Embed Size (px)
Citation preview

Methodology Guide for evaluating
Greenhouse gas emissions by water and sanitation services
Sector Guide - 2013
Water and sanitation services


3
Methodology Guide
for evaluating
Greenhouse Gas emissions
by water and
sanitation services
3rd edition, December 2012
Document produced by the “GhG footprint of water and sanitation services” Working Group at ASTEE

4

5
List of contributors
Working Group coordinator: Jean-Pierre MAUGENDRE (Lyonnaise des Eaux)
• Céline CHANUSSOT (Eau de Paris)
• Yves COQUELET (Saint Gobain PAM)
• Emmanuel DASSONVILLE (Aquasan 03)
• Thomas GOURDON (ADEME)
• Jean-Claude GUIGNARD (Saint Gobain PAM)
• Charlotte GUINSBURGER (FNCCR)
• Mohsen HASSINE (SADE)
• Isabelle LAIDIN (Jacobi)
• Anne LANG (SEDIF)
• Romain LEMAIRE (Veolia Eau)
• Alain MAHEU (Degrémont)
• Michael MARTIN (CIRSEE - Suez Environnement)
• Céline MERCIER (Veolia Eau)
• Estelle REUNGOAT (SAUR)
• Nathalie RIBON (Eau de Paris)
• Claire ROUSSELET (Veolia Eau)
• Emmanuelle SCHAFER (SIAAP)
• Jacques TCHENG (Grenoble)

6

7
Forword
ON THE CORRECT USE OF GHG EMISSIONS EVALUATION TOOLS FOR WATER AND SANITATION SERVICES
This methodology guide first of all recalls the existing protocols for evaluating greenhouse gas (GhG) emissions, both in France and internationally, in order to provide a basis for interpreting and comparing the corresponding results.
The second part of this guide proposes common conventions that are as complete as possible (scope, emission factors, terminology, etc.) for evaluating greenhouse gas emissions by water and sanitation services and asks these services to specify their methodology choices and hypotheses for subjects on which there is currently no consensus.
Finally, the guide lists the areas as yet poorly known and requiring further investigation, and proposes guidelines for communication of results and the production of action plans to reduce greenhouse gas emissions.
As a foreword to this guide, a number of points should be clarified:
> In terms of a community as a whole, water and sanitation services are clearly not the greatest contributors to GhG emissions. Based on the results of the emissions evaluations already conducted, both services (water and sanitation) would seem to represent an average of less than 1% of total French emissions, as opposed, for example, to 27% for transport. However the national «factor 4» approach (75% reduction in greenhouse gas emissions in France by the year 2050) is one that concerns all stakeholders, irrespective of their size and the volume of their emissions.
> The figures resulting from the GhG emissions evaluation studies suffer from a degree of uncertainty which can sometimes be considerable. The results thus make it possible to target the main areas in which efforts are needed, but they must be treated with a degree of circumspection if one is to attempt to use them as a basis for setting contractual emissions reduction targets. However, the greater the number of footprints carried out on water and sanitation services, the more this uncertainty will be brought down.
> It is not always be possible in all situations to propose solutions leading to a spectacular reduction in GhG emissions, especially if no provision is made for investment.
> Evaluation of emissions from water and sanitation services cannot yet be considered tools for benchmarking between local authorities, owing to the uncertainties previously mentioned, but also owing to the methodology hypotheses which may differ between two evaluations. This is not an obstacle insofar as the objective is not to achieve «good» results for GhG emissions, but to take part in a national move to reduce these emissions.

Contents
INTRODUCTION 11
CHAPTER 1 - Greenhouse Gas emissions evaluation protocols
1.1 THE IPCC GUIDELINES FOR ESTABLISHING NATIONAL EMISSIONS INVENTORIES 14
1.2 METHODOLOGY GUIDES APPLICABLE TO THE FRENCH REGULATORY CONTEXT 14
1.3 THE OTHER PROTOCOLS, METHODS AND GHG EMISSIONS EVALUATION TOOLS APPLICABLE TO WATER AND SANITATION SERVICES 15
1.3.1 The GhG (Greenhouse Gas) Protocol 15
1.3.2 The water and sanitation sector protocol developed by UK Water Industry Research 15
1.3.3 The ADEME Bilan Carbone® carbon footprint 16
1.3.4 Protocol used by technical services of local authorities in the United States (Local Government Operations Protocol for the quantification and reporting of greenhouse gas emissions inventories) 16
CHAPTER 2 - Accounting rules and principles for evaluating Greenhouse Gas (GhG) Emissions by water and sanitation services
2.1 THE GHG TO BE CONSIDERED 18
2.1.1 Note on carbon dioxide 18
2.1.2 Note on methane (CH4) and nitrous oxide (N2O) 18
2.1.3 Note on fluorinated gases 19
2.2 SCOPES OF ACTIVITY AND GHG EMISSION CATEGORIES 19
2.2.1 Scope 1: direct GhG emissions 20
2.2.2 Scope 2: indirect GhG emissions from energy consumption 20
2.2.3 Scope 3: the other indirect GhG emissions 20
2.2.4 Avoided emissions 21
2.3 EMISSIONS GENERATED BY CAPEX (INVESTMENTS/ASSETS) 23
2.4 EXAMPLE OF GHG EMISSION SOURCES BY A WATER OR SANITATION SERVICE 24
CHAPTER 3 - Greenhouse gas sources and emission factorsspecif ic to the water and sanitation sector
3.1 EMISSIONS LINKED TO THE SEWAGE PROCESS 26
3.1.1 N2O (nitrification step) 26
3.1.2 CH4 (treatment of wastewater, digester and biogas circuit leaks) 27
3.2 TRANSIENT EMISSIONS 27

3.3 INDIRECT EMISSIONS LINKED TO ENERGY CONSUMPTION 27
3.4 INDIRECT EMISSIONS RELATED TO REAGENTS AND CONSUMABLES 28
3.5 EMISSIONS LINKED TO THE SLUDGE TREATMENT PROCESSES 28
3.6 EMISSIONS OF BIOGENIC ORIGIN 29
3.6.1 Burning of biogas 29
3.6.2 Sludge incineration 29
3.7 DISCHARGES INTO SURFACE WATER 29
3.8 DIRECT EMISSIONS LINKED TO AIR-CONDITIONING 30
3.9 OFFSETS 30
3.10 EMISSIONS LINKED TO NEW WORKS 30
3.10.1 Methodology 30
3.10.1.1 Standard conStruction SiteS 30
3.10.1.2 GreenhouSe GaS and emiSSion factorS 31
3.10.1.3 Breakdown of GhG emiSSionS 31
3.10.2 Expression of the results in ratios 31
CHAPTER 4 - Subjects specif ic to the water professionsrequiring further investigation
4.1 DIRECT EMISSIONS LINKED TO SLUDGE TREATMENT PROCESSES 34
4.1.1 N2O Emissions 34
4.1.2 CH4 Emissions 34
4.2 GHG EMISSIONS IN SANITATION NETWORKS 34
4.3 BIOGENIC CO2 EMISSIONS NOT RESULTING FROM COMBUSTION 34
4.4 EMISSIONS AVOIDED THROUGH AGRICULTURAL RECYCLING OF SLUDGES AND COMPOSTS 35
CHAPTER 5 - Communication of results
5.1 METHOD FOR THE PRODUCTION OF BEGES FOOTPRINTS (MEDDTL – APRIL 2012) 38
5.2 TRACEABILITY OF RESULTS AND HYPOTHESES 38
5.3 A FORMULATION OF THE RESULTS APPROPRIATE TO OUR PROFESSIONAL SECTORS 38
APPENDIX
1. MAIN EMISSION ITEMS TO BE CONSIDERED IN THE BEGES FOOTPRINT FOR WATER AND SANITATION SERVICES 40
2. CORRESPONDENCE TABLE FOR THE VARIOUS SCOPES AND PROTOCOLS 42
3. EXAMPLES TO HELP DEFINE AN ACTION PLAN TO REDUCE GREENHOUSE GAS EMISSIONS FROM A WATER AND SANITATION SERVICE 42
4. EMISSION FACTORS SPECIFIC TO THE WATER AND SANITATION PROFESSIONS 44
5. EMISSION FACTORS FOR CHEMICAL PRODUCTS 44


11
Introduction
There are several methods for evaluating GhG emissions by an activity. All of these methods are based on a simple principle: multiplication of activity data by an emission factor determined in the literature or evaluated as closely as possible in line with the actual situation encountered.
The existing evaluation tools are therefore spreadsheets which consolidate these various multiplications with a view to identifying and reducing these emissions.
To be able to compare evaluations or footprints with each other, agreement must be reached on the following, for the various studies one wishes to compare:
> the rules and principles for counting GhG emissions (Chapter 2)
> the activity data to be collected and the emission factors to be used, in particular those specific to the field of water and sanitation (Chapter 3)
> the specific subjects not evaluated because they require additional investigations (Chapter 4)
> the results consolidation and presentation method (Chapter 5)
The purpose of this document is therefore to define guidelines to be used to evaluate GhG emissions by water and sanitation systems, which in particular involve complex reactions that need to be explained.
These guidelines will have to apply to any evaluation carried out for such systems.
They must also clarify and facilitate the statutory reporting of greenhouse gas emissions (see Chapter 1 of this guide, § 2 “Methodology guides applicable to the French regulatory context).
The aim is therefore to provide a means of helping with understanding and reading the various footprints/evaluations so that they can be better interpreted and possibly compared.
NB : The emission factors presented in this document and its appendices are taken either from the Base Carbone®
database managed by the ADEME (French Environment and Energy Management Agency), or from other sources (operators and companies participating in the working group, suppliers, calculations by the ASTEE working group). The sources are always specified. The emission factors from sources other than ADEME are not validated by it.


Greenhouse gas emissions evaluation protocols
Chapter 1

14
1.1 THE IPCC GUIDELINES FOR ESTABLISHING NATIONAL EMISSIONS INVENTORIES
The function of the Intergovernmental Panel on Climate change (IPCC) is to issue scientific, technical, and socio-economic opinions on climate change, in particular on the means of mitigating it and adapting to it. The IPCC reports are the result of a consensus by a vast majority of the international experts.
The IPCC has therefore published guidelines for the production of national greenhouse gas emissions inventories, which are regularly updated. With regard to wastewater treatment, we referred to chapters 5 and 6 of the 2006 «IPCC Guidelines for National Greenhouse Gas Inventories» concerning incineration, wastewater treatment and emissions of N2O from managed soils. The panel’s recommendations on this subject comprise five points: transparency, exhaustiveness, coherence, comparability and accuracy.
Chapter 5: http://www.ipcc-nggip.iges.or.jp/public/2006gl/french/pdf/5_Volume5/V5_5_Ch5_IOB.pdf
Chapter 6: http://www.ipcc-nggip.iges.or.jp/public/2006gl/french/pdf/5_Volume5/V5_6_Ch6_Wastewater.pdf
Chapter 11: http://www.ipcc-nggip.iges.or.jp/public/2006gl/french/pdf/4_Volume4_11Ch11_N2O&CO2.pdf
1.2 METHODOLOGY GUIDES APPLICABLE TO THE FRENCH REGULATORY CONTEXT
Article 75 of Act 2010-788 of 12 July 2010 constituting the National environmental commitment (known as Grenelle II) created an obligation on private law companies employing more than 500 people in metropolitan France, or more than 250 people in the overseas regions and departments, to produce a footprint of their greenhouse gas emissions (known as the GhG footprint - BEGES), and for local authorities of more than 50,000 inhabitants1 to draft a regional Climate-Energy plan (known as the PCET), including a GhG footprint and an action plan. The first GhG and PCET footprints are to be transmitted to the Prefects of the Regions before 31 December 2012 and revised every 3 years.
Decree 2011-829 of 11 July 2011 concerning the greenhouse gas emissions footprint and the regional climate-energy plan, as well as 2 methodology guides published by the MEDDTL (French Ministry for Ecology, Sustainable Development, Transport and Housing) (latest version: April 2012), define the guidelines for the production of these GhG and PCET footprints.
These 2 methodology guides can be downloaded from the ADEME and MEDDE (French Ministry for Ecology, Sustainable Development and Energy) sites:
> Method for the production of greenhouse gas emissions footprints pursuant to article 75 of Act 2010-788 of 12 July 2010 constituting the national environmental commitment
> Methodology guide for the production of greenhouse gas emissions footprints by local authorities pursuant to article 75 of Act 2010-788 of 12 July 2010 constituting the national environmental commitment
We will refer to extracts from these documents which concern the quantification of GhG emissions linked to the water and sanitation professions.
(1) Regions, departments, communautés urbaines, communautés d’agglomération, communes et communautés de communes.

15
For the production of the GhG footprints required by the regulations, the default emission factors to be used are those of the Base Carbone® database managed by Ademe. The Ademe’s Base Carbone® is a national public database containing a range of emission factors and source data. This particular aim of this methodology guide for the assessment of GhG emissions from water and sanitation services is to provide specific emission factors for these services which do not appear in Ademe’s Base Carbone®, to permit an assessment that is as broad as possible.
NB: The Methodology guide for the production of GhG footprints by local authorities, “water management service” chapter, refers to the ASTEE methodology guide.
1.3 THE OTHER PROTOCOLS, METHODS AND GHG EMISSIONS EVALUATION TOOLS APPLICABLE TO WATER AND SANITATION SERVICES
This non-exhaustive section identifies the international or national protocols and methodologies for assessing GhG emissions, known to the members of the working group. These tools have been tested and can therefore be analysed.
1.3.1 The GHG (Greenhouse Gas) Protocol
At the initiative of the World Business Council for Sustainable Development (WBCSD) and the World Resources Institute (WRI), the GhG Protocol was published in order to help companies and voluntary organisations with accounting of their GhG emissions.
The GhG Protocol gradually became a standard and provided guidelines for companies and all other types of organisations wishing to produce an inventory of their GhG emissions. It defines the accounting (and reporting) principles for GhG emissions and gives guidelines for the scope, the evaluation of emissions over a period of time and emissions reporting. It also identifies possibilities for management programmes designed to reduce the GhG emissions of the company or organisation evaluating its emissions. The ADEME’s Bilan Carbone® adopted the same principles as the GhG Protocol and they are also compatible with the principles stipulated in standard ISO 14 064 concerning the accounting and evaluation of GhG emissions.
Finally, the website of the GhG Protocol (http://www.ghgprotocol.org/ section «calculation tools») is a major source of information about GhG emissions from various industrial sectors and about indirect emissions related to the consumption of heat and electricity to be taken into account in the evaluations. This site also presents the latest up-to-date versions of the various guideline manuals.
1.3.2 The water and sanitation sector protocol developed by UK Water Industry Research
UK WIR (United Kingdom Water Industry Research) was created in 1993 by the British water industry to facilitate collaboration in research programs intended for all operators.
UK WIR developed a methodology and a tool designed to help water professionals estimate greenhouse gas emissions from their activities. The method proposed takes account of GhG emissions linked to the production of drinking water, the treatment of wastewater and the treatment of sludge, over a one-year time-frame. It is however important to point out that UK WIR made the decision to take account of emissions of biogenic origin in its inventories (contrary to the IPCC guidelines) and to ignore indirect non-energy related emissions (the emissions of activity scope 3 described below). The methodology is based on DEFRA (Department for Environment, Food and Rural Affairs) recommendations and therefore follows the regulatory requirements applicable to the United Kingdom. Nonetheless the DEFRA GhG

16
Reporting Guidelines (applicable to all sectors nationwide) are consistent with the GhG Protocol. They are organised around the publication of emission factors including direct and indirect emissions (for fuel oil, electricity, chemical products, transport and direct emissions).
1.3.3 The ADEME Bilan Carbone® carbon footprint
The Bilan Carbone® is an Excel spreadsheet type tool developed by the ADEME (French Environment and Energy Management Agency), that has been periodically upgraded since 2004. It evaluates direct and indirect GhG emissions from a site, a company, a local authority or an area, generally over a period of one year. It is compatible with standard ISO 14064 concerning the evaluation of GhG emissions. The current Bilan Carbone® version current as at end of December 2012 is version V7.1.04. Management of the Bilan Carbone® Excel spreadsheet was transferred to the Association Bilan Carbone on 1 January 2012. The emission factors used by this spreadsheet are those of the ADEME’s Base Carbone® database.
In the field of water and sanitation, the Bilan Carbone® methodology can be applied to several types of scopes:
> The scope of the water and/or sanitation service of a local authority: the Bilan Carbone® can thus be broken down into professional sectors (production / distribution / collection / purification / sludge treatment).
> One or more sites managed by the service (for example: a drinking water production plant, a sewage plant, an administrative building).
> An activity performed by the service (e.g.: wastewater treatment for a local authority and sludge recycling). In this case, the limits of the activity’s scope must be clearly stated.
1.3.4 Protocol used by technical services of local authorities in the United States (Local Government Operations Protocol for the quantification
and reporting of greenhouse gas emissions inventories)
This protocol, developed in the United States by the California Air Resources Board, the California Climate Action Registry, the ICLEI and the Climate Registry, was made public in September 2008. Its role is to establish a global standard for evaluating GhG emissions by local authorities and is based on methodological standards developed by the ICLEI association, called the International Local Government GhG Emission Analysis Protocol. This evaluation protocol was tested in 2009 in a number of American cities (New York, New Orleans, Portland, Las Vegas, Denver, etc.).
With regard to sanitation, this protocol devotes a whole chapter to emissions evaluation (chapter 10) containing guidelines and estimation formulas, in particular for emissions of CH4 and N2O.
Note: There are also many publications which have neither the format nor the content of an evaluation or quantification protocol. These studies, reports, scientific articles, etc. represent the current state of the art, which is not yet completely stabilised. They are in no case to be considered evaluation protocols. The user of this guide will therefore use the results from the literature concerning the various GhG when he feels it to be useful in order to supplement the missing information. However, when using these data, the sources must be absolutely transparent.

Accounting rules and principles for evaluating Greenhouse Gas (GhG) emissions by water
and sanitation services
Chapter 2

18
2.1 THE GHG TO BE CONSIDERED
The Method for the production of greenhouse gas emissions footprints (April 2012 version – MEDDTL) identifies the greenhouse gases listed in the order of 24 August 2011 concerning the GhG covered by the GhG emission footprints, that is:
> Carbon dioxide (CO2)
> Methane (CH4)
> Nitrous oxide (N2O)
> Hydrofluorocarbons (HFC)
> Perfluorocarbons (PFC)
> Sulphur hexafluoride (SF6)
We will in particular ignore water vapour, because direct water vapour emissions of human origin, coming primarily from electrical power plants, irrigation, dams and deforestation, do not make any detectable contribution to increasing the greenhouse effect and they are not therefore considered in human emissions. It should be remembered that on a planet that is two-thirds covered with water and given the fact that water does not accumulate in the atmosphere – where its retention time is only about one week – emissions of human origin are totally marginal in the global water cycle (for example, mankind’s annual water vapour emissions from the combustion of hydrocarbons represents less than 1% of natural evaporation in a single day). Man’s actions can disrupt the local water cycle very significantly, but this has no noteworthy repercussions on the average water vapour content of the atmosphere as a whole and it is this which determines the resulting greenhouse effect.
2.1.1 Note on carbon dioxide
A distinction is made between CO2 of fossil origin and CO2 emissions of biogenic origin.
CO2 of fossil origin comes from the combustion of hydrocarbons stored on the surface of the Earth for several million years, and is part of the long carbon cycle.
CO2 of biogenic origin is part of a short (seasonal) cycle involving plant photosynthesis, followed by biological or thermal oxidisation. Unlike fossil CO2 emissions, biogenic CO2 emissions are considered by the IPCC as neutral with respect to the greenhouse effect. This is owing to the time scale differences between the corresponding cycles.
The CO2 produced during the treatment of wastewater is to a large extent linked to the breakdown of organic matter of anthropogenic or animal origin. It is therefore considered to be of «biogenic» origin. For more details, refer to chapter 6 on wastewater in the IPCC guidelines for national reporting of GhG emissions, more specifically, paragraph 6.1.
Given the current state of knowledge, this guide only proposes emission factors for biogenic CO2 from combustion, that is during burning of biogas resulting from sludge digestion and during sludge incineration (see § 6 of chapter 3).
2.1.2 Note on methane (CH4) and nitrous oxide (N2O)
Methane and nitrous oxide can be emitted throughout the wastewater treatment process:
> Methane (CH4) is linked to the presence of organic matter in anaerobic conditions. The decomposition of organic matter in anaerobic conditions leads to the release of methane.
> Nitrous oxide (N2O) is linked to nitrogen treatment. Nitrous oxide is generated during the nitrification

19
and denitrification of the nitrogen present in the water to be treated (urea, ammonia, proteins) or during agricultural sludge spreading.
2.1.3 Note on fluorinated gases
Although not linked to the water treatment process, fluorinated gases may be present on some sites. HFC, PFC and their derivatives may be contained in air-conditioning systems, while some High Voltage metering units contain SF6.
2.2 SCOPES OF ACTIVITY AND GHG EMISSION CATEGORIES
It is first of all essential to define the “scope” of what one intends to measure. For example, are we dealing with:
> the “drinking water production” activity;
> “drinking water production + distribution” activities
> etc.
We recommend just considering GhG emissions linked to service activities which are related to local operations. It is hard to determine how to break down GhG emissions linked to combined activities (R&D, IT, head offices, etc.). However, whenever it is possible to attribute to a service the emissions dedicated to operational support measures (operating diagnosis, regulatory audits, etc.), we recommend doing it.
One must then differentiate between “scopes” or “GhG emission categories”.
Purchased products
Other indirect(Scope 3)
Upstream Downstream
Energy indirect(Scope 2)
Direct(Scope 1)
Indirect - others than energy
(Scope 3)
Upstream freight
…
Downstream freightSourcescontrolled by
theOrganisation
Electricity, steam…Buisness Travel
…
diaGram of different emiSSion cateGorieS linked to the activitieS of an orGaniSation(source : Method for producing greenhouse gas emission footprints pursuant to article 75 of Act 2010-788
of 12 July constituting the national environmental commitment – MEDDTL).

20
Each scope (or emission category) comprises several types of emissions:
Greenhouse Gas emissions table template for the beGes footprint (source: Method for producing greenhouse gas emission footprints pursuant to article 75 of Act 2010-788
of 12 July constituting the national environmental commitment – MEDDTL).
Below are the main types of GhG emissions from water and sanitation services making up the various “scopes”.
2.2.1 Scope 1: direct GhG emissions
These are emissions from sources that are either fixed (process or equipment) or mobile (e.g. vehicles) owned or operated by an entity.
For example, the emissions from combustion installations, from carbonaceous or nitrogenated matter breakdown phases, from storage of unstabilised sludge in the open air, or the entity’s vehicles.
2.2.2 Scope 2: indirect GhG emissions from energy consumption
These are indirect emissions associated with:
> Electricity consumption,
> The consumption of steam, heating or cooling.

21
2.2.3 Scope 3: the other indirect GhG emissions
These emissions are linked to the activities of the entity, but from sites or operations owned or operated by an entity other than that carrying out the evaluation.
It is preferable for the third scope indirect emissions to be divided into at least three parts for water and sanitation services:
> emissions from the manufacture and transport of chemical products,
> emissions from the treatment and elimination or transfer of wastewater treatment sludge and other by-products,
> emissions from the transport of sludge and other treatment by-products.
2.2.4 Avoided emissions
Producing a global footprint of GhG emissions for an entity means taking account of direct emissions on the one hand, indirect emissions on the other, but also avoided emissions.
If by-products from a station are reused by a third-party (sludge, sand, etc.) in place of a «product», or if energy is produced by the station and transferred to a third-party (recycling of biogas in the case of sludge digestion for example), the greenhouse gases which would have been emitted to manufacture this product or produce this quantity of energy conventionally, are not emitted: we then talk of avoided emissions.
The main greenhouse gas emissions avoided by operation of a sewage plant can be placed in two substitution categories: energy contribution and material contribution. These substitutions apply in the following cases:
Production of electrical or thermal energy from biogas and transfer to a third party: the avoided emissions correspond to the emissions which would have been involved in producing an equivalent quantity of non-renewable energy;
Use of sludge as fertiliser: the avoided emissions correspond to the emissions which would have been involved in producing the quantity of fertiliser substituted;
Use of sludge by a third-party as an alternative fuel or mineral input (cement-works incineration): the avoided emissions correspond to the emissions which would have been involved in producing an equivalent quantity of energy or producing the substituted raw materials;
Use of sand for road building (backfill): the avoided emissions correspond to the emissions which would have been involved in producing the quantity of sand substituted.
In the field of drinking water, it is possible that certain consumables can be reused for other purposes. In this case, the avoided emissions resulting from this recycling must be taken into account in the avoided emissions linked to the activity of the service.
For example, incineration of used granular activated carbon (GAC) in cement-works in place of heavy fuel oil, is a source of avoided emissions. Given the NCV of wet GAC and heavy fuel oil (1.7 kWh/kg and 11.1 kWh/kg respectively), the incineration of GAC avoids 0.48 kg eqCO2 per kg of wet GAC incinerated.
Avoided emissions must be differentiated from reduced emissions. The difference between these two types of emissions is that one always entails avoided emissions by a third party and the other always entails reduction of one’s own emissions.
Emissions reductions are observed (real) between two successive footprints (B and B-1) in the same scope: reduction in consumption of material or energy from third parties, whereas avoided emissions are evaluated (theoretical) on the basis of a reference scenario on behalf of a third-party, outside the scope of the footprint mentioned above.

22
0
20
40
60
80
100
120 120
100
80
60
40
20
0
-20
-40
Without reusing With reusing
100
0 -30
80
20
Emissions
Emissions
GH
G e
mis
sio
ns
GH
G e
mis
sio
ns
Reduced emissions
Avoided emissions
Avoided emissions
fiGure 1: illuStration of the rule for accountinG avoided emiSSionS By recyclinG enerGy from BioGaS with electricity conSumed on-Site (20) and Sold to a third-party (30)
Finally, treatment of nitrogen by sewage plants helps avoid the release of nitrogen into the environment, which could then cause uncontrolled N2O emissions. This point will not be developed any further in the guide, pending the results of work currently on-going.
Principle of separate communication of actual emissions and avoided emissions
The accounting footprint must reflect the physical footprint. Physically, there can be no negative emissions, whatever the scope concerned. Consequently, and as indicated in the Method for the production of GhG emission footprints (MEDDTL – April 2012), the avoided emissions are shown separately. They represent a gain for the environment but can on no account be subtracted from the footprint.
Example
Let us imagine a sanitation service that produces more energy and material than it consumes, its GhG emissions are reduced to zero because all consumption by the service is met by its own production from renewable sources / materials.
The surplus part, transferred to a third-party, cannot be deducted from the service’s footprint, which would then become negative. However, these avoided emissions will appear in the footprint of the benefiting third-party.
We therefore recommend adopting all of the scopes (1+2+3) and avoided emissions when evaluating the GhG emissions from water and sanitation services.
When combining several evaluations with common factors in certain scopes, it is important to avoid counting emissions twice. This is why an entity must clearly differentiate between direct and indirect emissions in its evaluation.
For example, when evaluating indirect emissions linked to the manufacture of a chemical reagent for the sanitation service of a local authority and, at the same time, the plant which manufactures this reagent is evaluating its GhG emissions, it will count the emissions from manufacture of the reagent as direct emissions in its footprint. If the two footprints are consolidated in the same area, there will be no double accounting of the emissions linked to the manufacture of the reagent (because they will be counted in the “indirect emissions” category by one and the “direct emissions” category by the other).

23
2.3 EMISSIONS GENERATED BY CAPEX (INVESTMENTS/ASSETS)
Certain methods for evaluating GhG emissions require an evaluation of the impact of the previous investments made in assets.
However, based on the “quantification before action” principle, we recommend clearly differentiating between the annual emissions footprint linked to the operation of the structures and the footprint from the construction and dismantling phases, rather than annually consolidating these two footprints by means of a system of depreciation. This avoids over-burdening the footprint with two different actions (the construction of a facility and its operation) on which it is hard to act at the same time.
However, it is also possible to evaluate the emissions generated by the past construction of structures and buildings linked to the operation of the service, by including them in the indirect emissions of scope 3, and depreciating them over the lifetime of the structures (once again depreciation of assets), in order to smooth out all the phases of the projects.
With regard to emissions linked to investments/assets acquired during the year of the evaluation, they could be counted in two different ways:
> annual accounts: 100% of the work done considered for the year in question;
> assets: by depreciation over the lifetime of the structure concerned.
the method used shall in this case be clearly specified.
We recommend adopting the following values for the depreciation periods of emissions from the structures:
Nature of the structure Duration (years)Civil engineering structures 30
Pipelines and branches
PVC
PEHD and PE
Reinforced concrete
Cast iron
Steel
Earthenware
40
30
50*
80*
80*
80*
Treatment facilities (excl. civil engineering and piping), pumps, electromechanical items, heating and ventilation
15
Control systems (electronics, sensors) 8
Layout of buildings, electrical installations 20
IT hardware 5
Vehicles 6
Source: instruction M49 mentioned in the report entitled “Tools for financing the refurbishment of water and sanitation service infrastructures”. Ministry for Ecology, June 2003.* we recommend adopting these values, used by a majority of local authorities, because they correspond to a technical lifetime,
whereas instruction M 49 recommends a depreciation period of 30 to 40 years.

24
2.4 EXAMPLE OF GHG EMISSION SOURCES BY A WATER OR SANITATION SERVICE
The emission sources presented in Appendix 1 are not an exhaustive check-list, but are simply given as examples.

Greenhouse gas sources and emission factors specif ic to the water and sanitation sector
Chapter 3

26
The GhG emissions must be filled out, mentioning the emission factors used and their source.
This chapter will only give values for which the ASTEE GhG working group considers that there is sufficient consensus for the emission factors announced to be included in the GhG statutory footprint (BEGES). The other information is presented in chapter 4.
All these emission factors are included in the table in Appendix 4 to this guide.
3.1 EMISSIONS LINKED TO THE SEWAGE PROCESS
3.1.1 N2O (nitrification step)
Current knowledge
It is first of all worth recalling that the nitrogen cycle in natural aquatic environments such as rivers, estuaries or catchment basins leads to significant N2O emissions during the nitrification and denitrification steps in these environments. The IPCC recently adopted an emission factor for the N2O emitted during these phases of 0.5% of the flow of N entering a river or estuary. It is therefore important that the direct N2O emissions linked to the processes treating the nitrogen in wastewater be compared with this “natural” emission factor for the host environment, in order to avoid stigmatising the efforts to treat nitrogen in sewage plants that are necessary for attaining good water quality.
Existing scientific data on N2O emissions from sewage plants, resulting from work both in France and internationally, are still relatively scarce and there is not as yet any “standardised” measurement methodology.
Considerable disparities are today observable between the measured emissions (factor of 10 or even 20 on certain processes).
However, recent scientific publications agree that N2O emissions on the water circuit of sewage plants are primarily linked to the nitrification step. The quantities of N2O produced are proportional to the nitrified nitrogen flows and depend on the nature of the treatment and thus on the type of treatment process and its implementation.
The following table gives the values resulting from the work done by CIRSEE-Suez Environnement (France), STOWA (Netherlands), WERF (USA) and WSAA (Australia) recently published in the latest report from the GWRC 2011 working group, as well as work by Veolia Environnement Recherche Innovation (France), as yet unpublished. The values concern two processes: activated sludge with infinitely mixed reactor and plug flow reactor.
Process SourceN-N2O Emission
(% N-eliminated)Comments
Activated sludge– infinitely mixed
WSAA (Aus)0.8 / 0.6 / 1.3 / 0.6 / 2.7 (each figure represents a
% of N per study)
Values far higher than those of the other R&D teams and no comparison available
with MSAA plug flows
WERF (US) 0.09 / 0.07 / 0.03
CIRSEE-Suez (Fr) <0.01 / <0.01
VERI-Veolia (Fr) 0.01
STOWA (NL) 0.04 / 0.05
Plug flow reactor
WERF (US) 0.9 / 0.7 / 1.7 / 0.22
CIRSEE-Suez (Fr) 0.2
VERI-Veolia (Fr) <0.01

27
For the other types of processes (BRM, Biofilters, SBR), less data is currently available (1 or 2 studies per type of process).
Position of the ASTEE working group
In the light of the small amount of data on the one hand, and the uncertainties and considerable variability between measurements on the other, the members of the working group wondered how best to report the above-mentioned work in the ASTEE GhG guide, a guide which also constitutes the benchmark for statutory “BEGES” footprint reporting with regard to water and sanitation services.
Concerning the N2O emissions linked to BRM, Biofilter and SBR processes, the working group’s position is that the small amount of data currently available does not make it possible to propose a specific emission factor.
In the absence of additional studies on the subject, Astee proposes for the time being adopting the following emission factor: 0.073% t N2O / t NTK abatement on the sewage plant.
This factor is based on the IPCC’s historical value of 3.2 g of N2O/p.e./year.
3.1.2 CH4 (treatment of wastewater, digester and biogas circuit leaks)
With regard to the treatment of wastewater (water circuit), the 2010 work done by the GWRC recommends using a ratio of CH4 emitted/ COD eliminated = 0.0002.
This position is also that adopted by ASTEE.
3.2 TRANSIENT EMISSIONS
These emissions mainly concern biogas leaks from the digesters and biogas circuits: in its V6.1 June 2010 version of its emission factors guide, the ADEME recommends a default reference value of 0.005 m3 leakage per m3 of biogas produced, or 0.5% of the volume produced. Caution: the volume of biogas should be weighted by the percentage of methane it contains (average value of 60%).
3.3 INDIRECT EMISSIONS LINKED TO ENERGY CONSUMPTION
Section 8.8 of the April 2012 MEDDTL/ADEME guide entitled “Method for the production of greenhouse gas emission footprints” states that “The assessment of the impact of electricity consumption in the GhG emissions footprint is calculated on the basis of usage emission factors: heating, lighting, basic usage, intermittent usage given in the Base Carbone® database. In the absence of data on usage, the company may use the average electricity production factor given in the Base Carbone®. The use of any other factor is prohibited. There is thus no supplier-related discrimination when collecting the data. Only one of the two approaches should be used (usage based approach or average emission factor approach) should be used in a given GhG emissions footprint in order to avoid all bias”.
Even when buying “green” electricity, it is therefore impossible to use an emission factor different from the French energy mix.

28
3.4 INDIRECT EMISSIONS RELATED TO REAGENTS AND CONSUMABLES
In the Excel spreadsheet that can be downloaded from the ASTEE website (http://www.astee.org/publications/bibliographie/guide/guide_11), we present what we currently know about emission factors related to reagents and consumables. The emission factors for chemical products not specific to our professional sectors, which are not included in the spreadsheet, can be found in ADEME’s Base Carbone® database.
The values of the emission factors (EF) for reagents given in the table are expressed in kg of CO2 per kg of pure product and per kg of commercial solution. The table gives an average value agreed on by the working group, sometimes having to decide between several sources (ADEME’s Base Carbone® database, ACV databases, supplier information, calculations by ASTEE experts).
These emissions concern the manufacture of reagents, excluding transport to the utilisation site, and take account of the extraction of their components.
It is however possible to find EF differences for the same product depending on the method of manufacture or the concentration of the product.
Two key points are to be considered when evaluating reagent emissions:
> The expression of the data which are “fed back” from the field or communicated by the suppliers. The data are very often expressed in tons of commercial product. It is therefore necessary to make corrections as shown in the following example:
For phosphoric acid: the table gives an EF of 1,423 kg of CO2 per 1,000 kg of pure phosphoric acid. In general, the commercial phosphoric acid used has a concentration of 85% by mass. This means that one ton of commercial product contains 850 kg of pure phosphoric acid. Each ton of commercial phosphoric acid used therefore corresponds to CO2 emissions corresponding to 1,423 * 0.85, or 1,210 kg of CO2.
> A second source of error can also be the expression by mass of the product. Again taking the case of phosphoric acid, the concentration is generally expressed as phosphoric acid (H3PO4). It is possible for the concentration to be expressed in PO4, P2O5, etc. This concentration must then be converted to H3PO4 in order to assess the equivalent GhG emission.
3.5 EMISSIONS LINKED TO THE SLUDGE TREATMENT PROCESSES
The data below are taken from the work of the IPCC. The emission factors to be used for spreading are as follows: 0.02237 kg of N2O / kg of N spread.
Calculation details: 0.02237 kg of N2O / kg of N spread = 0.0157 kg of N2O / kg of N spread (direct emissions – page 12, chapter 11, Volume 4 of IPCC 2006) + 0.00667 kg of N2O / kg of N spread (indirect emissions – page 27, chapter 11, Volume 4 of IPCC 2006).

29
3.6 EMISSIONS OF BIOGENIC ORIGIN
The emissions of biogenic CO2 presented below come only from combustion.
3.6.1 Burning of biogas
Whether the biogas is flared off without recovery, or if it is recovered, the biogenic CO2 emissions are evaluated at 1.18 kg CO2 b per m3 of biogas burned).
Calculation details:
1 m3 of biogas contains 0.6 m3 of CH4 (proportion of biogas 60% CH4 and 40% CO2)
0.6 m3 of CH4 represents 600/22.4 = 26.8 moles of CH4
The combustion of 1 mole of CH4 generates 1 mole of CO2, so the combustion of 600 litres of CH4 generates 26.8 x 44 (molar mass of CO2 in g) = 1.18 kg of CO2.
3.6.2 Sludge incineration
The emission factor proposed is taken from the work of the IPCC and concerns biogenic CO2 emissions linked to the incineration of sewage plant sludges.
The emission factor is 1.48 t CO2 b / t DS incinerated (54% of C by VM, or 54/100 x 0.75 x 3.66 = 1.48 t eq. CO2 / t DS).
3.7 DISCHARGES INTO SURFACE WATER
The emissions to be taken into account for the COD and the NTK discharged into watercourses must be quantified (discharge from sewage plants and discharges from network storm overflows).
We propose provisionally adopting the following values (taken from the work of the IPCC guidelines, volume 5, chapter 6), which are still subject to discussion and which will be fine-tuned as future work progresses:
N2O: In the same way as on the water lines of sewage plants, N2O emissions are linked to the nitrification and denitrification of the nitrogen speciations present in the discharge into the environment, so the total N flow discharged must be considered. We propose taking the emission factor of 0.5% of N-N2O per N-total discharged adopted by the IPCC for “natural” N2O emissions into receiving aquatic biotopes (or the following EF: 0.79% kg of N2O emitted per kg NTK discharged).
CH4 : The “2006 IPCC guidelines for national greenhouse gas inventories” (vol. 5, chap. 6) give a potential emission of 0.25 kg of CH4 per kg of COD discharged into the environment. This value is weighted by a correction factor of 0.14 when the discharge is into the sea, a river or lake. One should therefore take a factor of 0.025 kg of CH4 per kg of COD.

30
3.8 DIRECT EMISSIONS LINKED TO AIR-CONDITIONING
This concerns the HFC resulting from leaks from air-conditioning systems and SF6 (high-voltage transformers).
For the HFC, we recommend using the annual leak rates proposed by the ADEME, that is 15% for water-cooled air-conditioning units and 10% for air-cooled air-conditioning units.
3.9 OFFSETS
The MEDDTL/ADEME April 2012 guide “Method for producing greenhouse gas emissions footprints” states that “the estimated GhG emissions reductions associated with financing of the voluntary offsets project should not be deducted from the GhG emissions footprint”.
3.10 EMISSIONS LINKED TO NEW WORKS(and to the maintenance of drinking water supply and sanitation networks - source: ASTEE)
3.10.1 Methodology
It is easy to understand that the public works sector, more particularly that concerning drinking water and sanitation networks, is an “industry of prototypes”, because each construction site or network intervention is different.
Nonetheless, in order to achieve greenhouse gas ratios that are both reasonable in terms of imprecision, yet easy to use, the following approach was adopted.
3.10.1.1 Standard conStruction SiteS
> Drinking water: DN 100 pipe, 180 m long (urban street) with 10 branch connections (usually the case for pipe renovations) built using traditional methods (excavation).A load of 0.90 m above the upper surface and excavation dimensions as per part N°71 were considered.
> Sanitation: a 250 m long pipe, with about ten branch connections, DN 300 mm (rainwater) and DN 200 mm (wastewater), built using traditional methods.The excavation dimensions were considered in accordance with part N°70.
> Drinking water branch connection work: a branch of DN ≤ 40 mm and an average length of 8 m, built using traditional methods, was considered.
> Drinking water network and branch maintenance, a conventional repair for a leak on a cast iron pipe DN <=300 mm or on a lead branch DN <= 40 mm was selected.
> Simplified traditional scheduling with its main work units in terms of equipment, manpower and supplies was considered.
31
3.10.1.2 GreenhouSe GaS and emiSSion factorS
In the light of the typology of the work concerned, only CO2 was taken into consideration.
All the emission factors, examples of which will be presented below, come from the ADEME “Guide des Facteurs d’Emission, Bilan Carbone” (emission factors guide, Bilan Carbone footprint) January 2007 version.
In order to make the calculations easier, these emission factors are expressed, as applicable, in tons or kilograms Carbon Equivalent, or CO2 per ton of equipment, or per km travelled, or per day, and so on.
3.10.1.3 Breakdown of GhG emiSSionS
The GhG emissions from construction sites can be broken down as follows:
> Capital assets, site machinery;
> Energy consumption during the works;
> Transport of equipment to the site;
> Staff transport;
> Transport of construction site surpluses;
> Incoming materials and services/freight.
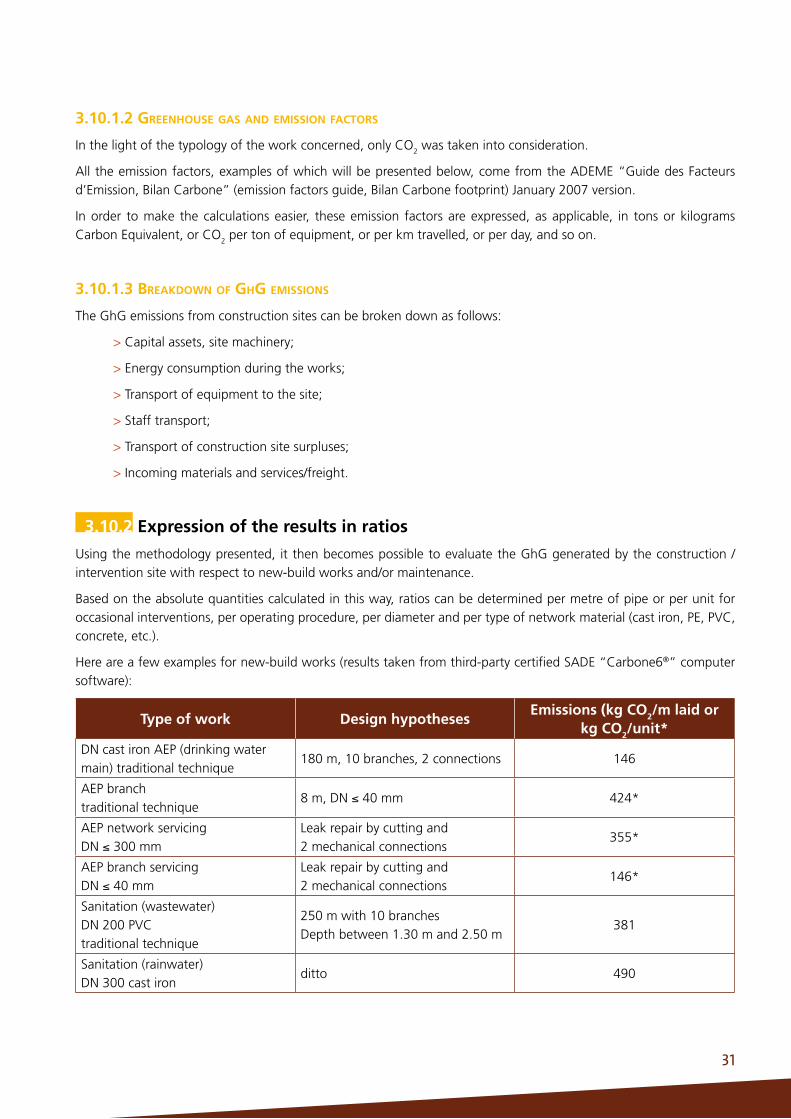
3.10.2 Expression of the results in ratios
Using the methodology presented, it then becomes possible to evaluate the GhG generated by the construction / intervention site with respect to new-build works and/or maintenance.
Based on the absolute quantities calculated in this way, ratios can be determined per metre of pipe or per unit for occasional interventions, per operating procedure, per diameter and per type of network material (cast iron, PE, PVC, concrete, etc.).
Here are a few examples for new-build works (results taken from third-party certified SADE “Carbone6®” computer software):
Type of work Design hypotheses Emissions (kg CO2/m laid or
kg CO2/unit*DN cast iron AEP (drinking water main) traditional technique
180 m, 10 branches, 2 connections 146
AEP branch traditional technique
8 m, DN ≤ 40 mm 424*
AEP network servicing DN ≤ 300 mm
Leak repair by cutting and 2 mechanical connections
355*
AEP branch servicing DN ≤ 40 mm
Leak repair by cutting and 2 mechanical connections
146*
Sanitation (wastewater) DN 200 PVC traditional technique
250 m with 10 branches Depth between 1.30 m and 2.50 m
381
Sanitation (rainwater) DN 300 cast iron
ditto 490

32
Origin of GhG emissions per item:
GhG
Immo. + energy
consumed on the
building site
Transportation of heavy
equipment on the buiding site
Transportation of people
Transportation of bulding site
surplus
Incoming material +
Freight
DN 100 cast Iron (traditional AEP)
15% 2% 1% 17% 65%
Branch (traditional AEP)
15% 4% 2% 22% 57%
Network maintenace (AEP
DN< 300mm)15% 21% 2% 13% 49%
Branch maintenace
18% 16% 2% 16% 48%
DN 200 PVC- traditional sanitation
5% 1% 1% 27% 66%
DN 300 cast iron - sanitation
6% 1% 1% 24% 68%

Subjects specif ic to the water professions requiring further investigation
Chapter 4

34
This chapter lists those areas in which data is still insufficient, either in terms of emission factors, or in terms of operating data concerning our professional sectors.
The following data, taken from the work of the IPCC, the ADEME, the GWRC and CIRSEE, are given for information, and the ASTEE GhG working group recommends waiting for additional work to be completed before using these figures in the statutory GhG footprints (BEGES).
4.1 DIRECT EMISSIONS LINKED TO SLUDGE TREATMENT PROCESSES
4.1.1 N2O Emissions
Composting: 1.141 kg N2O/ton of composted DS (ADEME data – July 2012 study, see Appendix 4).
Incineration: 0.990 kg N2O/ton of incinerated DS (IPCC data, see. Volume 5, Chapter 5).
4.1.2 CH4 Emissions
Composting: between 10 and 3400 g CH4 /ton of composted DS (Ademe – July 2012 study, see Appendix 4).
Drying: the CH4 emissions are negligible when compared with the other emissions;
Incineration: nil value (IPCC data, see Volume 5, Chapter 5).
4.2 GHG EMISSIONS IN SANITATION NETWORKS
The IPCC considers the emissions to be nil, given that the wastewater flow is rapid.
For a stagnant collection network open to the sky and in a high temperature situation, the IPCC recommends using the following EF: 0.5x 0.25 kg of CH4 per kg of COD contained in the wastewater.
4.3 BIOGENIC CO2 EMISSIONS NOT RESULTING FROM COMBUSTION
This concerns biogenic CO2 emissions linked to the wastewater treatment process and the end-of-life sludges (except combustion). The work in this field still contains gaps and does not enable an emissions quantification method to be proposed.

35
4.4 EMISSIONS AVOIDED THROUGH AGRICULTURAL RECYCLING OF SLUDGES AND COMPOSTS
When sewage plant sludges are spread, their fertilising capacity (agronomic value) avoids the use of synthetic fertilisers and thus the emission of greenhouse gases linked to the manufacture of these fertilisers, which requires the use of fossil energy.
Work is in progress to evaluate the avoided emissions (input of nitrogen, phosphorus or potassium to replace synthetic fertiliser) per sector and thus, for each sector, to determine an avoided emission factor in kg CO2e / kg DS spread.


Communication of results
Chapter 5

38
5.1 METHOD FOR THE PRODUCTION OF BEGES FOOTPRINTS (MEDDTL – APRIL 2012)
In its Appendix 3, the Method for the production of greenhouse gas emissions footprints (BEGES) details the format for the communication of results.
5.2 TRACEABILITY OF RESULTS AND HYPOTHESES
It is important that the results presented be based on recognised and clearly traced references (see table of emission factors).
The presentation of results should also recall the scope on which the GhG emissions evaluation is based as well as the emissions categories considered (scope 1, 2 or 3 – see Appendix 2) and all the hypotheses used for the calculation (e.g. emission factors used, investments depreciation time, etc.).
Any areas not considered because there is as yet no emission factor, or because the factor is still imprecise (e.g. N20 emissions) must be stipulated. Finally, the presentation of the results must be accompanied by an estimate of any quantitative or qualitative uncertainties surrounding them.
5.3 A FORMULATION OF THE RESULTS APPROPRIATE TO OUR PROFESSIONAL SECTORS
Furthermore, the different categories of impacts standardised, for example by the GhG emissions footprints, do not always carry titles that are explicitly clear for our professional sectors (e.g. «incoming materials and products»). These impact categories could therefore be grouped and renamed so that they are more meaningful for the operator (e.g. reagents, sludge treatment, and so on).
To illustrate points 2) and 3) an example of the evaluation of the GhG emissions from a sanitation service (network + sewage plant + sludge recycling) is given below:
> in dark blue, the GhG emissions linked to operation of the service;
> in light blue, the GhG emissions linked to depreciation of the works built before the year of reference used for production of the GhG emissions footprint;
> in green, the emissions avoided, on behalf of farmers, by sludge spreading (in place of agricultural product inputs).
-400
100
600
1 100
1 600
2 100
-400
100
600
1 100
1 600
2 100
150 73
650
0
329
-238
1 593

Appendices

40
APPENDIX 1 - MAIN EMISSION ITEMS TO BE CONSIDERED IN THE BEGES FOOTPRINT FOR WATER AND SANITATION SERVICES
Emission categories
Emission items
Description of emission items
GhG examples per emission source
Direct emissions
(SCOPE 1)
1… from fixed combustion sources
CO2: consumption of fossil fuels (gas, fuel oil, etc.) by boilers, electricity generating sets, incinerators, etc.
Biogenic CO2: combustion de biogaz ou d’énergie biomasse
CH4 and N2O: consumption of fossil fuel (marginal emissions)
Avoided emissions: if energy transferred to a third party
2… from mobile sources with heat engine
CO2 : Vehicle consumption of fuel of fossil origin
CH4 and N2O : emissions linked to consumption of fuel of fossil origin
3 … from non-energy processesBiogenic CO2: incineration of sludges on-site
4 … transient
N2O : nitrogen treatment (nitrification/denitrification),...
CH4 : fermentation in anaerobic conditions, biogas leaks from digesters, etc.
Other GhG (to be converted into CO2e): coolant fluid leaks, etc.
5... From biomass (soils and forests)
Not applicable to the water and sanitation professions
Indirect emissions
associated with energy
(SCOPE 2)
6… linked to electricity consumption **
Biogenic CO2, CH4 and N2O: depends on the energy mix used to produce the electricity --> refer to emission factor details in the Ademe’s Base Carbone database
Avoided emissions: If electricity produced and resold to a third party
7… linked to consumption of steam, heating or cooling **
Biogenic CO2, CH4 and N2O: depends on the energy mix used to produce heat or cold (to date only the emissions converted into CO2 are indicated in the base - Oct. 2012)
Other indirect emissions *
(SCOPE 3)
8Emissions linked to energy and not previously included
CO2e : upstream share of EF linked to consumption of energy (electricity, heat, cold, or fuels)
9 Purchases of products or servicesCO2e : reagents, piping materials, backfill, water purchases, etc.

41
Emission categories
Emission items
Description of emission items
GhG examples per emission source
10 Depreciation of assets CO2e : ehicle fleets, IT assets, etc.
11Transport and treatment of waste
CO2e : Sludge treatment, sludge evacuation, waste treatment, etc.
12 Upstream transport of goodsCO2e : tons.km of reagents, backfill, etc. brought in (incoming freight).
13Professional travel (vehicles not belonging to the PM)
CO2e : Train travel, air travel, etc.
14Upstream franchise - activity of franchiser
15Manufacture of equipment for leasing
16Sources linked to financial investments
17Transport of visitors or customers
18 Downstream transport of goods
19 Utilisation of products sold
20 End of life of product sold
21Downstream franchise - energy consumption by franchise-holders
22Leasing downstream - consumption of energy by leased assets
23Home-work journey and tele-working
CO2e : home-work journeys by public transport, 2-wheelers, cars, etc.
24Other emissions not covered by items 7 to 23
CO2e : Discharge of treated effluents
* Emissions category not concerned by the statutory obligation** The indirect emissions associated with the transport and distribution of electricity, steam, heat and cold are counted in the
international baselines in the «other indirect GhG emissions - Scope 3° category

42
APPENDIX 2: CORRESPONDENCE TABLE FOR THE VARIOUS SCOPES AND PROTOCOLS
GhG emissions evaluation protocols
Périmètres d’inventaire des émissions de GES
Emissions scope 1
Direct GhG emissions (except
biogenic)
Emissions scope 1’
Direct emissions of biogenic origin
Emissions scope 2
Indirect emissions arising from energy
consumption
Emissions scope 3
Other indirect emissions
IPCC guidelines Yes Counted as zero Yes -
GhG ProtocolYes
scope 1
Yes(see scope 1,
separate reporting)
Yes(scope 2)
Yes(scope 3)
Sectorial water and sanitation protocol - UK WIR
Yes Yes Yes No
Method for producing BEGES emissions footprints – MEDDTL April 2012
YesYes
(separately)Yes
Yes(optional)
Protocol for use by municipal technical services in the United States
Yes Yes YesYes
(separately)
Nature of emissions of scopes 1, 1’, 2 and 3: refer to the summary table of the main emission items enclosed in Appendix 1.
APPENDIX 3 – EXAMPLES TO HELP DEFINE AN ACTION PLAN TO REDUCE GREENHOUSE GAS EMISSIONS FROM A WATER AND SANITATION SERVICE
The purpose of an action plan resulting from an evaluation of GhG emissions is to achieve an overall reduction in greenhouse gas emissions linked to the activity. It may therefore focus on direct, indirect or avoided emissions. It will concern either the quantities of work units employed, or the emission factors linked to them
From one service to another, the possible margins for reducing GhG emissions will vary considerably and can only be determined after the figures concerning emissions have been calculated in full. Even if the reduction margins are small, the action taken may constitute an example for other services.
Experience has also shown that implementing an action plan to reduce GhG emissions is an excellent means of internal communication for mobilising the service’s staff around a sustainable development goal that is shared by all and which is characterised on a day to day basis by a whole range of “eco-actions”.
The following can be mentioned as examples for achieving reductions:

43
Energy
> Improvement of the energy efficiency of the treatment processes, possibly with modification of all or part of the process, while maintaining the same level of performance;
> Energy savings in buildings: insulation, low-energy light bulbs/fluorescent tubes, changes to heating, lighting or air-conditioning policy within buildings;
> Use of renewable energy production sources on the sites: thermal or PV solar, wind-turbines, heat pumps, geothermal, micro-turbines, digestion, production and reuse of biogas;
Reagents and consumables
> Take account of their emission factor when choosing or defining the buying policy for reagents. For example, use activated carbon of biological origin, choose iron chloride produced using the lowest emissions manufacturing process.
> When making wide-ranging changes to the processes, choose those which use reagents with the lowest emissions (for example, a chemical treatment entails 4 to 5 times more emissions than biological treatment, owing to the iron chloride used).
> Analyse the work done on the networks by breaking it down into work units, according to the technique used (see the chapter devoted to this subject in the guide) in order to optimise GhG emissions linked to installation and maintenance of pipelines.
Processes
> Control of air-conditioning system leaks.
Fret
> Prefer local purchases;
> Prefer rail or sea transport over air or road, in particular for shipment of reagents and network parts.
Staff travel
> Implement a company travel plan;
> Encourage car-pooling, use of public transport, travel by train for long distances, tele-conferencing or audio-conferencing, promote tele-working;
> Train the staff in eco-driving (which can lead to sometimes significant fuel savings);
> Take account of GhG emissions in service vehicle purchase policy.

44
APPENDIX 4 – EMISSION FACTORS SPECIFIC TO THE WATER AND SANITATION PROFESSIONS
http://www.astee.org/publications/bibliographie/guide/guide_11
APPENDIX 5 – EMISSION FACTORS FOR CHEMICAL PRODUCTS
http://www.astee.org/publications/bibliographie/guide/guide_11


ADEME
The French Environment and Energy Management
Agency (ADEME) is active in the implementation of
public policy in the areas of the environment, energy
and sustainable development. The Agency provides
expertise and advisory services to businesses, local
authorities and communities, government bodies and
the public at large, to enable them to establish and
consolidate their environmental action. As part of this
work ADEME helps finance projects, from research to
implementation, in the areas of waste management, soil
conservation, energy efficiency and renewable energy,
air quality and noise abatement.
ADEME is a public agency under the joint authority
of the Ministry for Ecology, Sustainable Development
and Energy, and the Ministry for Higher Education and
Research.
www.ademe.fr
ASTEE
Created in 1905, The Scientific and Technical Association
for Water and Environment (ASTEE) caries out
reflections on the various methodological, technical and
regulatory aspects linked to management of drinking
water, sanitation and aquatic environments in France.
It brings together experts, researchers, scientists and
practitioners as well as representatives of public and
private organizations working on different sectors
related to environment.
ASTEE is qualified to put forward recommendations
and bring them to the attention of public authorities
and is recognized to be of public interest. It constantly
provides advices and decision-making support to all
stakeholders involved in sustainable development,
elected officials as well as their technical staff.
www.astee.org