Embed Size (px)
Citation preview

Methodology for the free allocation of emission allowances in the
EU ETS post 2012
Sector report for the cement industry
November 2009
Ecofys (project leader)
Fraunhofer Institute for Systems and Innovation Research
Öko-Institut
By order of the European Commission
Study Contract: 07.0307/2008/515770/ETU/C2
Ecofys project Number: PECSNL082164

i
Disclaimer and acknowledgements
Disclaimer The views expressed in this study represent only the views of the authors and not those of the
European Commission. The focus of this study is on preparing a first blueprint of an
allocation methodology for free allocation of emission allowances under the EU Emission
Trading Scheme for the period 2013 – 2020 for installations in the cement industry. The
report should be read in conjunction with the report on the project approach and general
issues. This sector report has been written by Ecofys.
Acknowledgements The authors would like to thank representatives from the cement industry for the in-depth
discussions on possible benchmarking options for the cement industry during the execution of
the project.

ii
Table of content
1 Introduct ion . . . . . . . . . . . . . . . . . . . . . . . . . . . . . . . . . . . . . . . . . . . . . . . . . . . . . 1
2 Product ion process and GHG emiss ions . . . . . . . . . . . . . . . . . 3
3 Benchmark ing methodology . . . . . . . . . . . . . . . . . . . . . . . . . . . . . . . . 6
3.1 Background .............................................................................................................. 6 3.1.1 Clinker or cement.................................................................................................. 6 3.1.2 Other issues ........................................................................................................... 9 3.2 Final proposal for products to be distinguished ....................................................... 9
4 Benchmark va lues . . . . . . . . . . . . . . . . . . . . . . . . . . . . . . . . . . . . . . . . . . . . 10
4.1 Background and source of data .............................................................................. 10 4.2 Final proposed benchmark values .......................................................................... 11 4.3 Possibility of other approaches .............................................................................. 12
5 Addit iona l s teps required . . . . . . . . . . . . . . . . . . . . . . . . . . . . . . . . . . 14
6 Stakeholder comments . . . . . . . . . . . . . . . . . . . . . . . . . . . . . . . . . . . . . . 15
7 References . . . . . . . . . . . . . . . . . . . . . . . . . . . . . . . . . . . . . . . . . . . . . . . . . . . . . . 17

1
1 Introduction
The activity of the sector in Annex I of the amened Directive is defined as the “Production of
cement clinker in rotary kilns with a production capacity exceeding 500 tonnes per day or in
other furnaces with a production capacity exceeding 50 tonnes per day”. The respective
NACE codes of the sector are:
NACE code (Rev. 1.1): 26.51
Description: Manufacture of cement
The European cement industry is one of the most concentrated in the world. The 5 largest
European companies accounted for 57% of the total cement output in the EU25 in year 2003,
and each comprises between 23 - 34 cement plants in the whole EU. According to Öko
Institut and Ecofys (2008) the 10 largest producers together accounted for 75% of the total
EU25 cement output.
Table 1 provided by the European Cement Association (CEMBUREAU) gives a list of
installations currently reported in the CITL falling under the 4-digit NACE code 26.51 and
their verified emissions (CEMBUREAU, 2009a).
Table 1 CO2 emissions of cement clinker plants 2005 – 2008 (CEMBUREAU, 2009a)
CITL: Volume of CO2 verified emissions for annual production of cement clinker only (kt CO2)
Allocation Country
No. of instal.
2005 2006 2007 2008 Total
2005 - 2008
AT 9 2682 2966 3241 3221 12109
BE 5 4860 5133 5057 4849 19899
BG 5 0 0 3680 3463 7143
CY 2 1481 1471 1460 0 4412
CZ 6 2553 2796 3219 3015 11583
DE 48 20066 20433 22032 20434 82965
DK 1 2566 2695 2765 2236 10262
EE 1 746 802 1177 1179 3903
ES 36 27385 27366 27468 23405 105624
FI 2 921 963 989 1019 3892
FR 30 14005 14367 14651 13789 56813
GB1 16 9781 9827 10080 8259 26476
GR 8 10974 10745 10459 9878 42055
HU 4 2055 2123 2224 2111 8512
IE 4 3812 3793 3820 3391 14815
IT 54 27633 27861 28629 26156 110278

2
Continuation Table 1
CITL: Volume of CO2 verified emissions for annual production of cement clinker only (kt CO2)
Allocation Country
No. of instal.
2005 2006 2007 2008 Total
2005 - 2008
LT 1 783 1064 1092 902 3842
LU 1 732 697 678 641 2748
LV 1 285 358 363 358 1364
NL 1 621 563 615 616 2415
PL 11 8080 9638 11424 10466 39607
PT 6 6610 6505 6713 6376 26203
RO 7 0 0 6516 6594 13110
SE 3 2065 2277 2108 2203 8653
SI 2 776 836 898 968 3478
SK 4 2093 2138 2287 2357 8874
Total EU 27 268 153564 157417 173641 157884 631034 1 CITL data for 2005-2007 could not be used for the UK, due to half of the UK installations being temporarily excluded in
phase I of the EU ETS. Figures provided to CEMBUREA by the MPA (Mineral Products Association) as officially submitted to the UK National Air Emissions Inventory are reported here.
Installations producing cement clinker in the EU, to our knowledge, not produce electricity
and also the amount of heat supplied to external costumers is limited. This was confirmed in
the results from the questionnaire on sector classification (see final project report, Appendix 2
for more details). The emissions as indicated in the table therefore only refer to direct
emissions that are, in principle, eligible for free allocation.

3
2 Production process and GHG emissions
More detailed descriptions of the production processes can be found in the pilot study on
benchmarks for the EU ETS conducted in 2008 (Öko Institut and Ecofys, 2008) and in the
best available technique reference document (BREF CLM - draft, 2009).
The production of cement follows three fundamental stages (based on Öko Institut and
Ecofys, 2008):
1. Raw material preparation
At first the raw mixture of limestone (approx. 90%) and other materials (e.g. clay, iron ore,
bauxite) is prepared. For this, blocks of raw materials are extracted from a local quarry or
imported from other sites. These consist mostly of limestone but other materials are added to
reach the desired chemical composition. After this the raw materials are crushed into smaller
particles, homogenised and ground into a thin powder called “raw meal”.
2. Clinker production
Clinker production is the most energy-intensive step in the cement production. Temperatures
over 900°C transform the limestone (CaCO3) into lime (CaO), thus releasing CO2. This is
called the calcination process. The calcinated raw meal reaches temperatures of up to 1450°C
which allow its sintering to form clinker. This clinker lends the cement its binding properties.
Once the clinker is formed, it is then rapidly cooled down to 100-200°C.
3. Cement grinding
The clinker produced is mixed with different ingredients to produce the cement. In the case of
Ordinary Portland Cement (OPC), only around 5% gypsum is added. But so-called ‘blended
cements’ are also widely used in Europe. These cements consist of a mixture of clinker and
other products with cementitious properties. These are mostly by-products from other
industries such as blast furnaces, slags from pig iron production, fly ash from coal power
plants or other available pozzolans.
One of the most important indicators to measure the efficiency of a cement plant is the
specific energy consumption for the production of clinker (in MJ/t clinker). Several different
types of clinker kilns exist, with large differences in specific energy consumption and CO2
emission intensity. Two main technology types are the shaft kiln and the rotary Kiln. The
shaft kiln is an outdated technology, which is no longer used in Europe for reasons of high
fuel consumption, low productivity and an inconsistent cement quality. According to recent
figures (IEA, 2007) in the 2002 - 2006 period, 92% of the cement production in Europe was
produced by dry process kilns. An estimated 4.5% of the production was from semi-wet or
4
semi-dry kilns and only 3.5% of the production was from wet kilns. The specific energy
consumption for different technologies ranges from 2950 MJ/t clinker for dry kilns to 6700
MJ/t clinker for wet kilns. The specific heat consumption for the European cement industry
has been constantly decreasing and is estimated in 2006 at 3700 MJ/t clinker (IEA, 2007).
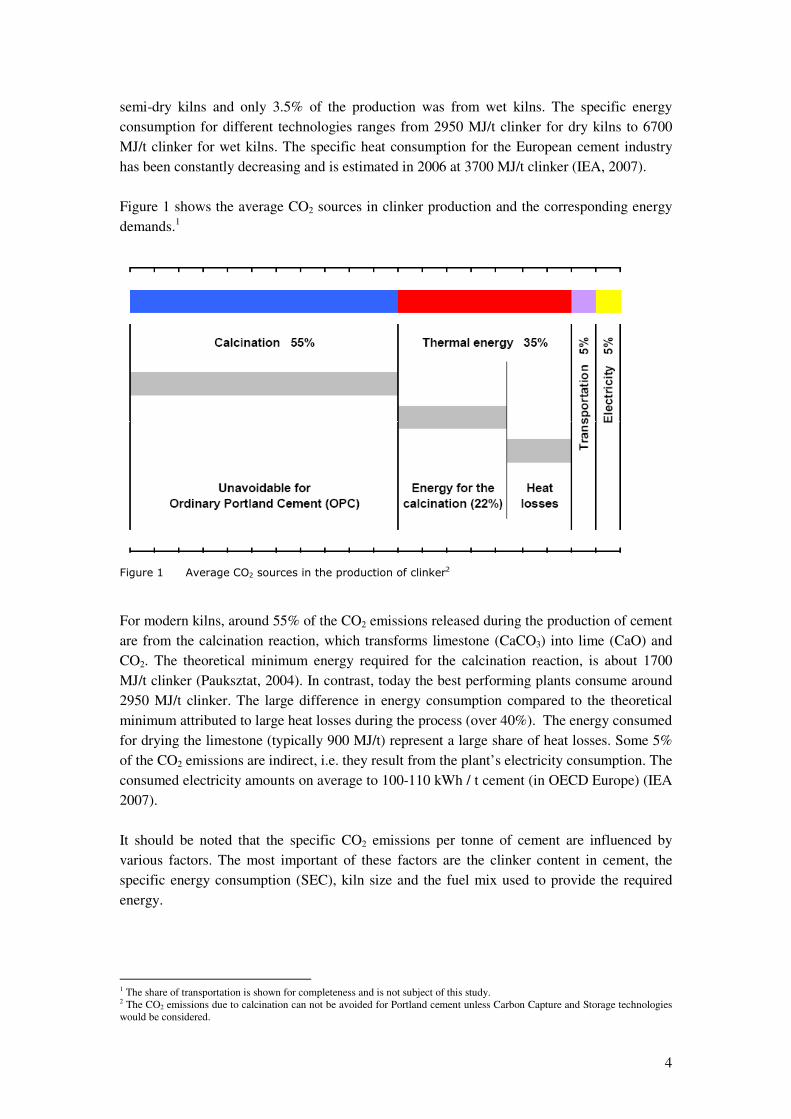
Figure 1 shows the average CO2 sources in clinker production and the corresponding energy
demands.1
Figure 1 Average CO2 sources in the production of clinker
2
For modern kilns, around 55% of the CO2 emissions released during the production of cement
are from the calcination reaction, which transforms limestone (CaCO3) into lime (CaO) and
CO2. The theoretical minimum energy required for the calcination reaction, is about 1700
MJ/t clinker (Pauksztat, 2004). In contrast, today the best performing plants consume around
2950 MJ/t clinker. The large difference in energy consumption compared to the theoretical
minimum attributed to large heat losses during the process (over 40%). The energy consumed
for drying the limestone (typically 900 MJ/t) represent a large share of heat losses. Some 5%
of the CO2 emissions are indirect, i.e. they result from the plant’s electricity consumption. The
consumed electricity amounts on average to 100-110 kWh / t cement (in OECD Europe) (IEA
2007).
It should be noted that the specific CO2 emissions per tonne of cement are influenced by
various factors. The most important of these factors are the clinker content in cement, the
specific energy consumption (SEC), kiln size and the fuel mix used to provide the required
energy.
1 The share of transportation is shown for completeness and is not subject of this study. 2 The CO2 emissions due to calcination can not be avoided for Portland cement unless Carbon Capture and Storage technologies would be considered.

5
Clinker substitutes
By-products such as slags from the steel industry or fly ash from coal combustion can be
mixed with clinker to produce blended cements. As these substitutes do not require most of
the production steps of the clinker which they replace, they are often an economically viable
option. Blended cements can be manufactured with up to 65% of slags or 35% of fly ash.
Compared to CEM I (Ordinary Portland Cement – OPC), equivalent strength classes can be
achieved. By comparison, CEM I typically contains 95% clinker. Blended cements are
already widely used in Europe but production depends on the local availability of clinker
substitutes, markets and applications. By reducing the relative clinker production per tonne of
cement, the associated energy related and process emissions of CO2 are avoided, resulting in
significantly lower specific emissions (i.e. t CO2/t cement) compared to Ordinary Portland
Cement. According to CEMBUREUA, not all types of fly ashes and slags are appropriate for
cement production and the European cement sector is already using most of the available by-
products. Also there is a decreasing tendency in the generation of those by products due to the
new power plants and the evolution of the steel industry (CEMUREAU, 2009c). The
following table 1 highlights the different shares of clinker in various cement types. Blended
cement can be used instead of Ordinary Portland Cement in most applications. However,
certain cement characteristics can be impacted by the use of additives, e.g. initial strength,
drying time, seawater resistance. Therefore, quality standards divide cements on the basis of
their contents of clinker substitutes with an allowed range for their chemical composition.
Within the EU, five major categories of cements are defined (EN 1973), see Table 2.
Table 2 Share of clinker in different cements
Category Share of clinker
CEM I: Ordinary Portland Cement 95 %
CEM II: Portland Composite Cement 65 - 94 %
CEM III: Blast Furnace Cement 5 - 64 %
CEM IV: Pozzolanic Cement 45 - 89 %
CEM V: Composite Cement 20 - 64 %
Fuel mix
Beside carbon-intensive fuels traditionally used in the cement industry, there are alternatives
leading to lower fossil CO2 emissions, which are also being already widely used. Up to 40%
of biomass can be used as a fuel in cement production. Cement kilns are also an alternative
way to incinerate combustible wastes compared to waste incinerators. Several industrial
wastes are for example used in cement kilns. The substitution rate of coal by waste in the
cement industry in most European countries is between 0 - 100%.
Kiln capacity
In addition to kiln technology, kiln capacity is another important factor influencing the energy
efficiency of a cement plant. Large kilns have lower heat losses per unit of clinker produced
and therefore show lower specific heat consumption and CO2 emissions.
3 Cement - Part 1: Composition, specifications and conformity criteria for common cements; German version prEN 197-1:2009

6
3 Benchmarking methodology
3.1 Background
The manufacture of cement falls under the following PRODCOM codes:
• 26.51.11.00: Cement clinker
• 26.51.12.10: White Portland cement
• 26.51.12.30: Grey Portland cement (including blended cement)
• 26.51.12.50: Alumina cement
• 26.51.12.90: Other hydraulic cements
3.1.1 Cl inker or cement
The primary choice regarding benchmarking is between cement or clinker based benchmark.
In Table 3 below we summarize the key arguments used in favour of either cement or clinker
benchmarking4.
Table 3 Key arguments for cement or clinker benchmarking
Issue In favour of Clinker
benchmarking
In favour of Cement benchmarking
1) Scope of the amended
Directive
In Annex I of the
amended Directive, the
reference is to clinker, not
to cement. As a result,
grinding stations as such
are not included in the
EU-ETS and the
benchmark should
therefore be based on
clinker.
Article 3 of the amended Directive
includes “directly associated activities
which have a technical connection with
the activities carried out on that site …”
At least for integrated (clinker and
cement) facilities, this means that
blending is also included.
There is a link between the definition
of activity in the EU ETS and the
definition of activity in the Integrated
Pollution Prevention and Control
(IPPC) Directive. From the Best
Available Technique Reference
Documents for cement, it becomes
clear that cement grinding is included
within the scope of the IPPC Directive
4 In compiling this text we made use of several personal communications with stakeholders within and outside the cement sector.

7
Continuation Table 3
Issue In favour of Clinker
benchmarking
In favour of Cement benchmarking
2) Article 10 a (1) of the
amended Directive that
indicates that for each sector
and sub-sector, in principle,
benchmarks should be
developed for products
rather than for inputs, in
order to maximise GHG
emissions reduction and
energy-efficiency savings
throughout each production
process
Based on the scope of the
amended Directive (see
above), the “product” is
clinker, not cement
Based on the scope of the amended
Directive (see above), the “product” is
cement, not clinker.
Given the scope of the
amended Directive,
“throughout each
production process” rules
out technology-specific
benchmarks, but does not
“prescribe” cement
benchmarking.
Given the scope of the amended
Directive, “throughout each production
process” means that the incentive to
reduce the clinker factor should be fully
included in the EU ETS. This can only
be accomplished via cement
benchmarking.
3) Clinker imports and
exports out of the EU-27
Cement benchmarking
can create a perverse
incentive to replace
domestically produced
clinker with imported
clinker.
Cement benchmarking can be applied
only to domestically produced clinker,
thereby taking away this perverse
incentive. This should thus not be a
limiting factor to applying cement
benchmark.
4) Clinker trade between
installations
Cement benchmarking
can not be applied to
individual installations
due to the trade of clinker
between installations
including trade with
grinding stations.
Cement benchmark is possible by using
1 An installation-specific clinker ratio.
This ratio could be applied to the
cement produced with clinker produced
on-site. For clinker crossing the system
boundaries, clinker benchmarking
could be applied.
2 Apply a company-specific clinker to
cement ratio in the allocation formula
Clinker trade between installations
should thus not be a limiting factor to
applying cement benchmark.
Continuation Table 3

8
Issue In favour of Clinker
benchmarking
In favour of Cement benchmarking
5) Need for multiple
benchmarks
Only a clinker benchmark
does not require
correction factors. In case
of cement benchmarking,
the differentiated
availability of clinker
substitutes and quality
differences between
blended cements should
be accounted for, adding
to the complexity of the
system.
Also in the case of cement
benchmarking, there is no need for
differentiation. Using a single cement
benchmark fully includes the incentive
to use blending materials to the extent
possible.
In particular, based on the 4th issue (clinker trade between installations), we conclude that a
benchmarking methodology based on clinker is the most practical approach for the cement
sector, also in line with the following starting point outlined in the report on the project
approach and general issues:
• Intermediate products that are traded between installations could be given separate
benchmarks, because otherwise the allocation to installations producing only the
intermediate would become very difficult.
The solutions (conceptually described in the table and a bit further discussed in Section 4.3) to
solve these practical difficulties in case of cement benchmark either result in a hybrid system
in which for a single product (clinker), two different benchmark methodologies are developed
or in a situation that a new entity (the company) is introduced in the allocation methodology5.
Both are not in line with the approach as outlined in the report on project approach and
general issues.
We do realize that with clinker benchmarking, clinker substitution is not incorporated as such
in the benchmarking methodology. Assuming that benchmarking will also be applied for the
allocation in trading periods after 2020, clinker benchmarking could give a negative incentive
for blending in the sense that increased blending could result in lower allowances in the next
trading period (an update problem)6. Regarding new installations, a clinker benchmark could
distort incentives to invest in blended cement. However, in view of the practical difficulties
associated with cement benchmarking (issue 3, 4 and 5) and in view of the ambiguity
regarding the scope of the amended Directive (1, 2), we regard this as acceptable.
5 In addition, the problem of clinker trade between companies would not be solved in this methodology. 6 Of course, cement benchmarking would also result in a different distribution of initial allowances between the various cement companies. As such, the real costs for buying allowances and the distribution of these costs over installations and companies will be different than with clinker benchmarking.

9
3.1.2 Other issues
In the report by Öko Institut and Ecofys (2008), several secondary factors are listed that could
be included as correction factor in the benchmark methodology such as:
1. Technology differentiation
2. Plant age and size
3. Moisture content raw materials
4. Fuel emission factors
5. Alternative fuels
6. By-pass factor
7. Self-generation of power from waste heat
Some of these factors (1, 2, 3, 6) directly conflict with the general starting points as used in
this study, whereas others (4, 5) are “automatically” taken into account in determining the
average of the 10% most GHG efficient installations (see below). Therefore, no correction
factors are proposed for these factors in line with Öko Institut and Ecofys (2008). Also for the
self-generation of power from waste heat, no correction factor (or additional allocation) is
proposed.
One additional issue is the small production volume of clinker for white cement. The
production process differs in a number of ways from that of grey cements7. The difference
between grey and white cement is an aesthetical one, but that two cements have the same
application. Only aesthetics are not a valid argument to distinguish between the two types of
clinker. Furthermore, is not yet clear whether existing production classifications allow
distinguishing between clinker for white cement and what the production volume for white
cement is. The PRODCOM classification seems to indicate that such a differentiation is
difficult to make. We therefore propose not to make a distinction between various types of
cement clinker.
3.2 F ina l proposa l for products to be d is t inguished
Based on the above, and the arguments laid out in Section 3.1.1 on a clinker vs. cement
benchmark, we propose one single EU-wide benchmark for clinker production, applicable
also to clinker for white cement. The relevant PRODCOM code is 23.51.11.00.
7 The kilns operate at a higher peak temperature and after the kiln, quenching is applied in which the sensible heat is not recycled as in normal clinker manufacture. As a result the specific energy consumption is between 5 and 10 GJ / t white clinker (CEMBUREAU, 2009e).

10
4 Benchmark values
4.1 Background and source of data
The benchmark curve as shown in the following section is based on the Getting the Numbers
Right (GNR) database developed as part of the World Business Council for Sustainable
Development Cement Sustainability Initiative (WBCSD - CSI). The CSI systematically
collects data on CO2 emissions using a uniform protocol. A selection of data gathered via this
protocol is included in a database, called the “Getting the numbers right (GNR)” database.
The EU ETS monitoring and reporting guidelines cover only a fraction of the parameters that
are available in the CSI protocol. The protocol for example includes also information on
indirect emissions from electricity, allows aggregation at the company level and includes also
baseline setting.
The data provided by the Cement Sustainability Initiative (CSI) covers over 94% of the
clinker production facilities in the EU27 (or 226 plants). The EU 27 clinker kilns that are not
included in the GNR database are minor producers with small production volumes.
(CEMBUREAU, 2009b) The data might include also some white clinker facilities as these
are sometimes combined with grey clinker kilns and production might have been reported in
an aggregated way.
CEMBUREAU provided the following correspondence Table 4 between the GNR data for the
EU27 and the data based on CITL.
Table 4 Differences between verified emissions in CITL and in the GNR database (values in kt CO2)
CO2 emissions (kt CO2) 2005 2006 2007 Tot.
2005 -2007
CITL - Total EU 27 148881 152661 171608 473151
CITL (corrected for the UK) - Total EU 27
153564 157417 173641 484622
GNR Absolute gross CO2 emissions over time - EU 27
151612 156019 Not available Not available
GNR - CITL 2730 3358 Not available Not available
GNR - CITL (corrected for the UK)
-1953 -1398 Not available Not available
In relation to the direct emissions from clinker production at the installation level (between
CITL and the GNR database), small differences (less than 2%) may occur as a result of the
inclusion of non-kiln fuels and differences in default emissions factors and definitions.
Specific differences between the EU ETS Monitoring and Reporting Guidelines (MRG) and
the GNR are:

11
1. The WBCSD CSI protocol does account mixed biomass and fossil waste as 100%
fossil, whereas, in the EU ETS, companies may report a certain biomass fraction on
the basis of laboratory analyses. The CSI Protocol considers only “pure” biomass as
climate neutral.”
2. The WBCSD CSI protocol uses as default emission factor for process emissions from
clinker making a value of 538 kg CO2/t clinker, whereas the EU ETS MRG use a
default value of 523 kg CO2/t clinker. Both the EU ETS MRG and the CSI protocol
allow the use of input based methods. A frequency distribution (Figure 2) of the
specific process CO2 emissions from the GNR database explains the default value of
538 kg CO2/t clinker from the GNR database. (CEMBUREAU, 2009a)
Figure 2 Frequency distribution of specific process CO2 emissions of grey clinker cement plants
(CEMBUREAU, 2009a)
We recommend basing the final benchmark value on data that are fully in line with the EU
ETS monitoring and reporting guidelines i.e. base the final benchmark value on data from the
CITL register and to include also the white clinker production facilities in the curve (see also
Section 5). Given the above, it is expected the changes of basing the benchmark on CITL will
in any case be quite small.
4.2 F ina l proposed benchmark va lues
The proposed benchmark is based on a full intensity curve as provided by CEMBUREAU
through the CSI initiative. The final curve for the year 2006 is shown in Figure 3.

12
Figure 3 Gross CO2 emissions per t clinker
This curve is based on the curve shown in Figure 2 meaning that reported site specific process
emissions are taken into account and not an average value. From this curve a preliminary
benchmark value of 780 kg CO2/t clinker can be derived as the average of the 10% best
performing plants (estimate based on visual inspection of the curve). This final value should
be corrected for the specific differences between the EU ETS Monitoring and Reporting
Guidelines and the CSI protocol. The necessary correction for the difference in emission
factor for process emission is maximal 15 kg CO2/t clinker (downwards). The necessary
correction for mixed biomass and fossil waste is unknown. Furthermore, the curve does not
yet include clinker kilns in Norway and Iceland.
4.3 Poss ib i l i ty o f other approaches
Although it is proposed to apply a clinker benchmark as allocation methodology it is still
worthwhile to consider how an allocation based on cement benchmarking could look like. The
basic allocation formula based on cement benchmarking would be:
A= Bc*Pc
With A being the allocation, Bc the cement benchmark in t CO2 / t cement and Pc the cement
production in a given year. Clinker and cement production are related via the clinker to
cement ratio (the clinker content in the cement produced). Since clinker production is the CO2
emitting process and clinker is traded between installations, the production of cement by an

13
installation8 in combination with the clinker to cement ratio of the cement produced by that
installation (defined as clinker consumed divided by cement produced) does not directly
correlate to the emissions of that installation. A grinding station not included in the EU ETS
and receiving all clinker from other facilities, does not have emissions, but clearly produces
cement with a certain clinker to cement ratio. At the other extreme, a clinker production
facility delivering all clinker to a grinding station, does not have any cement production, but
clearly has the emissions related to clinker production.
This situation could be solved by applying the cement benchmark only to cement production
which is produced with clinker produced by the installation and apply clinker benchmarking
for clinker flows over the system boundary. However, this could result in an incentive for
clinker flows between installations if that would yield a higher allocation and furthermore
strongly contradicts with the principle of having only benchmark per product. Alternatively, a
company specific clinker to cement ratio could be introduced, thereby levelling off at the
company level the clinker flows between companies9. However, this might create a good
distribution of allowances at the company level, but obviously not at an installation level.
Also the company is not a relevant entity within the EU ETS.
Based on this analysis, we maintain the conclusion that, albeit not strictly impossible, cement
benchmarking significantly complicates the benchmarking methodology.
8 Another issue regarding cement production figures is that the definition of cement according to the GNR databases includes also ground slag and fly ash that is sold directly to be used as cement substitution. This is not consistent with the definition of cement according to the European Standard. Before applying cement benchmarking, a consistent definition for cement therefore needs to be agreed on. 9 Information on clinker trade is not available to the authors, but industry experts indicate that the majority of clinker trade between installations is between installations owned by the same company.

14
5 Additional steps required
The curve that forms the basis for the benchmark values derived in this report is based on data
for 2006 and on data collected via the CSI protocol. To further improve the accuracy of the
resulting benchmark value it is recommended to:
• Use emissions according to CITL rather than based on the CITL to be fully in line
with the EU ETS Monitoring and Reporting Guidelines10
• To include all clinker production facilities in the EU 27 and Norway and Iceland in
the curve including also facilities producing white cement
• To update the curves with values for 2007 and 2008
It can be expected that the resulting benchmark value will not differ much from the value of
780 kg CO2 / t clinker as derived in this report.
10 In practice it will be difficult to use the CITL data for creating benchmark curves, because the entity managing the GNR database (including clinker production volume) does not have the CITL emissions available at the GNR installation level and probably needs approval from the Cement Sustainability Initiative (CSI) to combine the GNR database with other sources. Still, the possibilities of using CITL data could be further discussed with CEMBUREAU.

15
6 Stakeholder comments
The comments as included here are based on CEMBUREAU comments (CEMBUREAU
2009c) to an earlier draft of this report.
Based on the text of article 10a (2) of the amended Directive stating that “in defining
principles for setting ex-ante benchmarks in individual sectors or sub-sectors, the starting
point shall be the average performance of the 10% most efficient installations in a sector or
sub-sectors in the Community in the years 2007-2008. CEMBUREAU does not share Ecofys’
view that “most efficient” should always be interpreted as ‘most greenhouse gas efficient”.
As outlined in the CEMBUREAU benchmark proposal sent on 18 May 2009
(CEMBUREAU, 2009d), CEMBUREAU proposes a benchmark based on the average
performance in terms of energy efficiency of the 10% most efficient installations, taking into
account a fixed fuel mix.
CEMBUREAU advocates such a step-wise approach in which energy efficiency and fuel mix
are separately assessed and combined in an overall benchmark as the CO2 efficiency curve is
mainly influenced by the biomass use percentage in the case of the cement industry. As
illustrated below in Figure 4, all plants belonging to the P10 (i.e. the first percentile in the
benchmark curve) in terms of CO2 efficiency have a biomass use percentage significantly
higher than the average.
0.0
5.0
10.0
15.0
20.0
25.0
30.0
35.0
40.0
45.0
730
740
750
760
770
780
790
800
810
820
0 5 10 15 20 25 30 35
% B
iom
as
s U
se
Gro
ss
CO
2 p
er
ton
ne
clin
ker
2006
Figure 4 Relation of biomass percentage and gross CO2 emissions

16
Furthermore CEMBUREAU stated that the installations belonging to the P10 are not the most
efficient ones in terms of energy efficiency and that there is, in the P10, no correlation
between energy efficiency and CO2 emissions. This can be seen in Figure 5.
3200
3300
3400
3500
3600
3700
3800
3900
4000
720
730
740
750
760
770
780
790
800
810
820
0 5 10 15 20 25 30 35 En
erg
y c
on
su
mp
tio
n in
GJ
/ to
nn
e c
lin
ke
r
Gro
ss
CO
2 p
er
ton
ne
clin
ke
r
2006
Figure 5 Relation of energy consumption and gross CO2 emissions
Hence CEMBUREAU proposes a benchmark based on the average performance in terms of
energy efficiency of the 10%most efficient installations, taking into account a fixed fuel mix.
In their 18th of May proposal (CEMBUREAU), they derive an energy benchmark of 3.2 GJ / t
clinker and an average emission factor of 93.57 kg CO2/ GJ to arrive at a proposed benchmark
value of 837 kg CO2 / t clinker.
Contrary to ECOFYS’ statement, CEMBUREAU believes that the incentive to increase the
blend in cement is equally present with a clinker benchmark (clinker production) as with a
cement benchmark. CEMBUREAU also remarks that a clinker benchmark does not bring
about a negative incentive to reduce CO2 emissions. Indeed there are not enough active
clinker substitutes in Europe to cover the cement demand in Europe in 2020 and 2030. All
companies will therefore be naturally forced to use the maximum amount of additions that are
available to them without necessarily reducing clinker production. The most sustainable path
in the long term for the cement industry in Europe is to trigger improved energy efficiency,
closing low efficient kilns and upgrading equipment according with best available technology.
This is appropriately addressed through a clinker benchmark.

17
7 References
BREF CLM-draft (2009) Draft Reference Document on Best Available Techniques in the
Cement, Lime an Magnesium Oxide Manufacturing Industries, European Commission,
Institute for Prospective Technological studies, Seville, May 2009.
CEMBUREAU (2009a), personal communication with CEMBUREAU email received on 31st
July 2009
CEMBUREAU (2009b), personal communication via phone with Claude Lorea of
Cembureau on 22nd July 2009
CEMBUREAU (2009c), personal communication with CEMBUREAU email received on 1st
July 2009
CEMBUREAU (2009d), CEMBUREA EU ETS Benchmark Proposal EU ETS WG 3
Comitology, dated 8 May 2009, sent via e-mail on 18 May 2009
CEMBUREAU (2009e), Personal Communication with CEMBUREAU, 9 October 2009
IEA (2007), Tracking industrial energy efficiency and CO2 emissions, International Energy
Agency, Paris, France, Retrieved at_
http://www.iea.org/textbase/nppdf/free/2007/tracking_emissions.pdf
Pauksztat, A. Chair of Technical Thermodynamics, Aachen University, Germany. (October
15-16.2004) Benchmarking as Basis for a Technical Oriented Allocation Method of
CO2-Emissions. Retrieved at: www.kueichstaett.de/WWF/VWF/ICP/9th/pauksztat.ppt
Öko Institut and Ecofys (2008), Pilot on Benchmarking in the EU ETS, prepared for the
German Federal Ministry for the Environment, Nature Conservation and Nuclear Safety
and the Dutch Ministry of Economic Affairs, Berlin/Utrecht, October 2008


![[OUTDATED] Nicholas Frayne // Architecture](https://img.pdfslide.us/doc/110x75/568ca6f21a28ab186d935f0c/outdated-nicholas-frayne-architecture.jpg)