Embed Size (px)
Citation preview
energies
Article
Methodology for the Evaluation of Resilience of ICTSystems for Smart Distribution Grids
Pau Lloret-Gallego 1, Mònica Aragüés-Peñalba 1, Lien Van Schepdael 2,Eduard Bullich-Massagué 1, Pol Olivella-Rosell 1 and Andreas Sumper 1,*
1 Centre d’Innovació Tecnològica en Convertidors Estàtics i Accionaments (CITCEA-UPC), Departamentd’Enginyeria Elèctrica, ETS d’Enginyeria Industrial de Barcelona, Universitat Politècnica de Catalunya,Avinguda Diagonal, 647, Pl. 2, 08028 Barcelona, Spain; [email protected] (P.L.-G.);[email protected] (M.A.-P.); [email protected] (E.B.-M.);[email protected] (P.O.-R.)
2 ELECTA, Electrical Engineering Department, KU Leuven, Kasteelpark Arenberg 10, 3001 Leuven, Belgium;[email protected]
* Correspondence: [email protected]; Tel.: +34-93-413-73-11
Academic Editor: Gianfranco ChiccoReceived: 6 July 2017; Accepted: 23 August 2017; Published: 29 August 2017
Abstract: Ensuring resilient operation and control of smart grids is fundamental for empoweringtheir deployment, but challenging at the same time. Accordingly, this study proposes a novelmethodology for evaluating resilience of Information and Communication Technology (ICT) systemsfor smart distribution grids. Analysing how the system behaves under changing operating conditionsa power system perspective allows to understand how resilient the smart distribution grid is,but the resilience of the ICT system in charge of its operation affects the overall performance ofthe system and does, therefore, condition its resilience. With the aim of systematising the evaluationof ICT systems’ resilience, this study proposes to combine a standardized modelling of Smart Grids,the Smart Grid Architecture Model (SGAM), with a data structured diagram, the Entity RelationshipModel (ERM). The architecture of smart distribution grids is analysed through SGAM. Then, theirtechnical characteristics and functionalities are defined and represented in a ERM diagram. Finally,the attributes or properties of the system components are used to formulate resilience indicatorsagainst different types of disturbances. This methodology is then applied to analyse the resilience ofa ICT platform being developed in EMPOWER H2020 project.
Keywords: resilience; distribution grids; smart grids; Distributed Energy Resources; Smart GridArchitecture Model; Entity Relationship Model
1. Introduction
The performance of traditional power transmission systems has usually been assessed by its abilityto resist disturbances and to recover efficiently in case of failure. Existing resilience indices wouldgive insight of the system reliability and its robustness against a set of disturbances (e.g., componentfailure) [1]. As traditional transmission grids were static constructions with the relatively invariabletask of transmitting power form a central power plant to a decentralized network of loads, it madesense to assess its performance with invariable and static metrics as the Average Service AvailabilityIndex (ASAI) among others [1].
These new grid elements, together with constant changes within the environment in whichthe distribution system operates, create new requirements for the power system to be fully performant.With the new functionalities that are being assessed to the distribution grid, sufficient robustness doesno longer mean sufficient performance, as static robustness may be interfering with the flexibility
Energies 2017, 10, 1287; doi:10.3390/en10091287 www.mdpi.com/journal/energies
Energies 2017, 10, 1287 2 of 16
of the grid, which is required to control the wide variety of new components that are being added.In other words, a transition is taking place in which the distribution grid is becoming a dynamicsystem that evolves towards new equilibria over time. All the above aspects are making more difficultto determine how resilient smart distributed systems are.
On the other hand, distribution grids are bringing not only new grid elements, but also newactors and roles. The electrical exchanges enabled by local generation, consumption and storage units,as well as by their derived flexibility, are leading to economic transactions which could be managedlocally in the so-called local electricity markets [2], also known as micromarkets in some studies [3].A key actor for the local energy markets deployment is the so-called Smart Energy Service Provider(SESP) [4,5]. It is the entity responsible for the operation and control of the different units in theselocal electricity markets. Additionally, the SESP is their aggregator, trading electricity in wholesalemarkets. The SESP information exchange with these elements is possible thanks to Informationand Communication Technologies (ICT) based platform. In this sense, in order to ensure a resilientoperation of the distribution grid, the ICT platform itself, must be resilient too. The assessment ofthe resiliency of ICTs for smart distribution grids is the focus of this the present study.
The resilience concept, for its broadness and wide range of application, has lead to several studiesin the literature. A review of approaches to resilience definition and assessment is performed in [6].The need for resilience metrics in energy systems is stated in [7], where a matrix-based approach isdeveloped to generate resilience indicators. Focusing on resilience of distribution systems, it has beenanalysed from very different perspectives. The authors from [8] define and analyse the resilience ofelectric distribution systems integrating microgrids. The resilience of a distributed algorithm thatoperates and controls a microgrid has been analysed in [9]. The potential of microgrids as a resilienceresource is evaluated in [10].
Regarding resilience of ICT systems, some studies have analysed it without restricting the fieldof application of these ICT. Resilience in communication networks has been studied in [11],presenting principles for designing resilient networks and techniques to analyse network resilience.The requirements for resilient ICTs are described in [12], where the qualitative evaluation of resiliency isdone in terms of ICT service continuation. If ICT service can still continue even if the ICT is affected bya disaster, the resiliency of such ICT is considered high. The resilience of control systems is addressedthrough an automated control approach in [13], identifying a resilient control problem where a lineardynamic system is subject to the replay and Denial-of-Service attacks. On the other hand, an approachfor selecting architectures in a connected infrastructure system to increase resilience of the overallinfrastructure system is presented in [14].
The specificities of the control and communication architecture of smart distribution grids, whichimply different actors, roles, elements and functions compared to other systems, justify dedicatedstudies of resilience of ICT for their operation. However very few studies evaluate of the resilienceof the ICT platforms for operating smart distribution grids. Additionally, most of them address theirresilience focusing only on the vulnerabilities resulting from cyber attacks [15].
Taking into account the limited analysis of resilience of ICT systems in smart distribution grids,this paper proposes a novel methodology to evaluate it taking advantage of the combination of twoexisting tools. One is the standardized modelling of Smart Grids proposed by CENELEC [16], SmartGrid Architecture Model (SGAM) and the other one is an extended method for structuring datadiagrams: the Entity Relationship Model (ERM). Although these are well-developed tools, their useto assess resiliency as proposed in this methodology is not being addressed in smart grids context.The novel methodology developed allows to determine the criticality of functions and elementsinvolved in ICT systems for operating smart distribution grids in a systematic way.
This study is structured as follows. First, resilience concept is particularised for applicationin distribution grids (see Section 2). Then, a methodology to assess resilience of ICT systems forsmart distribution grids is developed in Section 3, based on the Entity-Relationship model. Next, this
Energies 2017, 10, 1287 3 of 16
methodology is applied to a case study in Section 4 to evaluate the resilience of a ICT platform for localenergy markets operation. Finally, conclusions are drawn in Section 5.
2. Defining Resilience
Before developing the methodology for resilience evaluation of ICT systems, the resilienceconcept assumed is clarified. The traditional centrally operated transmission grid is a complex,but mainly steady system with only a few well defined functionalities and a rather static infrastructure.Therefore, much of the literature found in electrical engineering defines resilience based on the abilityof a system to “bounce back” to its initial and invariable state after a disturbance. On the otherhand, the transition towards decentralized smart distribution grids is characterized by the dynamicsof integrating new technologies and new participants into the grid. Therefore, resilience for smartdistributed power systems will have some additional features that take into account the grids capacityto evolve towards new equilibria. When interpreting the transmission grid as a single equilibriumsystem with invariable functionalities, it was sufficient to assess its ability to resist and recover fromforeseeable disturbances. In other words, its resilience was assessed on its robustness and reliability.To take the recent power system evolutions on distribution grids into account, this paper will usea resilience definition considering the static and dynamic performance of the smart grids. As such,the definition of resilience in the context of smart distribution grids can be summarized as statedin [17]: “The ability to prepare for and adapt to changing conditions and withstand and recover rapidlyfrom disruptions”. Taking into account the previous resilience definition and similarly to [18], resiliencecan be divided into five quantifiable characteristics: reliability, adaptive capacity, elasticity, plasticity,and evolvability. The first three terms are describing short term resilience or how the system reactswhen a disturbance occurs. The last two terms, plasticity and evolvability, describe long term resilience,or the systems ability to evolve and adapt after undergoing disturbances. Moreover, a distinction ismade between dynamic and static resilience characteristics. Table 1 gives an overview of the fiveresilience characteristics, classified according to the affected time frame.
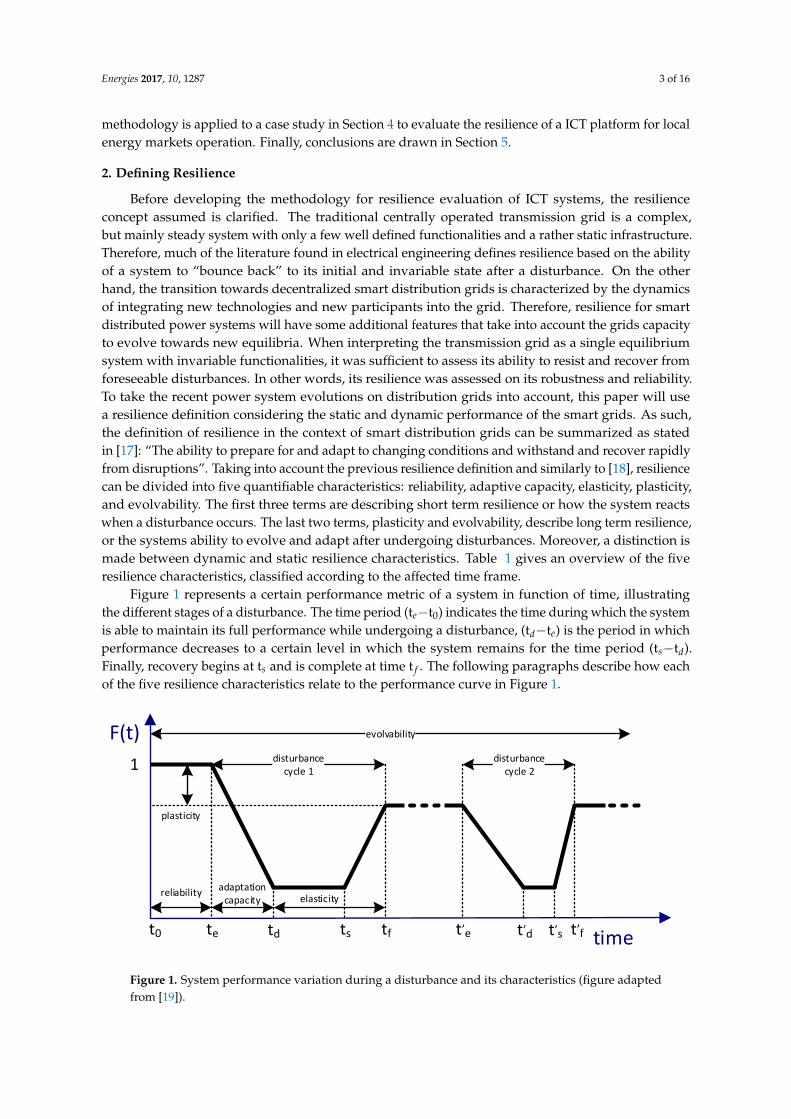
Figure 1 represents a certain performance metric of a system in function of time, illustratingthe different stages of a disturbance. The time period (te−t0) indicates the time during which the systemis able to maintain its full performance while undergoing a disturbance, (td−te) is the period in whichperformance decreases to a certain level in which the system remains for the time period (ts−td).Finally, recovery begins at ts and is complete at time t f . The following paragraphs describe how eachof the five resilience characteristics relate to the performance curve in Figure 1.
F(t)disturbance
cycle 1disturbance
cycle 2
evolvability
1
t0 te td ts tf t,e t,
d t,s t,
f
plasticity
adaptation capacity elasticity
reliability
Figure 1. System performance variation during a disturbance and its characteristics (figure adaptedfrom [19]).
Energies 2017, 10, 1287 4 of 16
Table 1. The five characteristics of resilience.
Static Dynamic
Short term reliability elasticity, adaptation capacityLong term plasticity evolvability
2.1. Reliability
The term is used to describe how well a system can withstand anticipated disturbances, namelyhigh probability, low impact events. For instance, power line failures are foreseeable failures, andcan be resolved by building redundancy into the system, making it more reliable. The reliabilityof the system is about building a system that is robust enough to resist disturbances. Thereforereliability is a property that has to be implemented in the design stage of the system. It requiresa top-down approach, by anticipating on the possible disturbances that can occur during the systemslifetime. Moreover, as reliability only assesses if a system is functional or non-functional, it is a staticcharacteristic, that does not change over time. In Figure 1, the system is fully functional during thetime period (t0−te). The longer this period, the more reliable the system is.
2.2. Adaptation Capacity
If a system cannot withstand a certain disturbance, it will be degraded to a lower level ofperformance, and this process is represented in time period (td−te) in Figure 1. This period representsthe adaptive capacity of a systemor how well the system can tolerate a disturbance before gettingfully degraded. The longer this period, the more controlled the degradation will be, which can limitthe overall damage caused by the disturbance, and indicates a higher ease of adaptation of the system.
2.3. Elasticity
Similar to metallurgy, elasticity in this context refers to the ability of a system to fully return orbounce back, to its original state after undergoing a deformation. In Figure 1, elasticity encompasses thetime range from a fully degraded state of the system (ts−td) up to the recovery period (t f−ts), included.If the system fails to fully recover the damage, then the loss of performance is irreversible and becomesa long term characteristic, described as plasticity. The more efficient the recovery, the more resilientthe system.
2.4. Plasticity
As stated earlier, the terminology used in metallurgy can be applied in the context of resiliencetoo. When a system undergoes irreversible damage, in other words, can no longer bounce back toits original equilibrium state, it loses its elasticity and the loss of system properties is described byplasticity. In Figure 1, this is shown by the difference between the initial fully performant state (at 100%performance rate), and the degraded state after recovery (at 80% performance rate). Once a systemhas plasticity, it won’t change over time, hence it is a static characteristic. Plasticity is not a favorablecharacteristic of resilience, as an elastic system is much more flexible.
2.5. Evolvability
This term refers to the ease with which a system can adapt itself to changes or improve itselfby learning from the disturbances it undergoes. For instance, Figure 1 shows how a system adaptsits behavior after a first disturbance, resulting in improved operation during a second disturbancecycle, where the system recovery initiates faster and the recovery time is shorter (improved elasticity)and does not suffer from additional plasticity. Evolvability is a characteristic that changes over time,together with the changes undergone by disturbances.
Energies 2017, 10, 1287 5 of 16
3. Multidimensional Approach for Resilience Evaluation
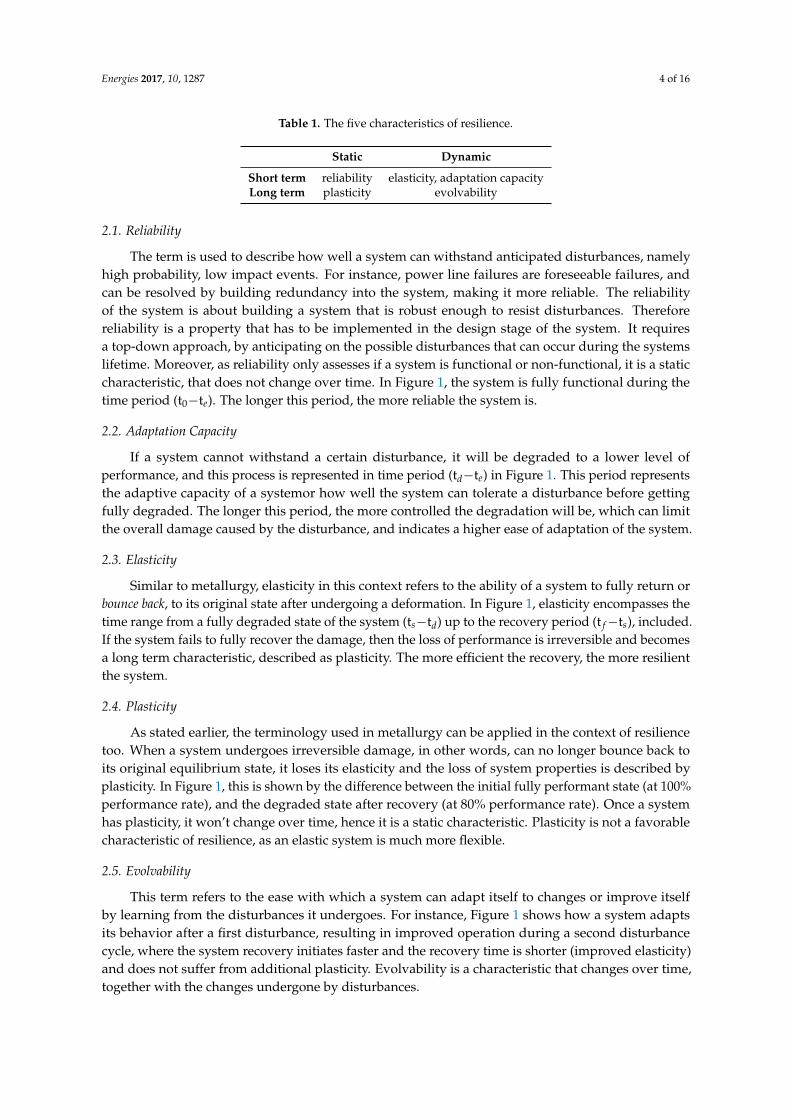
To assess how a disturbance affects the performance of a control system for distribution grids,this paper proposes the methodology shown in Figure 2.
Figure 2. Workflow of the methodology.
First, the assessed system needs to be characterized. This includes identifying its mainfunctionalities or High Level Functions (HLF) and representing the whole structure and elementsinvolved through the Smart Grid Architecture Model (SGAM) (see Section 3.1). Then, the obtainedstructure is related to the system’s main functionalities (e.g., remote monitoring, load and generationforecasting, communication with users and clients of the system) through a functional decomposition,as reflected in Section 3.2.
In order to specify the relationships between the different elements, the entities of the systemdefined by means of its properties (attributes) are identified in a conceptual Entity Relationship Model(ERM), according to Section 3.3. With the ERM, the share or importance of each of the system’s entitiesin performing the main functionalities of the system can be identified. When a disturbance occursin a certain element, the ERM model makes it possible to quantify the degree of impact it has onthe overall performance of the system, for each of its main functionalities.
The entity-relationship model, together with the functional decomposition of assessed systemform the basis for the presented resilience analysis framework (see Section 3.4). The resulting resilienceevaluation framework gives an indication of the resilience of the control system with respect tothe element in which the disturbance occurs. The more a disturbance affects the overall systemperformance, the less resilient the system is with regard to the involved element.
The before-described methodology will be applied to a particular case in Section 4.
3.1. Use Case Definition through SGAM Methodology
Prior to the evaluation of the resilience of a system, the involved elements and general operationprocedures need to be analysed. This can be achieved determining the system technical architectureusing the Smart Grid Architecture Model (SGAM) methodology. The Smart Grid Architecture Model(SGAM) is a three dimensional representation of the smart grid architecture established by the SmartGrid Coordination Group, a working group that is in charge of fulfilling the M/490 EU Mandate onsmart grids standardization [16].
The SGAM distinguishes different levels of functionality of the smart grid by decomposing it intodifferent layers of operability, zones, and domains. The Smart Grid zones are classified depending onthe procedures involved: process, station, operation, enterprise and market. The Smart Grid domainscan cover generation, transmission, distribution, Distributed Energy Resources (DER) and customerpremises. There are five interoperability layers, namely the component, communication, information,function, and business layers, which represent the hierarchical levels on which stakeholders interactin a smart grid system. The SGAM model standardizes the definition of smart grid functionalities andallows to define use cases to describe its main functionalities or HLF.
The advantage of the multidimensional framework is that smart grid functionalities can beexpressed independently from the physical set-up of the system or from its participants. As such,
Energies 2017, 10, 1287 6 of 16
a system represented through an SGAM can be adopted by different technologies and actors, and canfit in different regulatory delimitations.
3.2. Functional Decomposition
According to this methodology, resilience is assessed by looking at how the main systemfunctionalities are executed by a combination of multiple elements of the system. To do so, the mainfunctionalities or HLFs are decomposed into a set of less complex functions. To analyze whichelement executes what part of each of the main HLFs, these functionalities are decomposed intoa combination of secondary functions (SFs), which are in turn subdivided in a set of primaryfunctions (PFs).
These functions get input parameters in brackets, and deliver an output accordingly. The followinginput types can be required:
• Entities: they represent the physical components, actors or ICT links that execute the PFs. SomePFs require more than one entity to be executed, namely when the executing entity needs to sendsomething to a receiving entity or when intermediary entities are required. Hence the possibleentities are:
– executing entity: the entity performing the PF.– receiving entity: the entity receiving data from the executing entity.– intermediary entity: the entity that processes the output of the executing entity to complete
the function execution.
• Attributes: they represent the data that is processed by the PF. They refer to a set of variablescharacterizing the concerned entity, and for the same attribute, the set can vary depending onthe entity. For example, the attribute ’technical characteristics’ would include maximal chargingcapacity if the entity would be a storage device, which wouldn’t be included for a controllableload. There can be three types of attributes:
– primary attributes: they specify the basic attributes defined by entities (e.g., operationalcharacteristics to notify if the device is operational or controllable, technical characteristics todetail the maximal capacity or the control strategy of an inverter, weather forecast informationlike irradiance or temperature, etc.)
– composed attributes(): these are the result of applying a PF on primary attributes. Composedattributes are denoted by adding brackets, and the input parameters can be primary orcomposed attributes. They can be a combination of primary attributes, a calculation ora notification (e.g., report(), request(), command(), etc.).
– set of attributes(): some entities will receive primary attributes from several identicalexecuting entities, and aggregate these in a set of identical attributes with different values.This is comparable to an array 〈 〉 in object oriented programming. A set of attributes isdenoted by enclosing the input attribute type with square brackets. An example of itsfunctionality is when a set of attributes is used to notify metering values, including severalcurrent, voltage or power values in the same array.
• Time execution: it refers to the moment at which a function is executed. This can either beperiodically or at discrete moments.
– periodically: every 5 min (e.g., data acquisition), 60 min, 24 h (e.g., data retrieval by SESPfrom SCADA), monthly (e.g., billing), etc.
– discrete: on request (e.g., SESP requests customer information), event triggered (e.g., sendalarm if resource gets disconnected), executed by other PF (when PF monitor() registers andevent, PF send() will consequently be executed).
Energies 2017, 10, 1287 7 of 16
• Algorithm: it corresponds to the mathematical model that is used to calculate a certain output.The algorithm won’t be specified in this work, it will be considered as a black box with inputparameters, and returning composed attributes as output parameters.
Primary Functions
The PFs represent the basic actions that can be executed by different entities of the system.A sequence of PFs can be combined to form a SF.
The eight PFs identified are described below.
• set(executing entity, attributes, time resolution) This function represents the action of changingthe values of a certain attribute for an entity. Most of the time, an entity will execute this PF afterreceiving a command from another entity, in other words in discrete time periods, but it can alsobe done periodically through an automated system.
• get(executing entity, intermediary entity, attributes, time execution) This function is executedafter receiving a request message or periodically. It returns the values of the input parametersthat can be primary or composed attributes.
• calculate(executing entity, attributes, time execution, algorithm) This function is the basis forevery computation that has to be performed.
• aggregate(executing entity, attributes, time execution) This represents the action of puttingtogether a set of attributes. For instance, when entities send the same attributes to a centralentity, the latter will aggregate the received attributes for further data processing.
• distribute(executing entity, receiving entity, attributes, time execution) This represents the actionof decomposing a set of attributes into individual attributes. It is the opposite function of the PFaggregate, and is executed when an entity receives a set of attributes from which each individualattribute needs to be transferred to a specific receiving entity.
• store(executing entity, receiving entity, attributes, time execution) This function receives datafrom a certain entity and stores it into a database.
• monitor(executing entity, attributes, time execution) This function is giving a trigger to itsexecuting entity when values of attributes change. This change can be then used to executeother PFs.
However, as the way distribution grids are managed is changing, new SFs and HLFs can arise,leading to new functionalities and therefore to the definition of new PFs.
3.3. Entity-Relationship Model
The Entity-Relationship (ER) diagram is used to define the relationships between elements ofa certain system. In order to assess the resilience of a control system, the entire system is organizedand represented graphically in an ER model. The ER diagram identifies the interactions betweenthe system components and defines how each functionality is linked to the elements that participate inrealizing this function.
An ER model uses three elements to represent a system and its functionalities: entities, attributes,cardinality and ordinality.
• Entity: it defines a component of the system, regardless of being a physical element, an humanoperator or a digital communication line. Certain entities can be divided into more specificcategories or sub-type entities.
• Attributes: an entity is defined by attributes, representing the characteristics of the entity.Technical parameters are implemented in the ER model as attributes, but also unique identifiersand resilience indicators are implemented as attributes for each entity. The values of the attributeswill vary for each instance of a certain entity and may vary during the operation time of the system.
Energies 2017, 10, 1287 8 of 16
• Methods: they correspond to the PFs discussed previously. Methods describe the relation betweentwo entities, as they define how entities interact.
• Cardinality and ordinality: they characterize the relationships between the entities. In particular,cardinality refers to the maximum number of times an instance in one entity can be associatedwith instances in the related entity. In contrast, ordinality refers to minimum number of times aninstance in one entity can be associated with an instance in the related entity. Both are representedby a line and its endpoint.
3.4. Resilience Evaluation Framework
Once all the entities have been identified and the relationships between each of them have beenrepresented in an ER diagram, it becomes possible to quantify resilience as a function of any changeor disturbance that can affect the performance of the system. On the one hand, the system has to beresilient against discrete changes or disturbances. On the other hand, against continuous evolution ofthe system itself and its environment. Examples of discrete changes can be a cyber attack, a componentfailure or human error, while continuous changes are more related to regulatory changes, ageinginfrastructure, new economical recessions or changes of mindset of different actors.
Each of these changes or disturbances have different effects on the operation of system. Someof these effects will cause a more severe damage than others. Therefore, to analyze the resilienceit is necessary to identify the potential disturbances, their consequences and the set of attributesthat quantify the consequences of the previously identified disturbances. The literature reviewalready indicated that changes or disturbances can occur in three different dimensions: in the physicaldimension, the ICT network (digital dimension) and in the socio-economical dimension [17].
The proposed resilience evaluation framework allows to assess the system resilience on differentlevels: either in function of a certain element of the system or in function of its main functionalitiesor resilience dimension. Thus, it is possible to apply the resilience analysis on general system level,as much as on each specific component level. According to this, system resilience can be improved byeither making the control system less dependent on the element that is bringing the disturbance intothe system or by improving the resilience of the element itself.
3.4.1. Resilience of High Level Function from the Dimensions Perspective
The first resilience assessing approach looks at the requirements of each HLF using the qualityattributes of entities to define resilience indicators for each dimension of resilience: physicalinfrastructure, the socio-economic environment, and the ICT network.
Physical Dimension
The physical dimension of the system encompasses all the physical elements of the system, such asloads and generators, monitoring devices, computers, local controllers, cables and sensors, connectedmobile phones, etc. This is the most tangible dimension where disturbances and changes can be easilyanticipated: component failures, unsynchronized or delayed operation of devices, etc.
Digital Dimension
The digital dimension represents the ICT layer that is interconnecting and allows the operation ofthe physical elements of the distribution grid. It includes all the communication networks between thedifferent grid components, the automation processes of the control system, the forecasting algorithms,the databases used for storage, etc.
Socio-Economic Dimension
The socio-economic dimension is placing the purely technical system composed of a physicaland digital layer into a cultural context. The operation and performance of the control system that is
Energies 2017, 10, 1287 9 of 16
analyzed depends to a large extent on how it is being used by its operators. In addition, it depends onthe behavior of other participants (prosumers for example). Moreover, local policies and other existingtechnologies may limit the number of possibilities of the system, affecting its performance too.
In each dimension, specific resilience indicators are defined in function of the requirements thatevery component of the dimension has in order to perform the HLF. Indicators are chosen to coverall the five characteristics of resilience according to the adopted resilience definition in Section 2.As a result, one can assess which resilience dimension plays a more important role for the performanceof the assessed HLF.
When the potential disturbances are evaluated, these attributes can serve as metrics to translatethese disturbances into quantifiable consequences for the system. For example, to quantify the systemresilience against a denial of service (DoS) attack, which sends a very large amount of requests toa certain monitoring device, one can use the quality attributes of the communication link entitiesquantifying the available memory space and data flux capacity to deal with the attack.
3.4.2. Resilience of HLF in Function of Component Criticality
The second resilience assessment approach is based on an importance analysis and criticalityassessment. This approach makes use of the ER diagram to calculate the number of sequences of PFsthat are necessary to perform a certain HLF. It makes use of the cardinality to multiply the numberof PFs executed by an entity by the number of instances of that entity that are present in the system.The more a HLF is dependent on a specific entity, the more critical this entity is to the performance ofthe global system.
4. Case Study: EMPOWER H2020 Project
4.1. EMPOWER Project Description
The methodology described in Section 3 has been applied to evaluate the resilience of theICT platform of the local market it operates, which is the focus of the EMPOWER H2020 project.Entitled Local Energy Retail Markets For Prosumer Smart Grid Power Services, EMPOWER belongs to thetopic Modernising the European electricity grid: Distribution grid and retail market of the call CompetitiveLow-Carbon Energy of the HORIZON 2020 work programme 2014-2015. The project main objective isthe local energy markets development. Innovative business models are being proposed and promotedto take advantage of the flexibility of generation, load and storage units at distribution level [20] andthese models are setting the rules of the local markets operation [21]. On the other hand, an ICTplatform is being designed to manage this flexibility based on the suggested business models. The ICTplatform enables and manages the operation of the system, exchanging the signals between the SESP,brain of the system, and the field elements in order to ensure maximum welfare. The resilience ofthe whole distribution grid is strongly dependent on the resilience of the ICT platform governing itsoperation, making then essential the quantification of the ICT resilience to understand the resilience ofthe whole system.
4.2. EMPOWER Use Case Definition through SGAM Methodology
4.2.1. The Distribution Grid
The electric system analysed covers LV (Low Voltage) and MV (Medium Voltage) distributiongrid and includes prosumers installations and DER facilities. The main actors intervening areprosumers, DER’s owners, the Distribution System Operator (DSO) and the SESP. Prosumers, DERsand community neighbourhoods provide flexibility to the system and are rewarded based on SESPdecisions. To participate in the local market they need to accomplish the contracts agreed with the SESPand provide the required information of the flexible sources. According to its SGAM representation,the system domains include Prosumers and DER installations up to the Distribution Grid. The zones
Energies 2017, 10, 1287 10 of 16
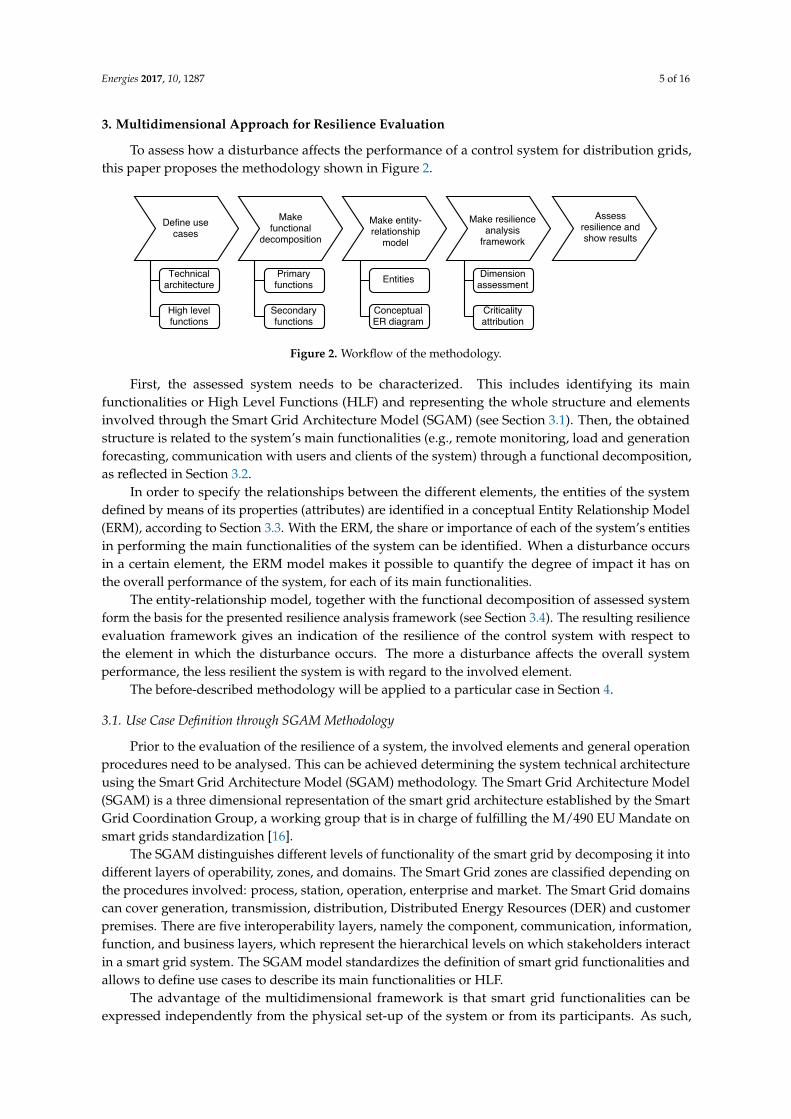
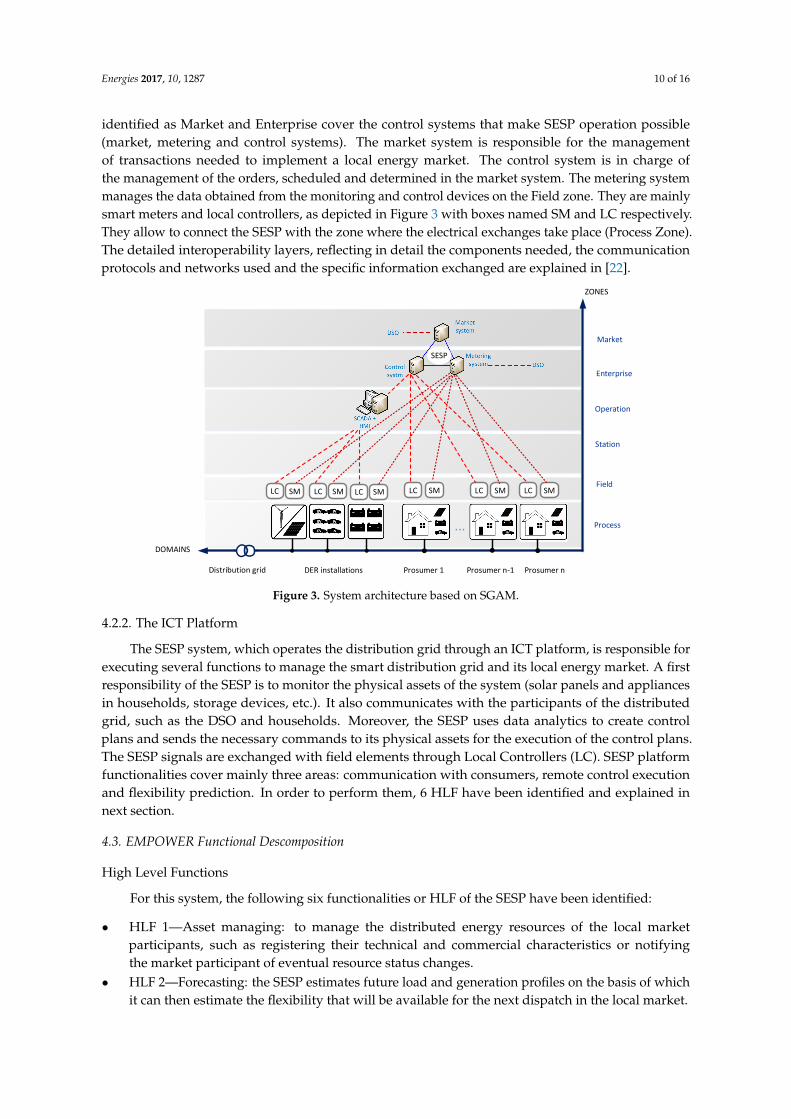
identified as Market and Enterprise cover the control systems that make SESP operation possible(market, metering and control systems). The market system is responsible for the managementof transactions needed to implement a local energy market. The control system is in charge ofthe management of the orders, scheduled and determined in the market system. The metering systemmanages the data obtained from the monitoring and control devices on the Field zone. They are mainlysmart meters and local controllers, as depicted in Figure 3 with boxes named SM and LC respectively.They allow to connect the SESP with the zone where the electrical exchanges take place (Process Zone).The detailed interoperability layers, reflecting in detail the components needed, the communicationprotocols and networks used and the specific information exchanged are explained in [22].
...
DER installations Prosumer 1 Prosumer n-1 Prosumer n
Process
Field
Station
Enterprise
Operation
Market
SMLCSMLCSMLCSMSMSM
DOMAINS
Distribution grid
ZONES
LCLCLC
SESP
Figure 3. System architecture based on SGAM.
4.2.2. The ICT Platform
The SESP system, which operates the distribution grid through an ICT platform, is responsible forexecuting several functions to manage the smart distribution grid and its local energy market. A firstresponsibility of the SESP is to monitor the physical assets of the system (solar panels and appliancesin households, storage devices, etc.). It also communicates with the participants of the distributedgrid, such as the DSO and households. Moreover, the SESP uses data analytics to create controlplans and sends the necessary commands to its physical assets for the execution of the control plans.The SESP signals are exchanged with field elements through Local Controllers (LC). SESP platformfunctionalities cover mainly three areas: communication with consumers, remote control executionand flexibility prediction. In order to perform them, 6 HLF have been identified and explained innext section.
4.3. EMPOWER Functional Descomposition
High Level Functions
For this system, the following six functionalities or HLF of the SESP have been identified:
• HLF 1—Asset managing: to manage the distributed energy resources of the local marketparticipants, such as registering their technical and commercial characteristics or notifyingthe market participant of eventual resource status changes.
• HLF 2—Forecasting: the SESP estimates future load and generation profiles on the basis of whichit can then estimate the flexibility that will be available for the next dispatch in the local market.
Energies 2017, 10, 1287 11 of 16
• HLF 3—Control plan creation: given a flexibility request from the DSO and the forecastedflexibility prediction, the SESP calculates an optimal dispatch for each participating resource.
• HLF 4—Remote control: based on the control plan created by the SESP, it sends control commandsto the LCs of each participation resource to adapt their operation (production, consumption,turning on or off, etc.).
• HLF 5—Monitoring: on field level, smart meters and other sensors are installed to periodicallymeasure the consumption and generation values of each resource. Moreover, special events, forexample when a device gets disconnected or when a customer denies to follow the instructions ofthe control commands, are also monitored by the SESP.
• HLF 6—Customer Service: this HLF encompasses everything that is related to communicationwith the customer, such as graphical overviews of their production and consumption madeavailable through smartphone or web browsers. It includes monthly billing notifications, contactfor the help desk, etc.
These HLF represent the overall functionality of the SESP, and each of them consists of a series ofsub-functions or use cases.
4.4. Primary and Secondary Functions
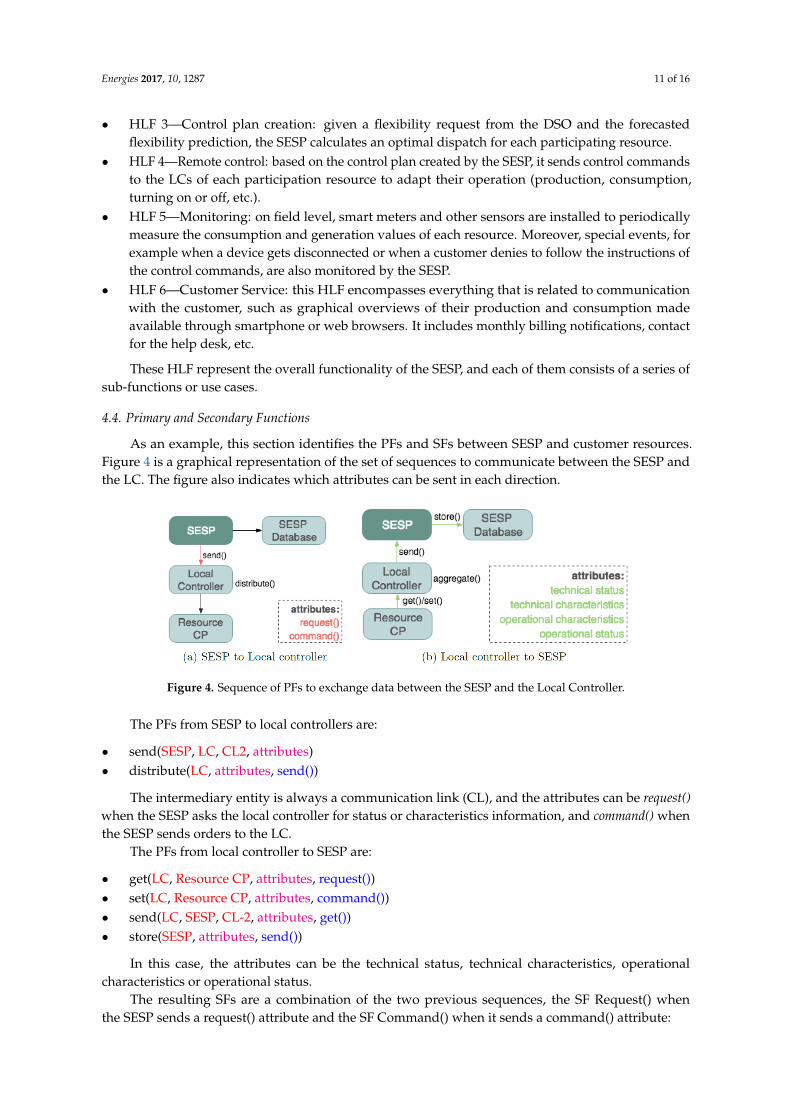
As an example, this section identifies the PFs and SFs between SESP and customer resources.Figure 4 is a graphical representation of the set of sequences to communicate between the SESP andthe LC. The figure also indicates which attributes can be sent in each direction.
Figure 4. Sequence of PFs to exchange data between the SESP and the Local Controller.
The PFs from SESP to local controllers are:
• send(SESP, LC, CL2, attributes)• distribute(LC, attributes, send())
The intermediary entity is always a communication link (CL), and the attributes can be request()when the SESP asks the local controller for status or characteristics information, and command() whenthe SESP sends orders to the LC.
The PFs from local controller to SESP are:
• get(LC, Resource CP, attributes, request())• set(LC, Resource CP, attributes, command())• send(LC, SESP, CL-2, attributes, get())• store(SESP, attributes, send())
In this case, the attributes can be the technical status, technical characteristics, operationalcharacteristics or operational status.
The resulting SFs are a combination of the two previous sequences, the SF Request() whenthe SESP sends a request() attribute and the SF Command() when it sends a command() attribute:
Energies 2017, 10, 1287 12 of 16
• Request(SESP, Local controller, attributes)• Command(SESP, Local controller, attributes)
The time execution of these SF can be both periodical or event based. However, each usedPF inside these SFs have an event-based time execution, as one PF triggers the next one to startits execution.
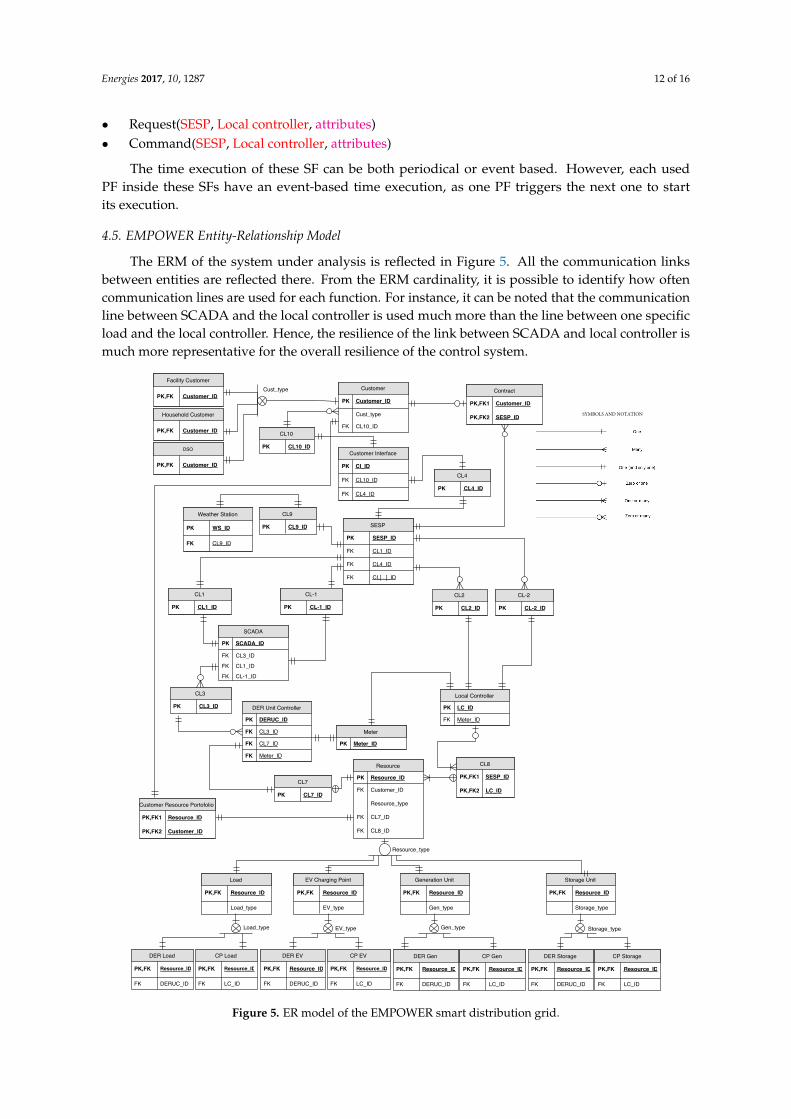
4.5. EMPOWER Entity-Relationship Model
The ERM of the system under analysis is reflected in Figure 5. All the communication linksbetween entities are reflected there. From the ERM cardinality, it is possible to identify how oftencommunication lines are used for each function. For instance, it can be noted that the communicationline between SCADA and the local controller is used much more than the line between one specificload and the local controller. Hence, the resilience of the link between SCADA and local controller ismuch more representative for the overall resilience of the control system.
SYMBOLS AND NOTATION
Figure 5. ER model of the EMPOWER smart distribution grid.
Energies 2017, 10, 1287 13 of 16
4.6. EMPOWER Resilience Evaluation Framework
As stated in Section 3.4, there are two approaches to assess the resilience of a system under theproposed methodology. The following sections give examples of these two approaches.
4.6.1. EMPOWER Resilience from the Dimensions Perspective
In order to exemplify the resilience assessment from the dimensions perspective, the HLF 5—RemoteMonitoring from the EMPOWER system is addressed.
This HLF include the following use cases or sub-functions: handle meter data, handle eventsignals, detect local overriding of control plan and the logging of all actions and events. Thesesub-functions have to ensure that metering data from different meters are reliable and sent at desiredfrequency, that this data is archived securely and that this data is also reliable and at desired frequencyreported to utility/customer.
For each resilience dimensions, it is needed to identify the requirements per each related entityand the potential disruptions prior to identify the resilience indicators.
The requirements per each related entity are:
• Physical infrastructure dimension:
– DER Unit Controller: is functional, is connected– SCADA: is functional, is connected, can interpret the transferred data– Local controller: is functional, is connected– SESP computer: is functional, can access the required data
• ICT network dimension:
– SESP Database: is functional, has free memory, is well programmed– Customer interface: is functional, is responding fast, can handle large amounts of data– Communication links: is connected, has the required speed, has the required latency, has the
required throughput
• Socio-economical dimension:
– Customer: takes the right decisions when getting event notifications, understands periodical reports
The identified potential disruptions are:
• Physical infrastructure dimension:
– anticipated: ageing infrastructure– unanticipated: natural disaster, unusual load profile of components
• ICT network dimension:
– cyber attack (denial of service, etc.)– change of used standards/protocols– addition of new standard– change of communication technology
• Socio-economical dimension:
– wrong human interpretation of data– level of collaboration of customers– unavailability of maintenance crews– regulatory limitations on information exchange
Based on the requirements per each related entity and the potential disruptions identified,the selected resilience indicators for each dimension are:
Energies 2017, 10, 1287 14 of 16
• Physical infrastructure dimension:
– Failure criticality Index. it ranks the importance of elements based on a parameter of interest.Represents the contribution to system failure of a specific component.
– Restoration criticality index: percentage of times that system restoration results fromthe restoration of this component. It assesses the impact of restoration of a specific element.
– Operation criticality index: percentage of a component’s down time over the systemdown time.
• ICT network dimension:
– Packet Delivery Ratio (PDR): number of packets successfully received over the expectednumber of packets.
– Average End-to-End Delay: average time to transmit packages from sending application toreceiving application.
– Average Packet Hop Count: average number of intermediate nodes through whichthe packets sent by a sender are routed (for example the number of meters traversed).
• Socio-economical dimension:
– Reputation score of customer: the more active a customer participates, the better is his score,the more flexible he is for the system.
– Level of transparency of agreements: if the customer knows about potential disruptionsand their influences, the risk of disturbances is shared between the SESP operator and thecustomer, making the system more resilient.
These indicators based on attributes of the system entities are used to quantify the resilienceand to determine which resilience dimension plays a more important role for the performance ofthe assessed HLF.
4.6.2. EMPOWER Resilience in Function of Component Criticality
Once again, the example of the HLF 5—Remote Monitoring can be taken as an illustration. In thisHLF, the following sequences are executed: periodically handle metering data of all resources, storemetering data in a database and report metering data to customer interface.
Assuming that N is the number of DER resources, the sequence dependencies for all N DERResources are:
• send(DER, DER unit controller, 〈P, Q, V, I〉, 1 min)• send(DER unit controller, SCADA, 〈P, Q, V, I〉, 1 min)• send(SCADA, SESP, 〈P, Q, V, I〉, 1 min)
In a similar way, if M is the number of CP resources, the sequence dependencies for all M customerpremises (CP) resources are:
• send(CP, Local controller, 〈P〉, 1 min)• send(Local controller, SESP, 〈P〉, 1 min)
In addition, to store these values in the SESP database, the following dependency is executed:
• send(SESP, SESP database, 〈Array of N attributes + Array of M attributes〉, 1 min)
Finally, for each customer (a number CDER for DER customers and CCP for household customers)the following dependency is performed when reporting to customer interface:
• send(SESP, Customer, 〈individual update of P or P, Q, V, I〉, 1 min)
Energies 2017, 10, 1287 15 of 16
Taking into account the number of each type of dependency and making use of the cardinalityand component criticality to calculate the resilience of a certain HLF use case, the results obtained forthe HLF 5—Remote Monitoring is:
Number o f PFs dependencies = 3× N + 2×M + 1× (3× N + 2×M) + CDER × N + CCP ×M (1)
5. Conclusions
This study has proposed a methodology to evaluate resilience of ICT platforms in Smartdistribution grids. As these grids are introducing new elements, actors and roles in the electricalsystem, the resilience concept has been adapted to take them into consideration. The combinationof a standardized modelling of Smart Grids (SGAM) with the Entity Relationship Model has beenproposed to determine the criticality of functions -and elements involved- essential in the operation ofthese systems.
This methodology has been developed under the EMPOWER project to assess the resilience ofa platform enabling the operation of a local energy market. A key actor identified in local energymarkets is the SESP. Taking into account that the interaction between the SESP and the elements ofthe distribution grid is enabled by ICT platforms, the assessment of their resilience is fundamental toquantify the resilience of the whole system.
This work also proposes paths for future research, such as the need for further development ofquantitative resilience indicators for the dynamic performance of the system, which is only partlyaddressed in the proposed methodology. This will help to clarify how the proposed methodologyhandles dynamic disruptions in the system.
Acknowledgments: This work has been supported by EMPOWER H2020 project, which has received fundingfrom the European Unions Horizon 2020 research and innovation programme under grant agreement No 646476.The research of Bullich has received support of the Secretaria d’Universitats i Recerca del Departament d’Economiai Coneixement de la Generalitat de Catalunya.
Author Contributions: Pau Lloret-Gallego, Mònica Aragüés-Peñalba and Lien Van Schepdael developed themethodology and wrote the manuscript. Eduard Bullich-Massagué and Pol Olivella-Rosell supported themodification and improvement of this paper. Andreas Sumper coordinated the research that led to the resultspresented in this paper. All authors contributed in structuring the study.
Conflicts of Interest: The authors declare no conflicts of interest.
References
1. Kuo, W.; Zuo, M. Optimal Reliability Modeling: Principles and Applications; Wiley: Hoboken, NJ, USA, 2003.2. Faber, I.; Lane, W.; Pak, W.; Prakel, M.; Rocha, C.; John, V.F. Micro-energy markets: The role of a consumer
preference pricing strategy on microgrid energy investment. Energy 2014, 74, 567–575.3. Lane, C.W.; Pak, W.; Prakel, M.; Rocha, C.; Faber, M.A.J.I.; Farr, J.V. Costing Consumer Preferences for a Micro
Energy Market; Technical Report; Center for Nation Reconstruction and Capacity Development: West Point,NY, USA, 2013.
4. Olivella-Rosell, P.; Viñals-Canal, G.; Sumper, A. Day-ahead micro-market design for distributed energyresources. In Proceedings of the 2016 IEEE International Energy Conference (ENERGYCON), Leuven,Belgium, 4–8 April 2016; pp. 1–6.
5. Ilieva, I. Design characteristics of a smart grid dominated local market. In Proceedings of the CIREDWorkshop 2016, Helsinki, Finland, 14–15 June 2016.
6. Barker, K.; Ramirez-Marquez, J.E.; Rocco, C.M. Resilience based network component importance measures.Reliab. Eng. Syst. Saf. 2013, 117, 89–97.
7. Roege, P.E.; Collier, Z.A.; Mancillas, J.; McDonagh, J.A.; Linkov, I. Metrics for energy resilience. Energy Policy2014, 72, 249–256.
8. Chanda, S.; Srivastava, A.K. Defining and Enabling Resiliency of Electric Distribution Systems with MultipleMicrogrids. IEEE Trans. Smart Grid 2016, 7, 2859–2868.
Energies 2017, 10, 1287 16 of 16
9. Chen, J.; Zhu, Q. A Game-Theoretic Framework for Resilient and Distributed Generation Control ofRenewable Energies in Microgrids. IEEE Trans. Smart Grid 2017, 8, 285–295.
10. Schneider, K.P.; Tuffner, F.K.; Elizondo, M.A.; Liu, C.C.; Xu, Y.; Ton, D. Evaluating the Feasibility to UseMicrogrids as a Resiliency Resource. IEEE Trans. Smart Grid 2017, 8, 687–696.
11. Sterbenz, J.P.G.; Hutchison, D.; Cetinkaya, E.K.; Jabbar, A.; Rohrer, J.P.; Scholler, M.; Smith, P. Resilience andsurvivability in communication networks: Strategies, principles, and survey of disciplines. Comput. Netw.2010, 54, 1245–1265.
12. Senda, S.; Nguyen, K.; Yamada, S. Requirements for Resilient Information and Communication Technology.In Proceedings of the 2013 Seventh International Conference on Complex, Intelligent, and Software IntensiveSystems (CISIS 13), Washington, DC, USA, 3–5 July 2013; pp. 418–423.
13. Zhu, M.; Martínez, S. On the Performance Analysis of Resilient Networked Control Systems Under ReplayAttacks. IEEE Trans. Autom. Control 2014, 59, 804–808.
14. Fuzzy Architecture Assessment for Critical Infrastructure Resilience. Procedia Comput. Sci. 2012, 12, 367–372.15. Dondossola, G.; Garrone, G.; Szanto, J.; Deconinck, G.; Loix, T.; Beitollahi, H. ICT resilience of power
control systems: experimental results from the CRUTIAL testbeds. In Proceedings of the 2009 IEEE/IFIPInternational Conference on Dependable Systems Networks, Lisbon, Portugal, 29 June–2 July 2009;pp. 554–559.
16. CEN-CENELEC-ETSI Smart Grid Coordination Group. Smart Grid Reference Architecture. 2012.Available online: http://gridscientific.com/images/Smart_Grid_Reference_Artichtecture.pdf (accessed on5 July 2017).
17. Kwasinski, A. Quantitative Model and Metrics of Electrical Grids’ Resilience Evaluated at a PowerDistribution Level. Energies 2016, 9, 93.
18. Mathaios, P.; Mancarella, P. The Grid: Stronger, Bigger, Smarter? Presenting a Conceptual Framework ofPower System Resilience. IEEE Power Energy Mag. 2015, 13, 58–66.
19. Albasrawi, M.N.; Jarus, N.; Joshi, K.A.; Sarvestani, S.S. Analysis of Reliability and Resilience for Smart Grids.In Proceedings of the 2014 IEEE 38th Annual Computer Software and Applications Conference, Vasteras,Sweden, 21–25 July 2014; pp. 529–534.
20. Ottesen, S.O.; Tomasgard, A. A stochastic model for scheduling energy flexibility in buildings. Energy 2015,88, 364–376.
21. Helms, T.; Loock, M.; Bohnsack, R. Timing-based business models for flexibility creation in the electric powersector. Energy Policy 2016, 92, 348–358.
22. Bullich-Massagué, E.; Aragüés-Peñalba, M.; Olivella-Rosell, P.; Lloret-Gallego, P.; Vidal-Close, J.A.;Sumper, A. Development of local energy markets. The EMPOWER Project. Mod. Power Syst. 2017, submitted.
c© 2017 by the authors. Licensee MDPI, Basel, Switzerland. This article is an open accessarticle distributed under the terms and conditions of the Creative Commons Attribution(CC BY) license (http://creativecommons.org/licenses/by/4.0/).