Embed Size (px)
Citation preview
Methodology for offshore renewable energy site selection using
economic decision factors M.Woznicki
Mines Paristech - PERSEE 1, rue Claude Daunesse, 06904 Sophia-Antipolis
Abstract: This paper presents a new methodology of
Multi-Criteria Analysis for offshore renewable energy site selection. Rather than using only weighting and mixing
geo-physical and non-geo-physical properties in a
subjective way, it defines costs related from those properties (distances, depth, energy and environment),
giving access to more objective and absolute suitability
values for the studied areas.
Keywords: Multi-Criteria Analysis, Site selection,
Offshore wind energy, Wave energy, Cost functions.
1. INTRODUCTION The very limited experience in offshore renewable energy
projects renders their development and exploitation
challenging topics. Today, as the purpose is to reach an attractive sale price of electricity, it is fundamental to
ensure that all aspects of the project are cost efficient.
One of the fundamental aspects of an ORE1 project is to find the most suitable sites available for its development.
Indeed, the location of the plant can have a significant
impact on the overall economic viability. In order to select the appropriate site, a technique
commonly used is the Multi-Criteria Analysis (MCA),
often based on GIS2 tools. Its purpose is to weight energy resource, technical and non-technical constraints,
geographically dependent. But, as stated in [1], early
methods of MCA use experts perception to reclassify and weight criteria, that may lead to subjective results, as they
may consider differently how a given factor impacts the
overall project feasibility. To help overcome these limitations, this document,
following recommendations of M. Silva & al [1], will
describe a site selection methodology including objective economic factors or functions, related to geographical and
geo-physical characteristics of studied areas.
This document will review the current common MCA methodologies from existing literature.
Then, cost functions related to geographical and geo-
physical parameters will be described, a methodology proposed and applied on a concrete case, using GIS
software.
The general idea being to be able to use this methodology for general assessment of sites, upon governments or
developers’ requests, ensuring, at a pre-feasibility stage,
that decision-makers are provided with an objective view of potentially viable sites and at the same time avoiding
conflicts of marine space users.
1 Offshore Renewable Energy
Finally, the results will be discussed and improvements
will be suggested.
2. STATE OF THE ART In the available literature, site selection through multi-
criteria analysis is performed in different ways, but a
common procedure is often applied to analyse suitable areas regarding competition for space. Indeed, one of the
key aspects of site selection, which should be considered
as a first step in any site selection process, is to limit conflicts with existing offshore activities or restrictions,
such as (non-exhaustive list):
- Conservation and protected areas, - Fishery areas,
- Aquaculture areas,
- Military areas, - Maritime routes or corridors,
- Other power plants,
- Oil rigs, - Cables & pipelines.
The multi-criteria analysis is then performed on the region
of interest, generally resorting to two different methodologies, based on geophysical properties and local
wind and wave climates. The most commonly used is
closer to a qualitative analysis [1]: Geophysical factors are reclassified into a common scale
si, usually from 0 to 100, 0 being the least preferable value.
The reclassification is not always linear or direct. As an example, for depth reclassification, lower depth levels will
be reclassified with a higher value.
A percentage weight wi is then assigned to the criterion depending on its overall importance. The total sum of
weights shall add up to 100%. The suitability indexes for
the considered region are then derived using a simple linear combination:
∑ 𝑤𝑖 ∙ 𝑠𝑖
𝑛
𝑖=1
Basically, the higher the value, the better is the location.
An example of this kind of analysis can be found in the ORECCA project [2] or TROPOS project [3].
This approach, however, faces limitations at every step of
the process: both reclassification and weighting of criteria are highly dependent on the sensitivity, experience and
perception of the person(s) performing the analysis. Added
to the general lack of experience in offshore plants development, this may lead to biased results, and project
stakeholders’ misinterpretation.
2 Geographical Information System
The second, more recent approach, consists in avoiding
reclassification and weighting, but rather assessing costs
related to some geophysical parameters, based on a particular farm and technology (e.g. [4], [5] and [6]).
For the UK REZ assessment [6], most of the costs
associated with the CAPEX and eventually the OPEX are assessed and applied, in order to map the LCOE over a
studied area, meaning that the energy production is
assessed too. Some costs related to locations are assessed, such as costs of transportation, costs of foundations and
costs of electrical connection, finally providing with a
quantitative assessment of suitable areas. On the other hand, the Galicia region’s study ( [4], [5]),
based on costs functions and assumptions, outputs the share on the final LCOE related to some of the sites geo-
physical characteristics (wave height, wave period, current
speed, wind climate, depth, distance from farm to shore, distance to the floating platform construction location and
distance to the components storage location).
These methodologies, rather than using reclassification and weighting, try to eliminate personal subjectivity, and
present a quantitative assessment, which may be used as a
basis for a more complete and complex analysis. A hybrid method of quantitative analysis has been
described in [1], providing a suitability index, based on
some figures of costs, weighted by the relevant geophysical specificities, as shown below:
𝐼𝑠𝑢𝑖𝑡𝑎𝑏𝑖𝑙𝑖𝑡𝑦 =
{(𝑐𝑜𝑠𝑡𝑚𝑜𝑜𝑟𝑖𝑛𝑔𝑠 + 𝑐𝑜𝑠𝑡𝑐𝑎𝑏𝑙𝑒 + 𝑐𝑜𝑠𝑡𝑖𝑛𝑠𝑡_𝑚𝑜𝑜𝑟𝑖𝑛𝑔𝑠 + 𝑐𝑜𝑠𝑡𝑖𝑛𝑠𝑡_𝑑𝑒𝑣𝑖𝑐𝑒 ) +
(𝑐𝑜𝑠𝑡𝑖𝑛𝑠𝑡_𝑐𝑎𝑏𝑙𝑒 + 𝑐𝑜𝑠𝑡𝑖𝑛𝑠𝑡_𝑎𝑛𝑐ℎ𝑜𝑟 + 𝑐𝑜𝑠𝑡𝑖𝑛𝑠𝑡_𝑓𝑜𝑢𝑛𝑑𝑎𝑡𝑖𝑜𝑛) × 𝑠𝑒𝑎𝑏𝑒𝑑_𝑚𝑜𝑑𝑖𝑓𝑖𝑒𝑟}
𝐴𝐸𝑃
- AEP being the annual energy production,
- seabed_modifier being a reclassified value of seabed
composition, related to the complexity of the installation in a given seabed substrate (sand = 1, less
complex, rock = 10, most complex).
With this method, the quantitative index Isuitability is computed, avoiding subjectivity, and applying some
weighting factors on the relevant costs. By applying this
method to several components of the project, different sites may be objectively compared through multi-criteria
analysis.
3. COST FUNCTIONS 3.1 Depth related For depths below 60 meters, station keeping systems are
likely to be used (mooring and anchoring), for both wave energy converters (such as point absorbers) and floating
offshore wind turbines.
Station keeping system - Mooring lines Mooring lines come with various types of materials, such
as synthetic fibres or steel. Only some of those will be covered, mostly because of the lack of availability of
prices. Nevertheless, candidate materials for offshore energy devices’ mooring lines will be covered, notably
chains, as described for the Hywind Scotland project [7].
The mooring line properties will be defined depending on their maximum breaking load, the chosen value being
directly related to the extreme loads expected on the
platform. Note that, at design stage, a safety factor has to
be applied, following DNV-GL recommendations [8]. Functions to derive costs and diameters are provided for a
range of maximum breaking loads (MBL) from 500kN to
12000kN, in Table 1 - Mooring lines materials costs. Properties of mooring chains can be found in the DNV
documentation [10].
The necessary length of mooring lines depends not only on
the depth but also on the mooring lines’ design: either
catenary or taut (spread or not). In order to derive the
mooring lines’ cost functions, two designs will be studied:
catenary mooring and taut (vertical) mooring, made only
of one material, even if today’s designs might combine
different materials.
The catenary design is adapted for chains and steel wire,
as their weight provides restoring force - synthetic
materials alone would not provide restoring force at
equilibrium position as most of them have a positive
buoyancy, i.e. their specific gravity is quite low.
The required length, function of depth, is assessed
considering a static inextensible cable approximation
[11]:
𝐿𝑚𝑖𝑛 = 𝑑𝑒𝑝𝑡ℎ ∙ √2∙𝑀𝐵𝐿
𝑤∙𝑑𝑒𝑝𝑡ℎ− 1 [𝑚] (1)
MBL: Maximum Breaking Load in Newton, depth the
local depth in meters, w the submerged weight of the
selected material in kg.
For the taut design, mooring lines are likely to be of the
same order of magnitude as the local depth:
𝐿𝑚𝑖𝑛 ≈ depth
Station keeping system - Anchoring system Even if the anchoring system is not directly related to the
local depth, it is directly related to the extreme loading on mooring lines and the holding capacity of the anchors must
be taken into consideration to ensure proper station
keeping of the floating platform. The anchor selection must be made depending on the local seabed slope, seabed
substrate and holding capacity (vertical and/or horizontal,
depending on the expected loading directions). Indeed, there is a large choice in anchor types, with their
own pros and cons, specific to the intended usage.
Comparisons can be found in the US Navy Salvor’s Handbook [12], chapter 3-5.
An order of magnitude of the costs is to be found in [13],
for two types of anchoring systems and described in Table 2 - Anchors cost functions.
Note: The vertical breaking load, VBL, provided in kN, can be approximated from the MBL, the depth and the
mooring line length.
Bottom Fixed (Offshore Wind) In offshore wind farms, fixed foundations and
substructures are used at depth above 60 meters.

Monopile and jacket are commonly used. The depth
related costs are found in [6] and available in Table 3 -
Foundation cost functions.
3.2 Distance related costs functions (Shore, Ports)
Cost of distance to shore – Export cable One of the most sensitive cost components related to the
distance to shore is the cost of export cables(s) installation.
Obviously, the further offshore is the site, the longer the cable(s) will be. Moreover, the cables need to be buried.
Burial operations’ costs equally depend on the seabed
substrate along the way to the shore. Because of that, the most straightforward path to shore may not be necessarily
the cheapest path. The market offers a wide variety of subsea cables, in terms
of capacity (MVA3), current type (AC/DC) and number of
cores (1 or 3). Prices are not readily available to the public but the DTOcean project [14] provides some insights and
the following cost function can be inferred for AC cables:
𝐶𝑜𝑠𝑡 = 𝑐1 + 𝑐2 ∙ 𝑒𝑐3∙𝑀𝑉𝐴 [€/𝑚] (2)
MVA: cable rated power in MVA
c1, c2 & c3: cost coefficients provided in Table 4 - Export Cables - cost functions coefficients.
Different techniques and equipment are used to bury the
cables into different types of substrate. Daily rates of specialized vessels (commonly referred to as Cable Laying
Vessels/Cable Laying Barges (CLV/CLB)), are available
in the DTOcean database, and provided in Table 5 - Cable Laying Vessels&Barges Daily Rates.
Trenching in the seabed is performed with special equipment [15], depending on the seabed composition,
before the cable laying and burial (1-2m deep).
We can approximate the time, hence the cost, of burying a meter of cable, depending on the trenching/burial speed
[15], provided in Table 6 - Trenching speeds
The type of seabed must be considered to select the appropriate trenching technique, according to [16].
Hence, by assuming the cable installation vessel works 24h
a day, with trenching and burial capabilities, we can define the total cost of a meter of export cable and its installation:
𝐶𝑜𝑠𝑡 = 𝑐1 + 𝑐2 ∙ 𝑒𝑐3∙𝑀𝑉𝐴 +𝑑𝑎𝑖𝑙𝑦𝑅𝑎𝑡𝑒
𝑖𝑛𝑠𝑡𝑎𝑙𝑙𝑆𝑝𝑒𝑒𝑑∙1440[
€
𝑚] (3)
dailyRate is the daily rate of candidate CLV/CLB,
installSpeed is the speed of trenching and burying cable in a given substrate type.
Cost of distance to suitable ports The distance of a site from suitable ports will impact
installation and O&M costs.
Vessels’ mobilization & demobilization costs may not be known, as they are strongly dependent on their location,
offer & demand on the market (SPOT market, short or long
term charter [17], [18]). Nevertheless, cost functions can
3 MVA: Mega-Volt Ampere, unit of measurement of
apparent power
be defined related to vessels capacity, speed and distance
from suitable ports to a particular location.
Indeed, installation-wise, we can assess necessary time and costs of transportation of plant devices (wind turbines
or wave energy converters) & foundations (wind turbines
floating/fixed platforms, mooring lines and anchors). The following speeds & daily rates for common
installation vessels may be used, based on DTOcean’s
database [19], provided in Table 7 - Installation vessels information.
The cost function for transportation of a particular plant
element type, back and forth, can be derived:
𝐶𝑜𝑠𝑡𝑡𝑟𝑎𝑛𝑠𝑝𝑜𝑟𝑡𝑎𝑡𝑖𝑜𝑛 = 2 ∙𝑑𝑖𝑠𝑡𝑎𝑛𝑐𝑒𝐹𝑟𝑜𝑚𝑃𝑜𝑟𝑡 ∙ 𝑑𝑎𝑖𝑙𝑦𝑅𝑎𝑡𝑒
𝑣𝑒𝑠𝑠𝑒𝑙𝑆𝑝𝑒𝑒𝑑∙24∙
𝑐𝑒𝑖𝑙𝑖𝑛𝑔 (𝑛𝑏𝐶𝑜𝑚𝑝𝑜𝑛𝑒𝑛𝑡𝑠
𝑣𝑒𝑠𝑠𝑒𝑙𝐶𝑎𝑝𝑎𝑐𝑖𝑡𝑦) [€] (4)
distanceFromPort: distance from port in km,
dailyRate: daily rate of the candidate vessel that
transports/tows the components in €/day,
vesselSpeed: candidate vessel speed in km/h,
nbComponents: total number of components of a particular
type (wind turbines, WEC, floating platform, anchors) to
be transported on site from the port,
vesselCapacity: number of components the vessel can
transport/tow in one trip.
Typically, for an offshore wind farm, the components to
be transported on site would be: the wind turbines, the
floating platforms or fixed foundation, the anchors and the
mooring lines. For a wave energy farm: wave energy
devices, and anchors and mooring lines.
4. METHODOLOGY This methodology can be applied with various GIS tools.
ESRI ArcGIS [20] was used in the present study. For that, it is necessary to define a couple of items, such
as:
- The plant power output, in order to select the appropriate number and capacity of export cables,
and obtain relevant costs for the export cable(s)
- The number of devices to be installed, in order to be able to obtain costs for installation vessels trips,
- Define vessels used to transport the plant equipment,
- If a floating technology is considered, the expected maximum loads on the platform (floating platform
for a floating wind turbine or buoy for a wave energy
converter) must be known, as it defines station keeping system design (and costs),
- The characteristic dimension of the devices, such as
rotor diameter or buoy diameter, in order to be able to assess the plant footprint, depending on the devices
spacing. Indeed, depth is not constant over the entire
area and must be averaged to estimate total costs of foundations or station keeping systems.
Geographical information of the studied region will be
necessary as well, to perform the analysis and avoid
conflicts in marine spatial planning: - Exclusion zones (subsea cables, protected areas,
shipping routes, existing offshore activities, etc.) (
[21], [22]), - Bathymetry ( [23]),
- Seabed substrates ( [24]),
- Suitable ports coordinates ( [25]), - Shorelines,
- Offshore wind and wave energy resource
information ( [26]).
The steps of the methodology are: 1. Extract the depth range of interest, appropriated to the
selected technology,
2. Compute station keeping system costs, based on bathymetry map, at any location, and use Focal
statistics [27] to average the costs over an area of the
size of the plant, 3. Perform a reclassification of the seabed from
substrates to the actual cost of purchase and burial of
a meter of cable in a particular substrate, 4. Compute the total cost of cable needed to go from
shore to any offshore location using cost distance
[28], the cost raster being the output of step 3, 5. Compute distances from suitable ports to any
offshore location, and derive transportation costs
from equation (4), 6. Compute annual energy production (AEP) of one
device of the selected technology at any offshore
location, and average the values over the farm area, using Focal statistics [27],
7. The suitability index can be derived using the
following formula, at any offshore location:
𝐼𝑛𝑑𝑒𝑥 =
[
(𝐶𝑜𝑠𝑡𝑓𝑜𝑢𝑛𝑑𝑎𝑡𝑖𝑜𝑛 ∙𝑁𝑏𝑑𝑒𝑣𝑖𝑐𝑒𝑠
+𝐶𝑜𝑠𝑡𝑡𝑟𝑎𝑛𝑠𝑝𝑜𝑟𝑡𝑎𝑡𝑖𝑜𝑛
+𝐶𝑜𝑠𝑡𝑒𝑥𝑝𝑜𝑟𝑡𝐶𝑎𝑏𝑙𝑒 ∙𝑁𝑏𝑒𝑥𝑝𝑜𝑟𝑡𝐶𝑎𝑏𝑙𝑒 )
]
𝐴𝐸𝑃∙ 𝑁𝑏𝑑𝑒𝑣𝑖𝑐𝑒𝑠 [
€
𝑀𝑊ℎ] (5)
8. To increase clarity, the previously derived index
should be normalized by its minimum value:
𝐼𝑛𝑑𝑒𝑥𝑁𝑜𝑟𝑚 =𝐼𝑛𝑑𝑒𝑥
min (𝐼𝑛𝑑𝑒𝑥) (6)
9. Exclusion zones should then be overlayed on the
index map, to provide a clear vision of the available areas in the studied region.
Note that, implicitly to its definition, the lower the value
of the suitability index, the better the location.
5. RESULTS & DISCUSSION The methodology was applied to the North Sea, considering offshore wind energy, bottom-fixed and
floating.
Bottom fixed Floating
Total Power Ouput 496 MW
Nbdevices 62
NbexportCables 4 (145 kV)
Foundation/Floating
platform
Jacket SPAR
Nbmooring - 3
Depth Range 5m-60m 60m-200m
Rotor Diameter (D) 164 m
Turbine Footprint 5D * 10D
Rated Power 8 MW
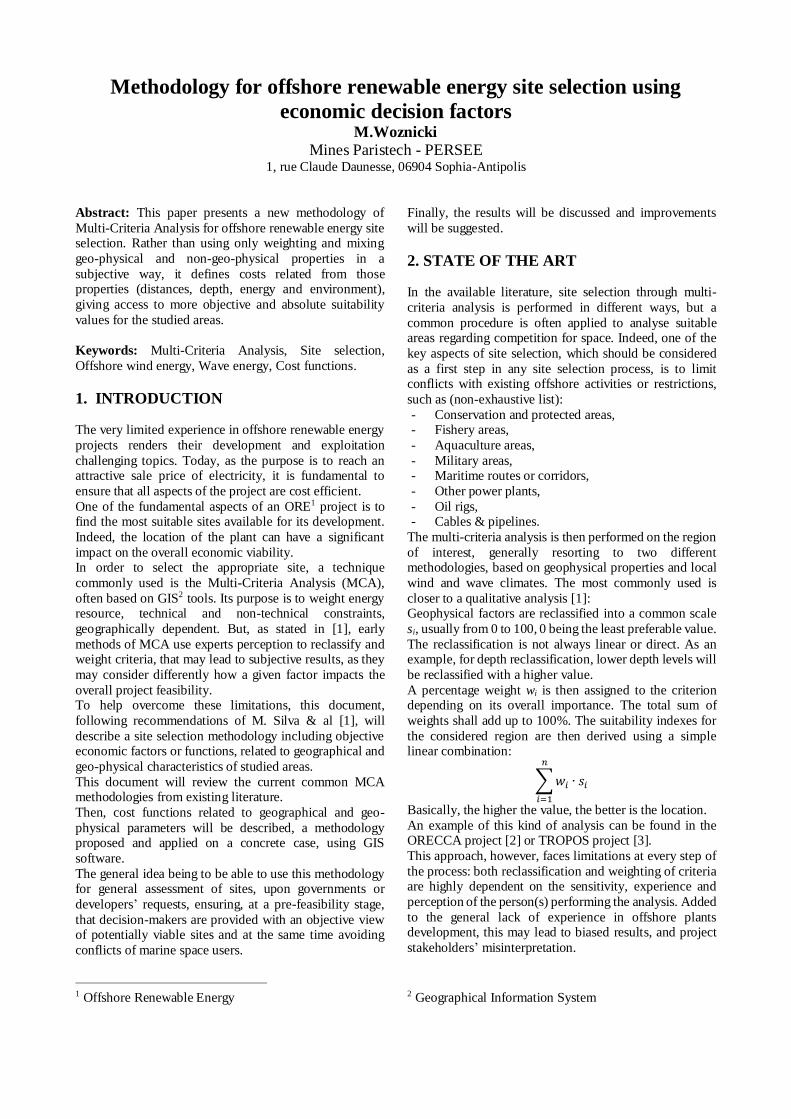
Results for the floating wind technology case and bottom
fixed case are respectively shown in Figure 1 - Suitability Map - Floating Offshore Wind and Figure 2 - Suitability
Map - Bottom Fixed Offshore Wind.
Figure 1 - Suitability Map - Floating Offshore Wind
In the case of floating wind technology, we observe a rather expected result: the further offshore, the less suitable
locations are. In that particular case, it indicates that the
increase in energy production offshore is not enough to counterweight the increase in costs. The potentially
available area seems to be less prone to spatial competition
than in depths shallower than 60m (in respect with the data of human activities or protected areas available or
considered).
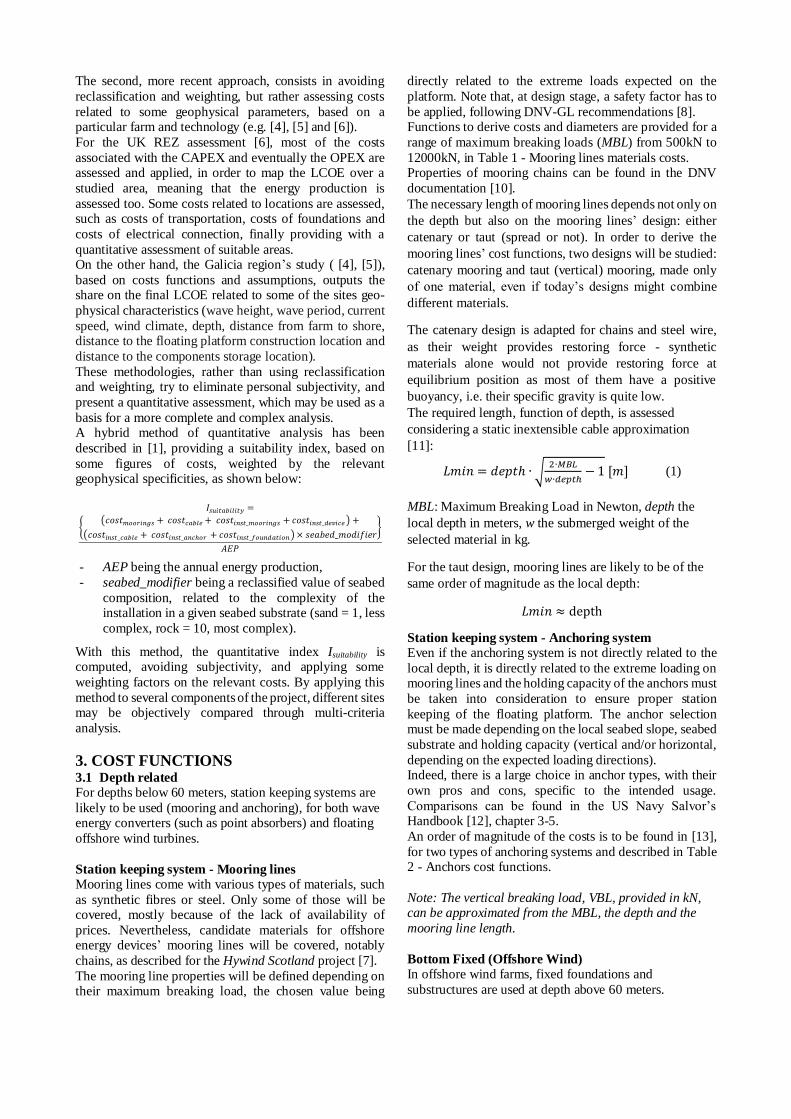
In the case of bottom fixed wind technology, results are more relevant: distinct areas of suitability level appear, that
wouldn’t have been necessarily expected. Indeed,
attractive locations are found far offshore (more than 200km from shore).
The results of this particular analysis can be compared with
characteristics of existing/in construction/planned wind farms in the region (blue circles in Fig. 2).
Indeed, most of the wind farms are located in rather
suitable areas, as identified from the application of the methodology.
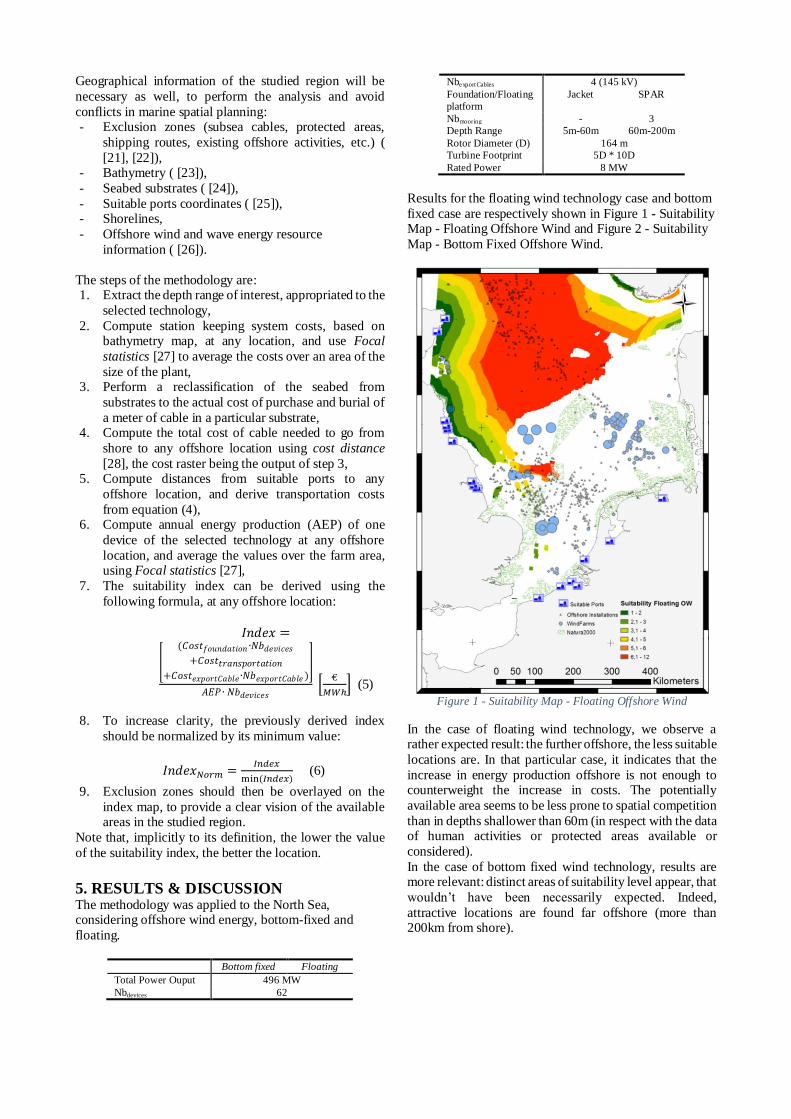
The wind farms location suitability index can be plotted as
a function of distance to shore (size of circles relative to plant power output):
Figure 3 demonstrates that going further offshore doesn’t necessarily mean a decrease in location suitability. The
four orange circles (Dogger Bank wind farms projects)
present interesting suitability indexes, which may be explained by a shallower depth and a higher available
power density.
It could be interesting to apply the normalization based on the same minimum value for both technologies to get a
better idea of locations suitability, whether the technology
is fixed or floating. This was not possible in the present
study due to the lack of available data on the specificities and costs of the floating platform.
However, applying this methodology, in regions willing to
develop bottom-fixed technology, seems relevant. And based on the previous results, locations with suitability
index ranging from 1 to 2.5 seem attractive, as proved by
the existence of wind farms installed within these areas. Note that, in this particular case, the suitability index of 1
is equivalent to 300 €/MWh. This value is a quantity
representing the computed costs related to particular geo-physical parameters over one year of energy produced by
a hypothetic farm. It shouldn’t be confused with the actual LCoE of a location.
This methodology may be applied for floating offshore
wind and wave energy site selection, at a pre-feasibility study stage, allowing to compare the suitability of different
locations in a given geographic region, and to prevent
competition for marine space. It would as well be useful to restrict the number of suitable locations to study in more
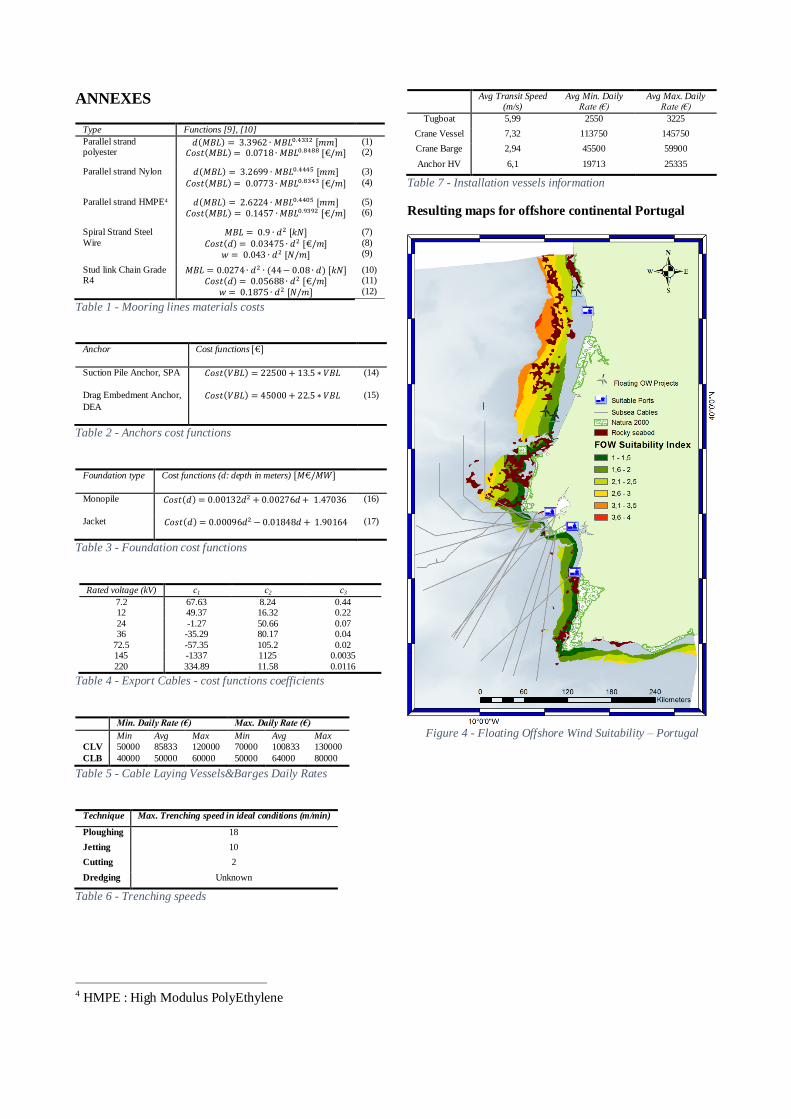
detail, such as shown for offshore continental Portugal in
annexes figures Figure 4 - Floating Offshore Wind Suitability – Portugal and Figure 5 - Wave Energy Array
Suitability - Portugal.
This methodology may be improved by adding the following components, amongst many others:
- Seabed slope in cable related costs computations,
- Vessel costs related to waiting time to get access to appropriate weather windows,
- Improved cost functions; as most of the costs
information is not publicly available, we can just rely on order of magnitude,
- Incentives in the studied region.
Moreover, as offshore wind turbines failure statistics are starting to be available, such as in [28], it may be
interesting as well to derive costs related to vessels used to
fix the failures. By associating appropriate vessels to failure types, part of the maintenance costs over time
related to the time taken to go back and forth from port to
the offshore location could be computed. They would be derived from the combination of selected vessels, speed,
daily rates, failure rates, plant size and project lifetime,
then included in the suitability index computations.
6. CONCLUSION This paper presented a methodology to perform offshore
site selection using economic decision factors. Cost functions derived from geo-physical properties such as
depth, distance to shore, distance to suitable ports and
seabed substrates have been presented. The methodology of offshore site selection based on these cost functions and
available energy has been described and implemented in a
GIS software in the North Sea region for bottom-fixed and floating offshore wind technologies. For bottom-fixed
technology, results show that the further offshore the
location is doesn’t necessarily imply a decrease in suitability. Moreover, there is a clear match between the
model and actual wind farm locations in the region.
Resulting figures and values may even be used as a
Figure 2 - Suitability Map - Bottom Fixed Offshore Wind
Figure 3
comparison basis when performing site selection in other
regions.
For floating wind and wave energy technologies, this methodology helps to compare the suitability of locations
over a wide area and provide some insights into the
relatively “best” locations without overlapping existing activities, before studying candidate locations into more
detail.
Finally, ideas of improvement have been suggested, in order to obtain a methodology with a higher level of
accuracy.
7. ACKNOWEDGEMENTS I’d like to thank, Mr Didier Mayer, responsible of the EnR
post-master at Mines Paristech, to have given me the chance of a new start in the challenging, interesting and
sustainable world of renewable energies. Furthermore, I’d
like to thank all the academic team of the EnR post-master, in Mines-Paristech and of the Instituto Superior Técnico in
Lisbon, it has been a genuine pleasure to learn from them.
And finally, thanks to WavEC Offshore Renewables team to have allowed me to make my first steps, surrounded by
many different expertise, in the offshore renewable
energies development.
REFERENCES
[1] M. Silva, J. Candido et I. Machado, «Economic
decision factors in site selection for offshore renewable energy projects,» 2016.
[2] ORECCA Project, ORECCA FP7 - Site Selection
Analysis For Offshore Combined Resource Projects in Europe, 2011.
[3] TROPOS project, TROPOS - D2.1 Report on
methodology, evaluation matrix setup, and overall design constraints.
[4] L. Castro-Santos, A. Filgueira-Vizoso, L. Carral-
Couce et J. Angel Fraguela Formoso, Economic feasibility of floating offshore wind farms, 2016.
[5] L. Castro-Santos et V. Diaz-Casas, Economic influence of location in floating offshore wind
farms, 2015.
[6] S. Cavazzi et A. Dutton, An Offshore Wind Energy Geographic Information System (OWE-GIS) for
assessment of the UK's offshore wind energy
potential, 2015.
[7] MACGREGOR, Mooring System for Hywind
Scotland, 2016.
[8] DNV-GL, DNV-OS-E301 Position Mooring, 2015.
[9] DNV-GL, DNV-OS-E302 - Offshore Mooring
Chain, 2008.
[10] P. Vicente, Mooring Line Statics (EUREC Master Course Material), 2016.
[11] U.S. Navy, US Navy Salvor's Handbook, 2000.
[12] NREL, Coupled Dynamic Modeling of Floating Wind Turbine Systems, 2006.
[13] DTOcean, Deliverable 3.4: Prediction of reliability
and economics of the offshore electrical
infrastructure with recommendations and guidelines for the environmental impacts of the
proposed array configurations, 2015.
[14] Bureau of Ocean Energy Management, Regulation and Enforcement, Offshore Electrical Cable Burial
for Offshore Wind Farms on the OCS, 2011.
[15] DTOcean, Deliverable 5.6: Report on logistical model for ocean energy and considerations, 2016.
[16] Y. Dalgic, L. I. et T. O., Vessel charter rate
estimation for offshore wind O&M activities, 2013.
[17] A. Shyshou, I. Gribkovskaia et J. Barceló, A
simulation study of the fleet sizing problem arising in offshore anchor handling operations, 2009.
[18] DTOcean, «DTOcean,» 2016. [En ligne].
Available: http://www.dtocean.eu.
[19] ESRI, «ESRI ARCGIS,» [En ligne]. Available:
https://www.arcgis.com/.
[20] Emodnet Human Activities, «Emodnet Human Activities Portal,» [En ligne]. Available:
http://www.emodnet-humanactivities.eu.
[21] Natura 2000, «Natura 2000 data - the European network of protected sites,» [En ligne]. Available:
http://www.eea.europa.eu/data-and-
maps/data/natura-7.
[22] Emodnet Bathymetry Portal, «Emodnet
Bathymetry Portal,» [En ligne]. Available:
http://portal.emodnet-bathymetry.eu.
[23] Emodnet Geology, «Emodnet Geology Portal,» [En
ligne]. Available: http://www.emodnet-
geology.eu/geonetwork/srv/eng/catalog.search#/home.
[24] National Geospatial-Intelligence Agency,
«National Geospatial-Intelligence Agency,» [En ligne]. Available:
http://msi.nga.mil/NGAPortal/MSI.portal?_nfpb=tr
ue&_pageLabel=msi_portal_page_62&pubCode=0015.
[25] SOWFIA consortium, «Sowfia Wave Watch III,»
[En ligne]. Available: http://sowfia.hidromod.com/PivotMapViewer/.
[26] ESRI, «ArcGIS - Focal Statistics,» [En ligne].
Available: http://pro.arcgis.com/en/pro-app/tool-reference/spatial-analyst/focal-statistics.htm.
[27] ESRI, «ArcGIS - Cost Distance,» [En ligne].
Available: http://pro.arcgis.com/en/pro-app/tool-reference/spatial-analyst/cost-distance.htm.
[28] M. A. M. D. Carroll J., Offshore Wind Turbine and
Sub-assembly Failure Rates through Time, 2015.
[29] DTOcean, DTOcean Deliverable 4.6 - Framework
for the prediction of the reliability, economic and
environmental criteria and assessment methodologies for Moorings and Foundations,
2015.
ANNEXES
Type Functions [9], [10]
Parallel strand polyester
𝑑(𝑀𝐵𝐿) = 3.3962 ∙ 𝑀𝐵𝐿0.4332 [𝑚𝑚] 𝐶𝑜𝑠𝑡(𝑀𝐵𝐿) = 0.0718 ∙ 𝑀𝐵𝐿0.8488 [€/𝑚]
(1) (2)
Parallel strand Nylon 𝑑(𝑀𝐵𝐿) = 3.2699 ∙ 𝑀𝐵𝐿0.4445 [𝑚𝑚] 𝐶𝑜𝑠𝑡(𝑀𝐵𝐿) = 0.0773 ∙ 𝑀𝐵𝐿0.8343 [€/𝑚]
(3)
(4)
Parallel strand HMPE4 𝑑(𝑀𝐵𝐿) = 2.6224 ∙ 𝑀𝐵𝐿0.4405 [𝑚𝑚] 𝐶𝑜𝑠𝑡(𝑀𝐵𝐿) = 0.1457 ∙ 𝑀𝐵𝐿0.9392 [€/𝑚]
(5) (6)
Spiral Strand Steel
Wire
𝑀𝐵𝐿 = 0.9 ∙ 𝑑2 [𝑘𝑁]
𝐶𝑜𝑠𝑡(𝑑) = 0.03475 ∙ 𝑑2 [€/𝑚]
𝑤 = 0.043 ∙ 𝑑2 [𝑁/𝑚]
(7)
(8) (9)
Stud link Chain Grade R4
𝑀𝐵𝐿 = 0.0274 ∙ 𝑑2 ∙ (44 − 0.08 ∙ 𝑑) [𝑘𝑁] 𝐶𝑜𝑠𝑡(𝑑) = 0.05688 ∙ 𝑑2 [€/𝑚]
𝑤 = 0.1875 ∙ 𝑑2 [𝑁/𝑚]
(10) (11)
(12)
Table 1 - Mooring lines materials costs
Anchor Cost functions [€]
Suction Pile Anchor, SPA 𝐶𝑜𝑠𝑡(𝑉𝐵𝐿) = 22500 + 13.5 ∗ 𝑉𝐵𝐿 (14)
Drag Embedment Anchor,
DEA
𝐶𝑜𝑠𝑡(𝑉𝐵𝐿) = 45000 + 22.5 ∗ 𝑉𝐵𝐿 (15)
Table 2 - Anchors cost functions
Foundation type Cost functions (d: depth in meters) [𝑀€/𝑀𝑊]
Monopile 𝐶𝑜𝑠𝑡(𝑑) = 0.00132𝑑2 + 0.00276𝑑 + 1.47036 (16)
Jacket 𝐶𝑜𝑠𝑡(𝑑) = 0.00096𝑑2 − 0.01848𝑑 + 1.90164 (17)
Table 3 - Foundation cost functions
Rated voltage (kV) c1 c2 c3
7.2 67.63 8.24 0.44 12 49.37 16.32 0.22
24 -1.27 50.66 0.07 36 -35.29 80.17 0.04
72.5 -57.35 105.2 0.02 145 -1337 1125 0.0035
220 334.89 11.58 0.0116
Table 4 - Export Cables - cost functions coefficients
Min. Daily Rate (€) Max. Daily Rate (€)
Min Avg Max Min Avg Max
CLV 50000 85833 120000 70000 100833 130000
CLB 40000 50000 60000 50000 64000 80000
Table 5 - Cable Laying Vessels&Barges Daily Rates
Technique Max. Trenching speed in ideal conditions (m/min)
Ploughing 18
Jetting 10
Cutting 2
Dredging Unknown
Table 6 - Trenching speeds
4 HMPE : High Modulus PolyEthylene
Avg Transit Speed
(m/s) Avg Min. Daily
Rate (€) Avg Max. Daily
Rate (€)
Tugboat 5,99 2550 3225
Crane Vessel 7,32 113750 145750
Crane Barge 2,94 45500 59900
Anchor HV 6,1 19713 25335
Table 7 - Installation vessels information
Resulting maps for offshore continental Portugal
Figure 4 - Floating Offshore Wind Suitability – Portugal
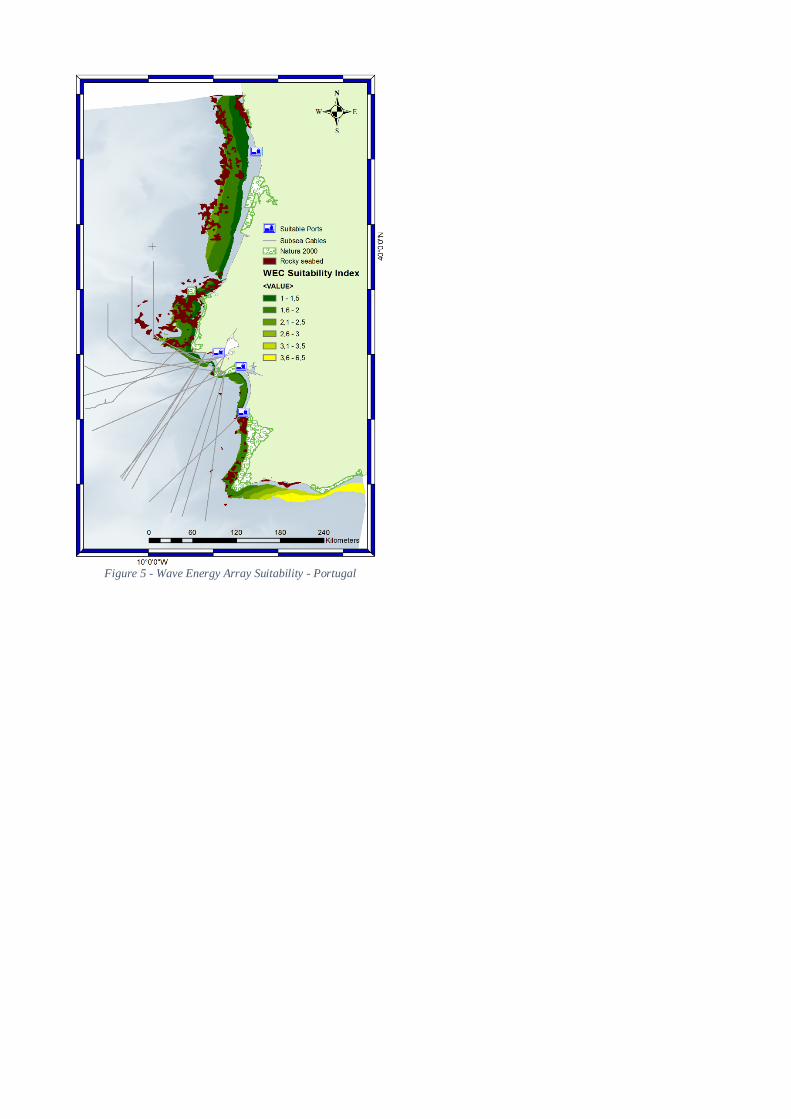
Figure 5 - Wave Energy Array Suitability - Portugal