Embed Size (px)
Citation preview

Methodology for Developing a Prioritized List of Critical and Vulnerable
Local Government Highway Infrastructure
By
Drs. Michael E. Stovall and Daniel S. Turner Department of Civil and Environmental Engineering
The University of Alabama Tuscaloosa, Alabama
For
UTCA University Transportation Center for Alabama The University of Alabama, The University of Alabama at Birmingham,
And The University of Alabama in Huntsville
Report 03114 December 31, 2004

ii
Technical Report Documentation Page
1. Report No FHWA/CA/OR-
2. Government Accession No. 3. Recipient Catalog No.
5. Report Date
4. Title and Subtitle Methodology for Developing a Prioritized List of Critical and Vulnerable Local Government Highway Infrastructure
6. Performing Organization Code
7. Authors Drs. Michael L. Stovall and Daniel S. Turner
8. Performing Organization Report No. UTCA Final Report 03114 10. Work Unit No.
9. Performing Organization Name and Address Department of Civil and Environmental Engineering The University of Alabama P O Box 870205 Tuscaloosa, Alabama 35487-0205
11. Contract or Grant No. DTSR0023424 13. Type of Report and Period Covered Final Report: January 1, 2003 - December 31, 2004
12. Sponsoring Agency Name and Address University Transportation Center for Alabama P O Box 870205 University of Alabama Tuscaloosa, AL 35487-0205
14. Sponsoring Agency Code
15. Supplementary Notes 16. Abstract This project was conducted to determine the national state-of-practice in assessing the vulnerability of local government highway infrastructure. The objective was to find an existing methodology or to create a new methodology appropriate for Alabama local governments. The most appropriate of these models was developed for state departments of transportation by the American Association of State Highway and Transportation Officials (ASASHTO). It consisted of six steps: identify critical assets, conduct a vulnerability assessment, conduct a consequence assessment, and determine countermeasures, estimate countermeasure costs, and review operational security planning. This research project adapted the AASHTO procedures by identifying portions that were difficult or seemed inappropriate for local governments, or for which local government personnel might lack sufficient knowledge or experience to implement. The modified procedures were tested in an Alabama county and city. For each case study, a two-day workshop was conducted. First a preliminary meeting was conducted to identify a local leader, to identify assessment team members, to obtain a preliminary list of critical assets, and to assemble background materials for the workshop. The first day of each workshop concentrated on applying the first three steps of the AASHTO procedure, and the second day consisted of selecting potential countermeasures for the critical assets. Both case studies were overwhelmingly successful and the participants enjoyed the experience. The case studies identified several characteristics of the methodology that were difficult for local governments to readily use. Most of these were remedied by providing additional background information to bring assessment team members to the necessary state of knowledge to use the AASHTO procedure. At the conclusion of the project, the research team documented the methodology, as supplemented and modified, and developed a plan, time frame and cost estimate to systematically apply the procedure to Alabama local governments. 17. Key Words Infrastructure security, emergency preparedness, transportation asset vulnerability
18. Distribution Statement
19. Security Class (of report) Unclassified
20. Security Class. (Of page) 21. No of Pages
22. Price

iii
Table of Contents
Contents………………………………………………………………………………......... iii Tables………………………………………………………………………………............ v Figures………………………………………………………………………………........... v Executive Summary……………………………………………………………………...... vi 1.0 Introduction……………………………………………………………………………. 1 2.0 Investigation of Methodologies………………………………………………………... 2 Introduction………………………………………………………………………...…... 2 Background………………………………………………………………...................... 2 What Do We Need to Protect………………………………………………………….. 3 Critical Assets and Recognizable Assets……………………………………………..... 4 Approach to Model Development……………………………………………………… 4 3.0 AASHTO Model for Assessment of Critical Infrastructure…………………………... 7 Introduction………………………………………………………………….…………. 7 Step 1- Identify Assets and Apply Criticality-Vulnerability Filter…………..……….... 7 Selection of Facilities for Analysis…………………………………………………. 7 Selection Of Assessment Team ………………………………………….…………. 8 Establish Critical Asset Factors……………………………………. ……………… 9 Prioritize the All-Inclusive List of Critical Assets…………………………..……… 11 Step 2- Vulnerability Assessment…………………………………………….………... 11 Vulnerabilities………………………………………………………………………. 11 Common Terrorist Tactics……………..…………………………………………… 12 Transportation Facilities as Targets………………………………………………… 12 Magnitude of the Threat……………………………………………….……………. 14 Bridge and Tunnel Vulnerability…………………………………………………… 16 Systematic Approach……………………………………………………………….. 18 Assign Vulnerability Factors to the Critical Assets……………..……….…………. 18 Score the Vulnerability Factor for Each Critical Asset…………..…….…………… 20 Step 3- Consequence Assessment…………………….………..………….…………… 21 Objective….………………..……………………………………………………….. 21 Approach..………………………………………………….……………………….. 21 Summary of Model Development…………………….……...………………………… 22 4.0 Case Studies…………………………………………………………………………… 24 Introduction……………………………………………………………….……………. 24 Shelby County Workshop………………………………………………….…………... 24 Methodology………………………………………………………………...……… 24 Phase 1 – Reference Material………………………………………………...……... 25 Phase 2 – Joint Workshop……………………………………………………...…… 26 Phase 3 – Select Workshop……………………………………………………...….. 30

iv
Contents (continued) 5.0 Discussion of Workshop Results……………………………………………………… 33 Introduction……………………………………………………………………………. 33 Common Points………………………………………………………………………... 33 Planning……………………………………………………………………………… 33 Leadership…………………………………………………………………………… 33 Assessment Team……………………………………………………………………. 34 Shelby County Workshop……………………………………………………………... 34 City of Tuscaloosa Workshop…………………………………………………………. 35 Summary of Case Study Results………………………………………………………. 35 6.0 Implementation Suggestions…………………………………………………………... 36 Introduction…………………………………………………….………………………. 36 Actions Prior to Workshop…………………………………….……………………….. 36 Obtain Commitment of Government Leadership…………………………………… 36 Initial Communications……………………………………………………………... 37 Knowledge and Experience of Assessment Team Members……………………….. 37 Planning for the Workshop……………….…………………………………………… 37 Facilitator Actions…………………………………………………………………... 37 Clarifications of Critical Asset Factor Descriptions………………………………... 37 Defensive Strategies and Designs…………………………………………………... 38 Point of Contact Actions……………………………………………………………. 38 Assessment Team…………………………………………………………………… 38 Execution of the Workshop….………………………………………………………… 39 Summary of Implementation Suggestions.…………………………………………… 40 7.0 Conclusions and Recommendations…………………………………………………... 41 Conclusions……………….……………………………………………………………. 41 Recommendations……….……………………………………………………………... 41 Summary……………….………………………………………………………………. 43 8.0 References……………………………………………………………………………... 44 9.0 Acknowledgements……………………………………………………………………. 46 10.0 Appendices …………………………………………………………………………... 47 A– Overview or Countermeasures…….………………………………………..……... 47 Introduction………………………………………………………………..……… 47 Philosophy for the Selection of Countermeasures………………………..………. 47 Integrated Protective System………………………………………….….………. 48 Design Strategies………………………………………………………..………… 49 Protective Measures…………………………………………………..…….…….. 49 Vehicle Bombs………………………………………………………..…………... 50 Overview of Countermeasures………………………………………..…………... 52 B – Shelby County Workshop….……………………………………….…………….. 53

v
List of Tables
No. Page 3-1 Suggested list of critical highway assets ……………………………………… 8 3-2 Tabular score sheet for all-inclusive list ………………………………………. 9 3-3 Critical asset factor…………………………………………………………….. 10 3-4 Common tactics used by terrorists……………………………………………... 13 3-5 WMD characteristics and effects, preparedness strategies and response actions 15 3-6 Vulnerability factor definitions………………………………………………… 18 3-7 Vulnerability factor sub-elements……………………………………………… 19 3-8 Vulnerability factor default values and definitions………………………….. 19 3-9 Vulnerability factor scoring…………………………………………………... 20 4-1 Most critical Shelby County assets……………………………………………. 27 4-2 Most vulnerable Shelby County assets………………………………………… 28 4-3 Shelby County quadrant I assets……………………………………………… 28 4-4 Summary of Shelby County first-day workshop participant survey responses... 30 4-5 Summary of Shelby County second-day workshop participant survey
responses………………………………………………………………………. 32
6-1 Typical workshop support requirements………………………………………. 38 7-1 Suggested plan for state wide infrastructure assessments……………………... 42 B1 Criticality factor and critical coordinate calculations………………………….. 54 B2 Most vulnerable assets…………………………………………………………. 55 B3 Consequence assessment values……………………………………………….. 56 B4 Suggested countermeasures for asset S1……………………………………... 57 B5 Suggested countermeasures for asset S3……………………………………... 58 B6 Suggested countermeasures for asset S7……………………………………... 59 B7 Suggested countermeasure for asset S8……………………………………..... 60
List of Figures
No. Page 2-1 AASHTO sequential steps for highway assets protection process…………….. 6 3-1 Asset narrowing analysis……………….……………………………………… 7 3-2 Assessments conducted by the assessment team………………………………. 8 3-3 Critically and vulnerability matrix……………………………………............... 22 A1 Standoff distance………………………………………………………………. 51 A2 Exclusive and nonexclusive standoff-zone……………………………………. 52 B1 Workshop evaluation form………………………………………..................... 61
vi
Executive Summary This project was conducted to determine the national state-of-practice in assessing the vulnerability of local government highway infrastructure. The objective was to find an existing methodology or to create a new methodology appropriate for Alabama local governments. No local government vulnerability methodologies were identified during the literature review, but several large scale models were documented. The most appropriate of these models was developed for state departments of transportation by the American Association of State Highway and Transportation Officials (AASHTO). It consisted of six steps:
1. Identify critical assets; 2. Conduct a criticality/vulnerability assessment; 3. Conduct a consequence assessment; 4. Determine countermeasures; 5. Estimate countermeasures cost; and 6. Review operational security planning.
This research project adapted the AASHTO procedures by identifying portions that were difficult or seemed inappropriate for local governments, or for which local government personnel might lack sufficient knowledge or experience to implement. The modified procedures were tested in an Alabama county and city. For each case study, a two-day workshop was conducted. First a preliminary meeting was conducted to identify a local leader to assemble the assessment team members (managers from police, fire, engineering, civil defense, emergency medical response, emergency management and similar agencies), to provide a preliminary list of critical assets, and to assemble background materials for the workshop (maps, infrastructure listings, emergency preparedness plans, etc.). The first day of each workshop concentrated on applying the first three steps of the AASHTO procedure to condense the preliminary list to a small pool of highest priority, critical assets. The second day of the workshop consisted of selecting potential countermeasures for the critical assets. Both case studies were overwhelmingly successful and the participants enjoyed the experience. The case studies identified several characteristics of the methodology that required modification of the procedure so that local governments could readily use it. For example, assessment team members had an excellent understanding of their local assets, but did not have a good grasp of the national picture or the susceptibility of their assets to terrorism. Other examples included critical asset factor descriptions that were not clearly understood, and insufficient vulnerability threat information. To counter these weaknesses, additional background information was provided to bring assessment team members to the necessary state of knowledge to use the AASHTO procedure. At the conclusion of the project, the research team documented the methodology, as supplemented and modified, and developed a plan, time frame, and cost estimate to systematically apply the procedure to Alabama local governments.

1
Chapter 1 Introduction
Tom Ridge, Secretary for Homeland Security, has often said, “The terrorist only has to be right once, we have to be right all the time.” These few words perfectly explain the difficulty in protecting our Nation’s infrastructure against terrorist attacks. The United States of America changed with the coordinated terrorist attacks that destroyed the World Trade Center, damaged the Pentagon, and caused the crash of an aircraft in Pennsylvania. These events made the American people suddenly fell insecure. Questions lingered in their minds about when and from where the next attacks would occur. Terrorist attacks are sudden and unexpected. Even if the government has some information on a possible attack, it will generally not know exactly where, when, or how an attack will occur. Without specific information, the most effective strategy is to plan in advance to prevent and mitigate, where possible, and to respond, when necessary, with flexibility, coordination, and speed. Given these imperatives, a research project was conducted by the University Transportation Center for Alabama (UTCA) to begin the planning process by creating, or finding and modifying, a methodology for Alabama transportation officials to use to produce a prioritized list of the most critical and most vulnerable highway infrastructure. The specific objectives of the project include:
• Determine the national state-of-practice in assessing the vulnerability and providing protection for local government highway infrastructure;
• Determine whether accepted methodologies exist for performing such assessments; • Develop a methodology appropriate for Alabama local governments, or adapt an existing
methodology so that it is appropriate for Alabama local governments; • Test the developed/modified methodology in case studies conducted with the cooperation
of Alabama local governments; • If needed, modify the methodology to enhance its use by Alabama local governments; • Develop recommendations for preparing vulnerability assessments of individual cities and
counties, and statewide; and • Document the project results in a final report.

2
Chapter 2 Investigation of Methodologies
Introduction The key step of this study on protection of highway infrastructure was a thorough literature review. This search sought to determine what had been produced on the subject and to select a methodology that could be used, or tailored for use, by state and local transportation professionals for identifying critical and vulnerable Alabama highway infrastructure. This methodology will be used to develop a prioritized list of local critical and vulnerable infrastructure projects that can then be rolled up into a state-wide prioritized list. After the methodology was developed in this research, it was pilot tested in a workshop environment with one city and one county to determine its applicability for use in the State of Alabama.
Background Prior to September 11, 2001, the majority of works published on the subject of transportation security were focused on protecting public surface transportation. The development of a much-needed knowledge base had begun at sister university transportation centers like the Mineta Transportation Institute (MTI) at San Jose State University and the Southeastern Transportation Center at the University of Tennessee. Indeed, a series of transportation security reports by MTI became some of the most read literature in the nation immediately following the tragic events of September 11, 2001. Brian Michael Jenkins (Jenkins, 2001) of MTI wrote in October of 2001, “Contemporary terrorists have made public transportation a new theater of operations.” Since 1996 Mr. Jenkins has been actively engaged in continuing research programs aimed at identifying the best practices for protecting public surface transportation against terrorist attacks and serious crimes. He frames this dilemma in the following statement (Jenkins, 1997):
Because terrorist threats are not easily quantifiable, it is difficult to determine the “right” level of security. Using cost-benefit analysis as the sole criterion to determine the level of security is inadequate. The risk of death to any individual citizen from terrorism in any venue is minuscule, making it difficult to argue for any security measure solely on the grounds that it will save lives. The problem is exacerbated by the fact that the costs of security are not determined solely by the number or capabilities of the potential attackers; they also are determined by the size and number of targets to be defended.
Coping with terrorism and protecting infrastructure from terrorist attacks are new to the American people, and in general, designers and operators do not know how to go about the process. The best source of information, before and after September 11, 2001, dealing with methods and techniques for the protection of infrastructure can be found in the Army Field

3
Manual, FM 3-19.30 Physical Security. This document has been accepted as the most authoritative in the field at this time. A majority of the work done with countermeasures in this research effort were derived from this field manual. In the aftermath of the September 11, 2001, terrorist attacks several good publications have been developed by agencies and organizations like American Association of State Highway and Transportation Officials (AASHTO), the Federal Highway Administration (FHWA), and the Intelligent Transportation Society of America (ITS America). This research effort depended heavily upon several of these documents:
• A Guide to Updating Highway Emergency Response Plans for Terrorist Incidents (USDOT and AASHTO, Response Plans, 2002);
• A Guide to Highway Vulnerability Assessment for Critical Asset Identification and Protection (USDOT/AASHTO, Vulnerability, 2002);
• National Needs Assessment for Insuring Transportation Infrastructure Security (Ham and Lockwood, 2002);
• Recommendations from Bridge and Tunnel Security (Blue Ribbon Panel, 2003); and • Homeland Security and ITS, (ITS America, 2002)
These documents were produced as general guides to cover general situations. They were not intended to cover all situations; it was expected that they would to be tailored to the specific needs of individual states. This research took the principles espoused in the above documents and tailored them for use by local governments in Alabama. This was accomplished by testing selected methodology in one city and one county in the State. Then, the results were used to develop a model for all counties and cities in the state. In the future, after all local governments have used the methodology it will be possible to establish a rank ordered priority list that can be used when identifying funding priorities among all possible protective actions within the state. The major focus of the existing literature was found to be aviation security, mass transit security, and port security, which implies these modes are higher-order terrorist targets than highways because of their high visibility and high cost facilities. GAO Testimony before Congress (GAO, 2003) supports the findings of the other literature reviewed and indicates that efforts to strengthen transportation security face several long-term institutional challenges that include (1) developing a comprehensive risk management approach; (2) ensuring funding needs are identified and prioritized and that costs are controlled; (3) establishing effective coordination among the many responsible public and private entities; (4) ensuring adequate workforce competence and staffing levels; and (5) implementing security standards for transportation facilities, workers, and security equipment. What Do We Need to Protect? The key but difficult question is “What do we need to protect?” The simple answer is that we need to protect everything. This is a perfect answer for an agency with infinite resources; however, no government body enjoys that kind of luxury. That makes it necessary to prioritize

4
assets so that the most important can be protected first. This requires a systematic method for (1) identifying the most critical assets necessary to accomplish the missions of various government agencies and (2) determining how to protect them. Critical Assets and Recognizable Assets Not all assets are equally important in their function. From a risk management point-of-view, the most critical national assets can be identified from a consequence perspective (critical assets are those major facilities which, if lost, would significantly reduce interregional mobility over an extended period and thereby damage the national economy and defense mobility). This includes major bridges, key urban interchange components, and major tunnels on the upper-level highway system that play significant roles in linking important economic activity centers, markets and production centers, urban centers and suburbs, military forts, and ports. It also includes key facilities that cross major physical boundaries such as rivers, mountain chains, estuaries, and bays. These may appropriately be classified as “critical.” Among even the most consequence-based critical assets some are more likely targets than others. This is because international terrorist organizations such as Al-Qaeda try to destroy assets that are recognizable and cherished – highly visible and well-known symbols of a nation or region. The loss of these beloved symbols could demoralize the public and prove very costly or very inconvenient. In addition, there are agency assets such as transportation management centers, the loss of which would significantly handicap emergency response functions. These types of activities are classified as critical for purposes of this research, but are often housed in unprotected commercial buildings and are also.
Approach to Model Development The initial approach of this project was to develop a new, simple process that could be learned quickly and used easily by managers of Alabama local government agencies to develop a prioritized list of their most vulnerable highway infrastructure. It was hoped that this activity would provide a sense of security to the population by showing that their local government was doing something to protect them. The desired methodology would be easy to understand, explain and apply. The intent was to base this new methodology on a concept called “area narrowing” – a process commonly used in the development of the Description of Proposed Actions and Alternatives for Environmental Impact Statements. The area narrowing process takes a list of all alternatives and subjects them to a series of criteria filters to arrive at the best options for consideration. The literature review identified several models that could be used for conducting vulnerability assessments. Polzin proposed developing security risk as a mathematical function (Polzin, 2002). In effect, he said the security risk was a product of an incident attempt times the vulnerability of the target times the damage cost of a successful breach of security. Polzin posed many relevant questions and identified some of the key elements for determining vulnerability, but offered no concrete recommendations that could be used by local governments.

5
His focus was on high level planners and academics, and is not appropriate for local government decisions. A model presented by Asad Khattak in a white paper (Khattak, 2002) suggested that the combination of two factors (a) the understanding of the risk preceptors of affected people and (b) the transportation risks “reported” by cities and law enforcement, could be used to forecast threats. The objective of this paper was to understand the transportation security problem as perceived by individuals and cities/government agencies and to suggest strategies to protect human life from intentional harm as well as avoid damage to people and property. The model espoused a behavioral model, a systems model, and a spatial analysis. This model was contingent on population surveys and a data search of reported incident data. The model did not appear to lend itself to use by local government. A third model was presented by Karthik Srinivasan (Srinivasan, 2002). It called for the development of systematic measures and methods to: (1) assess the vulnerability of existing infrastructure; (2) prevent the occurrence of disruptive attacks (where possible); (3) reduce the consequence of such attacks, if they do occur; (4) develop and organize a body of knowledge based upon security threats, impacts, and control decisions; (5) increase the awareness of security issues by experts and users of the systems; and (6) integrate security considerations as an integral part of network planning, design, and operations efforts. A regression analysis was prescribed to determine network security and vulnerability assessment problems. This model covered many of the items thought to be important by UTCA researchers, such as the need, scope, potential, and relevance of a quantitative framework for the vulnerability assessment of transportation networks. Although this model addressed the right issues, it was only the initial step in the search for a solution, not a fully developed model. The Bridge and Tunnel Blue Ribbon Panel (Panel, 2003)) recommended a methodology based on a risk assessment to determine vulnerabilities and evaluate countermeasures to deter attacks and/or mitigate damages:
R = O x V x I Eqn. 2-1
where, in the general form of the equation: R = Risk O = Occurrence, a hazard-oriented factor that changes with the nature of the hazard. V = Vulnerability, an indication of how much of the facility or population would be damaged
or destroyed based on the structural response to a particular hazard. I = Importance, a characteristic of the facility, not the hazard.
This was another good model but appeared better suited for applications at the state level, such as determining funding issues. The details for the equation components were not defined to a level where they could be easily used by local government officials. A fifth model was an AASHTO-approved methodology (USDOT and AASHTO, Vulnerability, 2002) developed for use by state departments of transportation (DOTs). The report was an excellent document that contained a simple model that was easy to understand, learn and explain.

6
It used a six step process for state DOTs to identify and protect their critical assets. In other words, the six steps listed below and on Figure 2-1 could be employed sequentially for evaluation and identification of the most critical and most vulnerable infrastructure:
1. Identify critical assets; 2. Conduct a vulnerability assessment; 3. Conduct a consequence assessment; 4. Determine countermeasures; 5. Estimate countermeasures cost; and 6. Review operational security planning.
Figure 2-1. AASHTO sequential steps for highway assets protection process This methodology met the general needs of this project, and had the full weight and acceptance of AASHTO. At this point the UTCA project staff felt that the first three steps were especially appropriate and that is was expedient to adopt (and modify as necessary to fit the specific characteristics of Alabama local governments) the general AASHTO methodology as a starting point for this project, rather than develop a new methodology. The next chapter of this report overviews the AASHTO model, and provides details on how it may be applied.
Assets CriticalityVulnerability Filter
Critical High PriorityAssets
Criticality
Vulner ability
0
X = C r i t ic a l i t y = ( x / C m a x ) * 1 0 0
Y = V u ln e r a b i l it y = ( y / 7 5 ) * 1 0 0
C r it i c a l i t y ( X )
Vu
lne
rab
ilit
y (
Y)
1 0 0
5 0
0
a n d h i g hH i g h c r i t i c a li t y
v u ln e r a b i li t y
5 0 1 0 0
H i g h c r i t i c a li t ya n d lo w
v u ln e r a b i li t y
C r i t ic a l i t y a n d V u ln e r a b i l i t y M a t r ix
Q u a d r a n t IV Q u a d r a n t I
Q u a d r a n t I I I Q u a d r a n t I I
a n d h i g hv u ln e r a b i l i ty
L o w c r i t i c a li t y
L o w c r i t i c a li t ya n d lo w
v u ln e r a b i l i ty
Consequenceassessment
Security Operations PlanCost
EstimateCountermeasures

7
Chapter 3 AASHTO Model – Assessment of Critical Infrastructure
Introduction The purpose of this research was to develop a methodology for producing a prioritized list of projects, so that the most critical and vulnerable highway infrastructure in Alabama can be protected. The project adopted the AASHTO sequential methodology (see Figure 2-1) as the means to produce this prioritized list. The first step in developing a prioritized list of projects is to compile a list of the critical highway infrastructure. Step 1 - Identify Assets and Apply Criticality-Vulnerability Filter The total number of sites that could be protected is overwhelming. To reduce this number, an “assets narrowing” process is used to identify the most critical and most vulnerable assets that need to be protected. The process shown in Figure 3-1 takes an all-inclusive list of assets through two filters to produce a list of the critical, high priority assets. The first filter (criticality) addresses the question of how critical a transportation asset is to the function and mission of the activities it supports. For example, an asset may be important because the fire department uses it to access a large gasoline storage area. Applying the first filter narrows the all-inclusive list to only the most critical assets. This list of critical assets is then filtered to reflect vulnerability to attack (this second filter will be addressed in the next section). The end result of the narrowing analysis is a list that contains the most critical, high priority assets for which countermeasures need to be developed.
Figure 3-1. Asset narrowing analysis
Selection of Facilities for Analysis The first step is to create an all-inclusive list of critical assets (for this project, the list was limited to only highway-related infrastructure assets). This list can be developed from current inventories such as the National Bridge Inventory System, hazardous materials information system, maps, geographic information systems, etc. The assets can be grouped into four general categories: infrastructure, facilities, equipment, and personnel. Table 3-1 contains a list of
Criticality-Vulnerability Filter
AssetsCritical High PriorityAssets
Criticality
Vuln erability
Criticality-Vulnerability Filter
AssetsCritical High PriorityAssets
Criticality
Vuln erability

8
suggested critical transportation assets, compiled by a survey of state departments of transportation. The list can be modified to reflect the mission and unique requirements of the local entity being evaluated. Individual assets or entire categories may be added or deleted.
Table 3-1. Suggested list of critical highway assets (SAIC, 2002) INFRASTRUCTURE FACILITIES EQUIPMENT PERSONNEL Arterial Roads Chemical Storage Areas Hazardous Materials Employees Interstate Highways Fueling Stations Roadway Monitoring Contractors Bridges Headquarters Buildings Signal & Control Systems Vendors Overpasses Maintenance Stations/Yards Variable Message Systems Visitors Barriers Material Testing Labs Vehicles Roads Upon Dams Ports of Entry Communications Systems Tunnels District/Regional Complexes Rest Areas Storm Water Pump Stations Toll Booths Traffic Operations Centers Vehicle Inspection Stations Weigh Stations
Selection of Assessment Team Once the all-inclusive list is complied, an experienced team (familiar with the highway assets in the area and their relative importance) is selected to perform the assessment. The composition of the team is very important. Members are drawn from agencies and organizations that construct and maintain highways, or that use highways for response to emergency situations. Typically this includes transportation, law enforcement, fire protection, emergency management, and civil defense agencies, and similar occupations. The transportation members of the team typically consist of operations and maintenance, design and construction, traffic, and field personnel. In addition, if some of the facilities are owned by other agencies (e.g., state highways that run through counties and cities) then personnel from those organizations should be included. Three different assessments are involved in the process, as shown by Figure 3-2. Members are added or deleted from the team so that its composition is appropriate for each assessment.
Figure 3-2. Assessments conducted by the assessment team
0
X = C r it ic a lit y = ( x /C m a x ) * 1 0 0
Y = V u ln e ra b ility = (y /7 5 ) * 1 0 0
C r it ic a lity (X )
Vu
lner
abil
ity
(Y)
100
50
0
an d h ig hH igh c r itic a lity
vu lne r ab i lity
50 1 00
H igh c r itic a litya nd low
vu lne r ab i lity
C r it ic a lity an d V u ln er ab ilit y M at rix
Q u ad ran t IV Q u ad r an t I
Q u ad ra n t III Q u ad r an t II
and h ighvu lne r ab i li ty
L ow c r itic a li ty
L ow c r itic a li tyand low
vu lne r ab i li ty
TransportationProfessionals
LikelihoodAssessment
ImpactAssessment
Critical Assessment
Threat Experts
MitigationStrategies
VulnerabilityExperts
LikelihoodAssessment
ImpactAssessment
Critical Assessment
Threat Experts
MitigationStrategies
VulnerabilityExperts
9
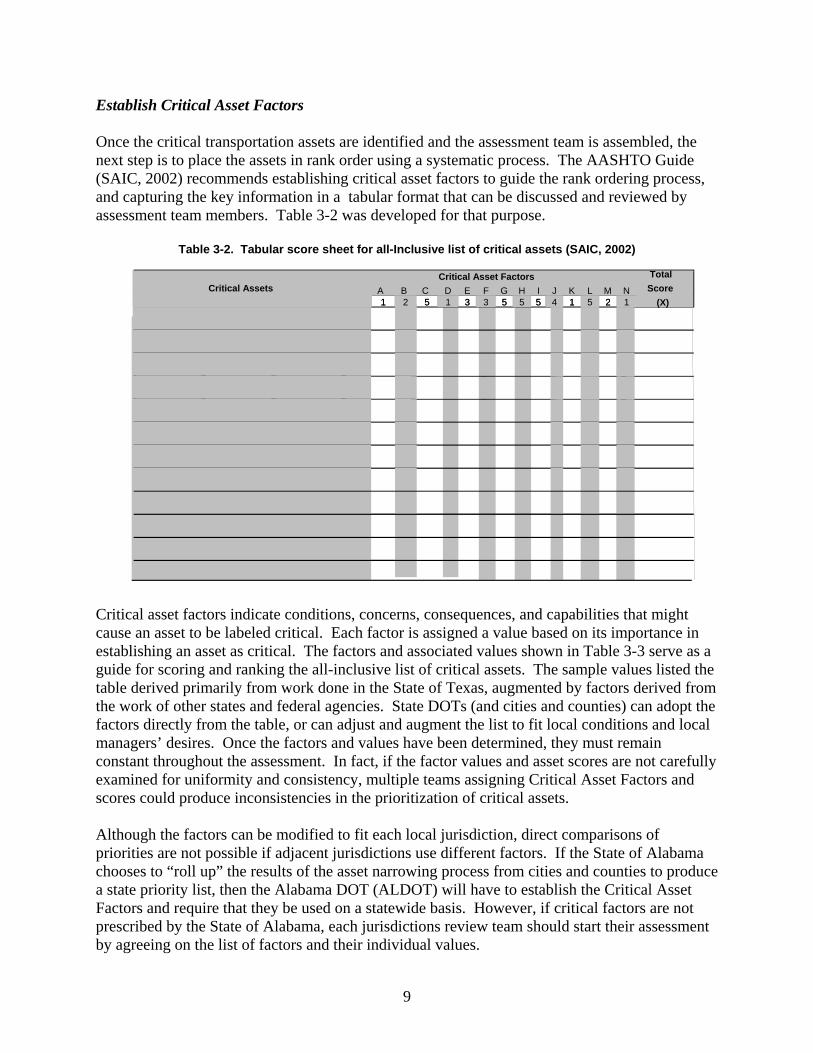
Establish Critical Asset Factors Once the critical transportation assets are identified and the assessment team is assembled, the next step is to place the assets in rank order using a systematic process. The AASHTO Guide (SAIC, 2002) recommends establishing critical asset factors to guide the rank ordering process, and capturing the key information in a tabular format that can be discussed and reviewed by assessment team members. Table 3-2 was developed for that purpose.
Table 3-2. Tabular score sheet for all-Inclusive list of critical assets (SAIC, 2002)
Critical asset factors indicate conditions, concerns, consequences, and capabilities that might cause an asset to be labeled critical. Each factor is assigned a value based on its importance in establishing an asset as critical. The factors and associated values shown in Table 3-3 serve as a guide for scoring and ranking the all-inclusive list of critical assets. The sample values listed the table derived primarily from work done in the State of Texas, augmented by factors derived from the work of other states and federal agencies. State DOTs (and cities and counties) can adopt the factors directly from the table, or can adjust and augment the list to fit local conditions and local managers’ desires. Once the factors and values have been determined, they must remain constant throughout the assessment. In fact, if the factor values and asset scores are not carefully examined for uniformity and consistency, multiple teams assigning Critical Asset Factors and scores could produce inconsistencies in the prioritization of critical assets. Although the factors can be modified to fit each local jurisdiction, direct comparisons of priorities are not possible if adjacent jurisdictions use different factors. If the State of Alabama chooses to “roll up” the results of the asset narrowing process from cities and counties to produce a state priority list, then the Alabama DOT (ALDOT) will have to establish the Critical Asset Factors and require that they be used on a statewide basis. However, if critical factors are not prescribed by the State of Alabama, each jurisdictions review team should start their assessment by agreeing on the list of factors and their individual values.
A B C D E F G H I J K L M N 1 2 5 1 3 3 5 5 5 4 1 5 2 1
Critical Asset FactorsCritical Assets
Total Score
(X) A B C D E F G H I J K L M N 1 2 5 1 3 3 5 5 5 4 1 5 2 1
Critical Asset FactorsCritical Assets
Total Score
(X)

10
Table 3-3. Critical asset factors (SAIC, 2002)
Values are assigned to factors on a scale of 5 to 1, where an extremely important factor receives a score of 5, and a minimally important factor receives a score of 1. If the critical asset factor does not apply to an asset, then it is assigned a value of “0”for that factor. The team may choose to establish two or more similar factors that distinguish between different levels. For example, a medium economic impact may receive a value of 3 and a major economic impact may receive a value of 5. Note that every asset is assessed for each factor; so adding more factors increases the number of judgments and the amount of time required. Table 3-3 lists the critical asset factors, their values, and descriptions of the factors. Note that they are grouped into four major categories: (1) deter/defend; (2) loss and damage consequences; (3) consequences to public service; and (4) consequences to the general public. A review of the critical asset factors in Table 3-3 shows that the factors rated extremely important (casualty risk, emergency response function, government continuity, military importance, available alternative, and economic impact) are most closely aligned with terrorists’ highest priorities. They cause maximum psychological, physical, and economic impact while simultaneously limiting or preventing reaction from law enforcement.

11
Prioritize the All-Inclusive List of Critical Assets Once the all-inclusive list is created and the critical asset factors are established, the next step is to assign a value to each critical asset factor. The letters A through N in Table 3-2 correspond to the critical asset factors listed in Table 3-3. For each asset, the applicable critical asset factor values are entered in the work table. When the assessment of individual assets is completed, the sum of these values (x) represents the total score for that asset. The total scores are then ordered from highest to lowest. The total score for the most critical assets are used later in the analysis, in Step 3 - Consequence Assessment. Using the values in Table 3-2, the maximum possible criticality value (Cmax) is 43. Cmax for any jurisdiction may vary based on the number of critical asset factors and the values assigned to them. The total score (x) calculated in this step will be used in calculating the criticality coordinate (X) of each asset in Step 3, as follows:
Criticality Coordinate (X) = (x / Cmax) * 100. Eqn. 3-1 At this point in the criticality assessment process, the number of assets deemed critical should be carefully examined. If too many assets remain on the list, a large amount of time and resources will be needed to complete the assessment. Because the first focus should be on the assets deemed most critical to the agency’s mission, it is often necessary to reduce the list. A logical technique for reducing the number of assets upon which to conduct further analysis may be to select the top 10 percent, or to look for a natural break in the scores. The next step in evaluating the list of critical assets produced by this exercise is to apply the second part of the asset narrowing filter, vulnerability.
Step 2 – Vulnerability Assessment The steps followed in producing the prioritized list were shown earlier in Figure 2-1. During Step 1 a “narrowed” list of the most critical assets was produced. In Step 2, the critical assets from Step 1 are subjected to a vulnerability assessment. The process uses the experienced assessment team assembled during Step 1 to accomplish the critical assets analysis.
Vulnerabilities Assessing the vulnerability of an asset requires an inherent knowledge of the threat. During the initial case study (Shelby County workshop, covered later in this report), the attendees asked for more information about the threat and the vulnerabilities that may be posed to their assets. The literature review identified a very concise resource of such information, Army Field Manual Physical Security (FM 3-19.30). It describes vulnerabilities as gaps in the protection of assets. One way to identify gaps is to consider the tactics associated with various threats and the levels of protection that are associated with those tactics. General design strategies are identified for protecting assets against specific tactics. For example, the general design strategy for protecting against forced entry is to detect attempted intrusion and to provide barriers to delay the aggressors until a response force arrives. Vulnerabilities may involve inadequacies in intrusion-

12
detection systems or in barriers. Similarly, the general design strategy for a moving vehicle bomb is to keep the vehicle as far from the facility as possible and to harden the facility to resist the explosive at that distance. Vulnerabilities may involve limited standoff distances, inadequate barriers, and building construction types that cannot resist explosive effects at the applicable standoff distance.
Common Terrorist Tactics According to FM 3-19.30 aggressors have historically used a wide range of offensive strategies, reflecting their capabilities and objectives. The offensive strategies are categorized into 15 tactics used to achieve aggressor goals, as outlined in Table 3-4. Separating these tactics into categories allows facility planners and physical security personnel to define threats in standardized terms that become the basis for facility and security system design. Individuals who must assess highway infrastructure vulnerability (and who must develop programs to harden or protect those facilities) will benefit from a brief review of these tactics. Even though the tactics are military in nature, many of them are now being used by terrorists against civilian targets, including highway infrastructure. The tactics outlined in Table 3-4are typical threats to fixed facilities for which some degree of protection may be provided by designers and physical security personnel. However, it must be understood that no matter how well a facility is protected it is impossible to guarantee complete protection. Transportation Facilities as Targets
Dr. Steven Polzin, a professor at University of South Florida, has emphasized that security of transportation systems is necessary (Polzin, 2002):
A secure transportation system is critical to overall national security from terrorism. Groups or individuals motivated to terrorize or injure people or the economy may well have transportation facilitates a target or a tool. Most assuredly, they would have a transportation element in an overall plan of terrorism. Thus, securing the transportation system is a critical consideration in overall security planning.
Dr. Polzin further indicates that terrorists are motivated to terrorize or injure people or the economy. The White House Report (White House, February 2003) echoes his statement, and stresses the close relationship between the nation’s transportation infrastructure and other segments of the economy:
Interdependencies exist between transportation and nearly every other sector of the economy. Consequently, a threat to the transportation sector may impact other industries that rely on it. Threat information affecting transportation modes must be adequately addressed through communication and coordination among multiple parties who use or rely on these systems.

13
Table 3-4. Common tactics used by terrorists (Army, FM 3-19.30)
Tactic Description
1. Moving vehicle Bomb
An aggressor drives an explosive-laden car or truck into a facility and detonates the explosives. His goal is to damage or destroy the facility or to kill people. This is a suicide attack.
2. Stationary vehicle bomb
An aggressor covertly parks an explosive-laden vehicle near a facility, and detonates the explosives either by time delay or remote control. His goal in this tactic is the same as for the moving vehicle bomb with the additional goal of destroying assets within the blast area. This is not normally a suicide attack. It is the most frequent application of vehicle bombings
3. Exterior attack An aggressor attacks a facility’s exterior or an exposed asset at close range. He uses weapons like as rocks, clubs, improvised incendiary or explosive devices, and hand grenades. Weapons (such as small arms) are not included in this tactic, but are considered in subsequent tactics. His goal is to damage the facility, to injure or kill its occupants, or to damage or destroy assets.
4. Standoff weapons
An aggressor fires military weapons or improvised versions of military weapons at a facility from a significant distance. These include direct (such as antitank weapons) and indirect line of sight weapons (such as mortars). His goal is to damage the facility, to injure or kill its occupants, or to damage or destroy assets
5. Ballistics The aggressor fires various small arms (such as pistols, submachine guns, shotguns, and rifles) from a distance. His goal is to injure or kill facility occupants or to damage or destroy assets.
6. Forced entry The aggressor enters a facility using forced entry tools (such as hand, power, and thermal tools) and explosives. He uses these tools to create a man-sized opening in the facility’s walls, doors, roof, windows, or utility openings. He may also use small arms to overpower guards. His goal is to steal or destroy assets, compromise information, injure or kill facility occupants, or disrupt operations.
7. Covert entry The aggressor attempts to enter a facility or a portion of a facility by using false credentials or stealth. He may try to carry weapons or explosives into the facility. His goals include those listed for forced entry.
8. Insider compromise
A person authorized access to a facility (an insider) attempts to compromise assets by taking advantage of that accessibility. The aggressor may also try to carry weapons or explosives into the facility in this tactic. His goals are the same as those listed for forced entry.
9. Visual surveillance
The aggressor uses ocular and photographic devices (such as binoculars and cameras with telephoto lenses) to monitor facility or installation operations or to see assets. His goal is to compromise information. As a precursor, he uses this tactic to determine information about the asset of interest.
10. Acoustic eavesdropping
The aggressor uses listening devices to monitor voice communications or other audibly transmitted information. His goal is to compromise information.
11. Electronic-emanations eavesdropping
The aggressor uses electronic-emanation surveillance equipment from outside a facility or its restricted area to monitor electronic emanations from computers, communications, and related equipment. His goal is to compromise information.
12. Mail-bomb delivery
The aggressor delivers bombs or incendiary devices to the target in letters or packages. The bomb sizes involved are relatively small. His goal is to kill or injure people.
13. Supplies-bomb delivery
The aggressor conceals bombs in various containers and delivers them to supply and material-handling points such as loading docks. The bomb sizes in this tactic can be significantly larger that those in mail bombs. His goal is to damage the facility, kill or injure its occupants, or damage or destroy assets.
14. Airborne contamination
An aggressor contaminates a facility’s air supply by introducing chemical or biological agents into it. His goal is to kill or injure people.
15. Waterborne contamination
An aggressor contaminates a facility’s water supply by introducing chemical, biological, or radiological agents into it. These agents can be introduced into the system at any location with varying effects, depending on the quantity of water and the contaminant involved. His goal is to kill or injure people
Even though transportation security is necessary, it is challenging to try to predict the details of a specific terrorist act prior to its occurrence, as evidenced from the multiple, nonspecific warnings that have been issued by the Department of Homeland Security since the 9/11 attack. The exact location, time and method of attack are at the whim of the terrorist. With the exception of the airplane attacks on September 11, 2001 and the Tokyo, Japan nerve gas attack, the favored method of attack by terrorists has been the use of explosives, like explosive vests or vehicles loaded with explosives.

14
Because of this imprecision in identifying and assessing a specific threat, it is best to take a conservative approach and consider in broad terms the types of threats to be addressed and to proceed with the vulnerability assessment accordingly.
Magnitude of the Threat To understand of the vulnerability of a particular asset, it is necessary to understand the types of effects of weapons terrorists are most likely to use. This topic is briefly outlined in the next few paragraphs. Transportation assets take on special significance in a terrorist-related context. Terrorists’ objectives are presumed to be political, economic, and social disruption via damage and destruction of physical facilities, civilian deaths and injuries, and demoralization of the public. These objectives are leveraged by the will to use weapons of mass destruction (WMD) which can, by definition, destroy large numbers of people. WMDs include high explosives, nuclear, biological, chemical, and radiological devices and other unconventional means of delivering large destructive force. The power of terrorist weapons and the capability to deliver those weapons has rapidly expanded in the last half-century. Terrorists have demonstrated improvised weapons with massive destructive capabilities. WMDs focus on the potential of highway facilities as primary targets, and as “response” targets intended to destroy first responders moving to the scene of a terrorist event. In spite of the robust and redundant nature of the highway system, the use of WMD weapons has greater potential for destroying and disrupting critical links of the highway network than lesser weapons and could substantially disrupt important economic and mobility functions. At the same time, the highway system plays a key role in emergency response to any type of major terrorism incident by supporting state and local emergency management with emergency access and evacuation capacity. Each of these dimensions relates to a key security program initiative discussed in this report. Two key dimensions of terrorist incidents distinguish them from conventional disasters with which state emergency management and state DOTs routinely cope. The first dimension involves the characteristics and effects of the weapons. Table 3-5 indicates the range of effects on people and property, highlighting some of the key consequences of several types of WMDs that might be considered threats to infrastructure. The second dimension is that terrorist WMD attacks have special characteristics that affect the nature of the preparedness strategies and response actions. These differentiate them from natural disasters. Table 3-5 suggests the key similarities and differences between, for example, a typical hurricane and a terrorist attack.

15
A basic understanding of terrorist attacks allows key assumptions to be drawn about the nature of the threat. The underlying assumptions that support the strategies described in the report include the following:
• Terrorist objectives are presumed to be political, economic and social disruption via damage and destruction of physical facilities, civilian deaths and injuries, and public demoralization through disruption resulting from responses to credible threats.
• State and local DOTs are a key support component of overall statewide and local emergency response programs. Highway systems provide a critical emergency response mechanism to off-road incidents and can be equipped to improve the efficiency of that role.
• Transportation assets, in general, have relatively low attractiveness as terrorist targets because of the modest potential for casualties. Regarding highway infrastructure, terrorism objectives are, therefore, likely to focus on destruction/damage to physical
Table 3-5. WMD characteristics and effects, preparedness strategies and response actions (Ham and Lockwood, 2002)
Weapons of Mass Destruction Possible Effects and Distinguishing Signs
Conventional explosives (e.g., detonation of military type or Commercial bombs, such as fuel oil-fertilizer, etc)
• Explosions • Casualties • Various types of localized blast damage up to structural collapse
Chemical (e.g., dispersion of pesticides, mustard gas, chlorine gas, cyanide, tear gas, etc.)
• Initial unexplained deaths and illnesses • Effects mostly localized to release site, but may be distributed
beyond release site by wind and contamination • Area my be marked by unusual clouds, hazy mist, odors, droplets,
etc.
Biological (e.g., dispersion of viruses, bacteria, toxins, fungus, etc.
• Initial unexplained deaths and illnesses, possibly beginning a day or two after the incident.
• Immediate effects mostly localized to release site, but distribution may be expanded through human transmittal
• Possible persistence in environment • Possible geographic contamination
Nuclear (nuclear detonation with radioactive fallout)
• Large scale infrastructure destruction. • Extensive radioactive fallout • Long-term persistence in environment • Geographic contamination • Radioactive poisoning of foodstuffs, water sources, and long-term
illnesses
Novel concepts (e.g., unusual delivery systems like aircraft and boats, combinations of weapons and attack modes, or unexpected targets with secondary consequences)
• Unknown
Similarities with Natural Disasters Dissimilarities with Natural Disasters • Mass casualties • Damage to infrastructure • Occurs with or without warning • Evacuation or displacement of citizens
• Caused by people on purpose • May target specific security vulnerabilities • Affected areas will be treated as crime scenes • May not be immediately recognizable as terrorist events • May not be single events • Place responders at higher risk • May result in widespread contamination of critical equipment and
facilities • May expand geometrically in scope • May cause strong public reaction

16
assets rather than on the transient use population. They also tend to focus on targets with high symbolic value.
• Certain highway structures, for example, major bridges and tunnels, play essential connecting roles and serve unique transportation and economic roles, and should therefore, be considered for protection in order to maintain their functionality.
Bridge and Tunnel Vulnerability Protective measures outlined in this report are addressed to explosive attacks across the complete range of weapon sizes, delivered as proximity attacks via mechanisms ranging from backpack to semi-trailer truck or boat. The effect of a blast on a structure depends on the following factors:
• The composition, size, and shape of the explosive material (the effect of fragments from a vehicle bomb are less damaging than cased military munitions).
• The distance of the explosive from the structure (stand-off distance). • The material composition and arrangements of the exposed structural element.
Bridges vary widely in their vulnerability depending on structure size, type, design, and setting. In general, explosives in portable quantities applied to the substructure of larger bridges are not considered a serious collapse threat – unless a terrorist demolition expert has the time to carefully place those explosives. However, truck and boat-borne explosives may cause more damage, including total collapse, depending on proximity, placement, and explosive yield. The primary destructive mechanism on structures resulting from a blast is the shockwave that strikes structural members. This is a complex phenomenon responding to the geometry and composition of the structure, the angle of the blast wave, relative distances, and other factors. The resulting overpressure expands in a shock wave that is reflected by various structural elements, creating a complex mixture of overpressures and reflected pressures – especially in confined areas – with intense and uneven impacts on the structural elements. The effects vary with structural member type and material, structure types, and size of blast. Non-linear characteristics can be created through complex interactions of blast size, shape, placement, and structural characteristics. Thus, there is large variability of expected damage by blast-structure configuration, and much research is needed to define expected damage, and appropriate mitigating designs. Even though predicting exact blast effects on bridges and tunnels is difficult, there are open-source materials discussing highway facility vulnerability other than that utilized within the Department of Defense context. For example, seismic design experience has some relevance – especially regarding connections that preserve full structural capacity. Current general assumptions about bridge vulnerability, based on judgments by the U.S. Army Corps of Engineers, FHWA, and others (Ham and Lockwood, 2002; Blue Ribbon Panel, 2003; Stovall, 2005) include the following general observations about the impact of explosives on bridges or tunnels.
• Bridges and tunnels cannot be fully protected against significant disruption to roadway decks from even modest explosive quantities.

17
• Significant damage to the substructure of smaller bridges is to be expected with even modest explosive quantities.
• Larger bridges are less vulnerable by virtue of member size, spacing, redundancy, and ductility, including cables and hangers. Total collapse of single- or multiple- span bridges is less likely, although significant elements can be destroyed.
• Hinges and anchorages are special points of vulnerability, although access can be protected.
• On larger structures, roadway decks may experience considerable local damage – but can usually be repaired in a relatively short time frame. Furthermore, decks may be considered “sacrificial” as they may provide significant protection to below-deck superstructure and substructure elements that may otherwise be breached. Cable-stayed and segmental box girder bridges are exceptions, because the deck is an integral part of the structure.
• Hollow piers and below-deck substructure, depending on size and location, are vulnerable to proximity attacks, unless they have been designed for vessel ramming lateral impacts.
• On larger suspension and cable-stayed bridges, cables, hangers, and main deck beams are relatively resistant to standoff blasts and fragments; collapse would occur only if multiple elements failed.
• Above-deck towers and hollow piers and box girders are vulnerable to proximity blasts, but protection and strengthening is presumed feasible. Bents and columns on critical structures are usually large enough and include connections capable of withstanding substantial explosive forces.
• Above-roadway deck superstructures in through-deck truss and arch bridges are vulnerable to above deck lateral forces – especially on smaller structures.
• Newer bridges with piers in navigable water may already have been designed to withstand accidental ramming and thus are resistant to explosive attacks.
• Tunnels, including immersed tubes, are relatively invulnerable to blast-induced collapse or breeching, although internal fireballs and blast pressures will cause casualties and significant damage to decks and walls.
• Low-tech and high-tech conventional explosives (e.g., shape charges) • Explosively formed penetrating devices (EFP, kinetic energy penetrators) • Low-tech, hand-held cutting devices • Truck size/barge size conventional explosives • Chemical/biological agents released in tunnel • Incendiary conventional explosives • HAZMAT release in tunnels • Intentional ramming via ship or barge
A review of the literature will provide additional details about the vulnerability of bridges and tunnels. This information is available in the public domain, to the point of providing overviews of blast effects for various sizes and types of explosives placed at various locations on bridges or in tunnels.

18
Systematic Approach Evaluation of the threat and vulnerability to critical highway infrastructure of the 15 common terrorist tactics shows that there are only three that are most likely to occur and that need to be addressed in detail. They are: (1) moving vehicle bomb, (2) stationary vehicle bomb, and (3) exterior attack. It is important that a repeatable, systematic approach be used to mitigate these vulnerabilities since the assessment of vulnerabilities is a continuing process that should be consistent from site to site and for future assessments.
Assign Vulnerability Factors to the Critical Assets A Guide to Highway Vulnerability Assessment for Critical Asset Identification and Protection (SAIC, 2002) uses the vulnerability factors shown in Table 3-6 to analyze the potential vulnerability of critical assets. The vulnerability factors are divided into three major categories: visibility and attendance, access to the asset, and site specific hazards.
Table 3-6. Vulnerability factor definitions (SAIC, 2002) The Visibility and Attendance factor considers the level of recognition of the target and the number of attendees/users that might be associated with it. If an asset is critical but has a low level of recognition or has few people associated with it, then it is probably not a high priority target. The second vulnerability factor is concerned with accessibility to the asset. How available and usable are ingress and egress to an asset? If the terrorist cannot reach an asset with a vehicle loaded with explosives, then the asset is probably not a good target. The third major vulnerability factor deals with site specific hazards. Are there large amounts of contaminates (e.g., the Chemical Demilitarization Plant in Alabama) that can be exploited by the terrorist to harm humans or the environment? If there are large amounts and they can be easily accessed, then it could be an attractive target.
Each vulnerability factor is comprised of two sub-elements. These subdivisions are created to refine the definition of vulnerability factors and to make the assessment easier for the assessment team. These sub-elements (Table 3-7) are used to calculate the vulnerability factor in the next section of this report. Values ranging from extremely important (5) to less important (1) are assigned for the sub-elements shown in the table. Table 3-8 provides typical values assigned for vulnerability factor sub-elements. In contrast to the criticality assessment in Step 1 where the choice was binary, the vulnerability assessment allows values that range from 1 to 5. Note that the scores assigned to critical assts should reflect judgments about the existence and capabilities of real or potential threats to the assets as discussed in the threat assessment sub-step.
Awareness of the existence of the asset and the number of people typically present
DEFINITION
The availability of an asset to ingress and egress by a potential threat elementThe presence of materials that have biological, nuclear, incendiary, chemical, or explosive properties in quantities that would expend initial response capabilities if compromised
VULNERABILITY FACTOR
Visibility and Attendance
Access to the Asset
Site Specific Hazards

19
Table 3-7. Vulnerability factor sub-elements (SAIC, 2002)
Table 3-8. Vulnerability factor default values and definitions (SAIC, 2002)
In Table 3-8 under Security Level (D), protected access is defined as structural and/or electronic security measures such as fencing, alarms, cameras, or locks. Controlled access is defined as entry validated by personnel such as armed or unarmed guards. Response force is defined as having personnel available to respond to either protected or controlled access violations. The vulnerability assessment is an iterative process. The application of a countermeasure may cause the vulnerability to be reduced. For example, considering Access Proximity in Table 3-8, an asset would be scored a “5” if there was open access for vehicle traffic and parking with 50 feet. If a countermeasure is installed to restrict vehicle traffic and parking within 50 feet, then that asset would be scored a “1,” reducing the vulnerability score. If this is the case, then the vulnerability assessment would be revaluated to establish a new position on the priority list.
123451234512345123451234512345 Large quantities of multiple materials present
No materials present
Asset with open access for vehicle traffic and parking within 50 feet
Asset with vehicle traffic but no vehicle parking within 50 feetAsset with vehicle traffic but no unauthorized vehicle parking with 50 feet
DEFINITIONLargely invisible in the communityVisible by the communityVisible Statewide
Acc
ess
to th
e A
sset ACCESS
PROXIMITY (C)
SECURITY LEVEL
(D)
Controlled and protected security access with a response force availableControlled and protected security access without a response forceControlled security access but not protectedProtected but not controlled security accessUnprotected and uncontrolled security access
Asset with no vehicle traffic and no parking within 50 feetAsset with no unauthorized vehicle traffic and no parking within 50 feet
Visible NationwideVisible WorldwideLess than 1010 to 100 (Major Incident per FEMA)100 to 10001000 to 3000Greater than 3000 (Catastrophic Incident per FEMA)
Site
Spe
cific
Haz
ards RECEPTOR
IMPACTS (E)
VOLUME (F)
No environmental or human receptor effectsAcute or chronic toxic effects to environmental receptor(s)Acute and chronic toxic effects to environmental receptor(s)Acute or chronic effects to human receptor(s)
Large quantities of a single material present
Small quantities of a single material present
VULNERABILITY FACTOR and DEFAULT VALUE
Small quantities of multiple material present
Acute and chronic effects to environmental and human receptor(s)
Visi
bilit
y an
d A
ttend
ance LEVEL OF
RECOGNITION (A)
ATTENDANCE/ USERS
(B)
Site Specific
Hazards
Receptor Impacts
(E) (F)
Access to the Asset
Attendance/Users
(B)
Security Level
(D)
VULNERABILITY FACTOR
FIRST SUB-ELEMENT SUB-ELEMENT
Visibility and
Attendance
Level of Recognition
(A)
Access Proximity
(C)
SECOND
Site Specific
Hazards
Receptor Impacts
(E) (F)
Access to the Asset
Attendance/Users
(B)
Security Level
(D)
VULNERABILITY FACTOR
FIRST SUB-ELEMENT SUB-ELEMENT
Visibility and
Attendance
Level of Recognition
(A)
Access Proximity
(C)
SECOND
Volume

20
Score the Vulnerability Factor for Each Critical Asset At this step, the assessment team can assess the vulnerability of each individual asset and record the results in Table 3-9. In the final sub-step, Equation 3-2 is used to calculate the vulnerability factor (y) for each critical asset. In the formula, the sub-elements are multiplied by each other for visibility and attendance (A * B), for access to the asset (C * D), and for site specific hazard (E * F). The three resulting numbers are then added.
Vulnerability Factor (y) = (A * B) + (C * D) + (E * F) Eqn. 3-2
Table 3-9. Vulnerability factor scoring According to Table 3-9, for any critical asset the lowest attainable vulnerability factor score is 3 and highest attainable score is 75. The vulnerability factor (y) is used to calculate the vulnerability coordinate (Y) in Step 3, as follows: Vulnerability Coordinate (Y) = (y/75) * 100 Eqn. 3-3
After calculating a total score for each critical asset, the scores are prioritized from highest to lowest. The list of the most critical assets has now been further refined by evaluating it with the vulnerability filter. This new product is a list of the most vulnerable assets. Step 3, Consequence Assessment, will take the results from Step 1 and Step 2 and produce a list of the highest priority projects, which are candidate sites for possible protection.
(A * B) + (C * D) + (E * F) 1-5 * 1-5 + 1-5 * 1-5 * 1-5 * 1 -5
Vulnerability FactorsCritical AssetsTotal
Score (y)
(A * B) + (C * D) + (E * F) 1-5 * 1-5 + 1-5 * 1-5 * 1-5 * 1 -5
Vulnerability FactorsCritical AssetsTotal
Score (y)
(A * B) + (C * D) + (E * F) 1-5 * 1-5 + 1-5 * 1-5 * 1-5 * 1 -5
Vulnerability FactorsCritical AssetsTotal
Score (y)

21
Step 3 – Consequence Assessment The first two assessment steps produced a prioritized list of the most critical highway assets. Step 1 assessed their criticality and produced a list of the most critical assets. Step 2 took the list from Step 1 and subjected it to another filter to produce the most vulnerable assets. Step 3, Consequence Assessment, will take the results from Steps 1 and 2 and combine them to determine the most critical and vulnerable assets for which countermeasures may need to be developed.
Objective The objective of the consequence assessment is to help identify assets which, if attacked, produce the greatest risks for undesirable outcomes given a specific set of circumstances and conditions. AASHTO recommends the following four distinctions when expressing the consequences of an attack in the terms of damage to the structure (Blue Ribbon Panel, 2003):
1. Threats to the integrity of the structure (e.g., resulting in replacement of the facility or major repairs)
2. Damage that inhibits the structure’s functionality for an extended period of time, such as closure of the facility for 30 days or more
3. Contamination of a tunnel resulting in extended closure or loss of functionality. 4. Catastrophic failure resulting from the attack
These assessments are based on an integrated analysis of the data collected on critical/key assets/activities, realistic and credible threats, and known or specifically identified vulnerabilities. Once these assessments are completed the criticality and vulnerability for each critical asset is plotted. Approach This step utilizes the same assessment team that accomplished Steps 1 and 2 the vulnerability analysis. In this activity, criticality (X) and vulnerability (Y) coordinates are calculated for each asset. The X and Y coordinates define a point for each asset in one of the four quadrants in Figure 3-3, Criticality and Vulnerability Matrix. The criticality coordinate (X) and vulnerability coordinate (Y) are calculated using Equations 3-1 and 3-2, respectively. The equations were developed during Steps 1 and 2, respectively:
Figure 3-3 displays critical assets by the greatest level of consequence based on the critical asset factors and vulnerabilities previously evaluated. Quadrant I identifies the assets with the highest criticality and vulnerability for implementing countermeasures.

22
Figure 3-3. Criticality and vulnerability matrix Assets that fall into Quadrant I are both critical to the local, state or region and judged to be vulnerable to the identified threats. The specific consequences of an attack on these assets and depends on the nature of the attack and the impacts of the loss of the asset to the state or region. Consequences can vary from (1) loss of life and property associated with the attack; (2) loss of an important part of the transportation infrastructure needed to support economic activity or military deployment; or (3) the ability to respond effectively to other emergencies (e.g., loss of an important evacuation route). A careful look at the criticality (X) and vulnerability (Y) coordinates of each asset in Quadrant I can reveal important information for the consequence assessment of the asset. The next step is countermeasure development. The assessment team should begin with assets in the upper right corner of the matrix and work toward the ordinate, using their collective experience and judgment to work through the asset list in identifying countermeasures appropriate to the potential consequences. A complete discussion of countermeasure development is beyond this project, but Appendix A provides an overview of a methodology that can be used to select appropriate countermeasures to protect selected assets. Summary of Model Development The original goal of this research was to assemble a model that Alabama local governments could use to review their highway infrastructure assets and produce a prioritized list of assets most deserving protection from terrorist attacks. During the literature review, a model developed by AASHTO was identified that closely resembled the initial design concepts. The AASHTO model had been developed for state departments of transportation, but appeared usable by Alabama local governments if it could be adapted to fit the knowledge base, types of assets, and
0
Criticality (X)
Vuln
erab
ility
(Y)
100
50
0
High criticalityand high
vulnerability
50 100
High criticalityand low
vulnerability
Quadrant IV Quadrant I
Quadrant III Quadrant II
Low criticalityand high
vulnerability
Low criticalityand low
vulnerability
0
Criticality (X)
Vuln
erab
ility
(Y)
100
50
0
High criticalityand high
vulnerability
50 100
High criticalityand low
vulnerability
Quadrant IV Quadrant I
Quadrant III Quadrant II
Low criticalityand high
vulnerability
Low criticalityand low
vulnerability

23
resources available. Although the model and its components seemed to be very appropriate, portions of it appeared to require assessment team members that were innately familiar with terrorism, the effects of specific acts of terror, and other situations not normally encountered in America. The research team identified these and other concerns and evaluated them in two pilot applications of the methodology to determine modifications and refinements necessary for wide scale application in Alabama.

24
Chapter 4 Case Studies
Introduction Two case study workshops, in Shelby County and the City of Tuscaloosa, were conducted to determine the applicability of the methodology adapted from A Guide to Highway Vulnerability Assessment for Critical Asset Identification and Protection. It was hoped that the workshops would provide a head start toward identifying the type and extent of any modifications necessary for the methodology to fit local governments in Alabama. If a common process like the one developed in this research is used by all state and local entities, then it should be possible to compile a very useful, state-wide priority list. All six of the steps in the AASHTO methodology were discussed with the participants of the workshops, but the primary focus was on the first three steps to develop a prioritized list of the most critical and vulnerable assets. These steps were the primary focus of this project because they are the most difficult and require the coordinated efforts of local government specialists from many disciplines. Step 4, Determine Countermeasures, requires specialized expertise beyond that of this project and in actual practice would normally be secured through consultants. Steps 5 and 6, Estimate Countermeasure Costs and Review Operational Security Planning, would be conducted by the managing agency once steps 1 - 4 are completed. As it turned out, the results of the two workshops were virtually identical. For that reason, only the Shelby County workshop is reviewed in this report. Complete details of both workshops are documented elsewhere (Stovall, 2005). Shelby County Workshop The Shelby County workshop was conducted October 16-17, 2003. The Assistant Shelby County Engineer was the primary point of contact for the county and his efforts were of enormous value to the success of the workshop. Methodology A workshop format was chosen as the vehicle to test the applicability of the model, so that direct feedback could be solicited from the personnel who will be expected to use the methodology in the future. The workshop was divided into three phases to minimize the time impact on county personnel. Phase 1 of the workshop was a resource/information gathering session with Mr. Grimes, which was conducted about two weeks before the scheduled workshop. Phase 2 was a Joint Workshop attended by representatives from county and municipal engineering, law enforcement officers from multiple agencies, fire protection services, public
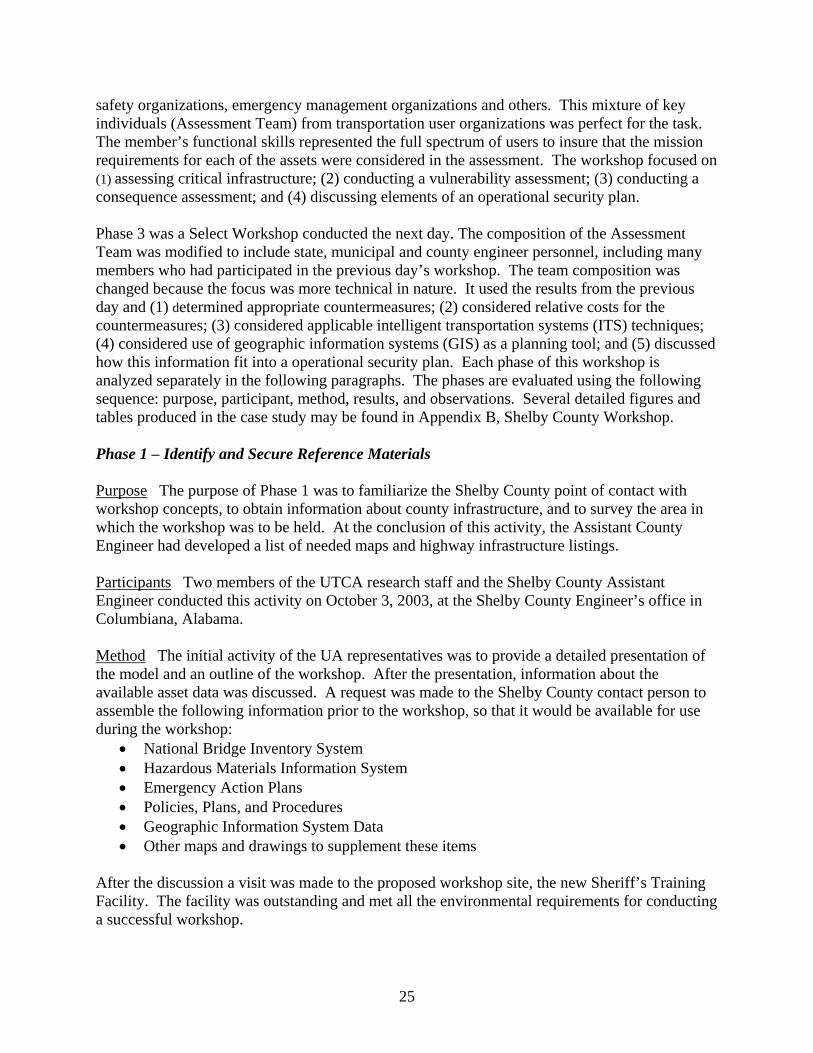
25
safety organizations, emergency management organizations and others. This mixture of key individuals (Assessment Team) from transportation user organizations was perfect for the task. The member’s functional skills represented the full spectrum of users to insure that the mission requirements for each of the assets were considered in the assessment. The workshop focused on (1) assessing critical infrastructure; (2) conducting a vulnerability assessment; (3) conducting a consequence assessment; and (4) discussing elements of an operational security plan. Phase 3 was a Select Workshop conducted the next day. The composition of the Assessment Team was modified to include state, municipal and county engineer personnel, including many members who had participated in the previous day’s workshop. The team composition was changed because the focus was more technical in nature. It used the results from the previous day and (1) determined appropriate countermeasures; (2) considered relative costs for the countermeasures; (3) considered applicable intelligent transportation systems (ITS) techniques; (4) considered use of geographic information systems (GIS) as a planning tool; and (5) discussed how this information fit into a operational security plan. Each phase of this workshop is analyzed separately in the following paragraphs. The phases are evaluated using the following sequence: purpose, participant, method, results, and observations. Several detailed figures and tables produced in the case study may be found in Appendix B, Shelby County Workshop. Phase 1 – Identify and Secure Reference Materials Purpose The purpose of Phase 1 was to familiarize the Shelby County point of contact with workshop concepts, to obtain information about county infrastructure, and to survey the area in which the workshop was to be held. At the conclusion of this activity, the Assistant County Engineer had developed a list of needed maps and highway infrastructure listings. Participants Two members of the UTCA research staff and the Shelby County Assistant Engineer conducted this activity on October 3, 2003, at the Shelby County Engineer’s office in Columbiana, Alabama.
Method The initial activity of the UA representatives was to provide a detailed presentation of the model and an outline of the workshop. After the presentation, information about the available asset data was discussed. A request was made to the Shelby County contact person to assemble the following information prior to the workshop, so that it would be available for use during the workshop:
• National Bridge Inventory System • Hazardous Materials Information System • Emergency Action Plans • Policies, Plans, and Procedures • Geographic Information System Data • Other maps and drawings to supplement these items
After the discussion a visit was made to the proposed workshop site, the new Sheriff’s Training Facility. The facility was outstanding and met all the environmental requirements for conducting a successful workshop.

26
Results The meeting was a vital and successful step in the planning and preparation for a successful workshop. It allowed exchange of information to clarify expectations prior to assembling the workshop participants. Observations The pre-meeting was a critical part of the process. It (1) allowed the host the opportunity to ask questions, (2) provided a clear understanding of the benefits to be derived from the workshop, (3) allowed discussions about the composition of the group of participants and the vital role each plays, and (4) define the responsibilities and commitment inherent to conducting the workshop. Phase 2 – Conduct Joint Workshop Purpose The purpose of the Joint Workshop was to develop a prioritized list of the most critical and vulnerable highway assets, and to discuss the integration of the new information (developed in the workshop) into Shelby County’s emergency response plans. The following steps were accomplished: (1) Step 1 - Assessment of Critical Infrastructure; (2) Step 2 - Vulnerability Assessment; (3) Step 3 - Consequence Assessment; and (4) Review Operational Security Planning. Participants The Phase 2 – joint workshop had 22 participants representing state, county and municipal transportation departments, Shelby Count Emergency Operations Center (EOC), police departments, the sheriff’s office, and fire departments.
Method Steps 1 through 3 of the AASHTO process were used to identify most critical and vulnerable assets.
Result The participants were divided into four teams, with representatives from each of the functional areas represented on each team. The teams began with the all-inclusive list (41 assets) that was produced as a result of Phase 1. That list is not included in this report because of the sensitive nature of the information it contains. For illustration purposes the asset names were replaces with code (S1, S2, etc.). Participants were asked if there were other items that should be included in the list, and 10 additional items were identified. At this point the team members were uncertain of the process and tended to be concerned about protecting everything, which is a normal and understandable situation. To relieve this concern, the all-inclusive list and others assets suggested for inclusion were discussed. All of the suggested additions were good candidates for protection, but were not highway infrastructure and were therefore, not given further consideration in this workshop. Using the techniques in Step 1, the list was prioritized based on critical asset factors. The criticality coordinates(X) were calculated using Equation 3-1. The teams then decided to reduce the number of assets from 51 to 19 (Table 4-1) based on the critical asset factors scores. After reviewing all of the scores, the team decided to make the cut off 8.75 for the critical asset factors score.

27
Table 4-1. Most critical Shelby County assets
group 1 group 2 group 3 group 4 Average XCritical Assets X=x/43*100
S1 35 31 30 31 31.75 74
S2 36 22 31 24 28.25 66
S3 27 27 31 27 28 65
S4 32 27 22 23 26 60
S5 21 22 30 21 23.5 55
S6 21 22 30 21 23.5 55
S7 30 22 25 16 23.25 54
S8 27 22 21 21 22.75 53
S9 15 22 23 24 21 49
S10 20 16 20 21 19.25 45
S11 9 16 25 21 17.75 41
S12 6 11 18 26 15.25 35
S13 11 15 17 9 13 30
S14 16 8 17 8 12.25 28
S15 10 15 8 13 11.5 27
S16 10 15 14 1 10 23
S17 5 15 6 13 9.75 23
S18 9 11 17 1 9.5 22
S19 11 11 9 4 8.75 20 In Step 2, the team took the list of most critical assets and completed the vulnerability assessment. The vulnerability scores (y) were calculated, and the Vulnerability Coordinate (Y) was calculated using Equation 3-3. Table 4-2 contains the results of the vulnerability assessment and the calculation of vulnerability coordinates Y. Using the criticality coordinates and vulnerability coordinates in Table 4-2, the values were plotted in a consequence matrix to determine the most critical and most vulnerable assets. As a result, the Shelby County analysis that started with an all-inclusive list of 51 assets plus 10 additional suggestions concluded with only four assets falling into Quadrant I (most critical and most vulnerable). The concerns of assessment team members to protect everything had been removed because they had learned to set priorities by working through the entire process and making the crucial decisions themselves. The four high priority assets that they identified for protection can be found in Table 4-3.

28
Table 4-2. Most vulnerable Shelby County assets
(A * B) + (C * D) + (E * F)1-5 * 1-5 + 1-5 * 1-5 * 1-5 * 1-5
1 1 29.75
1 29
2.5 5 5
5 12 5
1 1 30
1 30
2 5 5
5 12 5S16
S17
S18
S19
2
2
1.5
1.5
Critical AssetsTotal Score
(y)
S1 2.5 3 40.25
S2
S3
S4
S5
S6
S7
S8
S9
S10
S11
S12
S13
S14
S15
Vulnerbility Factors
2.5 5 5 3
1.5 2 5 5 1 1.5 29.5
3.5 2.5 5 5 3 3 42.75
2 2.5 4.5 4.5 4 4 41.25
1 1 3.5 4 2.5 2 20
1 1 3.5 4 1.5 2 18
2.5 2 3.5 3.5 3 3 26.25
2 2 5 5 3 3 38
1.5 2 5 3 1 1 19
2 1.5 5 5 1.5 2 31
2 2 5 5 3 3 38
3 1.5 5 5 2.5 3.5 38.25
1.5 1.5 5 5 2 2 31.25
2 1.5 5 5 1 1 29
2 2 5 5 1 1 30
54
39
57
55
27
24
35
51
25
41
51
51
Y=y/75*100
40
39
40
42
39
40
40
Table 4-3. Shelby County quadrant I assets
I
A ss e t X Y
I
5 7
5 5
7 4S 1
S 3
Q u a d
6 5
6 0
5 4 I
I
5 3 5 1
S 4
S 8

29
Observations The following observations were offered by the participants during the course of the first day’s exercise. They are important, because they gave clues about how to improve the application of the methodology for local governments:
• The workshop facilitator must make sure there are sufficient maps clearly showing the location of each asset. Some of the assets in this workshop were known by different names to different participants, which caused confusion.
• Not all team members were comfortable with a binary choice when scoring criticality
factors in Step 1. Some of the participants had a problem with making yes or no as the only answer to some of the criticality factor descriptions.
• In general, team members were not comfortable that they understood the threat scenarios
that must be defended. The information provided about the threat was too general for use in a specific environment.
The assessment team was highly motivated and enthusiastic about completing the first three steps of the analysis. The participant survey (see Appendix B) provided the following comments, and a summary of survey responses is provided in Table 4-4:
• There should have appropriate worksheets for each participant. • There is a need for better or more defined explanations of the questions used to rate the
categories. • More time is needed, and a numbered listing of each asset to associate with the map. • Although time was limited, give a better understanding of the vulnerabilities and how to
best mitigate them at the beginning of the class. Basically, this could be done by using other examples as a comparison.
• Everything was explained and covered very well. • Additional participant resources are needed – better maps, pictures, descriptions, wider
range of facilities. • Maybe allow more time for discussion. It was a very interesting and beneficial
workshop. After watching the participants become engaged in the process, learning from it, and taking ownership of the methodology and results, it is easy to interpret these remarks. The participants “got what they came for,” a procedure to address the threat to infrastructure from terrorists. They wanted more time and more experience because they liked what they had done, and they felt that they had produced useful results to help their county. For the research staff members, this was exactly the desired results – the methodology worked well, but feedback had been obtained to refine it.

30
Table 4-4. Summary of Shelby County first-day workshop participant survey responses
Survey Questions
Strongly Agree Agree N/A Disagree Strongly
DisagreeDid you feel this workshop satisfactorily defined
critical highway infrastructure? 6 7
Did you feel this workshop satisfactorily explained how to determine Vulnerability of critical highway
infrastructure?5 8
Did you feel this workshop satisfactorily explained how to determine the consequence caused by
threats to vulnerable assets?3 9 1
Did you feel this workshop satisfactorily give you an understanding of how to prioritize work to provide
security to highway infrastructure?6 5 2
Do you feel this workshop satisfactorily explained how to reduce vulnerabilities and mitigate
consequences by means of counter measures?1 5 7
Do you feel this workshop satisfactorily explained the information essential for the development of
operations security plans to mitigate the consequences?
1 5 7
Response
Phase 3 – Conduct Select Workshop Purpose The focus of the second day of the Shelby County workshop was on the technical portions of the evaluation. This included Step 4 - Determine Countermeasures, Step 5 - Estimate Countermeasure Cost, Step 6 - Review Operational Security Planning, and consider ITS and GIS technologies as tools for the planning, monitoring and responding efforts. Although not discussed in this report, more information about Steps 4, 5, and 6 may be found in A Guide to Highway Vulnerability Assessment for Critical Asset Identification and Protection. Participants There were six participants on the second day. They were members of the state, county and municipal engineering staffs who had participated in the first day workshop.
Method The team took the results of Phase 2, which was the list of Quadrant I (Table 4-1) assets that were the highest priority based on Steps 1 through 3, and determined appropriate countermeasures to protect them. After determining countermeasures, a general discussion was conducted on the cost of countermeasures, the use of ITS as a countermeasure, and the use of GIS in aiding the assessment process. The workshop concluded with a discussion of how to integrate the countermeasures into the county’s emergency response planning.
Results Each of the four Quadrant I assets was evaluated and countermeasures were identified and analyzed. During this exercise, the facilitator emphasized that one of the most effective countermeasures was standoff distance to prevent a potential terrorist from gaining access to the site being protected. The point was made that countermeasures do not have to be complicated or expensive. They can range from expedient temporary measures to expensive engineered and manufactured solutions. The major emphasis of a countermeasure is that it is part of an overall security system that includes observation, placement, and integration into an overall plan. An

31
integrated countermeasure plan, even if funding is not currently available, needs to be developed and implemented as funds become available. ITS and GIS innovations were discussed as aids to the planning process and as systematic data collection and display mechanisms. Shelby County did not have ITS as a part of its strategy but the value of adding closed circuit television and message boards was discussed. It was agreed that these additions would enhance transportation operations during any natural or man created disaster. GIS has the potential of making the planning process more efficient. Since vulnerability assessments are required periodically or when the threat condition changes, GIS would be ideal for quicker access to information and for replicating planning steps with minimal manpower resources. This tool allows the use of colors and contours to identify transportation choke points, alternate routes, and identification of critical assets. The subject of the final discussion was integration of transportation related protective measures into the Shelby County emergency response plans. The County has an integrated emergency response plan that covers natural and man-made incidents. The addition of countermeasures into the plan will help ensure the actions are accomplished in an integrated manner. Observations The exceptionally high level of enthusiasm continued from the previous day. The assessment team continued to be highly motivated and enthusiastic about completing the Phase 3 analysis. The participant survey was given again at the end of the day two (see responses in Table 4-5), and produced two helpful comments:
• This was another very good workshop – participants learned a lot about the state of practice in infrastructure security in the United States.
• Cost figures. Need more information on what the different countermeasures cost.
Again, it was apparent to the UTCA researchers that the participants “got what they came for,” a procedure to address the terrorist threat to infrastructure. Again, they wanted more time and more experience because they liked what they had done.

32
Table 4-5. Summary of Shelby County second-day workshop participant survey responses
Survey Questions
Strongly Agree Agree N/A Disagree Strongly
Disagree
Did you feel this workshop satisfactorily defined critical highway infrastructure? 3 3
Did you feel this workshop satisfactorily explained how to determine Vulnerability of critical highway
infrastructure?3 3
Did you feel this workshop satisfactorily explained how to determine the consequence caused by
threats to vulnerable assets?4 2
Did you feel this workshop satisfactorily give you an understanding of how to prioritize work to provide
security to highway infrastructure?3 3
Do you feel this workshop satisfactorily explained how to reduce vulnerabilities and mitigate
consequences by means of counter measures?3 2 1
Do you feel this workshop satisfactorily explained the information essential for the development of
operations security plans to mitigate the consequences?
3 3
Response

33
Chapter 5 Discussion of Workshop Results
Introduction
The Shelby County and City of Tuscaloosa workshops were excellent indicators of the usefulness and applicability of the first three steps (identify critical assets, vulnerability assessment, and the consequence assessment) of the vulnerability model proposed for Alabama by this research. Following the workshops it was abundantly clear that the methodology can be used by the local and state governments. If the State of Alabama chooses to adopt this methodology state-wide, then an overall prioritized list of the most critical and vulnerable highway infrastructure assets can be compiled. The following section of this report reviews important findings from the workshops that need to be considered in developing a final methodology. In all cases these are reasonable and responsive to the current needs, knowledge bases, and resources of Alabama local governments.
Common Points The common observations from both workshops will be addressed first. These observations can be grouped into three major areas: (1) planning for the workshops; (2) leadership of the workshops; and (3) composition of the assessment team.
Planning Phase 1 planning for a workshop is important if the workshop is to accomplish its goal of identifying a prioritized list of the most critical and vulnerable assets. These are several necessary steps. First, an all-inclusive list of highway assets must be compiled for the study area. The generic list offered in Table 3-1 appears to be acceptable for use in Alabama, if modified as needed to address local situations. Second, it is important to assemble supporting information about the assets that have been identified for the all-inclusive list. For example, it is helpful to have maps that show the exact locations of the assets, with each asset labeled, and with attached GIS data that can show relationships between assets. Data about individual assets is needed because the transportation system is comprised of a set of individual assets that are integrated into a single operating system. Leadership Support of local government leadership is a critical component of a successful workshop. The top managers must be convinced that the resulting product is worth the expense of having key people available to participate in the workshop. The Shelby County and City of Tuscaloosa workshops both had strong support from the chief executives.

34
Leadership of the workshop is also important. A knowledgeable facilitator is necessary to guide the assessment team as they accomplish their tasks. This person must provide background information to educate the participants so that they have a general understanding of basic terrorism issues and a specific knowledge of the assessment techniques used in each step of the process. In addition, there are always side questions that must be answered as the participants gradually shift from “begrudging amateurs” to “owners of the process.” The meeting facilitator must be familiar with the details of all six steps in the AASHTO protection processes, and it is helpful if the facilitator brings reference texts and catalogues to the workshop. Assessment Team The third major component of a successful workshop is the assessment team. The team must, as a minimum, have knowledgeable personnel from engineering, law enforcement, fire protection, rescue services, and emergency management organizations. If there are multiple agencies in one of these categories (i.e., state highway patrol, sheriff’s office, police departments in multiple cities in the study area), it may be appropriate to invite representatives from all of them. The quality of the assessment team will determine the quality of the products produced during the workshop; therefore, it is desirable to have decision makers from all affected agencies. Shelby County Workshop The Shelby County Workshop was enthusiastically supported by the county leadership which made a concerted effort to have the right people attend the workshop. The facilitator was delighted to see the team enjoy the experience, absorb the material, and produce practical results. At the end of each workshop, participants clearly felt that they “got what they came for,” a procedure to address terrorist threats to highway infrastructure. Using the first three steps of the methodology they narrowed an all-inclusive list of assets from 51 to four. The assessment team gave the results a “common sense” check and was pleased with the outcome. Three concerns were expressed during the workshop that needed to be addressed in future sessions: (1) not all participants were aware of the names and locations of the assets; (2) not all of the descriptions of critical asset factors were clearly understood; and (3) the threat information provided in A Guide to Highway Vulnerability Assessment for Critical Asset Identification and Protection was not sufficient to satisfy the assessment team. The following actions were taken to address these concerns. Special emphasis was given during the planning process for the Tuscaloosa Workshop to make sure that the case study maps listed the asset locations. Consequently, the Shelby County concern was not an issue during the Tuscaloosa Workshop. The second modification instituted during the Tuscaloosa Workshop was an emphasis on addressing each of the descriptions in Table 3-3. Extra time was taken to make sure that each participant had a clear understanding of each of the definitions. One situation did arise on this subject during the Tuscaloosa Workshop, and it is addressed later in the Tuscaloosa section of this chapter.

35
The third concern was a lack of participant understanding of the terrorist threat. Additional information was added to the description of Step 2 (vulnerability assessments) that addressed this concern. Additional time was dedicated during the Tuscaloosa Workshop, during the workshop introduction and during step 2, to a discussion of threats and the kinds of threats that could be expected. City of Tuscaloosa Workshop Like the Shelby County workshop, the City of Tuscaloosa workshop was enthusiastically supported by the city and county leadership. A concerted effort was made to make sure that the right people were available to attend the workshop. The workshop local point of contact was a manager from the Tuscaloosa Department of Transportation (TDOT). Based upon his initial meeting with the UTCA research staff, he assembled the all-inclusive list and then removed those assets that were clearly low priority. During the workshop, the first three steps of the methodology were used to narrow the all-inclusive list of assets from 19 to five. The assessment team gave the results a “common sense” check and was pleased with the outcome. The only challenge revealed during the Tuscaloosa workshop occurred during Step 1 (Identify Critical Assets). The participants were trying to understand the meaning of the description given for item I, Military Importance. The key question for item I was, “Is the asset important to military function?” The discussions between the assessment team members concluded that the asset had military importance when it was designated as a part of the Strategic Highway Network. Therefore, one of the recommended changes to the assessment model was to add to the description of military importance a caveat that the asset must be on the STRAHNET. One advantage of having TDOT as one of the pilot workshops was their experience with ITS. They have established a traffic management center and have installed fiber optic cable to support communications. During the discussions of countermeasures it became apparent that ITS offers a great advantage in providing detection and deterrence for key assets. Summary of Case Study Results The results of the two pilot workshops demonstrated that the methodology developed in this dissertation from A Guide to Highway Vulnerability Assessment for Critical Asset Identification and Protection can be used by local governments to produce a prioritized list of the most critical and vulnerable highway assets. If the State of Alabama chooses to adopt this process it will have the ability to compile an overall state-wide prioritized list of vulnerable highway assets.

36
Chapter 6 Implementation Suggestions
Introduction If the methodology identified and supplemented during this project is to be accepted by the State of Alabama as the preferred process for identifying a state-wide priority list, then it is probable that the State will provide funding to accomplish the task. Chapter 7 has a recommendation on how this might be accomplished. If this course of action is taken, then special training must be prepared and conducted for ALDOT leadership so they can plan and manage the program. The Shelby County and City of Tuscaloosa workshops found that the methodology presented in A Guide to Highway Vulnerability Assessment for Critical Asset Identification and Protection, Steps1 through 3 can be used by Alabama local government to identify vulnerable highway infrastructure. But a large caveat is that it took much (previously undocumented) preparation by experts to set the stage for the workshop. As might have been predicted, the participants were experts in their own fields, but initially had difficulty seeing the specific missions and capabilities of other agencies. To give all participants a global view of the exercise, is was necessary to introduce basic educational material to broaden the terrorism/infrastructure security horizons of all participants. Without this, it would have been too difficult for working individuals to get started in the security assessment/protection process because they could not see the big picture, did not understand the terminology, did not understand who was responsible for what assessment and what defense, and had not been previously charged with preparing for terrorist actions. The following sections identify major (previously undocumented) preparation activities and suggest an implementation strategy. The unfolding of this information will be in three basic phases: (1) actions prior to workshop; (2) planning for the workshop; and (3) execution of the workshop. Actions Prior to Workshop Obtain Commitment of Government Leadership A successful workshop begins with a commitment from the local government executive leadership. This can come from enlightened leadership (as was the case in Shelby County and the City of Tuscaloosa), encouragement from the state, or through education by the facilitator. Once this has been accomplished, the next step is to identify a local champion. The Shelby County and TDOT point persons did outstanding jobs of fulfilling that role at their respective sites. They had the tough job of recruiting and coordinating the assessment team members, instilling commitment to the workshop, gathering the workshop support materials and data, identifying and reserving the workshop facilities; and otherwise providing necessary logistical support.
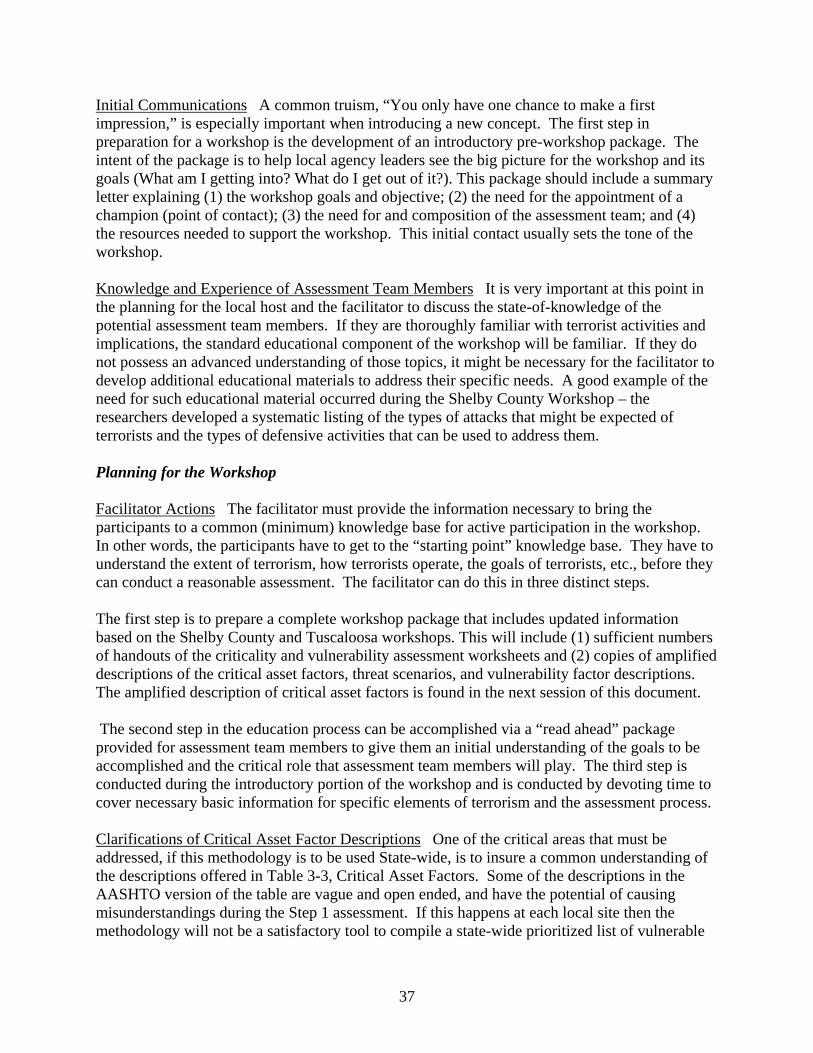
37
Initial Communications A common truism, “You only have one chance to make a first impression,” is especially important when introducing a new concept. The first step in preparation for a workshop is the development of an introductory pre-workshop package. The intent of the package is to help local agency leaders see the big picture for the workshop and its goals (What am I getting into? What do I get out of it?). This package should include a summary letter explaining (1) the workshop goals and objective; (2) the need for the appointment of a champion (point of contact); (3) the need for and composition of the assessment team; and (4) the resources needed to support the workshop. This initial contact usually sets the tone of the workshop. Knowledge and Experience of Assessment Team Members It is very important at this point in the planning for the local host and the facilitator to discuss the state-of-knowledge of the potential assessment team members. If they are thoroughly familiar with terrorist activities and implications, the standard educational component of the workshop will be familiar. If they do not possess an advanced understanding of those topics, it might be necessary for the facilitator to develop additional educational materials to address their specific needs. A good example of the need for such educational material occurred during the Shelby County Workshop – the researchers developed a systematic listing of the types of attacks that might be expected of terrorists and the types of defensive activities that can be used to address them.
Planning for the Workshop Facilitator Actions The facilitator must provide the information necessary to bring the participants to a common (minimum) knowledge base for active participation in the workshop. In other words, the participants have to get to the “starting point” knowledge base. They have to understand the extent of terrorism, how terrorists operate, the goals of terrorists, etc., before they can conduct a reasonable assessment. The facilitator can do this in three distinct steps. The first step is to prepare a complete workshop package that includes updated information based on the Shelby County and Tuscaloosa workshops. This will include (1) sufficient numbers of handouts of the criticality and vulnerability assessment worksheets and (2) copies of amplified descriptions of the critical asset factors, threat scenarios, and vulnerability factor descriptions. The amplified description of critical asset factors is found in the next session of this document. The second step in the education process can be accomplished via a “read ahead” package provided for assessment team members to give them an initial understanding of the goals to be accomplished and the critical role that assessment team members will play. The third step is conducted during the introductory portion of the workshop and is conducted by devoting time to cover necessary basic information for specific elements of terrorism and the assessment process. Clarifications of Critical Asset Factor Descriptions One of the critical areas that must be addressed, if this methodology is to be used State-wide, is to insure a common understanding of the descriptions offered in Table 3-3, Critical Asset Factors. Some of the descriptions in the AASHTO version of the table are vague and open ended, and have the potential of causing misunderstandings during the Step 1 assessment. If this happens at each local site then the methodology will not be a satisfactory tool to compile a state-wide prioritized list of vulnerable

38
assets. During this project amplified descriptions were developed as supplemental materials to be provided by the facilitator during the assessment process. They were intended to illustrate that the terrorist’s primary intent is to make targets of people and symbolic assets. The amplified descriptions were successfully tested in the TDOT workshop, and have been documented elsewhere (Stovall, 2005) Defensive Strategies and Designs Another major shortcoming with the AASHTO Guide methodology was that it lacked detailed discussions of the types of possible terrorist threats against highway infrastructure assets and the types of countermeasures that can be used to protect them. The information from the Guide was insufficient to adequately explain to assessment team members that countermeasures are developed based on systematic processes that produce an integrated protective system. The project research staff prepared materials in great detail to guide the assessment team through the concepts necessary to plan for and select appropriate countermeasures. These steps included discussions on (1) the most common types of threats that may be countered (the information provided in Step 2 is intended to fill participants’ knowledge gap on vulnerability); (2) the concepts of a systematic design strategy for use when considering protection of different assets; (3) countermeasure concepts; and (4) the types of countermeasures that are currently available. If the facilitator had not been experienced in threat evaluation and countermeasures (independently from the information in the Guide) it is likely that the participants’ efforts would have been quite limited in selection of countermeasures. Knowing the dedication of the participants at both workshops, they would have probably been quite frustrated and the results of the workshops may not have been as positive. Point of Contact Actions Another key action is to begin initial coordination with the point of contact for the designated local government. The activities conducted with the contact person will be to (1) provide a list of the basic needs for conducting the workshop, including a training facility; (2) discuss and schedule a date for the workshop; (3) and schedule a time for a site visit. The items listed in Table 6-1 are required to produce a successful workshop. For example, the refreshments help provide a relaxed, corporative environment. The catered lunch allows the team to remain onsite and continue work on the project (at the two case study sites it was hard for the facilitator to convince the assessment team members to stop their deliberations long enough to eat). These are busy people and if they leave the site their attention may be diverted to other pressing issues and you may lose them as participants in the remaining portion of the workshop.
Table 6-1. Typical workshop support requirements
Workshop Facilities Assessment Team Data RequirementsEngineering Personnel Maps
Emergency Management GIS DataLaw Enforcement Asset Data
Fire & Rescue Security Planscoffee/soft drinks
catered lunch
Well lighted, environmental controlled classroom
tables and chairs with space to arrange for small groups
Assessment Team The selection of assessment team members is perhaps the most critical part of the preparation. The team members need to have a strong working knowledge of their agencies’ missions, critical assets, and policies. It is impossible to specify a mandatory list of

39
individuals that should be in attendance at each site, because local governments differ widely across the state. The general types of people that need to be in attendance are senior engineering, law enforcement, fire and rescue, and emergency management personnel who are empowered to speak and make decisions on behalf of their respective organizations. Obviously, the larger the number of agencies represented and the more qualified the team members are, the better the chances for a successful workshop.
Execution of the Workshop The success of a workshop begins with detailed prior planning, appointment of a motivated champion as the local point person, and identification of knowledgeable and committed assessment team members. The facilitator needs to ensure that all information is available and the classroom is ready prior to the first day of the workshop. The workshop should start and end on time, because the assessment team members are busy people who are important to their agencies and they should be treated with respect. The following details are additional keys to conducting a successful workshop.
• Use multiple small groups for processes like evaluating assets and establishing rating scores. The groups should be interdisciplinary, composed of a mixture of the key expertise in attendance (engineers, law enforcement, emergency management, and fire and rescue).
• After the completion of each step, time should be allowed for group reporting and discussion between all assessment team members to allow sharing of experiences and clarification of questions and concepts. This improves the final assessment and builds group consensus about the process and the results.
• The facilitator should keep the group focused on the goals of the workshop and maintain a positive attitude toward the participants. He or she must constantly work to keep the sessions moving toward the desired goal of the workshop.
• The facilitator should continually summarize progress and make sure the participants understand where the process started and where it is going.
• To the extent possible, keep the process and the discussions informal to maximize interactions.
• If contentious issues arise, or a participant gets off track, table that discussion and address it off line (at a time other than the planned exercise, at a break or after the session). Another technique is to tape a large piece of paper on the wall and call it the “parking lot” for ideas that will be discussed later. That way, a point of contention can be preserved (which reassures the participant who originated the idea), yet the group can get back to work on the main topic,
• Let the participants know what they are producing, how their work products will be used, and how their results fit into the overall product.
• Allow the participants time to bond and to enjoy their successes in the workshop. • Ensure that there are drinks and snacks available in the room (or near the room), and that
lunch is catered. If the participants leave the work area for lunch and their cell phones ring, they are likely to divert to a minor problem back at the office and will be lost for the remainder of the meeting. After all, the team members are some of the most important and busiest people in their organizations.

40
Summary of Implementation Suggestions This chapter has presented supplemental activities and materials that enhance the processes presented in the AASHTO Guide. The supplemental information simplifies the process for those without extensive knowledge, invites each participant to be an important and full member of the assessment team, and greatly increases the probability that the workshop will be successful and that it will produce useful documents. In effect, the supplementary materials allow Alabama local governments to produce a prioritized list of their most vulnerable assets. If this process is used by all local governments, then this repeatable model can be used to generate a prioritized list of vulnerable highway infrastructure Alabama assets.

41
Chapter 7 Conclusions and Recommendations
Conclusions The initial objective of this project was to develop a model for identifying vulnerable highway infrastructure, but the literature review identified a model developed by AASHTO for state DOTS. It appeared that the model could be adapted to accomplish the primary objective with the clear advantage of having the authority of AASHTO to reinforce its validity. Shelby County and City of Tuscaloosa Workshops demonstrated that the methodology outlined in Steps 1 - 3 of the AASHTO model can be used by Alabama local governments to identify vulnerable highway assets. However, certain modifications and supplementary steps are required so that the state DOT process meets the unique needs of local jurisdictions. This includes clarifying parameter meanings, providing an educational component to prepare the assessment team, and having the work sessions guided by a knowledgeable facilitator. Given those modifications, the model becomes a prioritization process that can be easily taught and replicated, and the results obtained at different sites can be combined to develop a state-wide prioritized list of vulnerable highway assets. Based upon the AASHTO-approval stature of the selected model, it should be widely accepted and used by state DOTs. That stature will also influence many local governments, and coupled with the modifications and implementation steps of this research can provide incentive for local governments to perform highway infrastructure assessments. Recommendations After having identified, field tested, and modified an appropriate model, the author makes the following recommendations: 1) That the methodology can be adopted by ALDOT, which can initiate a state-wide program to identify critical and vulnerable assets. This would mean that the state would (a) direct the values and descriptions for the critical asset factors and the vulnerability factors to be used in Steps 1 and 2 of the model, and (b) establish a list of local governments/state agencies and a timeframe for the completion of vulnerability analyses. The author recommends using the proposed implementation plan in Chapter 6 with a phased approach. Phase 1 (18 months) would be to conduct assessment workshops for the 12 metropolitan areas in the State: Birmingham, Tuscaloosa, Gadsden, Anniston, Florence, Decatur, Huntsville, Montgomery, Mobile, Auburn-Opelika, Columbus, and Dothan. A suggested plan (Table 7-1) begins with the Birmingham area, moves to Tuscaloosa, then Montgomery, Mobile, Huntsville, Decatur, Florence, Anniston, Columbus, Dothan, Gadsden, and finally Auburn-Opelika. The proposed workshops are labeled “workshop” and “area

42
workshop” in the table. This will total 44 workshops over an 18 month period. Each workshop will be two days in length, and it is estimated that the cost of each workshop will be about $10,000. The total estimated cost for this phase is $440,000. These priorities, of course, can be changed to meet priorities that might be established at a later time by State of Alabama leaders.
Table 7-1. Suggested plan for state wide infrastructure assessments
Workshop Area Workshop Regional WorkshopBirmingham x x 1A
Blount County xJefferson County x
Shelby County ySt. Clair County x
Tuscaloosa x 1ACity of Tuscaloosa y
Tuscaloosa County x
Montogomery x xAutauga County xElmore County x
Montogomery County x
Mobile x xBaldwin County xMobile County x
Huntsville x x 2ALimestone County x
Madison County x
Decatur x x 2ALawrence County x
Morgan County x
Florence x x 2AColbert County x
Lauterdale County x
Gadsden x x 1AEtowah County x
Anniston x x 1ACalhoun County x
Auburn - Opelika x xLee County x
Columbus x xRussell County x
Dothan x xDale County x
Houston County x1A - Regional Area 12A - Regional Area 2
x = proposed workshopy = accomplsihed workshoplegend
Phase 2 (six months) would involve conducting regional workshops to coordinate findings and requirements between adjacent metropolitan statistical areas. It is estimated this phase will cost about $20,000.
Phase 3 (six months) would be a review of the remaining counties and cities that were not completed in phase 1. This can be accomplished in one of two ways. First, the analysis can be

43
accomplished as a “table top” review in coordination with ALDOT. Some site visits may be required during this process, based on the findings of the initial table top review. Or, secondly, the assessments could be completed by grouping the remaining counties (5 or 6 per workshop) and conducting workshops to assess the assets in their area. It is estimated that the table top review will cost $50,000, where the grouped workshops would cost about $10,000 per workshop.
Phase 4 (six months) will be a comprehensive review and summary of all data generated during the first three phases of the assessment. The goal of phase 4 will be to develop a state-wide prioritized list of vulnerable assets. This effort is estimated to cost $50,000.
2) That additional research be conducted. The following projects would improve the overall assessment program for Alabama (and nationwide).
• Develop an educational module to be used at the initiation of each assessment workshop. The module would provide background information to bring each participant’s base knowledge to a level sufficient to contribute to the assessment decision process.
• Develop a countermeasure selection and application module. It would include guidelines on how to address specific threat scenarios and how to accomplish specific protective objectives. This module would include cost data for each treatment package.
• Develop an ITS application module that indicates typical uses in addressing terrorist threats and the aftermath of terrorism, and that indicates appropriate uses for protection of assets
• Develop a GIS application module that identifies how GIS can supplement and support planning techniques and how it can provide immediate access to vital information to support control and recovery activities during a terrorist event.
• Identify funding strategies to support planning, countermeasures, and retrofits. • Identify environmental considerations that need to be included in the planning process.
3) That a facilitators training plan be developed for EMA and ALDOT managers, and other appropriate personnel so that they can provide oversight of the processes and programs. Summary This project found no evidence of any similar studies or activities being undertaken to determine how to identify terrorist threats to local highway infrastructure. The methodology presented in the AASHTO-sanctioned guide (USDOT/AASHTO, Vulnerability, 2002), and supplemented in this research, has been demonstrated in the two workshops to be an effective tool for identifying a prioritized list of vulnerable highway assets. Adoption of the above recommendations will result in a safer environment for the citizens of the state of Alabama.

44
Chapter 8 References
Blue Ribbon Panel on Bridge and Tunnel Security, Recommendations for Bridge and Tunnel
Security, U.S. Department of Transportation and American Association of State Highway and Transportation Officials, 2003, Washington, D.C.
Dillingham, Gerald L., Post-September 11th Initiatives and Long-Term Challenges, General
Accounting Office testimony before Congress, April 1, 2003, Washington, D.C. Guide to Highway Vulnerability Assessment for Critical Asset Identification and Protection,
Science Applications International Corporation (SAIC) Transportation Policy and Analysis Center, Vienna, VA, May 2002.
Ham, Douglas B. and Stephen Lockwood, National Needs Assessment for Insuring
Transportation Infrastructure Security (October 2002), U.S. Department of Transportation and American Association of State Highway and Transportation Officials, Washington, D.C., 2002.
Homeland Security and ITS: Using Intelligent Transportation Systems to Improve and
Support Homeland Security, Intelligent Transportation Society of America, 2002, Washington, D.C.
Jenkins, Brian Michael and Larry N. Gersten, Protecting Public Surface Transportation
Against Terrorism and Serious Crime: Continuing Research and Best Security Practices, Mineta Transportation Institute, 2001, MTI Report 01-07, San Jose, CA.
Jenkins, Brian Michael, Protecting Surface Transportation Systems and Patrons From Terrorist Activities, Norman Y. Mineta International Institute for Surface Transportation Policy Studies, 1997, IISTPS Report 97-4, San Jose, CA.
Khattak, Asad, Transportation Security: Identifying Vulnerabilities through Spatial Analysis of
Risk Perceptions, Security Papers, Southeastern Transportation Center, 2002, Knoxville, TN, pages 37-49.
Physical Security, Army Field Manual FM 3-19.30. Polzin, Steven, Security Considerations in Transportation Planning, Security Papers,
Southeastern Transportation Center, 2002, Knoxville, TN, pages 12-36. Srinivasan, Karthik, Transportation Network Vulnerability Assessment: A Quantitative
Framework, Security Papers, Southeastern Transportation Center, 2002, Knoxville, TN, pages 60-79.

45
Stovall, Michael E., Methodology for Developing a Prioritized Project List for the Protection of Critical and Vulnerable Alabama Highway Infrastructure,” Doctoral Dissertation, January 2005, the University of Alabama. U.S. Department of Transportation and American Association of State Highway and
Transportation Officials. A Guide to Updating Highway Emergency Response Plans for Terrorist Incidents, 2002, Washington, D.C.
U.S. Department of Transportation and American Association of State Highway and
Transportation Officials, A Guide to Highway Vulnerability Assessment for Critical Asset Identification and Protection, 2002, Washington, D.C.
U.S. President, The National Strategy for the Physical Protection of Critical Infrastructure and
Key Assets, February 2003, The White House Report, Washington, D.C.

46
Chapter 9 Acknowledgements
The authors gratefully acknowledge the support of the Alabama Department of Transportation in the planning and organization stage of this project. The wholehearted support of the Shelby County Engineer’s Office and the Tuscaloosa Department of Transportation during the case studies was one of the highlights of the project, and the authors express appreciate to the assessment teams at those locations. Certainly the key to project success was the meticulous preparation and hosting of the local point people at those two sites. This research project was the dissertation research for Dr. Michael E. Stovall, and appreciation is expressed to the members of his dissertation committee for their guidance.

47
Appendix A Overview or Countermeasures
Introduction This research developed a methodology for producing a prioritized list of projects to protect the most critical and vulnerable highway infrastructure in the State of Alabama. The methodology is an adaptation of a six-step AASHTO methodology developed for state departments of transportation, with supplementary materials to facilitate its use by Alabama local governments. The fourth step takes a list of the most critical and most vulnerable assets developed in steps 1-3 and (beginning with the assets in Quadrant I and working toward the ordinate) develops countermeasures that are designed to reduce or mitigate the risk of attack. This appendix provides example materials from those developed for the project workshops. A more complete description of those materials has been provided elsewhere (Stovall, 2005). Philosophy for the Selection of Countermeasures Participants in the Shelby County Workshop were uncomfortable with their basic knowledge of how to effectively select countermeasures and the lack of detail about suggested countermeasures in the AASHTO publication A Guide to Vulnerability Assessments for Critical Asset Identification and Protection. Therefore, Appendix A was written to provide more detailed information about how to plan countermeasures based on the assumed threat to a particular asset. The basis for this discussion is the Army Field Manual; FM 3-19.30. Although much of the following discussion is couched in military terms and concepts, they can easily transition to terrorist mitigation in the public sector. As a reminder, the three primary threats to highway infrastructure asset identified in Step 2 (vulnerability assessment) were:
• Moving vehicle bomb. An aggressor drives an explosive-laden car or truck into a facility and detonates the explosives. His goal is to damage or destroy the facility or to kill people. This is a suicide attack.
• Stationary vehicle bomb. An aggressor covertly parks an explosive laden car or truck near a facility. He then detonates the explosives either by time delay or remote control. His goal in this tactic is the same as for the moving vehicle bomb with the additional goal of destroying assets within the blast area. This is commonly not a suicide attack. It is the most frequent application of vehicle bombings.
• Exterior attack. An aggressor attacks a facility’s exterior or an exposed asset at close range. He uses weapons such as rocks, clubs, improvised incendiary or explosive devices, and hand grenades. Weapons (such as small arms) are not included in this tactic, but are considered in subsequent tactics. His goal is to damage the facility, to injure or kill its occupants, or to damage or destroy assets.

48
The development of countermeasures for highway assets should be based on systematic processes that produce an integrated protective system. The system is organized with mutually supporting elements coordinated to prevent gaps or overlaps in responsibilities and performance. Effective protective systems integrate the following mutually supporting elements:
• Physical protective measures, including barriers, lighting, and electronic security systems (ESS).
• Procedural security measures (discussed in detail in Appendix C), including procedures in place before an incident and those employed in response to an incident.
• Counteraction measures to terrorism that protects assets against terrorist attacks. Three overriding factors must be considered when developing protective systems: (1) the resources available; (2) the assets to be protected; and (3) the threat to those assets.
Integrated Protective System An integrated protective system concept integrates physical protective measures and security procedures to protect assets against identified threats. The five basic categories that characterize integrated protective countermeasures systems are deterrence, detection, defense, defeat, and strengthening of assets by structural hardening. Design structural hardening is a topic beyond the scope of this research because of the time and expense normally associated with the design and implementation, but its application to highway infrastructure is certainly a good topic for further research. The Blue Ribbon Panel on Bridge and Tunnels report is a good initial reference and FM 3-19.30 Physical Security is the primary reference. The Manual was used in this discussion. Even though it is an Army manual written for battlefield situations, it provides excellent advice and design guidance for terrorist threats to civilian facilities like highway infrastructure. It offers the following definitions for the four basic categories that will be addressed in this appendix. Deterrence A potential aggressor who perceives a risk of being caught may be deterred from attacking an asset. The effectiveness of deterrence varies with the aggressor’s sophistication, the asset’s attractiveness, and the aggressor’s objective. Although deterrence is not considered a direct design objective when choosing countermeasures, it may be a result of the design.
Detection A detection measure senses an act of aggression, assesses the validity of the detection, and communicates the appropriate information to a response force. A detection system must provide all three of these capabilities to be effective. Detection measures may detect an aggressor’s movement via an Intrusion Detection System (IDS) or Closed Circuit Television (CCTV). They may detect weapons and tools via X-ray machines or metal and explosive detectors. Detection measures may also include access-control elements that assess the validity of identification (ID) credentials. These control elements may provide a programmed response (admission or denial), or they may relay information to a response force. Guards serve as detection elements by detecting intrusions and controlling access.
Defense Defensive measures protect an asset from aggression by delaying or preventing an aggressor’s movement toward the asset or by shielding the asset from weapons and explosives. Typical defensive measures include the following:

49
• Delay aggressors from gaining access by using tools in a forced entry. These measures include barriers along with a response force.
• Prevent an aggressor’s movement toward an asset. These measures provide barriers to movement and obscure lines of sight (LOS) to assets.
• Protect the asset from the effects of tools, weapons, and explosives. Defensive measures may be active or passive. Active defensive measures are manually or automatically activated in response to acts of aggression. Passive defensive measures do not depend on detection or a response. They include such measures as blast-resistant building components and fences. Guards may also be considered as a defensive measure.
Defeat Most protective systems depend on law enforcement response personnel to defeat an aggressor. Defeat is not a design objective; but, defensive and detection systems must be designed to accommodate (or at least not interfere with) law enforcement response force activities.
Design Strategies
There are separate design strategies for protecting assets from each of the three primary tactics associated with highway infrastructure (moving vehicle bomb, stationary vehicle bomb, and exterior attack). Using the model presented in FM 3-19.30, there are two types of strategies associated with each tactic—the general-design and specific-design strategies. The general-design strategy is the general approach to protecting assets against tactics. The specific-design strategy refines the general-design strategy to focus the performance of the protective system on a particular level of protection.
Protective Measures Protective measures are developed as a result of the general- and specific-design strategies. These protective measures commonly take the form of site-work, building, detection, and procedural elements.
• Site-work elements include the area surrounding a facility or an asset. Technically, they are associated with everything beyond five feet from a building. They can include perimeter barriers, landforms, and standoff distances.
• Building elements are protective measures directly associated with buildings. These elements include walls, doors, windows, and roofs.
• Detection elements detect such things as intruders, weapons, or explosives. They include IDSs, CCTV systems used to assess intrusion alarms, and weapon and explosive detectors. These elements can also include the guards used to support this equipment or to perform similar functions.
• Procedural elements are the protective measures required by state or local security operation plans, Appendix C. These elements provide the foundation for developing the other three elements.

50
Vehicle Bombs Although many individual threats are addressed in FM 3-19.30, only one example (vehicle bombs) is reviewed in this appendix. The vehicle-bomb tactic includes both moving and stationary vehicle bombs. In the case of a moving vehicle bomb, the aggressor drives the vehicle into the target. This is commonly known as a suicide attack. In a stationary vehicle bomb, he parks the vehicle and detonates the bomb remotely or on a timed delay.
General-Design Strategy Blast pressures near an exploding vehicle bomb are very high, but they decrease rapidly with distance from the explosion. The design strategy for these tactics is to maintain as much standoff distance as possible between the vehicle bomb and the facility; and then, if necessary, to harden the facility for the resulting blast pressures. Barriers on the perimeter of the resulting standoff zone are intended to maintain the required standoff distance. The difference between moving and stationary vehicle-bomb tactics is that the aggressor using the moving vehicle bomb will attempt to crash through the vehicle barriers; the aggressor using the stationary vehicle bomb will not. The two key points to remember about vehicle barriers are:
• For the moving vehicle bomb, vehicle barriers must be capable of stopping a moving vehicle at the perimeter of the standoff zone.
• For a stationary vehicle bomb, vehicle barriers must mark the perimeter of the standoff zone, but they are not required to stop the moving vehicle. They only need to make it obvious if an aggressor attempts to breach the perimeter.
Levels of Protection There are three levels of protection for vehicle bombs—low, medium, and high. The primary differences between the levels are the degree of damage allowed to the facility protecting the assets and the resulting degree of damage or injury to the assets.
• Low. The facility or the protected space will sustain a high degree of damage but will not collapse. It may not be economically repairable. Although collapse is prevented, injuries may occur and assets may be damaged.
• Medium. The facility or the protected space will sustain a significant degree of damage, but the structure will be reusable. Occupants and other assets may sustain minor injuries or damage.
• High. The facility or the protected space will sustain only superficial damage. Occupants and other assets will also incur only superficial injury or damage.
Site-Work Elements The two primary types of site-work elements for vehicle bombs are standoff distance and vehicle barriers. When determining the use of vehicle barriers, vehicular speed must also be taken into consideration. Standoff Distance The standoff distance is the maintained distance between where a vehicle bomb is allowed and the target. The initial goal should be to make that distance as far from the target facility as practical. Figure A1 shows the distances required to limit building damage to particular levels (including the levels of protection described above) for a range of bomb weights. All bomb weights are given in terms of equivalent pounds of trinitrotoluene (TNT), which is a standard way of identifying all explosives regardless of their composition. The example in Figure A1 is a building of conventional construction (common, unhardened construction). Buildings built without any special construction at these standoff distances will
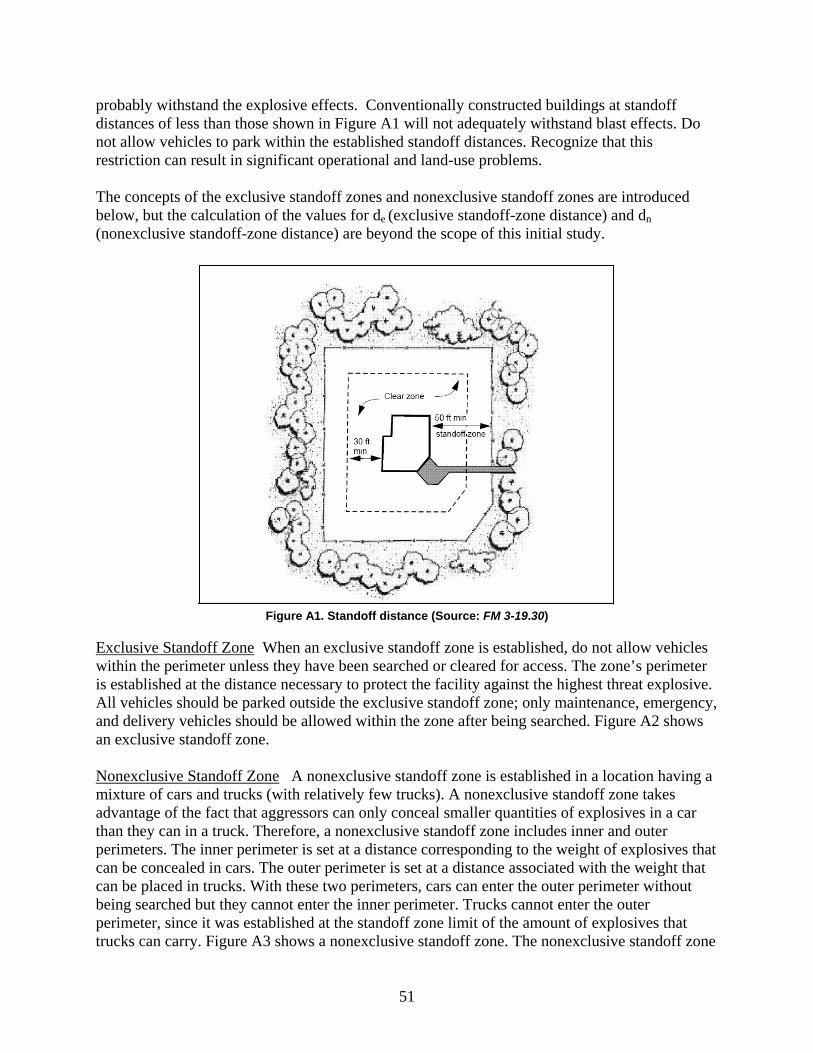
51
probably withstand the explosive effects. Conventionally constructed buildings at standoff distances of less than those shown in Figure A1 will not adequately withstand blast effects. Do not allow vehicles to park within the established standoff distances. Recognize that this restriction can result in significant operational and land-use problems. The concepts of the exclusive standoff zones and nonexclusive standoff zones are introduced below, but the calculation of the values for de (exclusive standoff-zone distance) and dn (nonexclusive standoff-zone distance) are beyond the scope of this initial study.
Figure A1. Standoff distance (Source: FM 3-19.30)
Exclusive Standoff Zone When an exclusive standoff zone is established, do not allow vehicles within the perimeter unless they have been searched or cleared for access. The zone’s perimeter is established at the distance necessary to protect the facility against the highest threat explosive. All vehicles should be parked outside the exclusive standoff zone; only maintenance, emergency, and delivery vehicles should be allowed within the zone after being searched. Figure A2 shows an exclusive standoff zone. Nonexclusive Standoff Zone A nonexclusive standoff zone is established in a location having a mixture of cars and trucks (with relatively few trucks). A nonexclusive standoff zone takes advantage of the fact that aggressors can only conceal smaller quantities of explosives in a car than they can in a truck. Therefore, a nonexclusive standoff zone includes inner and outer perimeters. The inner perimeter is set at a distance corresponding to the weight of explosives that can be concealed in cars. The outer perimeter is set at a distance associated with the weight that can be placed in trucks. With these two perimeters, cars can enter the outer perimeter without being searched but they cannot enter the inner perimeter. Trucks cannot enter the outer perimeter, since it was established at the standoff zone limit of the amount of explosives that trucks can carry. Figure A3 shows a nonexclusive standoff zone. The nonexclusive standoff zone

52
provides the advantages of allowing better use of the parking areas and limiting the number of vehicles that need to be searched at the outer perimeter.
Figure A2. Exclusive and nonexclusive standoff-zone (Source: FM 3-19.30)
Overview of Countermeasures This brief overview was intended to illustrate that countermeasure selection and deployment consists of a series of simple steps that identify appropriate countermeasures for designated threat scenarios. There is much additional material in the published literature, and the supplemental materials developed in this project and published by Stovall (1995) are sufficient for most local government highway infrastructure security assessments.

53
Appendix B Shelby County Workshop
This appendix contains examples of the work products that resulted from the two-day case study workshop.

54
The assessment team in the Shelby County workshop broke into four groups, and performed a criticality assessment on the 51 assets contained in the initial all-inclusive list of highway infrastructure assets. The results are shown in Table B-1. Due to the sensitive nature of this analysis, the names of the assets have been replaced by alphanumeric designators in this appendix.
Table B1. Criticality factor and critical coordinate calculations group 1 group 2 group 3 group 4 Average X
Critical Assets X=x/43*100
S1 35 31 30 31 31.75 74
S2 36 22 31 24 28.25 66
S3 27 27 31 27 28 65
S4 32 27 22 23 26 60
S5 21 22 30 21 23.5 55
S6 21 22 30 21 23.5 55
S7 30 22 25 16 23.25 54
S8 27 22 21 21 22.75 53
S9 15 22 23 24 21 49
S10 20 16 20 21 19.25 45
S11 9 16 25 21 17.75 41
S12 6 11 18 26 15.25 35
S13 11 15 17 9 13 30
S14 16 8 17 8 12.25 28
S15 10 15 8 13 11.5 27
S16 10 15 14 1 10 23
S17 5 15 6 13 9.75 23
S18 9 11 17 1 9.5 22
S19 11 11 9 4 8.75 20

55
In Step 2, Vulnerability Assessment, the team took the list of most critical assets and completed the vulnerability assessment. Table B2 contains the results of the vulnerability assessment.
Table B2. Most vulnerable assets
(A * B) + (C * D) + (E * F)1-5 * 1-5 + 1-5 * 1-5 * 1-5 * 1-5
1 1 29.75
1 29
2.5 5 5
5 12 5
1 1 30
1 30
2 5 5
5 12 5S16
S17
S18
S19
2
2
1.5
1.5
Critical AssetsTotal Score
(y)
S1 2.5 3 40.25
S2
S3
S4
S5
S6
S7
S8
S9
S10
S11
S12
S13
S14
S15
Vulnerbility Factors
2.5 5 5 3
1.5 2 5 5 1 1.5 29.5
3.5 2.5 5 5 3 3 42.75
2 2.5 4.5 4.5 4 4 41.25
1 1 3.5 4 2.5 2 20
1 1 3.5 4 1.5 2 18
2.5 2 3.5 3.5 3 3 26.25
2 2 5 5 3 3 38
1.5 2 5 3 1 1 19
2 1.5 5 5 1.5 2 31
2 2 5 5 3 3 38
3 1.5 5 5 2.5 3.5 38.25
1.5 1.5 5 5 2 2 31.25
2 1.5 5 5 1 1 29
2 2 5 5 1 1 30
54
39
57
55
27
24
35
51
25
41
51
51
Y=y/75*100
40
39
40
42
39
40
40

56
In the next step, the assessment team used the results of the criticality (x) and vulnerability (y) assessments to prepare a Consequence Assessment Matrix. The x and y coordinates for each asset are shown in Table B3, along with the matrix quadrant into which the asset fell.
Table B3. Consequence assessment values
S6
S7
S9
S10
S11
I
Asset X Y
I
57
55
74S1
S3
Quad
65
60
54 I
I
III
III
III
S2
S5
53 51
S4
S8
S12
S13
S14
S15
S16
S17
S18
S19
66
55
55
54
49
45
41
35
30
28
27
23
23
22
20
39
27
24
35
25
41
51
51
42
39
40
40
40
39
40
II
II
II
II
III
III
IV
III
IV
III
III
III

57
During the second day workshop, assessment team members identified appropriate countermeasures for the four assets with the highest consequent assessment scores. These are shown in Tables B-4 through B-7.
Table B4. Suggested countermeasures for asset S1
Install security sytems with video capability at all DOT facilities X X
X X X
X X
X
X
X X
X
X
X
Train all DOT personnel to be more observant of their surroundings and potentially dangerous packages, boxes, people, etc.Improve lightingIncrease surveillance at tunnels by installing cameras linked to the Traffic Operations Center (TOC)Add motion sensors to fences.
Lock all access gates and install remote controlled gates where necessary.Develop and implement a department-wide security policy.Limit access to all buildings through the issuance of a security badge with specific accesses identified and controlled through the card.
Protect ventilation intakes with barriersInstall and protect ventilation emergency shut off systems.Install Mylar sheeting on inside of windows to protect employees from flying glass in case of an explosion
Place a full-time security officer in a guard shack to control access.
Increase inspection efforts aimed at identifying potential explosive devices as well as increased of suspecious potential criminal activityInstitute full-time surveillance at the most critical assets where alternate routes are limited or have been identifiedEliminate parking under any of the most critical type bridges. Elimination of the parking can be accomplished through the use of concrete barriers.Place barriers in such a way as to eliminate ease of access where a vehicle could be driven right up to the asset
POTENTIAL COUNTERMEASURES
DE
TER
DE
TEC
T
DE
FEN
D

58
Table B5. Suggested countermeasures for asset S3
Install security sytems with video capability at all DOT facilities X X
X X X
X X
X
X
X X
X
X
X
Train all DOT personnel to be more observant of their surroundings and potentially dangerous packages, boxes, people, etc.Improve lightingIncrease surveillance at tunnels by installing cameras linked to the Traffic Operations Center (TOC)Add motion sensors to fences.
Lock all access gates and install remote controlled gates where necessary.Develop and implement a department-wide security policy.Limit access to all buildings through the issuance of a security badge with specific accesses identified and controlled through the card.
Protect ventilation intakes with barriersInstall and protect ventilation emergency shut off systems.Install Mylar sheeting on inside of windows to protect employees from flying glass in case of an explosion
Place a full-time security officer in a guard shack to control access.
Increase inspection efforts aimed at identifying potential explosive devices as well as increased of suspecious potential criminal activityInstitute full-time surveillance at the most critical assets where alternate routes are limited or have been identifiedEliminate parking under any of the most critical type bridges. Elimination of the parking can be accomplished through the use of concrete barriers.Place barriers in such a way as to eliminate ease of access where a vehicle could be driven right up to the asset
POTENTIAL COUNTERMEASURES
DE
TER
DE
TEC
T
DE
FEN
D

59
Table B6. Suggested countermeasures for asset S7
Install security sytems with video capability at all DOT facilities X
X X
X X
POTENTIAL COUNTERMEASURES
DET
ER
DET
ECT
DEF
END
Increase inspection efforts aimed at identifying potential explosive devices as well as increased of suspecious potential criminal activity X X
Institute full-time surveillance at the most critical assets where alternate routes are limited or have been identified X X
Eliminate parking under any of the most critical type bridges. Elimination of the parking can be accomplished through the use of concrete barriers.Place barriers in such a way as to eliminate ease of access where a vehicle could be driven right up to the asset X
Protect ventilation intakes with barriersInstall and protect ventilation emergency shut off systems.Install Mylar sheeting on inside of windows to protect employees from flying glass in case of an explosion X
Place a full-time security officer in a guard shack to control access. X X
Lock all access gates and install remote controlled gates where necessary. X X
Develop and implement a department-wide security policy.Limit access to all buildings through the issuance of a security badge with specific accesses identified and controlled through the card.
X X
Train all DOT personnel to be more observant of their surroundings and potentially dangerous packages, boxes, people, etc. X X
Improve lightingIncrease surveillance at tunnels by installing cameras linked to the Traffic Operations Center (TOC)Add motion sensors to fences.

60
Table B7. Suggested countermeasures for asset S8
Install security sytems with video capability at all DOT facilities X X
X X X
X X
X
X
X X
X
X
X
Train all DOT personnel to be more observant of their surroundings and potentially dangerous packages, boxes, people, etc.Improve lightingIncrease surveillance at tunnels by installing cameras linked to the Traffic Operations Center (TOC)Add motion sensors to fences.
Lock all access gates and install remote controlled gates where necessary.Develop and implement a department-wide security policy.Limit access to all buildings through the issuance of a security badge with specific accesses identified and controlled through the card.
Protect ventilation intakes with barriersInstall and protect ventilation emergency shut off systems.Install Mylar sheeting on inside of windows to protect employees from flying glass in case of an explosion
Place a full-time security officer in a guard shack to control access.
Increase inspection efforts aimed at identifying potential explosive devices as well as increased of suspecious potential criminal activityInstitute full-time surveillance at the most critical assets where alternate routes are limited or have been identifiedEliminate parking under any of the most critical type bridges. Elimination of the parking can be accomplished through the use of concrete barriers.Place barriers in such a way as to eliminate ease of access where a vehicle could be driven right up to the asset
POTENTIAL COUNTERMEASURES
DET
ER
DET
ECT
DEF
END

61
Figure B1. Evaluation form used to acquire workshop participant feedback
Alabama Highway Infrastructure Security Workshop Evaluation Form Participant SurveyDay One ____________ Day Two ____________
1. Did you feel this workshop satisfactorily defined critical highway infrastructure?
1 2 3 4 5Strongly Agree Agree N/A Disagree
Strongly Disagree
2. Did you feel this workshop satisfactorily explained how to determine Vulnerability of critical highway infrastructure?
1 2 3 4 5Strongly Agree Agree N/A Disagree
Strongly Disagree
3. Did you feel this workshop satisfactorily explained how to determine the consequence of the threats to and vulnerabilities of those assets?
1 2 3 4 5Strongly Agree Agree N/A Disagree
Strongly Disagree
4. Did you feel this workshop satisfactorily give you an understanding of how to prioritize work toprovide security to highway infrastructure?
1 2 3 4 5Strongly Agree Agree N/A Disagree
Strongly Disagree
5. Do you feel this workshop satisfactorily explained how to reduce vulnerabilities and mitigate consequences by means of counter measures?
1 2 3 4 5Strongly Agree Agree N/A Disagree
Strongly Disagree
6. Do you feel this workshop satisfactorily explained the information essential for the development of operations security plans to mitigate the consequences?
1 2 3 4 5Strongly Agree Agree N/A Disagree
Strongly Disagree


![Risk Assessment Methodology for Critical Infrastructure ...publications.jrc.ec.europa.eu/repository/bitstream/... · critical infrastructures ([12]). Researchers have pursued two](https://img.pdfslide.us/doc/110x75/5f22d1ca111a033be662b992/risk-assessment-methodology-for-critical-infrastructure-critical-infrastructures.jpg)