Embed Size (px)
Citation preview

Methodology for creating nonaxisymmetric WECs to screen mooring designs using a Morison
Equation approach Diana Bull and Paul Jacob
Oceans 2012
SAND2012-8767C

Contents
• Introductions
• WEC mooring systems
• Backward Bent Duct Buoy (BBDB) discretization method
• Case study – Results for BBDB idealization
– Example mooring system assessment
– Parametric study to test robustness of analysis procedure
2

Sandia Water Power Overview
Unique Capabilities • SEAWOLF laboratory/field oscillatory-flow
sediment transport testing
• Sandia Lake Facility – potential for large scale wave testing
• Ability to leverage defense spending on fundamental sciences: controls, hydrodynamics, aerodynamics, experimentation, etc.
Technology Assessment: Reference Model Project
Goal: obtain baseline Cost Of Energy (COE) estimates for a variety of Marine Hydro-Kinetic (MHK) devices.
Technology Development: Modeling Tools & Advanced Materials
Modeling Tools: predict power performance of MHK devices
Advanced Materials: evaluate new corrosion resistant and antifouling material coatings
Market Acceleration: Environmental Impact
SNL-EFDC: MHK –capable environmental circulation and array performance code
SNL-SWAN: tool to evaluate environmental effects of WEC arrays
San Francisco Bay – water residence time analysis
Sandia Lake Facility
OWC Dynamic Analysis
3

• Based in Houston Texas • Joint US Agents for Orcina (OrcaFlex since
2009) • Prior to 2009 Agent for Orcina with Third
Party • Participated in design of mooring systems
for wave energy converters that are currently in service
• Other offshore experience in petroleum industry for deign of riser and mooring systems
• Licensed professional engineer in Texas and United Kingdom
4
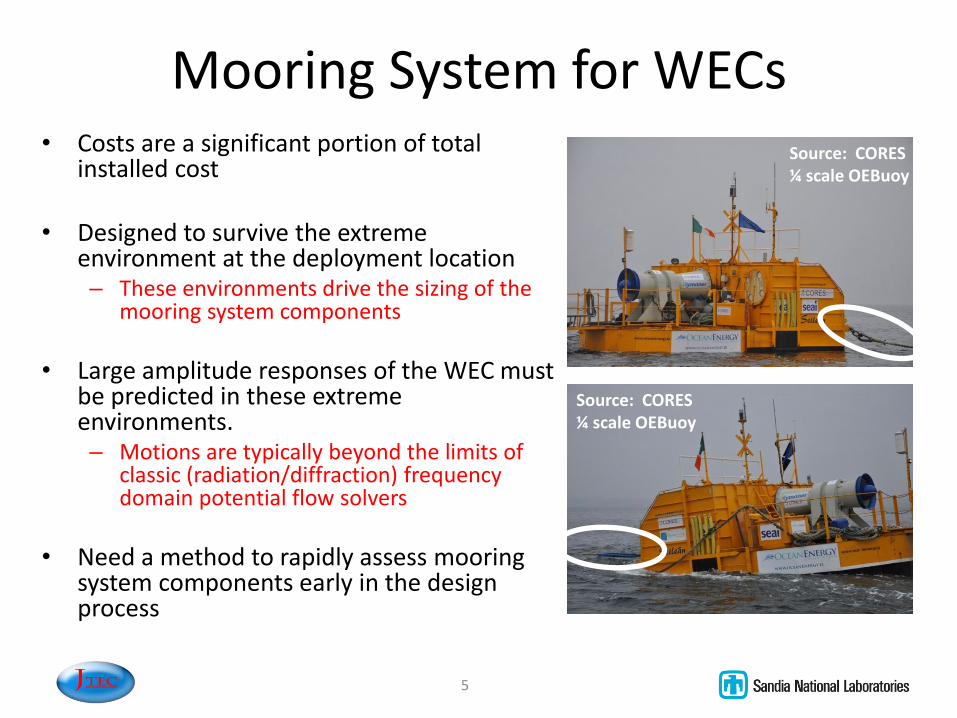
Mooring System for WECs • Costs are a significant portion of total
installed cost
• Designed to survive the extreme environment at the deployment location – These environments drive the sizing of the
mooring system components
• Large amplitude responses of the WEC must be predicted in these extreme environments. – Motions are typically beyond the limits of
classic (radiation/diffraction) frequency domain potential flow solvers
• Need a method to rapidly assess mooring system components early in the design process
Source: CORES ¼ scale OEBuoy
5
Source: CORES ¼ scale OEBuoy

Morison Equation to Evaluate WEC Motions
• Appropriate wave-force calculation methods are specified through comparison of – The diffraction parameter :
– The wave height (H) to characteristic length ratio:
• Morison Equation should be used
when is small and is large
6
𝐻
𝐿∝𝐾𝐶
𝜋
𝜋𝐿
𝜆
𝜋𝐿
𝜆
𝐻
𝐿∝𝐾𝐶
𝜋
Morsion Eq.
Froude-Krylov Diffraction
Chakrabarti, S.K. Hydrodynamics of Offshore Structures Vertical Cylinder: wave-force calculations
𝜋𝐿
𝜆
𝐻
𝐿
Definitions
• L: Structures characteristic length
• l: wavelength
• KC: Keulegan Carpenter No
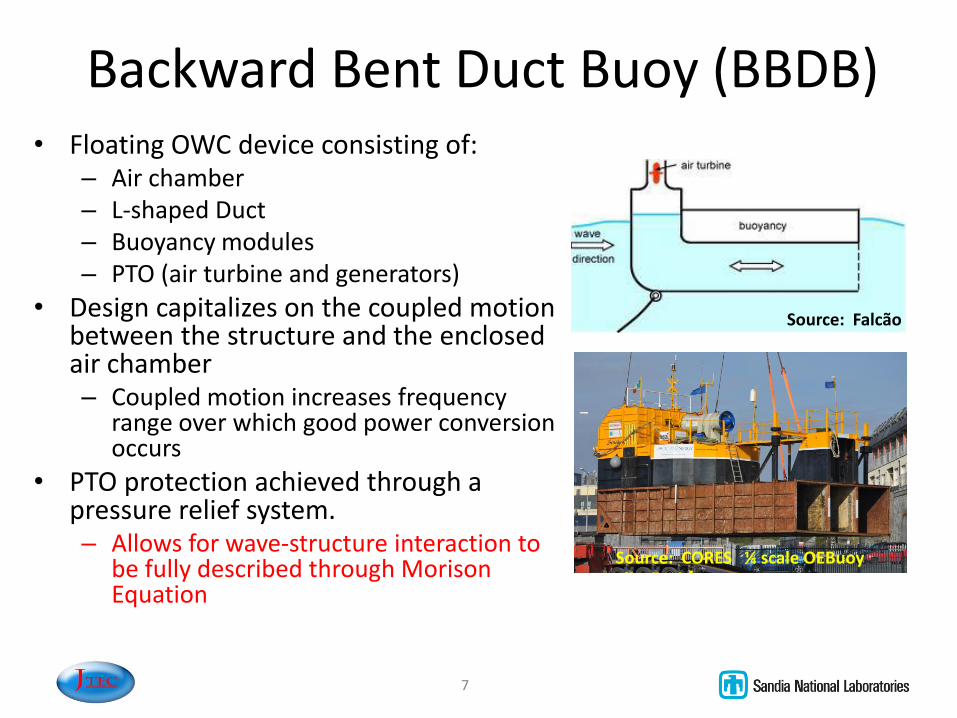
Backward Bent Duct Buoy (BBDB) • Floating OWC device consisting of:
– Air chamber – L-shaped Duct – Buoyancy modules – PTO (air turbine and generators)
• Design capitalizes on the coupled motion between the structure and the enclosed air chamber – Coupled motion increases frequency
range over which good power conversion occurs
• PTO protection achieved through a pressure relief system. – Allows for wave-structure interaction to
be fully described through Morison Equation
Source: CORES ¼ scale OEBuoy
Source: Falcão
7
Modeling Tool
• OrcaFlex used to model BBDB response
– 3D time domain solution of equations of motion for bodies subjected to hydrodynamic loads
– Hydrodynamic loads calculated using extended formulation of Morison’s equation
• BBDB treated as a rigid body
– Modeling methodology needs to capture hydrodynamic loads in the three translational and three rotational degrees of freedom
8

Discretization Methodology • Model developed using an array of 6-
DOF discrete bodies to capture – Buoyancy distribution – Device free flooding for the time-
dependent variation of entrained water mass
– Hydrodynamic characteristics that account for inertial and viscous effects
• Separate discrete bodies for each effect
• The array of lumped bodies is then attached to a reference body that acts as the integrand of the loading effects
• Rotational response is controlled by distribution and density of discrete bodies
9

Structural and Buoyancy Bodies
10
Structural mass and inertia prescribed at center of mass
Buoyancy distribution captured by array of discrete volumes – no other properties
𝐵𝑧 = 𝜌𝑔𝑉𝑗𝑁𝑗=1 (1)
𝑀𝐵𝑥 = 𝜌𝑔𝑉𝑗 𝑥𝑗 𝑁𝑗=1 (2)
𝑀𝐵𝑦 = 𝜌𝑔𝑉𝑗 𝑦𝑗 𝑁𝑗=1 (3)
𝜌𝑔𝑉𝑗
𝐵𝑧
𝑀𝐵𝑥
𝑀𝐵𝑦
X Y
Z

Freely Flooding Bodies
• Free flooding bodies
– Massless with no hydrodynamic loads
– Water volume defined by relative position to water plane
– Captures spatial and temporal variation in free surface elevation
11

Hydrodynamic bodies
• Hydrodynamic bodies – Three sets to represent
• X direction -> Y-Z Plane
• Y direction -> X-Z Plane
• Z direction -> X-Y Plane
– Distribution of bodies readily captures rotational response
– Discrete body properties • Prescribed added mass
• Plane area and drag coefficient
12
X
Y
Z
Z
Y
X

Extended Morison’s Equation Formulation
13
For each discrete body
Inertia force due to
fluid acceleration
relative to earth
Inertia force due to
discrete body
motion in water
Drag force due to
relative motion of
body in water
dded mass term
t at is res ri ed ex li itl in t is ase for dis rete od
lane area for
dis rete od
ra oeffi ient for
dis rete od
It is important to investigate impact of drag and added mass parameters on mooring components in lieu of test data to calibrate
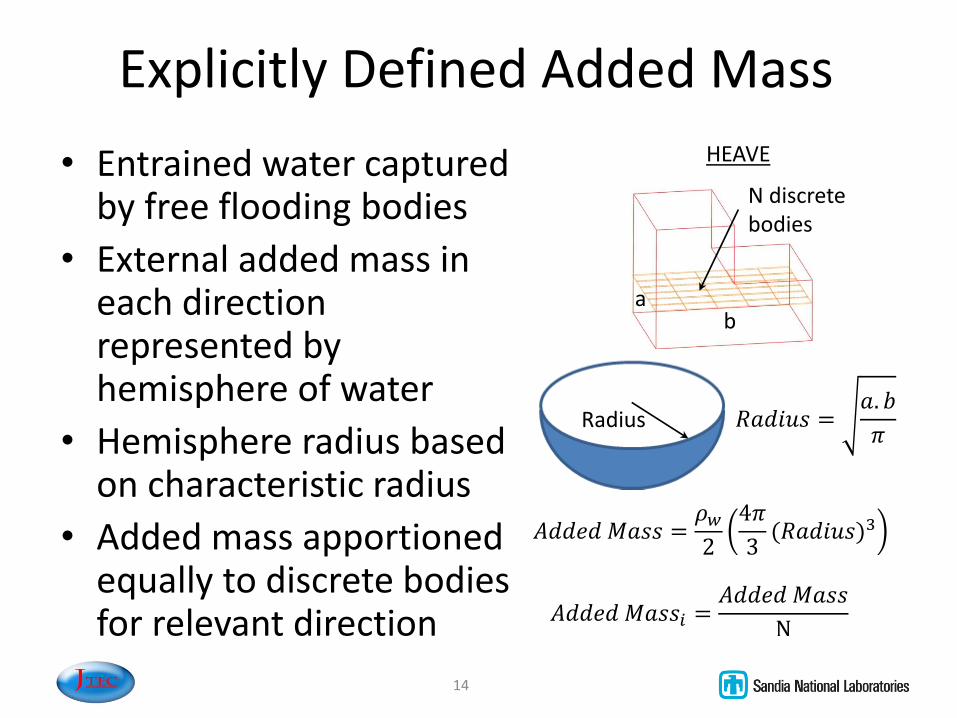
Explicitly Defined Added Mass
14
• Entrained water captured by free flooding bodies
• External added mass in each direction represented by hemisphere of water
• Hemisphere radius based on characteristic radius
• Added mass apportioned equally to discrete bodies for relevant direction
a b
N discrete bodies
Radius
HEAVE

Heave Drag Coefficient
Hydrodynamics of Damping Plates at Small KC Numbers. He, H., Troesch, W., Perlin, M.. Symposium on Fluid-Structure Interaction in Ocean Engineering. 2008.
15
• First estimate is to assume device is perfect wave follower – BBDB heave will be on the
order of the wave height
• A drag factor based on steady state motion is not valid
• KC number is low so drag coefficient is higher than steady state cases (something of order of 5)

Surge & Sway Drag Coefficients
16
• First estimate is to again assume device is perfect wave follower – Parallel to wave direction: device would oscillate
according to water particle kinematics, e.g. ½ the environment wavelength
– Perpendicular to wave direction: device is considered static
• KC number will be large parallel to the wave direction because the wavelength is large – Large KC numbers result in lower drag coefficients
• A small drag factor is valid for both directions due to large KC number (i.e., something of order of 1.2 to 2.0)

Reference Body
• All discrete bodies are attached to reference body
• Reference body has no mass, buoyancy or drag characteristics
• Resultant forces from discrete bodies are summed up at reference – Translational forces sum directly
– Product of translational forces and position relative to reference body generate applied moments
• Resultant forces are summed up in every time step of calculation
17

Case Study to Test Modeling Methodology
18

Discretization Verification— Physical Design
BBDB structural properties defined from solid model.
X
Z
35
27.5
Stern
Buoyancy
Chamber 22.5
8.5
2.7
14
12.75
8.5
17.5
8.75
17.5
Still Water
Level
Bow
Bu
oyan
cy C
ham
ber
COB COG
19
Structural Mass [kg] 2056940
Front Buoyancy [m3] 802
Aft Buoyancy [m3] 1205
Entrained Water [m3] 14884
COG (x,y,z) [m] 5.05 0.00 –4.74
COB (x,y,z) [m] 5.05 0.00 –3.27
Inertia at COG
[kg•m2)
x 3.4×108 0.0 0.0
Y 0.0 4.4×10⁸ 0.0
Z 0.0 0.0 4.5×10⁸
Characteristic Length 35[m]

Discretization Verification—Displacement Tests
• Displace structure with unit heave in still water (in OrcaFlex)
• Record heave displacement • Post process signal to obtain
natural period • Compare natural period to
predicted value from diffraction program
• Comparison valid – small motion relative to body size
• Coupled heave pitch response captured
• Repeat for pitch and roll
20
OrcaFlex Heave Natural Period 18.3 sec Potential Flow Heave Natural Period 16.1 sec

NDBC 46022 630[m]
Example Extreme Environment
Northern California: Humboldt County
21
Prevailing Environment
Extreme Environment
Depth (h) 59.6[m]
Spectral Parameters
Significant Wave Height 11.22[m]
Peak Period 17.26[sec]
JONSWAP or Bretschneider
Monochromatic Equivalent
Wave Height 21.3[m]
Period (T) 17[sec]
Wave Type 5th order Dean Steam
Wind
100-yr Wind at 10[m] above SWL
29.6[m/s]
Wind Profile constant
Current 10-yr Surface Current 0.33[m/s]
Current Profile Linear decrease to zero
a elen t
iffra tion arameter
a e ei t to len t ratio
Small
Large
Meets idealization criteria

Mooring System Layout
22
Operating Environment
Extreme Environment
Fwd Starboard Mooring Line
Fwd Port Mooring Line
Aft Mooring Line
Mooring Line Forward Aft
Total Length [m] 810 810 200
12 Plait Polyester [m] 45 45 45
R4 Studlink Chain [m] 765 765 155
Hangoff Angle [deg] 122.8 122.8 113.9
Pre Tension [kN] 110.4 110.4 18.4
Compliance added to aft mooring line with 4Te buoyancy module and 1Te sinker weight

Mooring Performance • Run regular wave conditions (10 cycles to obtain steady state
response) • Extract peak mooring line tensions and calculate design factor of
safety • Factors of safety – peak load 2089kN
– Chain FOS 1.74 – Polyester Rope FOS 2.75
• Compression in stern mooring line • Results are for single set of drag/added mass parameters • Test robustness by parametric study
23

Parametric Study on Drag Coefficient
test
CD Specification Peak Load-Port
Heave Surge Sway [kN]
1 5.0 1.2 1.2 2089
2 2.5 1.2 1.2 2651
3 7.5 1.2 1.2 1940
4 5.0 2.5 1.2 3267
5 5.0 5.0 1.2 4894
6 5.0 1.2 2.5 3317
7 5.0 1.2 5.0 4383
8 5.0 2.5 2.5 4311
9 7.5 5.0 5.0 7149
• Varied Heave Drag
• Varied Surge Drag
• Varied Sway Drag
• Combined extremes of parameters
Influence of drag coefficients on mooring components Surge or
Sway Drag
Coefficient
Anchor
Weight
R4 Studlink
Chain
Diameter
-- Te mm
1 1.2 5 58
4/6 2.5 8 70
5/7 5.0 11 81
test
Test 1 is baseline
Conclusions
• Morison’s equation idealization ro edure is limited to applicability i.e., WEC geometry relative to environment
• If applicable: – Straight forward and robust – Can be used to quickly assess mooring system configuration and
sizing of components – Simple analysis procedure caters for easy revision to mooring
system
• Method can be used to test system response to variation in drag and added mass parameters
• Case study illustrates sensitivity of system response to assumed/theoretical drag and added mass parameters
• Method can be extend to calibration with test data as/when this becomes available 25

Sandia National Laboratories is a multiprogram laboratory managed and operated by Sandia Corporation, a wholly owned subsidiary of Lockheed Martin Corporation, for the U.S. Department of Ener ’s National Nuclear Security Administration under contract DE-AC04-94AL85000.
This research was made possible by support from the Department of Ener ’s Energy Efficiency and Renewable Energy Offi e’s Wind and Water Power Program. The research was in support of the Reference Model Project.


![Ken B. Henisey arXiv:1211.2273v2 [astro-ph.HE] 14 Nov 2012Variability from Nonaxisymmetric Fluctuations Interacting with Standing Shocks in Tilted Black Hole Accretion Disks Ken B](https://img.pdfslide.us/doc/110x75/60aeeb2336d56c21f9556ad0/ken-b-henisey-arxiv12112273v2-astro-phhe-14-nov-2012-variability-from-nonaxisymmetric.jpg)