Embed Size (px)
Citation preview
University of Wollongong Thesis Collections
University of Wollongong Thesis Collection
University of Wollongong Year
Methodology for assessment of
serviceability of aged transmission line
conductors
Gary Francis BrennanUniversity of Wollongong
Brennan, Gary Francis, Methodology for assessment of serviceability of aged transmis-sion line conductors, Master of Engineering (Hons.) thesis, Department of MechanicalEngineering, University of Wollongong, 1989. http://ro.uow.edu.au/theses/2520
This paper is posted at Research Online.

METHODOLOGY FOR ASSESSMENT OF SERVICEABILITY OF AGED
TRANSMISSION LINE CONDUCTORS
A thesis submitted in fulfilment of the requirements for the award of the degree
MASTER OF ENGINEERING (HONOURS)
from
THE UNIVERSITY OF WOLLONGONG
by
GARY FRANCIS BRENNAN B.E. (HONS)
UNHVERSITY OP WOLLONGONG
LIBRARY
DEPARTMENT OF MECHANICAL ENGINEERING
1989

11
I hereby declare that I have not submitted this material either in whole or in part, for a degree at this or any other institution. Whilst this thesis has been prepared with the proper care, the information, advice, opinion and recommendations contained herein are offered, I accept no responsibility for the use of the information in any particular application.
GARY BRENNAN
30 NOVEMBER, 1989
3 0009 02907 6226

Ill
ABSTRACT
The degradation of transmission line conductors is attributed to
annealing, fatigue, corrosion, creep and in the case of an ACSR
construction, stress redistribution in the aluminium and steel wires. A
methodology for monitoring and testing for the degradation mechanisms is
presented. Simple life expectancy models presented, give confidence in
the long term serviceability of conductors.
The methodology and life expectancy models developed are based on
examining and testing conductor samples that are representative of various
stages of each of the degradation mechanisms. The conductor samples were
removed from in service transmission lines that had over twenty years
service experience.
IV
ACKNOWLEDGEMENTS
The author wishes to thank the Department of Mechanical Engineering,
University of Wollongong, MM Metals and The Electricity Commission of NSW
for initially providing the opportunity to research and develop the
subject material, creating an environment and atmosphere in which it was a
pleasure and privilege to work and the continued support by funding and
providing the facilities to carry out the work.
The most sincere thanks are directed to Dr. A. Gouch, Mr. P. Flanagan, Dr.
A. Basu, Dr. P. Arnold and Dr. W. Plumbridge for their continuous
supervision and interest in the project. Their encouragement, guidance
and endless patience during the course of the studies was greatly
appreciated.
The author is indebted to Mr F. Van Eimeren for the preparation of all the
conductor samples and assistance during the course of the work. An
appreciation is extended to Mr J. Maliphant for the scanning election
micrographs.
Thanks are also due to my colleagues on the Australian Standards Committee
EL/10/1 - Conductors, for their continued interest and encouragement.
I owe a debt of gratitude to Wendy Douglas, Debbie Annetts, Gary Harris
and Harry Allen for the cheerful and patient way they carried out the
typing and associated drafting for the thesis. A thank you is also
extended to David Guille, for his support during the final stages of the
preparation of the thesis.
And finally, I would like to take the opportunity to express my deep
gratitude to my wife Cheryle, for her support, encouragement and
forebearance during the period of these studies. A special thanks also
goes to my daughter, Sarah-Ann, for her cheerful smiles during difficult
times.
TABLE OF CONTENTS PAGE
TITLE PAGE
STATEMENT OF SOURCE AND DISCLAIMER
ABSTRACT
ACKNOWLEDGEMENTS
TABLE OF CONTENTS
LIST OF ABBREVIATIONS
LIST OF TABLES
LIST OF FIGURES
LIST OF PLATES
LIST OF SYMBOLS
INTRODUCTION
11
iii
iv
V
xiii
xiv
xxiv
xxiv
xxviii
xxxvi
CHAPTER ONE REVIEW OF THE LITERATURE
1.1 INTRODUCTION
1.2 CONDUCTOR TENSION AND SAG PROPERTIES
1.2.1 H.B. Dwight 1926
1.2.2 D.O. Ehrenburg 1934
1.2.3 CO. Boyse and N.G. Simpson 1944
1.2.4 M. Landau 1951
1.2.5 C.A. Jordan 1952
1.2.6 B.M. Pickens 1959
1.2.7 P.F. Winkleman 1960
1.2.8 J. Barrien 1975
1.2.9 G.R. Boal 1977
2
3
4
5
6
8
9
11
12

VI
1.2.10 J. Bradbury, G.F. Kuska and D.J. Tarr 1982 13
1.2.11 J.S. Barrett, S. Dutta and 0. Nigol 1983 14
1.2.12 Future Developments 15
1.3 CONDUCTOR MECHANICAL PROPERTIES
1.3.1 G.W. Stickley 1932 16
1.3.2 E. Fritz 1960 17
1.3.3 J.B. Roche and E. Dziedzic 1968 18
1.3.4 J.R. Harvey 1969 19
1.3.5 J.R. Harvey and R.E. Larson 1970 21
1.3.6 Y. Nakayama and T. Kojima 1970 22
1.3.7 J.R. Harvey 1972 23
1.3.8 J. Bradbury, P. Dey, G. Orawski and K.H. Pickup 1975 24
1.3.9 V.T. Morgan 1979 25
1.3.10 0. Nigol and J.S. Barrett 1981 27
1.3.11 J.S. Barrett, P. Ralston and 0. Nigol 1982 28
1.3.12 Future Developments 30
1.4 CONDUCTOR CORROSION RESISTANCE PROPERTIES
1.4.1 J.S. Forrest and J.M. Ward 1954 31
1.4.2 R.D. Carter (undated) 33
1.4.3 J.R. Booker 1986 35
1.4.4 B.J. Maddock, J.G. Allnutt, J.M. Ferguson, K.G. Lewis, D.A. Swift, P.W. Teare and M.J. Tunstall 1986 36
1.4.5 Future Developments 37
1.5 CONDUCTOR FATIGUE PROPERTIES
1.5.1 J.C. Little, D.G. MacMullan and J.V. Majercak 1950 38
1.5.2 J.S. Tompkins, L.L. Merrill and B. L. Jones 1956 39

Vll
1.5.3 R.F. Steidel, Jr 1959 40
1.5.4 M.B. Elton, A.R. Hard and A.H. Shealy 1959 41
1.5.5 J.C. Poffenberger and R.L. Swart 1965 43
1.5.6 W.G. Fricke, Jr and C.B. Rawlins 1968 43
1.5.7 R. Claren and G. Diana 1969 44
1.5.8 R.A. Carter and D.G. Quick 1979 45
1.5.9 A.S. Richardson, Jr and F.S. Smith 1981 46
1.5.10 W. Philipps, W. Carlshem and W. Buckner (Prior 1985) 47
1.5.11 T.V. Gopalan 1985 50
1.5.12 W.F. Buckner, R. Holm and K.G. Papailiou 1986 51
1.5.13 Future Developments 52
CHAPTER TWO CONDUCTOR TENSION
2.1 INTRODUCTION 54
2.2 FUNDAMENTAL THEORY 56
2.2.1 Vertical Conductor Sag 58
2.2.2 Conductor Tension 63
2.2.2.1 Conductor Horizontal Tension 70
2.2.2.2 Average Conductor Tension 71
2.2.2.3 Conductor Span Length 72
2.2.2.4 Conductor Physical Parameters 78
2.2.2.5 Conductor Temperature 82
2.2.3 Sag Tension Evaluation by Strain Summation (STESS) 84
2.2.3.1 Thermal Strain 85
2.2.3.2 Slack 87
2.2.3.3 Elastic Strain 87
2.2.3.4 Creep Strain 87

Vlll
2.2.3.5 Settling Strain 88
2.2.2.6 Other Features of STRESS 89
2.3 CONDUCTOR SAG MEASUREMENT THEORY 89
2.3.1 Tangent Observation Method 90
2.3.2 Satellite Observation Method 93
2.3.3 Conductor Temperature Measurement 97
2.3.4 Systematic Errors 98
2.4 TRANSMISSION LINE SAMPLES 103
2.5 CONDUCTOR SAG TENSION MEASUREMENTS 107
2.5.1 Summary of Results 107
2.5.2 Conductor Permanent Elongation 108
2.5.3 Conductor Clearance Margin 113
2.6 CONCLUSION 114
CHAPTER THREE MECHANICAL PROPERTIES OF AGED CONDUCTORS
3.1 INTRODUCTION 116
3.2 TRANSMISSION LINE CONDUCTOR SAMPLES 121
3.2.1 Conductor Removal 123
3.3 METALLOGRAPHIC EXAMINATION 126
3.3.1 Macroexamination 126
3.3.2 Microexamination 135

IX
3.4 MECHANICAL TESTS 140
3.4.1 Wire Tests 140
3.4.1.1 Cross Section Area 146
3.4.1.2 Mechanical Properties 152
3.4.1.3 Electrical Properties 167
3.4.1.4 Steel Wire Galvanizing Properties 173
3.4.2 Conductor Tests 188
3.4.2.1 Stress Strain 190
3.4.2.2 Coefficient of Linear Expansion 208
3.4.2.3 Creep 217
3.4.2.4 Breaking Load 233
3.4.2.5 Lay Ratio 241
3.5 CHEMICAL TESTS 248
3.5.1 Material Composition 250
3.5.2 Grease/Tar Drop Point 253
3.5.3 Grease/Tar Mass 256
3.6 METHODOLOGY FOR TESTING AGED CONDUCTORS 257
3.6.1 Corrosion , 259
3.6.2 Fatigue 261
3.6.3 Annealing 264
3.6.4 Creep 269
3.6.5 Electrical 269
3.6.6 Mechanical 271
3.6.7 Stress Distribution Degradation 272

X
3.7 CONCLUSION 273
3.7.1 Avon Kemps Creek Transmission Line 277
3.7.2 Dapto Springhill Transmission Line 279
3.7.3 Tomago Taree Transmission Line 280
3.7.4 Bellarabi Heathcote Transmission Line 281
CHAPTER 4 CONDUCTOR FATIGUE
4.1 INTRODUCTION 282
4.2 FUNDAMENTAL VIBRATION THEORY 283
4.2.1 Aeolian Vibration 283
4.2.2 Wind Velocity Conductor Amplitude Relationship 287
4.2.3 Wind Velocity and Dynamic Stress Relationship 291
4.2.4 Conductor Displacement and Dynamic Stress Relationship 295
4.2.5 Conductor Statis Load Stress 296
4.3 FATIGUE CHARACTERISTICS OF CONDUCTORS 297
4.3.1 Fatigue Properties of Aluminium 297
4.3.2 Conductor Fatigue Mechanism 299
4.3.3 Cumulative Damage Theory 303
4.4 FATIGUE TESTS 308
4.4.1 Test Apparatus 308
4.4.2 Instrumentation 313
4.3.2.1 Wire Break Detection 313
4.3.2.2 Conductor Amplitude Detection 315
4.3.2.3 Conductor Frequency 317
4.3.2.4 Data Logging 319

XI
4.4.3 Test Program 319
4.4.4 Test Results 321
4.5 CONCLUSION 321
APPENDIX ONE REFERENCES 324
APPENDIX TWO SAG TENSION TEST RESULTS 332
A2.1 Survey and Calculated Datum 332
A2.1.1 Avon Kemps Creek Transmission Line 332
A2.1,2 Dapto Springhill Transmission Line 332
APPENDIX THREE AGED CONDUCTORS MECHANICAL PROPERTIES TEST RESULTS 340A
A3.1 METALLOGRAPHIC EXAMINATION 340A
A3.1.1 MACROEXAMINATION 340A
A3.1.1.1 Avon Kemps Creek Transmission Line 340A
A3.1.1.2 Dapto Springhill Transmission Line 342
A3.1.1.3 Tomago Taree Transmission Line 342
A3.1.1.4 Bellambi Heathcote Transmission Line 344
A3.1.2 MICROEXAMINATION 345
A3.2 WIRE TESTS 346
A3.2.1 Cross Section Area 346
A3.2.2 Mechanical Properties 346
A3.2.3 Electrical Properties 347
A3.2.4 Galvanized Steel Zinc Coating Mass 347
A3.2.5 Galvanized Steel Wire Wrap Tests 347
A3.3 CONDUCTOR TESTS 348
A3.3.1 Stress Strain 348
A3.3.2 Coefficient of Linear Expansion 349

Xll
A3.3.3 Creep 350
A3.3.4 Breaking Load 351
A3.3.5 Lay Lengths 351
A3.4 CHEMICAL TESTS 352
APPENDIX FOUR CONDUCTOR FATIGUE TEST RESULTS 428
XI11
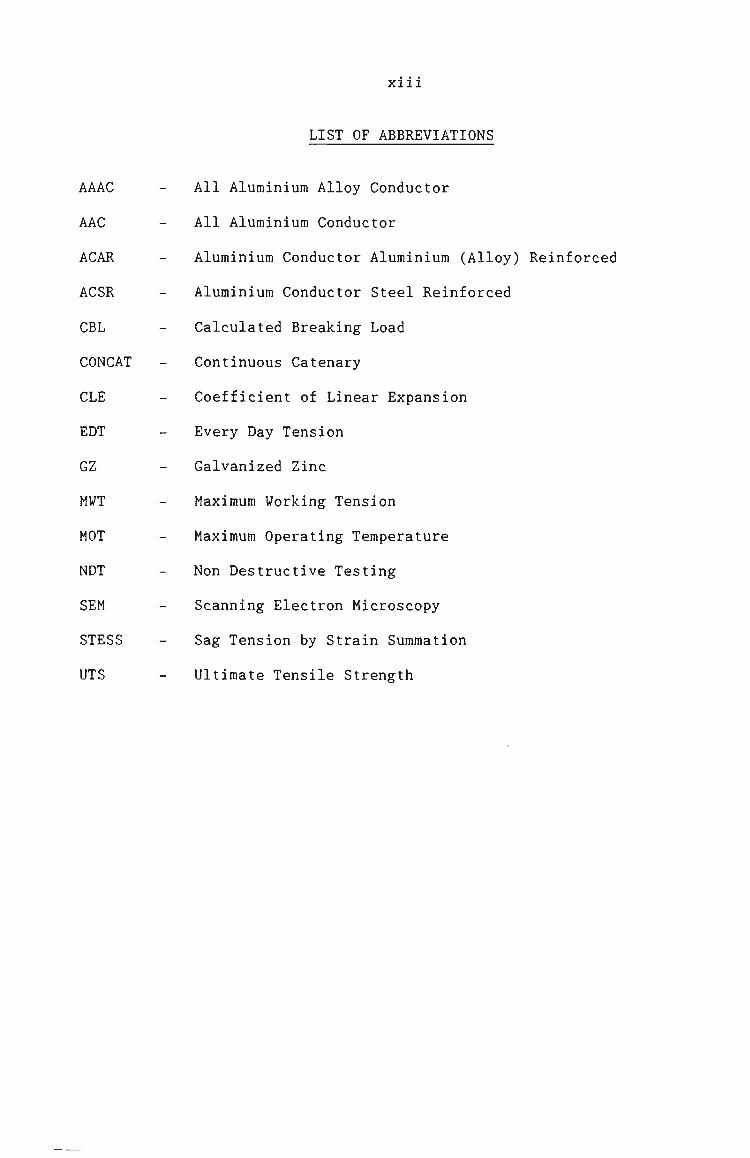
LIST OF ABBREVIATIONS
AAAC
kkC
AGAR
ACSR
CBL
CONCAT
CLE
EDT
GZ
MWT
MOT
NDT
SEM
STESS
UTS
All Aluminium Alloy Conductor
All Aluminium Conductor
Aluminium Conductor Aluminium (Alloy) Reinforced
Aluminium Conductor Steel Reinforced
Calculated Breaking Load
Continuous Catenary
Coefficient of Linear Expansion
Every Day Tension
Galvanized Zinc
Maximum Working Tension
Maximum Operating Temperature
Non Destructive Testing
Scanning Electron Microscopy
Sag Tension by Strain Summation
Ultimate Tensile Strength
xiv
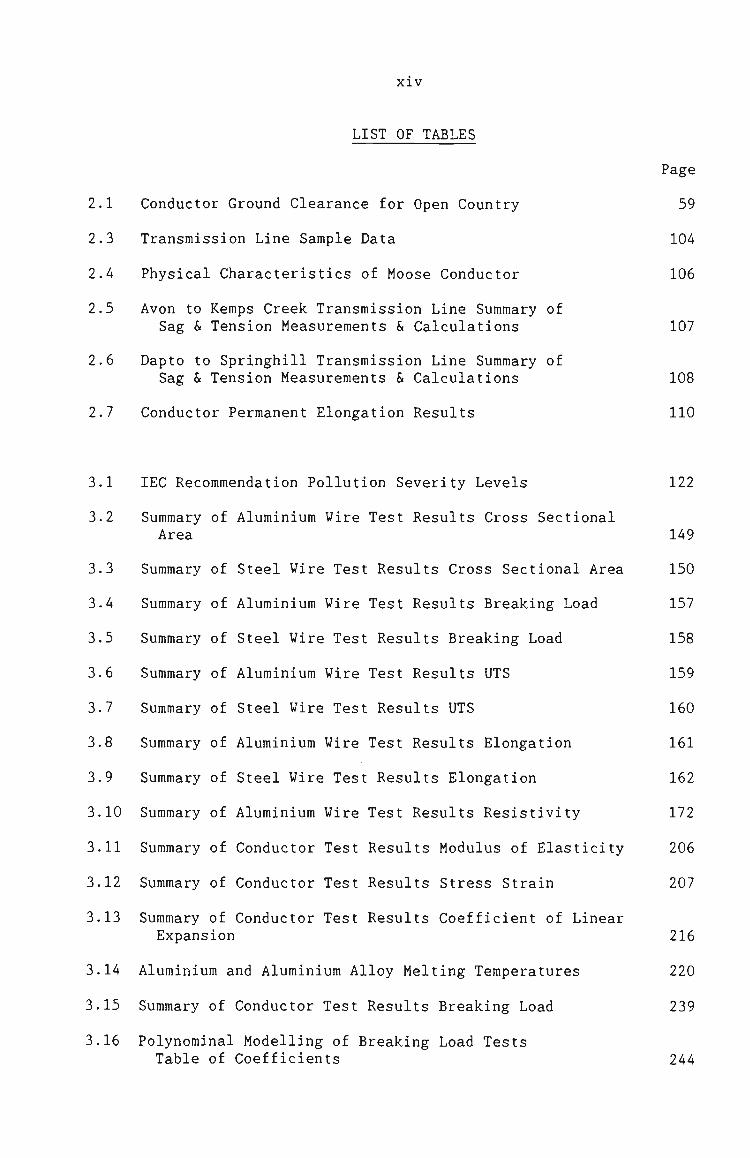
LIST OF TABLES
Page
2.1 Conductor Ground Clearance for Open Country 59
2.3 Transmission Line Sample Data 104
2.4 Physical Characteristics of Moose Conductor 106
2.5 Avon to Kemps Creek Transmission Line Summary of
Sag & Tension Measurements & Calculations 107
2.6 Dapto to Springhill Transmission Line Summary of Sag & Tension Measurements & Calculations 108
2.7 Conductor Permanent Elongation Results 110
3.1 lEC Recommendation Pollution Severity Levels 122
3.2 Summary of Aluminium Wire Test Results Cross Sectional
Area 149
3.3 Summary of Steel Wire Test Results Cross Sectional Area 150
3.4 Summary of Aluminium Wire Test Results Breaking Load 157
3.5 Summary of Steel Wire Test Results Breaking Load 158
3.6 Summary of Aluminium Wire Test Results UTS 159
3.7 Summary of Steel Wire Test Results UTS 160
3.8 Summary of Aluminium Wire Test Results Elongation 161
3.9 Summary of Steel Wire Test Results Elongation 162
3.10 Summary of Aluminium Wire Test Results Resistivity 172
3.11 Summary of Conductor Test Results Modulus of Elasticity 206
3.12 Summary of Conductor Test Results Stress Strain 207
3.13 Summary of Conductor Test Results Coefficient of Linear
Expansion 216
3.14 Aluminium and Aluminium Alloy Melting Temperatures 220
3.15 Summary of Conductor Test Results Breaking Load 239
3.16 Polynominal Modelling of Breaking Load Tests
Table of Coefficients 244

XV
LIST OF TABLES (CONT)
Page
3.17 Summary of Conductor Test Results Lay Ratio 249
3.18 Chemical Composite Limits of Aluminium and Aluminium Alloys 251
3.19 Summary of Chemical Test Results, Corrosion Protection Material Drop Point and Mass and Maximum Design Operating Temperature 255
3.20 Typical Grease Mass in Conductors 258
4.1 Transmission Line Conductor Flexural Rigidity 294
4.2 Summary of Fatigue Test Results Nepture 19/3.25 mm AAC 321
A3.1 Cross sectional area Avon to Kemps Creek TL 368
A3.2 Cross sectional area Dapto to Springhill TL 369
A3.3 Cross sectional area Tomago to Taree TL 370
A3.4 Cross sectional area Bellambi to Heathcote TL 371
A3.5 Mechanical Properties Avon to Kemps Creek TL 372
A3.6 Mechanical Properties Dapto to Springhill TL 373
A3.7 Mechanical Properties Tomago to Taree TL 374
A3.8 Mechanical Properties Bellambi to Heathcote TL 375
A3.9 Electrical Properties Avon to Kemps Creek TL 376
A3.10 Electrical Properties Dapto to Springhill TL 377
A3.11 Electrical Properties Tomago to Taree TL 378
A3.12 Electrical Properties Bellarabi to Heathcote TL 379
A3.13 Zinc Coating Mass Avon to Kemps Creek TL 380
A3.14 Zinc Coating Mass Dapto to Springhill TL 380
A3.15 Zinc Coating Mass Tomago to Taree TL 381

XVI
LIST OF TABLES (CONT)
Page
A3.16 Zinc Coating Mass Bellambi to Heathcote TL 381
A3.17 Stress Strain Test No. 52 Test Result Data
Tomago to Taree TL 385
A3.18 Stress Strain Test No. 53 Test Result Data Tomago to Taree TL 389
A3.19 Stress Strain Test No. 61 Test Result Data Dapto to Springhill TL 393
A3.20 Stress Strain Test No. 62 Test Result Data Avon to Kemps Creek TL 397
A3.21 Coefficient of Linear Expansion Test No. 43 Test Result Data Tomago to Taree TL 399
A3.22 Coefficient of Linear Expansion Test No. 44 Test Result Data Tomago to Taree TL 401
A3.23 Coefficient of Linear Expansion Test No. 50 Test Result Data Dapto to Springhill TL 403
A3.24 Coefficient of Linear Expansion Test No. 52 Test Result Data Avon to Kemps Creek TL 405
A3.25 Conductor Creep Test Result Data Avon to Kemps Creek TL 408
A3.26 Conductor Creep Test Result Data Dapto to Springhill TL 411
A3.27 Breaking Load Test No. 163 Test Result Data Tomago to Taree TL 414
A3.28 Breaking Load Test No. 164 Test Result Data Tomago to Taree TL 416
A3.29 Breaking Load Test No. 205 Test Result Data Avon to Kemps Creek TL 418

X V l l
LIST OF TABLES (CONT)
Page
A3,30 Breaking Load Test No. 206 Test Result Data Avon to Kemps Creek TL 420
A3.31 Breaking Load Test No. 207 Test Result Data Dapto to Springhill TL 422
A3.32 Breaking Load Test No. 208 Test Result Data
Dapto to Springhill TL 424
A3.33 Lay Length Dapto to Springhill TL 425
A3.34 Lay Length Avon to Kemps Creek TL 425
A3.35 Chemical Test Test Result Data Tomago to Taree TL 426
A3.36 Chemical Test Test Result Data Bellambi to Heathcote TL 426
A3.37 Chemical Test Test Result Data Avon to Kemps Creek TL 427
A3.38 Chemical Test Test Result Data Dapto to Springhill TL 427
A4.1 Conductor Fatigue Test Data Test No. NEP/1 429
A4.2 Conductor Fatigue Test Log Test No. NEP/1 430
A4.3 Conductor Fatigue Test Data Test No. NEP/2 432
A4.4 Conductor Fatigue Test Log Test No. NEP/2 433
A4,5 Conductor Fatigue Test Data Test No. NEP/3 435
A4.6 Conductor Fatigue Test Log Test No. NEP/3 437
A4.7 Conductor Fatigue Test Data Test No. NEP/4 439
A4.8 Conductor Fatigue Test Log Test No. NEP/4 Sheet 1 441
A4.9 Conductor Fatigue Test Log Test No. NEP/4 Sheet 2 442
A4.10 Conductor Fatigue Test Data Test No. NEP/5 444
A4.11 Conductor Fatigue Test Log Test No. NEP/5 446
A4.12 Conductor Fatigue Test Data Test No. NEP/6 448
A4.13 Conductor Fatigue Test Log Test No. NEP/6 450

X V I 1 1
LIST OF FIGURES
Page
2.1 Catenary and Parabolic Sag Equations Level Spans 60
2.2 Catenary and Parabolic Sag Equations Non Level Spans 61
2.3 Parabolic Sag Error 62
2.4 Parabolic Conductor Length Error 64
2.5 Catenary Change of State Equation 68
2.6 Parabolic Change of State Equation 69
2.7 Catenary/Span Length Error 74
2.8 Conductor Tension & Sag Change with Change in Mass 80
2.9 Conductor Tension & Sag Change with Change in CSA or
Modulus of Elasticity 80
2.10 Conductor Tension & Sag Change with Change in CLE 81
2.11 Conductor Tension & Sag Change with Change in Ultimate
Tensile Strength 81
2.12 Expansion of Aluminium Component of an ACSR/GZ Conductor 86
2.13 Transformed Ordinate and Abscissa Axis of Catenary Curve 92
2.14 Parabolic Span Least Squares Method of Analysis 95
2.15 Calibration Curve of Live Line Temperature Measuring
Equipment 100 2.17 Stringing Chart for Moose ACSR Conductor 105
3.1 Relationship of Service Conditions and Conductor
Degradation Mechanism 120
3.2 Distribution of Diameter of 3.00 mm 1350 Wire 142
3.3 Distribution of UTS of 3.00 mm 1350 Wire 143
3.4 Distribution of Resistivity of 3.00 mm 1350 Wire 144
3.5 Percentage of Original Tensile Strength for Alloy 1350
Vs Aging Time 153

XIX
LIST OF FIGURES (CONT)
Page
3.6 Percentage of Original Tensile Strength for Alloy 1120 Vs Aging Time 154
3.7 Percentage of Original Tensile Strength for Alloy 6201 Vs Aging Time 155
3.8 Electrical Conductivity for Alloy 1350 Vs Time and Temperature 168
3.9 Electrical Conductivity for Alloy 1120 Vs Time and Temperature 169
3.10 Electrical Conductivity for Alloy 6201 Vs Time and Temperature 170
3.12 Degradation of Galvanising Coating for ACSR/GZ
Conductor 176
3.13 Degradation of Galvanising Coating for 30/7/3.00 177
3.14 Degradation of Galvanising Mass 3.00 mm Wire 179
3.15 30/7/2.50 mm ACSR/GZ/1120 Stress Strain Test Results
Raw Data Plot Composite 192 3.16 30/7/2.50 mm ACSR/GZ/1120 Stress Strain Test Results
Raw Data Plot Core 193
3.17 30/7/2.50 mm ACSR/GZ/1120 Stress Strain Test Results Zero Corrected Plot Composite 195
3.18 30/7/2.50 mm ACSR/GZ/1120 Stress Strain Test Results Zero Corrected Plot Core 196
3.19 30/7/2.50 mm ACSR/GZ/1120 Stress Strain Test Results Master Stress Strain Curves 197
3.20 54/6/3,53 -i- 1/3.71 ACSR/GZ Transition Tension and Conductor Tension Change with Change in Temperature 204
3.21 7/4.75 mm AAC Coefficient of Linear Expansion Test
Results Raw Data and Linear Regression Plot 211
3.22 Wire Geometry in a Helically Stranded Conductor 213
3.23 Low and High Temperature Creep 218
3.24 7/4.75 mm AAC Conductor Creep Test Results
Linear Linear Plot 224

XX
LIST OF FIGURES (CONT)
Page
3.25 l/h.l5 mm AAC Conductor Creep Test Results
Log Log Plot 225
3.26 7/4.75 mm AAC Conductor Creep Rate 227
3.27 7/4.75 mm AAC Conductor Tension and Sag Change
with Change in Time 229
3.29 Summary of Conductor Test Results Creep 232
3.30 Conductor Tension & Sag Change with Change in Time 54/6/3.53 + 1/3.71 mm ACSR/GZ with Preformed Steel Core Wires 234
3.31 Conductor Tension & Sag Change with Change in Time 54/6/3.53 + 1/3.71 mm ACSR/GZ with No Preformed Steel Core Wires 235
3.32 Polynominal Modelling of Breaking Load Tests Panther ACSR/GZ 30/7/2.99 mm Conductor 242
3.33 Polynominal Modelling of Breaking Load Tests
Moose ACSR/GZ 54/7/3.53 mm -i- 1/3.71 mm Conductor 243
3.34 Wire Geometry in a Helically Stranded Conductor 245
3.35 Methodology for Testing Steel Wires in Aged Conductors 262
3.36 Methodology for Testing Fatigue of Aluminium Wires in 270
Aged Conductors 265 3.37 Methodology for Testing of Aged Conductors, Annealing
of Aluminium Wires 268
3.38 Methodology for Testing Creep in Aged Conductors
3.39 Methodology for Testing Stress Distribution Changes in
Aged Conductors 274 3.40 Summary of Degradation Mechanisms and Assessment
Procedures for Aged Conductors 278
4.1 Relationship of Vibration Freqency to Conductor Diameter 286
XX1
LIST OF FIGURES (CONT)
Page
4.2 Relationship of Conductor Parameters to Conductor
Vibration Loop Length 288
4.3 Predicted Conductor Vibration and Amplitude 289
4.4 Diana Frequency and Amplitude Predication 290
4.5 Relationship of Conductor Deflection to Conductor
Diameter 292
4.6 Fatigue Curves Separate Wires and Stranded Conductors 305
4.7 Miners Cumulative Damage Theory 307
4.8 Conductor Rotating Torque 314
4.10 Conductor Fatigue Test Program 320
4.11 S-N Fatigue Curve 19/3.25 mm AAC Conductor 322
A2.1 Avon to Kemps Creek TL Profile Structures 51 to 52 333
A2.2 Avon to Kemps Creek TL Profile Structures 52 to 53 334
A2.3 Avon to Kemps Creek TL Profile Structures 53 to 54 335
A2.4 Dapto to Springhill TL Profile Structures 317A to 318A 336
A2.5 Dapto to Springhill TL Profile Structures 318A to 319A 337
A2.6 Dapto to Springhill TL Profile Structures 319A to 320A 338
A2.7 Dapto to Springhill TL Profile Structures 320A to 321A 339
A2.8 Dapto to Springhill TL Profile Structures 321A to 322A 340
A3.1 Stress Strain Test Raw Plot of Test Data Composite Tomago to Taree TL 382
A3.2 Stress Strain Test Raw Plot of Test Result Data Core Tomago to Taree TL 383
A3.3 Stress Strain Test Derived Test Results Tomago to Taree TL 384

XXI1
LIST OF FIGURES (CONT)
Page
A3.4 Stress Strain Test Raw Plot of Test Results Data Composite Tomago to Taree TL 386
A3.5 Stress Strain Test Raw Plot of Test Results Data Core Tomago to Taree TL 387
A3.6 Stress Strain Test Derived Test Result Tomago to Taree TL 388
A3.7 Stress Strain Test Raw Plot of Test Results Data Composite Dapto to Springhill TL 390
A3.8 Stress Strain Test Raw Plot of Test Result Data Core Dapto to Springhill TL 391
A3.9 Stress Strain Test Derived Test Result Dapto to Springhill 392
A3.10 Stress Strain Test Raw Plot of Test Result Data Commposite Avon to Kemps Creek TL 394
A3.11 Stress Strain Test Raw Plot of Test Result Data Core Avon to Kemps Creek Tl 395
A3.12 Stress Strain Test Derived Test Result Avon to Kemps Creek TL 396
A3.13 CLE Test Raw Plot and Linear Regression Test Results Tomago to Taree TL 398
A3.14 CLE Test Raw Plot and Linear Regression Test Results Tomago to Taree TL , 400
A3.15 CLE Test Raw Plot and Linear Regression Test Results Dapto to Springhill TL 402
A3.16 CLE Test Raw Plot and Linear Regression Test Results
Avon to Kemps Creek TL 404
A3.17 Creep Test Raw Test Result Avon to Kemps Creek TL 406
A3.18 Creep Test Raw Test Result Avon to Kemps Creek TL 407
A3.19 Creep Test Raw Test Result Dapto to Springhill TL 409
A3.20 Creep Test Raw Test Result Dapto to Springhill TL 410
X X I 1 1
LIST OF FIGURES (CONT)
Page
A3.21 Conductor Creep Test Temperature Variation 412
A3.22 Composite Conductor Breaking Load Test No. 163 413
A3.23 Composite Conductor Breaking Load Test No. 164 415
A3.24 Composite Conductor Breaking Load Test No. 205 417
A3.25 Composite Conductor Breaking Load Test No. 206 419
A3.26 Composite Conductor Breaking Load Test No. 207 421
A3,27 Composite Conductor Breaking Load Test No. 208 423
A4,l Conductor Fatigue Test Test Results Test No. NEP/1 431
A4,2 Conductor Fatigue Test Test Results Test No. NEP/2 434
A4.3 Conductor Fatigue Test Spectrum Analysis Test No. NEP/3 436
A4,4 Conductor Fatigue Test Test Results Test No. NEP/4 438
A4.5 Conductor Fatigue Test Spectrum Analysis Test No. NEP/4 440
A4.6 Conductor Fatigue Test Test Results Test No. NEP/4 443
A4.7 Conductor Fatigue Test Test Spectrum Analysis No. NEP/5 445
A4.8 Conductor Fatigue Test Test Results Test No. NEP/5 447
A4.9 Conductor Fatigue Test Spectrum Analysis Test No. NEP/6 449
A4.10 Conductor Fatigue Test Test Results Test No. NEP/6 451
XXIV
LIST OF PLATES
Page
2.1 Accumulation of Ice and Snow on Transmission Line
Conductors 66
2.2 Direct Line Conductor Temperature Measuring Instruments 99
2.3 Application of Conductor Temperature Measuring
Instruments 101
3.1 Fitting of Bonding Tape to the Conductor Sample 124
3.2 Fitting of Wooden Cleats to the Conductor Sample 125
3.3 19/3.25 AAC Conductor, Conductor Fretting and Fatigue
Crack 129
3.4 7/4.22 AAAC/6201 Conductor, Broken Strand Adjacent Suspension Clamp 129
3.5 30/7/3.00 mm ACSR/GZ Conductor, 18 Wire Layer Surface pitting Magnification x 200 132
3.6 SEM of 19/3.25 mm AAC, Aluminium Wire Fatigue Crack Surface 137
3.7 SEM of 19/3.25 mm AAC, Longitudinal Section of Fatigue Crack 137
3.8 SEM of 30/7/2.36 mm ACSR/GZ, Longitudinal Section of Galvanizing Coating of Steel Wire 138
3.9 SEM of 19/3.75 mm AAC, 12 Wire Layer Fatigue Fretting Magnification x 200 147
3.10 SEM of 30/7/2.997 mm ACSR/GZ, 6 Wire Layer Steel Strand Loss of Galvanizing Magnification x 200 148
3.11 SEM of 30/7/2.997 mm ACSR/GZ 6 Wire Layer Steel Strands Poor Zinc Adhesion 175
3.12 7/2.99 mm Tarred and Aged GZ Wire After 408 Hours Salt Spray Exposure As Found Sample 180
3.13 7/3.00 mm New and Greased Wire After 864 Hours Salt Spray Exposure As Found Sample 180
3.14 30/7/2.99 mm ACSR/GZ 18 Wire Layer Aged and Tarred Sample after 864 Hours Salt Spray Exposure 182

XXV
LIST OF PLATES (CONT)
Page
3.15 30/7/3.00 mm ACSR/GZ 18 Wire Layer New and Greased Sample after 864 Hours Salt Spray Exposure 182
3.16 30/7/2.99 mm ACSR/GZ 6 Wire Layer Aged and Tarred Sample after 864 Hours Salt Spray Exposure 183
3.17 30/7/3.00 mm ACSR/GZ 6 Wire Layer New and Greased Sample after 864 Hours Salt Spray Exposure 183
3.18 30/7/2.99 mm ACSR/GZ 6 Wire Layer Aged and Tarred Sample after 864 Hours Salt Spray Exposure Localised Brown Staining 184
3.19 30/7/3.00 mm ACSR/GZ 6 Wire Layer New and Greased Sample after 864 Hours Salt Spray Exposure Localised Discolouration of Zinc Coating 184
3.20 30/7/2.99 mm ACSR/GZ 6 Wire Layer Aged and Tarred Sample after 864 Hours Salt Spray Exposure Cross Section Showing Localised Loss of Zinc Coating 185
3.21 30/7/3.00 ram ACSR/GZ 6 Wire Layer Aged and Tarred Sample after 864 Hours Salt Spray Exposure Cross Section Showing Localised Loss of Zinc Coating 185
3.22 Section of Epoxy/Compression Termination of an ACSR Construction 240
3.23 Section of Epoxy/Compression Termination of an ACSR Construction Showing Compression Sleeve 240
4.1 Fretting Fatigue 19/3.25 mm AAC Construction 302
4.2 Fatigue Failure 19/3.25 mm AAC Construction 304
4.3 General Arrangement of Conductor Fatigue Tester 309
4.4 Conductor Termination Block and Static Stress Strain
Gauge Arrangement 311
4.5 Conductor Fatigue Tester Conductor Mechanical Actuator 312
4.6 Conductor Fatigue Tester Wire Break Detection Arrangement 316
4.7 Conductor Fatigue V-Scope Measurement Technique 318

XXVI
LIST OF PLATES (CONT)
Page
A3.1 Avon to Kemps Creek TL 24 Wire Al Layer or Outside
Layer 353
A3.2 Avon to Kemps Creek TL 18 Wire Al Layer 353
A3.3 Avon to Kemps Creek TL 12 Wire Al Layer 354
A3.4 Avon to Kemps Creek TL 6 Wire Steel Layer 354
A3.5 Avon to Kemps Creek TL Steel Layer 355
A3.6 Dapto to Springhill TL 24 Wire Al Layer or Outside Layer 356
A3.7 Dapto to Springhill TL 18 Wire Al Layer 356
A3.8 Dapto to Springhill TL 12 Wire Al Layer 357
A3.9 Dapto to Springhill TL 6 Wire Steel Layer Without
Preform 357
A3.10 Dapto to Springhill TL Steel Core 358
A3.11 Tomago to Taree TL 18 Wire Layer or Outside Layer After
Destranding Armour Rods 359
A3.12 Tomago to Taree TL 18 Wire Al Layer or Outside Layer 359
A3.13 Tomago to Taree TL 12 Wire Al Layer and Underside of
18 Wire Al Layer 360 A3.14 Tomago to Taree TL 6 Wire Steel Layer and Underside
of 12 Wire Al Layer 360 A3.15 Tomago to Taree TL Destranded 6 Wire Steel Layer and
Steel Core 361 A3.16 Tomago to Taree TL Destranded and Cleaned 6 Wire Steel
Layer and Steel Core 361
A3.17 Bellambi to Heathcote TL 12 Wire Al Layer or Outside Layer 362
A3.18 Bellambi to Heathcote TL 12 Wire Al Layer and Underside of 18 Wire Layer 362
A3.19 Bellambi to Heathcote TL 6 Wire Layer and Underside of the 12 Wire Layer 363

XXVI1
LIST OF PLATES (CONT)
Page
A3.20 Bellambi to Heathcote TL Destranded 6 Wire Steel Layer and Steel Core 363
A3.21 Bellambi to Heathcote TL Destranded and Cleaned
6 Wire Steel Layer and Steel Core 364
A3.22 Typical Elliptical Area Damage of Aluminium Strands 365
A3.23 Longitudinal Section of Elliptical Area Damage of
Aluminium Strands x 100 365 A3.24 Longitudinal Section of Typical Outer Aluminium Layer
Pitting X 200 366
A3.25 Longitudinal Section of 18 Wire Layer Aluminium Pitting from Tomago to Taree TL x 50 366
A3.26 Loss of Galvanizing from Steel Core from Tomago to Taree TL x 200 367
A3.37 Corrosion of Steel Wire from 6 Wire Layer from Tomago to Taree x 100 367
XXVI11
LIST OF SYMBOLS
The symbols used in this thesis are, as far as possible, the symbols in common use by the electrical industry and published works. In some cases, as a result of the diverse nature of the thesis, the symbols may define more than one parameter. In this regard, to assist the reader, the symbols used, have been categorised into chapters. However in achieving a consistent approach, some duplication in the list of symbols from one chapter to the next will occur.
CHAPTER ONE
E - modulus of elasticity of aluminium in Pa a -
E - modulus of elasticity of steel in Pa s •' m - ratio of cross section area of steel to the total
conductor
n - ratio of cross section area of aluminium to the total conductor
z
e
a a
a s
parameter
parameter
aluminium CLE in
steel CLE in C"-"-
0 -1
CHAPTER TWO
2
A - conductor cross sectional area in m
A„ - conductor creep constant
C - constant
c - conductor curve constant D - aluminium thermal strain in mm.km a
D_ - steel thermal strain in mra.kra"

xxix
LIST OF SYMBOLS (CONT)
E - conductor modulus of elasticity in Pa
H - vertical distance between two adjacent conductor attachment points in m
K - conductor,radial thermal conductivity coefficient in W.m~ .C
L - horizontal span distance in m
1 - conductor chord length in ra
L rr - effective level span length for a non level span
L_ - equivalent span in m
n^,n„ - conductor creep constants
R - d.c. resistance of conductor in S.m
r - radius of conductor in ra c
r - radius of steel core of an ACSR conductor in m s
S - conductor sag in m
s - conductor stress in Pa
T - conductor tension in N
T, - conductor horizontal tension in N
T.^ - conductor average tension in a span in N
t - time in hours
t' - conductor tension at any point in the chord length in N
X - conductor weight load in N
w - conductor weight load in N
a - conductor CLE in °C~

XXX
LIST OF SYMBOLS (CONT)
9 - conductor temperature in C
G - conductor core temperature in C
© - conductor surface temperature in C
6 - aluminium temperature in C
' o
e - steel temperature in C
ye - conductor creep in mm.km
8 - conductor creep constant
Y - an angle in degrees
CHAPTER THREE
A„ - conductor creep constant
2 A - aluminium cross sectional area in m a
2 A - conductor cross sectional area in m c
A . - wire area constant for the ith layer ci •'
A - polynominal constant, where n = 1,2,3...etc.
2 A - steel cross sectional area in m s
B - polynominal constant, where n = 1,2,3...etc.
BL - steel wire breaking load in N
BL.. - breaking load of the ith wire of material j
C - aluminium permanent elongation in m.m~ in a stress a strain test
C - steel permanent elongation in m.m in a stress s strain test
E - modulus of elasticity of aluminium in Pa
XXXI
LIST OF SYMBOLS (CONT)
E ^ - final modulus of elasticity of aluminium in Pa
E ^ - final modulus of elasticity of conductor in Pa
E . - initial modulus of elasticity of conductor in Pa
E„ - modulus of elasticity of steel in Pa s ''
Y, r - final modulus of elasticity of conductor in Pa
E . - initial modulus of elasticity of conductor in Pa
E - modulus of elasticity of wire in Pa w
E - wire axial modulus of elasticity in Pa
D - conductor diameter in m
F - conductor axial force in N
i - layer number
j - material type
L - wire length corresponding to one lay length in ra
L - length of the centre wire from the conductor sample in m
LR - lay ratio
Load - instantaneous load in kN during a breaking load test
m - ratio of cross section area of steel to the total conductor
M . - wire mass constant for the ith layer ci •'
_\ M - mass of conductor sample in g.m
M - mass of grease or tar in g
M - mass of zinc in g.m"
MLR - mean lay ratio
n - ratio of cross section of aluminium to the total conductor

XXXI1
LIST OF SYMBOLS (CONT)
N - conductor creep constants where n = 1,2 or 3
N.. - number of wires in i layer of material j
N. - number of wires in a conductor 1
R - conductor layer radius in m
R . - wire resistance constant for the ith layer ci •'
S - conductor stress in Pa
S - aluminium stress in Pa a
S - maximum aluminium stress in Pa at initial ao temperature
S - conductor average stress in Pa av ^
S, - conductor birdcaging stress in Pa
S - conductor stress in Pa c
S - maximum conductor stress in Pa at initial temperature
S. - conductor critical stress in Pa
S - steel stress in Pa s
S - maximum steel stress in Pa at initial temperature so
T - temperature in C
t - time in hours
W. - mass of the ith wire in g after destranding of the conductor sample and reraoval of all grease or tar from the ith wire
s - conductor strain in m.ra"
e, - wire strain in m.m
ys - conductor creep in mm.km"
X - lay length in m
a - lay angle in degrees
X X X I 1 1
LIST OF SYMBOLS (CONT)
a - CLE in °C •*"
a - aluminium CLE in C-a
•I
a - Steel CLE in °C~ s
a' - wire CLE in °C-1
a - conductor temperature in C
a - conductor maximum operating temperature in C craax
dp
L
a^^ - grease/tar drop point in C
e, - wire strain in ra.ra
CHAPTER 4
A - defined distance of 89 mra or 3-1/2 inches
2 A - aluminium cross sectional area in m a
2 A - conductor cross sectional area in m c
a.. .. - area of the wires in the left hand lay layer (i) or the right hand lay layer (j)
a - homogenous conductor area in m
c - distance from the neutral plane to the outermost fibre in m
d - aluminium wire diameter in m a
d - conductor diameter in m
d - steel wire diameter in ra
d.. - diameter of the wire in the ith layer of material j
d„ - wire diameter in m w Eg - modulus of elasticity of aluminium in Pa
E. - modulus of elasticity of material j

XXXIV
LIST OF SYMBOLS (CONT)
E - modulus of elasticity of steel in Pa s ''
2 EI - conductor flexural rigidity in N.ra
f - conductor vibration frequency in Hz
L - conductor loop length in m
M - wire torque in N.m
m - conductor mass in g
ra. . - number of wires in the ith layer of material j
N. - number of wires in a conductor 1
N - fatigue life of material at a given stress level in cycles where n = 1,2,3...etc
N^. .. - number of wires in the left hand lay layer i or the right hand lay layer j
n - ratio of cross section of aluminium to the total conductor
n - number of alumimiun wires a
n - proportion of material life at a given stress level in cycles where n = 1,2,3....etc
n - number of steel wires s
R - bending radius of conductor over suspension point in m
r - conductor layer radius in ra
r. . - radius of the ith layer of material j
r.. .. - radius of the left hand layer i of the right hand layer j
S - Stroudal number
T - conductor tension in N
T, - conductor force producing rotating torque in N
V - wind velocity in m.s"
Y - conductor peak to peak displacement in mra
Y' - conductor peak displacement in mra

xxxv
LIST OF SYMBOLS (CONT)
y - conductor deflection in m •'a
a - conductor stress in Pa
o - aluminium wire stringing stress in Pa 3-
cT, - conductor bending stress in Pa
a' - conductor stress at 89mm from the suspebsion pint in Pa
a,. .. - wire stress in the left hand lay layer i or the right (i or J) , , . J J e.
• lay layer j
9 - lay angle in degrees
9.. .V - lay angle in the left hand lay layer i or the right ^ hand lay layer j
xxxvi
INTRODUCTION
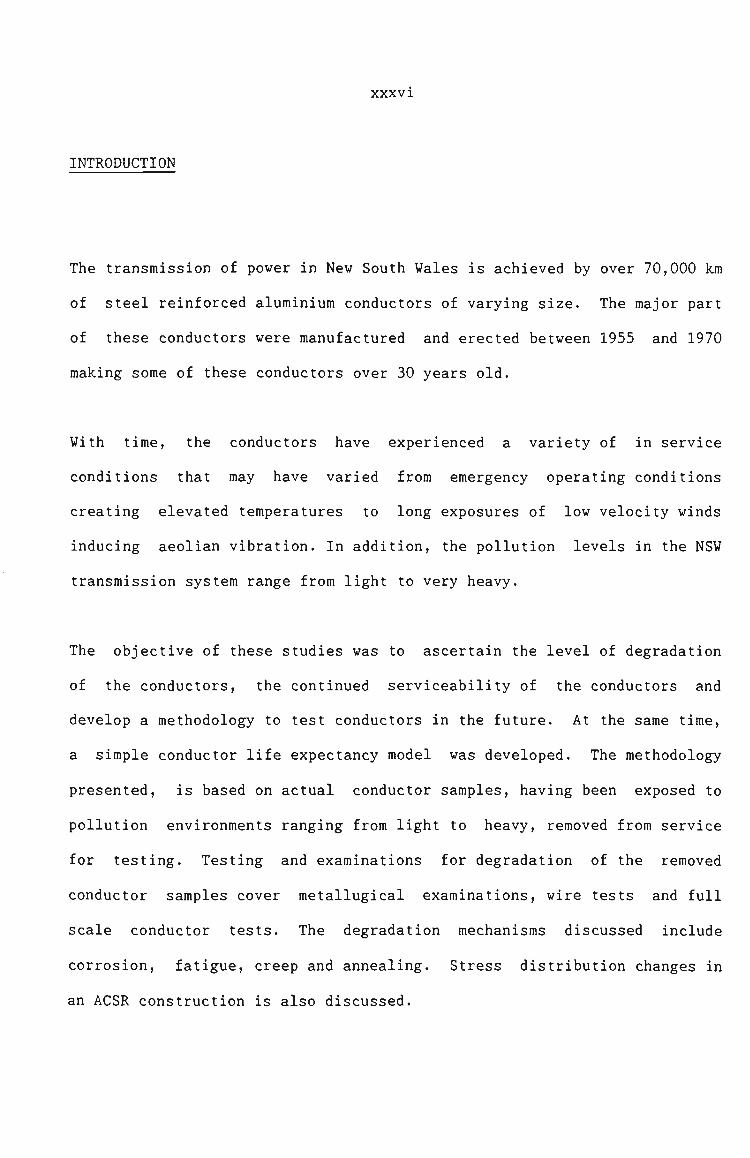
The transmission of power in New South Wales is achieved by over 70,000 km
of steel reinforced aluminium conductors of varying size. The major part
of these conductors were manufactured and erected between 1955 and 1970
making some of these conductors over 30 years old.
With time, the conductors have experienced a variety of in service
conditions that may have varied from emergency operating conditions
creating elevated temperatures to long exposures of low velocity winds
inducing aeolian vibration. In addition, the pollution levels in the NSW
transmission system range from light to very heavy.
The objective of these studies was to ascertain the level of degradation
of the conductors, the continued serviceability of the conductors and
develop a methodology to test conductors in the future. At the same time,
a simple conductor life expectancy model was developed. The methodology
presented, is based on actual conductor samples, having been exposed to
pollution environments ranging from light to heavy, removed frora service
for testing. Testing and exarainations for degradation of the reraoved
conductor samples cover metallugical examinations, wire tests and full
scale conductor tests. The degradation mechanisms discussed include
corrosion, fatigue, creep and annealing. Stress distribution changes in
an ACSR construction is also discussed.
xxxv11
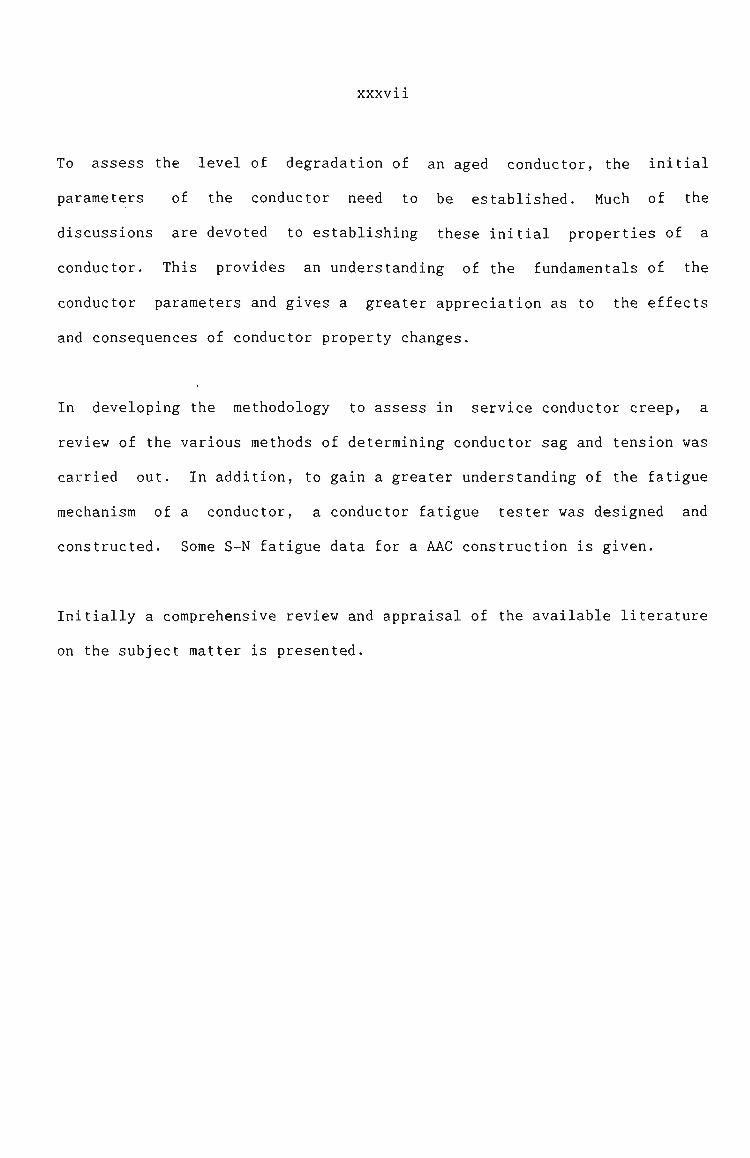
To assess the level of degradation of an aged conductor, the initial
parameters of the conductor need to be established. Much of the
discussions are devoted to establishing these initial properties of a
conductor. This provides an understanding of the fundamentals of the
conductor parameters and gives a greater appreciation as to the effects
and consequences of conductor property changes.
In developing the methodology to assess in service conductor creep, a
review of the various methods of determining conductor sag and tension was
carried out. In addition, to gain a greater understanding of the fatigue
mechanism of a conductor, a conductor fatigue tester was designed and
constructed. Some S-N fatigue data for a AAC construction is given.
Initially a comprehensive review and appraisal of the available literature
on the subject matter is presented.

CHAPTER ONE
REVIEW OF THE LITERATURE
1.1 INTRODUCTION
Fundamental to any research work is a review and appraisal of the
currently available literature on the subject matter. It goes without
saying that an enormous amount of literature has been published on the
subject of the properties of transmission line conductors. Much of the
research and development work has culminated in the publication of
standard specifications (6, 7, 8 & 22), guides (1 & 3), reports (35, 63 &
64), recommendations (27, 28 & 29) and reference books (2, 36 & 66).
The mechanical properties of transmission line conductors covers a broad
range of topics. These topics have been categorised into transmission
line conductor tension and sag, mechanical, corrosion resistance and
fatigue properties. Accordingly, the literature appraisal has been
referenced in these categories. In addition, to allow some historical
development to be established the appraisals have been carried out in a
chronological order.

2.
1.2 CONDUCTOR TENSION AND SAG PROPERTIES
1.2.1 H.B'. Dwight 1926 (32)
Dwight presents a number of formulas given in series form to
determine sag, tension and unstretched conductor length for level
and non level spans knowing typical conductor parameters and
climatic conditions.
Using modern digital computers for transmission line designs it
is considered that the ideas presented by Dwight are somewhat
dated. However, it is still common practise for some designers
to employ approximate parabolic solutions like those given by
Dwight. In these cases one of the features of the formulas
presented, was that of giving automatically, the percentage
errors involved in the use of the parabolic approximations.
In the subsequent discussions, E.V. Parnell points out that sag
and tension calculations are presented with a higher degree of
accuracy than the known physical properties of the conductors and
the accuracy of the results are useless unless the physical
properties of the conductors are more soundly established.
3.
Dwight acknowledged that the modulus of elasticity and the
temperature coefficient of linear expansion were not known to any
degree of accuracy and he suggested further tests to be carried
out to determine the average values of these conductor
parameters.
It seems quite ironic that as early as 1926 it was recognised
that conductor parameters were required to be known with a degree
of accuracy and certainity, supported by actual tests. Even
today Australian Standards for overhead conductors do not specify
the need for type testing. It is to be commended, as part of the
research and development policy of some Australian conductor
manufactures, type testing to determine actual conductor
parameters is being carried out.
1.2.2 D.O. Ehrenburg 1935 (34)
Ehrenburg proposed a method of determining conductor length, sag
and tension in terms of a defined parameter, z being directly
proportional to the span length and the conductor mass and
inversely proportional to the conductor horizontal tension.
Series equations based on the catenary curves are derived using
the parameter, z. Equations for conductor length, sag and
tension in terms of the parameter, z are presented to enable the
construction of tension/temperature charts.

4.
Examples of long and short spans with considerable difference in
reduced levels of the conductor attachment points are given to
demonstrate the methods.
Ehrenburg includes the derivations, for the effect of insulator
sag for low tension spans, point of horizontal tangency, angle of
inclination at the conductor attachment point and point of
maximum deviation as appendices to the paper.
Like a number of papers presented prior to the availability of
computers the methods presented by Ehrenburg lack the accuracy
that can be achieved by the use of the exact catenary equiations.
Ehrenburg recognised this by the constraint saying that z should
always be less than 0.5.
Whilst the author's contributions were valuable at the time, it
is considered, that the methods presented are dated and with
maybe the exception of the effect of insulator sag, not
appropriate for further discussions.
1.2.3 CO. Boyse and N.G. Simpson 1944 (17)
The Authors presented a paper in two parts. The first part
reviews the fundamental relationships of sag, span, load, tension
and length of conductor, using parabolic approximations and
equivalent span theory. This is the first known published works

5.
which describe in full the "freely supported lines" and the
associated equivalent span theory. Boyse and Simpson's
contribution with this theory has to be recorded as one of the
most valuable design philosphies available to transmission line
engineers today. This theory will be reviewed in some detail in
Chapter Two.
The second part of the paper discusses in some length the factors
of safety in transmission line designs and suggests a new
approach to design procedures. This part of the paper warrents
further investigations since the Overhead Construction and
Maintenance Regulations, 1962 remains today, essential unchanged.
However, these investigations are considered outside the scope of
these studies and will not be discussed further.
1.2.4 M. Landau 1951 (55)
The paper is a further development of Ehrenburg's (31) work
published on "Transmission Line Catenary Calculations" and
provides analytical methods for calculating conductor sags,
tensions and lengths for level and non-level spans for homogenous
and non-homogenous conductors using a slide rule.
6.
However, like Ehrenburg's work the methods, employed by Landau
lacks the accuracy achievable by the use of exact catenary
equations and modern computers and whilst it is appropriate to
recognise Landau's work it will not be discussed in detail.
1.2.5 C.A. Jordan 1952 (54)
Jordan provides a complete interpretation of the ACSR stress
strain diagrams and illustrates the calculating techniques for
determining the initial, final and weighted final modulus of
elasticity for the composite conductor, steel core and the
aluminium components. Relationships for the coefficient of
linear expansion for the steel core and the composite conductor
are also given. In addition, Jordan described the temperature
variation of the critical tension and stress distribution of the
aluminium and the steel components of a composite conductor.
The assumption that a = 2a was made throughout the paper. a s
—f> —6 Since nominal values of a = 23 x 10 and a = 11.5 x 10~ it is
a s
considered that this was reasonable. The actual values of the
coefficient of linear expansion is dependent on the modulus of
elasticity, the lay ratios of the various layers and the cross
sectional areas of the component materials of the composite
conductor and in general will be less than the nominal values.

7.
Of particular interest is the critical tension of an ACSR
conductor where loads less than this tension are solely borne by
the' steel core. In other words, conductor tensions below this
critical point will behave as a steel conductor with the
appropriate mE and nE properties. The critical tension S cl
transition point is a function of temperature. An increasing
temperature, results in a linear increase in critical tension.
Intuition would suggest that when aluminium strands suffer
permanent elongation over steel after a period of time then the
critical tension may move within the regime of every day
operating tensions and temperatures. (i.e. the greater the
aluminium permanent elongation the greater the critical tension).
The critical tensions will be discussed in some detail in Chapter
Three.
Another interesting concept of Jordan's, is that of the secant
modulus and is defined as the slope of the line on the stress
strain diagram from the maximum stress point, after the customary
one hour hold period to the intercept of the initial modulus line
of the ACSR composite. The secant modulus gives a direct,
relationship between any combination of stress and length along
the final and initial modulus lines.
Finally, Jordan provides a ten step plan to determine design or
final sags and tensions.

1.2.6 B.M. Pickens 1959 (69)
The' author published details of digital computer program to
determine conductor sag and tension. In fact, Pickens has to be
recognised as the first engineer to progress from slide rule and
or tables as the calculating medium to a computer.
The program designs for both final and initial values for a
series of spans and determines the controlling design limit of
the conductor. The basis and principles of the program are
similar to those used today however the computer program is
considered dated and will not be discussed further.
Of more interest is the inclusion in the paper of typical
limiting working tensions and the recognition that different
constants need to be applied for different topography and
climatic conditions. In addition the initial tension at the
regional still air conditions is 33 1/3% of calculated breaking
load (CBL) compared with 25% of CBL used in this country. This
is of particular interest because it recognises that it is
possible that conductor static stress can be increased providing
dynamic stresses and bending stresses are minimised.
1.2.7 P.F. Winkleman 1960 (80)
The' paper describes the methods of computing sag and tension data
of conductors and field measurement methods to determine sag.
Much of the author's work has been adopted by ANSI for inclusion
in the IEEE Guide to the Installation of Overhead Transmission
Line Conductors (3).
Winkleman illustrates the method of using new catenary functions
superimposed over tension-strain curves plotted for the various
temperatures of interest to determine conductor tension and sag
for level dead end spans.
The basis of the catenary function curves is the term slack,
being the difference between the curve length and the span length
expressed as a percentage of the curve length. Like Ehrenburg
(34) the catenary functions for slack in terms of tension and sag
are derived from the defined paramter, z.
The resultant conductor stringing charts with the exception of
the sag curves are not unlike the stringing charts employed by
the Electricity Commission of NSW.
For non level spans Winkleman uses a nomograph for determining a
level span equivalent of non level span and provides a correction
value to be included in the non level span length.

10.
Two methods of sagging of conductors are presented. The first
method of the field sagging equation is based on the parabolic
approximation. In cases where the sag exceeds 5% of the span
this method will result in measurable errors. The second method
of the insulator clipping in offsets is based on the fact that
the total length of the conductor at sag in the stringing sheaves
equals the total length of the conductor at sag in the suspension
clamps at a given stringing temperature. Sags and insulator
offsets are related since sag corrections required for computing
sags are dependant upon offset computations. The insulator
offset calculations are described in detail in reference (3).
Winkleman also provides a method of determining insulator sag
similar to that provided by Ehrenburg (34). Both these methods
are valuable in determining the effect of insulator sag in low
tension, short span, higher voltage transmission lines where the
insulator length can be a considerable proportion of the length
of the total span length.
Finally, Winkleman commented on conductor creep and suggests
prestressing the conductors as a means of overcoming long terra
increases in conductor sag.

11.
1.2.8 J. Barrien 1975 (12)
Barrien has provided a method to solve the well established
catenary equations for the continuous multiple span transmission
lines. Like Winkelman (80), Barrien was interested in more
exacting solutions to transmission line designs. This is
demonstrated by the example of the calculations for a
transmission line in undulating terrain where there is a common
need to straddle ridges with several short spans and either side
of these short spans have relatively large spans. In these
cases, considerable discrepancies in the equivalent span theory
are revealed, particularly in the sag predications.
The tension calculating method employed is based on the restoring
forces of the weight and tension of the conductor and the weight
of the insulators, at each suspension structure. Put more
simply, the suspension insulator string is a moment arm and
forces of weight and tension are resolved about the insulator
attachment point.
Barrien also discussed the mathematical solutions available to
solve the final tensions. The first method using finite elements
is discounted as very accurate but very time consuming with
little overall gain. The second method using a derived
hyperbolic expression which was solved using Newton-Raphson
method provided rapid convergence with results having a greater
accuracy than the input data.

12.
Other aspects of sag and tension such as the catenary in an
inclined plane, line deviation considerations and flexibility in
the' computer program to solve problems such as broken conductor
conditions were also discussed.
Barrien's contribution in providing exacting solutions to
determine tension and sag, culminating in the computer program
CONCAT has been accepted and become a design tool for all
transmission line engineers. Further, more exacting comments
regarding Barrien's work will be discussed in detail in Chapter
Two.
1.2.9 G.R. Boal 1977 (14)
Boal presented a model of tension and sag of transmission line
conductors that includes the effects of creep, uses precise
equations for non linear load elongation behaviour and is said to
consider thermal loading history of the conductor. The program
developed by Boal employs catenary equations, models stress
strain data by a polynominal curve and includes the effect of
creep.
Boal illustrates the capabilities of the program and the effects
of the governing conditions or design limitations of 26/7 ACSR
and 37 AASC/6201 conductors.

13.
Boal also postulates a statistical approach for the predication
of extreme load conditions likely to occur, to be used as the
basis of transmission line designs.
Unfortunately, much of the details of Boal's work was not
included in the published paper. However, it is considered that
there is a need for a sag tension program that uses catenary
equations, models stress strain data as a polynominal curve and
includes the long term effect of creep. The errors in the most
widely used sag tension equations and the development of sag
tension program that includes the non linear behaviour of
conductors will be discussed in Chapter Two.
1.2.10 J. Bradbury, G.F. Kuska and D.J. Tarr 1982 (18)
The authors discuss the inaccuracies of the parabolic theories in
very mountainous terrain and highlight the presence of towers and
conductors having loads in excess of their design limits. In
deriving the theory it was recognized that two theories were
available the elastic and the non elastic. The authors chose the
elastic theory suggesting that it gives a tolerable accuracy.
The authors derive the catenary change of state equation which is
presented and discussed in detail in Chapter 2. Furthermore,
Bradbury, Kuska and Tarr examine the effects of the suspension

14.
insulator string when the conductor is in the stringing sheaves
and "clamped in" and present the theory of offsets previously
mentioned.
In addition five methods of measuring sag are presented and the
relative merits of each method is discussed.
In conclusion the catenary change of state equation and the
theory present in this paper is similar that of Barrien's (12)
presented in 1975. The next appropriate development of the
catenary change of state equation is the inclusion of the
inelastic theory making the determination of sag time dependent.
1.2.11 J.S. Barrett, S. Dutta and 0. Nigol 1983 (9)
The author's present the details of a new sag-tension computer
program named STESS which is based on the summation of strains.
The concept is a simple approach of given conductor stress and
time, the total conductor strain is the accumulation of thermal
strain, elastic strain, creep strain and two relatively new
strain terras, slack and settling.
The program STESS is the first real departure from the
traditional sag tension determination methods. In the previous
methods the strain was the independent variable for the necessary
calculations and the conductor stress was the dependent variable.
15.
In actual practise, the conductor strain is dependent on
component stresses, temperatures and creep history.
The STESS method determines tensions for any given future loading
conditions and limiting constraints. This is not possible with
the traditional sag-tension methods because it involves a
complicated shifting of initial and final stress-strain and creep
curves.
In addition STESS includes the effects of load distribution
changes previously mentioned by Jordan (54). More significantly
a compressive loading of the aluminium wires in an ACSR
construction is included that contributes to increases in sags at
elevated temperatures.
1.2.12 Future Developments
The logical progression to achieve a greater understanding of
tension and sag, behaviour is the combination of the sag tension
evaluation of strain summation and the continuous catenary theory
of Barrien's (12). This will enable the prediction of time
dependent sag and tension using exact conductor behaviour theory,
modelling all possible loading conditions and provide an accurate
span behaviour model achieved by the continuous catenary theory.
16.
1.3 CONDUCTOR MECHANICAL PROPERTIES
1.3.1 G.W. Stickley 1932 (77)
Stickley presents a paper that recognised the stress strain
curves of stranded cables differ appreciably to that of single
wires. The author published details of conductor testing
equipment and test procedures that are still employed today.
Stickley commented on the results of stress strain tests and
discussed the "foot" or as it is known today the zero correction
factor or slack caused by unavoidable looseness in the wires
resulting in uneven stress distribution at small loads in the
conductor.
Stickley is the first known author to discuss the aluminium
unloading phenomena at low loads that is discussed by other
authors and at some length in Chapter Three of these studies.
Of particular interest is the findings that the modulus of
elasticity increased after a second stress strain test. This is
attributed to the individual wires acting more homogeneously in
subsequent tests.

17.
1.3.2 E. Fritz 1960 (42)
The' author published a paper on "The Effects of Tighter Conductor
Tensions on Transmission Line Costs" covering many aspects of
transmission line designs such as foundations, steel tower
masses, insulators and line fittings, earthwires and conductors.
With regard to conductors, Fritz highlights the design
limitations of higher conductor tensions, like maximum design
tensions within the elastic regime of mechanical behaviour, the
effects of increased creep and lastly the fatigue limitations.
Fritz emphasises the fact that tighter tensions will increase
conductor vibration and suggests:
"judicious selection of vibration protection hardware at suspension and strain points or fatigue breaks will occur".
Like many other authors Fritz did not recognise that the
accumulation of the stresses at the conductor support point is
the design limitation of the conductor. For a given dynamic
stress, increasing static stress, decreases bending stress with a
single a net gain of decreasing sag. This will be discussed in
detail in Chapter Four of this study.

18.
1.3.3 J.B. Roche and E. Dziedzic 1968 (73)
Roche and Dziedzic discuss the factors affecting creep and sag in
transmission lines covering three main areas of interest,
conductor design and manufacturer, creep at elevated temperatures
and component stress analysis in composite conductors.
The first area, conductor design and manufacturer, the authors
give an account of the possible variables in the manufacture
process and the effects that will result in the conductor
parameters and performance affected.
The second subject examines conductor creep at elevated
temperatures. The authors comment on high temperature creep
rates for AAC, AGAR and AAAC constructions being considerably
greater than creep rates of most equivalent ACSR conductors.
Several comparisons of the use of AGAR and ACSR are given.
The final area of discussion presented by the authors is that of
the calculated breaking load (CBL) of the conductor as being a
deceptive design parameter. This is illustrated by comparing the
CBL of an AAC and that of an equivalent ACSR using the definition
of 20% CBL the ACSR aluminium strands have considerable higher
stress levels. Roche and Dziedzic also discuss the ramification
of wire stress re-distribution and suggest such load shifts may
accelerate the creep rates in an ACSR construction.

19.
Roche and Dziedzic join an increasing number of authorative
authors who have suggested that the calculated breaking load of a
conductor is an ill founded basis for design. This is supported
when one considers aeolian vibration induces a dynamic stress
into the conductor, the suspension clamp produces a bending
stress and creep of conductors is generally determined as a
function of the conductor static stress.
1.3.4 J.R. Harvey 1969 (47)
John Harvey is recognised as one of the first authors to publish
papers on conductor creep and creep at elevated temperatures.
The author gives an account of the room temperature creep test
procedures, model equations and the long term predictions.
In addition the author has carried out a significant number of
creep tests at elevated temperatures. Test results are published
to illustrate the effect of temperature on the creep of various
conductors.
Two points are interesting to note regarding the test results for
ACSR construction.
1. "These figures also show that not much difference in creep exists between any of the conductors tested at room temperature at a tension of 20% nominal ultimate strength (CBL);" and
2. "that temperature has a much smaller effect on the creep of ACSR than it has on the creep of AAC".
20.
However, regarding the first comment close examination of the
test results suggest that:
1. For Arbutus conductor a tenfold increase in creep occurs
after 100,000 hours between tests at 20% CBL at 26°C and 15%
CBL at 125°C,
2. For Greedey conductor a fivefold increase in creep occurs
after 100,000 hours between tests at 20% CBL at 26°C and 15%
CBL at 100°C, and
3. For a 1021.4 kcmil AGAR an eightfold increase in creep
occurs after 100,000 hours between tests at 20% CBL and 26°C
and 100°C
It is considered that, contrary to Harvey's remarks that these
differences are considerable.
Harvey also commented on the high temperature performance of an
ACSR and illustrated the effects of the unloading of the
aluminium strands in an ACSR construction. This unloading
occurred for Drake conductor between 100 C and 125 C
Using the test results and a statistical loading model of a
transmission line developed by Beers, Gilligan and Schamberger
(13), Harvey determined the creep in the conductor for the life
of the transmission line. The results suggest that,
21.
"Operating at these temperatures for the calculated times will not increase the creep of ACSR over that predicted from room temperature operation, but these operations would produce more creep in all-aluminium conductors than that predicted from room temperature operation".
1.3.5 J.R. Harvey and R.E. Larson 1970 (49)
Harvey and Larson's paper on the "Use of Elevated-Temperature
Creep Data in Sag-Tension Calculations" is the natural
progression frora Harvey's previously published work (47) in 1969.
The authors present the results of conductor creep tests with
various combinations of stress and temperature and provide an
understanding of how creep is accumulated. Creep accumulation
methodology is discussed in detail in reference (27).
One series of tests performed suggested that given a conductor
exposed to a high tension for a period of time, subsequently
allowing the tension to be reduced that the conductor creep will
cease. Similar tests carried out during the coarse of these
studies suggest a similar conductor behaviour. Tests of this
nature are the first step of providing quantified information
about the prestressing of the conductor after initial stringing
in an attempt to achieve creep stabilisation.

22.
According to the authors Arbutus conductor has similar creep
behaviour at 25 C and 40% of calculated breaking load and 75°C
and' 15% of calculated breaking load. Such behaviour is not
consistant with that predicted by the equations published by
Bradbury, Dey, Orawski and Pickup (21).
Finally the authors suggest temperature time cycles to predict
long term conductor creep. Similar cycles have been predicted by
Beers, Gilligan and Schamberger (13) and Rickard and Sproule
(72).
1.3.6 Y. Nakayama and T. Kojima 1970 (61)
The authors published details of field measurements of the creep
of overhead line conductors that were compared with simultaneous
laboratory measurements of creep.
The field tests consisted of three different stress levels and
the duration of the test was 4 1/2 years. Laboratory tests were
carried out at two different stress levels for a duration of 1000
hrs with the test results extrapolated to 10 hours.
The results of the tests confirmed,
1. Sag increased due to non-elastic elongation, and the sag
increase was a function of conductor stress;

23.
2. The difficulty of correlating the dynamically behaviour
creep data from a transmission line with that of constant
' tension creep data from a laboratory; and
3. The temperature correction allowance is an effective method
to compensate for conductor elongation.
1.3.7 J.R. Harvey 1972 (48)
Harvey's interest in conductor creep was extended to include the
publishing of the paper that describes "The Effects of Elevated
Temperature Operation on the Strength of Alurainium Conductors".
The work deals with the amount of strength lost by conductors
operating at elevated temperatures under tension.
The test results suggest that the loss of strength can be
represented by parabolic matheraatical model in the form of rat
where for a given wire diameter alloy, m and n are a function of
temperature. Furthermore smaller diameter wires lost more
strength than larger diameter wires.
Four loss of strength empirical equations are presented for
conductor constructions SAC, ACSR, AAAC and AGAR. Finally a
methodology of accumulating loss of strength given temperature
and exposure times is given.
24.
Unfortunately loss of strength predictions can only be estimates
since the precision of such predications exceeds the precision
with which actual operating temperatures of transmission lines
are measured. Operating tempertures will also vary along the
transmission lines and the uncertainity will be highly dependent
on the wind velocity and other climatic factors.
1.3.8 J. Bradbury, P. Dey, G. Orawski and K.H. Pickup 1975 (21)
The authors present a paper that describes the long term creep
assessment for conductors. Initially, three forms of the creep
equations are presented identical to those given by reference
(27). Derivation of the dependency of rate of change of tension
with rate of change of creep strain is given.
Creep constants are given for various conductor constructions and
the effects of manufacturing variables on creep are discussed.
The authors found reasonable correlation between creep estimation
using the predictor equations and experimental results from two
separate field tests.
Finally the authors discuss the application of the methods given
to transmission line designs and conductor sagging procedure.
This discussion includes the methods of creep compensation namely
prestressing, temperature, marginal allowance and overtensioning;

25.
and the estimations of the increase in sag over the service life
of a conductor. The effects of normal and intermittent high
temperature are presented which could contribute 0.200 m
additional sag change over a 20 year period.
The authors have made a valuable contribution to the
understanding of and the need to compensate for creep of
conductors. Methods presented have become the foundation of many
generating authorities conductor creep compensation methodology.
1.3.9 V.T. Morgan 1979 (60)
Morgan published a paper titled "The Loss of Tensile Strength of
Hard-Drawn Conductors by Annealing in Service". The paper is a
valuable contribution to understanding the annealing process yet
highlights the more difficult task of establishing the thermal
history of a conductor.
The author initially describes the metallurgical annnealing
process followed by empirical equations to describe the wire loss
of strength as a function time, temperature and reduction area
during the drawing process.
26.
Morgan postulates that.
"annealing is cumulative for intermittent heating of untensioned wires and it is possible to calculate the loss of tensile strength during the lifetime of a conductor from knowledge of its thermal history".
Two raethods of calculation of annealing are given by Morgan, the
first for loss of strength less than 15% and the empirical
equation uses a second order polynominal and the second where the
loss of strength is stated as proportional to the rate of
recrystallization.
The author provides a method to accumulate annealing caused by
intermittent or overload currents. The time duration of the
incremental heating and cooling periods is initially determined
following by calculation of the raaximum teraperature.
In closing the author suggests an inexpensive method of
determining the thermal history of a conductor to determine
annealing. Statistical analysis of known load patterns and
meterological conditions during the life of a conductor is also
given as a further method of determine annealing.
As a rule of thumb Morgan generally suggests that the maximum
design temperature for copper, 1350 and 6201 aluminium should not
exceed 98, 141 and 102°C respectively.

27.
1.3.10 0. Nigol and J.S. Barrett 1981 (62)
Nigol and Barrett published a paper titled "Characteristics of an
ACSR Conductor at High Temperatures and Stress" which disclosed
three significant discoveries,
1. The aluminium wires of an ACSR construction are capable of
sustaining a compressive load of the order of 6 to 12 MPa
that remain essentially constant and may account for as much
as 0.6 m additional sag for a typical 300 m span;
2. Substantial radial thermal gradients reported to be as high
as 40 C This phenomena enhances the compressive load
previously mentioned; and
3. Permanent elongation of 0.09% of the steel wires will cause
an additional sag in the order of 1.3 m for a typical 300 m
span.
To quantify their research, Nigol and Barrett provide a number of
empirical equations to determine conductor stress. The main
departures from the classical equations are;
1. The aluminium and steel strain equations include an
additional term to provide for conductor creep;
28.
2. The high temperature performance of the conductor is
predicted by determining the birdcaging stress of the
' conductor; and
3. The coefficient of linear expansion is given by a quadratic
equation. The additional term is intended to compensate the
change in modulus of elasticity with change in temperature.
Nigol and Barrett have provided a most valuable definitive paper
on the characteristics of ACSR constructions at high temperatures
and stress. Many of the theories postulated by the authors are
supported by actual test results. As the demand for a more
efficient transmission system is required by authorities and
transmission line construction is restricted due to environmental
constraints, higher conductor operating temperatures will become
common practise. Nigol and Barrett's work has filled the gap in
the theory of operation of an ACSR construction at high
teraperature.
1.3.11 J.S. Barrett, P. Ralston and 0. Nigol 1982 (10)
The author's initially investigate the behaviour of aluminium and
steel wires in an ACSR construction. Comparisons have been made
the permanent elongation of wires and conductors and increased
plastic deformations in conductors is attributed to geometrical
29.
stranding factors. Similar plastic deformations in the steel
wires and steel core were small and this is said to be caused by
the' small lay angles of the steel wires.
Barrett, Ralston and Nigol discuss the calculated rated tensile
strength or more comraonly known as the calculated breaking load.
Historically the calculated breaking load is based on the
conductor achieving 1% elongation. Experience has shown that the
calculated breaking load is the sura of the individual wire
breaking loads having regard to an appropriate rating factor.
However in more recent times manufacturers have reported that
conductors often exceed the rated strength at strain values of
approximately 0.8% before failure.
The author's also discuss the stress strain tests of conductors
and an appropriate method of terminating the conductor to
minimise aluminium extrusion into the test length. The
termination method is not unlike the method used to terminate all
the conductor samples tested as part of these studies.
Of most significance is the author's discussion of excessive
conductor sags at high temperatures due to compressive loading in
the alurainium which has elongated at a greater rate than the
steel, but with both members forced to occupy the same length
resulting in a greater elongation of the steel core. Tests

30.
carried out by the author's suggests that compressive stresses
reach a limiting value corresponding to 6 to 12 MPa which would
result in 0.3 to 0.6 m extra sag in a typical span of 300 m.
Finally the author's describe the details of a new sag-tension
computer program named STESS which has previously been discussed.
1.3.12 Future Developments
Further works on the prediction of the mechanical behaviour of
conductors consist of:
1. The development of a time dependant tension and sag computer
program based on conductor creep predications. Subroutines
in fortran included in an existing sag tension program have
been developed as part of these studies;
2. The development of a mechanical loading history model based
on electrical loading and climatic predications proposed as
part of an undergraduate study program;
3. The establishment of an accurate thermal model of a
conductor;

31.
4. The establishment of a time dependent wire stress
redistribution model for an ACSR construction; and
5. Quantitative studies into the prestressing of conductors to
establish a creep resistant conductor behaviour. It is
anticipated that this will be the subject of a post graduate
research project funded by the Electrical Research Board.
1.4 CONDUCTOR, CORROSION RESISTANCE PROPERTIES
1.4.1 J.S. Forrest and J.M. Ward 1954 (39)
Forrest and Ward are the first known authors to publish works on
the "Service Experience of the Effects of Corrosion on Steel
Cored Aluminium Overhead Line Construction", which still remains
today as the most authorative paper on this subject. The paper
suramarises the investigation and conclusions reach as a result of
service experience extending over a period of 20 years.
The authors initially discuss the methods of raeasuring corrosion
and suggest several alternatives such as mechanical, electrical,
weight loss, depth of pitting and loss in cross section.
Regarding the mechanical assessment of corrosion it is suggested
that after measuring the wire tensile properties that the
allowable degree of deterioration is of the order of 12% loss of
strength for the complete conductor and if the deterioration is

32.
restricted to the aluminium strands and the steel core is not
reduced in strength that 30% loss of strength is acceptable. To
put' this into perspective for Lemon ACSR/GZ the calculated
breaking load would be derated from 90.1 kN to 79.3 kN and 65.7
kN respectively.
Forrest and Ward discount the electrical, weight loss, depth of
pitting and loss in cross section area as methods of assessment
of corrosion having insufficient sensitivity.
Secondly, the authors present an account of the type of
conductors used and the service experience of these conductors
from 1934 to 1952 installed throughout Great Britain. The
degradation results were presented in the form of linear
regression equations that determined deterioration as a function
of layer and pollution environraent. In general outlayer
industrial environment rate of deterioration was greatest,
followed by inner and outer layer aluminium coastal environment
with slowest deterioration rate being that of inner aluminium
industrial environment. This is summarises as a mean
deterioration of 0.5% and 0.4% per annum for industrial and
coastal environments respectively.
Descriptions of the type of corrosion and the factors affecting
corrosion are presented emphasizing the effects of the position
of the transmission line with respect to the sources of

33.
pollution. Notwithstanding the avoidance of such areas. Forest &
Ward suggest that the only method suitable for protection against
corrosion is to prevent the ingress of the corrosive substance.
This is achieved by the application of a protective grease and if
necessary coraplete irapregnation of the conductor.
1.4.2 R.D. Carter (undated) (25)
Carter published a paper on the "Corrosion Resistance of
Alurainiura Conductors in Overhead Service" which reviews the types
of conductor constructions in common use and surveys experience
gained in their resistance to corrosion under varying conditions
of use.
Initially the author describes the establishment of the alurainiura
hydroxide and its protective characteristics. Crevice corrosion
mechanism and the possibility of electrolytic action of the
conductor and fittings is also discussed.
Finally service experience of several samples of conductors and
constructions are discussed which would suggest,
1. For an ACSR 30/7 construction after 28 years exposure in a
rural environment, slight corrosion of the outside alurainiura
strands occurred with the ungreased galvanised steel core
unaffected. Tensile tests on the wires were regarded as
entirely satisfactory;

34.
2. For an ACSR 6/1 construction after 2 1/2 years exposure in a
saline environment, severe corrosion of the aluminium wires
' had occurred despite the use of the protective grease over
the steel core. Several wires broke in service;
3. For an AAC 19 construction after seven years exposure to a
severe saline environment, some
"slight overall corrosion had taken place on the outer layers and little crivice pitting internally but the tensile strength of the wires was satisfactory".
4. For an AAC 37 construction after forty two years exposure to
a saline environment, the conductor appeared to be unaffected
by corrosion with the exception of general weathering.
Carter also published preliminary results of corrosion tests in
severe saline environments, commenced in 1964 in collaboration
with the Illawarra County Council. The results are consistent
with those reported by other authors and indicate,
1. Slight external pitting generally less than 250 um will occur
after three years exposure;
2. No difference in external pitting between 1350 and 6201
alurainium;

35.
3. Severe attack on galvanized wires after three years exposure.
For complete removal of the zinc coating in three years a
_2 salt fall-out in the order of 160 g.m is necessary;
4. Protection of the aluminium wires will occur up to the point
that degradation of the zinc coating has occurred;
5. Good corrosion resistance to both internal and external
attack by AAAC and AAC constructions; and
6. A delay in the onset of internal corrosion results from the
use of a protective grease.
Carter is to be commended as providing a detailed account of
service experience of the corrosion resistance of aluminium alloy
conductors. From the results presented it is concluded that an
AAAC or AAC construction will perform equally as well as a copper
construction in a saline environment discounting a long time
design myth.
1.4.3 J.R. Booker 1986 (16)
The author presents a study on the "Natural Aging of
Non-Energised Aluminium Conductors". Booker reports on the
changing nature of the surface of the outer strands of the
aluminium stranded conductor from one of having hydrophobic
surface properties to that of hydepholic properties.
36.
Much of the authors work related to wet corona inception voltages
and corona discharge. However Booker suggest an interesting
phenomena of expulsion of water droplets from the conductor.
This may result in wire corona corrosion (43) being greater in
some localised strands than others.
1.4.4 B.J. Maddock, J.G. Allnutt, J.M. Ferguson, K.G. Lewis, D.A.
Swift, P.A. Swift, P.W. Teare and M.J. Tunstall 1986 (57)
The authors published results of "Some Investigation of the
Ageing of Overhead Lines", that include corrosion of tower legs,
conductor corrosion and the ageing of insulators.
Regarding conductor corrosion the authors present details of,
eddy current testing to detect the loss of galvanising zinc on
the steel wires, infra-red thermography to detect loss of cross
sectional area of the conductor and exaraination of conductor
samples for evidence of fatigue.
Not surprising, the authors advocate a fatigue free design
with dynamic strains less than internationally accepted values
(nominally 150 mm.km" ). This is achieved by a combination of
the use of generally two stockbridge vibration dampers per
subconductor and every day tensions restricted to approximately
20% of nominal breaking load.
37.
Of particular interest is the development of an optical
instrument capable of measuring line vibration frora the ground,
without any special target attached to the conductor. This would
be valuable in conductor sarapling to identify the raost active
vibration spans.
The authors also present detailed discussions on the effects of
an corrective action for conductor galloping and subconductor
oscillations.
1.4.5 Future Developraents
A greater understanding of the corrosion mechanisms of conductors
will only be achieved by the circulation of a questionnaire to
all Australian supply authorities and the establishment of a data
base of information. Such work is viewed to be the
responsibility of the Electrical Supply Association of Australian
(ESAA). As a result of these studies a recommendation will be
submitted to ESAA to form an Ad Hoc Committee to institute the
questionnaire and data base and publish the findings.
38.
1.5 CONDUCTOR FATIGUE PROPERTIES
1.5.1 J.C Little, D.G. MacMillan and J.V. Majercak 1950 (56)
The authors published the only known work on the "Vibration and
Fatigue Life of Steel Strand", consisting of a study of wire and
strand properties that would determine,
1. The fatigue limit of various materials used in overhead
ground strands;
2. The effects of operating teramperature on the fatigue limit;
3. The extent to which the change in elastic modulus caused by
temperature changes affects the calculated stresses;
4. The extent to which operating stresses were affected by
linear expansion coefficient;
5. The effects of working tension on the vibration fatigue life
of clamped extra high strength galvanized strand; and
6. Investigation of the possible measures for improving
operating performance.
39.
The results of the experiemental work indicated,
1. 'The fatigue limit of the wire increases as the tensile
strength increases;
2. A small increase in fatigue limit exists at temperatures less
than 0 C, however no evidence existed of a decrease in the
fatigue limit with high temperatures;
3. A decrease in elastic modulus of the order of 3% with a
temperature increase from 0 C to 100 C;
4. That, as expected, temperature increases results in
decreasing wire tension;
5. That, as expected, increasing static stress for a constant
dynamic stress the fatigue limit is decreased; and
6. That, as expected, with the application of armour rods a
marginal increase in fatigue limit is achieved.
1.5.2 J.S. Tompkins, L.L. Merrill and B.L. Jones 1956 (79)
The authors published a paper on the "Quantitative Relationships
in Conductor Vibration Damping" based on electrical - mechanical
analogies. Parallels are drawn between circuit impedance

40.
matching and the characteristic matching of vibration dampers to
conductor tension, mass and diaraeter.
t
With the exception of the vibration frequency and conductor
diameter relationship and the conductor tension, mass, frequency
and loop length relationship, raost of the work by Torapkins,
Merill and Jones relates to the power input frora the wind to the
conductor and the power dissipation by line hardware.
Accordingly, whilst it is appropriate to recognise the authors
work it will not be discussed in detail.
1.5.3 R.F. Steidel, Jr. 1959 (76)
The author published methods of evaluating the factors affecting
the actual stresses or strains in a vibrating conductor.
Equations for conductor deflection, slope, bending moment and
shear either side of suspension point are derived. In addition
an equation of the motion for a conductor is derived and three
boundary conditions solutions for the support point are
presented, the pinned-pinned loop, clamped-pinned loop and the
realistic raodel, partially clamped-pinned loop.
Steidel used a design parameter s as the boundary conditions that
is somewhere between the regime of pinned and the fixed end
model. The fraction 1-e represents that portion of the maximum
41.
bending moraent for the fixed end. Subsequent experimental work
suggests the conductor suspension clamp arrangement approached
the' ideal pinned-end condition where s = 1.
The author has developed equations for use in the design of
suspension clamps and necessary saddle curvature which will
uniformly distribute the bearing load of the suspension clamp and
reduces the mean stress in the individual strands.
1.5.4 M.B. Elton, A.R. Hard and A.N. Shealy 1959 (38)
The authors have published a paper on "Transmission Conductor
Vibration Tests" that initially discusses observations from field
and laboratory tests. Two fatigue endurance service experiences
presented were,
1. Unarmoured, undamped Drake ACSR operating at 15 C with
tension of 18.9% of the calculated breaking load and
vibration at 70% of the time with a total of 2.5 gigacycles
over 7.6 years having no evidence of fatigue damage; and
2. Unarmoured, undamped Drake ACSR with similar conditions as
above with 1.4 gigacycles of vibration in 4.7 years having
fatigue fractures occurring in the outside wires.
42.
Unfortunately in both these cases the dynamic stress levels were
not disclosed; accordingly the published results must be said to
be inconclusive.
The authors discuss the effects of armour rods and stockbridge
dampers suggesting when used, the cyclic stress can be reduced by
approximately 50% and 90% respectively.
An extensive study was carried on in-service Chukar ACSR. The
results indicate that 200 megacycles occur at the lowest strain
levels whereas only 100 cycles exceed the maximura raeasured 550
mra.km" strain. Further,
"less than 1 megacycles would be expected to exceed 400 mm.km" strain".
Elton, Hard and Shealy attempted to correlate the hourly changes
of strain with wind data however,
"no definite trend was observable between uniformity of the wind and conductor strain level".
43.
1.5.5 J.C. Poffenberger and R.L. Swart 1965 (67)
The' authors provide a mathematical solution for the conductor
differential displacement caused by wind induced aeolian
vibration. The solution suggests the relationship to be
dependent on conductor tension, flexural rigidity and conductor
physical properties.
The relationship of bending amplitude is linear with the
exception of high frequencies when the loop lengths are
relatively short compared to the deflection arm integration
constant.
Analytic solutions of the equations are in good agreement with
experimental data frora three laboratories.
1.5.6 W.G. Fricke, Jr and C.B. Rawlins 1968 (41)
The authors published definitive paper that describes the
"Importance of Fretting in Vibration Failures of Stranded
Conductor". The purpose of the investigation was
"to evaluate, by metallographic raeans, the damage done to a conductor by fretting, to estimate in what proportion of vibration fatigue failures fretting is a contributing influence and establish the order of magnitude of its effect upon fatigue strength".
44.
The research program consisted of two parts,
1. The collection and metallographic examination of a number of
fatigued wires from ACSR construction; and
2. Fatigue tests of laboratory spans that quantitative describe
the effects of fretting.
The findings of Fricke and Rawlins works suggests, all failures
in stranded conductors examined whether induced in the laboratory
or found in service initiated at frett sites, fretting reduces
the fatigue strength by a factor of about 0.5 or 0.6 and the
effect of fretting can be reduced by the application of wire
surface coatings such as grease.
1.5.7 Claren and Diana 1969 (30)
Claren and Diana published works on the "Dynamic Strain
Distribution of Loaded Stranded Cables", illustrating the
relationships of dynaraic strains occuring in spans and those
occurring at rigid clamped supports and how wire movements
contribute to the conductor's internal damping.
The authors solve the partial differential equation of the load
circular section beam, the boundary condition problem and
provided solutions for the maximum strain and raaxiraum antinode

45.
strain. A series of tests were carried out to correlate
predicted and experiraental results.
Unlike Poffenberger and Swart (67), Claren and Diana assumed the
wires in the conductor to act as and form a corapletely rigid
cylinder. In later discussions the authors agree with the loose
wire theory suggesting the results could be too high by a factor
of 3. This is significant as the flexural rigidity frora the
rigid model to that of the free model can vary by a factor of 7.
The authors provided a relationship of the outer wire strains and
the anitode vibration, wave length, tensile load and the flexural
rigidity. The relationship derived are similar to those of
Poffenberger and Swart (67) published in 1965.
1.5.8 R.A. Carter and D.G. Quick 1979 (26)
The authors present a paper titled "NDT of High Voltage
Transmission Lines", in which gamraa and x-ray radiography were
used to detect evidence of early fatigue conditions in a
transmission line conductor.
Carter and Quick initially decided on X-ray raethod for field
radiography because of the greater sensitivity and considerably
shorter exposure times. Two exposures are necessary at right
angles to reraove the effect of raasking causes by the steel core.

46.
Removal of the suspension clamp also increased the sensitivity of
the radiography.
With developments gamma radiography was used on future
inspections as the equipment was more reliable and exposure times
were reduced to that similar to the X-ray raethod.
Unfortunately radiography of conductor samples will only detect
the presence of broken wires and cannot be used as a method of
predicting the long term performance of the conductor.
1.5.9 A.S. Richardson, Jr. and F.S. Smith 1981 (71)
The authors published a paper on "Some Effects of Tension on
Static Wire Fatigue in New England" in which a review of the
various factors affecting fatigue stress in overhead static wires
is carried out.
The authors suggest that the bending stresses due to aeolion
vibration are a function of the 3/2 power of tension. Case
studies of the present practise in New England of setting the
initial tension at 12.5% of the calculated breaking load, no ice
and 0°F are given. According to Richardson and Smith increasing
initial tension to limit sag under ice conditions would not
return benefits comraensurate with the increased risk of fatigue
damage.

47.
Richardson and Sraith worked lacked adequate inforraation on the
wind energy input and the power dissipation by the various
mechanisms. To overcome the lack of background data the authors
developed a simplified model to which they applied the available
data and made several simple assumptions.
1.5.10 W. Philipps, W. Carlshem and W. Buckner - (Prior 1985) (68)
The authors presented this report to CIGRE Study Committee,
Working Group 04, titled "The Endurance Capability of Single and
Bundle Transmission Line Conductors and its Evaluation" which is
the culmination of other published works (38, 46, 51, 58, 67 and
76) and additional experimental work in Europe.
The object of the studies was to establish the capability of a
conductor to endure a combination of static and dynamic stresses;
carry out full scale outdoor conductor vibration tests and
finally to develop a calculating method for the endurance of the
conductor.
Findings of the fatigue tests for AAC and AAAC suggest,
1. Alloyed aluminium conductors exhibit the same fatigue
strength as unalloyed aluminium conductors;

48.
2. With the influence of armour rods and suspension clamps, the
fatigue strength was reduced to 70% of that of the original
' conductor;
3. With the influence of suspension clamps the fatigue strength
was reduced to 50% of that of the original conductor;
4. That 50% of the fatigue fractures initiated at fretting sites
and the other fatigue fractures initiated at wire defect
sites;
5. Unlike other investigations, all wire fractures occurred in
the outside layer of the conductor and the failures were
attributed to fretting between the suspension clamp and the
wires; and
6. With a mean static stress increase of approximately 60% the
conductor fatigue strength is reduced to 25% of that of the
original conductor.
It is the opinion of the authors that conductor designs must be
arranged that the dynamic stress in excess of 5 N.rara" should not
be reached in service. Furtherraore, that dynamic stress
measurements should not be carried out in the initial 6-12 months
after stringing as the creep of the conductor will influence the
results.

49.
A series of S-N curves produced from field studies suggest, that
1. ' Self damping of a conductor increases as static stress
decreases;
2. Only slightly higher dynaraic stresses are reached if static
stress is increased from 20.5% to 27.1% and 21.4% to 23.5%
for 560/50 and 230/30 ACSR construction respectively;
3. Multiple suspension clamps may reduce the dynamic stress by
as much as 20%; and an arraour grip suspension unit by as much
as 60%;
4. Flat terrain compared to hilly terrain may increase the
dynamic stress in the order of 400%;
5. Vibration damrapers will reduce dynamic stress by
approximately 500%; and
6. Bundling conductors will reduce dynamic stress by
approximately 30%.
Philipps, Carlshem and Buckner calculated the effects of bending
stress on realistic conductor span combinations. The results
indicate that the bending stress is between two and four times
that of the static stress. This will result in higher total
50.
stresses at lower static stresses. In other words the bending
stress increases with decreasing tensile stress and increasing
span length.
The authors conclusions are,
1. The fatigue limit of hard drawn aluminium wires, is between
_2 10 and 20 N.mm depending on static prestessing;
2 2. For a 593 mm AAC at a mean static and bending stress of 110
-2 7 N.mm and 10 load cycles, the mean fatigue limit of the
conductor, conductor with suspension clamp and arraour rod and
-2 -2 conductor with suspension clamp is 22 N.mm , 15 N.mm and
_2 11 N.ram respectively;
o
3. For conductors with normal suspension dampers at 10 load
cycles an ultimate allowable dynamic bending stress of 7
_2 N.mm may be assumed; and
4. The terrain effect will have a significant impact on the
conductor and hardware design.
1.5.11 T.V. Gopolan 1985 (45)
Gopolan published a paper on "Fatigue damage criterion for ACSR"
in which he discusses the damage criteria based on dynaraic stress
and fretting.

51.
The author, using the dynaraic strain equation derived by Claren
and Diana (30) and an appropriate value for the flexural
rigidity, derives an equation for the double amplitude of
vibration in terms of frequency of vibration. A sirailar but raore
general equation is given in Chapter 4. The liraiting criteria is
300 mm.km and 150 mra.kra for conductor greater 18 ram diameter
and for smaller conductors respectively.
1.5.12 W.F. Buckner, R. Helm & K.O. Papailiou 1986 (23)
The authors published a paper titled "The Effect of Ageing of
Overhead Line Conductors due to Aeolion Vibration". The
discussion commences with a description of the stresses in and
fatigue failures of conductors.
S-N curves for aluminium wires and stranded conductors are
presented which suggest that stranded conductors are less fatigue
resistance and do not have a asyratopic behaviour. In view of
these S-N curves and with permissible strain limits in the outer
aluminium layer of the conductor of 150 mm.km" corresponding to
as CIGRE (29) recomraend a perraissible stress limit of 10-15
_2 N.mm fatigue failure is still possible.
The authors describe a very interesting method of sampling for
evidence of conductor fatigue. Unlike the methods used in these
studies which studied terrain and prevailing climate conditions

52.
and sampling was based on the sites raost likely to be susceptible
to fatigue, Buckner, Helm and Papailiou carried out a quantitive
dynamic stress level survey to identify the critically stressed
sites. Frora these studies an estimation of conductor fatigue
life is determined using Miners (58) cumulative fatigue
hypothesis and known S-N curves.
Finally the author's gave an account of the effects of different
line hardware and terrain on the life estimation of a conductor.
1.5.13 Future Developraents
Further works on the predication of the Fatigue Properties of
conductors consist of,
1. The establishraent a test line with several identical
conductors strung at differing tensions, having tailored
vibration reducing hardware attached to each span and
measuring and comparing the resultant dynamic strains as a
function of wind velocity. This program would enable an
assessraent of the effect of increased static stress,
decreased bending stress and constant designed dynamic stress
to be achieved simultaneously.
53.
2. The establishment of S-N curves for Australian manufactured
conductors and enable an understanding of the effects of
< alloying alurainiura on the fatigue limit. As part of these
studies a conductor fatigue tester was constructed and
comraissioned to achieve the S-N curve test results. This is
discussed in detail in Chapter 4.
3. The investigation of the effect of conductor fittings on the
S-N curves.
CHAPTER TWO
CONDUCTOR TENSION AND SAG
2.1 INTRODUCTION
The basic theory of transmission line conductor tension and sag has been
well , established over many years and has become time honoured by
transmission line engineers.
Commencing as early as the 1920's history has shown that much work and
research has been published to provide definitive raethods for determining
tension and sag. In those early days the basic calculating tools were
mathematical tables, slide rules and in some cases mechanical calculating
machines. Consequently to simplify the theoretical catenary equations,
raost of the early works employed the parabolic approximations of the
catenary sag curve.
With the common use of computers by engineers in the 1960's more exacting
solutions of the parabolic equations were demanded to provide a more
comprehensive understanding of the basic theory and more importantly to
minimise the capital costs of transmission line construction. To put this
into perspective a modern structure spotting computer program employing
catenary equations has been said to save up to three percent of the total
capital construction costs.

55.
Even as recent as 1983, Barnett, Dutta and Nigol (9) published the details
of a strain summation method for calculating tension and sags of an ACSR
conductor.
"based on a conductor model which is more realistic and conceptually simpler".
The raost accepted and widely used raethod of deterraining tension and sag is
the classical equivalent span theory given by Boyse and Simpson (17). In
raore recent tiraes Barrien (12) provided the continuous catenary raethod for
determining tension and sag which revealed in particular circumstances,
significant discrepancies in the classical equivalent span theory. The
most current development in determining tension and sag is that of the
strain summation using the computer program STESS (Sag Tension by Strain
Summation) published by Nigol and Barrett (9, 63, 64).
It is now appropriate to review the methods available to determine
conductor tension and sag. The objectives of these studies is as follows.
1. Determine the benefits of the alternative tension and sag calculating
methods;
2. Examine the approximations employed in the various calculating
raethods;
3. Develop methods to measure conductor tension and sag of in service
transmission lines.
56.
4. Correlate the results of survey raeasureraents to determine existing
transmission line conductor tension and sag with design parameters.
5. Ascertain the amount of conductor inelastic stretch and loss of
strength in aged transraission line conductors by survey raeasureraents.
6. Review the current allowances for conductor inelastic stretch.
2.2 FUNDAMENTAL THEORY
The problera of determining tension and sag designs for transmission line
and distribution conductors is generally restricted to determining the
conductor mechanical loading conditions within the bounds of the following
constraints.
1. Everyday Tension (EDT) or the still air constraint. This constraint
deterraines a suitable level of conductor stress to limit the
likelihood of long term conductor fatigue caused by aeolian vibration.
2. Maximum Working Tension (MWT). The raaxiraum working tension usually
occurs at the raaximura design wind and an everyday arabient temperature.
In short spans the maximum working tension can be at low ambient
temperatures. For elevations greater than 1200 m a combination of
raaxiraum design wind and raaxiraum design ice mass will produce a maximum
working tension. The maximum working tension ensures adquate safety
factors for all line equipment, structures and foundations.

57,
3. Maximum Operating Temperature (MOT). This constraint ensures that at
a maximum operating temperature, the required minimum ground clearance
is maintained and the loss of ultimate tensile strength of the
conductor due to annealing is minimised.
4. Stringing Constraint. This involves any allowances in sag for the
inelastic stretch in the conductor before final termination or the
prestressing of the conductor to stabilise the inelastic stretch prior
to final termination.
5. Maintenance Constraint. This constraint allows for the compliance of
statutory safety factors during maintenance operations.
Further to these mechanical design considerations are the electrical
constraints of providing structure earthing, lightning protection,
electrical insulation and clearances at supporting structures and
electrical clearance at midspan. The latter requires a knowledge of the
motion of a conductor under varying prevailing climatic conditions. At
higher voltages, corona power loss and in particular its interference with
communication systems will have a major influence on conductor diameter,
the need to bundle conductors and conductor spacing.
From the aboveraentioned constraints it is easily concluded that the
fundamental requirements for the mechanical design of transmission lines
may be restricted to the need to determine conductor vertical sag,
conductor tension, long term conductor creep behaviour and the loss of
ultimate tensile strength due to annealing. The later two design criteria
will be discussed in Chapter Three.
58.
2.2.1 Vertical Conductor Sag
The statutory requirements in NSW (37) for conductor clearance is
a function of the operating voltage, the raaximum operating
temperature and the services that the transmission line will
cross. Higher voltage transmission lines require more ground
clearance as does the spanning of roads, other aerial services
and areas likely to be frequented by motor vehicles. On the other
hand, $ifter allowance for the inelastic stretch of the conductor,
ground clearance provided in excess of the statutory requirements
implies an over design and uneconomical capital expenditure.
With these boundary constraints, conductor sag and conductor sag
change with time must be determined with a reasonable degree of
accuracy.
The allowance for inelastic stretch of the conductor normally
consists of a margin on the statutory requirement (37) of
clearance. For the Electricity Commission of NSW this marginal
allowance varies depending on voltage but may be the same for
differing conductors constructions. Table 2.1 lists the adopted
clearance policy, the statutory clearances requirement for open
country not frequented by raotor vehicles and the marginal
allowances for inelastic stretch. Included in these marginal
allowances is allowances for structure settlement and survey
discrepancies.
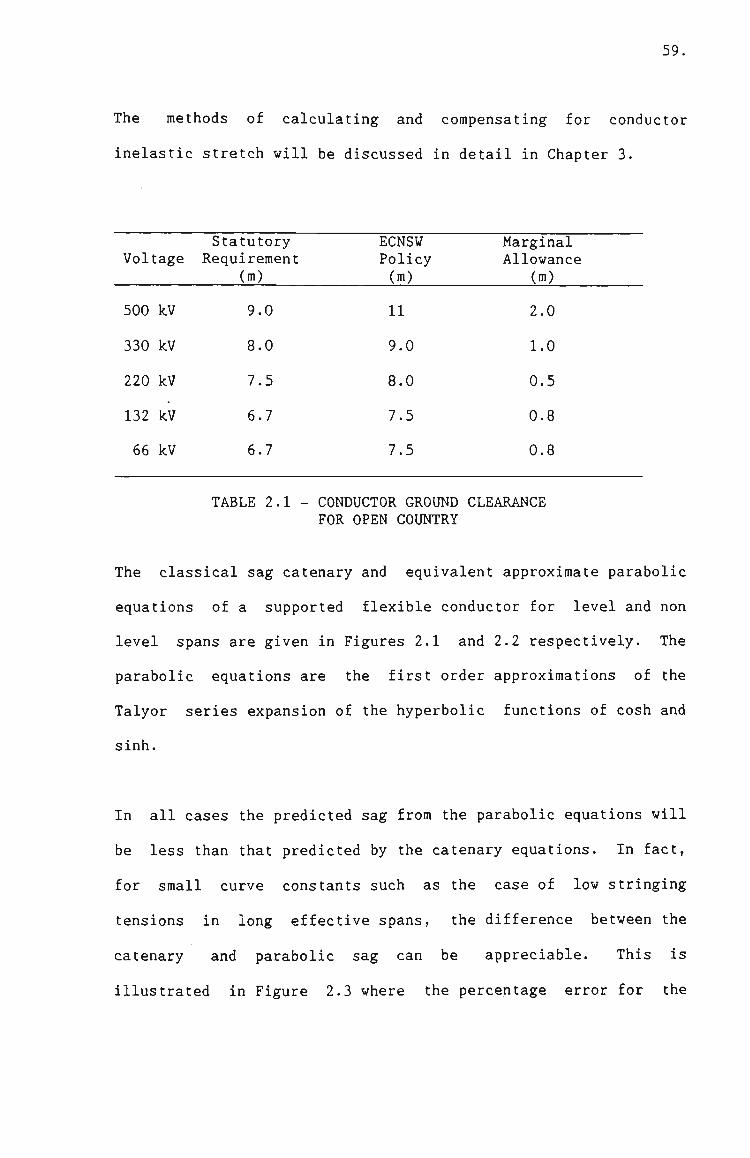
59.
The methods of calculating and compensating for conductor
inelastic stretch will be discussed in detail in Chapter 3.
Voltage
500 kV
330 kV
220 kV
132 kV
66 kV
Statutory Requirement
(m)
9.0
8.0
7.5
6.7
6.7
ECNSW Policy (m)
11
9.0
8.0
7.5
7.5
Marginal Allowance
(m)
2.0
1.0
0.5
0.8
0.8
TABLE 2.1 - CONDUCTOR GROUND CLEARANCE FOR OPEN COUNTRY
The classical sag catenary and equivalent approximate parabolic
equations of a supported flexible conductor for level and non
level spans are given in Figures 2.1 and 2.2 respectively. The
parabolic equations are the first order approximations of the
Talyor series expansion of the hyperbolic functions of cosh and
sinh.
In all cases the predicted sag frora the parabolic equations will
be less than that predicted by the catenary equations. In fact,
for small curve constants such as the case of low stringing
tensions in long effective spans, the difference between the
catenary and parabolic sag can be appreciable. This is
illustrated in Figure 2.3 where the percentage error for the

60
B ( x , / y , )
PARAMETER CATENARY PARABOLIC
CURVE CONSTANT, c
SAG AT ANY POINT, x
MAXIMUM SAG, S
c
c
cosh
cosh
_ c _
"L ' _2c .
- 1
- 1
J(_ 2c
2
8c
CONDUCTOR LENGTH, I 2c s i nh 2c ^ 24c
FIGURE 2.1 CATENARY AND PARABOLIC SAG EQUATIONS
T.FVF.T. SIPAN?^

61
PARAMETER CATENARY PARABOLIC
CURVE CONSTANT, c CO CO
SAG AT ANY POINT, x
MAXIMUM SAG, S
CONDUCTOR LENGTH, L
DISTANCE, X
c
c
c
cosh
cosh ^
1—
cosh
c
^ x ~ 1
u_C_
rx"! 2_
_ c _
- 1
- 1
r — r
- 1
r X. X ~i c sinh -^+sinh ^ L c c J
- c sinh -1 H
K
L U-' H —- +c Sinh
2c
A 2c
2 x
_ 2 . 2c
L + H'
24c
L 2
L
2L
-^1 ,. r H
K
EFFECTIVE SPAN LENGTH, L ef f L + 2 c s i n h " ' -^
K L + 2c —
where K = 2c sinh — 2c
FIGURE 2.2 CATENARY AND PARABOLIC SAG EQUATIONS
NON LEVEL SPANS

u
62
\ \
\ \
V
\
Effective Span 300ro
Effective Span 600m
C 2 O \ — Effective Span SOOro
& \ \ • Effective Span 1200m
5 \ \ \
J3 1 - \ D
° . . V \ s
X \
V
J I L 1000 1500 2000 2500 3000
Curve Constant Cm)
FIG 2.3 PARABOLIC SAG ERROR
63.
predicted sag of a range of effective spans and curve constants
for the parabolic sag equation is given. Academically it is also
interesting to note as Winkleman (80) commented.
"that any inflexibility in the conductor will result in sags less than that of the predicted catenary sag.
The predicted conductor length frora the parabolic equation will
also be less than that predicted by the catenary equation. For
sraall curve constants the difference between the catenary and
parabolic lengths can be considerable. This difference is
illustrated in Figure 2.4 where the percentage error for the
predicted conductor length of a range of effective spans and
curve constants for the parabolic conductor length equation is
given.
It should be noted that although the conductor length is
generally not a design parameter it is the basis of determining
conductor tension and inelastic stretch allowances.
2,2.2 Conductor Tension
The statutory requirements in NSW (37) for conductor tension
designs after making an allowance for inelastic stretch is based
on the following three conditions.

64
C o L C LU
CD C 01
L O +-u U c
O 2
U
o n 0 c D
CL
\
\
\ Effective Span SOOra
Effective Span 600m
— Effective Span 900m
Effective Span 1200m
y
\
\
\ \
\ \
\ \ N.
\ \
s
s
N
± 1000 1500 2000 2500 3000
Curve Constant Cm)
FIG 2 .4 PARABOLIC CONDUCTOR LENGTH ERROR

65.
1. At an ambient temperature of 15°C and a horizontal wind
pressure of 500 Pa applied orthoginal to the projected area
of the conductor, the tension must not exceed 50^ of the
ultimate tensile strength.
2. At an arabient temperature of 5°C and no wind for ACSR, AAC
and AAAC fitted with conductor vibration dampers, the
conductor tension must not exceed 25% of the ultimate
tensile strength. For ACSR, AAC and AAAC not fitted with
vibration dampers the tension is reduced to 18% of the
ultimate tensile strength.
3. After making provisions for additional loads on conductors
caused by the accumulation of ice and snow the tension must
not exceed 50% of the ultimate tensile strength. Plate 2.1
illustrates the accumulation of ice and snow on a
transmission line conductor under laboratory conditions.
It is clear from these requirements that the conductor tension
needs to be determined for a variety of climatic conditions. A
reference design conductor tension or bench mark tension is
assuraed for all span lengths and is generally taken at a
conductor temperature of 5 C and no wind. * This assuraption
satisfies the penultimate aboveraentioned statutory condition.

66.
PLATE 2.1 - ACCUMULATION OF ICE AND SNOW ON TRANSMISSION LINE CONDUCTORS
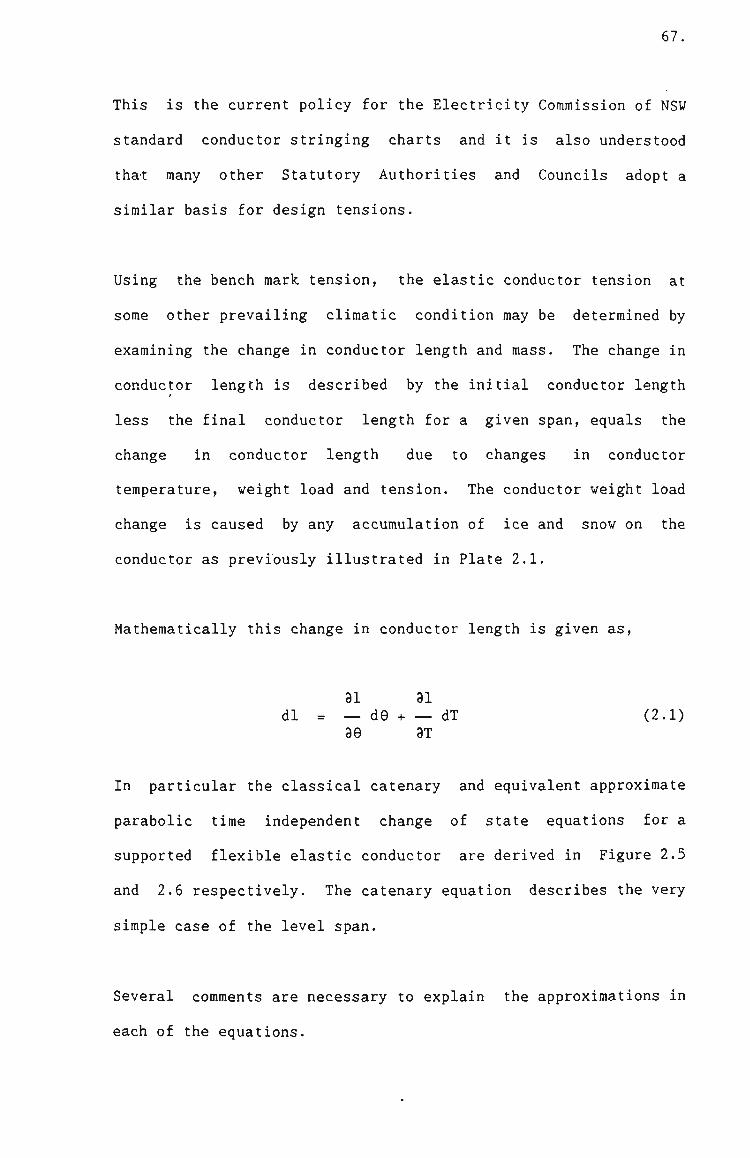
67,
This is the current policy for the Electricity Commission of NSW
standard conductor stringing charts and it is also understood
that many other Statutory Authorities and Councils adopt a
similar basis for design tensions.
Using the bench mark tension, the elastic conductor tension at
sorae other prevailing climatic condition may be determined by
examining the change in conductor length and raass. The change in
conductor length is described by the initial conductor length
less the final conductor length for a given span, equals the
change in conductor length due to changes in conductor
temperature, weight load and tension. The conductor weight load
change is caused by any accumulation of ice and snow on the
conductor as previously illustrated in Plate 2.1.
Mathematically this change in conductor length is given as.
31 31 dl = — de + — dT (2.1)
39 3T
In particular the classical catenary and equivalent approximate
parabolic time independent change of state equations for a
supported flexible elastic conductor are derived in Figure 2.5
and 2.6 respectively. The catenary equation describes the very
simple case of the level span.
Several comraents are necessary to explain the approxiraations in
each of the equations.

68
initial + change in length + change in length = final conductor due to temperature due to tension conductor length change change length
2T, Lw., 1 2T. - Lw„ "^ sinh 1- + 061(92 - 9 ) + (T2 - T^) = —iil sinh ^ "1 • ^\l ^E "2 ^\2
Assuraing that L=l and T, =T then,
2C-T Lw 2C.T^ Lw„ —i-i sinh — - T, - C 9 = —i-=- sinh — - T„ - C„9„ w L 2T^ -L ^ i ^^ 2T
where C. - EA C2 = oEA
The suffixes for w, T and 9 denote initial and final conditions.
FIGURE 2.5 CATENARY CHANGE OF STATE EQUATION
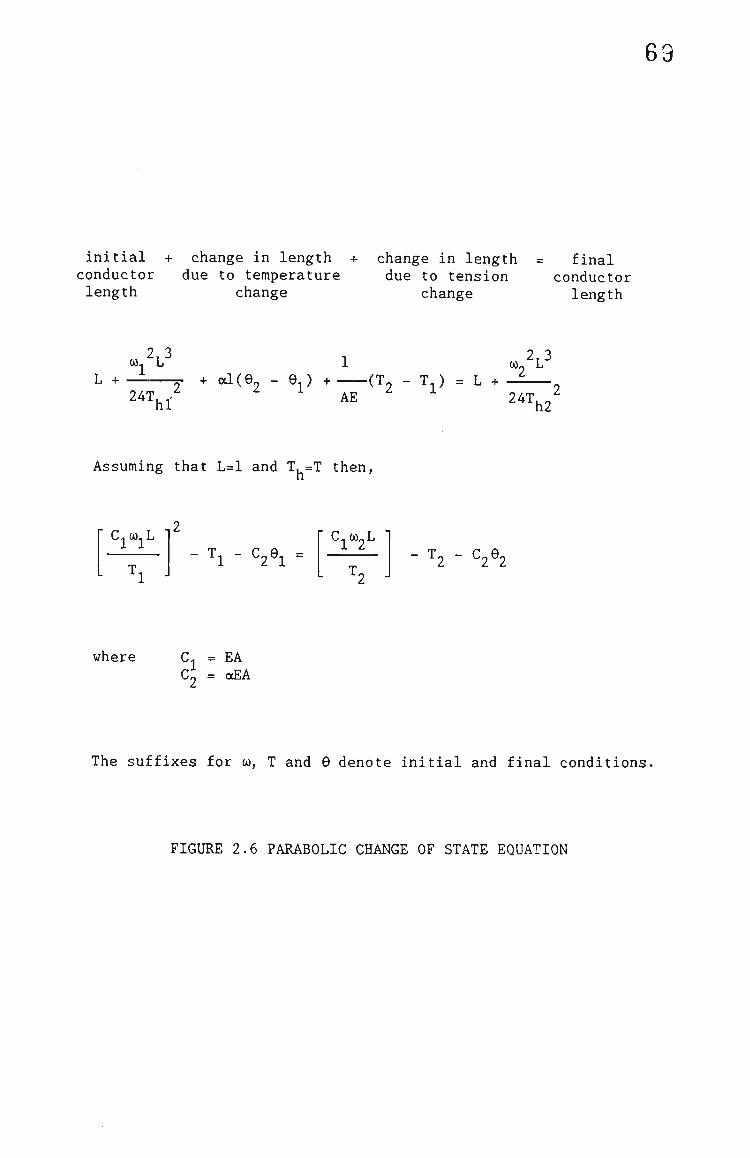
69
initial + change in length + change in length = final conductor due to teraperature due to tension conductor length change change length
OJ L 1 w ^L^ L + — ^ + od(9 - 9 ) + (T - T ) = L + — .
24T,v - AE ^ - 24T, ^ hl •h2
Assuraing that L=l and T, =T then,
C-w-L - T^ - C29, =
C C02L
- "^2 ~ ^2^2
where C. = EA C2 = oEA
The suffixes for oi, T and 9 denote initial and final conditions.
FIGURE 2.6 PARABOLIC CHANGE OF STATE EQUATION

70.
2.2.2.1 Conductor Horizontal Tension
Both the catenary and parabolic equations approximate the
horizontal conductor tension and the actual conductor tension as
equal, that is T, = T. At the low point of the sag curve this is
obviously true. As a result of the relatively small vertical
component of tension due to the weight load of the conductor at
the conductor attachment point T > T, . To compensate for this
slight increase in conductor tension a rule of thumb reduction of
10% of the bench mark tension has been adopted that adequately
accounts for this approximation. In other words, for ACSR
conductors fitted with vibration dampers the percentage of
ultimate tensile strength is reduced from 25% to 22.5%.
The actual maximum conductor tension at the supporting structure
will be a function of the span length and conductor attachment
reduced level or put more simply the weight span of the conductor
each side of the supporting structure. The exact catenary
equation for the conductor tension at the supporting structure
for level spans is given as,
0) L
n T = T cosh (2.2)
h 2T
having the first order Talyor series expansion parabolic
approximation of,

71.
2 2 2 4 CO L 0) L
n n T = T + + (2.3)
h 8T 3 h 24T
h
2.2.2.2 Average Conductor Tension
When determining conductor inelastic stretch it must be decided
whether the horizontal or actual conductor tension at the
attachment point should be used. Whilst the difference between
both these tensions is marginal, the use of actual conductor will
lead to an over estimation in inelastic stretch. In contrast
horizontal conductor tension will lead to an under estimate of in
inelastic stretch.
A more appropriate tension for determining inelastic stretch is
the average conductor tension. The average conductor tension
along the conductor length is given as,
1/2 2
av 1 0
t'dl (2.4)
where t is the conductor tension at any point in the chord length
and is derived by substituting x = L/2 into equation (2.2), hence
X
t'= T cosh (2.5) c

72.
From Figure 2.1 the conductor length equation for any horizontal
distance x is given as.
X 1 = c sinh (2.6)
or
X
dl = cosh dx c
(2.7)
Nigol & Barrett (63) provide the solution of equation (2.4) by
the substitution of equations (2.5), (2.6) and (2.7) and with the
appropriate transformations, the average tension is given by,
av
T
2 cosh
' 1 ^ 1 — — + —
.2c J 2c { 1
sinh .2c >
(2.8)
2.2.2.3 Conductor Span Length
The next approximation used in both the catenary and the
parabolic equations equates the span length and the conductor
length, that is L = 1. In this instance, the parabolic equation
is raore exact since the parabolic sag is less than the catenary
sag. The error in the parabolic sag for a typical range of curve
constants and fixed effective span lengths does not exceed
0.002%. Even for a curve constant of 1000 and a fixed effective
span of 1200 m, that is a very slack span, the error is as little
as 0.006%.

73.
In contrast figure 2.7 illustrates the error in the catenary/span
length error of a range of effective spans and curve constants.
In addition to the span length approximations already mentioned,
in non fixed spans such as that of suspension structures which
allow longitudinal movement of the conductor attachment point,
the conductor horizontal component of tension in adjacent spans
having dissimilar length will be equalised to some extent by
longitudinal moveraents of the insulator string. This moveraent
whilst small, contributes to an error in span length.
Maximum longitudinal insulator movement or maximura longitudinal
conductor tension acting on a conductor attachraent point will
occur at maximum operating temperature.
Unlike Boyce and Simpson (17) who assumed the horizontal
component of tension in a transraission line section was constant
thus establishing the equivalent span theory, Barrien (12)
developed the continuous catenary theory by considering a balance
of the weight of the insulator string and the weight of the
conductor on each side of the insulator string acting at the
insulator/structure attachment point.
This continuous catenary theory accounts for the approximate
equalisation of the adjacent span tension and longitudinal
moveraent of the suspension insulator string. As previously
mentioned this longitudinal moveraent of the suspension insulator
string is effectively a span length change.
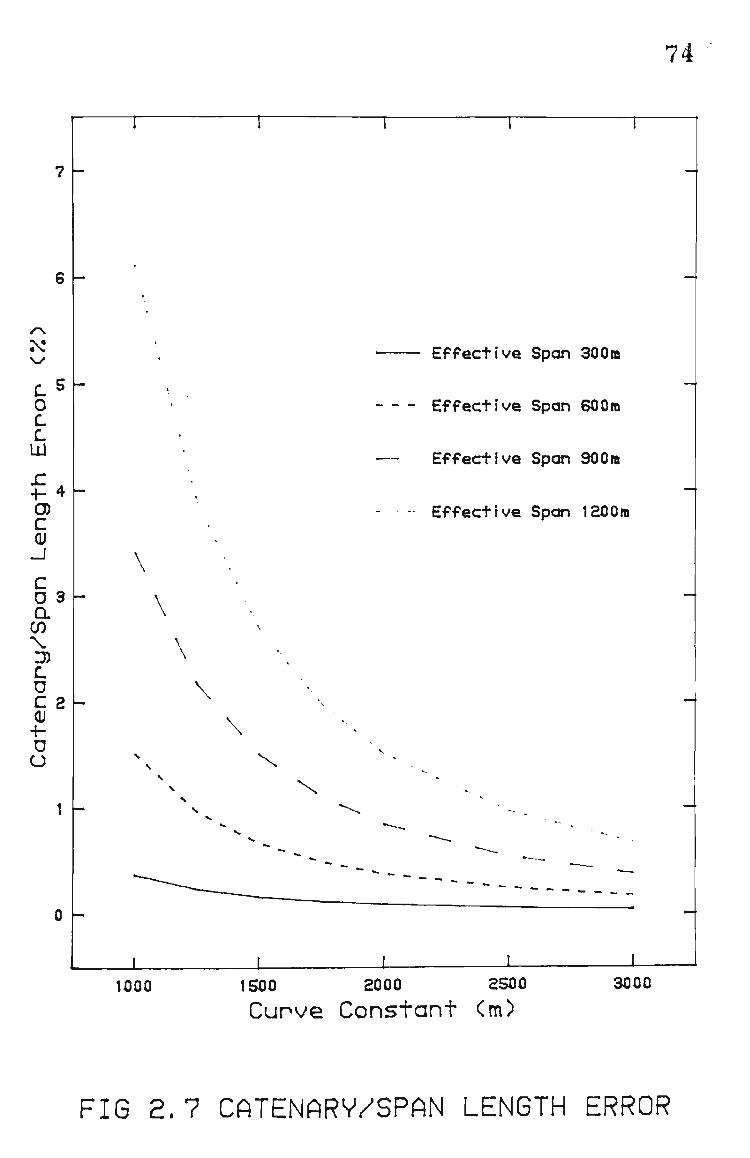
5
\
74
•j Effective Span 300m
Effective Span 900m
C O Effective Span 600m C L lil
r , 0) - E f f e c t i v e Span 1200m
\
c 0 3 h \ a \
(fi D) L C 2 ^
-h \ D CJ \ \
V
N X %
»»
J I L 1000 1500 2000 2500 3000
Curve Constant <m)
FIG 2 .7 CATENARV/SPAN LENGTH ERROR

75.
Typical raovements can be of the order of 20 mm for spans of 400 m
in gently undulating topography. This represents a differential
tension at a suspension structure of the order of 5%.
The next approximation used in the parabolic change of state
equations is that of the first order approximation of the
parabolic curve length compared with the exact catenary curve
length used in the catenary change of state equation. In
mathematical terms coraparing the catenary curve length equation
given as,
L
1 = 2c sinh (2.9) 2c
with the first order Talyor series expansion parabolic
approximation of
3 L
1 = L + (2.10) 2
24c
The error associated with this approximation has already been
discussed in section 2.3.1 and illustrated in Figure 2.4.

76.
As previously mentioned Boyce and Simpson (17) established the
equivalent span theory by assuming a constant tension in a
transmission line section. Any tension variations due to
climatic changes will depend on the span length in the section
and the whole section of line will behave in a similar way as an
"equivalent span".
This is illustrated by assuming a series of freely supported
spans 1-, ly, 1~, 1, etc. having a total section length of El.
The total length of conductor under the an initial conditions of
T. and w is given by.
1 n + 21 (2.11)
2 24c
1
and at some final condition of T2 and W2 the total conductor
length is given by.
1
n + n (2.12) 2
24c 2
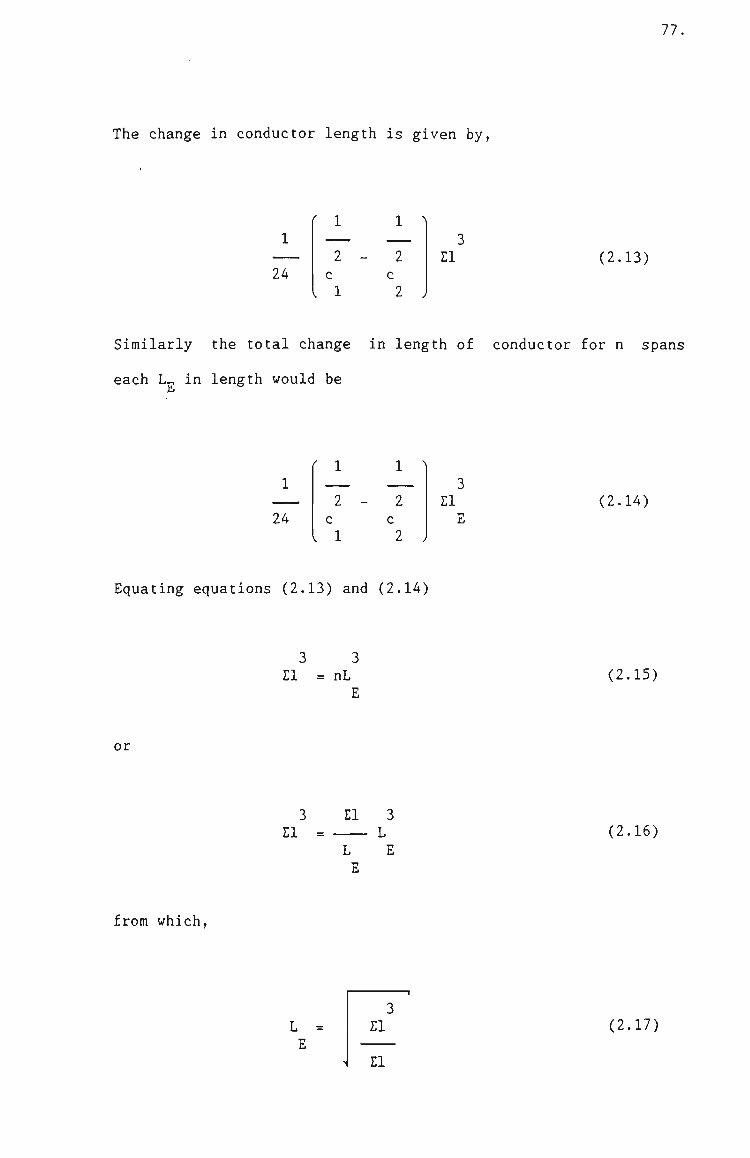
The change in conductor length is given by.
77.
1
4
' 1
2 -c
I 1
1 ^
2 c
2 J
21 (2.13)
Similarly the total change in length of conductor for n spans
each L„ in length would be
1
24
f 1
2 -c
I 1
1 ^
2 El (2.14)
Equating equations (2.13) and (2.14)
3 3 El = nL
E (2.15)
or
3 El 3 El = L
L E E
(2.16)
from which,
L = E
El
El
(2.17)

78,
In other words equation (2.17) describes the tension variation of
a single span of equivalent length, L , under varying temperature
and loading conditions to a similar tension variation in a series
of spans, 1-, I2, IT, 1/ etc. under the same change of conditions
assuming that the tension of the conductor remains the same
either side of a suspension string of insulators.
Because of the nature of the equivalent span theory and the
assumptions employed, no similar theory is available for the
continuous catenary theory.
2.2.2.4 Conductor Physical Parameters
The next approximations used in both change of state equations
are attributed to the physical parameters of mass, cross section
area, modulus of elasticity, coefficient of linear expansion and
the initial conductor horizontal tension. The conductor physical
parameters will be discussed in detail in Chapter 3, however it
is appropriate to illustrate the changes in sag and tension of a
typical conductor with changes in each of the physical
parameters.
The mass of the conductor is a function of the density of the
raaterial, the nuraber of wires, the lay ratio of the wires, the
tolerance on the diaraeter of the wires and whether the conductor
is provided with grease for additional corrosion protection.

79.
Typical conductor mass variations can be of the order of 2.5% and
can lead to conductor sag and tension variations as illustrated
in Figure 2.8.
The cross sectional area of a conductor is a function of the
nuraber of wires, the lay ratio of the wires and the tolerance on
the diaraeter of the wires. Typical conductor cross sectional
area variations can be of the order of 2.5% and can lead to
conductor sag and tension variations as illustrated in Figure
2.9.
The modulus of elasticity of a conductor is a function of the lay
ratios of the wires, the tolerances on the diameter of wires, the
conductor construction and the modulus of the individual wires.
Typical conductor modulus of elasticity variations frora test to
calculated values can be of the order of 5% and can lead to
conductor sag and tension variations as illustrated in Figure
2.9.
The coefficient of linear expansion of a conductor is a function
of the coefficient of thermal expansion, cross sectional area and
modulus of elasticity of the component wires. The calculated
coefficient of linear expansion and the actual coefficient of
linear expansion of a conductor determined by test can vary in
the order of 5% and may lead to conductor sag and tension
variations as illustrated in Figure 2.10.

80
4 -
2 -
g 0
n •2
-4
95
I n i t i a l conditions : ZZ.Sii UTS 8 5 d«g C
Final conditions t 85 deo C s t i l l air
T
97.5
1 Sag Tension
LEMON ACSR/6Z 300m SPAN
100 Mass ai>
ioe.5 105
- 4
2 <N
& §
c o
"iil
-.5
Fig 2,8 Conductor Tension & Sag Change
JAllth Change In Mass
Initial conditions : 22.SX UTS a 5 d«o C
Final conditions : 85 deg C still air
T
Sag Tens ion
.s /\
& 8 • S
I •a
LEMON ACSR/GZ 300B SPAN
I7.S 1M lOCI
Cross Section firea on Modulus of E lost ic l ty C i? 1M
F'lg 2.9 Conductor Tension & Sag Change
With Change In CSA on Modulus of Elasticity
— I
•'3
S • 6 §
- '.StZ
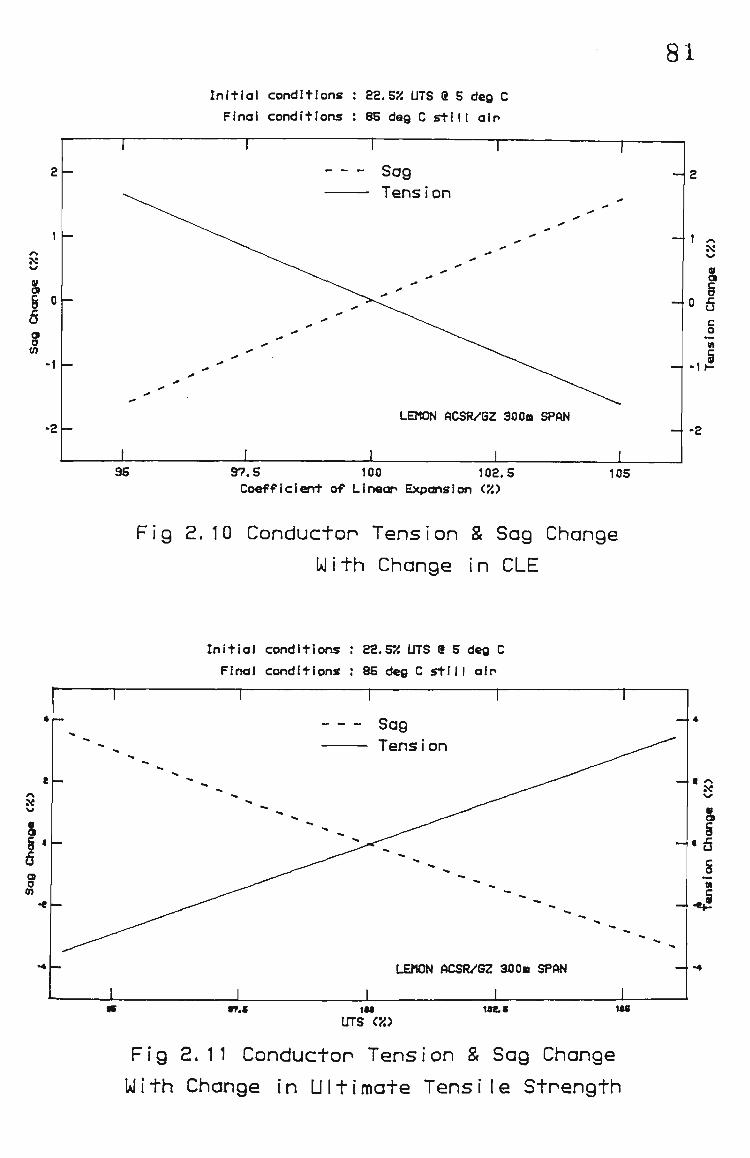
Initial conditions : Sa.S i UTS a 5 deg C
Final conditions t 85 deg C still alp
Sag Tens i on
81
- 2
a § 0
6 a a m -1
1 ^
& §
0 5 c o M
- 1 1 -
-2 -LEMON ftCSR/G2 30Oa SPAN
-2
95 97.S 100 102.5 Coefficient of Linear Expansion C/.)
105
Fig 2.10 Conductor Tension & Sag Change
With Change In CLE
I n i t i a l conditions : 22.5% UTS 8 5 deg C
Final conditions : 85 deg C s t i l l a i r
Sag Tens ion
— 4
&
6 a o 0)
8 ^
§
•6 J M
.5
LEMON ACSR/GZ 3 0 0 B SPAN
r?.t UTS ('/,>
u&s 1M
Fig 2.11 Conductor Tension & Sag Change
IAI i th Change in Ul 11 mate Tens i I e Strength

82,
The most critical conductor parameter that affects sag and
tension is that of the ultimate tensile strength (UTS). The UTS
of a conductor is a function of the strength of the component
wires and variation between calculated UTS and actual UTS
determined by test can be of the under of 5%. The resultant
variations to sag and tension of UTS variations is illustrated in
Figure 2.11.
2.2.2.5 Conductor Temperature
In sorae cases where the conductor is operating at or near the
maximura operating temperature, the core of the conductor will be
at a higher temperature than the outside surface of the
conductor. This effect can affect the conductor tension and in
particular for an ACSR conductor where the steel core may be
carrying most of the raechanical load.
At relatively high conductor temperatures, once elastic
elongation of the alurainiura of an ACSR has occurred to the extent
of the alurainiura carrying little mechanical load then the
conductor will exhibit the coefficient of linear expansion of the
steel core. This load distribution change phenoraenon is
described in detail by Nigol and Barrett (62) and discussed in
Chapter 3.
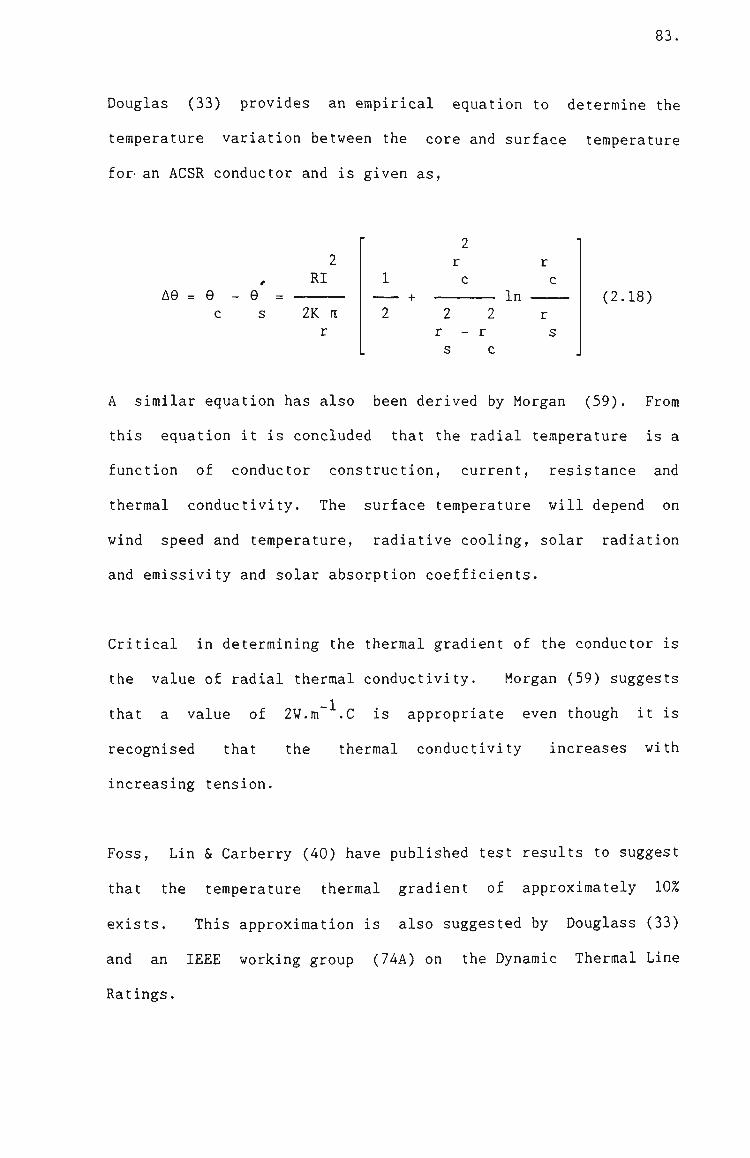
83.
Douglas (33) provides an empirical equation to determine the
teraperature variation between the core and surface temperature
for' an ACSR conductor and is given as,
RI AG = 9 - e =
c s 2K n 2 2 r - r s c
In (2.18)
A similar equation has also been derived by Morgan (59). From
this equation it is concluded that the radial temperature is a
function of conductor construction, current, resistance and
thermal conductivity. The surface temperature will depend on
wind speed and temperature, radiative cooling, solar radiation
and eraissivity and solar absorption coefficients.
Critical in determining the thermal gradient of the conductor is
the value of radial thermal conductivity. Morgan (59) suggests
that a value of 2W.m~ .C is appropriate even though it is
recognised that the thermal conductivity increases with
increasing tension.
Foss, Lin & Carberry (40) have published test results to suggest
that the temperature therraal gradient of approxiraately 10%
exists. This approximation is also suggested by Douglass (33)
and an IEEE working group (74A) on the Dynamic Thermal Line
Ratings.
84.
Nigol and Barrett (62) have determined a ratio aluminium
teraperature rise above arabient to steel core temperature rise
above ambient over a full range of currents to be constant in
light winds. For standard round wire ACSR and trapezoidul wire
compact ACSR this ratio is 0.90 and 0.95 respectively. This
support the previous authors approxiraations.
Frora this discussion it is concluded that for determining
conductor tension at maxiraura operating temperature the core is
likely to be 10% hotter than the surface temperature.
Unfortunately the traditional catenary and parabolic tension
equations do not allow differing alurainiura and steel core
temperatures to be used in deterraining tension.
2.2.3 Sag Tension Evaluation by Strain Suraraation (STESS)
The STESS coraputer program details of which have been published
by Barrett, Dutta and Nigol (9) is the first real departure of
determining conductor tension and sag by the classical equivalent
span and continuous catenary theory.
The program evaluates conductor tension by summating the various
components of strain including the inelastic strain. Accordingly
with the introduction of inelastic strain the conductor tension
and sag become not only dependent on prevailing cliraatic
conditions but tirae dependent with a chronological loading
history. The concept of the strain summation is given as
follows.

85.
Total Strain = Thermal Strain + Slack + Elastic Strain
+ Creep Strain + Settling Strain (2.19)
2.2.3.1 Therraal Strain
The therraal strain coraponent of equation (2.19) is defined by
Nigol and Barrett (7) and is given by the classical linear term
and an additional a quadratic term. The quadratic term includes
the effect of the change of modulus of elasticity with
temperature of 55 MPa.C" . This effect is very small for the
aluminium component of an ACSR construction as illustrated in
Figure 2.12.
Since STESS summates differing aluminium and steel thermal
strains two equations are necessary and are given by,
D = s
11.3 (9 - 20) + 0.008 (9 - 400) s s
-6 *10 (2.20)
and
D = a
22.8 (9 - 20) + 0.009 (9 - 400) a a
-6 *10 (2.21)
These equations do not include the effect of load distribution
changes between alurainium and steel components discussed in
section 2.2.2.5 and Chapter Three.
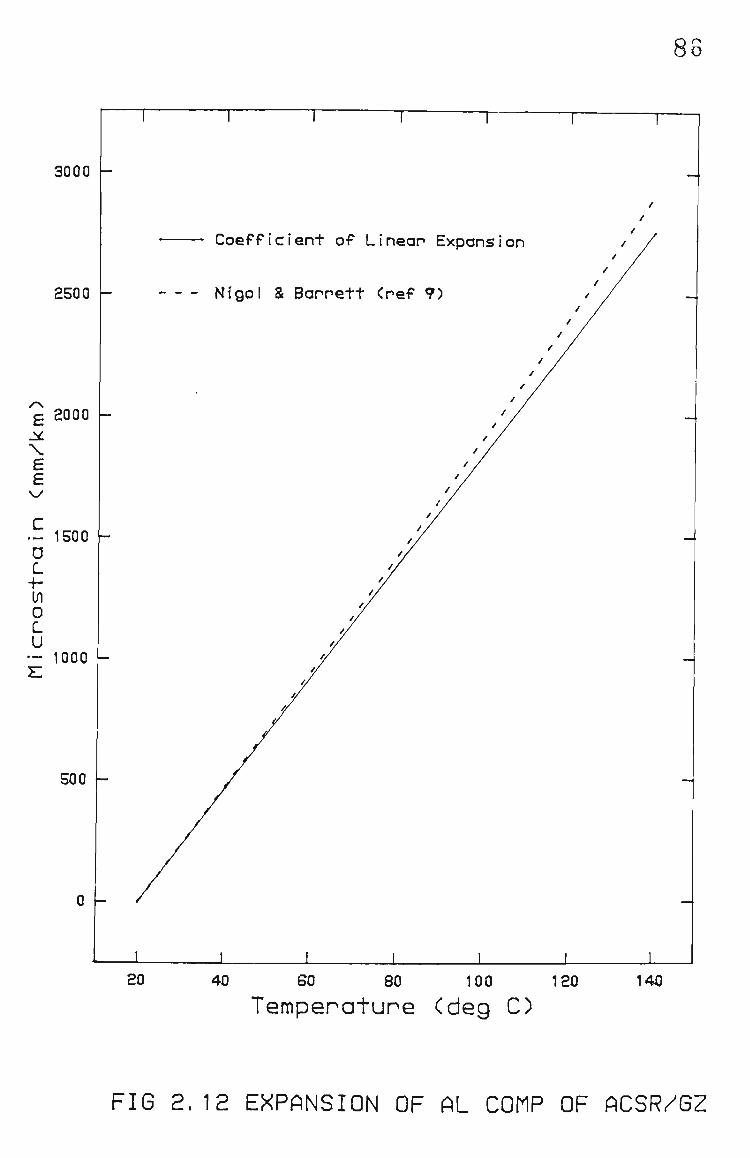
88
3000
2500
£ 2000
e £
C .- 1500 D L t-[f\ O L U — 1000 K
500 -
0 -
Coefficient of Linear Expansion
Nigol & Barnett <ref 9)
20 40 60 80 100
Temperature Cdeg C) 120 140
FIG 2.12 EXPANSION OF AL COdP OF ACSR/GZ

87.
2.2.3.2 Slack
The' alurainiura slack term describes the hysterisis or sometimes
termed the zero correction of the initial part of a stress-strain
curve on an ACSR conductor. In short test spans the slack
component can be up to 150 mra.kra however over long spans such
as those encountered in the field it is considered that the slack
would be very sraall. This is also supported by the practice of
removing any slack and some degree of metallurgical creep by
prestressing the conductor prior to final termination.
2.2.3.3 Elastic Strain
The elastic strain is determined from the modulus of elasticity
of the alurainiura and in the case of an ACSR conductor the steel
final curves of a stress-strain test.
This is not a departure frora current methods and supports the
accepted practise of the initial modulus curve to 30% UTS being
essentially parallel to the final modulus curve.
2.2.3.4 Creep Strain
Conductor creep strain is non recoverable or inelastic plastic
deformation sometimes termed permanent elongation that occurs
under tensile load and increases with both temperature and
stress. Permanent elongation begins at the instant of applied

88.
tensile load and continues at a decreasing rate as long as the
tension and temperature remain constant. This progressive
deformation is described in detailed in references (18, 19, 20,
21, 24, 27, 44, 47, 49, 53, 63 and 64).
The equation used by STESS to describe the creep strain behaviour
is similar to that found in the aboveraentioned references and is
given by,
n n 1 2 5(9-20)
US = A t s e (2.22) 2
The four pararaeters A„, n^, n^ and 5 define the creep behaviour
of the alurainium and steel components and are determined by test.
The details of the creep tests are discussed in Chapter Three.
The procedure adopted by STESS calculates creep and includes a
chronological loading history, including all prestressing.
2.2.3.5 Settling Strain
The author's describes settling strain as geometric settling of
the wires moving both radically and tangentially during any
initial loading.

89.
The settling strain of the steel and aluminium components at any
given steel or aluminium stress is defined as,
"the substraction of both the elastic strain
and the one hour room temperature creep strains
from the initial stress strain curve".
This settling is assumed to be independent of teraperature and
coraplete in one hour.
2.2.3.6 Other Features of STESS
The raain advantage of the program is the ability to determine
stringing tensions for any given future loading conditions and
limiting constraint. In addition the program can examine the
effects of stress relaxation, thermal gradients in the conductor
and determine the load distribution of the conductor wire
components. This is a more realistic approach if the conductor
failure criteria is based on individual wire strengths.
These advantages aside a considerable araount of conductor
laboratory testing such as stress strain tests, coefficient of
linear expansion tests and creep tests are necessary to be
assured of the certainty and accuracy of the tensions and sags.
2.3 CONDUCTOR SAG MEASUREMENTS THEORY
Several techniques have been developed to measure conductor sags. Most
techniques have been developed to measure conductor sags. Most techniques
are described in references (3) and (80). The methods are used in these
studies. The first method is a modified tangent observation
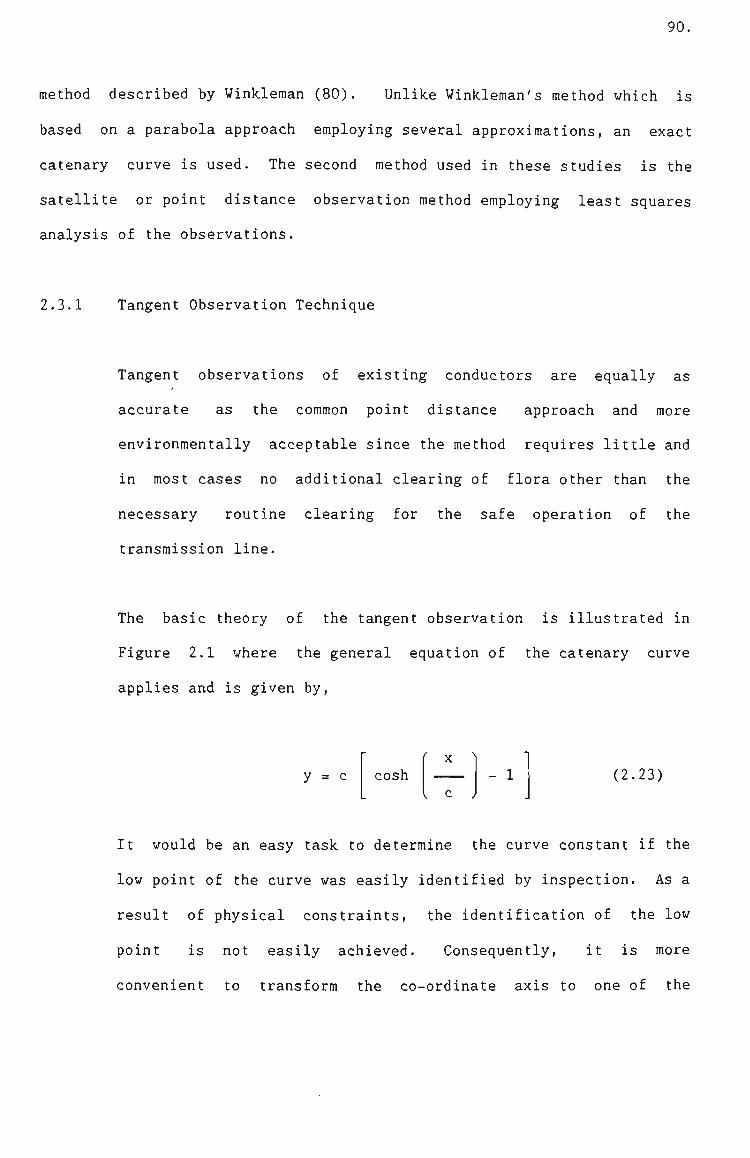
90.
method described by Winkleman (80). Unlike Winkleman's method which is
based on a parabola approach employing several approximations, an exact
catenary curve is used. The second method used in these studies is the
satellite or point distance observation method employing least squares
analysis of the observations.
2.3.1 Tangent Observation Technique
Tangent observations of existing conductors are equally as
accurate as the common point distance approach and more
environmentally acceptable since the method requires little and
in most cases no additional clearing of flora other than the
necessary routine clearing for the safe operation of the
transmission line.
The basic theory of the tangent observation is illustrated in
Figure 2.1 where the general equation of the catenary curve
applies and is given by.
y = c cosh r x
V c
\
- 1 (2.23)
It would be an easy task to determine the curve constant if the
low point of the curve was easily identified by inspection. As a
result of physical constraints, the identification of the low
point is not easily achieved. Consequently, it is more
convenient to transform the co-ordinate axis to one of the

91.
conductor attachraent points and determine the curve constant of a
span by a combination of survey measurements and iterative
calculations.
The transformed ordinate and abscissa from the origin to the
conductor attachraent point is obtained frora inspection of Figure
2.13 and is given by,
X = X + a (2.24)
Y = y - y (2.25)
where
y' = c
•
cosh ' a ^
. c )
-
- 1 _
(2.26)
The horizontal distance to the low point has been previously
defined in Figure 2.2 and is given as,
L -1 y' = - c sinh
2
H
K (2.27)
Substituting equation (2.24) into (2.23)
y = c cosh r x-a
V c
- 1 (2.28)

92
FIGURE 2.13 TRANSFORMED ORDINATE AND ABSCISSA AXIS OF CATENARY CURVE
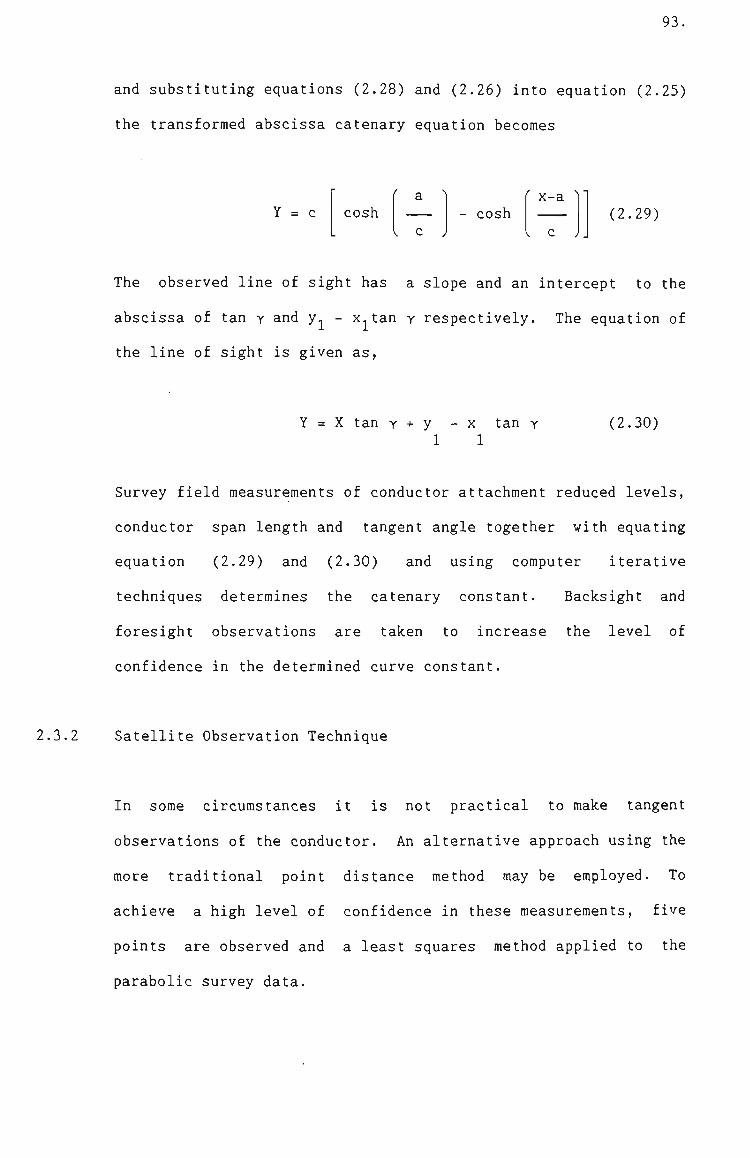
93.
and substituting equations (2.28) and (2.26) into equation (2.25)
the transformed abscissa catenary equation becomes
Y = c cosh .
' a ^
. c , cosh
' x-a
. c > (2.29)
The observed line of sight has a slope and an intercept to the
abscissa of tan y and y, - x^tan y respectively. The equation of
the line of sight is given as.
Y = X tan T + y - X tan y 1 1
(2.30)
Survey field measurements of conductor attachment reduced levels,
conductor span length and tangent angle together with equating
equation (2.29) and (2.30) and using coraputer iterative
techniques determines the catenary constant. Backsight and
foresight observations are taken to increase the level of
confidence in the determined curve constant.
2.3.2 Satellite Observation Technique
In some circumstances it is not practical to make tangent
observations of the conductor. An alternative approach using the
more traditional point distance method may be employed. To
achieve a high level of confidence in these raeasureraents, five
points are observed and a least squares method applied to the
parabolic survey data.

94.
The basic theory of the least squares analysis is described by
reference to Figure 2.14 where the general equation of the
parabolic curve applies and for the lowest observed point PQ as,
b = ka 0 0
(2.31)
At point P,,
b + b = k 0 1
a + a 0 2
(2.32)
Similarly at points ?„, Po and P^,
b + b = k 2 1
a + a - a 0 2 1 J
(2.33)
b + b = k 3 1
a - a - a 3 0 2
(2.34)
b + b = k 4 1
a - a - a 4 0 2
(2.35)
By substitution of equation (2.31) into (2.32) to (2.35), thus

95
FIGURE 2.14 PARABOLIC SPAN LEAST SQUARES METHOD OF ANALYSIS
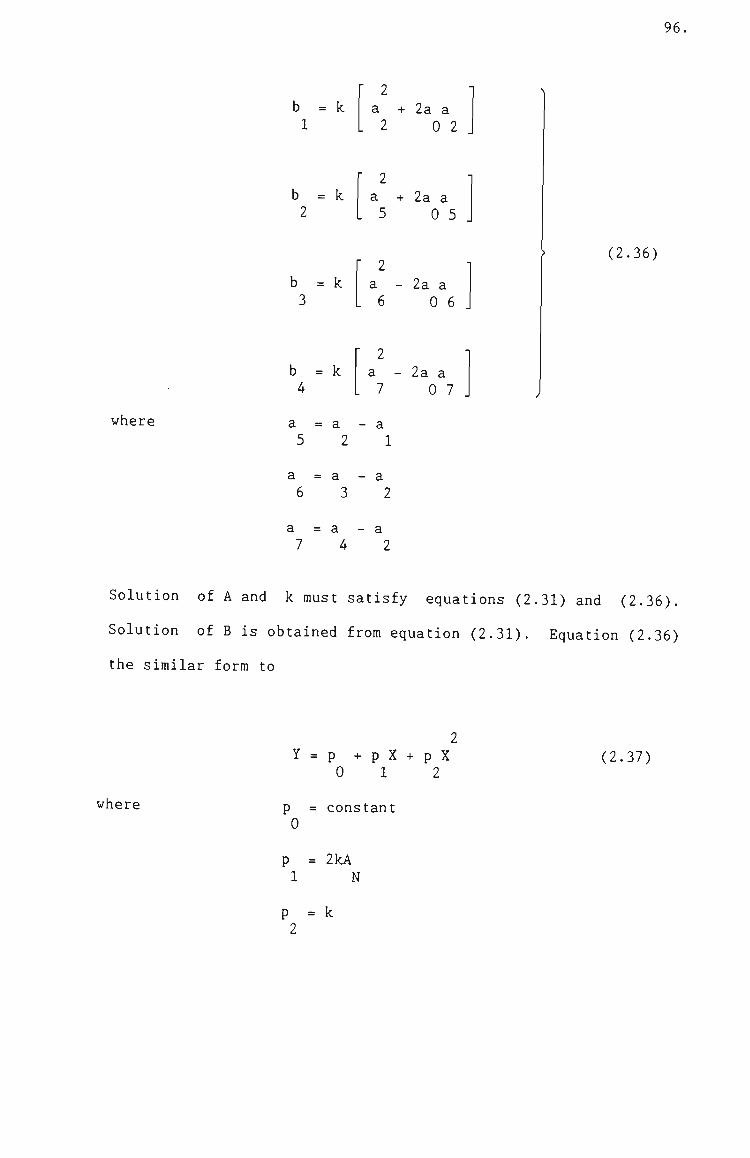
96.
where
b = k 1
b = k 2
b = k 3
b = k 4
a + 2a a 2 0 2
a + 2a a 5 0 5
a - 2a a 6 0 6
r 2 a - 2a a 7 0 7
a = a - a 5 2 1
a = a - a 6 3 2
a = a - a 7 4 2
(2.36)
Solution of A and k must satisfy equations (2.31) and (2.36).
Solution of B is obtained from equation (2.31). Equation (2.36)
the similar form to
where
Y
P 0
P 1
P 2
=
=
=
P + 0
P X 1
cons tant
2kA N
k
+ P X 2
(2.37)
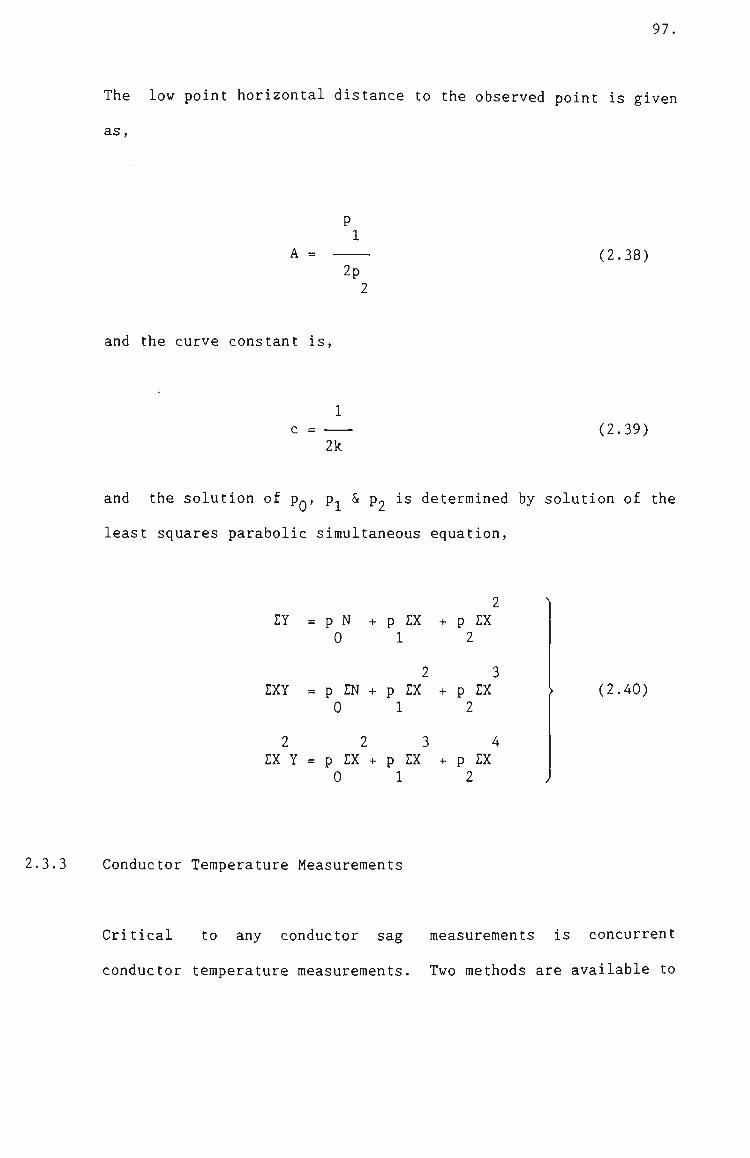
97.
The low point horizontal distance to the observed point is given
as.
A = 2p
(2.38)
and the curve constant is,
c = 2k
(2.39)
and the solution of p ,, p, & p^ is determined by solution of the
least squares parabolic simultaneous equation,
LY = p N + p EX + p EX 0 1 2
2 3 EXY = p EN + p EX + p EX
0 1 2
2 2 3 4 EX Y = p EX + p EX + p EX
0 1 2
(2.40)
2.3.3 Conductor Teraperature Measureraents
Critical to any conductor sag raeasureraents is concurrent
conductor teraperature measurements. Two methods are available to

98,
measure conductor temperature, remote and direct. The remote
method employs infra-red scanning whilst the direct method uses a
contact thermocouple with a calibrated indicating instrument.
For the purpose of these studies the conductor temperature
measurements were carried out using a commercially available live
line conductor temperature measuring instrument illustrated in
Plate 2.2.
The instrument was laboratory calibrated before and after all
survey measureraents to give reassurance of the certainty of
conductor teraperature measurements. The calibration curve of the
instruments is given in Figure 2.15.
The instruraent was used strictly in accordance with
manufacturer's recomraended methods and the application of the
instrument to a live conductor via a live line operating rod is
illustrated in Plate 2.3.
2.3.4 Systematic Errors
Systeraatic errors arise from sources which are known and
therefore their effects can be either eliminated or compensated.
The tangential and point distance observation techniques have
five sources of systeraatic errors. The first comes from
observation error cause by heat haze distorting the surface of
the conductor. This problem is generally eliminated by carrying
out backsight and foresight measurements on the span under
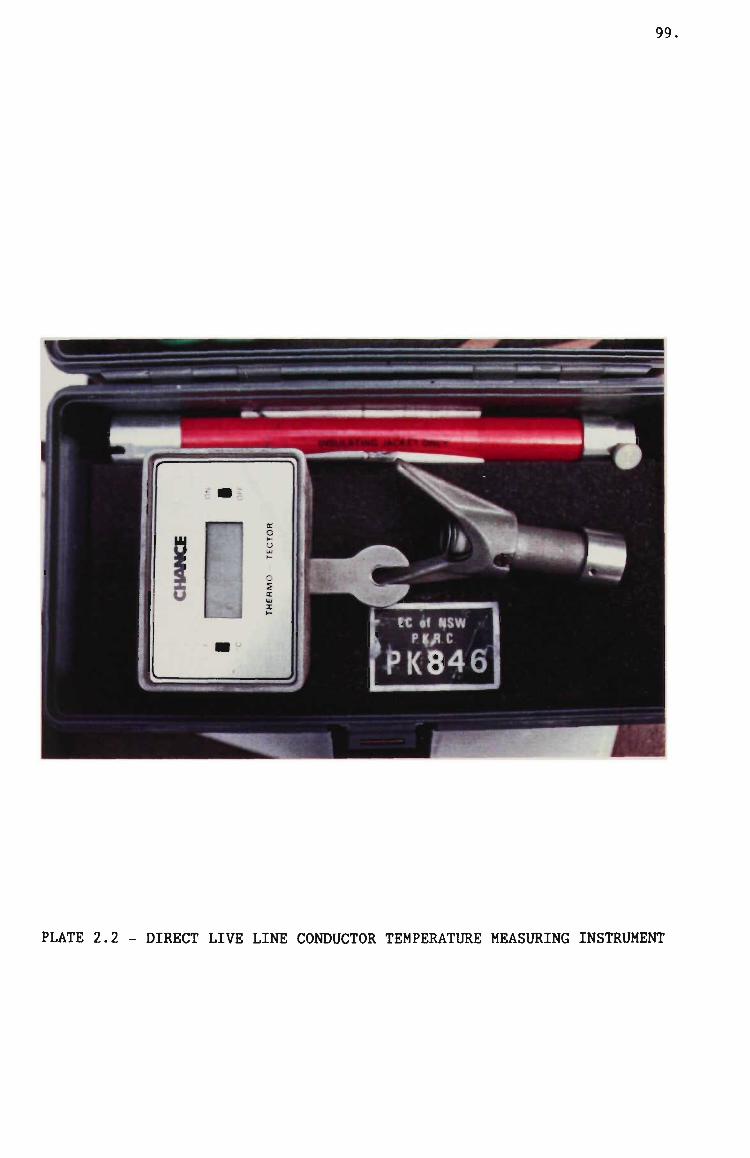
99.
PLATE 2.2 - DIRECT LIVE LINE CONDUCTOR TEMPERATURE MEASURING INSTRUMENT

iOO
CD
c o •H
4-1 CO SH JD •H rH CO o CD J-, o CU, <1) CQ
C O
•H -1-) CO in
SJ •H 1—1 CO c_> J-<D -P (i-, <t
o o
CD 03
O oo
o
CD CO
CD
in
CD CO
CD CM
W S Q - . I—I
O
a
CD CO eC W
w
E l . — =3;
D:;
U J CL,
O
CC
Q
o o
LiJ ^
LJJ J
» - ex. o
oc o g i f o
2 o M E-=3: CC CQ M • J «C
LO
C\J
K l CC
a M IJL,
0 0
0 G )
C5 OO
0 r-s.
0 CO
0 LO
CD - 1 *
0 CO
CD CM
(0) 3ynivy3cJW3i a3ynsv3W

101
PLATE 2.3 - APPLICATION OF CONDUCTOR TEMPERATURE MEASURING INSTRUMENT

102
consideration, thus making observations with differing amounts of
refracted light. In addition, since the catenary data is
determined in the field, a sensitivity analysis of the catenary
constant may be carried out to deterraine the effect of any
tangential error.
The second source of a systematic error comes frora the
longitudinal moveraent of suspension insulator strings caused by
differential tensions in adjacent spans. The resultant error for
adjacent spans of similar lengths is generally small. This error
may be eliminated by measuring the longitudinal movement of the
insulator string and making the necessary corrections.
The third source of inaccuracy comes from wind blowing parallel
to the conductors under observation causing a change in the basic
shape of the catenary curve. This results in an error of the
location of the conductor with respect to the conductor
attachment points and hence the tangent angle observed. This
problem is partly overcome by carrying out backsight and
foresight observations. However a more practical way of
eliminating this error source is aborting the sag measurements
when the longitudinal component of wind exceeds a velocity of
approximately 4 m.s~ .
The next source of survey inaccuracy is caused by air movements
orthogonal to the line inducing aeolian vibration of the
conductor. Observations of the extremes of the conductor
103
vibration may be taken, thus enabling a more accurate
determination of the conductor observed tangent point to be
achieved.
The final source of systeraatic errors is that of the complex
dynamics of a transmission line. During the course of any
measurements taken the prevailing climatic conditions will
change. These changes cause tower movements, suspension
insulator string longitudinal movements and lastly, an ever
changing catenary constant. Ideally to eliminate these errors it
would be possible to carry out all survey mesureraents
simultaneously. Unfortunately this is not practicable or
economical.
Survey errors will not be discussed in these studies apart from
mentioning that a controlled network of survey stations was used
having a probable error of less than 0.025 m and using a standard
field theordolite with a least count of 0°00'10".
2.4 TRANSMISSION LINE SAMPLES
The electricity generated in New South Wales is transmitted to load
centres by about 12000 route kilometres of 330, 220 and 132 kV
transmission lines. In more recent times as a result of major
augmentations to the transmission system over 350 route kilometres of 500
kV transmission line has been completed.

104
The major part of these route kilometres was constructed between the
period of 1955 to 1970 making some of these transmission lines between 20
and 30 years old. Further to the degradation of the conductors by the age
of the transmission line is the amount of atmospheric pollutants that the
conductor has been exposed to, thus any degradation of the conductor due
to corrosion causes by the transmission lines geographical location.
Since as part of these studies, conductor samples will be removed from the
transmission line and metallurgically examined for evidence of charges in
raechanical properties it was considered prudent to identify two
transmission lines having similar conductors and age but with differing
pollutant environraents.
The details of the transraission line samples selected for the study are
given in Table 2.3 and are both approximately 24 years old. The
transmission lines selected have Moose ACSR conductor with stringing
and physical parameters details given in Figure 2.17 and Table 2.4
respectively.
TRANSMISSION LINE vnTTAPP COMMISSIONING STUDY POLLUTION FEEDER TITLE " DATE AREA LEVEL
37 Avon Kemps Creek 330 kV 5/1964 51 to 54 light 983 Dapto Springhill 132 kV 11/1964 317A to 322A heavy
TABLE 2.3 TRANSMISSION LINE SAMPLE DATA


105

106
PARAMETERS NOMINAL VALUE
MECHANICAL
Cross Sectional Area
Aluminium Steel Total
Overall Diaraeter
Stranding
Alurainium Number Diameter
Steel Galvanized Number Diaraeter
Mass
Ultimate Tensile Strength
Final Modulus of Elasticity
Coefficient of Linear Expansion
ELECTRICAL
Cross Sectional Area
Aluminium Copper Equivalent
Resistance DC at 20°C
528.5 mra, 69.5 mm 598 mra
31.95 mra
54 3.53 mm
3 53 mra 3.
2
159
82
19
002 kg.
6 kN
6 GPa
93 * 10
71
ra
-6.
mra
°c--1
515.8 mm„ „ 324.4 mm" (0.5 in^)
5.48 ma.km -1
TABLE 2.4 PHYS ICAL CHARACTERISTICS OF MOOSE CONDUCTOR
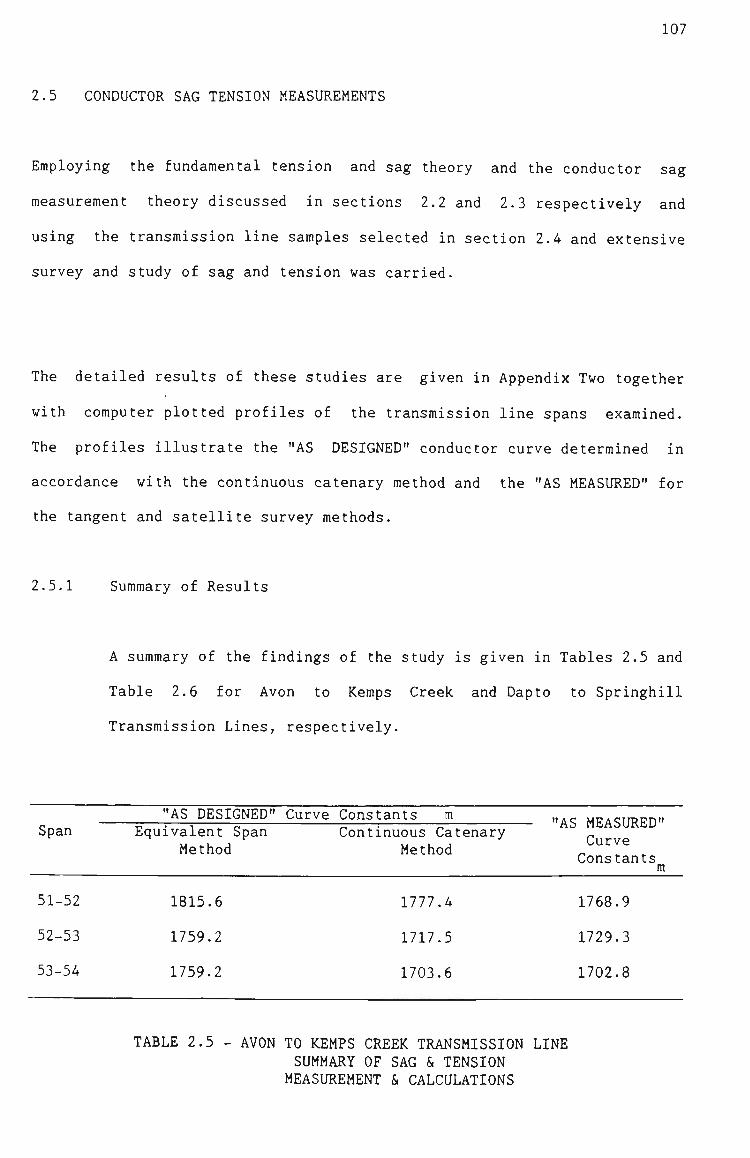
107
2.5 CONDUCTOR SAG TENSION MEASUREMENTS
Employing the fundamental tension and sag theory and the conductor sag
measurement theory discussed in sections 2.2 and 2.3 respectively and
using the transmission line samples selected in section 2.4 and extensive
survey and study of sag and tension was carried.
The detailed results of these studies are given in Appendix Two together
with coraputer plotted profiles of the transraission line spans exarained.
The profiles illustrate the "AS DESIGNED" conductor curve deterrained in
accordance with the continuous catenary method and the "AS MEASURED" for
the tangent and satellite survey raethods.
2.5.1 Suramary of Results
A suraraary of the findings of the study is given in Tables 2.5 and
Table 2.6 for Avon to Keraps Creek and Dapto to Springhill
Transmission Lines, respectively.
Span "AS DESIGNED" Curve Constants m
Equivalent Span Method
Continuous Catenary Method
"AS MEASURED" Curve Constants
ra
51-52
52-53
53-54
1815.6
1759.2
1759.2
1777.4
1717.5
1703.6
1768.9
1729.3
1702.8
TABLE 2.5 - AVON TO KEMPS CREEK TRANSMISSION LINE SUMMARY OF SAG & TENSION MEASUREMENT & CALCULATIONS

108
"AS DESIGNED" Curve Constants m Span
371A-318A
318A-319A
319A-320A
320A-321A
321A-322A
Equ: .valent Span Method
1650.4
1811.0
1650.4
1650.4
1811.0
Cont inuous Catenary Method
1574.0
1752.3
1573.2
1576.5
1754.6
"AS MEASURED" Curve Constants
m
1606.3
1667.0
1580.3
1592.9
1683.9
TABLE 2.6 - DAPTO TO SPRINGHILL TRANSMISSION LINE SUMMARY OF SAG & TENSION
MEASUREMENTS S" CALCULATIONS
2.5.2 Conductor Permanent Elongation
As previously discussed in section 2.2.3.4 conductor permanent
elongation or creep is non recoverable deformation under tensile
load and increases with both temperature and stress.
All transmission line conductors exhibit creep behaviour and the
araount of creep in a particular span may be determined by
coraparing the "AS DESIGNED" conductor length with the "AS
MEASURED" conductor length. Several assumptions are necessary
before this comparison may be made. The assumptions are as
follows.
1. The conductors were originally strung in accordance with
design stringing chart, in this case Figure 2.17;

109.
2. Minimal prestressing of the conductor was carried out prior
to the cutting and termination; and
3. The conductor teraperature during the "AS MEASURED" survey
work was measured accurately and reflects the actual
conductor temperature of section under examination;
4. No structure settlement has occurred, thus affecting the
original span length and conductor attachment reduced level;
and
5. No permanent elongation of the conductor due to annealing
has occurred.
Employing these assumptions the measured curve constant at some
elapsed time should always be less than the designed curve
constant. In other words the conductor will sag more at some
identical prevailing climatic condition after some elapsed time.
The "AS MEASURED" conductor creep is the difference between "AS
MEASURED" and the "AS DESIGNED" conductor length normalised to
mra.kra" and 20°C. These perraanent elongation results are
compared with those of the predictor equations of CIGRE (27) and
the creep test results and equations derived in Chapter Three,
calculated for 20°C and an every day tension of 20% UTS. These
creep results are given in Table 2.7.

110
Conductor Creep
Transraission Line
(mra.kra )
Span "AS MEASURED" CIGRE Creep Predication
Predictor Equation Derived Equations frora Test
Avon-Keraps Creek
Dapto-Springhill
51-52 52-53 53-54
317A-318A 318A-319A 319A-320A 320A-321A 321A-322A
16.8 -38.6 0.5
-47.6 135.8 -6.7 -26.7 106.0
488 274
488 185
TABLE 2.7 CONDUCTOR PERMANENT ELONGATION RESULTS
It is clear from Table 2.7 that the "AS MEASURED" results do not
correlate with the predication of the CIGRE predictor equations
and those derived in Chapter Three.
The discrepancies of the "AS MEASURED" results raay be measurement
technique based, a result of unsatisfactory initial assumptions,
or an in correct initial assuraption used for determining
theoretical permanent elongation for the creep predicator
equations. The later is the subject of a current undergraduate
thesis project.
It needs to be appreciated that the whilst the survey and
analysis of transmission line sags is a difficult task, in a
controlled network the errors of surveyed reduced levels and
chainage are extremely small. That aside, the "AS MEASURED" and
Ill
"AS DESIGNED" span length and conductor attachment reduced level
are the same. The only variable in the calculations is that of
the' catenary constant determined by several observations of the
tangent angle and point distances.
The remaining measurement required to determine the catenary
constant is that of the temperature. To appreciate the effects
of temperature variations, an example will illustrate the change
in teraperature, the effect on curve constant and calculated
conductor creep. Using the Avon to Kemps Creek Transmission Line
span 52-53 a change of 7.1 C from 34.3 C to 27.2 C represents a
change of curve constant of 61.6 m from 1717.5 m to 1779.1 m.
This change translated into creep, represents a change frora -38.6
mra.kra" to 154.7 mra.kra" . In other words the accuracy of the
deterraination of the conductor creep requires realiable and
accurate methods of temperature determination. It is considered
that the before and after calibration of the temperature
measuring equipment was sufficient to provide the reliability and
miniraal drift of the instrument.
Accordingly if the measurement technique is assumed to be
satisfactory the initial assumptions need to be examined. The
likely cause of the marked difference in "AS MEASURED" conductor
creep is that of initial prestressing. This is a comraon practise
in the construction of transraission lines and is generally an
accepted rule of thumb procedure. The effect of prestressing
reraoves much of the stand setting and metallurgical creep.
112
Unfortunately, because the history of the initial loading of
transmission line conductor was not recorded, the amount of
prestressing is indeterminate.
Further to this is the evidence of overtensioning of the
conductors revealed by the "AS MEASURED" conductor length being
shorter than the "AS DESIGNED", or translated into a negative
creep.
However, the postulation of overtensioning should have the net
effect of increasing creep, and it can only be concluded that
some equilbrium has been reached in these spans.
In a span, conductor creep behaves differently to that of
laboratory controlled creep measurements. In a section of
transmission line, the tension in a conductor decreases with time
because of conductor creep. This raeans that the araount of
conductor creep that occurs during this stress relaxation process
is less than the conductor creep in a constant tension span. In
an ACSR conductor as the alurainium creeps at a greater rate than
the steel, an increasing portion of the total tension is
transferred to the steel core. This lower proportion of load on
the alurainium contributes further to the stress relaxation in the
aluminium.
From the aboveraentioned discussions it is concluded that the
raethods employed to measure the conductor sag and to calculate
conductor creep are satisfactory. However the history of loading
of the conductor or initial survey datum must be established to
113
determine the initial conditions of a section of transmission
line before any future studies can be undertaken.
2.5.3 Conductor Clearance Margins
The marginal allowance given in Table 2.1 for conductor sag
provides for inelastic stretch or conductor creep, structure
settleraent and survey discrepancies.
In view of the sag results obtained, the evidence suggests
conductor creep has not occurred on the transraission lines
exarained to the extent of the original design allowances. As a
result of this and the major capital costs of new transraission
lines, it considered that a review of the raarginal allowances of
sag is necessary.
Although additional studies need to be carried out in determine a
suitable of marginal allowances, at this stage it is suggested
that a reduction of 2% in conductor tension at maxiraura operating
teraperature could be used as a basis to determine the sag
raarginal allowance.
Further to this allowance, it is considered with the use of
modern survey measuring equipment and check survey procedures
already being used, that any marginal allowance provided for
survey discrepancies is unnecessary.
114
This leaves structure settlement and it is considered that an
allowance of approximately 0.1% of the structure height would be
raore than sufficient.
Accordingly for Lemon ACSR/GZ conductor, 300 m span at raaximura
operating teraperature of 120°C erected on concrete poles with a
conductor attachraent point of 20 m the suggested marginal
allowance would be 0.2 m a reduction 50% on current allowances.
2.6 CONCLUSION
1. Three raethods of determining conductor, tension and sag have been
examined. Each method requires an increasing understanding and
knowledge of conductor behaviour. The advantages of the equivalent
span method is that the concepts are easily understood, little
knowledge is required of the conductor physical parameter and the
ability of being able to produce stringing charts that can be easily
interpreted and understood by construction staff. In contrast the
continuous catenary raethod is more complex by its very nature, but
does produce very accurate however probably unnecessary results. The
continuous catenary method is seen as being a useful aid in
mountainous terrain where changes in reduced levels of conductor
attachment points may be considerable. The final method examined was
the STESS raethod which like the CONCAT raethod is coraplex. It is not
agreed that, as the author's describe "conceptually simpler". Any
benefits of the STESS method are discounted by the need to undertake
an extensive testing prograrame to deterraine conductor physical
parameters. This is offset against the ability of the STESS to handle

115
difficult stess relaxation and the thermal gradient behaviour of
conductors that raay be useful in initial stringing and high
temperature operation.
2. The errors in the approximations employed in the traditional raethods
of calculating conductor tension and sag have been examined in detail.
It is considered, with modern computing techniques that no reason is
apparent for not using the exact catenary equations. This is
reinforced if any marginal allowance for conductor sag is accepted.
This aside the errors encountered for average effective spans and
curve constants are likely to be less than 1% if the parabolic
equations are employed.
3. Correlation of "AS DESIGNED" and "AS MEASURED" conductor sags was
achieved and a method is now available to monitor sag changes with
time by tangent or satellite survey observations.
4. The difficult task of determining conductor creep after an elapsed
time was not achieved. This is primarily due to the lack of original
datum available to compare the recent measureraents. It is anticipated
that as a result of these studies and the raethods developed herein,
that monitoring of in service transraission lines to determine
conductor creep can be achieved in the future.
5. It is considered that a review of the current marginal allowances for
conductor inelastic stretch is necessary to miniraise transraission line
capital costs in the future. Further work is necessary to determine
the reduction in marginal allowances however at this stage it is
suggested that a 50% reduction on current policies could be achieved.

CHAPTER THREE
MECHANCIAL PROPERTIES OF AGED TRANSMISSION LINE CONDUCTORS
3.1 INTRODUCTION
The development of the electricity transmission system in New South Wales
has been characterised by the transmission of power from major generating
areas to load centres located throughout the state.
This transmission of power is achieved by over 70,000 km of steel
reinforced aluminium conductors of varying size. The conductor size is
generally dependent on the required current carrying capacity, thermal
limitations imposed by conductor ground clearance, conductor annealing and
the need to keep radio interference voltage levels low. In some cases
such as long spans the mechanical parameters of the conductor may
influence the choose of an appropriate size of conductor.
The major part of these conductors were manufactured and erected in the
period between 1955 and 1970 making some of these conductors over 30 years
old. The majority of these conductors have been manufactured by the
Properzi extrusion method however some of the early conductors
manufactured prior to the mid fifties employed the hot rolled process.
117
With time the conductors have experienced a variety of in service
conditions that may vary from emergency operating conditions creating
elevated temperatures to long exposures of low velocity winds inducing
aeolion vibration, characteristic of conductor fatigue failure.
Some of the geographical features that affect the performance of the
conductors are, the excursions of temperature from -10 C in the Snowy
Mountains region to 50 C in the western plains; gentle breezes to
destructive narrow fronted tornado like storms; exposure to salt pollution
on the eastern seaboard and the hazards of high temperatures of travelling
bushfires.
It is now appropriate to ascertain the level of degradation and the
continued serviceability of these conductors. In addition, to carrying
out this work it is intended to develop a methodology to test conductors
in the future and determine the life expectancy of conductors.
Two categories of testing are available for examining the performance of
conductors, non destructive testing and destructive testing.
Non destructive testing will in most cases disclose the occurrence of
broken wires and the presence of corrosion products in the case of the
aluminium wires of an ACSR. Several methods of non destructive testing
are available and are briefly described as follows:

118
1. Routine visible inspections being by for the most common non
destructive testing of conductors. This method will disclose bulging
of the conductor caused by bimetallic corrosion (50) and in some cases
may reveal fatigue damaged conductor by the presence of outer wire
failures;
2. X-ray and gamma ray radiography used with mixed success will reveal
non visible wire breakages of fatigue conductors (26);
3. Eddy current testing has been employed and will disclose internal
corrosion and it has been reported that aluminium external corrosion
of more than 10% reduction in the cross sectional area will be
detected (57).
4. Thermovision may be employed to disclose thermal gradients in the
conductor and thus possible non visible wire breakages of fatigued
conductors.
These diagnostic raethods provide valuable information on the short term
performance and the need to repair damaged conductors.
Unfortunately, no non destructive test method provides an indication of
the long term and component performance of the conductor. On the other
hand, destructive testing of samples of conductors, does provide a true
measure of the deterioration of the components and the composite of the
conductor. An assessraent of the test results can deterraine the long terra
performance of the aged conductor.

119
Three categories of test are used to give an overall indication of the
level of degradation of the conductor. The test categories are:
1. Metallography examination.
2. Mechanical tests
3. Chemical tests examination.
Frora these categories it concluded that conductor degradation transgresses
several engineering disciplines. The relationship of serviceability of
conductors, engineering disciplines, transraission line design parameter
and conductor degradation mechanisms is given in Figure 3.1.
The objective of these studies will examine each of the degradation
mechanisms and in particular will,
1. Remove sufficient in service aged conductor from the field to allow
the following test to be carried out.
2. Carry out metallographic sample analysis of aged wires.
3. Carry out conventional mechanical tests on aged wire and composite
conductor.
4. Carry out chemical tests on aged conductor grease.
121
5. Establish a methodology for testing future aged conductor samples.
6. Determine the life expectancy of aged conductor samples.
3.2 TRANSMISSION LINE CONDUCTOR SAMPLES
As part of the transraission line conductor sag and tension deterraination,
two samples of transmission lines having similiar conductors were selected
giving representations of differing pollutant environments. The details of
the location and construction of the conductors are given in Tables 2.3
and Table 2.4 respectively.
The criteria for the various pollution environraents has been adopted from
lEC Recommendation 815, 1986 and is given in Table 3.1. One sample was
selected from a heavy pollution environment and one sample from a light
pollution environment.
Characteristics of the sites chosen for conductor removal were relatively
flat terrain, free frora rocky outcrops that may have damaged the
conductor, areas of good access and included a section of conductor from a
suspension point.
In addition to these two samples of conductor two further samples of
conductor from the Tomago to Taree and Bellambi to Heathcote 132kV
transmission lines had selected tests carried out during the course of
these studies. The Bellambi to Heathcote transmission line sample was
removed from a jumper connection not held in tension.
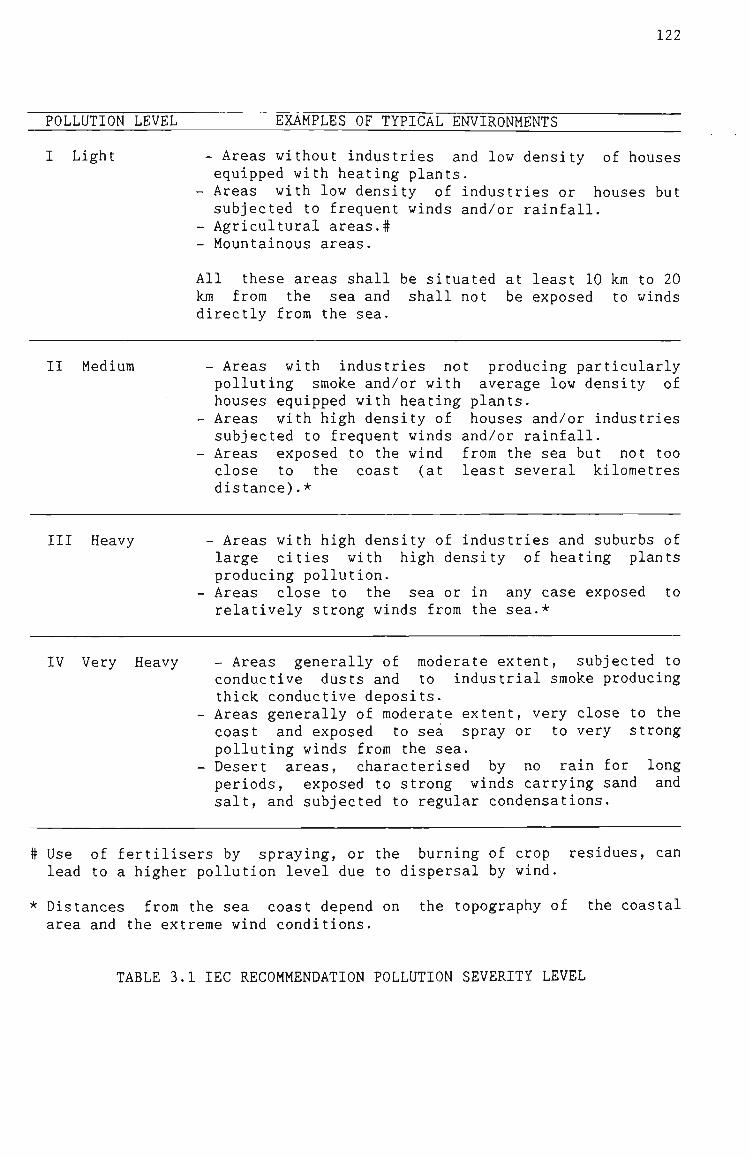
122
POLLUTION LEVEL EXAMPLES OF TYPICAL ENVIRONMENTS
I Light - Areas without industries and low density of houses equipped with heating plants.
- Areas with low density of industries or houses but subjected to frequent winds and/or rainfall.
- Agricultural areas.# - Mountainous areas.
All these areas shall be situated at least 10 km to 20 km from the sea and shall not be exposed to winds directly from the sea.
II Medium - Areas with industries not producing particularly polluting smoke and/or with average low density of houses equipped with heating plants. Areas with high density of houses and/or industries subjected to frequent winds and/or rainfall. Areas exposed to the wind from the sea but not too close to the coast (at least several kilometres distance).*
Ill Heavy - Areas with high density of industries and suburbs of large cities with high density of heating plants producing pollution. Areas close to the sea or in any case exposed to relatively strong winds from the sea.*
IV Very Heavy - Areas generally of moderate extent, subjected to conductive dusts and to industrial smoke producing thick conductive deposits. Areas generally of moderate extent, very close to the coast and exposed to sea spray or to very strong polluting winds from the sea. Desert areas, characterised by no rain for long periods, exposed to strong winds carrying sand and salt, and subjected to regular condensations.
# Use of fertilisers by spraying, or the burning of crop lead to a higher pollution level due to dispersal by wind.
residues, can
* Distances from the sea coast depend on area and the extreme wind conditions.
the topography of the coastal
TABLE 3.1 lEC RECOMMENDATION POLLUTION SEVERITY LEVEL

123
3.2.1 Conductor Reraoval
After the attachraent of appropriate lowering slings, rigging and
winches, the conductor was detached frora the insulator string at
the suspension structure of interest and the suspension structure
either side. The conductor was then lowered at all three
structure sites until the required length of conductor rested at
ground level.
Prior to the cutting of the conductor, bonding tape and wooden
cleats were fitted to the conductor as illustrated in Plates 3.1
and 3.2 to insure that relative wire positions were raaintained.
Conductor corae-along clamps were then fitted to the old conductor
and the new replacement conductor and the tension was gradually
and simultaneously applied and released to the new replacement
conductor and the old conductor section being reraoved
respectively. This was siraultaneously repeated at the other end
of the length of conductor to be reraoved. When no apparent
tension reraained in the old conductor the old conductor was cut
and removed.
Midspan joints were applied at the two ends of the new
replaceraent conductor and the new intact section of conductor was
raised and reattached to the insulator string.
The removal of the field conductor in this manner was achieved by
employing the appropriate resources and the transmission line
outage was restricted to approximately 6 hours.

124
PLATE 3.1 FITTING OF BONDING TAPE TO THE CONDUCTOR SAMPLE

125
PLATE 3.2 FITTING OF WOODEN CLEATS TO THE CONDUCTOR SAMPLE

126
The old conductor sample was person handled to rolled onto an
oversized conductor drum for subsequent transport to the
laboratory. Person handling in this raanner insured that no
surface daraage of the conductor was incurred
3.3 METALLOGRAPHIC EXAMINATION
Metallographic examinations fall into two categories, macro-examination
and micro-exarainations.
3.3.1 Macro-examination
Macro-examination consists of an inspection and visual
examination of the various layers that constitute the conductor
and recording the observations. Samples of conductor should be
taken from suspension points that are likely to have suffered
sorae degree of degradation due to fatigue.
Observations are likely to reveal, surface pitting, corrosion,
foreign particles, closing die depressions, surface abrasion,
black and white powders, weeping tars and greases, wire fretting,
wire fatigue cracks, broken wires and in the case of steel cores,
loss of zinc coating and in sorae cases rust.
Typical foreign particles found on and within the voids of the
various wire layers are white powders, typically sulphates and
nitrates used in the raanufacturer of fertiliser, sodiura chloride
cyrstals and dirt particles. In raining and industrial regions
foreign particules raay be found that are corapatible with the
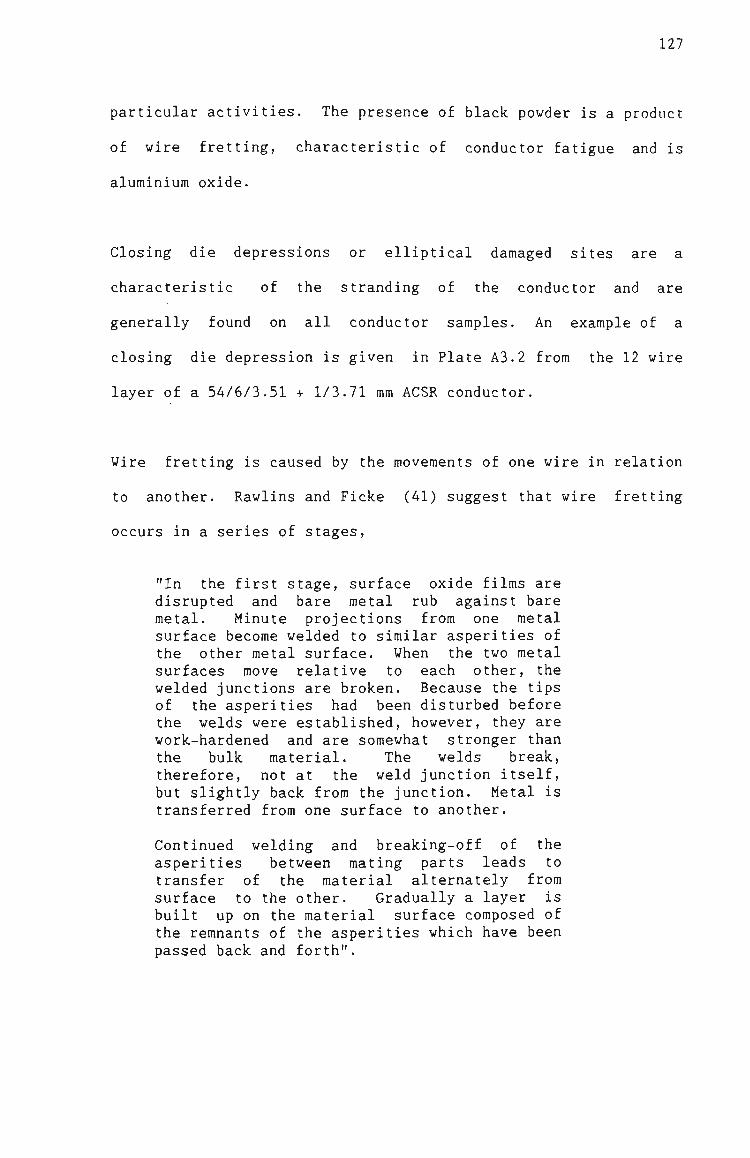
127
particular activities. The presence of black powder is a product
of wire fretting, characteristic of conductor fatigue and is
alurainium oxide.
Closing die depressions or elliptical damaged sites are a
characteristic of the stranding of the conductor and are
generally found on all conductor samples. An example of a
closing die depression is given in Plate A3.2 from the 12 wire
layer of a 54/6/3.51 + 1/3.71 ram ACSR conductor.
Wire fretting is caused by the moveraents of one wire in relation
to another. Rawlins and Ficke (41) suggest that wire fretting
occurs in a series of stages,
"In the first stage, surface oxide films are disrupted and bare raetal rub against bare raetal. Minute projections frora one raetal surface becorae welded to sirailar asperities of the other raetal surface. When the two metal surfaces move relative to each other, the welded junctions are broken. Because the tips of the asperities had been disturbed before the welds were established, however, they are work-hardened and are somewhat stronger than the bulk raaterial. The welds break, therefore, not at the weld junction itself, but slightly back frora the junction. Metal is transferred from one surface to another.
Continued welding and breaking-off of the asperities between mating parts leads to transfer of the material alternately from surface to the other. Gradually a layer is built up on the material surface composed of the remnants of the asperities which have been passed back and forth".

128
The surface of the wire created by the fretting action will
contain many fine cracks. The presence of the cracks are sites
of stress concentration which may eventually lead to fatigue
cracks. An example of a wire frett site and wire fatigue crack
frora the 6 wire layer of a 19/3.25 rara AAC conductor is given in
Plate 3.3
Broken wires are the result of the continued fretting action and
if present will obviously be revealed during a metallographic
macro-examination. An example of a broken wire at a suspension
site from the 6 wire layer of a 7/4.22 mra AAAC/6201 conductor is
illustrated in Plate 3.4.
Evidence of preferential corrosion of one raetal in a galvanic
cell in the presence of a conducting medium is likely to be the
most significant metallographic macro observation made during the
examination of a conductor sample.
In a galvanic cell, the metal loss or the amount of current flow
depends on the potential difference in the mediura, the electrical
resistance between the two raetals, the conductivity of the
electrolyte and the degree of polarisation of the two raetals.
Severity of attack depends on the anode to cathode contact area
or in other words the current density.
In ACSR conductors, Forest and Ward (39) suggested that the
electrochemical effects of contact between aluminium and
galvanised steel core wire are responsible for corrosion product
bulges in conductors in coastal environraents. Initially, a cell

129
« • - • .• ^ , V - ' '
<^^u>/-.^
PLATE 3.3 19/3.25 AAC CONDUCTOR CONDUCTOR FRETTING AND FATIGUE CRACK
PLATE 3.4 7/4.22 AAAC/6201 CONDUCTOR BROKEN STRAND ADJACENT SUSPENSION CLAMP

130
is set up with the zinc anode and the aluminium cathode. The
zinc corrodes in the presence of sulphur oxides and the alkaline
cathode product might produce some attack on the alurainium.
After some of the zinc has been removed, the aluminium will act
as an anode and the steel as a cathode and the aluminium will be
sacrificial to the steel.
Forrest and Ward (39) described;
"the most effective method of reducing corrosion is to prevent moisture, sulphur oxides and other corrosive substances frora coming into contact with the conductor. This can be done by applying a protective raaterial such as grease, bituraen, paint or a plastic film."
The degree of applying the most convenient protection such as
grease or bitumen is described by Haughten and Cole (50) who
suggest that the long terra corrosion behaviour of a conductor is
greatly enhanced if the full advantage of the use of grease to
the penultiraate layer is eraployed and
"that the grease had extended the life of the ACSR by at least a 50 to 60 years".
Other types of corrosion likely to be present in a conductor
saraple are:
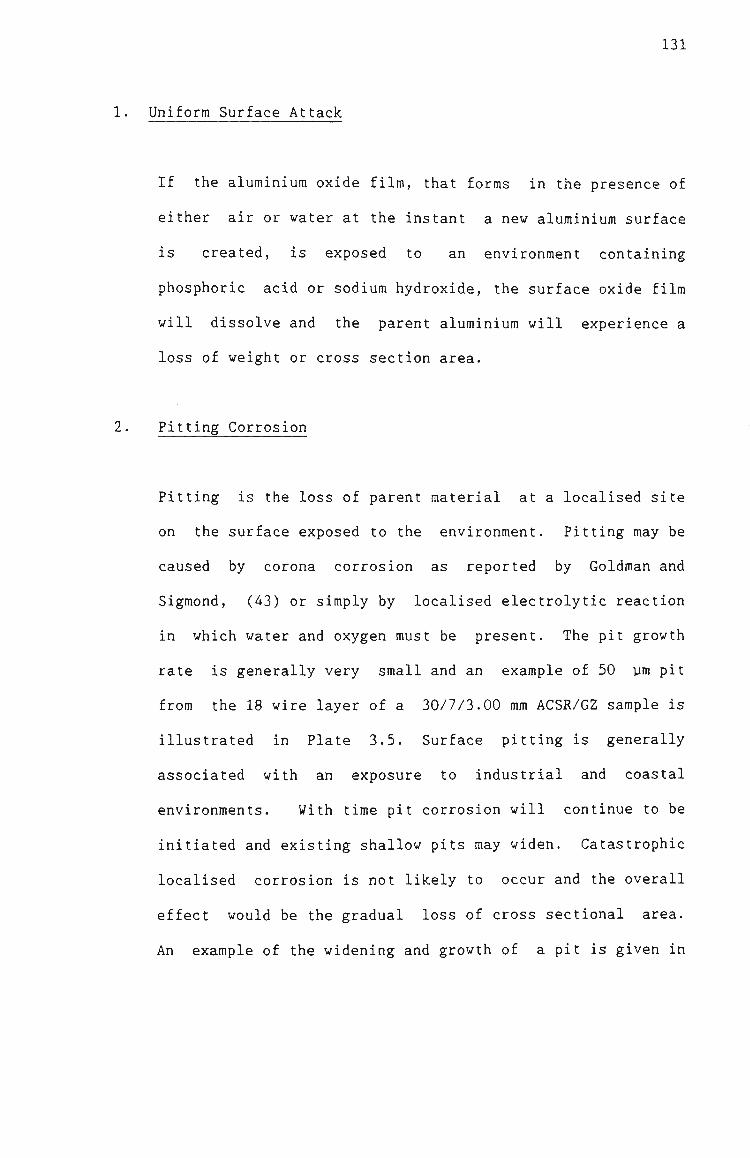
131
1. Uniforra Surface Attack
If the alurainium oxide filra, that forras in the presence of
either air or water at the instant a new alurainiura surface
is created, is exposed to an environment containing
phosphoric acid or sodium hydroxide, the surface oxide film
will dissolve and the parent aluminium will experience a
loss of weight or cross section area.
2. Pitting Corrosion
Pitting is the loss of parent material at a localised site
on the surface exposed to the environment. Pitting may be
caused by corona corrosion as reported by Goldman and
Sigmond, (43) or simply by localised electrolytic reaction
in which water and oxygen must be present. The pit growth
rate is generally very small and an example of 50 ym pit
from the 18 wire layer of a 30/7/3.00 mm ACSR/GZ sample is
illustrated in Plate 3.5. Surface pitting is generally
associated with an exposure to industrial and coastal
environments. With time pit corrosion will continue to be
initiated and existing shallow pits may widen. Catastrophic
localised corrosion is not likely to occur and the overall
effect would be the gradual loss of cross sectional area.
An example of the widening and growth of a pit is given in

132
PLATE 3.5 30/7/3.00 MM ACSR/GZ CONDUCTOR 18 WIRE LAYER WIRE SURFACE PITTING MAGNIFICATION X 200

133
Plate A3.25 which illustrates a longitudional section from
the 18 wire layer of a 30/7/2.99 mm ACSR/GZ conductor. The
pit depth is 0.6 mra and the exposure in a coastal raarine
environraent was 27 years.
3. Crevice Corrosion
If an electrolyte such as water is present in the
interstitial spaces between the wires, localised corrosion in
the forra of pits or etch patches may occur. An example of
crevice corrosion was reported in 1971 in which voluminous
grey to white slightly moist deposits between the penultimate
and ultimate aluminium layers was reported. Subsequent
investigations revealed that the environment was of
particularly high rainfall, frequented by fogs and in close
proximity to a railway line. Chemical examination of the
white deposits revealed alurainiura oxide 66.3%, sulphates 3%
and chlorides 0.7%. It was concluded that the corrosion
resulted from the intermittent entrapment of moisture within
the conductor and the corrosion had been catalysed by the
presence of sulphates and chlorides probably emitted from
locomotives using the railway line in close proximity to the
transmission line.

134
The detailed macro-exaraination comments of the conductor
samples from the Avon to Keraps Creek and Dapto to Springhill
transraission lines are given in Appendix 3. In addition two
further saraples were exarained frora the Toraago to Taree and
Bellambi to Heathcote transmission lines are given.
Regarding the Avon to Kemps Creek transraission line
conductor sample with the exception of the presence of white
powder between the armour rods and conductor, the conductor
was found to be in a normal and good condition. Chemical
tests on the white powder present suggested sulphur and
nitrogen elements. The grease appeared to be in good
conditions and of adequate quantity to protect the interface
between the zinc and the aluminium.
Regarding the Dapto to Springhill transmission line
conductor saraple, sorae evidence of wire fretting was present
however no traces of aluminium oxide were found. This
suggests that sorae wire moveraent has occurred but is not of
a significant araount to produce the aluminium oxide
characteristic of fatigue failure. The conductor was found
to be in a normal and good condition consistent with the age
and the pollution environment. The grease appeared to be in
good condition and of adequate quantity to protect the
interface between the zinc and the aluminium.
Regarding the Tomago to Taree transmission line conductor
sample, considerable evidence of outer layer pitting existed
as illustrated in Plate A3.25. White powder deposits
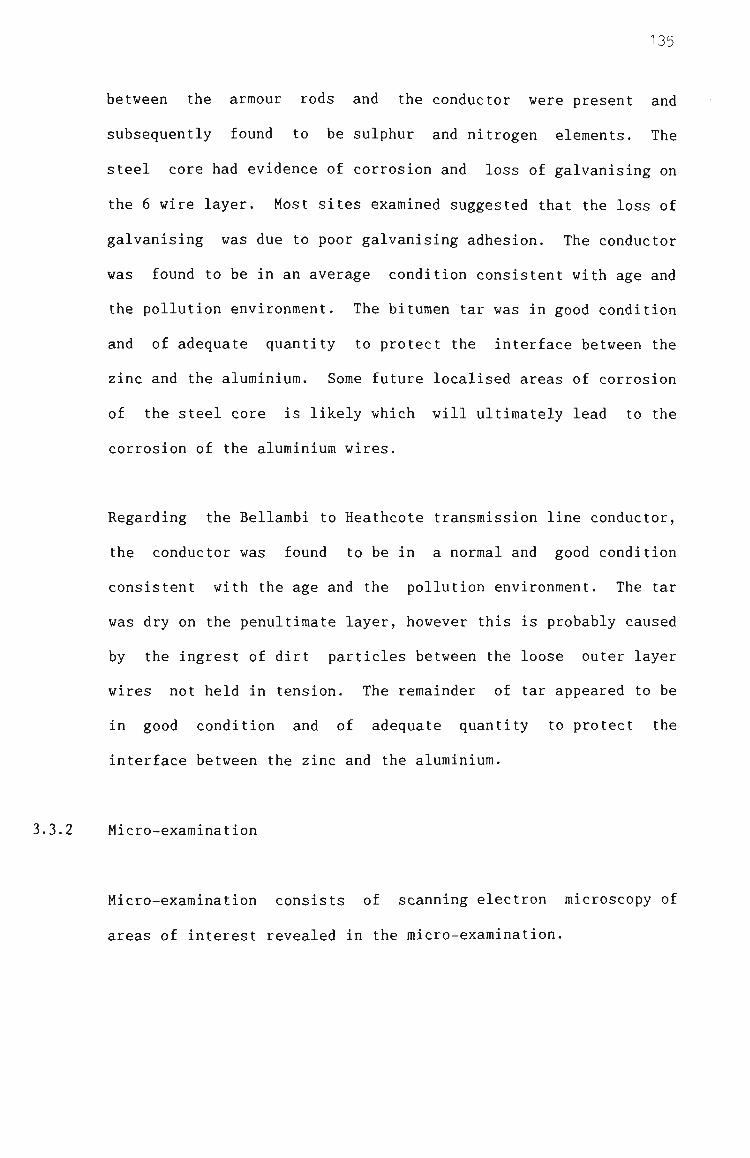
135
between the armour rods and the conductor were present and
subsequently found to be sulphur and nitrogen elements. The
steel core had evidence of corrosion and loss of galvanising on
the 6 wire layer. Most sites exarained suggested that the loss of
galvanising was due to poor galvanising adhesion. The conductor
was found to be in an average condition consistent with age and
the pollution environment. The bitumen tar was in good condition
and of adequate quantity to protect the interface between the
zinc and the alurainiura. Sorae future localised areas of corrosion
of the steel core is likely which will ultimately lead to the
corrosion of the alurainiura wires.
Regarding the Bellarabi to Heathcote transmission line conductor,
the conductor was found to be in a normal and good condition
consistent with the age and the pollution environraent. The tar
was dry on the penultiraate layer, however this is probably caused
by the ingrest of dirt particles between the loose outer layer
wires not held in tension. The remainder of tar appeared to be
in good condition and of adequate quantity to protect the
interface between the zinc and the aluminium.
3.3.2 Micro-examination
Micro-examination consists of scanning electron microscopy of
areas of interest revealed in the micro-exaraination.

136
Sites of fretting fatigue in aluminium wires are examined for
evidence of crack formation and longitudinal sections of
alurainium and steel wires quantify the depth of pit corrosion and
the conditions of the galvanising coating.
Typical scanning electron microscopy of alurainiura wire fatigued
crack surface and longitudinal section showing fatigue crack
initiation are illustrated in the Plates 3.6 and 3.7
respectively.
Typically scanning electron microscopy of longitudinal section
through a steel wire showing galvanised coating is illustrated in
Plate 3.8.
Regarding the Avon to Kemps Creek transmission line conductor
sample, no alurainium wire fatigue crack forraation was present and
no evidence of pitting or loss of the zinc coating of the steel
wires existed. Sorae outer layer alurainiura wire pitting corrosion
was present and the overall condition of the conductor was
consistent with the age and the light pollution environment.

137
PLATE 3.6 SEM OF 19/3.25 MM AAC ALUMINIUM WIRE FATIGUE CRACK SURFACE
PLATE 3.7 SEM OF 19/3.25 MM AAC LONGITUDINAL SECTION OF FATIGUE CRACK
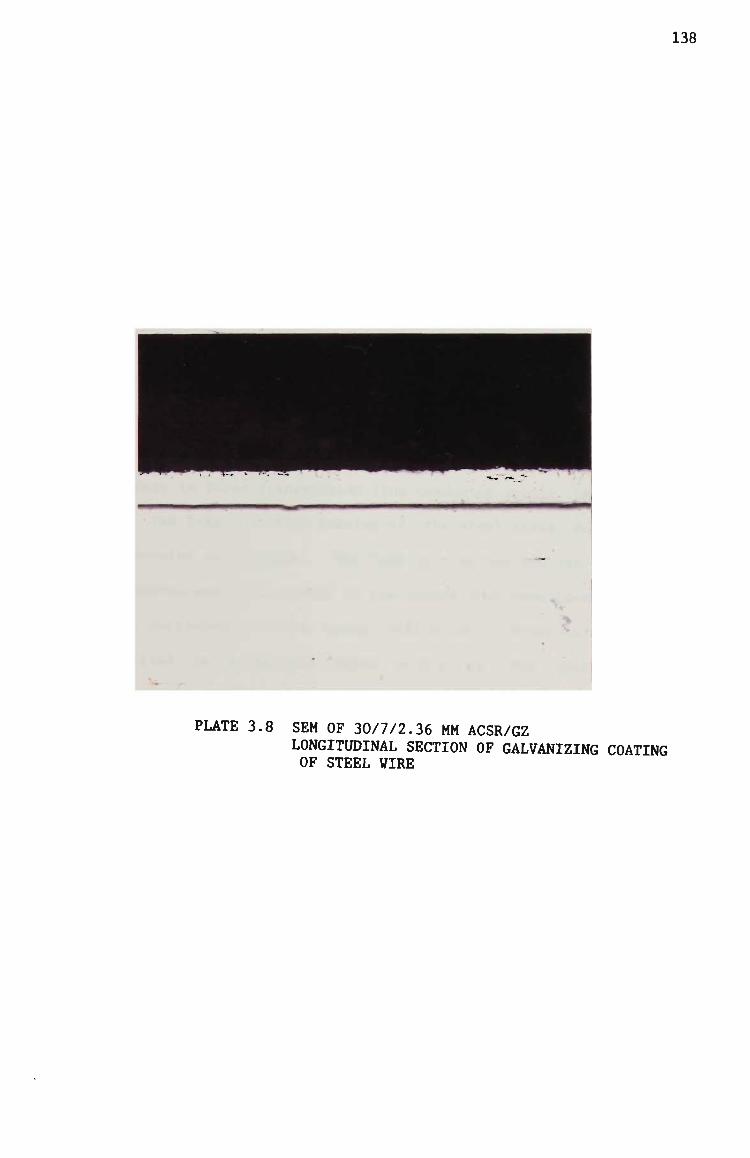
138
PLATE 3.8 SEM OF 30/7/2.36 MM ACSR/GZ LONGITUDINAL SECTION OF GALVANIZING COATING OF STEEL WIRE
139
Regarding the Dapto to Springhill transmission line conductor
saraple, no alurainium wire fatigue crack forraation was present,
however sorae evidence of excessive closing die force was present
on the 12 wire alurainiura layer. No evidence of pitting or loss
of the zinc coating of the steel wires existed. Similarly to the
Avon to Keraps Creek transraission line sorae outer layer alurainiura
wire pitting corrosion was present. The condition of the
conductor is consistent with the age and the heavy pollution
environment.
No aluminium wire fatigue crack forraation was present on the
Tomago to Taree transmission line conductor sample. Several sites
of the loss of zinc coating of the steel wires and initiated
corrosion were present. The loss of zinc coating was due to poor
adhesion and it is likely in the future that some localised areas
of corrosion of the steel will occur. Outer layer pitting
existed to a maximura depth of 0.6 mra. The quality of the
conductor is consistent with the age and coastal marine
environraent.
Since the Bellambi to Heathcote transmission line saraple was
reraoved from a jumper connection not subjected to stringing
tension, exaraination for alurainiura wire fatigue crack forraation
was not carried out. No evidence of pitting or loss of the zinc
coating of the steel wires existed. Sorae outer layer aluminium
wire pitting corrosion was present and the overall condition of
the conductor was consistent with the age and the light pollution
environment.
140
3.4 MECHANICAL TESTS
The mechanical tests of conductors fall into two categories, the component
or wire tests and the composite or conductor tests.
3.4.1 Wire Tests
At elevated temperature under norraal atmospheric conditions for
extended times the raechanical and electrical properties of wires
can change. In the case of transraission lines having designed
therraal ratings of 85°C and in some cases 120°C both the
conductivity and tensile strength of the component wires of a
conductor will change with time.
Accordingly, wire tests to deterraine the tensile strength and
conductivity are the elementary means of determining the level of
degradation in a conductor.
Carrying out the tensile and resistivity tests is a relatively
easy task. The difficulty in assessing the level of degradation
of the wire coraraences in the decision to choose the initial wire
property acceptance criteria. One could simply take the
available initial criteria from the appropriate standard that the
wire was manufactured in accordance with and compare the wire
property test results. This is one method of measuring the level
of degradation of the conductor being assessed.

141
Unfortunately, this method of assessing the level of degradation
does not recognise that it is common practise in any
manufacturing process to set the appropriate standard acceptance
criteria at approxiraately minus three standard deviations of
typical standard distribution curve.
Typical standard distribution of a manufacturing process for 3 mra
diaraeter, 1350 aluminium wires manufactured in a 12 month period
for diameter, ultimate tensile strength and resistivity is
illustrated in Figures 3.2 to 3.4 respectively.
These standard distributions illustrate that,
1. the mean diameter is 3.011 rara for a norainal 3.00 mra wire, a
marginal tolerance in the manufacturing process of +0.367%;
2. the mean ultimate tensile strength is 0.209 GPa for a norainal
0.169 GPa strength, a marginal tolerance in the manufacturing
process of +23.6%; and
3. the mean resistivity is 0.0278 y.m for a norainal 0.0283 u.ra,
a marginal tolerance in the manufacturing process of -1.77%.

142
200 - AS1220.1-1973 RANGE 2 .97 - 3 .03 mm
"I r r
180 r
160 -
140 L.
120 > U z LU ZI 100 r-(3 LLI 01 U.
80 p
60
40
20 r
F~
^ Z=l._i: .-H-. V A
^
/
1
I 3 _
J -.\ I 2.97
I _ ^ L L 1 , I I - -I I • 2.982 2.994 3.006 3.018 3.03
DIAMETER (mm)
FIGURE 3.2 DISTRUBITION OF DIAMETER OF 3.OOMM 1350 WIRE
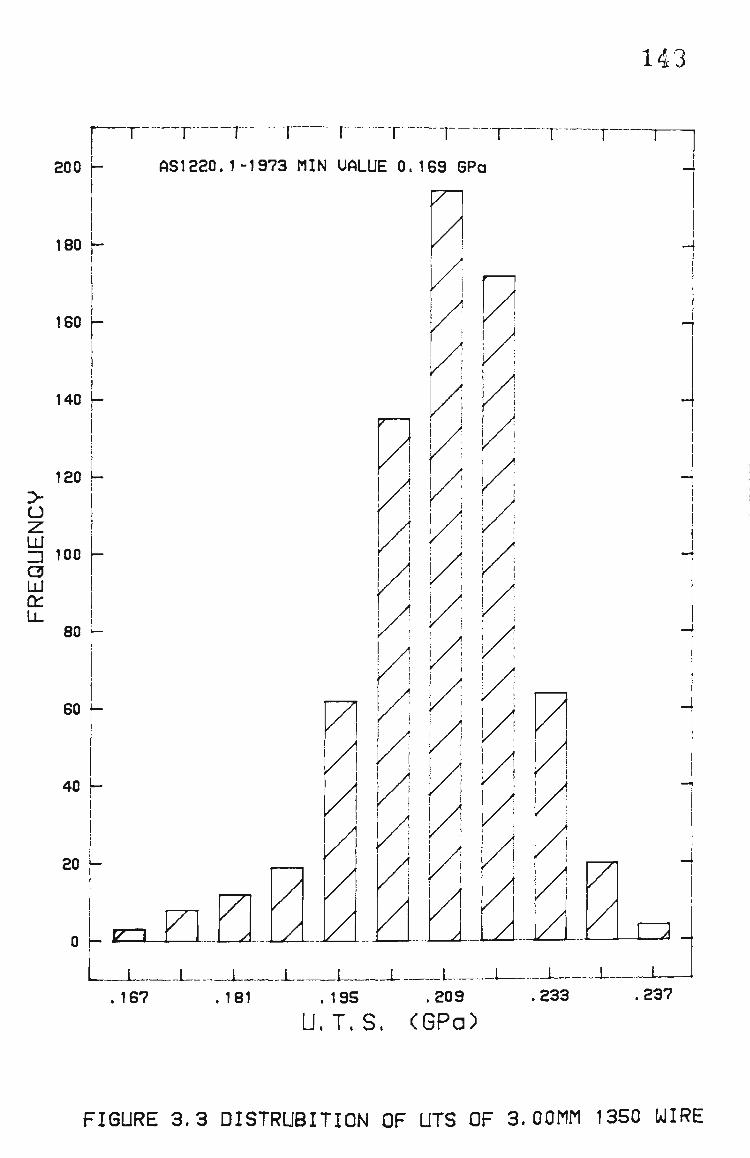
143
200 I -
180 t-
160 h
140 -
120 ->
a UJ Z2 100 -(3 LU LL
80 p
60
40
20
_ zm
T
AS1220.1-1973 MIN UALUE 0.169 6Pa
~] r
iz X
. 167
A- A -\ L
. 181
T
! i
I !
! !
i I
y
-X I. _ J I .195 .209
U.T.S. (GPa)
ASA .233
nik-
.237
FIGURE 3 . 3 DISTRUBITION OF UTS OF 3.OOMM 1350 WIRE
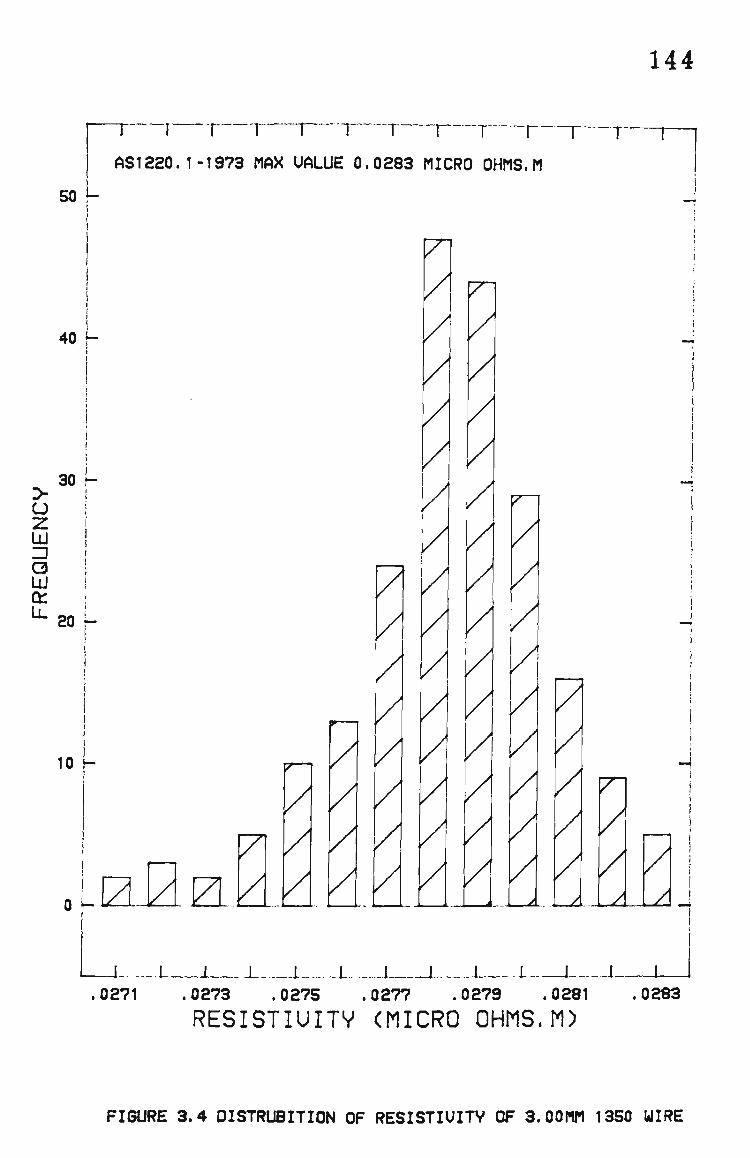
144
50 J-
_ ^ J. ^ J . ^ J . J — _ ^ _
AS1220.1-1973 MAX UALUE 0.0283 MICRO OHMS.M
40 H
> U z UJ Z]
a UJ u.
30 h
20 r-
10 [-
n
P" LIZ.MZL,k]
/ /
F
p^
/ / / .A—X
/
/
A
A
A
- I L . X \- X \- X L .0271
-J t L .0273 .0275 .0277 .0279 .0281
RESISTIUITV (MICRO OHMS.M)
A
A
X .0283
FISURE 3.4 DISTRUBITION OF RESISTIUITV OF 3.OOMM 1350 WIRE

145
An exaraple of the possible raisinterpretation of the level of
degradation of a wire is illustrated as follows. After 15 years
of service operation, the ultimate tensile strength of a 3.00 mm
wire, manufactured during the aboveraentioned period could be
found to be 0.175 GPa. Comparison with the nominal standard
value of 0.169 GPa would suggest that no degradation has taken
place. In fact, the wire has a strength of 3.55% greater than
that of the standard. However, a comparison made with the
process capability survey suggests that a degradation of -16.3%
has occurred.
Process capability surveys that give manufacturing tolerances are
a relatively new concept and arise from quality assurance
programs. Conductor manufacturers prior to the early 80's will
generally have no standard distribution data available. In the
absence of a process capability survey, the wire tests can only
be interpretated as complying with the appropriate standard.
As a result of such wire tests it would be concluded that if no
degradation has occurred in the period between manufacturer and
subsequent assessment than the likelihood of any future
degradation under the same operating conditions and future period
will be small.

146
3.4.1.1 Cross Sectional Area
The diameter of a wire is defined as the mean of two measurements
taken at right angle at any one section. The cross sectional
area is determined from the diameter.
Changes in cross sectional area of a wire may be caused by
conductor creep, fatigue fretting and corrosion. For steel
wires, loss of galvanising coating is another possible cause of
reduction of cross sectional area. The typical cross sectional
area reductions caused by fatigue fretting of alurainium wires and
loss of galvanising coating of steel wires are illustrated in
Plates 3.9 and 3.10 respectively.
The details of the cross sectional area of the wires that
constitute the conductor samples frora the Avon to Keraps Creek and
the Dapto to Springhill transmission lines are given in Appendix
3. In addition two further samples from the Toraago to Taree and
Bellambi to Heathcote transmission lines are given.
A suramary of the findings of the cross sectional area
measurements is given in Tables 3.2 and 3.3 for the alurainiura and
steel wires, respectively.
Regarding the alurainium wires, with the exception of the Bellambi
to Heathcote conductor sample, the mean and minimum cross
sectional areas complied with the requirements of Australian
Standard C75.1 1963(6). The Bellambi to Heathcote conductor 12
wire layer sample mean and miniraum cross sectional areas were

147
PLATE 3.9 SEM OF 19/3.75 MM AAC 12 WIRE LAYER FATIGUE FRETTING MAGNIFICATION X 200

148
PLATE 3.10 SEM OF 30/7/2.997 MM ACSR/G2 6 WIRE LAYER STEEL STRAND LOSS OF GALVANISING MAGNIFICATION X 200
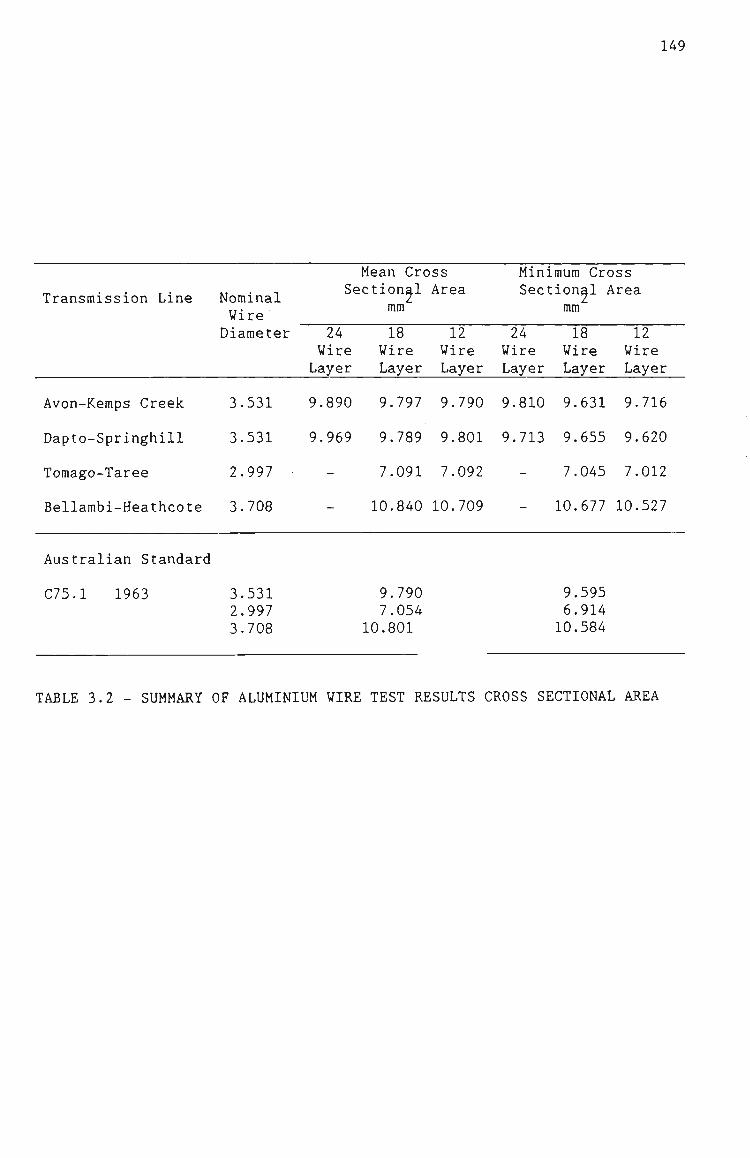
149
Transmission Line
^
Avon-Kemps Creek
Dapto-Springhill
Tomago-Taree
Bellambi-Heathcote
Australian Standard
C75.1 1963
Nominal Wire Diameter
3.531
3.531
2.997
3.708
3.531 2.997 3.708
Mean Cross Sectional
ram
24 Wire Layer
9.890
9.969
-
-
18 Wire Layer
9.797
9.789
7.091
10.840
9.790 7.054
10.801
Area
12 Wire Layer
9.790
9.801
7.092
10.709
Minimura Cross Sectional Area
rara
24 Wire Layer
9.810
9.713
-
-
18 Wire Layer
9.631
9.655
7.045
10.677
9.595 6.914 10.584
12 Wire Layer
9.716
9.620
7.012
10.527
TABLE 3.2 - SUMMARY OF ALUMINIUM WIRE TEST RESULTS CROSS SECTIONAL AREA
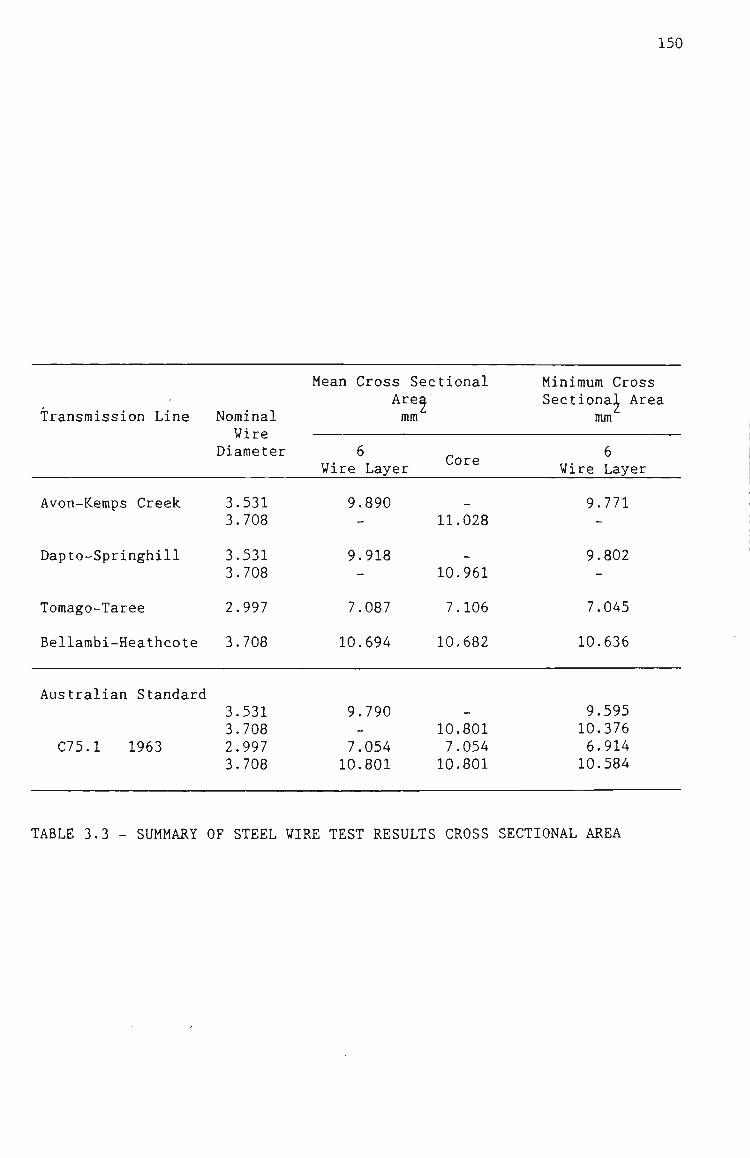
150
Transraission Line
Avon-Kemps Creek
Dapto-Springhill
Tomago-Taree
Bellambi-Heathcote
Australian Standard
C75.1 1963
Norainal Wire
Diaraeter
3.531 3.708
3.531 3.708
2.997
3.708
3.531 3.708 2.997 3.708
Mean Cross Sectional Area rara
6 Wire Layer
9.890 -
9.918 -
7.087
10.694
9.790 —
7.054 10.801
Core
11.028
_
10.961
7.106
10,682
-
10.801 7.054 10.801
Minimura Cross Sectional Area
mra
6 Wire Layer
9.771 -
9.802 -
7.045
10.636
9.595 10.376 6.914 10.584
TABLE 3.3 - SUMMARY OF STEEL WIRE TEST RESULTS CROSS SECTIONAL AREA

151
0.9% and 0.5% respectively less than the rainimura criteria of the
Australian Standard. Even after excluding the wire with the
rainimura cross sectional area frora the raean cross sectional area
determination, a 0.7% average reduction in cross sectional area
is revealed.
As raentioned in Section 3.3 there was no significant evidence of
corrosion or fatigue fretting on all the samples exarained.
Regarding the Bellarabi to Heathcote conductor saraple which was
removed frora a jumper connection not subjected to stringing
tension the reduction of cross sectional area due to creep was
discounted. However, since this conductor sample is from one of
the oldest transmission lines in the state of NSW and whilst the
18 wire layer mean and miniraum cross sectional areas complied
with the requirements of the Australian Standard, it is concluded
that the quality assurance for the 12 wire layer was
unsatisfactory and the wires were probably undersized at
manufacturer.
Regarding the steel wires, for all samples, the mean and miniraum
cross sectional areas complied with the Australian Standard C75.1
1963.
Accordingly, it is concluded that no degradation in cross
sectional area of the saraples tested has occurred as a result of
norraal in service use and pollution environraents ranging frora
light to heavy.

152
3.4.1.2 Mechancial Properties
The raechanical properties of a wire are assessed by determining
the breaking load, ultimate tensile strength and elongation.
The breaking load of a wire is defined as the raaximura load
obtained in a tensile test, the ultimate tensile strength of a
wire is defined as the breaking load divided by the cross
sectional area of the area, and the elongation of a wire is
defined as a measureraent of the increase in distance between two
gauged marks, after carefully fitting the broken ends of the
tensile test wire specimen together.
Changes in a breaking load of a wire may be caused by changes in
the cross sectional area or ultimate tensile strength. To
eliminate variations in the mechanical properties of the wire
caused by variations in cross sectional area and to assess the
extent of annealing the ultimate tensile strength of the wire is
determined. Annealing of the wires at elevated temperatures can
cause appreciable loss of tensile strength as illustrated in
Figures 3.5, 3.6 and 3.7 for alurainiura 1350 and alurainiura alloy
1120 and 6201 respectively (53). Curaulative annealing damage is
determined by sumraating the daraage at one temperature and
exposure time to an identical damage at a second temperature with
an equivalent exposure time. Samples of conductor reraoved frora
suspension points may exhibit lower breaking loads caused by an
effective reduction in cross sectional area by fatigue initiated
microcracks.

153
O CO OS —
1
i /
/
/
/
1
o
/
/
o CO
C3 - • I CO
>
CD
ro
> -C5
or CD
CD
CD O
13 +-O
CC
oo
oo
to
o
CD
CD
LU CD
C-> Od.
CD
y+6u9J+s 8|isu8i I QUI61 JO i-o eSo+ueojScj

154
OO
1 /
/
o
CVJ
1 1
1 i
j i
o CD
CD
CO >
o
or CD
CD
CD
(D
<o
od I— OO
OO
CO
\_ o
CD
Od o
o LU CD
cr: LU Q_
rn
Qd ZD CD
m6uaj+s 3|lsuQi |DUi5iJ0 j.o a5D|U90J9d

155
3,001
3,08
I 1
I
\
j I !
/
/
/
1 1 /
1
1
\ i
/ 1
3,051
CD
CD O
o o CD
CD
CD Csl CO
> -CD
or CD
CD
- t -
to
cr: I — OO
OO
CD
CD
CD -«a:
CD
cr:
m cr: CD
q4.6U9J+S 9 | lSU9 i IDUjSjJO ^ 9BD+U90J9d

156
Changes in the elongation of a wire indicate a change in the
ductility of the wires.
The details of the breaking loads, ultiraate tensile strength and
elongation of the wires that constitute the conductor saraples
frora the Avon to Keraps Creek and Dapto to Springhill transraission
lines are given in Appendix 3. In addition two further samples
frora the Toraago to Taree and Bellambi to Heathcote transraission
lines are given in Appendix 3.
All samples of the conductor used for the mechanical property
tests were taken from areas away from the suspension points.
Additional samples from the suspension point were tested after
macro and micro-examinations, however no significant difference
in the test results were revealed.
A suraraary of the findings of the wire breaking loads are given in
Tables 3.4 and 3.5 for the alurainiura and steel strands,
respectively. A suramary of the findings of the wire ultiraate
tensile strengths are given in Tables 3.6 and 3.7 for alurainiura
and steel strands, respectively and finally a suramary of the
findings of the wire elongations are given in Tables 3.8 and 3.9
for aluminium and steel strands, respectively.
Regarding the aluminium wire breaking loads for the,
1. Avon to Keraps Creek transmission line conductor sample, two
wires one frora the 18 wire layer and one from the 12 wire
layer did not comply with the rainimura breaking load criteria
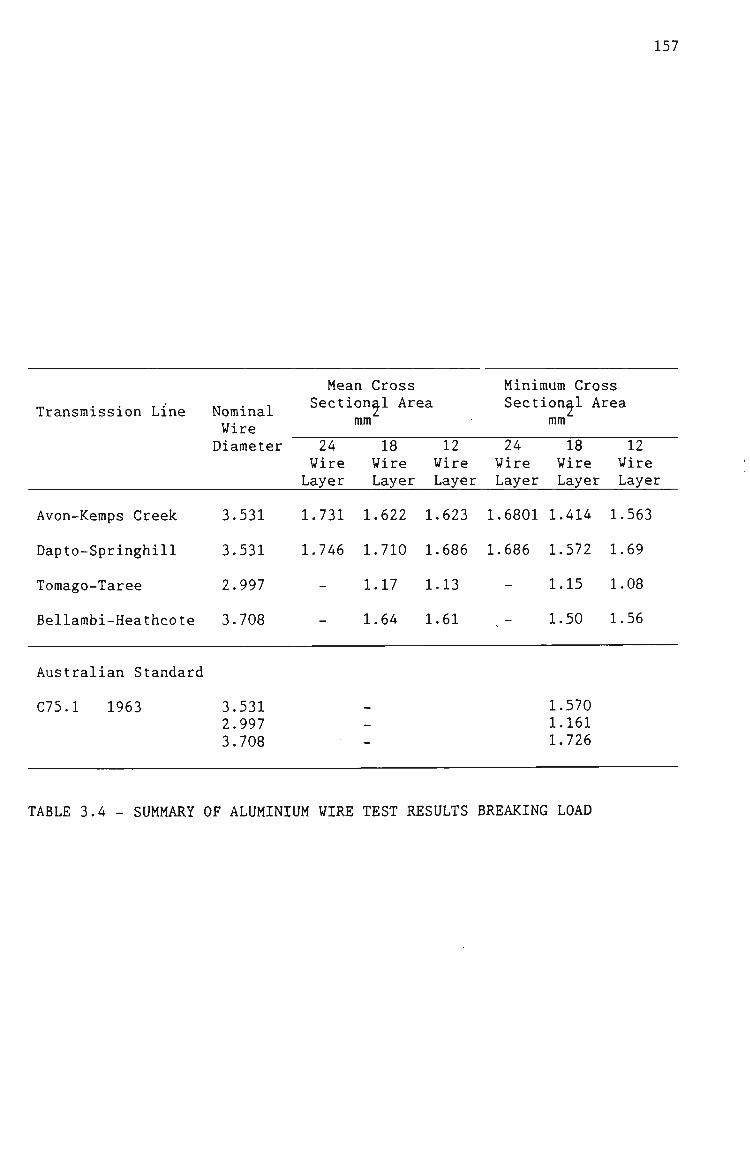
157
Transmission Line
Avon-Kemps Creek
Dapto-Springhill
Tomago-Taree
Bellambi-Heathcote
Australian Standard
C75.1 1963
Nominal Wire Diameter
3.531
3.531
2.997
3.708
3.531 2.997 3.708
Mean Cross Sectional Area
rara
24 Wire Layer
1.731
1.746
-
-
18 Wire Layer
1.622
1.710
1.17
1.64
-
12 Wire Layer
1.623
1.686
1.13
1.61
Mini Sect
24 Wire Layer
1.6801
1.686
-
num Cross ional Area mra
18 Wire Layer
1.414
1.572
1.15
1.50
1.570 1.161 1.726
12 Wire Layer
1.563
1.69
1.08
1.56
TABLE 3.4 - SUMMARY OF ALUMINIUM WIRE TEST RESULTS BREAKING LOAD
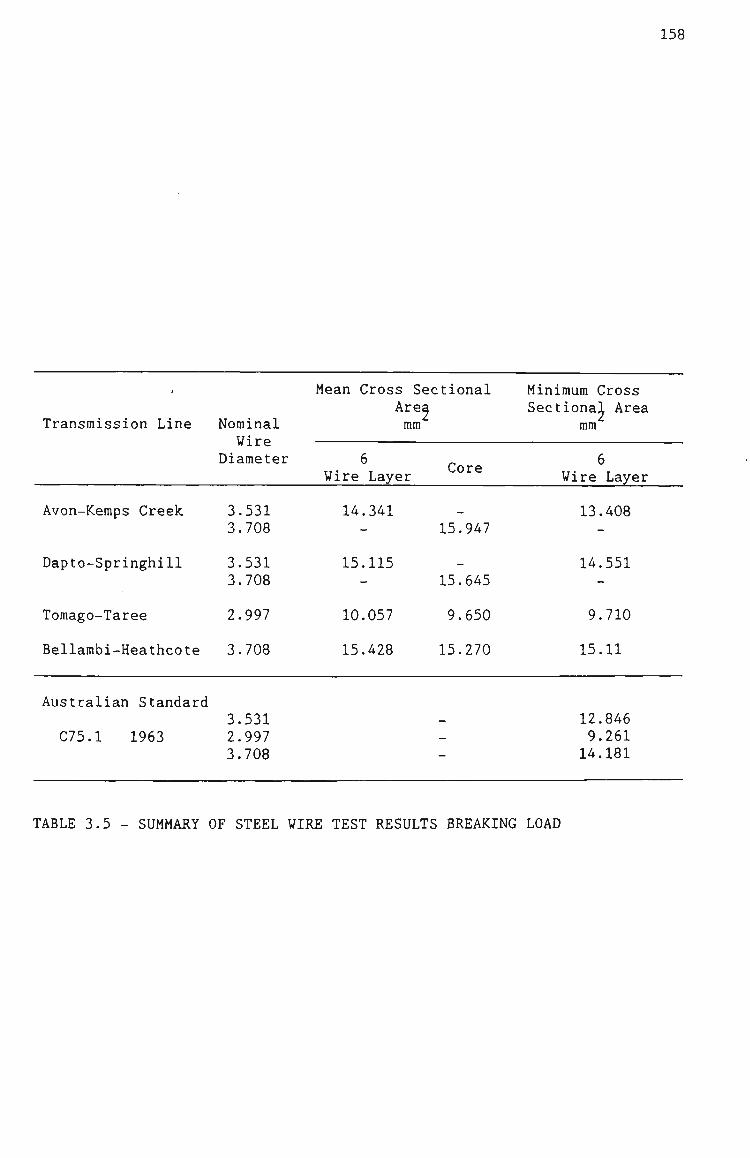
158
,
Transmission Line
Avon-Keraps Creek
Dapto-Springhill
Tomago-Taree
Bellambi-Heathcote
Australian Standard
C75.1 1963
Nominal Wire
Diaraeter
3.531 3.708
3.531 3.708
2.997
3.708
3.531 2.997 3.708
Mean Cross Sectional Area ram
6 Wire Layer
14.341 -
15.115 -
10.057
15.428
Core
15.947
_
15.645
9.650
15.270
— —
—
Minimum Cross Sectional Area
mra
6 Wire Layer
13.408 -
14.551 -
9.710
15.11
12.846 9.261 14.181
TABLE 3.5 - SUMMARY OF STEEL WIRE TEST RESULTS BREAKING LOAD
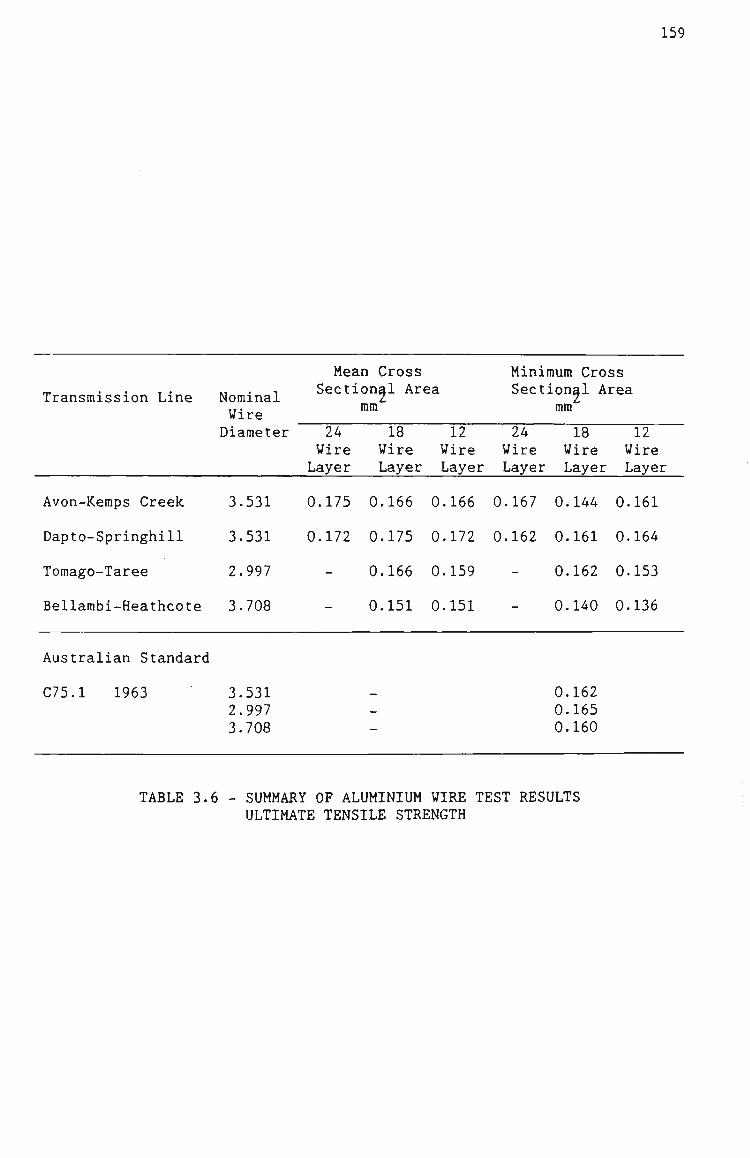
159
Transmission Line
Avon-Keraps Creek
Dapto-Springhill
Tomago-Taree
Bellambi-Heathcote
Australian Standard
C75.1 1963
Nominal Wire Diaraeter
3.531
3.531
2.997
3.708
3.531 2.997 3.708
Mean Cross Sectional Area
mm
24 Wire Layer
0.175
0.172
-
-
18 Wire Layer
0.166
0.175
0.166
0.151
^
12 Wire Layer
0.166
0.172
0.159
0.151
Minimum Cross Sect
24 Wire Layer
0.167
0.162
-
-
ional Area rara
18 Wire Layer
0.144
0.161
0.162
0.140
0.162 0.165 0.160
12 Wire Layer
0.161
0.164
0.153
0.136
TABLE 3.6 - SUMMARY OF ALUMINIUM WIRE TEST RESULTS ULTIMATE TENSILE STRENGTH
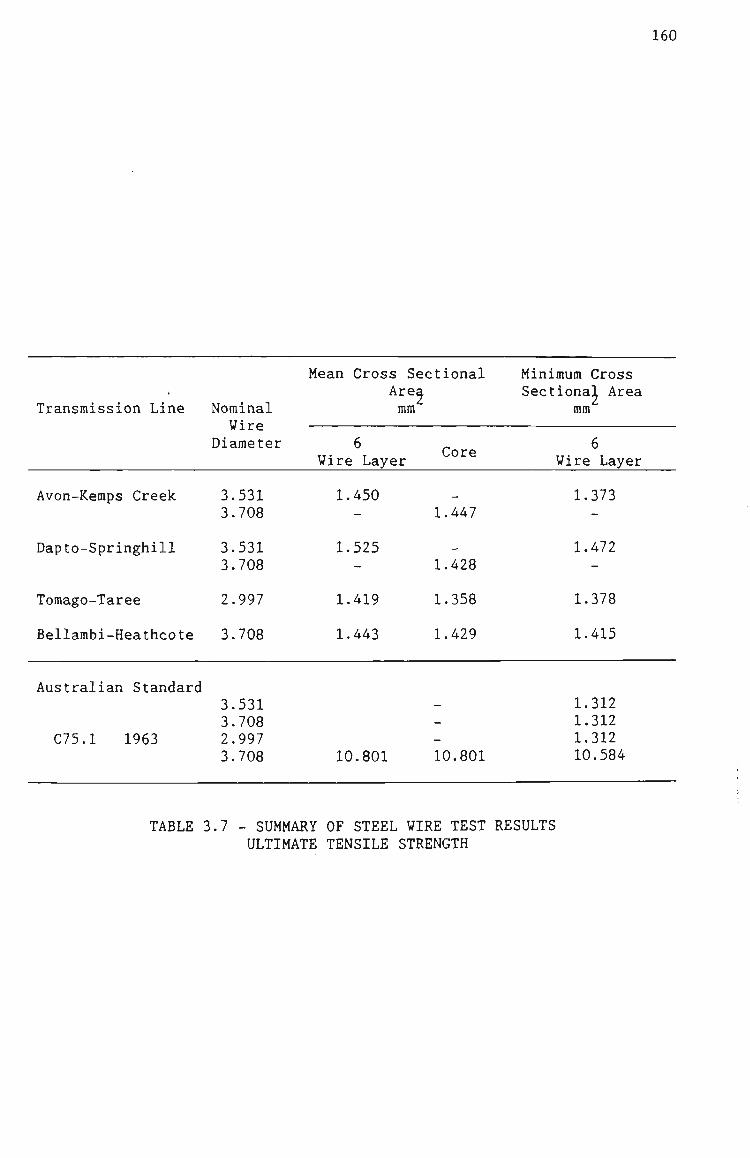
160
Mean Cross Sectional Minimum Cross Area Sectional Area
Transmission Line Norainal mm ram Wire
Diameter 6 ^ 6 TT- T Core ,,. , Wire Layer Wire Layer
Avon-Kemps Creek 3.531 1.450 - 1.373 3.708 - 1.447
Dapto-Springhill 3.531 1.525 - 1.472
3.708 - 1.428
Tomago-Taree 2.997 1.419 1.358 1.378
Bellambi-Heathcote 3.708 1.443 1.429 1.415
Australian Standard 3.531 - 1.312 3.708 - 1.312
C75.1 1963 2.997 - 1.312 3.708 10.801 10.801 10.584
TABLE 3.7 - SUMMARY OF STEEL WIRE TEST RESULTS ULTIMATE TENSILE STRENGTH
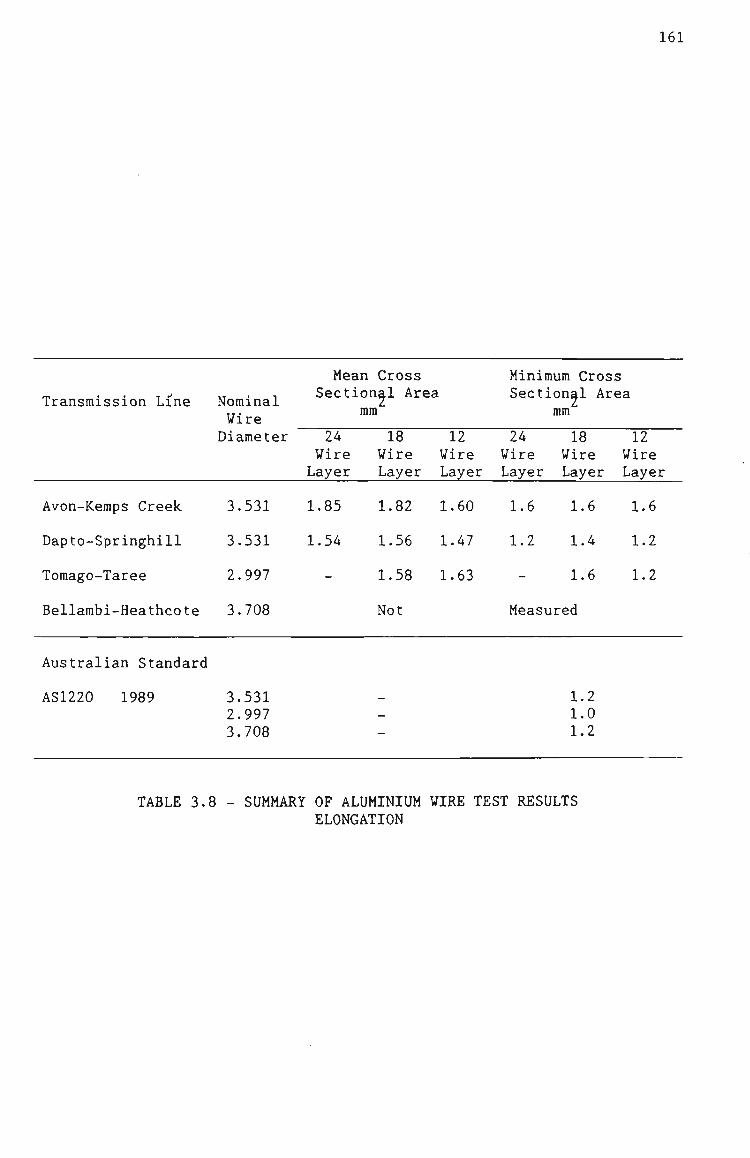
161
Transmission Line
Avon-Keraps Creek
Dapto-Springhill
Toraago-Taree
Bellarabi-Heathcote
Australian Standard
AS1220 1989
Nominal Wire Diameter
3.531
3.531
2.997
3.708
3.531 2.997 3.708
Mean Cross Sectional Area
mra
24 Wire Layer
1.85
1.54
-
18 Wire Layer
1.82
1.56
1.58
Not
-
12 Wire Layer
1.60
1.47
1.63
Minimum Cross Sect
24 Wire Layer
1.6
1.2
-
Lonal Area rara
18 Wire Layer
1.6
1.4
1.6
Measured
1.2 1.0 1.2
12 Wire Layer
1.6
1.2
1.2
TABLE 3.8 - SUMMARY OF ALUMINIUM WIRE TEST RESULTS ELONGATION
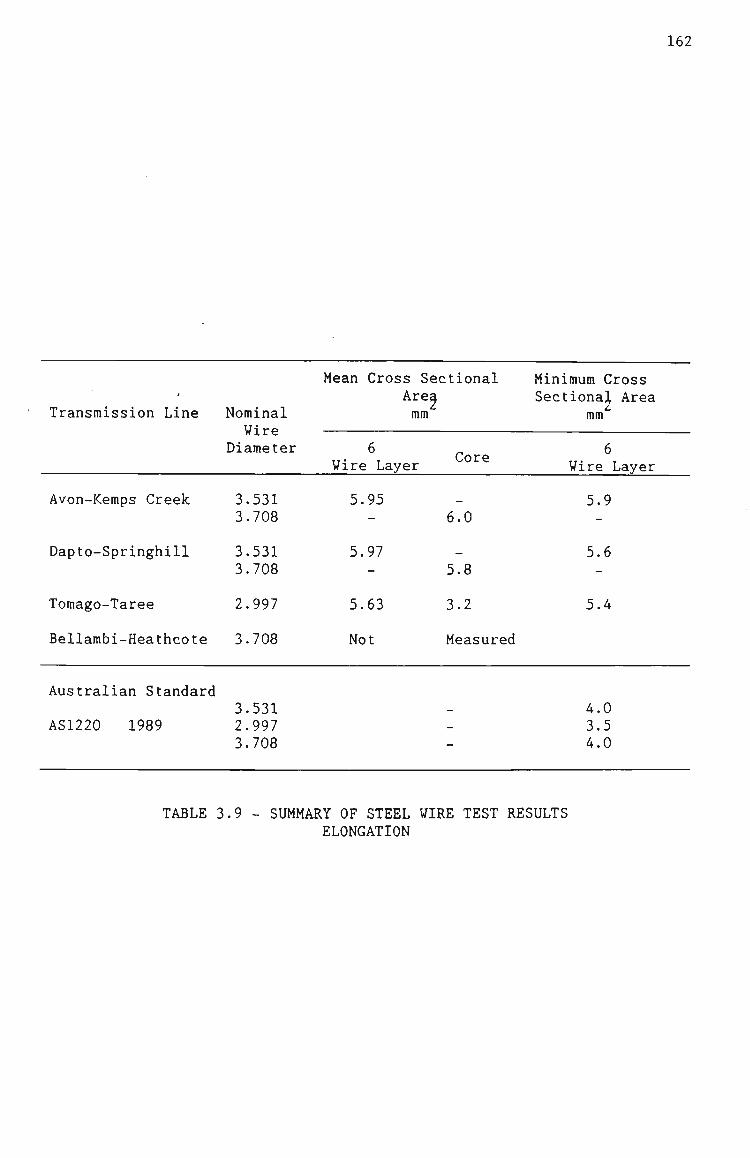
162
'
Transmission Line
Avon-Keraps Creek
Dapto-Springhill
Toraago-Taree
Bellarabi-Heathcote
Australian Standard
AS1220 1989
Norainal Wire
Diameter
3.531 3.708
3.531 3.708
2.997
3.708
3.531 2.997 3.708
Mean Cross Sectional
6
Area rara
Wire Layer
5.95 -
5.97 -
5.63
Not
Core
6.0
_
5.8
3.2
Measured
— —
—
Miniraum Cross Sectional Area
rara
6 Wire Layer
5.9 -
5.6 -
5.4
4.0 3.5 4.0
TABLE 3.9 - SUMMARY OF STEEL WIRE TEST RESULTS ELONGATION

163
and the raean breaking load was 10.3, 3.3 and 3.4% in excess
of the rainiraura requireraent for the 24, 18 and 12 wire layers
respectively;
2. Dapto to Springhill transmission line conductor sample, all
the wires coraplied with the rainiraura breaking load criteria
and the raean breaking load was 11.2, 8.9 and 7.4% in excess
of the rainiraura requireraent for the 24, 18 and 12 wire layers
respectively;
3. Toraago to Taree transraission line conductor saraple, one wire
from the 18 wire layer and eight wires from the 12 wire layer
did not comply with the miniraum breaking load criteria and
the mean breaking load was 0.78 and -2.60% of the rainiraura
requireraents for the 18 and 12 wire layers respectively; and
4. Bellarabi to Heathcote transraission line conductor sample, all
wires with the exception of two wires frora the 18 wire layer
did not comply with the minimum breaking load criteria and
the mean breaking load was -4.98 and -6.72% of the miniraum
requireraents for the 18 and 12 wire layers respectively.
Regarding the steel wire breaking loads, all the conductor
saraples coraplied with the rainiraura load criteria and for the.

164
1. Avon to Kemps Creek transraission line conductor sample, the
mean breaking load was 11.6 and 7.93% in excess of the
rainimura requireraent for the 6 wire layer and core
respectively;
2. Dapto to Springhill transraission line conductor sample, the
mean breaking load was 17.7 and 10.3% in excess of the
rainimura requirements for the 6 wire layer and core
respectively;
3. Tomago to Taree transraission line conductor sample, the mean
breaking load was 8.60 and 4.2% in excess of the miniraum
requireraents for the 6 wire layer and core respectively; and
4. Bellambi to Heathcote transraission line conductor sample, the
mean breaking load was 8.79 and 7.68% in excess of the
minimum requirement for the 6 wire layer and core
respectively.
Regarding the aluminium wire ultimate tensile strengths for the,
1. Avon to Keraps Creek transraission line conductor sample, two
wires, one from the 18 wire layer and one from the 12 wire
layer did not comply with the minimum ultiraate tensile
strength (the same two wires that did not meet the rainiraura
breaking load requireraent) and the mean ultiraate tensile
strength was 8.03, 2.47 and 2.47% in excess of the rainiraura
requireraent for the 24, 18 and 12 wire layers respectively;
165
2. Dapto to Springhill transraission line conductor sample, one
wire frora the 18 wire layer did not coraply with the rainiraura
ultiraate tensile strength and the raean ultiraate tensile
strength was 6.17, 8.02 and 6.17% in excess of the rainiraura
requireraents for the 24, 18 and 12 wire layers respectively;
3. Tomago to Taree transraission line conductor sample, fourteen
wires, three from the 18 wire layer and eleven frora the 12
wire layer did not coraply with the miniraum ultiraate tensile
strength (nine of the fourteen wires did not meet the
breaking load requirements) and the mean ultiraate tensile
strength was 0.606 and -3.64% of the minimura requirement for
the 18 and 12 wire layers respectively; and
4. Bellambi to Heathcote transmission line conductor saraple,
twenty six wires, fifteen from the 18 wire layer and eleven
wires frora the 12 wire layer did not comply with the rainiraura
ultimate tensile strength (all but two wires from the
aboveraentioned twenty six wires did not meet the minimura
breaking load requirement) and the raean ultimate tensile
strength was -5.63% of the rainimura requireraent for both the
18 and 12 wire layers.
Regarding the aluminium wire elongations, all the conductor
saraples complied with the rainiraura elongations for the.
166
1. Avon to Keraps Creek transmission line conductor sample, the
raean elongation was 54, 52 and 33% in excess of the rainimura
requirements for the 24, 18 and 12 wires layers respectively;
2. Dapto to Springhill transmission line conductor sample, the
mean elongation was 28, 30 and 23% in excess of the rainimura
requirements for the 24, 18 and 12 wire layers respectively;
3. Tomago to Taree transmission line conductor sample, the mean
elongation was 58 and 63% in excess of the miniraum
requireraents for the 18 and 12 wire layers respectively; and
4. Bellarabi to Heathcote transmission line conductor saraple the
elongation were not raeasured.
Regarding the steel wire elongations, all the conductor saraples
coraplied with the rainiraura elongations with the exception of the
core of the Toraago to Taree transmission line conductor sample.
For the,
1. Avon to Keraps Creek transmission line conductor saraple, the
raean elongation was 49 and 50% in excess of the minimum
requirements for the 6 wire layer and core respectively;
2. Dapto to Springhill transmission line conductor saraple, the
mean elongation was 49 and 45% in excess of the minimura
requireraents for the 6 wire layer and core respectively;

167
3. Toraago to Taree transraission line conductor sample, the mean
elongation was 61 and -9% of the rainiraura requireraents for the
6 wire layer and core respectively; and
4. Bellarabi to Heathcote transraission line conductor saraple, the
elongations were not measured.
3.4.1.3 Electrical Properties
The electrical properties of the alurainiura wire are assessed by
deterraining the resistivity. An accepted value for the
electrical resistivity of aluminium at 20 C is 0.028034 ym or
61.5% of the International Annealed Copper Standard (lACS). The
resistivity of copper at 20°C is 0.017241 urn for 100%
conductivity (2). The resistivity is determined by carrying
measureraents of raass and resistance for a known length.
Changes in the resistivity or conductivity may be caused by
changes in the cross sectional area and raaterial microstructure.
Annealing of the wires at elevated teraperatures can cause an
increase of conductivity as illustrated in Figures 3.8, 3.9 and
3.10 for alurainiura 1350 and alurainiura alloy 1120 and 6201
respectively (53). Saraples of conductor reraoved frora suspension
points may exhibit a decrease in conductivity caused by an
effective reduction in cross sectional area by fatigue initiated
cracks.
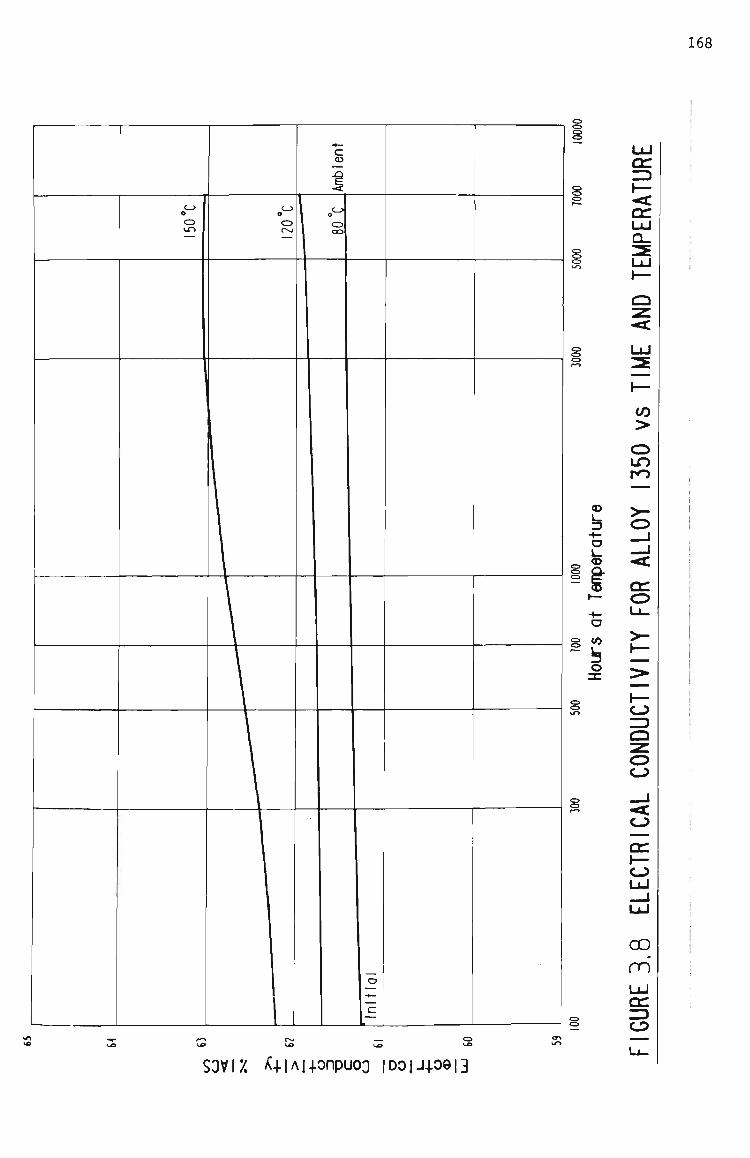
168
3,051
Am
bien
t
O O
Init
ial
s
s cr:
CD
- < :
CO >
CD UO
O
s y> ^ Is
o
C3d CD
CD
CD
CD CJ
CD
cr: h -CD LU
OO
rn
cc CD
SOVIX ^4.|Ai+onpuo3 |D0iJ4.09i3

169
o C3
o C3
O
O i i ->
o
LU cr: ~ ^ \— - < Qd LU Q_ '^ LU h—
CD "^ •<I
LU
H -
I -
<o >
CD CSi
—
ALLO
Y
QC CD
o § to
n o
CD
CD CD
CD
cr: I— CD
rn
OC
CD
SOVIX A+iA|4.onpuo3 ! D O I J + 0 9 | 3

170
3,051
e 1
O l
\
6 OO
\
1 Am
bien
t In
itia
l
OC
Od
CO >
CD Csi CO
CD
+-a
to
13 O
cn CD
CD
CD CD
CD
QC I— CD
CD
QC
CD
SOVIX ^-HAi+onpuoo | D O I J + 0 9 | 3

171
The details of the resistivity of the wires that constitute the
conductor samples frora the Avon to Keraps Creek, Dapto to
Springhill, Toraago to Taree and Bellarabi to Heathcote
transraission lines are given in Appendix 3.
All saraples of the conductor used for the electrical property
deterraination were taken frora areas away from the suspension
point. A suraraary of the findings of the wire resistivity are
given in Tables 3.10.
Regarding the aluminium wire resistivity for the,
1. Avon to Kemps Creek transmission line conductor sample
complied with the maxiraura resistivity criteria and the raean
resistivity was 1.3, 1.6 and 1.3% less than the rainiraura
requirement for the 24, 18 and 12 wire layers respectively;
2. Dapto to Springhill transraission line conductor saraple
complied with the maximura resistivity criteria with the
exception of two wires from the 24 wire layer. The mean
resistivity was 0, 0.9 and 1.3% less than the minimura
requirement for the 24, 18 and 12 wire layers respectively;
3. Toraago to Taree transraission line conductor saraple coraplied
with the maximura resistivity criteria and the mean
resistivity was 3.1% less than the minimum requirement for
both the 18 and 12 wire layers; and

172
Transmission Line
Avon-Kemps Creek
Dapto-Springhill
Tomago-Taree
Bellambi-Heathcote
Australian Standard
C75.1 1963
Norainal Wire Diaraeter
3.531
3.531
2.997
3.708
3.531 2.997 3.708
Mean Resistivity at 20°C ura
24 Wire Layer
0.0279
0.0283
-
-
18 12 Wire Wire Layer Layer
0.0278 0.0279
0.0280 0.0279
0.0274 0.0274
0.0288 0.0278
_
—
—
Maxiraura Resistivity
at 20°C
24 Wire Layer
0.0280
0.0286
-
-
18 12 Wire Wire Layer Layer
0.0279 0.0280
0.0281 0.0281
0.0276 0.0276
0.0288 0.0279
0.028264 0.028264 0.028264
TABLE 3.10 - SUMMARY OF ALUMINIUM WIRE TEST RESULTS RESISTIVITY
* Two saraples frora the 18 wire layer and two saraples frora the 12 wire layer were measured.

173
4. Bellambi to Heathcote transraission line conductor saraple, all
the wires from the 12 wire layer coraplied with the raaximura
resistivity criteria. The mean resistivity for the 12 wire
layer was 1.64% less than the rainiraura requireraent. The
average resistivity of the 18 wire layer was 1.90% in excess
of the rainiraura requireraent and subsequent chemical test
revealed an average of 0.174% silicon component in the
alurainium. This is in excess of the maximura silicon
component at 0.100% and accounts for the higher than normal
resistivity. High silicon components is consistent with the
hot rolled production process probably used to manufacturer
this conductor.
3.4.1.4 Steel Wire Galvanising Properties
The steel wire galvanising properties are assessed by determining
the raass of the zinc coating and the adherence quality.
The raass of the zinc coating is determined by measuring the mass
of a wire specimen. The zinc coating is then cheraically reraoved
and a further raeasureraent of raass as well as diaraeter is carried
out. From these raeasureraents the mass per metre of zinc coating
may be determined.
Changes in the galvanising raass may be caused by the zinc being
sacrificial to the aluminium under certain circurastances and/or
abrasion of the zinc caused by the raoveraent of strands over the
galvanised wire surface. Poor adhesion of the zinc to the parent
steel wire is another likely cause of degradation of the zinc
174
coating raass. An exaraple of this poor adhesion is illustrated in
Plate 3.11. Poor adhesion is assessed by traditional wrap tests.
Forrest and Ward (39) published results of the loss of zinc
coating mass of 30/7 ACSR/GZ construction for various
environments for transmission lines being 16 to 20 years old.
Whilst it is appreciated that extrapolation beyond this age range
can lead to significant errors in predicted results particularly
in view of the large scatter in the data, linear regression of
the date suggests that after 42 years of service 25% of the zinc
coating raay be lost. The test results and the linear regression
line are given in Figure 3.12.
This corapares favourable with Occassione, Brit ton and Collins
(65) results for 7/1 ACSR/GZ construction which suggests that
after 20 years exposure to various environraents no evidence of
rust initiation had occurred.
As part of these studies further investigations suggest a greater
loss of zinc coating raass occurs at the suspension clarap site
compared with that of a site away frora the suspension site
(norainally terraed the raidspan site). This is probably caused by
the constrained movement of the alurainiura wires over the
galvanised wire surface causing an abrasion and subsequent loss
of the zinc. Linear regression of the test results of 27 year
old 30/7/2.99 rara ACSR/GZ construction is given in Figure 3.13
illustrates this effect.
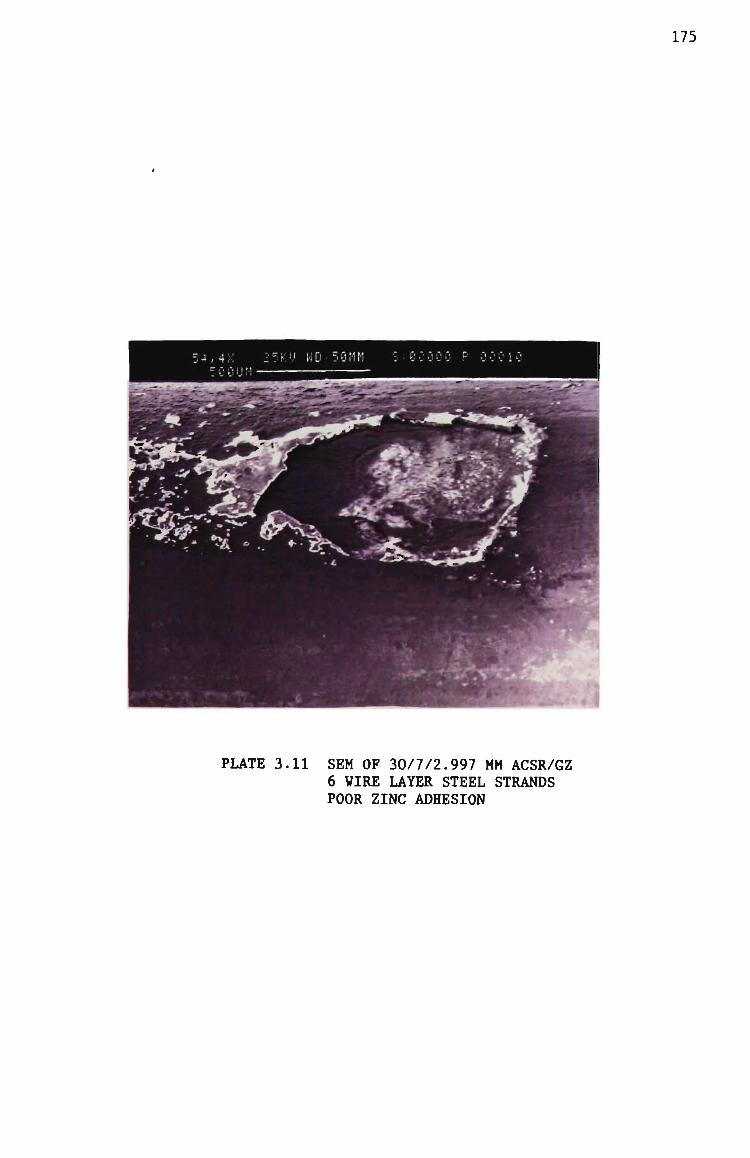
175
PLATE 3.11 SEM OF 20/1/1.991 MM ACSR/GZ 6 WIRE LAYER STEEL STRANDS POOR ZINC ADHESION

17o
cr o h-CJ Z2 Q
Q U
N CD \ . Q:
o <i:
cr o IL
CD
<i o o CD
z »—I
cn •-H
<r 3 -J
a: LL
o
h -CE Q <l Cd CD LLl Q
CT)
LU
cr Z] CD I—«
LL
CVJ a a
o LO
( ) SSDW 6U I 4.DO3 OUiSIUDAIDQ

177
-
-
1 S
ite
§ a
01 +• 0)
c o
c a; w a
— D
a o
Ol
CD
2 I II
S I
W
C3) o
CU I
Q
O 00
ftMn aofto! •
CO w C D (U
(U
£ o •— ^ I -
I I
n
1'
o CU
o o LO o
LO
C^) ssDW 6UJ4.D03 e u i s m D A i D Q
IM CD
Q: cn u <r 2: C5 O
CT)
X CT)
Q : o LL CD
z f-<E O U CD
cn z <r -J <i:
CD
LL
o
<r a cr CD LU Q CO
CO
LU Od Z3 CD t—t Li.
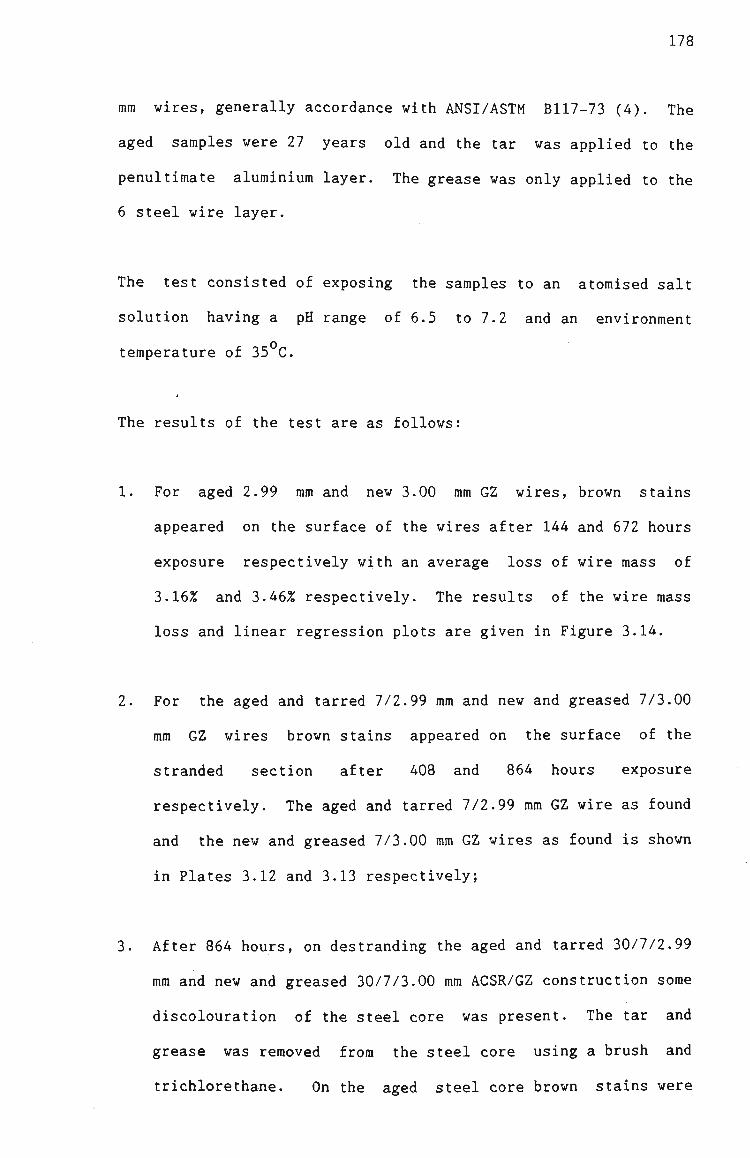
178
mra wires, generally accordance with ANSI/ASTM B117-73 (4). The
aged samples were 27 years old and the tar was applied to the
penultiraate alurainiura layer. The grease was only applied to the
6 steel wire layer.
The test consisted of exposing the saraples to an atoraised salt
solution having a pH range of 6.5 to 7.2 and an environraent
teraperature of 35°C.
The results of the test are as follows:
1. For aged 2.99 ram and new 3.00 rara GZ wires, brown stains
appeared on the surface of the wires after 144 and 672 hours
exposure respectively with an average loss of wire raass of
3.16% and 3.46% respectively. The results of the wire raass
loss and linear regression plots are given in Figure 3.14.
2. For the aged and tarred 7/2.99 rara and new and greased 7/3.00
rara GZ wires brown stains appeared on the surface of the
stranded section after 408 and 864 hours exposure
respectively. The aged and tarred 7/2.99 rara GZ wire as found
and the new and greased 7/3.00 rara GZ wires as found is shown
in Plates 3.12 and 3.13 respectively;
3. After 864 hours, on destranding the aged and tarred 30/7/2.99
rara and new and greased 30/7/3.00 mm ACSR/GZ construction sorae
discolouration of the steel core was present. The tar and
grease was removed frora the steel core using a brush and
trichlorethane. On the aged steel core brown stains were
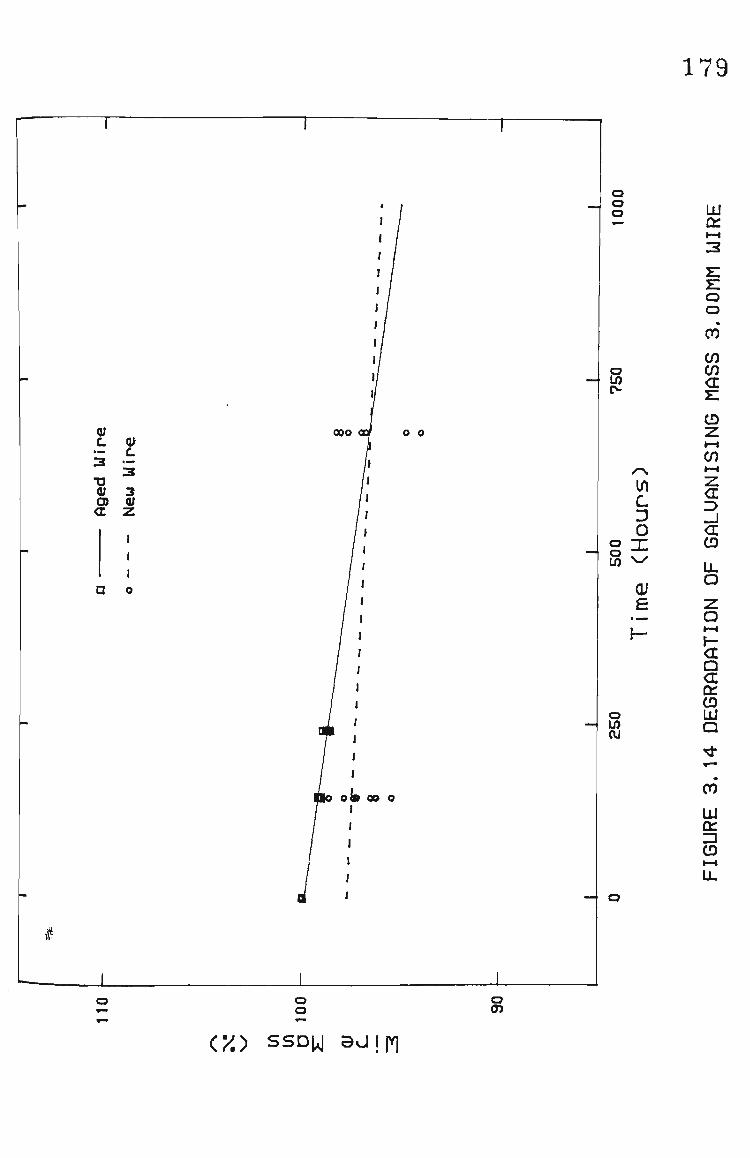
179
o o o LU
cr
o 10
o o CO
cn cn a
Qi L
•— 3
"O Q; 13) < C
(U L
<_ 3
3 <U N
ooo O 0
o o 10
in c o X
£
I -
o LO OJ
CD
cn
a D - J <L CD LL O
Z o I—I t -<E Q cr CD LU
a
00 o en
LU
cr CD *-i LL
— o
o a
o
(^i) SSDW BJJIY]
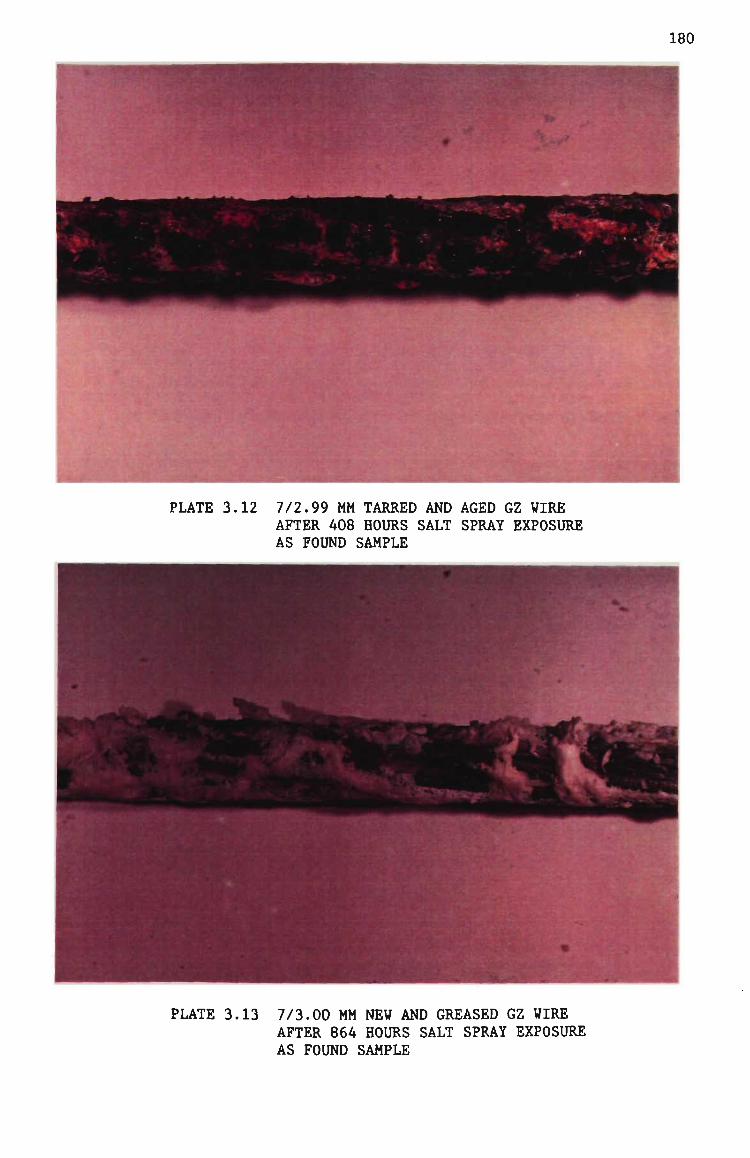
180
PLATE 3.12 7/2.99 MM TARRED AND AGED GZ WIRE AFTER 408 HOURS SALT SPRAY EXPOSURE AS FOUND SAMPLE
PLATE 3.13 7/3.00 MM NEW AND GREASED GZ WIRE AFTER 864 HOURS SALT SPRAY EXPOSURE AS FOUND SAMPLE
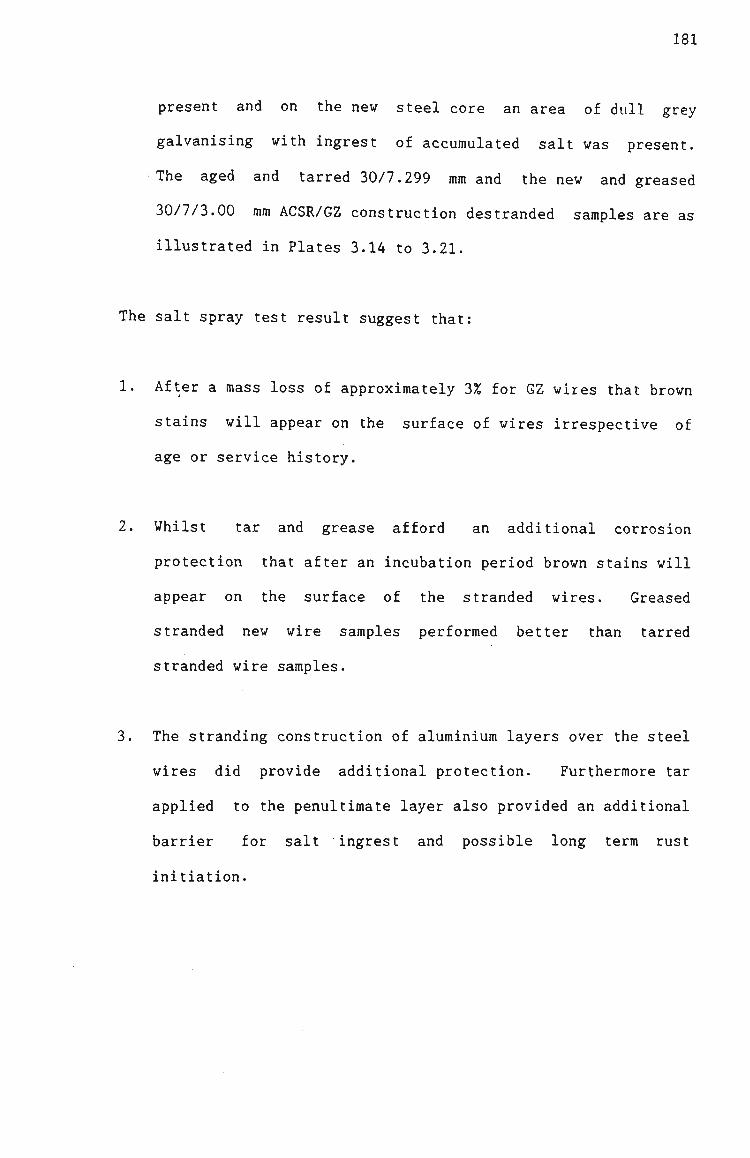
181
present and on the new steel core an area of dull grey
galvanising with ingrest of accumulated salt was present.
The aged and tarred 30/7.299 mm and the new and greased
30/7/3.00 rara ACSR/GZ construction destranded samples are as
illustrated in Plates 3.14 to 3.21.
The salt spray test result suggest that:
1. After a mass loss of approxiraately 3% for GZ wires that brown
stains will appear on the surface of wires irrespective of
age or service history.
2. Whilst tar and grease afford an additional corrosion
protection that after an incubation period brown stains will
appear on the surface of the stranded wires. Greased
stranded new wire samples performed better than tarred
stranded wire samples.
3. The stranding construction of alurainiura layers over the steel
wires did provide additional protection. Furtherraore tar
applied to the penultiraate layer also provided an additional
barrier for salt ingrest and possible long term rust
initiation.

182
PLATE 3.14 30/7/2.99 MM ACSR/GZ 18 WIRE LAYER AGED AND TARRED SAMPLE AFTER 864 HOURS SALT SPRAY EXPOSURE
PLATE 3.15 30/7/3.00 MM ACSR/GZ 18 WIRE LAYER NEW AND GREASES SAMPLE AFTER 864 HOURS SALT SPRAY EXPOSURE

183
- • ' ^ . J
aFjTi'i^fifr"
• i .
^ ' * ' " * • • • ' • " < - .
S&
— - - -
__«.fc«,.^.j >. . .<«»- ' ;^i^^^^^H
•|^^©MSJ»«^SBi=
K i
,
^ ^ ^ ^ ^ ^ - ^
.- ?». '!«^' |H^H^|
PLATE 3 . 1 6 3 0 / 7 / 2 . 9 9 MM ACSR/GZ 6 WIRE LAYER AGED AND TARRED SAMPLE AFTER 864 HOURS SALT SPRAY EXPOSURE
PLATE 3 . 1 7 3 0 / 7 / 3 . 0 0 MM ACSR/GZ 6 WIRE LAYER NEW AND GREASED SAMPLE AFTER 864 HOURS SALT SPRAY EXPOSURE
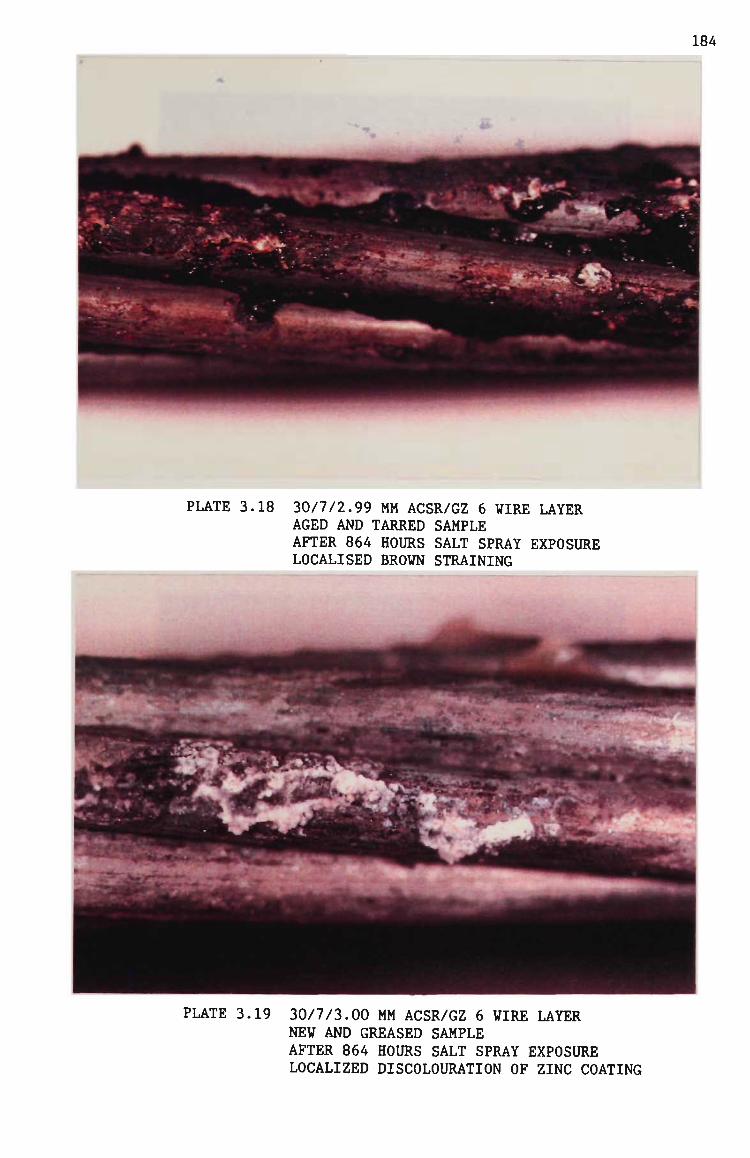
184
PLATE 3.18 30/7/2.99 MM ACSR/GZ 6 WIRE LAYER AGED AND TARRED SAMPLE AFTER 864 HOURS SALT SPRAY EXPOSURE LOCALISED BROWN STRAINING
PLATE 3.19 30/7/3.00 MM ACSR/GZ 6 WIRE LAYER NEW AND GREASED SAMPLE AFTER 864 HOURS SALT SPRAY EXPOSURE LOCALIZED DISCOLOURATION OF ZINC COATING

185
PLATE 3.20 30/7/2.99 MM ACSR/GZ 6 WIRE LAYER AGED AND TARRED SAMPLE AFTER 864 HOURS SALT SPRAY EXPOSURE CROSS SECTION SHOWING LOCALISED LOSS OF ZINC COATING
PLATE 3.21 30/7/3.00 MM ACSR/GZ 6 WIRE LAYER NEW AND GREASED SAMPLE AFTER 864 HOURS SALT SPRAY EXPOSURE CROSS SECTION SHOWING LOCALISED LOSS OF ZINC COATING

186
The detailed zinc coating raass and wrap test results of the wires
that constitute the conductor saraples frora the Avon to Keraps
Creek, Dapto to Springhill, Toraago to Taree and Bellarabi to
Heathcote transraission lines are given in Appendix 3. All wire
saraples except that of the Bellarabi to Heathcote transmission
line were taken frora a suspension site.
The rainiraura requireraent for the zinc coating raass given in AS
-2 -2
C75.1 - 1963 is 240 g.m and 260 g.m for norainal diameter of
coated wires in the range of 2.85 - 3.61 mm and 3.62 - 3.86 mm
respectively. The rainimura wrap test requirements is 6 wraps.
Regarding the test results for the,
1. Avon to Keraps Creek transraission line conductor saraple
coraplied with the rainiraura requirement criteria and the mean
zinc coating raass was 50.2 and 51.1% in excess of the rainimura
requirements for the 6 wire layer and core respectively;
2. Dapto to Springhill transraission line conductor saraple
coraplied with the rainiraura requireraent criteria and the raean
zinc coating raass was 69 and 60% in excess of the rainiraura
requireraents for the 6 wire layer and core respectively;
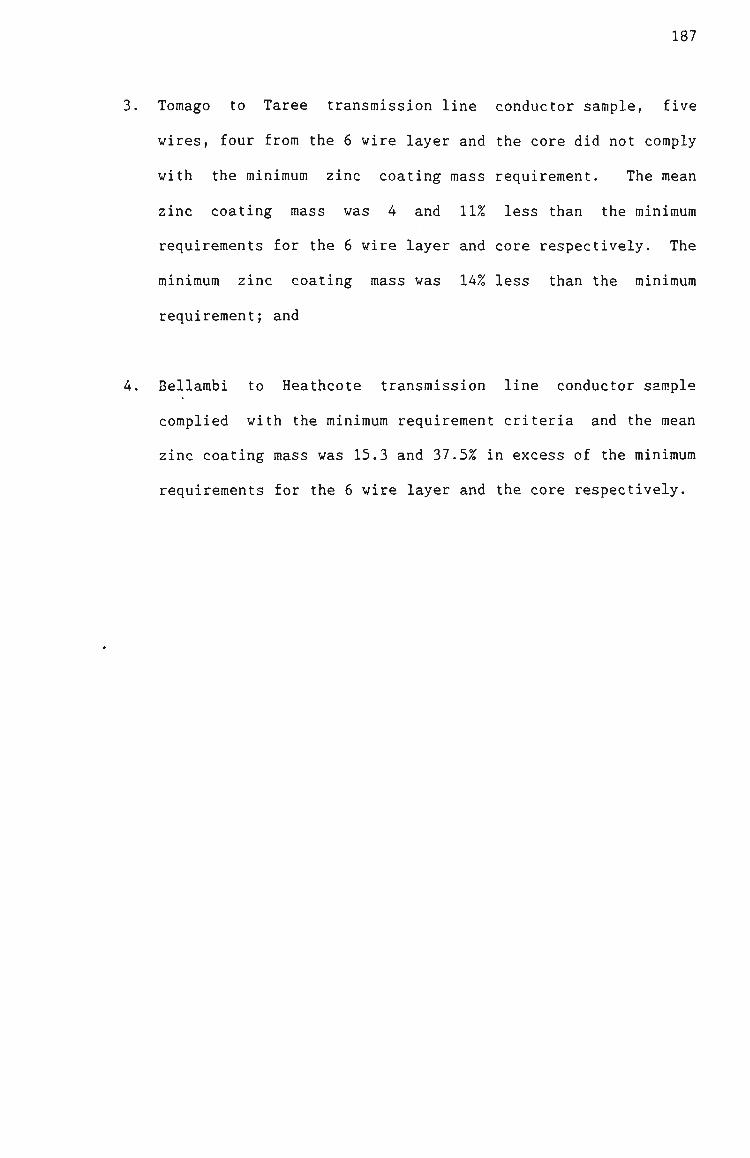
187
3. Toraago to Taree transraission line conductor sample, five
wires, four frora the 6 wire layer and the core did not coraply
with the rainimura zinc coating raass requirement. The mean
zinc coating raass was 4 and 11% less than the minimum
requirements for the 6 wire layer and core respectively. The
minimum zinc coating mass was 14% less than the rainiraura
requireraent; and
4. Bellarabi to Heathcote transraission line conductor sara.ple
coraplied with the miniraum requireraent criteria and the mean
zinc coating mass was 15.3 and 37.5% in excess of the rainiraura
requirements for the 6 wire layer and the core respectively.

188
3.4.2 Conductor Tests
The mechanical behavour of a conductor differs considerably frora
that of a wire because of the stranding factors of lay length,
lay angle and diaraeter of lay. Individual wire tests on
destranded conductors provide valuable information on the
mechanical and electrical performance of the components of the
conductor, however this inforraation needs to be translated into
an overall conductor perforraance.
In the past conductor data used to design transmission lines was
generally theoretically deterrained and on sorae occassions
confirmed by actual tests. In raore recent tiraes, as a result of
supply authorities operating conductors at the excursions of the
known electrical and mechanical parameters, a greater
understanding of the overall conductor performance hais been
demanded.
In the case of aged transmission line conductors, actual
conductor tests provide a complete picture of the continued
serviceability of conductors. Several examples are discussed to
show cause for the need of conductor tests.
Reviewing the wire breaking load test results, it is difficult to
conclude the effect of an individual or several wires having low
tensile strengths to the overall degradation of the strength of
the conductor. In the past the breaking load of a conductor has
been deterrained by in the case of an ACSR as 98% of the sum of
the strengths of the aluminium wires plus 85% of the sura of

189
strength of the steel wires. The calculated breaking load may
comply with the minimum criteria with many low strength wires
offset with an equivalent nuraber of high strength wires. In an
actual breaking load test, the conductor may not reach the the
calculated breaking load because of the premature failure of sorae
of the low strength wires. In this case, clearly a breaking load
test provides additional information on the overall performance
of the conductor and the effects of low strength wires.
Furtherraore, wire tests do not provide inforraation on the
permanent elongation of the conductor with regard to aged
transraission line conductors. In other words has the alurainiura
wires perraanently elongated over the steel in an ACSR
construction to such to such an extent that alurainium wires no
longer support their proportional share of the conductor stress.
Tests carried out on new or aged conductors are normally
restricted to mechanical tests such as stress-strain, coefficient
of linear expansion, creep, breaking load and lay length.
Testing equipraent to deterraine actual DC and AC resistance is
expensive, and sorae doubt is raised to the accuracy of such
raeasureraents. In addition it is questioned whether any
degradation of the conductor can be assessed by the DC and AC
resistance measurements. Consequently electrical tests on
conductors were not carried as part of these studies.

190
Conductor saraples used for the tests are approxiraately 14 ra in
length and terminated using special designed epoxy resin
terrainations. In preparation of the conductor for termination,
the conductor is clamped at several locations at the test length
end. The conductor is carefully destranded and the individual
strands are cleaned to remove any dirt, grease and wire drawing
lubricants. The conductor is then restranded and fitted with a
steel sleeve. In the case of an ACSR construction, an additional
steel sleeve compression fitting is applied to the steel core.
The termination is completed by bonding the conductor to the
steel sleeve using epoxy resin.
3.4.2.1 Stress Strain
The basic data of the raechanical properties of a conductor are
obtained frora a stress strain test in which a prepared conductor
saraple is subjected to an increasing axial load to 30% of the
calculated breaking load after which the load is held constant
for 30 minutes. The load is then gradually released until
approxiraately 2% of the calculated breaking load is reached. The
axial load is immediately reapplied gradually to the conductor
sample until 50% of the calculated breaking load is reached and
again the load is held constant for 30 rainutes. The load is
further gradually released until approximately 2% of the
calculated breaking load is reached. The procedure is repeated a
third time until 70% of the calculated breaking load is reached
and the load is held constant for 1 hour. At the corapletion of
this hold period the load is gradually released to zero.

191
In an ACSR construction the test procedure is repeated on a steel
core saraple to allow coraputation of the distribution of the loads
in the steel core and alurainiura.
The stress strain test is performed at ambient temperature and
the conductor temperature differential over the gauge length is
minimised by immersion of the conductor sample in a bath
containing re-circulating oil. During the coarse of the test,
measureraents of conductor extension, conductor load and
temperature are carried out.
Typical raw data plots for a coraposite 30/7/2.50 mm ACSR/GZ/1120
and a steel core 30/7/2.50 ram ACSR/GZ/1120 are given in Figures
3.15 and 3.16 respectively.
A zero correction of the raw data, to account for any wire slack
or looseness in the wires during the sample preparation, is
deterrained by choosing a line of best fit for the initial loading
curve to 30% of the calculated breaking load. Linear regression
is used to determine the line of best fit and the slope of the
line for the coraposite and the weighted steel core is defined as
ci and ™ si, respectively. Using epoxy resin termination the
zero correction is normally sraall and generally does not exceed
150 mra.kra" . Alurainiura compression fitting which if fitted to
a short test length of conductor may extrude considerable
aluminium into the test length and increase the slack component.
For short test lengths aluminium compression fittings should not
be used.
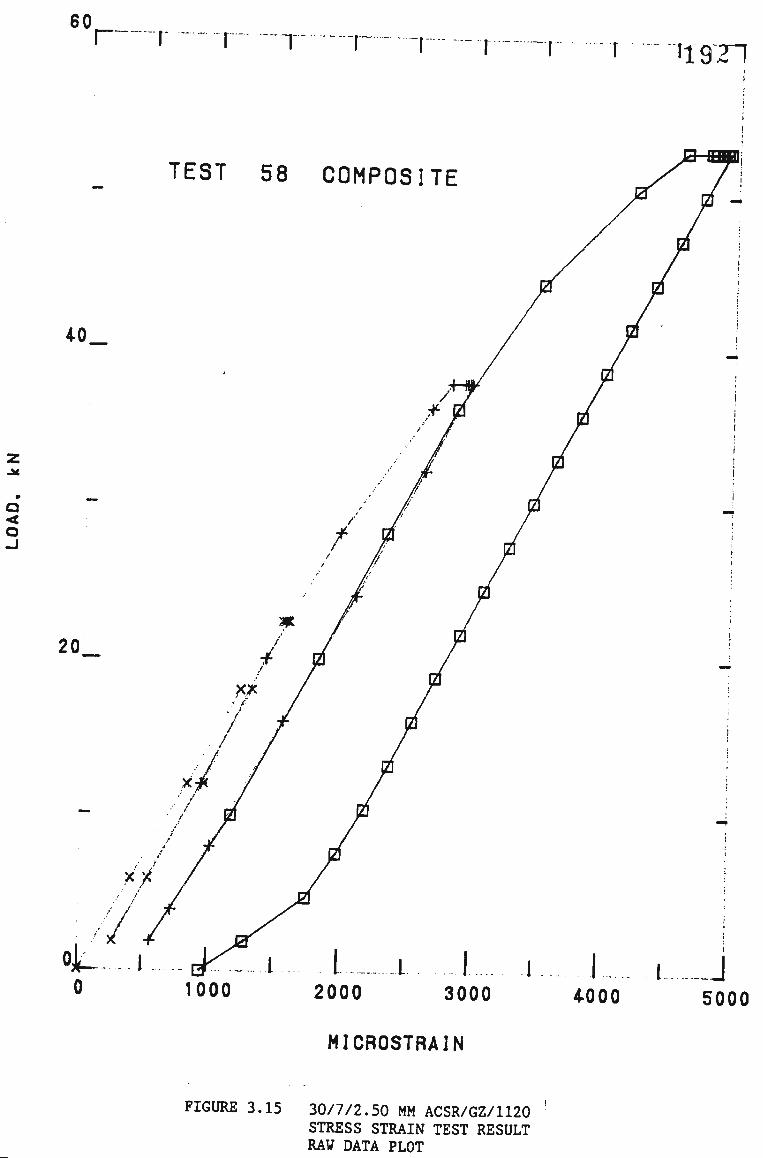
60. r- T r I19J1
TEST 58 COMPOSITE
4-0.
20
0
MICROSTRAIN
FIGURE 3.15 30/7/2.50 MM ACSR/GZ/1120 STRESS STRAIN TEST RESULT RAW DATA PLOT
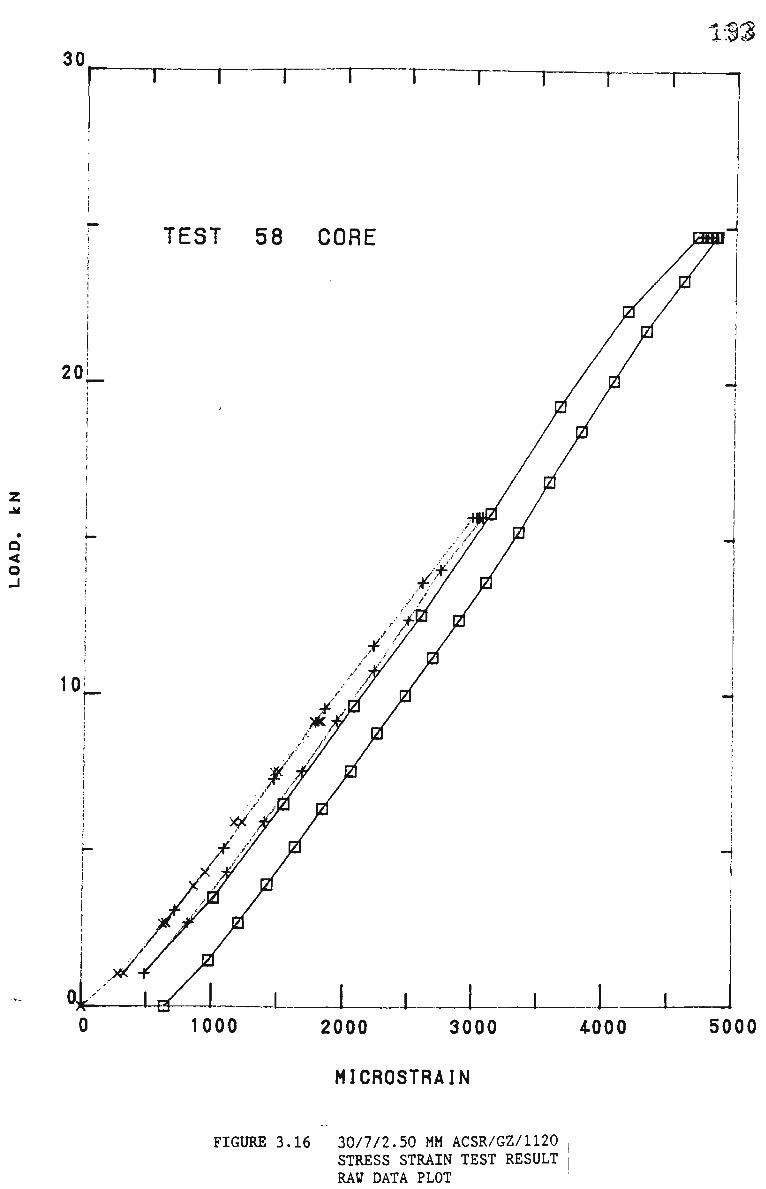
30 1S3
TEST 58 CORE
1000 2000 3000 4.000
MICROSTRAIN
FIGURE 3.16 30/7/2.50 MM ACSR/GZ/1120 STRESS STRAIN TEST RESULT RAW DATA PLOT

194
For zero corrected plots the initial 30% loading curve commence
at the origin of zero load and zero elongation. All data points
are corrected by the amount of the zero correction. Zero
corrected plots are illustrated in Figure 3.17 and 3.18 for a
coraposite 30/7/2.50 mm ACSR/GZ/1120 and a steel core 30/7/2.50
ACSR/GZ/1120 respectively. The zero correction is 7.06 and
95.8 mra.kra" respectively.
The master stress strain curves are derived from the zero
corrected plots and for the 30/7/2.50 mra ACSR/GZ/1120
construction at the given test teraperature are illustrated in
Figure 3.19. The curves of three loops are, one for the
coraposite construction, one for the steel core and a derived loop
for the alurainiura coraponent. The ordinate of the composite loop
is derived by dividing the load points by the total area of
conductor. The ordinates of the alurainiura and steel loops are
weighted by the ratios of the respective areas to the composite
areas, or raatheraatically A /A and A /A respectively. ' •' a c s c " ^
The initial raodulus curve of the coraposite construction is
derived using a method of least squares applied to the three data
points from the end of each hold period. The least squares
solution provides an nth order polynorainal equations given as,
2 3 4 ye = AQ + A^S + A^S + A^S + A^S + etc (3.1)

60 195
TEST 58 COMPOSITE
1000 2000 3000 4.000 5000
MICROSTRAIN
FIGURE 3.17 30/7/2.50 MM ACSR/GZ/1120 STRESS STRAIN TEST RESULT ZERO CORRECTED PLOT

198 30.
Q < O u
TEST 58 CORE
1000 2000 3000 4-000 5000
MICROSTRAIN
FIGURE 3.18 30/7/2.50 MM ACSR/GZ/1120 STRESS STRAIN TEST RESULT ZERO CORRECTED PLOT
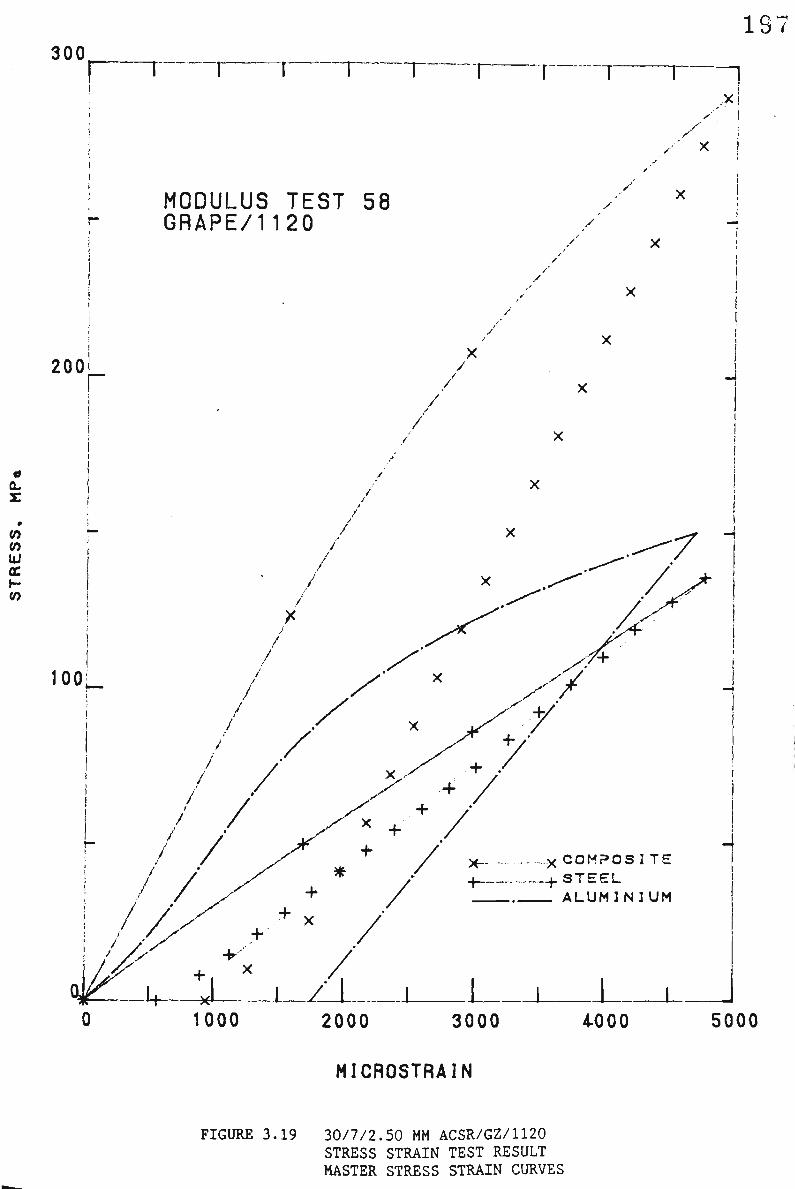
300 197
.X i
./ X
200L
100
MODULUS TEST 58 GRAPE/1120
/
/
X COMPOSITE -4. STEEL _ ALUMINIUM
1000 2000 3000 4-000 5000
MICROSTRAIN
FIGURE 3.19 30/7/2.50 MM ACSR/GZ/1120 STRESS STRAIN TEST RESULT MASTER STRESS STRAIN CURVES

198
A is general very sraall and can be ignored. Usually a 3rd order
polynominal describes the data adequately, however in sorae cases
other orders raay be more appropriate. Sirailar polynorainals are
derived for the initial curves of the steel core and the
alurainiura.
The final raodulus of the conductor is the slope of the regression
line fitted to unloading curve from the final hold point at 70%
of calculated breaking load to the slope transition point. The
slope of the coraposite final modulus is designated E r. The
slope of the final raodulus for the alurainiura curve raay be
expressed in terras of raaterial raodulus, E ^ or the reduced final
modular mE r. Similarly, the slope of the final raodulus for the
steel curve raay be expressed in terras of raaterial modulus, E ,; or
the reduced final raodulus, mE r. SI
In the past the final raodulus of elasticity of the coraposite
conductor has been theoretically deterrained knowing the weighted
ratios of the alurainiura and steel components to the composite
conductor and the material raodulus of alurainium and steel.
Considering a change in elongation from x = x, to x = X2 where x,
and Xp are both greater than the transition microstrain (i.e. the
linear part of the final curves) and at constant temperature the
change in stress is given as.
S = raE (x„ - x^) (3.2)
\ = "\ (2 - 1> ^ • >
\ = \ t < 2 - 1) ^ - ^
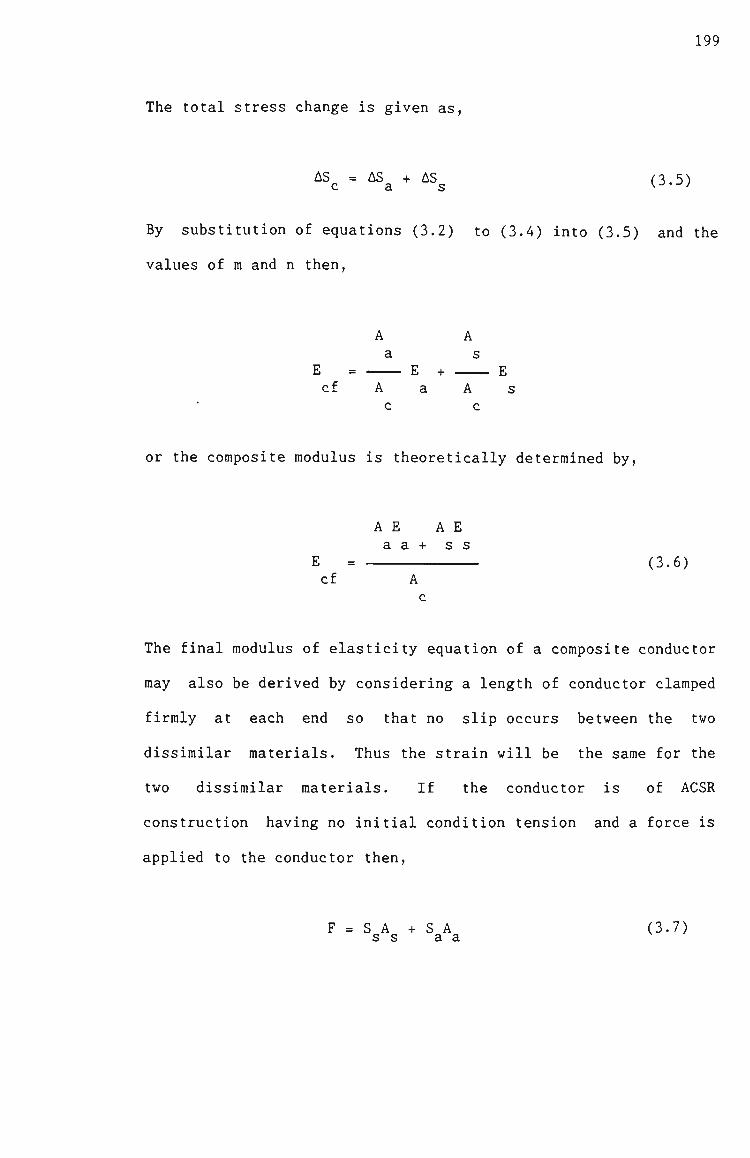
199
The total stress change is given as,
AS = AS + AS (3.5) c a t : \->'-' / c a s
By substitution of equations (3.2) to (3.4) into (3.5) and the
values of ra and n then,
A A a s
E = E + E cf A a A s
c c
or the composite modulus is theoretically deterrained by.
A E A E a a + s s
E = (3.6) cf A
c
The final raodulus of elasticity equation of a composite conductor
raay also be derived by considering a length of conductor claraped
firraly at each end so that no slip occurs between the two
dissirailar raaterials. Thus the strain will be the sarae for the
two dissirailar raaterials. If the conductor is of ACSR
construction having no initial condition tension and a force is
applied to the conductor then,
F = S A + S A (3.7) s s a a

200
The average stress is given as.
av A + A s a
(3.8)
and the strain is given as.
S S s a
e = = (3.9) E E s a
The raodulus of e l a s t i c i t y of the coraposite construction i s
defined as ,
E^j = Fe (3.10)
and by substitution of equations (3.7), (3.8) and (3.9) into
(3.10)
A E A E a a + s s
E = (3.11) cf A
c
Equation (3.11) is identical to that of equation (3.6). In both
these derivations the critical factor is that of the slope of the
final raodulus curves (i.e. mEs and nEa), the assuraption that no
slip occurs between the dissirailar materials and the wires are
straight.

201
In raore recent times Nigol and Barrett (62) discovered that the
stress and strains in a helically stranded alurainiura wires of a
conductor were not the same as those of the individual straight
wires. By examining the wire geometry of a helically stranded
wire, Nigol and Barrett derived an equation for the conductor
strain e related to the wire Sj. and to the change of layer radius
R by,
e = X
3X 3X AL + AR
9L 8R
1 2 AR s - tan c
2 1 R cos a
(3.12)
Equation (3.12) consists of two parts, the therraal, elastic and
plastic strain and the axial elongation of the layer as a result
of a decreasing layer radius. By substitution of the uniaxial
stress equation into equation (3.12) the true raodulus of the wire
raaterial the layer raodulus in the axial direction was derived and
is given as,
1
E axial
1
E X
1
3 c o s ff
E + w
2 tan a
R
r -AR
. s (3.13)

202
Thus the total layer modulus in the axial direction was defined
as,
where.
N helical radial
(3.14)
E, , . T = E cos 9 helical w n
(3.15)
radial n
^ 2 tan o n
-AR n
(3.16)
In terms of the layer i and the material j, the lay angle is given as.
tanff. =
2iir. 1
L.D. 1 1
(3.17)
the wire l a y e r raodulus of e l a s t i c i t y i s given a s .
E . . = E . . cos 9. i j w i j 1
(3 .18)
and the coraposite raodulus i s given a s ,
^cf
N. E A + E
s s . -1=1
Z ( n . . A . . E . . ) ] i = l ^J ^J ^J J
(3 .19)
Equations (3.17), (3.18) and (3.19) have been recently adopted by
Australian Standards for inclusion into revision of AS1220 -
1973(7).

203
The next item of interest in the master stress strain curve of an
ACSR construction is the critical tension/stress load defined as
the point of the final modulus coraposite conductor curve where
the slope of the curve changes frora E ^ to that of raE . In
cf sf
other words, the point where the alurainiura because of perraanent
elongation does not support its share of the total conductor
stresses during further unloading. The critical tension/stress
load is deterrained by linear regression of the data points above
the transition point and linear regression of data points below
the transition point. Data points iraraediately adjacent the
transition are discounted. Frora the linear regression equations
the intercept of critical tension/stress and strain are
deterrained.
Of particular interest is the change in the critical
tension/stress load with a change in teraperature. Jordon (54)
derived a linear equation that related in increasing critical
tension/stress with an increasing temperature and is given by,
E r S. = S ^ ^ S + mE a AT (3.20) kt CO „ ao s s
nE a
This deviation is based on the final modulus of elasticity
previously derived and given in equations (3.6) and (3.11).
Figure 3.20 illustrates the linear relationship of transition
tension and conductor temperature for a 54/7/3.53 + 1/3.71 rara
ACSR/GZ construction. Everyday tension for this conductor is
approxiraately 32 kN. As the conductor temperature increases for
a given span length the tension will decrease as determined by
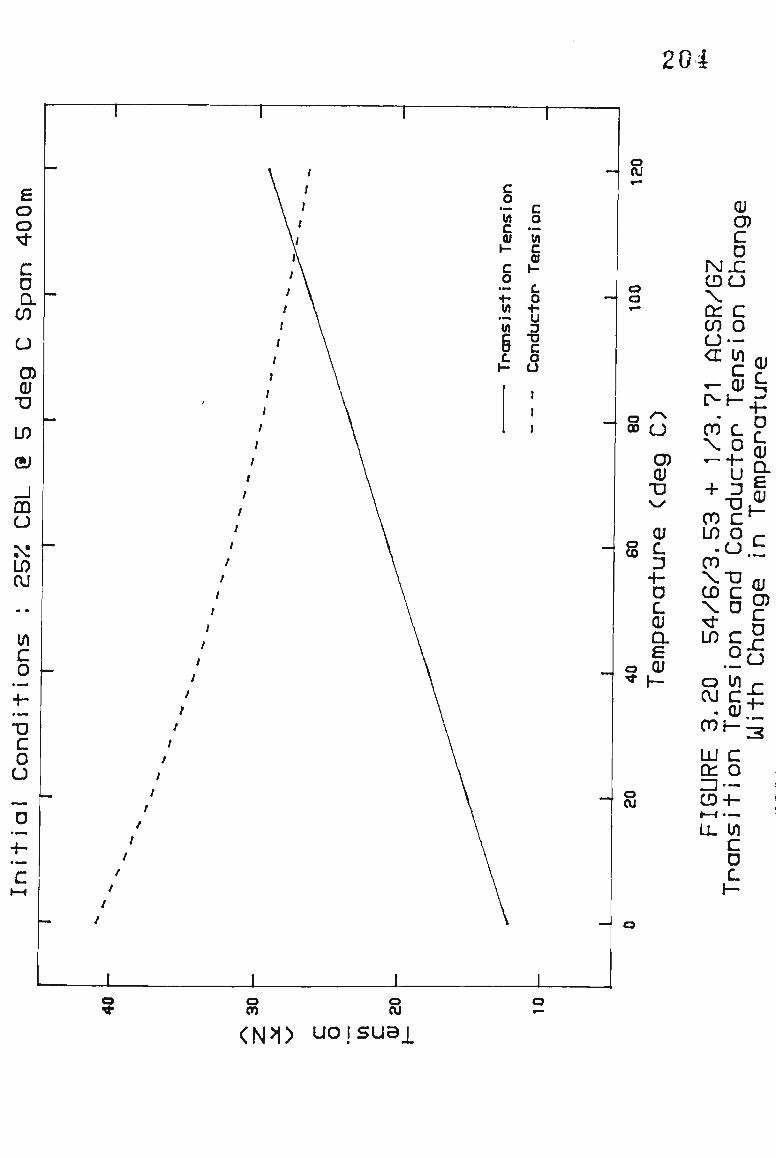
204
£ o o
C o a CO
o O) (U
•D
m
CJ ^^ if) (U in c 0
-h
•D C o u
0
+-c
— /
o
c o .-" M c (U
1 -
c o ••-• H U)
(A
§ c H
c o •-• M c 01
H
c o +-u 3
c o u t I I
o a
CD CJ
O) Q)
• D
s CU
c +-D C. (U a £
o Q)
o CU
m a (U
CU CD C 0
IM_C CDO X C/7 CJ <r
c o Ul
c r- (U
X o ^+-
u + D
u OQ C U) O
- U CT) X - D CD C X D
CU
c 4 -D C CU a £ CU
\1- c o
CU
c D
u O Ul ,
- CU.1 cnh--; LU c Q: O
CD-f-
LL W c o c
<N>J) UOjSUBl

205
equations given in Figures 2.5 or 2.6. This change in conductor
tension with temperature is illustrated in Figure 3.20. An
interesting phenomena occurs when the two curves intersect at
107 C. This phenomena was reported by Nigol Barrett (62) known
as the birdcaging teraperature is, when above this teraperature the
conductor expands at the rate of the steel core. With increasing
tensions the birdcaging teraperature will increase because
additional therraal expansion is required in the alurainiura before
the load is transferred wholly to the steel core. Nigol and
Barrett (62) derived an equation for the birdcaging stress and is
given as.
mE E c s a
""IT cf
S —H£ (a - a ) A T - ( C - C ) ^ a s' ^ a s' raS so
(3.21)
The last itera of interest of the raaster stress strain curve is
the ability to deterraine the coefficient of linear expansion of
the steel core in an ACSR construction. The equation was derived
by Jordon (54) and is given by,
^cf a = Ur (3.22) ^ ^^ E r + nE cf a
The detailed conductor stress strain test results and data for
the saraples frora the Avon to Keraps Creek, Dapto to Springhill and
Tomago to Taree transraission lines are given in Appendix 3. A
suramary of the findings of the stress strain tests are given in
Tables 3.11 and 3.12 respectively.
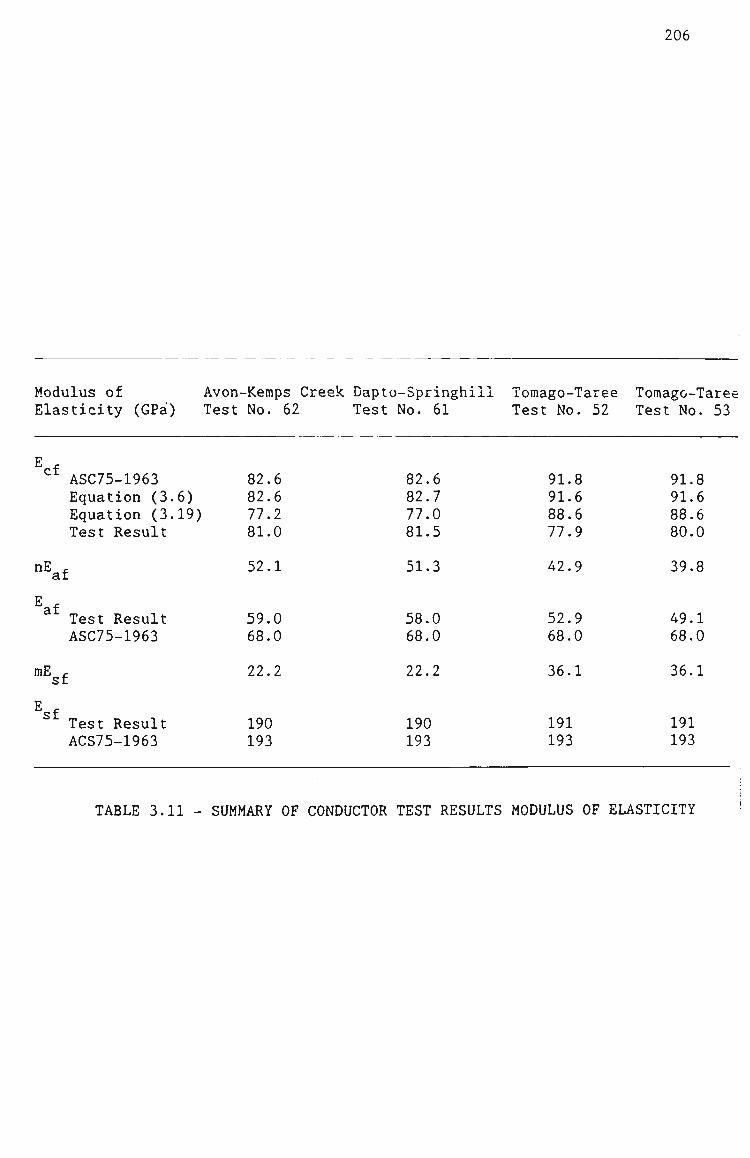
206
Modulus of Avon-Keraps Creek Dapto-Springhill Toraago-Taree Toraago-Taree Elasticity (GPa) Test No. 62 Test No. 61 Test No. 52 Test No. 53
cf ASC75-1963 82.6 Equation (3.6) 82.6 Equation (3.19) 77.2 Test Result 81.0
82.6 82.7 77.0 81.5
91.8 91.6 88.6 77.9
91.8 91.6 88.6 80.0
nE af 52.1 51.3 42.9 39.8
af Test Result ASC75-1963
59.0 68.0
58.0 68.0
52.9 68.0
49.1 68.0
mE sf 22.2 22.2 36.1 36.1
sf Test Result ACS75-1963
190 193
190 193
191 193
191 193
TABLE 3.11 - SUMMARY OF CONDUCTOR TEST RESULTS MODULUS OF ELASTICITY

207
I n i t i a l Modulus Curve Polynominal
Coe f f i c i en t -
Avon-Keraps Creek Test No. 62
Da p to -Sp r ingh i l l Test No. 61
Toraago-Taree Tomago-Taree Test No. 52 Test No. 53
Coraposite
S tee l
Alurainium
0.161x10 -0.564x10 0.384x10
0.524x10 -0.265x10 0.250x10
0.302x10 -0.420x10 0.390x10
-4
-9
-4 -6 -8
-6 -6 -8
0.180x10 -0.689x10 0.395x10
0.489x10 -0.198x10 0.244x10
0.317x10 0.345x10 0.302x10
-4 -7 -9
-4 -6 -8
-4 -6 -8
0.224x10 -0.789x10 0.274x10
0.391x10 -0.196x10 0.998x10
0.558x10 -0.689x10 0.652x10
-4 -7 -9
-4 -6 -9
-4 -6 -8
0.232x10 -0.819x10 0.294x10
0.315x10 -0.115x10 0.727x10
0.810x10 -0.118x10 0.110x10
-4 -7 -9
-6 -9
-4 -5 -7
Critical Point
Tension (kN) Strain (rara/kra) % CBL
19.6 1430 12.3
15.4 1480
9.6
18.1 2500 20.1
19.2 2570 21.3
TABLE 3.12 - SUMMARY OF CONDUCTOR TEST RESULTS STRESS STRAIN
208
The final composite raodulus of elasticity for the conductor
saraples frora the Avon to Kemps Creek and Dapto to Springhill
transmission lines is in good agreeraent with that of AS C75 1963
and equations (3.6) and (3.19). The Tomago to Taree transmission
line conductor samples test results, suggests a change of an
instrinsic property of raodulus of the conductor. Unfortunately
when the conductor sample was reraoved from service no precautions
were taken to prevent relative wire movements. This wire
movement is confirmed by the critical tension/stress as a
percentage of calculated breaking load being as high as 20%.
Accordingly it is hypothesised that the instrinic property of
raodulus has not changed however the lay of the wires and the
relative position to each other has changed causing a significant
change in the final raodulus of the coraposite conductor. This is
also supported by the significant difference in the final raodulus
of the alurainiura and to a lesser extent the final raodulus of the
steel.
3.4.2.2 Coefficient of Linear Expansion
The coefficient of linear expansion properties of a conductor are
obtained frora a therraal test in which a prepared conductor saraple
is heated and during the course of the test, raeasureraents of
conductor extension as a function of temperature are carried out
for a constant load.

209
To remove varience in extension due to conductor settlement or
initial metallurgical creep the conductor sample is
preconditioned by performing a stress strain test or holding the
saraple at 70% calculated breaking load for one hour prior to the
therraal test.
To rainiraise the effects of high teraperature creep, the constant
load of 20% calculated breaking load is only applied at the
instant of the raeasureraent of extension.
The conductor saraple is heated in a recirculating oil bath and
measureraents of extension are taken at approxiraately 10°C
intervals to 100 C. At each teraperature interval the
differential temperature over the gauge length is minimised by
allowing an approximate 10 minute stabilising period before
raeasureraents are taken.
After the conductor sample reaches 100 C the teraperature is
allowed to cool to room temperature. Additional extension
raeasureraents are taken at approxiraately 15 C intervals during the
cooling period. In the early stages of the cooling cycle
stabilised heating periods may be necessary to ensure a rainiraura
teraperature differential over the gauge length.
The gauge length of the conductor sample is approxiraately 10 ra in
length and the conductor teraperature is raeasured by means of
thermocouples attached to the conductor sample within the gauge
length every 1.5 ra.
210
The constant load of 20% calculated breaking load is chosen such
that in an ACSR construction the conductor load will be in excess
of the critical tension/stress and therraal elongation will be
that of the composite construction and not of the steel
component.
Typical raw data plots for an all aluminium construction 7/4.75
mra AAC is given in Figure 3.21. Linear regression is used to
deterraine the line of best fit and the slope of the line is
defined as the coefficient of linear expansion.
In the past the coefficient of linear expansion of a coraposite
conductor has been deterrained knowing the weighted ratios of the
alurainiura and steel components, the moduli of alurainiura and steel
coraponents and the coefficient of linear expansion of the
alurainiura and steel coraponents. An expression for the
coefficient of linear expansion of a coraposite conductor raay be
derived, if we consider for a teraperature change of AT which in
effect is a change of elongation providing the initial and final
elongation is greater than critical strain then the change in the
steel stress is given as,
AS = mE a AT (3.23) s s s
and the change in alurainiura stress is given as,
AS = nE a AT (3.24) a a a

2500 i i
1 I I 1 \ \ 1 1 r
2 3 0 0 _
2100__
1900
1 7 0 0 _
1500
g 1300 H-(O o cc
" 1100
900
700
500
300
100
CTE TEST 54-7/1.75 mm AAC MOON
O ' ^ I O 20 30 40 50 80 70 80 90 100 110 120
TEMPERATURE C
FIG. 3.21 7/4.75 MM AAC COEFFICIENT OF LINEAR EXPANSION TEST RESULTS RAW DATA AND LINEAR REGRESSION PLOT
212
The change in the composite stress is given as,
AS^ = mE^.a .AT (3.25) c cf cf ^ ^
By substitution of equations (3.23), (3.24) and (3.25) into
equation (3.5) and the values of ra and n,
E„4:a rAT = mE a AT + nE a AT (3.26) cr cf s s a a
A A E^.a , = — 1 - E^a + —^ E a (3.27) cr cf . s s , a a ^ A A c c
A E a + A E a s s s a a a /-, oo\
a f = (3.28) A E . c cf
By substitution of equation (3.6) into (3.28), the composite
coefficient of linear expansion is given as.
A E a + A E a a = _-£_i-! 1±±- (3.29)
A E + A E s s a a
Equation (3.29) does not account of the wire geometry of a
helical stranded conductor and will always over estimate the
coefficient of linear expansion. By exaraination of the wire
georaetry of Figure 3.22 an increase in teraperature will cause an
increase in wire length of AL, resulting in an increase in lay
length. The lay length change in terras of the lay angle is given
as,
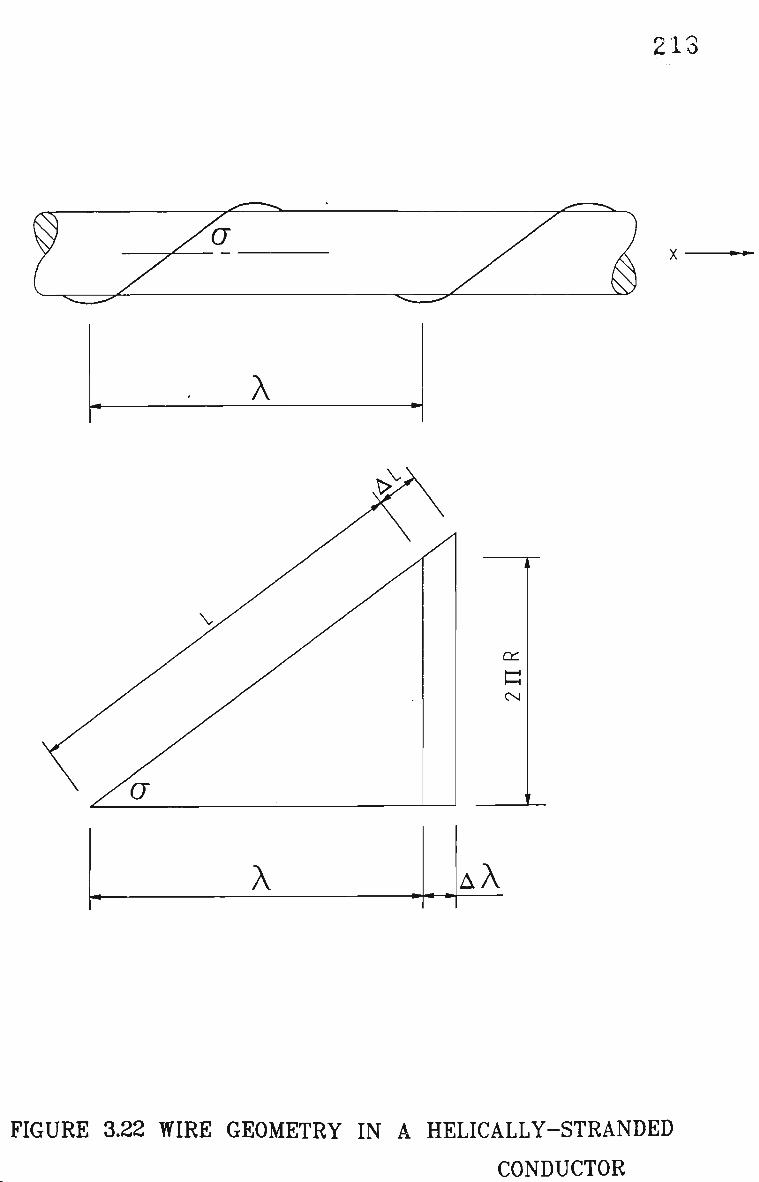
213
X
FIGURE 3.22 WIRE GEOMETRY IN A HELICALLY-STRANDED
CONDUCTOR

214
aATX AX = = aAT cos a
= aAT cos tan -1
2JIR 1
X (3.30)
Using the layer and material notation, equation (3.30) raay be
written as,
a. .' = a. cos tan -1
2iiR
L.D. 1 1
(3.31)
The stress in the centre wire for a teraperature change of AT is
given as,
AS = — - - E a AT s . s s
A c
(3.32)
and the stress in successive layers i is given as.
A. AS. =
1
ij E. .a. .'AT 13 13
(3.33)
By substituting equations (3.32), (3.33) and (3.25) into equation
(3.5),
E rA a rAT = E A a AT + E..A..a..'AT (3.34) cf c cf s s s ij ij ij

215
and suramating for all raaterials j and layers i, the final
coraposite construction coefficient of therraal expansion is given
as.
a cf E .A cf
N. E A a + Z^ s s S . -
3=1
n Z (n..A..a. .')
1=1 13 13 13 (3.35)
The detailed coefficient of therraal expansion conductor test
results and data for the saraples frora the Avon to Keraps Creek,
Dapto to Springhill and Toraago to Taree transraission lines are
given in Appendix 3. A suraraary of the findings of the
coefficient of therraal expansion tests are given in Table 3.13.
The coefficient of linear expansion for the conductor saraples
frora the Avon to Keraps Creek and Dapto to Springhill transmission
lines is in good agreement with that of AS C75 1963 and equations
(3.29) and (3.33). The Toraago to Taree transraission line
conductor saraple test number 43 and 44 supports the findings of
the stress strain test results.

218
V M <ti
H 1 - *
o <* bO (a B O
H
Q) (U U fd
H 1 cn
o -* bo <ti B O
H
i H f-H • H X ! bO C
• H IH 0 . 0 c/3 m
1 o 4-> O. rt
Q
J.J (U (U u o w a. s (U
1 c o > <!
u CU
.£> a 3
z •M CO (U
H
TS rt o
J
4->
w (U
H
O •
VO cn
O •
00 r H
OV .
r H cn
<Ti .
r H
on
c o
•(H CO c (U
H
O vr
o CNJ
o CM
o CM
J PQ O
Sv?
f Linear
o u o
Ul C CU
•r-i
a • H H-l <4H CU O
O
r H
c o
• H CO c rt a X u
VO VO \ 0 1 1 1 1 1 1
o o o r H r H r H X X X
CM VO i n ><r o «*
0 0 CO CO r H r H r H
VO VO VO
1 1 1
o o o T H r H r H X X X
CM VO 0 0 ^ o to
• • • CO 00 CM r H r H r H
VO VO VO 1 1 1 O O O r H r H r H X X X
VO r H r^ 0 0 CM CM
. . . OV ON CO r H r H r H
VO VO VO 1 1 1 O O O r H r H r H X X X
VO CM r H CO CM cn
. . . ON ON CO r H r H r H
3.29)
3.33)
ts
^ - ' -^^ r-i 3
C C C/} O O CU
• H -r-i 0^ J-l i-> (Q (d i-> 3 3 CO D* cr 0)
U U H
z o M c/i
% Ot X
M
z M _ ]
b4 O
H Z
CIE
M b fa b3 O O
CO H
3 CO u Oi
EST
H
oii O H U 3 Q z O CJ
fa O
13 - SUMMARY
. cn
m H J CO < H
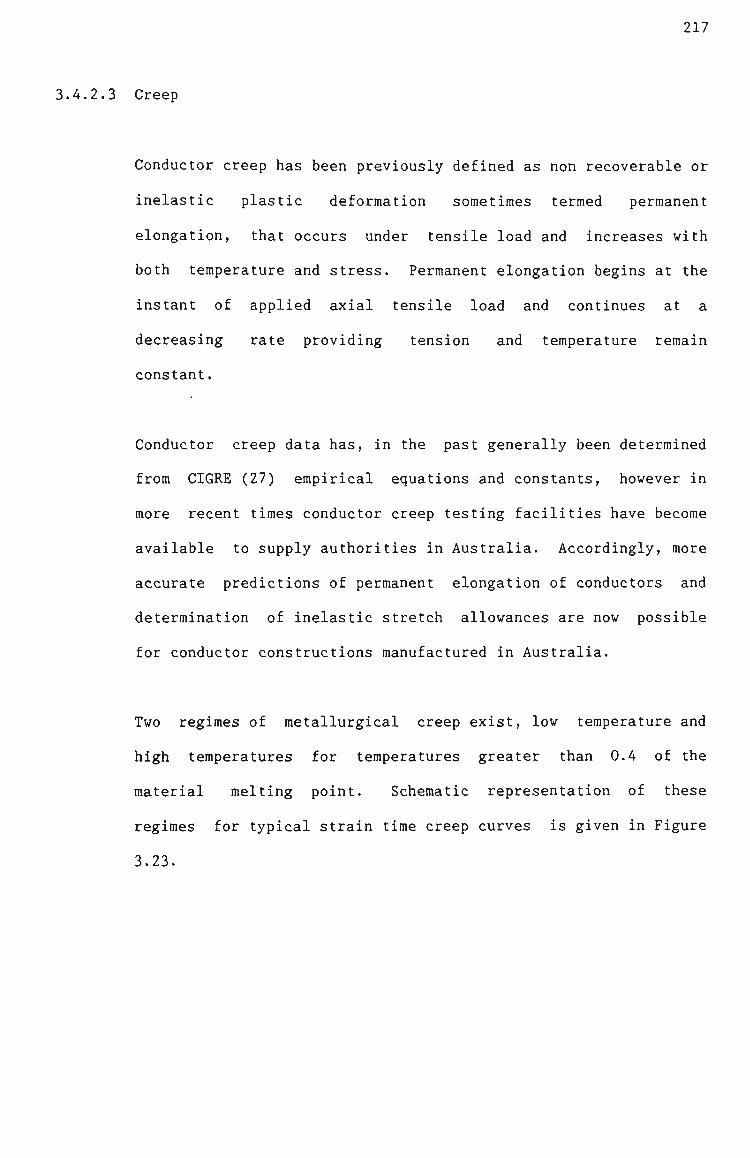
217
3.4.2.3 Creep
Conductor creep has been previously defined as non recoverable or
inelastic plastic deforraation soraetiraes terraed perraanent
elongation, that occurs under tensile load and increases with
both teraperature and stress. Permanent elongation begins at the
instant of applied axial tensile load and continues at a
decreasing rate providing tension and teraperature remain
constant.
Conductor creep data has, in the past generally been deterrained
from CIGRE (27) erapirical equations and constants, however in
more recent tiraes conductor creep testing facilities have becorae
available to supply authorities in Australia. Accordingly, more
accurate predictions of permanent elongation of conductors and
determination of inelastic stretch allowances are now possible
for conductor constructions raanufactured in Australia.
Two regiraes of raetallurgical creep exist, low teraperature and
high temperatures for teraperatures greater than 0.4 of the
raaterial melting point. Schematic representation of these
regiraes for typical strain time creep curves is given in Figure
3.23.
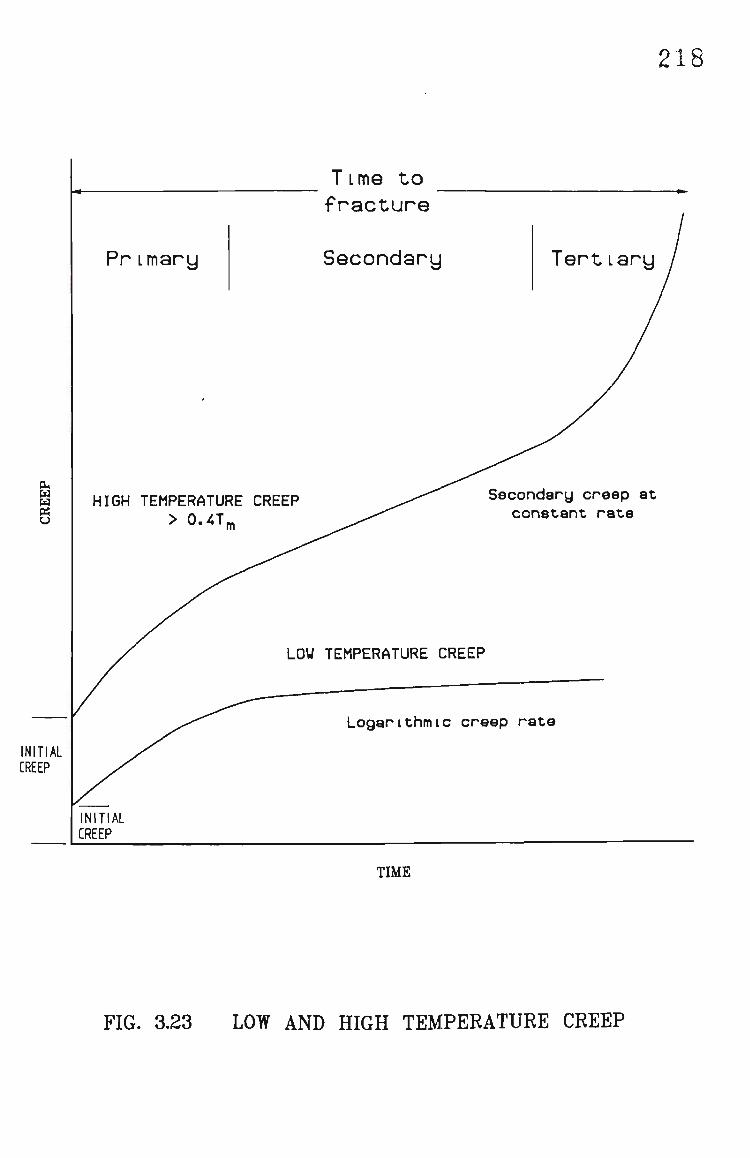
218
Primary
T L me to fracture
Seconcjary Tertiary
HIGH TEMPERATURE CREEP Secondary creep a t const-ant r a t e
LOU TEMPERATURE CREEP
Logar i thmic creep r a t e
INITIAL CREEP
INITIAL CREEP
TIME
FIG. 3.23 LOW AND HIGH TEMPERATURE CREEP
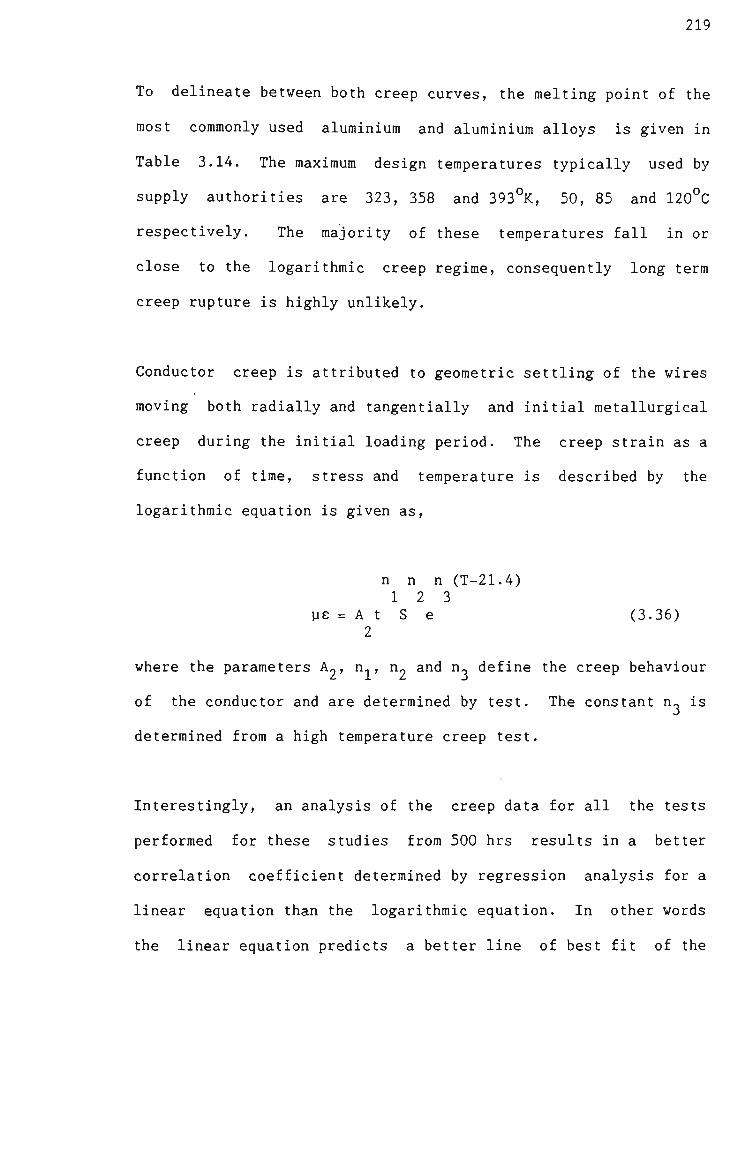
219
To delineate between both creep curves, the melting point of the
most commonly used alurainiura and alurainiura alloys is given in
Table 3.14. The raaxiraum design temperatures typically used by
supply authorities are 323, 358 and 393°K, 50, 85 and 120°C
respectively. The majority of these teraperatures fall in or
close to the logarithraic creep regirae, consequently long term
creep rupture is highly unlikely.
Conductor creep is attributed to geometric settling of the wires
moving both radially and tangentially and initial raetallurgical
creep during the initial loading period. The creep strain as a
function of tirae, stress and teraperature is described by the
logarithmic equation is given as,
n n n (T-21.4) 1 2 3
ys = A t S e (3.36) 2
where the parameters A„, n^, n„ and n- define the creep behaviour
of the conductor and are determined by test. The constant n^ is
deterrained frora a high teraperature creep test.
Interestingly, an analysis of the creep data for all the tests
performed for these studies from 500 hrs results in a better
correlation coefficient determined by regression analysis for a
linear equation than the logarithraic equation. In other words
the linear equation predicts a better line of best fit of the
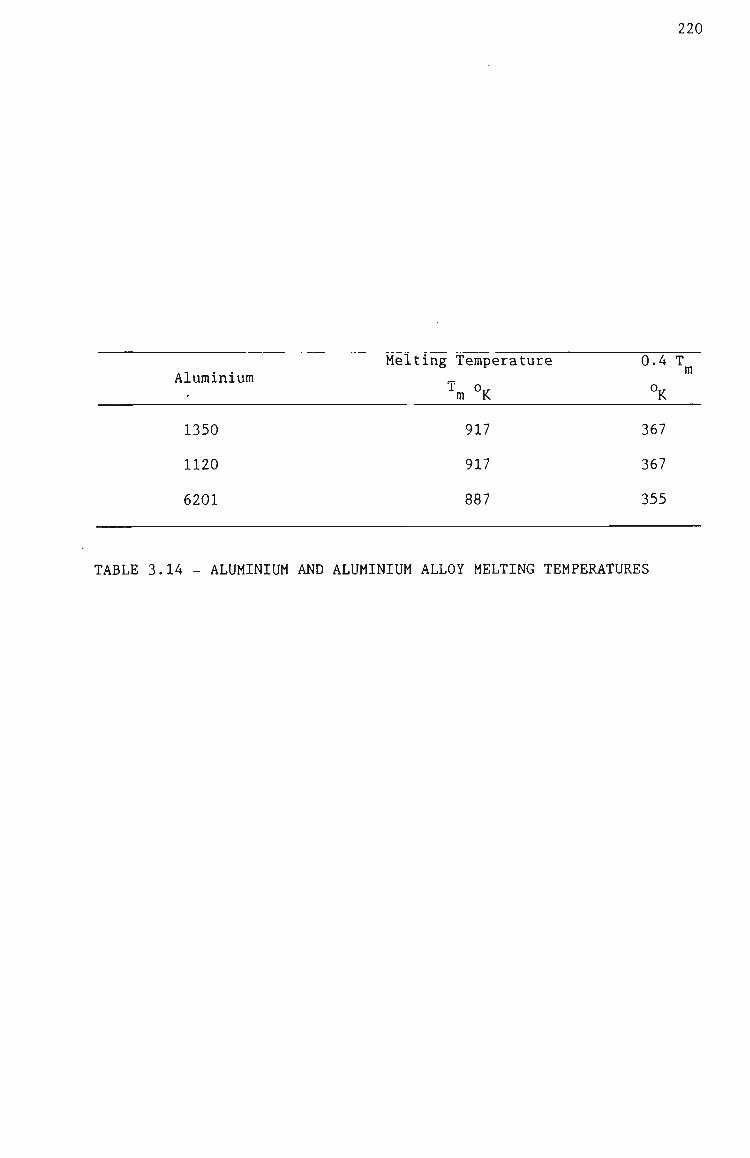
220
Melting Teraperature 0.4 T Alurainiura ^
i o., 0,,
' ra K K
1350 917 367
1120 917 367
6201 887 355
TABLE 3.14 - ALUMINIUM AND ALUMINIUM ALLOY MELTING TEMPERATURES
221
test data than the logarithraic equation. Accordingly, it could
easily be hypotherized that the conductors are in a secondary
stage of creep.
To put this into perspective, creep predicted for the Moose
ACSR/GZ conductor test results given in Appendix 3 by the
logarithraic and linear equations is 254 and 1553 mra.kra"
respectively for a load of 20% CBL after 10 years. Translated
into conductor sag for a 400 ra span at 120°C, this creep
difference is equivalent to a sag of 2.53 m.
The sag tension results presented in Chapter Two would not
support such a large departure in sag measureraents unless a
significant amount of prestressing of the conductor had occurred
at installation.
These arguraents aside, the discussions depicts the difficulties
of designing for long tiraes based on the predication of
raatheraatical models. A further constraint is introduced when one
considers the wide deversity of service conditions and the need
for raaterial properties of conductors after long and varying
service histories. It is these service histories that are
difficult to duplicate under laboratory conditions to obtain
adequate design data. The erapirical raodels do permit
interpolation in the regions bounded by the experiraental data,
however extrapolation to predict conductor creep behaviour beyond
raeasured data is considered hazardous.

222
CIGRE (27) suggest that the conductor creep test duration should
be a minimum 2000 hour. Using creep data from such tests and
considering a transmission line service life of 30 years,
extrapolation of the logarithmic data 1.65 tiraes is required.
Extrapolation with confidence in these circurastances is thought
to be reasonably reliable particularly when one considers the
confidence liraits of the test data.
Little work has been carried out in the area of long terra
conductor creep measurements to confirm the use of the
traditional logarithraic equation to predict creep behaviour.
Nakayiraa and Kojiraa (61) performed a series of field measurements
of the creep of overhead line conductors on a test line and the
results were correlated with those of laboratory creep tests.
The duration of the field test was 4 1/2 years annd the
laborating tests was 1000 hours. Whilst the predicted results
"are quite,similar in terms of the order after a lapse of 10 to 10 hours,"
no regression analysis was reported to establish which
matheraatical raodel best describes the test results.
The methods presented in Chapter Two of these studies do provide
a raethod to raeasure conductor creep for "in service" transraission
lines. A monitoring program, not unlike that for dam wall
moveraents, can now be readily carried out in the future that
would confirra long term conductor creep behaviour.

223
The basic data of the creep properties of a conductor test is
obtained in an elongation test in which a prepared conductor
saraple is subjected to a constant axial load for the given
duration of the test. The duration of the test is usually 2000
hours. Three conductor saraples are normally tested
simultaneously with axial loads of 20, 30 and A0% of calculated
breaking load.
The creep tests are perforraed at a constant teraperature and the
conductor teraperature differential over the gauge length is
rainiraised by providing circulating cooled air. In the case of
high teraperature creep, test a recirculating oil bath is used as
the heating raedium, but one raust question the validity of such
test results, given the possible teraperature differentials and
subsequent wire stress variations likely to occur if heating was
via an electrical source. No high temperature creep tests were
carried out as part of these studies.
During the course of the creep tests, measurements of conductor
extension conductor load and temperature are carried out.
Typical raw data linear linear plots and raw data log log plots
with regression lines are given in Figures 3.24 and 3.25
respectively for Moon AAC 7/4.75 rara construction.

224
o o z: o < <
E E
in
S rs.
LL.
O
Q-UJ LU QC O
1 i 1 1 1 1 1 121 *
B %
• *
B *
B * B m
1 %
a %
B *
a * • t
%
i 1 i 1 1 r ^
1 1 1 1 +
CO
M rv'.
+ H , CO
+ W H E-" O
J OH 04 U
O W pi < OS 5 < O W z S « M S O i-J m o ( r 3 -5
• Q W 4, >* Z Z T \ O M
r- O J
~ CM
w
o
+ + s
t
+
+ t +
% \
BI ' V J X o o CO
^ to CM
^ ^ CM
o o ir> o
NIVHrsOdOIW ""
o --. o
o CM
in
o o
LiJ
r-t
O
to
to

00 OO 0}
o o
I > -- J 3
CD z: o K O -+
H O CO
o CM
z o o z: o < <
E E
in
\
It. O Q-UJ iLi QC O
r ii 1 1 1 1 1 I
in CM
cn
Cd
O M fa
i I I
CO
+X
o o
l l 225
o
RES
E-" CO E4 H O l
«33 03 < O
s: OS s o H in o r^ 3
• Q sf Z •> O r- O
H O
P.1
O O X
O O -J
. zz ^ •^ !•
^ .^
-
—— • "" ^ •^ .^ ••
o o o o »*
o o o 9 ^ .
o o
= , - UJ
+ =
LULlJa_U-l LLILli_LJ i —L js o o
NIVHiSOtiOIH

226
Since the long term effect of conductor creep is to reduce
tensions and increase sag thus reduce ground clearance, an
allowance raust be raade for creep in sag tension calculations.
Once creep data is available four ways of interpretation of the
results is possible to compensate for the effects of creep.
1. PRESTRESSING CONDUCTORS - It has been established for some
tirae now, that after a period of tirae inelastic stretch rate
decreases with time. To accelerate the creep behaviour of
the conductor, over stressing at a predetermined tension is
carried out for a nominated period of tirae. This reraoves a
significant araount of creep because the initial rate of creep
at the higher stress level is much more rapid than at a low
stress level. Figure 3.26 illustrates the creep rates for
stress levels of 20, 30 and 40% of calculated breaking load
for Moon AAC 7/4.75 mm. Prestressing the Moon conductor at
30% of calculated breaking load for 5 hours reduces the
possible final sag change in 30 years for an 80 ra span at
85°C by 50%.

227
_ j _ j _ j CQ CO CQ a a o ^ M ^: o o o •* cn (u
CJ <r cn £ £
LT) CXJ
c ^
z o o E:
/
o o o 00
o o o CD
o o o
CD CD O CU
o o CQ
o LO CU
o o CU
o LD "•
o o
< N
£
X £ £
>^-«'
C
a c +-
CO
—
u
QJ
Rot
a OJ
c u c o u
C o CJ
CD CVJ +-
o
o
- o
CO
LLl ct: = ] CD
(jDaR/(UJ>i/ujuj) ) B+Dd daa jQ
228
2. OVERTENSIONING - In this compensating method the conductor is
overtensioned at final stringing to raake an allowance for the
long terra str6ss relaxation or perraanent elongation of the
conductor. Figure 3.27 illustrates the change in tension and
sag for Moon AAC 7/4.75 rara for a 30 year service life. The
tension change during this period is 40N representing a sag
change of 74 rara. Overtensioning of 40N at final stringing
corapensates for this stress relaxation. In longer spans
using larger conductors overtensioning loads can be
considerable higher than the calculated 40N for the Moon AAC
construction and span combination.
3. MARGINAL CLEARANCE ALLOWANCE - In the overtensioning
corapensating raethod for Moon AAC construction and span
corabination previously discussed a sag change of 74 rara
occurred in a 30 year service life. The raarginal clearance
allowance corapensating raethod provides for an additional 74
rara at the conductor attachraent reduced level to provide for
long terra sag change.
4. TEMPERATURE ALLOWANCE - Creep raay be interpreted as perraanent
extension in length similarly to that of the elastic
extension due to teraperature. Consequently it is possible to
say that a certain araount of creep will produce an identical
increase in conductor length as a certain temperature rise.
This temperature raay be added to the stringing teraperature
and after creep has taken place and at raaximura operating
teramperature no infringement of statutory ground clearances
will occur. In the Moon AAC construction and span
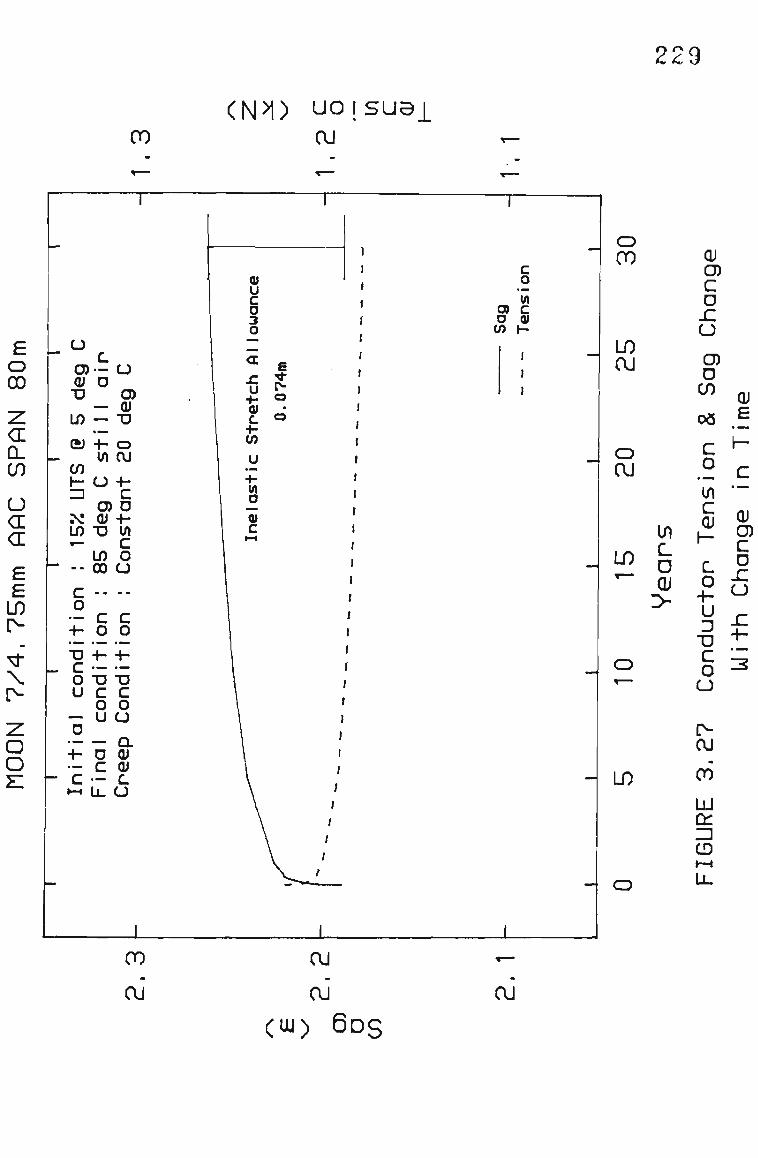
229
CO
<N>1) UOISUBl CXJ
£ o 00
z <E CL CO
U CE <r £ £
LO [
z o o
u c
O)'- u QJ U
•D O) — Q}
LO — "O
(/) I -Z3
M LO
+- O W OJ
CJ +-c O) D (U -f-
•o V\ c LO O 00 (J
c -- --o — c c +- o o T3 -H +• C O "U TD U C C
O O — U U D
a 4 - O <U — CO) c — c •-I u_ u
u c o 3 o
c o in
O) C O (U
W I -
00
LO CU
OJ O) c D
JO
u C3)
o CU
LO
in c D OJ
>
LO
D CO
oa
c o
c Qi
c o +-u D
"D C o a
OJ
CO
LU on
CD
UL
00
CU
CU
OJ
(01) 6 D S
OJ
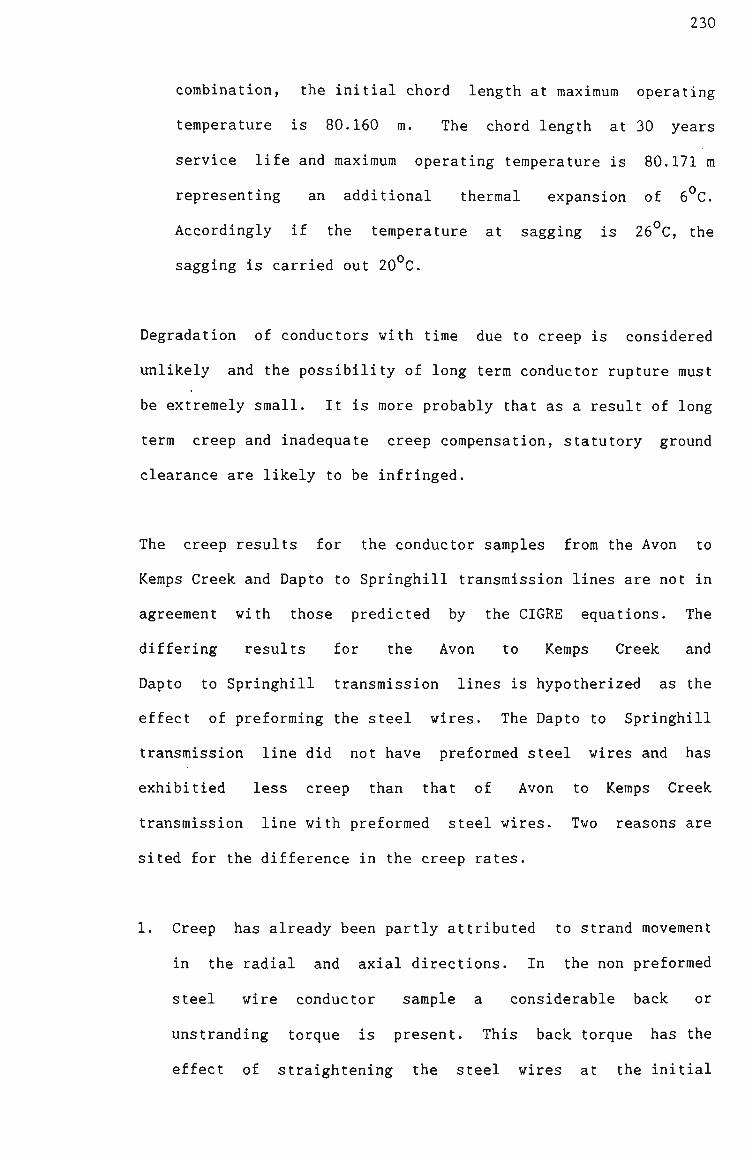
230
corabination, the initial chord length at maximum operating
temperature is 80.160 ra. The chord length at 30 years
service life and maxiraura operating teraperature is 80.171 m
representing an additional thermal expansion of 6°C.
Accordingly if the teraperature at sagging is 26°C, the
sagging is carried out 20°C.
Degradation of conductors with tirae due to creep is considered
unlikely and the possibility of long terra conductor rupture raust
be extreraely small. It is more probably that as a result of long
term creep and inadequate creep compensation, statutory ground
clearance are likely to be infringed.
The creep results for the conductor saraples from the Avon to
Keraps Creek and Dapto to Springhill transmission lines are not in
agreeraent with those predicted by the CIGRE equations. The
differing results for the Avon to Keraps Creek and
Dapto to Springhill transraission lines is hypotherized as the
effect of preforraing the steel wires. The Dapto to Springhill
transmission line did not have preformed steel wires and has
exhibitied less creep than that of Avon to Kemps Creek
transraission line with preformed steel wires. Two reasons are
sited for the difference in the creep rates.
1. Creep has already been partly attributed to strand raoveraent
in the radial and axial directions. In the non preforraed
steel wire conductor saraple a considerable back or
unstranding torque is present. This back torque has the
effect of straightening the steel wires at the initial

231
stranding stage and continuing throughout the service
history. In coraparison the preforraed steel wires do not have
the sarae level of back torque and when axial load is applied
strand raoveraent is likely to be greater. In other words,
raore strand raoveraent occurs in the preforraed steel wire
sample than that of no preformed steel wire saraple.
2. Although great care is taken in the preparation of the
conductor saraples, some back torque in the non preformed
steel wire conductor sample after the conductor termination
clamps were reraoved raay have occurred in the test length.
This has the effect of straightening the steel core wires and
reducing the araount of strand raoveraent likely to occur during
the creep test.
When coraparing the CIGRE (27) predictor equation (7) with that of
the test results of Figure 3.29 and discounting the Dapto to
Springhill transraission line conductor sample, there is good
agreement in the slope of creep curve. The Dapto to Springhill
transraission line conductor sample is discounted as the
preforraing the steel core wires has been carried out for a
considerable period of tirae and the CIGRE conductor construction
constants have probably been deterrained frora creep test on
ACSR/GZ construction with preforraed steel core wires.
Considerable departures in the CIGRE temperature and stress
constants lead to the offset of the creep curves by as ranch as
600 mra.kra" at 50 years.
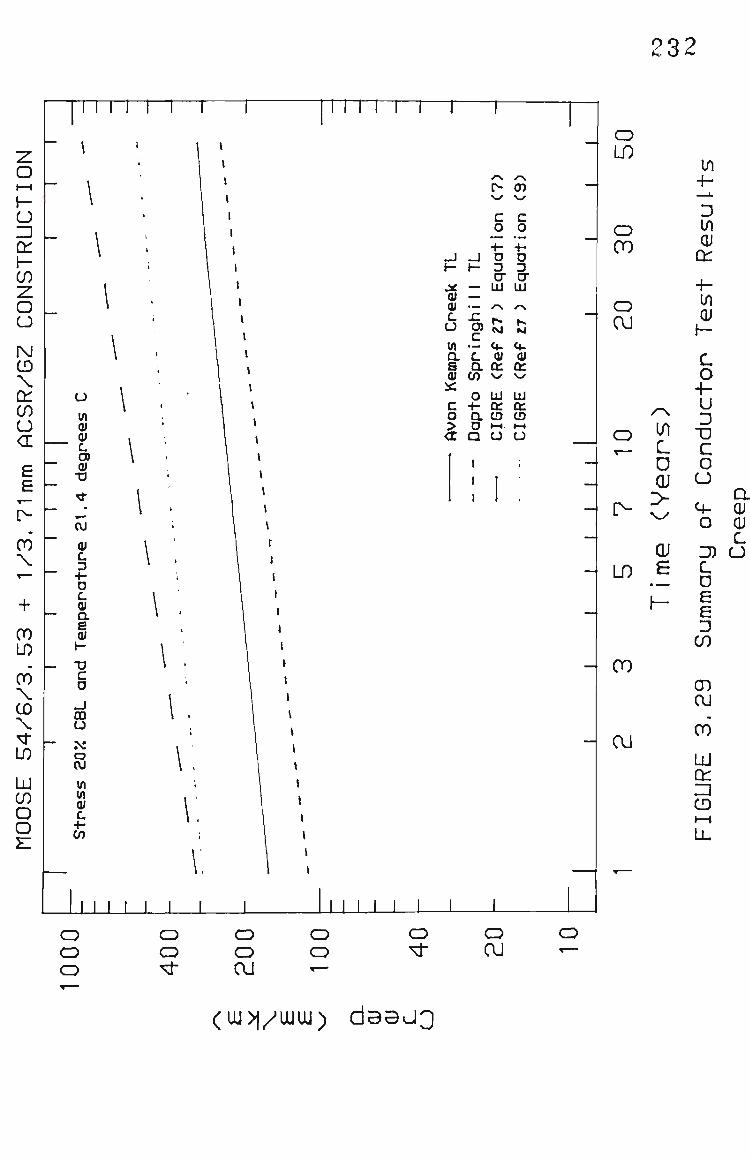
232
11 I i I I—r 11 I 1 I I—r
I I I I I I L
_J 1-
Jli (U <u u
in a 6 (V :x: c o > <t
-J H-
^ — .—
ngh
• ^
c a cn o •4-a 0 a 1 J I
r\ f> \ - r
c o +-o 3 cr u . 'N
<*. (U Q: \^
UJ ce. CO »-H
u
^ N
OT \^
C o +-o D CT LU
.^
!3 u-<u Q: \^
LU Q: CD t—•
o i
,
J_J L
o LO
o 00
o CU
o
l>
ID
in L D CU
>
OJ £
Ul-
ts
w UJ
cn
+-
cto
p T
GS
C o u
o
c H
CO
CU
cn OJ CO
LU Ql Z2 CD H-»
U-
o CD O
o o ^
o o OJ
o o X —
o ^ o CU
(UJ>|/UJU1) d B B J 3

233
Finally, Figures 3.30 and 3.31 illustrates the change in tension
and sag for the Moose ACSR/GZ construction with tirae for the
conductor saraples frora the Avon to Keraps Creek and Dapto to
Springhill transmission line respectively for an every day
service condition of 20 C, no ice and no wind. In addition the
required creep or inelastic stretch allowance is given for each
conductor sample.
To coraplete an accurate picture of the necessary inelastic
stretch allowance additional knowledge of high teraperature creep
data is necessary and a stress and temperature history or raore
appropriate, prediction of the service stress and temraperature of
the conductor is required. The later is probably the raost
difficult to obtain although sorae work in this field has been
carried out by Beers, Gilligan Lis and Scharaberger (13).
3.4.2.4 Breaking Load Tests
The breaking load or ultiraate tensile strength (UTS) of a
conductor is deterrained by a breaking load test similar to that
for a wire obtained in a tensile test. However, because of the
nature and difficulty of the test, prepared conductor saraples are
placed in a specially designed bench provided with a raechanical
raeans of elongating the conductor until failure occurs.
Historically, the breaking load of a conductor is deterrained by
calculations based on the premise that the alurainium strands will
break at 1% strain with a suitable derating factors to account
for the lay angle of the various layers. For ACSR constructions,

234
(|\j>l) u o i s u a i i> CU
e o o
<r CL
N UJ CD cc
CO CJ LU CL cn
fS r- _i c^ LU ^" LU
X CO
+ LU
CO Q :
LO o rA L l -
00 LLl
CD 0 .
LO
LU CO O O
CD
LO
CJD OJ
LO CU
mmim
o Ci (U
•D
LO
- ay
(/) h-Z ]
^ : LO
- CU
c o • —
+-- TI
c o u
— D
•— _ -H
C 1—I
L
O
— —
+-\f\
u CD OJ
U
O OJ • ^
c o +-.— • D c o u
— D c .—
LL
1
U
O) Qi
• D
o (\J
+-C D +-c o a
c o +-•— T3 C o u a QJ QJ
c a
I
1 1
A11
ow
ance
1 JC
at c. +-\ ^
1 " \ +•
\ (u \ c 1 1—1
\. ''
1
E i 01 U) ' r- , o 1
1 1
J 1
c o — Ul
1 O) C O (U
/ cn H / > ; 1 1
1
/
/
/ /
f
/
/ /
1
1 I
1
—
mm-
—
—
o 00
LO CU
- CD
OJ
LO
00
OJ O) C a x: ( J
O) D
OO
o CU
LO •«
CD
LO
m L_ o OJ
>
si
on
c \ -
c
ucto
u c
30
Co
6UR
E
3.
U-
f -
(UJ) 6 D S
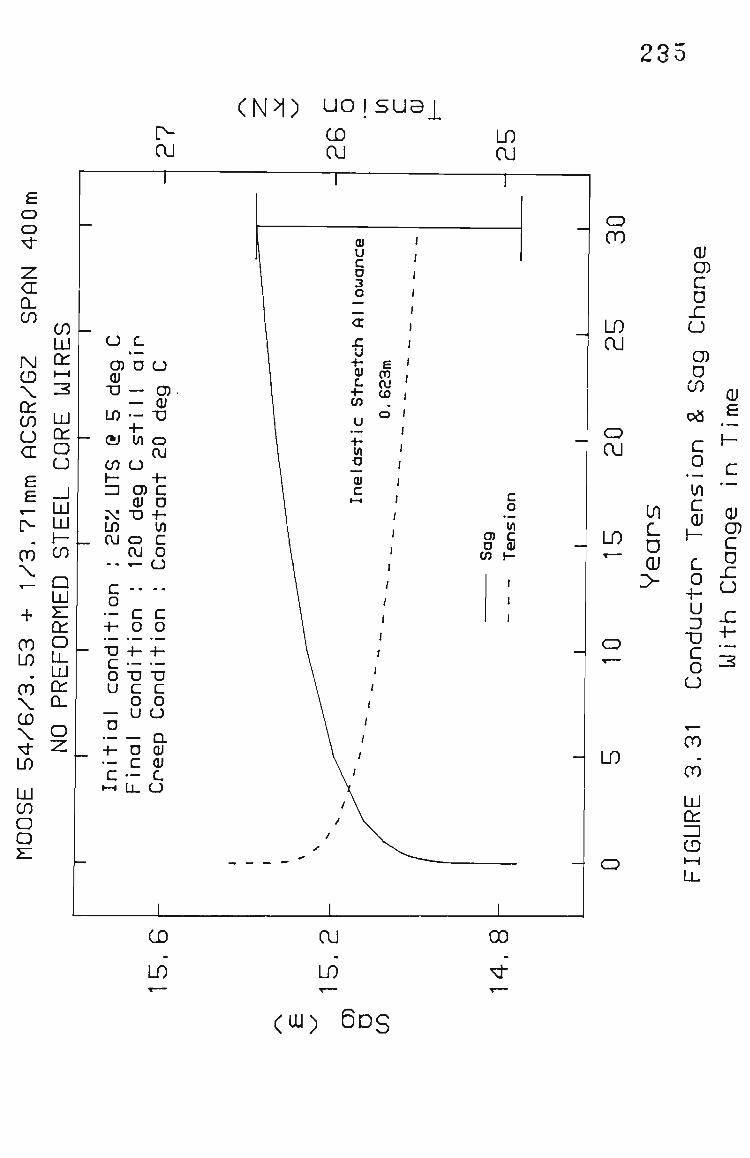
235
(N>|) UOISU31
£ o o
CL
'^ tf) LU
fsj cn CD *-* X 3 01 CO LU O CU
^ 8 I -J
^ LU [>- LU CO (n
LU
+ E cn
00 o LO U-UJ
CO ^ X 0-
•^ z LO
LU CO o o
OJ
U L
CD O QJ
TJ —
LO —
U
C^ QJ
T)
- CSJ W o CXJ
h -ZJ O)
QJ XI
LO CXJ
c D
O OJ
Ul c o
y- U
C -- --o '- c c +- o o •O +- -H C — — O 13 -D U C C
O O — u a D a
-H D OJ — C OJ c — c
•-. L L o
CD CU
JC u •t-tu c +-cn
+-in
c
£ CO CU CO
LO OJ
T
o CO
LO OJ
CD OJ
o cn
c o trt
LO C. D OJ
>
LO
QJ CD C D
- C
u C3) 0
CO
c. o -h u D
• D C o u
00
CO*
UJ cn Z2 CD I — J
LL
OJ
e
.2 c c OJ
H -
OJ c:) c D
JZ a x:
CD
LO
CU
LD
(UJ) 6 D S
CO
14
.

236
the strength of the steel wire core is included by raeasureraents
of the steel wire strength at IX strain in a tensile test. Like
the alurainiura wires an appropriate derating factor to account for
the lay of the steel wires is applied. The total calculated
breaking load of the coraposite construction is then taken as the
sura of the aluminium and steel components.
British and Australia Standards, whilst recognising the failure
criteria of IX strain do not require the measureraent of the steel
wire at IX strain. Appropriate derating factors based on
breaking load test data are applied to the strength of the
alurainiura and steel wires. In the case of an ACSR construction,
the derating factors for alurainiura and steel wires are 98% and
89% respectively when the samples are taken frora the stranded
conductor. During the raanufacturing of a conductor, it is more
convenient to test the wires before stranding as part of a
quality assurance program. In this case, because of the
probability of wire damage, particularly that of a reduction of
cross sectional area caused by the back torque on the strander
bobbins, a derating of the steel wire of 85% is applied.
Theoretically, if the layer stranding constant was deterrained and
knowing the strand breaking load along the helix lay axis, the
calculated breaking load along the composite conductor axis
direction could be determined by the relationship,
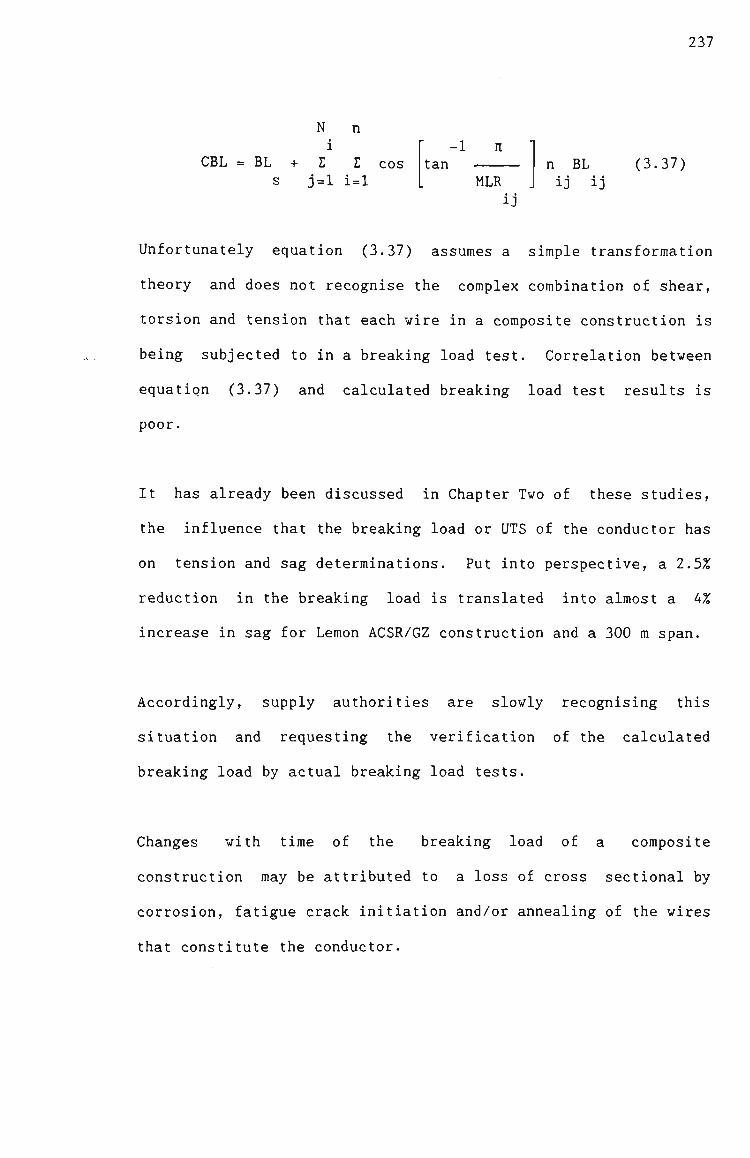
237
N n i
CBL = BL + 2 L cos s 3=1 i=l
-1 It tan
MLR
ij
n BL (3.37)
ij ij
Unfortunately equation (3.37) assuraes a simple transformation
theory and does not recognise the coraplex corabination of shear,
torsion and tension that each wire in a composite construction is
being subjected to in a breaking load test. Correlation between
equation (3.37) and calculated breaking load test results is
poor.
It has already been discussed in Chapter Two of these studies,
the influence that the breaking load or UTS of the conductor has
on tension and sag determinations. Put into perspective, a 2.5%
reduction in the breaking load is translated into almost a 4%
increase in sag for Leraon ACSR/GZ construction and a 300 m span.
Accordingly, supply authorities are slowly recognising this
situation and requesting the verification of the calculated
breaking load by actual breaking load tests.
Changes with tirae of the breaking load of a coraposite
construction raay be attributed to a loss of cross sectional by
corrosion, fatigue crack initiation and/or annealing of the wires
that constitute the conductor.

238
The detailed conductor breaking load test results for the saraples
of conductor frora the Avon - Keraps Creek, Dapto - Springhill and
Tomago - Taree transmission lines are given in Appendix 3. A
suraraary of the findings of the Brealairag Load tests are given in
Table 3.15.
The breaking loads for the conductor saraples from the Avon -
Keraps Creek and Dapto - Springhill transmission lines are in good
agreeraent with that of the value quoted in AS C75 - 1963, despite
the premature terraination failures. The breaking load for the
conductor saraple from the Tomago - Taree transraission line
suggests a 6.5% degradation which supports the wire raechanical
property tests. However cecause of the preraature termination
failure the breaking load tests for this conductor sample is not
conclusive. Unfortunately an additional conductor saraple was not
available for further breaking load tests.
Preraature terraination failures are defined as the failures that
occur outside the gauge test length. The gauge test length is
the length of test speciraen less 3 tiraes the epoxy termination
length at each end of the specimen. It is in this region that
strands become disturbed during the preparation of the conductor
terraination that may influence the breaking load test results
Typical sections of an epoxy terraination are given in Plates 3.22
and 3.23.

239
Avon-Keraps Creek Dapto-Springhill Toraago-Taree
Test No. 205 206 207 208 163 164
Breaking Load (kN)
ASC75-1963
1 Calculated
Test Result
Failure Strain (%)
159.5
178.9
153.11^
0.69
159.5
178.9
158.9^
0.85
159.5
184.6
170.4^
0.88
159.5
184.6
159.5^
0.76
89.2
96.3
2 83.4^
0.61
89.2
96.3
83.3^
0.67
TABLE 3.15 - SUMMARY OF CONDUCTOR TEST RESULTS BREAKING LOAD
Notes:
1. Calculated value is deterrained frora actual wire breaking loads and eraploying the raethods of ASC75-1963.
2. Preraature termination failure.
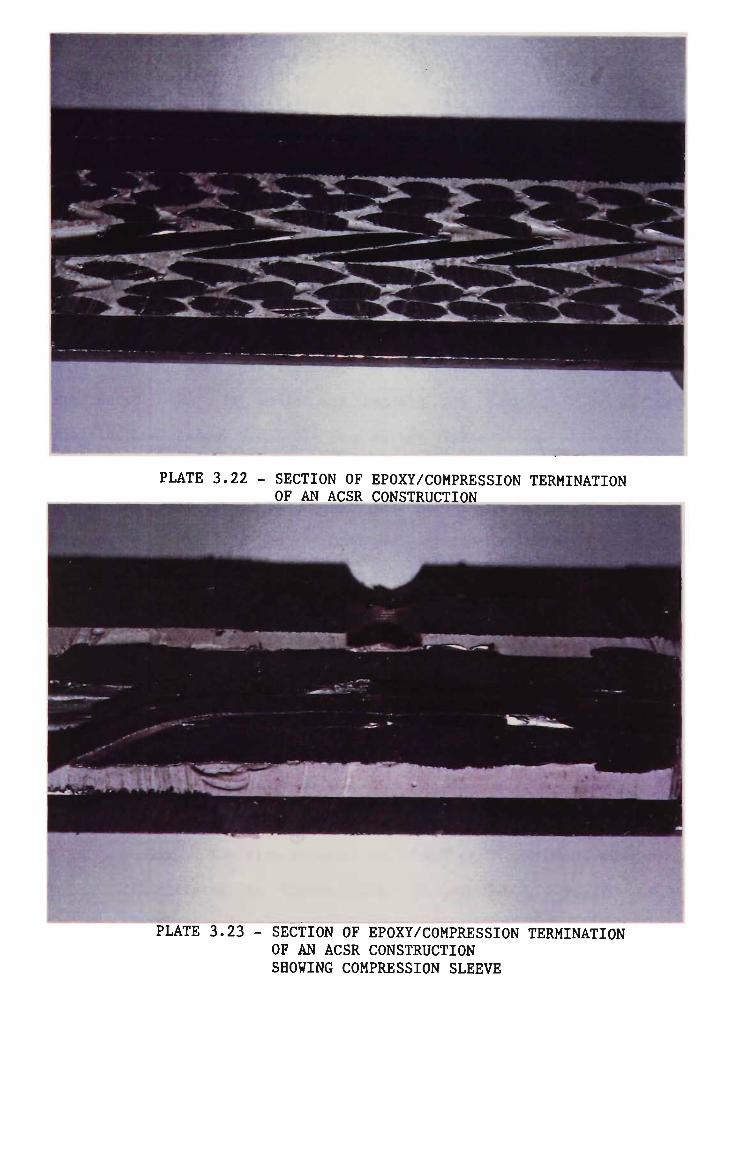
PLATE 3.22 - SECTION OF EPOXY/COMPRESSION TERMINATION OF AN ACSR CONSTRUCTION
PLATE 3.23 - SECTION OF EPOXY/COMPRESSION TERMINATION OF AN ACSR CONSTRUCTION SHOWING COMPRESSION SLEEVE

241
An interesting interpretation of the breaking load test result is
polynorainal raodelling of the stress strain curve. The polynorainal model
is given as.
Load = B^ + B,S + B^S^ + B„S^ ... B s" (3.38) 0 1 2 3 n
Changes in the stress distribution with time in an ACSR construction may
exhibit differing polynominal constants caused by the creep of alurainiura
wires. Unfortunately for this assessraent to be successful a substantial
data base of test results would be necessary and at this stage it is
considered that it would not replace the deterraination of stress
distribution changes available in a stress strain test.
Polynominal modelling of Panther and Moose ACSR/GZ is illustrated in
Figures 3.32 and 3.33 and the constants of the polynorainal equations are
given in Table 3.16.
3.4.2.5 Lay Ratio
The lay ratio is defined as the ratio of axial length of one
complete turn of the helix formed by an individual wire in a
stranded conductor to the external diaraeter of the helix. In the
past the lay ratio was determined frora the raean diaraeter of the
helix. The wire georaetry of a helically stranded conductor is
illustrated in Figure 3.34. Mathematically the lay ratio is
defined as,
L LR = (3.39)
2R

242
C/)
co LU
a <L o
cn o H-O ID Q Z
o CJ E £ 05
OJ N.
-J X
CD
2s: <E LU QC CQ LL O
CD
LU Q O z: <E
o CT)
CD
cn o
> -J cn O LU Q. X
H z
OJ cc CT) Q.
00
LU Ck: =] CD
(N>i) ayoi

243
<L Q:
_ ' ^ CO
CO
co UJ
a <E O
CD
<r LLl cn m LL
o CD
MODE
- J <L Z
POLVNOMI
CT) CT)
CT)
LU Q: ZI CD
CT) X CO X
LO
ACSR/62
OSE
o z:
o o (U
o in I T "
o o »-
o Ui
<N>i) auoi

244
Coefficient
B' 0
^1
^2
^3
h ^5
Panther ACSR/GZ
-0.00587
206
-187
851
-2050
1390
Moos e ACSR/GZ
0.0765
317
218
-904
561
-
TABLE 3.16 - POLYNOMINAL MODELLING OF BREAKING LOAD TESTS TABLE OF COEFFICIENTS

245
X
,
Cd
n
R =
X = i
(J =
X-L =
'
LAYER RADIUS
AXIAL LENGTH
LAY ANGLE
LAY LENGTH
STRAND LENGTH CORRESPONDING TO ONE LAY LENGTH.
FIGURE 3.34 WIRE GEOMETRY IN A HELICALLY-STRANDED
CONDUCTOR

246
The lay angle of the helix is defined as.
, -1 a = tan
2jlR
(3.40)
The lay ratio describes the araount that one wire of a particular
layer of the conductor is longer than the length of the
conductor. This is applicable to all layers of a conductor with
the exception of the core wire.
Depending on the lay ratio, number of wires in a construction and
the size of the wires, the lay of the wires has the effect of
increasing the bulk mass and resistance of the conductor compared
with that of the sura of the individual straight strands. In
addition, the conductor pararaeters of calculated equivalent
alurainiura area which corapares the area of a solid alurainiura rod
having the same d.c. resistance as the conductor is influence by
the lay of the wires.
Unit less constants are determined for particular stranding
construction and published in Standards (6, 7, & 8). These
constant for raass, resistance and calculated aluminium area for
layer i are given as.

247
- 1
ra =
c i
r f
COS tan - 1 Tl
LR ; i
( 3 . 4 1 )
ra C l
(3.42) C l
n 1
1
C l R (3.43)
C l
respectively.
Changes in the lay ratio with time are attributed to radial and
axial moveraents of the wires. In an ACSR conductor, particularly
one with non preforraed steel wires, the back torque on the 6 wire
layer has the effect of unravelling this layer. This unravelling
will increase the lay ratio for those layer with the sarae
direction of lay or the 6 wire layers steel core and decrease the
lay ratio for those layers with the opposite direction of lay as
the 6 wire layer steel core.
One of the main difficulties in assessing a change in the lay
ratios is the broad range of lay ratios allowed in the
appropriate manufacturing standard. Even if a bench mark lay
ratio could be established and a significant change occurred,
this would not represent a serious degradation to the conductor
unless the conductor layers had unravelled to such an extent that
the conductor elongated and ground clearance statutory
requirements were infringed. This situation is not likely to
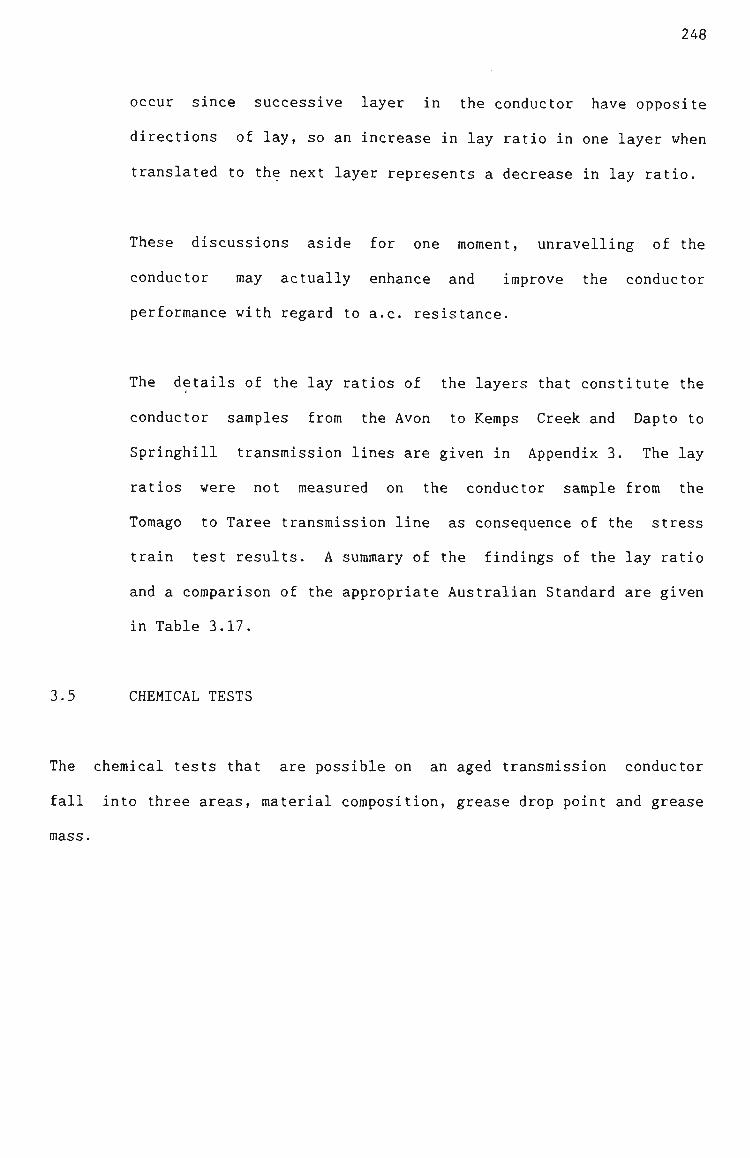
248
occur since successive layer in the conductor have opposite
directions of lay, so an increase in lay ratio in one layer when
translated to the next layer represents a decrease in lay ratio.
These discussions aside for one moment, unravelling of the
conductor raay actually enhance and improve the conductor
performance with regard to a.c. resistance.
The details of the lay ratios of the layers that constitute the
conductor saraples frora the Avon to Keraps Creek and Dapto to
Springhill transraission lines are given in Appendix 3. The lay
ratios were not measured on the conductor sample from the
Tomago to Taree transmission line as consequence of the stress
train test results. A suraraary of the findings of the lay ratio
and a comparison of the appropriate Australian Standard are given
in Table 3.17.
3.5 CHEMICAL TESTS
The chemical tests that are possible on an aged transmission conductor
fall into three areas, raaterial coraposition, grease drop point and grease
mass.

249
Layer As C75.1-1963 Avon-Kemps Creek Dapto-Springhill Transraission Line Transraission Line
6 Wire 20-30 25.83 24.31
12 Wire 14-21 16.75 16.22
18 Wire 11.25-18 14.56 14.79
24 Wire 11.25-14 10.84 10.82
TABLE 3.17 - SUMMARY OF CONDUCTOR TEST RESULTS LAY RATIO
250
3.5.1 Material Composition
The raaterial properties of a conductor are function of the
composition and structure of the material. Fundamentally, if the
material intrinsic properties are suspected of changing with tirae
then either or both the raetallurgical structure and the cheraical
coraposition have changed.
However, it is not possible for the cheraical coraposition of a
conductor to change with tirae. To elirainate cheraical coraposition
as a possible factor in determining a property change it is
necessary to carry out chemical composition tests on a sample of
conductor to establish the material bench mark.
To illustrate the possible misinterpretation of wire or conductor
test results, the resistivity of alurainiura wires that constitute
the conductor sample frora the Bellarabi to Heathcote transraission
line was high because of a high silicon component consistant with
a hot rolled production process. This could have easily been
interpretated as loss of conductivity due to high operating
teraperatures for extended periods causing an intrinsic property
change.
The chemical coraposition of the three currently available
conductor aluminiums is given in Table 3.18.
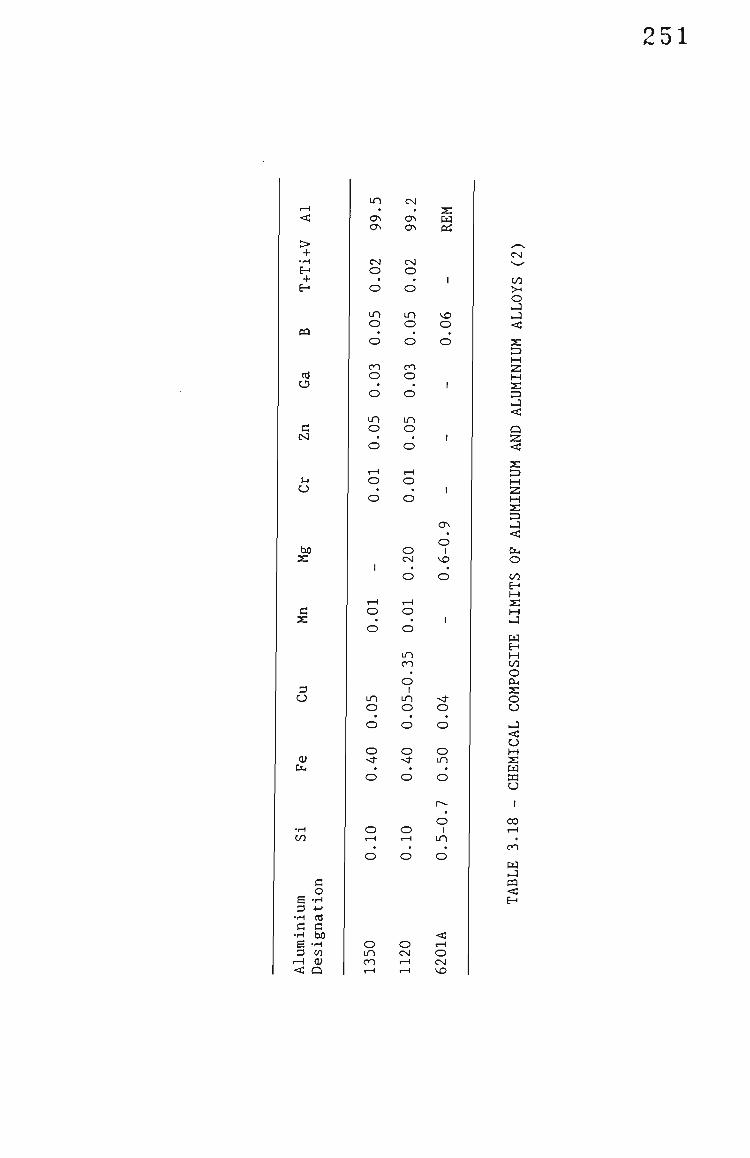
251
m CM
> +
H +
03
rt 9
9.
CM O • o
m o • o m o • o
in o 9
9.
CNl
o • o
in o • o
cn O • o
in o RE
M
1
o « o
1
CM
00 >-• O X i-J <
X
<
u o
bO
G
3
O
d o d
o CM
d I
o • o
in
o • o
o ^
o •
-0.3
5 0
in
o • o
o -<r
1
St
o • o
o m
x: 3
21 X < O
CO H M
M H M C/3 O CM s o o X < M a: w El o
173
B 3
O
5 3
rt 3 bO
O 1—1
d o 1—1
d
o I
i n
o in cn T-i
o CM 1—1 I-I
i-H
O CM vO
CO
cn
w CQ <

253
3.5.2 Grease/Tar Drop Point
The principal reason of including a grease or tar in a conductor
is to provide corrosion resistance to the wires that constitute
the conductor. It has been previously discussed in Section 3.3.1
that the zinc coating of the steel wire under some conditions is
sacrificial to the aluminium. The grease/tar plays an important
role in providing a barrier to this zinc alurainiura interface,
thus preventing the possibility of corrosion.
Another iraportant property of the grease/tar is to restrict the
loss of grease/tar when the conductor is operating at high
teraperatures. Accordingly the grease/tar drop point should be
greater than the raaxiraura design operating teraperature of the
transraission line.
The grease/tar drop point is deterrained in accordance with the
requirement of ASTM D566.
* ASTM Designation D566-64 "Dropping Point of Lubricating Grease". IP Standards for Petroleum and its Product Part I Mothods for Analysis and Testing Section 1 IP Methods 1

254
The details of the grease/tar drop point of the conductor samples
from the Avon to Kemps Creek, Dapto to Springhill, Toraago to
Taree and Bellambi to Heathcote transmission lines are given in
Appendix 3. A suraraary of the findings of the grease/tar drop
point and the raaximura design operating teraperature of the
transraission lines is given in Table 3.19.
In the case of the Avon - Keraps Creek and Dapto to Springhill
conductor grease drop points were less than the raaximum design
operating temperature. Accordingly, loss of grease raay occur if
the conductor teraperature was greater than grease drop point for
a sufficient time for raigration of the grease frora the core to
the surface to occur.
Two stages of grease/tar flow are likely to occur.
1. The grease/tar migrates from the top of the conductor to the
bottora.
2. The grease/tar accumulates at the bottom of the conductor and
then flows to the span low point or to a point where the raass
of the grease/tar droplets is sufficiently large that
discharge frora the conductor will occur.

255
CU
*-> o o
X •I-I (d a>
B cd
<U 03
0) u cd
E l I
o ho (d e o H
X b O
a •H u CL
CO I
O 4-> CL rt
Q
OJ (U S-l
CJ
M
5
I C o > <3
G O
CO to
•H e to G (d u H
CM
0 0 u i-a rt
E-" ^ O f s -
. VO
cn o i n
CM
cd E-< V O cn
o i n
<u CO rt
i n VD
o CM
CU to rt 0)
O VO
v£)
m V O
o CM
G O
•r-i J ->
G (U
> CU s-l
CU
G o
•r-i CO
o u 1-1
o u
1—1
rt • H i ^ (U
J - J
rt s
OJ >» cd
1—1
<u 1-1
• H
> x , ^
4 - 1
G O* 4->
X w
J->
G • H
o CL.
o. o 1-1
Q
r H
rt •1 -1
1-1
0) 4->
rt s
^ - N
o o
..•
CO CO
rt s 1—1
rt • r t 1-1
<u 4->
rt s:
ho
c bO
•H
in CU
a E 3
B • H
X (d s
CJ)
o • " - ^
dJ 1-1
ho 3 G • "
•H rt •i-i 1-1 ca CU
u a. (U E CL CU O E-i
(A E-"
CO
an
H CO
w H • J
CO
< w
H M
o 0•^ On
o Q
o
^
I
0 0
03 <
(X,
W E-i
CJ
X
fa W O H
2:
CO O
E-t O
ON P 5 X «-l 0-1 <3
o z CJ M CO M Q
M
Z o M CO
o o o
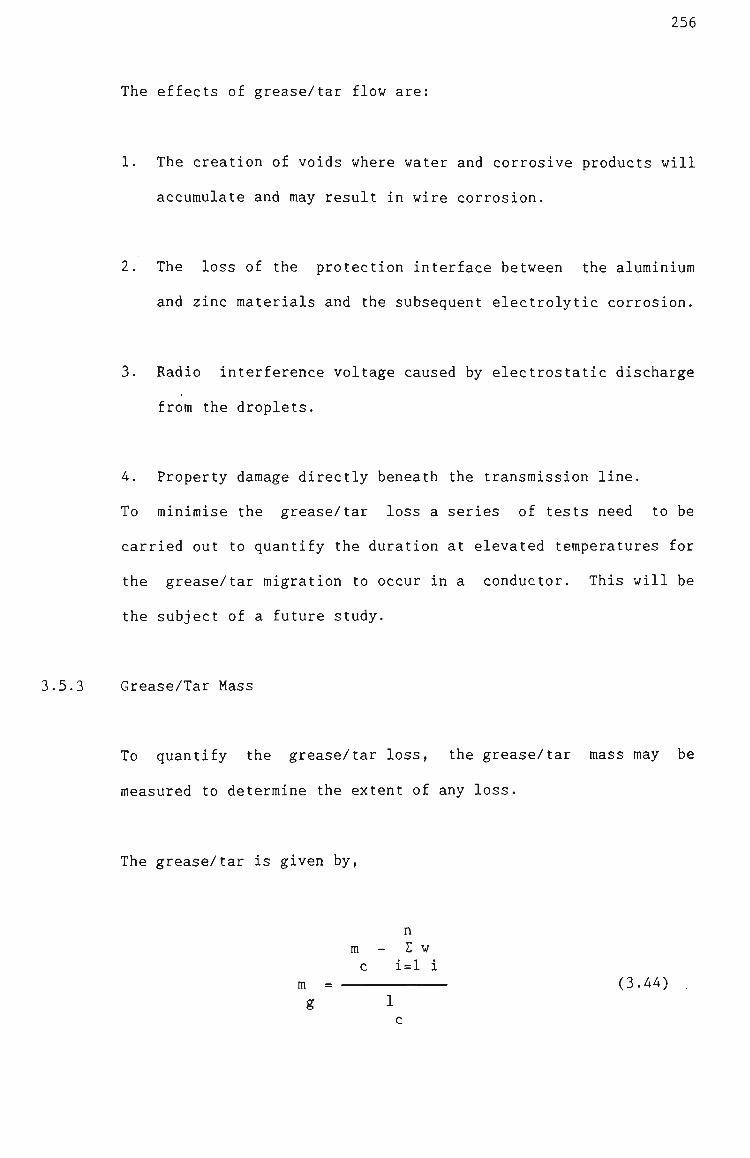
256
The effects of grease/tar flow are:
1. The creation of voids where water and corrosive products will
accuraulate and raay result in wire corrosion.
2. The loss of the protection interface between the alurainiura
and zinc materials and the subsequent electrolytic corrosion.
3. Radio interference voltage caused by electrostatic discharge
from the droplets.
4. Property damage directly beneath the transraission line.
To miniraise the grease/tar loss a series of tests need to be
carried out to quantify the duration at elevated teraperatures for
the grease/tar raigration to occur in a conductor. This will be
the subject of a future study.
3.5.3 Grease/Tar Mass
To quantify the grease/tar loss, the grease/tar raass raay be
raeasured to determine the extent of any loss.
The grease/tar is given by.
n m - Z w c i=l i
m = (3.44) g 1

257
Current typical grease raasses for various conductor constructions
is given in Table 3.20. Unfortunately past tar raass data is not
available, however good correlation between the Toraago to Taree
and Bellarabi to Heathcote transraission line conductor samples
would indicate for tarring of 6 and 12 wire layers a tar mass in
the order of 36-37 g.m~ is likely.
A comparison of the grease raass per raetre for the Avon to Keraps
Creek and Dapto to Springhill transraission lines given in Table
3.19 and the typical grease raass per metre for conductor
constructions suggests no loss of grease.
3.6 METHODOLOGY FOR TESTING AGED CONDUCTORS
Conductor degradation with tirae can be attributed to one or all of five
mechanisms, corrosion, fatigue, annealing, electrical and mechanical. In
an ACSR construction stress distribution changes can occur due to creep of
the alurainiura wires over the steel wire. Furthermore, overall
transmission line degradation caused by the infringement of statutory
ground clearances is attributed to conductor creep.
A raethodology for conductor sarapling, testing and assessing the level of
degradation of each of these mechanisms and a simple life expectancy model
is discussed as follows.

258
Construction
3/4 4/3 6/1 6/7 30/7 54/7 54/19
Grease Mass, Mg X M c
0.2-0.3 0.2-0.3 0.3-0.4 1.0 1.0-1.5 1.0 1.0
TABLE 3.20 - TYPICAL GREASE MASS IN CONDUCTORS
259
3.6.1 Corrosion
The level of corrosion in a conductor is a function of the
pollution level of the environment and the topography of the
route of the transraission line. Climatic factors can also
influence the extent of the corrosion in a conductor. Results of
the samples of conductor suggests negligible corrosion will occur
in pollution environraents ranging frora light to heavy.
Experience would indicate sarapling of the conductor is necessary
at the suspension point where foreign raaterials are likely to
accuraulate beneath the armour rods and deterioration of the
alurainiura wires and the galvanizing zinc of the steel wires is
more likely.
Corrosion of a homogeneous conductor will normally be restricted
to pit corrosion, with pit growth rates generally small.
Experience also would suggest catastrophic localised corrosion is
not likely to occur because of the presence of the hard alurainiura
oxide surface filra, even in environraents with a heavy pollution
level. The overall effect of pit growth would be the gradual
loss of cross sectional area and the development of marginal
thermal hot spots.
In non homogeneous conductors such as ACSR/GZ construction
internal corrosion is an additional consideration and will occur
in several stages. Initially, in the presence of an electrolyte
a cell is established between a zinc anode and an alurainiura
cathode. The zinc corrodes exposing the steel core. Secondary

260
cell action is then established where the aluminium behaves as
the anode and the steel as the cathode. As the alurainiura
deteriorates bulges will form and with the flow of electric
current and the gradual loss of cross sectional area, therraal hot
spots will develop that may lead to ultiraate failure of the
alurainiura and steel wires.
Steel wire galvanising properties discussed in Section 3.4.1.4
indicates that with a 3X loss of wire mass that onset of brown
strains on the wire will occur. The most effective way to
prevent this onset occurring is insuring an adequate corrosion
prevention material such as a grease or tar is present. These
materials have the effect of providing an insulating barrier to
the zinc alurainiura interface and excluding any electrolyte from
the interstitials. Typical grease raasses for various conductor
constructions are given in Table 3.20. Tar masses are
unavailable, however for a 30/7 ACSR construction with tar on 6 &
12 wire layers, the results of these studies, assuraing no loss
had occurred in the service life of the saraples, suggest that 36
g.ra" is an appropriate value.
Conductor life expectancy is predicted by a siraply philosophy.
If negligible degradation has occurred in the grease and zinc
coating for a particular service history, then provided the
environraent reraains the sarae, one would expect a sirailar future
exposure period without significant additional degradation to
occur from the time of initial sarapling. In the case of
measurable degradation, annual visible inspections of evidence of
conductor bulging combined with conductor sarapling at the rate of

261
one quarter the period frora the tirae of initial sarapling is
considered appropriate.
A raethodology for testing for the degradation of steel wires due
to corrosion is given in Figure 3.35. A methodology for testing
for the degradation of aluminium wires due to corrosion is
restricted to tensile tests where results need to comply with the
appropriate raanufacturing standards. In the event of that one or
raore wires did not raeet the appropriate criteria then a conductor
breaking load test would provide an overall perforraance indicator
on the conductor degradation.
3.6.2 Fatigue
Two design philosophies are used to account for material fatigue,
daraage tolerant and daraage free. Daraage tolerant designs perrait
fatigue crack initiation and predicts an acceptable crack
propogation period before raaterial replaceraent is necessary. On
the other hand, the daraage free designs deterraines a critical
value of stress in the raaterial, which if not exceeded, inhibits
fatigue crack initiation.
With the use of vibration darapers, transraission line conductor
designs are based on the daraage free criteria. The rule of thurab
critical dynaraic strain is 150 mm.km . However even with such
damage free designs, as transmission line conductors age and in

TRANSMISSION LINES
TRANSMISSION LINES
UPRATING TRANSMISSION
LINES
Z CONDUCTOR EXPOSURE POLLUTION ENVIRONMENT
LIGHT 4 MEDIUM
PROBABILITY OF CORROSION SMALL
PERIODICALLY REVIEW POLLUTION
ENVIRONMENT
HEAVY AND VERY HEAVY
262
ALUMIN UM CLAD CONDUCTORS
ZINC AND ALUMINUM
COATED CONDUCTORS
PROBABILITY OF CORROSION VERY SMALL
ROU INE INSPECTIONS
ANNUAL INSPECTION
NO
ESTABLISH EXTENT OF DEGRADATION BY SAMPLING
GREASE / TAR MASS (Mq)
Wl RE BREAKING LOAD
ZINC COATING MASS (Mz)
Mg' DETERMINED FROM TABLE 3.20
WIRE SIZE
2.85 3.62
3.61nTn
3.86fTm
ilz:
192 g/m
208 g/m
REPLACE DETERIORATED SECTION OF CONDUCTOR
FIGURE 3.35 METHODOLOGY FOR TESTING STEEL WIRES IN AGED CONDUCTORS

263
view of the wide spectrum of service conditions, the complex
nature of stranded conductors and the instrinsic fretting action
of the coraponent wires, it is prudent to investigate for evidence
of fatigue crack initiation.
The first evidence of wire fatigue is abrasion or fretting and
the presence of alurainiura oxide. Wire fretting is raore prone to
occur where radial wire moveraent is restricted such as suspension
points, conductor spacers and vibration damper locations. At the
suspension point the addition of the bending stress over the
suspension clarap, particularly at the top of the conductor raakes
this site the most likely location for fatigue cracks to be
present.
Samples of fretted wires are exarained with an optical microscope
and a scanning election microscope to establish the presence of
fatigue cracks in the fretted areas and longitudinal section are
prepared to measure the depth of any fatigue cracks. Tensile
tests on fatigued wires were not conclusive as to whether such
tests are sufficiently sensitive to indicate fatigue crack
initiation.
The saraples of conductors exarained as part of these studies did
reveal wire fretting without fatigue cracks. However with such a
small sarapling rate the likelihood of finding fatigue cracks raust
be considered sraall. Even so, with no evidence of fatigue cracks
and a current history of fatigue free service of transmission
line conductors in NSW, such results are reassuring.
264
These discussions aside, it could be hypotherized that all the
conductors in service to date are in an incubation period and
future wire breaks are possible. If this scenario did eventuate,
then the reraedial action necessary would consist of placing the
conductor in stringing sheaves and relocating the daraaged section
of conductor away frora the suspension point. Arraour repair rods
fitted to the daraage section of conductor would provide insurance
against loss of cross sectional, if other wires were subsequently
daraaged.
Future life expectancy of conductors in the event of wire fatigue
failure is considered liraited without reraedial action. This is
due to the curaulative daraage already occurred in the reraaining
wires and the increased stress that the reraaining wires will be
subjected. In other words the increased stress levels in the
reraaining wires is likely to accelerate the propogation of
fatigue cracks in any other daraaged wires.
A methodology for testing for the degradation of alurainiura wires
due to fatigue is given in Figure 3.36.
3.6.3 Annealing
Annealing is the heating of a material generally followed by a
cooling period. During this process the material experiences a
change in the microstructure and for alurainiura this includes a
reduction in tensile strength and an increase in conductivity.
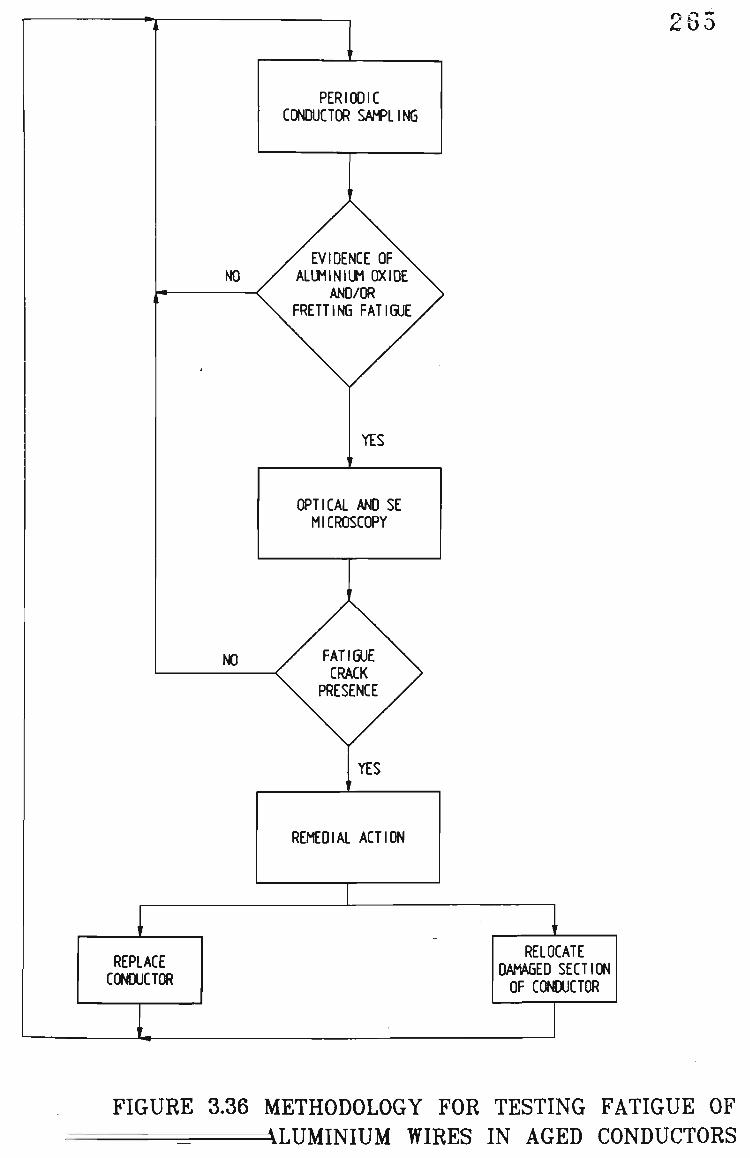
o a 26o
PERIODIC COraJCTOR SA^f>LING
NO EVIDENCE OF
ALUMINIUM OXIOE AND/OR
FRETTING FATIGUE
YES
OPTICAL AND SE MICROSCOPY
NO
YES
REMEDIAL ACTION
REPLACE COrOJCTOR
RELOCATE DAMAGED SECTION OF CONDUCTOR
FIGURE 3.36 METHODOLOGY FOR TESTING FATIGUE OF ALUMINIUM WIRES IN AGED CONDUCTORS

266
Such changes have already been illustrated in Figures 3.5 to 3.7
and 3.8 to 3.10 for tensile strength and conductivity
respectively.
It is clear frora these illustrations that significant changes in
the tensile strength and conductivity only occur when conductors
are subjected to operating teraperatures greater than 80°C with
corresponding long exposure times. Normal raaxiraum design
teraperatures only raarginally exceed this value, however transient
short circuit currents will increase the conductor teraperature
considerably. This high teraperature excursions are thought not
to have a large irapact on annealing of conductors as the exposure
tiraes are limited to less than 0.2 seconds by high speed
protection systeras. Even with curaulative annealing during the
lifetirae of conductors large excursions of property changes are
not likely.
The results of these studies support this and suggest the current
operating policies of the Electricity Coraraission of NSW that the
likelihood of conductor annealing is sraall.
The extent of annealing is determined by tensile testing of a
destranded conductor and the extent of degradation measured using
the appropriate raanufacturing standard minimura criteria. In the
event, that several wires did not meet the criteria, a coraposite
breaking load test would give an overall perforraance indicator

267
and the effect of individual low strength wires. If the
conductor did not raeet the breaking load criteria, the results of
lower conductor statutory safety factors would need exaraination.
Conductivity tests raay be carried out to determine the extent of
the annealing, however given the likely initial raanufacturing
tolerances, it is considered that such tests would be
inconclusive.
Life expectancy is raeasured by deterraining the future date when
statutory safety factors could not be achieved. Even though the
tensile strength deterioration rate is coraplicated by an
increasing conductivity, a linear degradation raodel is suggested.
A raore coraplex model that would account for the combined effects
of conductor teraperature, exposure tirae, increasing conductivity
and decreasing tensile strength could be established by
determining equations for loss of strength and resistivity by
mathematically modelling the curves of Figures 3.5 to to 3.10
using raultiple regression. However this is not considered
appropriate unless it is necessary to operate conductors at
temperatures in excess of 80 C for long periods of tirae.
A raethodology for testing for the effects of annealing of
alurainiura wires is given in Figure 3.37.

aB8 NEW
TRANSMISSION LINES OLD
TRANSMISSION LINES
ESTABLISH CONDUCTOR DATA FROM PROCESS CAPABILITY SURVEY AND COMXCTOR
TYPE TESTS
AUSTRALIAN STANDARDS CONDUCTOR DATA
DETERMINE CONDUCTOR TEMPERATURE AND
TEMPERATURE DURATION PROFILE
SPAN AND A m DATA FOR LONGEST
ASSESSIBLE SPAN
COMPARE PROFILE VJTH KNOWN LOSS OF TENSILE
STRENGTH VERSES TEMPERATURE CURVES
ESTABLISH CONTINUE MONITORING
DETERMINE LOSS OF TENSILE STRENGTH CATENARY CONSTANT
FOR CONDUCTOR TEMPERATURE
NO YES
DETERMINE CONDUCTOR SAG
REMOVE JUMPER CONNECTION FROM
SERVICE
YES
NO
NO
REMOVE 100m TEST SPECIMEN FOR BL TEST
NO /CONFIRMS (LOSS OF TENSILE;
.STRENGTH,
DETERMINE INFRINGEMENT OF SAFETY FACTORS
FIGURE 3.37 METHODOLOGY FOR TESTING OF AGED CONDUCTORS =VNNEALING OF ALUMINIUM WIRES

269
3.6.4 Creep
Various stages of conductor creep have previously discussed and
considering the operating teraperatures typically used by supply
authorities creep rupture is considered unlikely.
Like fatigue, conductor creep requires a design philosophy and
four methods are given in Section 3.4.2.3-
The results of long terra conductor creep is an increasing sag
with tirae. In the event of inadequate creep corapensation,
statutory ground clearance will be infringed.
A raethodology for testing for the effects of conductor creep and
statutory ground clearance infringements is given in Table 3.38.
The methods used to raeasure conductor sag have previously been
given in Chapter 2.
3.6.5 Electrical
Insulation co-ordination designs of a power systera as far as
econoraically reasonable are based on rainimising the effects of
over-voltages. However, over-voltage transients such as direct
lightning strikes, interphase conductor clashing and insulator
flashovers raay result in the daraage of conductors. The daraage of
the conductor is the destructive power of electric arcs which
generate high localised teraperatures that vapourise conductor
raaterials.

"
MONITOR AT t 2
i
SPAN AND A.H.D. DATA FOR LONGEST ACCESSIBLE SPAN
"
ESTABLISH
"
CATENARY CONSTANT FDR
"
DETERMINE CONDUCTOR LENGTH
' ' ESTABLISH CREEP
AND
PLOT l i t V'8 f
' '
EXTRAPOLATE FOR t TO PREDICT EROUND CLEARANCE CHANGE
' '
NO
YES
REMOVE IOOB
SAMPLE OF CONDUCTOR
METHODOLOGY FOR STRESS
DISTRIBUTION CHANGES
270
FIGURE 3.38 METHODOLOGY FOR TESTING CREEP IN AGED CONDUCTORS

271
Evidence of such daraage is the pitting and deposit of arc
products and discolouration of the conductor. The effect of this
degradation is the reduction of cross sectional area, localised
annealing, wire breaks and even conductor failure.
Reraedial action depends on the nature and extent of the daraage
and raay range frora the application of repair rods to the
replacement of the daraaged sections of conductor.
3.6.6 Mechanical
Degradation due to a raechanical source resulting in the failure
of the conductor is generally attributed to flying objects coming
in contact with the conductor. In rare circumstances, structure
or foundation failure raay be attributed to conductor failure.
In this situations the conductor is likely to sustain
considerable raechanical damage and may even fail. Depending on
the magnitude of the forces of the failure, necking daraage raay
have occurred in the affected section of conductor. This
effective cross sectional area reduction will reduce the
raechanical integrity of the transmission line, consequently it is
considered prudent to replace the affected sections of conductor.

272
3.6.7 Stress Distribution Degradation
With time, the stress distribution of the alurainiura and steel
wires in an ACSR construction changes. At high transient
raechanical loads the alurainium wires will permanently elongate at
a greater rate than the steel wires. When the transient
mechanical load is removed, the aluminium wires can be longer
than that of the steel thus the conductor will not share the
applied stress appropriately. Accordingly, the steel wires raay
be in a situation of being overloaded even though the conductor
ultimate tensile strength has not been degraded.
The advantage of such changes occuring is the resultant
coefficient of therraal expansion being two thirds that of the
ACSR construction at high teraperature and corresponding low
stress levels. In other words, the ACSR construction develops a
coefficient of thermal expansion of steel because the steel is
the only component that is mechanically loaded.
Unfortunately, to assess for stress distribution changes with
tirae one needs to have bench raark values of critical strain and
stress deterrained frora of stress strain test. Manufacturing
standards do not require the publication of stress strain data
other than the modulus of elasticity of the composite and the
components. Consequently this information is generally not
available.

273
The only measure available to determine suspected stress
distribution change is the coefficient of linear expansion test
at a load corresponding to the rainiraura tension of raaxiraura design
temperature condition. Coefficient of linear expansion results
should be sirailar to that deterrained by equation (3.33). It
would seera prudent at the sarae tirae to carry out a stress strain
test to establish a data base of critical stresses and strains.
Conductor sarapling techniques have previously been described in
section 3.2. It is eraphasised that without proper sarapling
techniques, incorrect results will result as indicated in the
Tomago to Taree transraission line conductor saraple.
A raethodology for testing for the effects of stress distribution
changes is given in Figure 3.39.
3.7 CONCLUSION
A transraission line conductor having nuraerous span lengths, passing
through varying topography, with raechanically siraple but raatheraatically
coraplex suspension and tension supports and exposed to the excursions of
climates from low velocity winds inducing aeolian vibration to destructive
winds and bushfires truly represents a coraplex physical and raatheraatical
problera. In addition, the transraission line represents a large structural
systera incorporating conductors with a wide range of material behaviour
that includes such as corrosion, annealing, fatigue and creep. In

274
REMOVE 100m TEST SPECIMEN FOR TESTS
COEFFICIENT OF LINEAR EXPANSION TEST
AT MINIMUM WORKING CONDUCTOR TENSION
STRESS STRAIN TEST
STRESS DISTRIBUTION CALCULATIONS
DETERMINE WIRE SAFETY FACTORS
FIGURE 3.39 METHODOLOGY FOR TESTING STRESS DISTRIBUTION CHANGES IN AGED CONDUCTORS

275
particular in an ACSR construction, the stress in the alurainiura wires
decreases due to tirae dependent creep, inducing stress changes frora the
alurainiura to the steel coraponents.
It is these raaterial properties and behavioural changes with time that are
assessed for the degradation deterraination and the continued
serviceability of aged conductors. Such deterioration assessments are
carried out in several steps commencing with the raost important stage,
sampling.
When choosing the site for the subsequent reraoval of transraission line
conductor sample, one must decide on a location that is representative of
the exposures to the extremes of pollution and frequent low velocity
winds. Topography and cliraatic conditions will also have a major
influence on the degradation of conductor and must be included in the
sampling criteria.
If it is necessary to remove other than a jumper connection, proper care
must be taken to insure no wire relative raoveraents take place prior to the
cutting of the conductor. Satisfactory raethods of conductor removal have
been developed and described herein to ensure such movements are
minimised.
Once the conductor sample is available the difficulty in assessing for the
degradation of the aged conductor commences when an acceptance criteria is
established. With early raanufactured conductors the acceptance criteria
is the appropriate raanufacturing standard. In tirae, a data base of test

276
results will replace this acceptance criteria for old conductors.
Conductors raanufactured after the raid 80's will employ process capability
studies as the acceptance criteria.
For wire tests the criteria is readily available and a raethodology for
assessing degradation by the raechanisras of corrosion, fatigue and
annealing has been discussed and contained herein. It is unlikely that
conductors with operating teraperatures of less than 80°C will incur
annealing. Furtherraore, conductors exposed to light pollution levels are
not likely to deteriorate by corrosion.
Unfortunately, unlike wire data, actual conductor data other than
theoretical predictions is generally not available. However test
procedures have been developed herein to provide sufficient inforraation to
assess the level of degradation caused by annealing, wire stress
redistribution and creep of aged conductors.
In the future, as supply authorities operate conductors at the excursions
of their raechanical properties sorae deraand will be placed on establishing
actual conductor pararaeters. Conductor criteria such as stress strain,
coefficient of linear expansion, creep, fatigue and breaking load
inforraation will become available allowing for accurate aged conductor
degradation assessments.
Creep and fatigue raechanisras of conductor degradation need to be treated
as design pararaeters rather than allowing with time a level of acceptable
degradation to occur. Conductor creep testing facilities are available
which permit predications of long term inelastic stretch and the necessary
allowances. Differences between CIGRE predictor equations and actual
277
creep results are considerable placing emphasis on the need for actual
conductor creep tests.
As a direct result of these studies, conductor fatigue testing facilities
are now available and in the future fatigue curves (S-N) will become
available. This will enable known fatigue endurance designs to be
implemented.
These degradation free design philosophies aside, it is considered prudent
to examine conductor samples and transraission line spans for evidence of
fatigue and creep respectively. Favourable results are reassuring and a
measure of successful design practises.
A summary of the degradation mechanisms and assessment for aged conductors
is given in Figure 3.40.
Life expectancy raodels developed are simple in nature and in some
instances require routine annual inspections to provide assurance of the
continued serviceability and integrity of the conductor. Such
inspections are useful because of the complex nature of a conductor,
deterioration rates raay in sorae circurastances be indeterrainate and
unpredictable.
3.7.1 Avon to Kemps Creek Transmission Line
The conductor saraple tested being representative of a low
pollution, environraent suggested no degradation of corrosion
resistance and the strength of the conductor and wire stress
distribution were satisfactory. Sag raeasureraents revealed no

273
DEGRADATION
MECHANISM
MATERIAL
CORROSION
STEEL WIRE
ALUMINIUM WIRE
GREASE
ASSESSMENT
ZINC LOSS
SA^fLE EXAMINATIONS
WIRE BREAKING LOAD
SAffLE EXAMINATIONS
•WIRE BREAKING LOAD
DROP POINT
MASS
ANNEALING ALUMINIUM WIRES
WIRE BREAKING LOAD
CONDUCTOR SAG €ASUREMENTS
CONDUCTOR BREAKING LOAD
FATIGUE
STRESS DISTRIBUTION
CHANGES
ALUMINIUM WIRES
C0rf»OSITE CONDUCTOR
SEM SAMPLE EXAMINATIONS
-WIRE BREAKING LOAD
COEFFICIENT OF LINEAR EXPANSION TEST
CREEP COMPOSITE CONDUCTOR CONDUCTOR SAG rtASUREMENTS
FIGURE 3.40 SUMMARY OF DEGRADATION MECHANISMS AND MENT PROCEDURES FOR AGED CONDUCTORS

279
significant evidence of creep deforraation and wire sample
examination concluded that there was miniraal fretting daraage and
there was no fatigue crack initiation.
The drop point of the grease dictated that the operating
teraperature of the transraission line should be restricted to
60 C. A risk of loss of grease and accelerated corrosion raay
occur if operation in excess of 60 C is necessary.
Accordingly, if curaulative fatigue daraage is miniraal then it is
expected that the transraission line conductor will reraain
serviceable for a further 24 years for sirailar operating
conditions and pollution environraents.
3.7.2 Dapto to Springhill Transraission Line
The conductor saraple tested being representative of pollution
environraent suggested no degradation of corrosion resistance and
the strength of the conductor and wire stress distribution were
satisfactory. Sag raeasureraents revealed no significant evidence
of creep deforraation and wire saraple exaraination concluded that
there was rainiraal fretting daraage and there was no fatigue crack
initiation.
The drop point of the grease dictated that the operating
teraperature of the transraission line should be restricted to
60°C. A risk of loss of grease and accelerated corrosion raay
occur if operation in excess of 60 C is necessary.
280
Accordingly, if cumulative fatigue daraage is rainiraal then it is
expected that the transraission line conductor will reraain
serviceable for a further 24 years base on sirailar operating
conditions and pollution environraent.
3.7.3 Toraago to Taree Transraission Line
Additional sarapling and testing is necessary to allow raore
conclusive coefficient of linear expansion and breaking load test
to be carried out. On the basis that the location of the
sarapling was unknown, one cannot assess whether the saraple
condition is representative of the extreraes of pollution. In the
absence of further tests it is concluded that:
(i) the breaking load is 83.3 kN a mechanical derating of 6.6%;
(ii) the coefficient of linear expansion for tensions less than
19.2 kN is 12.6 x 10" .C"-*-;
(iii) the conductor therraal rating be restricted to 70 C. A risk
of loss of tar and accelerated corrosion may occur if
operation in excess of 70 C is necessary; and
(iv) routine annual inspection policy be implemented.
Wire sample exaraination concluded that there was miniraal fretting
daraage and there was no fatigue crack initiation. Accordingly,
if cumulative fatigue daraage is rainiraal then it is expected the
transraission line will reraain serviceable for a further 6 years

281
base as sirailar operating conditions and pollution environments.
After 6 years further additional sampling is necessary to provide
reassurance of the continued serviceability of the conductor.
3.7.4 Bellarabi to Heathcote Transraission Line
Additional sarapling and testing is necessary to allow raore
conclusive coefficient of linear expansion and breaking load
tests to be carried out. On the basis that the location of the
sampling was unknown, one cannot assess whether the saraple
condition is representative of the extreraes of pollution. In the
absence of further tests it is concluded that:
(i) the a coraposite breaking load test will probably not raeet
the rainiraura criteria. Accordingly, the conductor requires
raechanical derating; and
(ii) the conductor therraal rating be restricted to 65 C. A risk
of loss of tar and accelerated corrosion raay occur if
operation in excess of 70 C is necessary.
Exaraination for wire fretting was not carried out since the
conductor sample was a jumper connection not subjected to aeolian
vibration inducing fatigue.
CHAPTER FOUR
TRANSMISSION LINE CONDUCTOR FATIGUE
4.1 INTRODUCTION
Two approaches are possible when one designs for conductor fatigue and the
appropriate conductor static and dynaraic stress levels. The first
approach is the fatigue free philosophy where conductor stress levels are
restricted to give a predicted infinite conductor life and the second
approach, is a cumulative daraage approach were conductor stress levels are
generally higher than the fatigue free philosophy, however known sustained
fatigue daraage occurs that will result in conductors having a finite life.
Both design philosophies require a knowledge of the conductor strength or
fatigue characteristics known as S-N curves. In addition, the curaulative
daraage approach requires a knowledge of the stress or load history and a
suitable curaulative daraage theory.
In the past, the accepted design practise for fatigue endurance assuraes an
every day tension (EDT) of a conductor at approxiraately 20% of calculated
breaking load. Limited conductor fatigue data available frora overseas
sources suggests the fatigue free lirait of alurainiura is approxiraately
30-40 MPa while other researchers (23) claim, a non asymptotic behaviour
because of the influence of wire fretting. Further to this situation, no
conductor fatigue tests have been carried out in Australia on conductors
manufactured to Australian Standards.
283
Accordingly it is now appropriate to review the conductor every day stress
design philosophies and initiate a conductor fatigue testing program for
Australian raanufactured conductors. The objective of these studies is as
follows:
1. Examine the available conductor vibration theory;
2. Design and commission a conductor fatigue testing apparatus;
3. Initiate a conductor fatigue testing program which will enable an
understanding of the effects of alloying alurainiura on the fatigue
lirait of electrical grade alurainiura; and
4. Investigate the effects of conductor fittings on the conductor
S-N curves.
4.2 FUNDAMENTAL CONDUCTOR VIBRATION THEORY
4.2.1 Aeolian Vibration
When a constant velocity wind passes across a transmission line
conductor under tension, vortices are detached at regular and
alternating intervals from the top and bottora sides of the
conductor. The rate of detachraent of the vortices is a function
of the wind velocity and each detachraent is associated with a
sraall vertical force induced into the conductor.

284
Experience has shown that conductor vibration is generated with
winds having larainar flow with velocities between 0.5 ra.s"'^ to
7.0 m.s . Wind velocities below this regime do not have
sufficient energy to produce vortex shedding and induce an
alternating forces. Wind velocities above 7.0 m.s" are
generally turbulent in nature and do not produced the periodic
vortex shedding.
The behaviour of the air flowing past a cylinder changes with the
Reynolds number. The corresponding Strouhal nuraber that covers
the regime of vibration inducing wind velocities and conductor
diameters is 0.185 (79). The Strouhal nuraber is a diraensionless
nuraber that relates the raediura velocity, cylinder diaraeter and
vortex frequency or in the case of a transraission line, wind
velocity, conductor velocity and vibration frequency
respectively. The Strouhal nuraber is given by the equation.
fd
S = (4.1)
When Stroudal equation is rearranged with S = 0.185, the
frequency of conductor vibration is given as.
V
f = 0.185 (4.2) d c
285
Accordingly for large conductors and low wind velocities, low
frequencies are produced, however the highest frequencies of
vibration exist in sraall conductors at relatively high wind
velocities. This relationship is illustrated in Figure 4.1 for
various wind velocities.
In the case of a transmission line span with negligible damping
at the support points, the vibrations will take the forra of a
standing wave with fixed nodes. Assuraing the conductor has
negligible stiffness with regard to the vibration loop length.and
the effect of variations in tension in a span is sraall than the
loop length is given by,
L = 2f
(4.3)
ra
The behaviour of a conductor in terras of wind velocity is
predicted by substituting equation (4.2) into equation (4.3)
yielding,
2.703 (4.4)
ra

288
300
200
1
1
/-\ N X \y
D) U C (U D cr OJ L
IJL 100
\
\
Wind Uelocity 1 m/s
yind Uelocity 3 m/s
— Wind Uelocity 5 m/s
Wind Uelocity 7 m/s
10 15 20 25 30
Conductor Diameter Cmm) 35
FIG 4.1 Relationship of Ulbnation Frequency
to Conductor Diameter
287
Thus, for small conductors at high wind velocities, sraall loop
lengths are generated and for large conductors and low wind
velocities loop lengths can be greater than 10 ra. The ratios of
loop length to conductor diameter and conductor tension to
conductor mass for various wind velocities is illustrated in
Figure 4.2
4.2.2 Wind Velocity and Conductor Displacement Relationship
The dynamic stress in a conductor at the support point is a
function of the amplitude of vibration. The amplitude of
vibration of the conductor is determined from a balance of the
conductor self dissipation characteristic and the wind input
power. Interpretation of the input power and conductor
self-dissipation is given by Diana and Alcoa, published in the
Transmission Line Reference Book Wind - Induced Conductor Motion
(36) and is illustrated in Figure 4.3.
An analysis of this data by plotting the Diana prediction curve
with logarithmic logarithraic scales yields Figure 4.4 and has an
equation, derived by linear regression analysis with a
correlation coefficient of 0.9983, as
0.4865 d
f = 7.509 c
Y
(4.5)
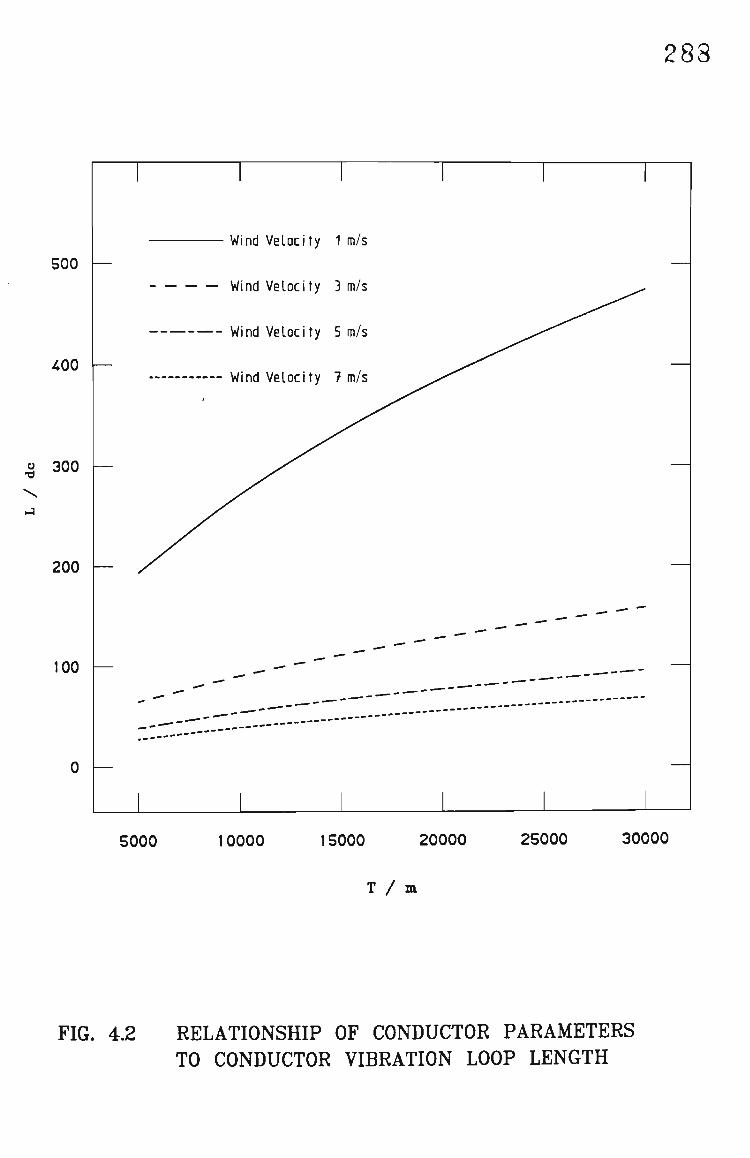
500
400
2 300
200
100
Wind Velocity 1 m/s
Wind Velocity 3 m/s
Wind Velocity 5 m/s
Wind Velocity 7 m/s
283
5000 10000 15000 20000 25000 30000
T / m
FIG. 4.2 RELATIONSHIP OF CONDUCTOR PARAMETERS TO CONDUCTOR VIBRATION LOOP LENGTH
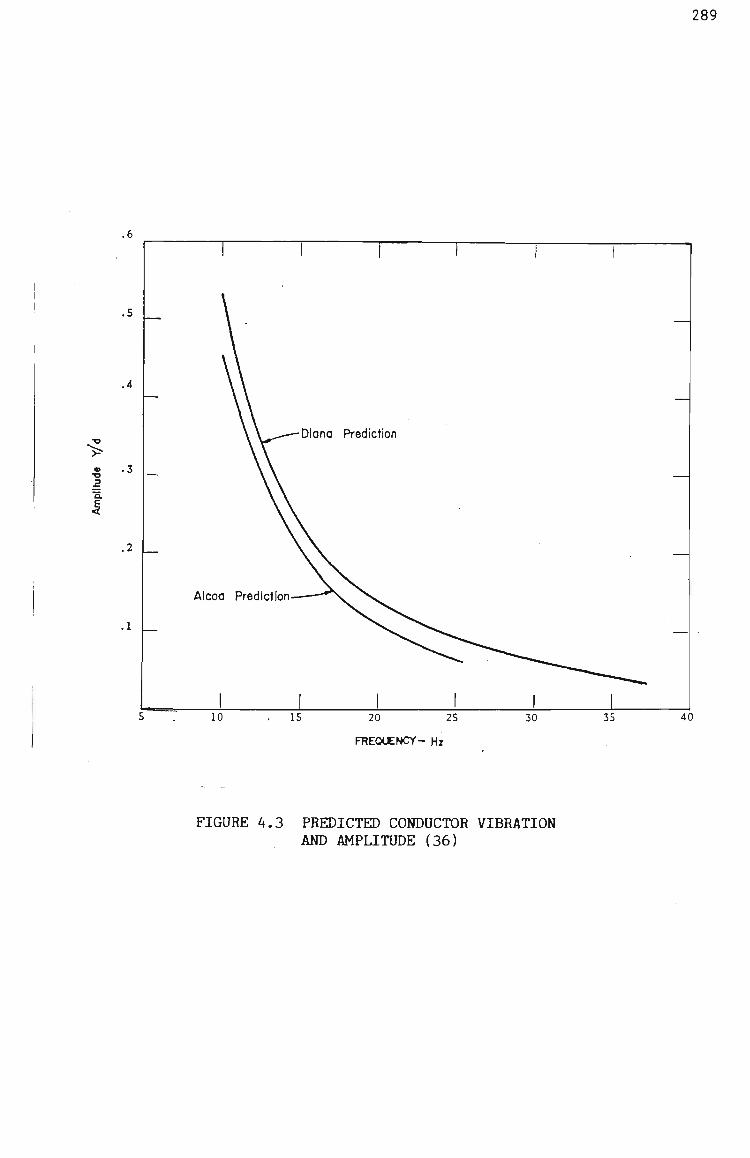
.6
289
.5
.4
. .3
OL
.2
.1
10
Alcoa Prediction
20 25
FREQUENCY- Hz
40
FIGURE 4.3 PREDICTED CONDUCTOR VIBRATION AND AMPLITUDE (36)

.70 —
.50 —
.30 —
.20
.10 — a
a V 0 u
i .07 u o
• * * u :i
8 -05
.03
.02 —
2aa
10 20 30
Frequency (hz)
40
FIG. 4 .4 DIANA FREQUENCY AND AMPLITUDE PREDICATION
291
A relationship of peak araplitude in terras of conductor diameter
and wind velocity is derived by substituting equation (4.2) into
equation (4.5) and is given as,
3.055 -2.055 Y' = 1012 d V (4.6)
c
The conductor displacement behaviour as a function of conductor
diaraeter for various wind velocities as given in equation (4.6)
is illustrated in Figure 4.5.
4.2.3 Wind Velocity and Conductor Dynamic Stress Relationship
The fatigue of alurainiura wires is generally attributed to the
dynaraic stress induced by aeolion vibration. The addition of the
static load stress to the dynaraic load stress raakes the top of
the conductor at the support point, the site raost likely to
sustain fatigue.
An equation to describe the dynaraic stress in the top wires of
the conductor at the conductor support as a function of the
conductor raid loop displacement was derived by Claren and Diana
(30) and is given as,
<T = IX d E w a
1
ra f Y' (4.7)
EI
By substitution of equations (4.2) and (4.6) into equation (4.7)
the conductor dynamic stress in terms of wind velocity is given
as,
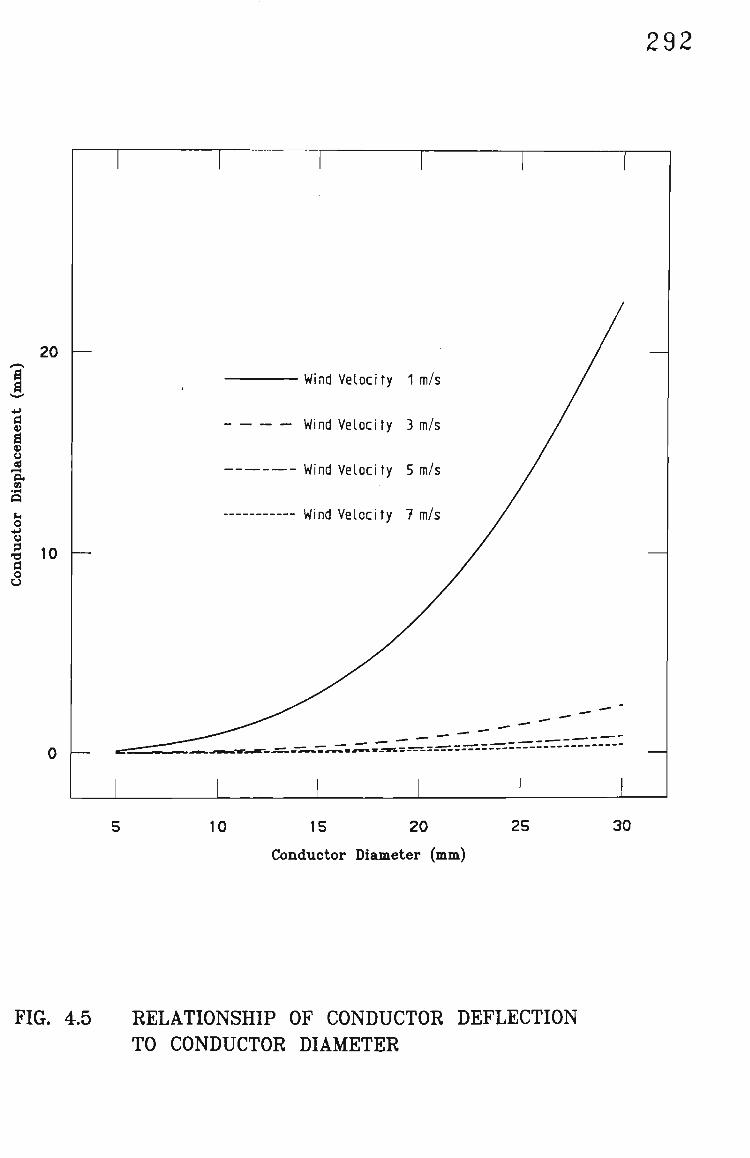
292
20
Wind Velocity 1 m/s
a V « o cd A m
hi o u ^ 10 a a
Wind Velocity 3 m/s
Wind Velocity 5 m/s
Wind Velocity 7 m/s
10 15 20
Conductor Diameter (mm)
25 30
FIG. 4.5 RELATIONSHIP OF CONDUCTOR DEFLECTION TO CONDUCTOR DIAMETER

293
a = 588 d E w a
ra 2.055 -1.055 d V (4.8)
EI c
All conductors have self daraping characteristics that vary with
size and construction pararaeters. The self clamping
characteristics of a conductor decreases as tension increases.
It is interesting to note that using the Diana predication of
Figure 4.3 to derive the dynamic stress equation (4.8), the
conductor tension is not a critical factor.
The conductor dynaraic stress is a function of the flexural
rigidity (EI) of the conductor. Two raodels raay be eraployed in
evaluating the flexual rigidity of a conductor,
1. the wires act individually and independent frora one another
with no friction between the wires; and
2. the wires act as a solid homogenous body.
In practise the conductor behaviour will vary within these models
for a given span. At the suspension site the conductor will act
as a homogenous body and the flexural rigidity will be a minimura.
Away frora the suspension site the wires have two degrees of
freedora longitudinal and radially, hence the wires will act
individually and the flexural rigidity will be at a maxiraura.

294
A coraparison of calculated values with experimental values given
by Gopolan (45) suggests that an appropriate value of half the
raaxiraura flexural rigidity should be eraployed for designs at the
suspension site.
The minimura flexural rigidity for an ACSR construction is given
as.
EI = n E
iid
rain s s 64
nd
+ n E a a 64
(4.9)
and the raaxiraum flexural rigidity is given as,
EI max
N i
Z 3=1
n ra Jid
ij ij r p
. i=l j 8
IJ
8 + r
ij
(4.10)
Typical values of flexural rigidity of transraission line
conductors are given in Table 4.1.
Conductor
Code Narae
Grape Leraon Lirae Mango Orange Olive
Stranding
30/7/2.50 30/7/3.00 30/7/3.50 54/7/3.00 54/7/3.25 54/7/3.50
Flexural (N
rain
6.50 13.50 25.0 20.0 27.5 37.0
Rjgidity ra )
raax
243 505 935 1340 1850 2490
TABLE 4.1 - TRANSMISSION LINE CONDUCTOR FLEXURAL RIGIDITY

295
4.2.4 Conductor Displaceraent and Dynaraic Stress Relationship.
In contrast to the design dynaraic stress equation (4.8) in terras
of wind velocity, Poffenberger and Swart (67) derived an equation
which relates conductor displaceraent adjacent to the conductor
support to the conductor stress. This relationship is used in
conjunction with displaceraent transducers fitted to the
suspension point to record conductor deflection.
The dynamic stress in the top surface of the conductor at the
suspension point as a result of deflection y at A distance frora
the suspension point is given as.
1000 y d E a c a
<T =
d • -A/j
e - 1 + A/j
(4.11)
2j
where J = EI/T (4.12)
The international accepted distance A is 3 1/2 inches or 89 rara.
Equation 4.11 is used to deterraine the conductor dynaraic stress
for all fatigue tests results given in Appendix 4.
296
4.2.5 Conductor Static Load Stresses
The conductor static load stress consists of two coraponents, the
stringing stress and the bending stress over the suspension
clamp.
The alurainiura wire stringing stress is siraply given as,
A E a a
CT = a (4.13) a A E
c c
and the bending stress over the suspension clarap (35) is given
as,
E c a
ff = (4.14) b R
The bending stress is a function of the inverse of the conductor
radius. Thus if the radius is sraall the resultant bending stress
is large. An overall interpretation of equations (4.13) and
(4.14) suggests that as conductor tension is increased, the raean
stringing stress increases however the bending stress decreases.
Such net effects have been revealed in fatigue test results (34)
and described as.
"the level of tension in the conductor seeras to have little effect upon the S-N relationship given the conductor and its supporting clarap."

297
4.3 FATIGUE CHARACTERISTICS OF CONDUCTORS
4.3.1 Fatigue Properties of Aluraini ura
In high purity forra, the alurainiura is a soft and durabile
material and is generally classified by two raain groups of
raanufacturing process, wrought and cast. In the coramercially
pure form aluminium has a tensile strength of approximately 90
MPa (2).
Several raetallurgical factors contribute to the overall strength
of fully annealed alurainiura. These include solid solutions
hardening, cold working and precipitation hardening.
Three alurainium and aluminium alloy parent materials are used to
manufacture conductors namely 1350, 1120 and 6201A. The cheraical
coraposition of the alurainium and aluminium alloys is given in
Table 3.18.
Alurainiura 1350 is the electrical grade alurainiura characterised by
excellent corrosion, resistance, high thermal and electrical
conductivity, low mechanical properties and excellent work
ability. The conductivity of alurainiura 1350 is 61.0% lACS, the
ultimate tensile strength is in the range of 159-188 MPa and
maximum resistivity of 0.0283 u-m (53).

298
Alurainiura alloy 1120 is a relatively high purity alurainiura alloy
containing sraall additions of copper and raagnesiura and has
sirailar properties of 1350 alurainiura. The conductivity of
alurainiura alloy 1120 is 59.0% lACS, the ultiraate tensile strength
is in the range of 230-250 MPa and raaxiraura resistivity of 0.0293
y.ra (53).
Lastly, alurainiura alloy 6201A contain sraall additions of silicon
and raagnesiura which enables heat treatraent, while precipitation
hardening is achieved by a corabination of cold working and heat
treatraent. The raagnesiura silicon alloys possess good forraability
and corrosion resistance with medium strength and electrical
properties. The conductivity of 6201A alurainiura alloy is 52.6%
lACS, the ultiraate tensile strength is of the order of 315-325
MPa and raaxiraura resistivity of 0.0328 u.ra (53).
Fatigue endurance is related to tensile strength suggesting that
the alurainiura alloys have better fatigue characteristics than the
electrical grade alurainiura. Fatigue curves for coraraercially pure
alurainiura tend to be asyraptotic and the Electric Power Research
Institute (35) suggested that,
"in general, it raay be said that for heat treatable alloys a fatigue lirait is doubtful; whereas, for non-heat-treatable alloys there is possibly a definite fatigue lirait."
299
The fatigue lirait of alurainiura is expressed as the fatigue
g
Strength at 5x10 cycles. In addition, the fatigue ratio (ratio
of fatigue strength to ultiraate strength) for 1350 and 1120
alurainiura lies between 0.45 and 0.60.
However this fatigue ratio has to be addressed in the context of
the conductor fatigue raechanisra.
4.3.2 Conductor Fatigue Mechanism
It is generally accepted that any fatigue raechanisra consists of
two stages, crack nucleation and crack propogation.
The probability of the crack nucleation depends on the
corabination of stress and strength factors. The stress factors
are the presence of stress concentration, teraperature and stress
corabinations. The strength factors are the grain size effects,
surface finish and notch effects.
In a conductor the' process of crack nucleation is influenced by
the repetitive dynaraic stress action on the alurainiura wires and
the fatigue characteristics of alurainiura.
It has been previously discussed that a constant wind velocity
passing over the conductor induces an alternating vertical raotion
in the conductor. The norraal mode shape for other than at the
support locations is approxiraately a sine wave. At the
support locations, due to the partial rigidity of the conductor,
distortion of the raode shape occurs. The addition of the bending
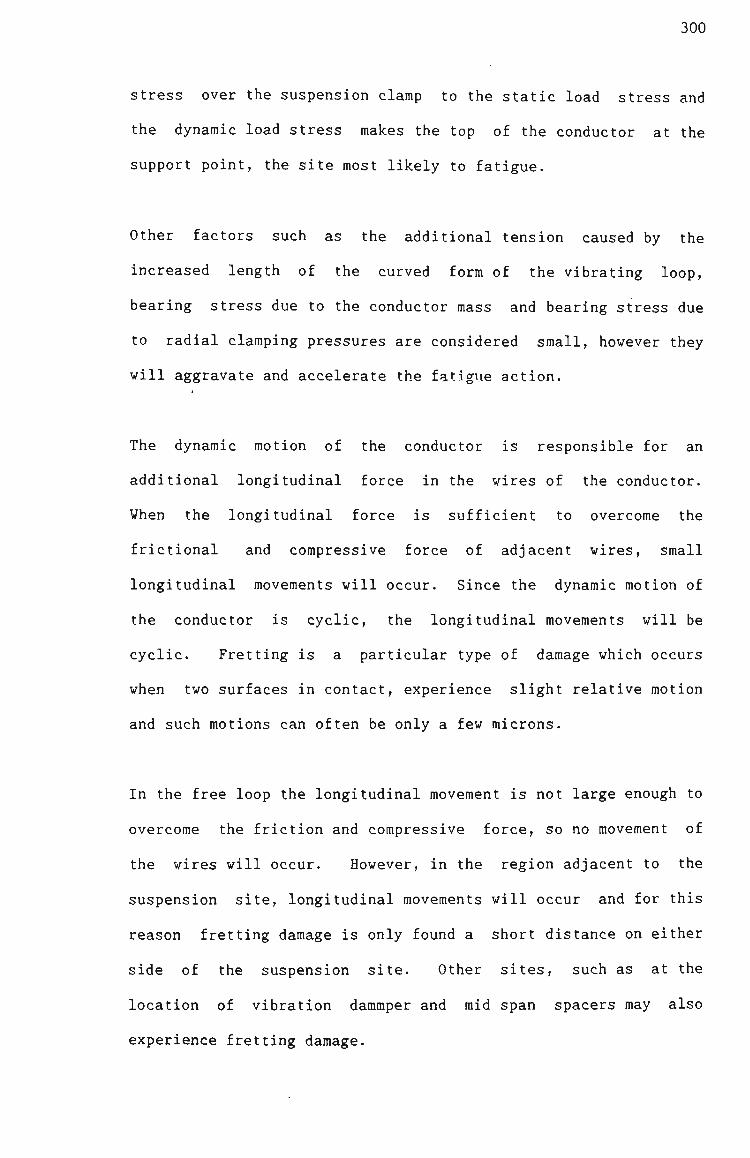
300
stress over the suspension clamp to the static load stress and
the dynamic load stress makes the top of the conductor at the
support point, the site raost likely to fatigue.
Other factors such as the additional tension caused by the
increased length of the curved forra of the vibrating loop,
bearing stress due to the conductor raass and bearing stress due
to radial claraping pressures are considered small, however they
will aggravate and accelerate the fatigue action.
The dynaraic raotion of the conductor is responsible for an
additional longitudinal force in the wires of the conductor.
When the longitudinal force is sufficient to overcome the
frictional and corapressive force of adjacent wires, sraall
longitudinal raoveraents will occur. Since the dynaraic motion of
the conductor is cyclic, the longitudinal raoveraents will be
cyclic. Fretting is a particular type of daraage which occurs
when two surfaces in contact, experience slight relative motion
and such motions can often be only a few microns.
In the free loop the longitudinal movement is not large enough to
overcome the friction and compressive force, so no moveraent of
the wires will occur. However, in the region adjacent to the
suspension site, longitudinal movements will occur and for this
reason fretting daraage is only found a short distance on either
side of the suspension site. Other sites, such as at the
location of vibration dammper and raid span spacers raay also
experience fretting damage.
301
Rawlins and Ficke (41) suggested that the fretting occurs in a
series of stages,
"In the first stage, surface oxide films are disrupted and bare raetal rubs against bare raetal. Minute projections from one metal surface becorae welded to sirailar asperities of the other raetal surface. When the two metal surfaces raove relative to each other, the weld junctions are broken. Because the tips of the asperities had been distorted before the welds were established, however, they were work-hardened and are soraewhat stronger than the bulk raaterial. The welds break, therefore, not at the weld injunction itself, but slightly back from the junction. Metal is transferred frora one surface to another.
Continued welding and breaking-off of asperities between raating parts leads to transfer of the raaterial alternately frora one surface to the other. Gradually, a layer is built up on the raaterial surface coraposed of the reranants of the asperities which have been passed back and forth."
A by product of the fretting action is the iraraediate replaceraent
of newly exposed alurainiura surface with a fresh coating of
alurainiura oxide. This alurainiura oxide is harder than the parent
raaterial and will probably accelerate the fretting action.
Further fretting will dislodge the alurainiura oxide and evidence
of fretting fatigue is quite often indicated by the accuraulation
of alurainiura oxide (black powder) in the region of the suspension
point.
Classical wire fretting is illustrated in Plate 4.1 for Neptune
19/3.25 AAC construction.

302
PLATE 4.1 FRETTING FATIGUE 19/3.25 AAC CONSTRUCTION

303
The cyclic action of the wires on the microscopic cracks will
cause
"highly localised plastic deformation at the crack tips. If the fatigue deforraation becoraes large enough, a fatigue crack raay nucleate and eventually propogate throughout the wire". (35)
The raulitple initiation of fatigue cracks in the fretted areas
and propogation at 45 to the stress axis is coraraon feature of
fretting fatigue. This is illustrated in Plate 4.2 and
previously illustrated in Plate 3.7.
The action of wire fretting has a significant irapact on fatigue
curves and this illustrated in Figure 4.6 (29).
Unfortunately little quantitiative inforraation is available on
the relative duration of crack nucleation and crack propogation.
However, prediction of wire failure can be achieved by a
curaulative damage theory.
4.3.3 Curaulative Daraage Theory
Several curaulative daraage theories are available and raost
theories generally assurae that,
1. Operation at any given cyclic stress araplitude will produce
fatigue daraage;
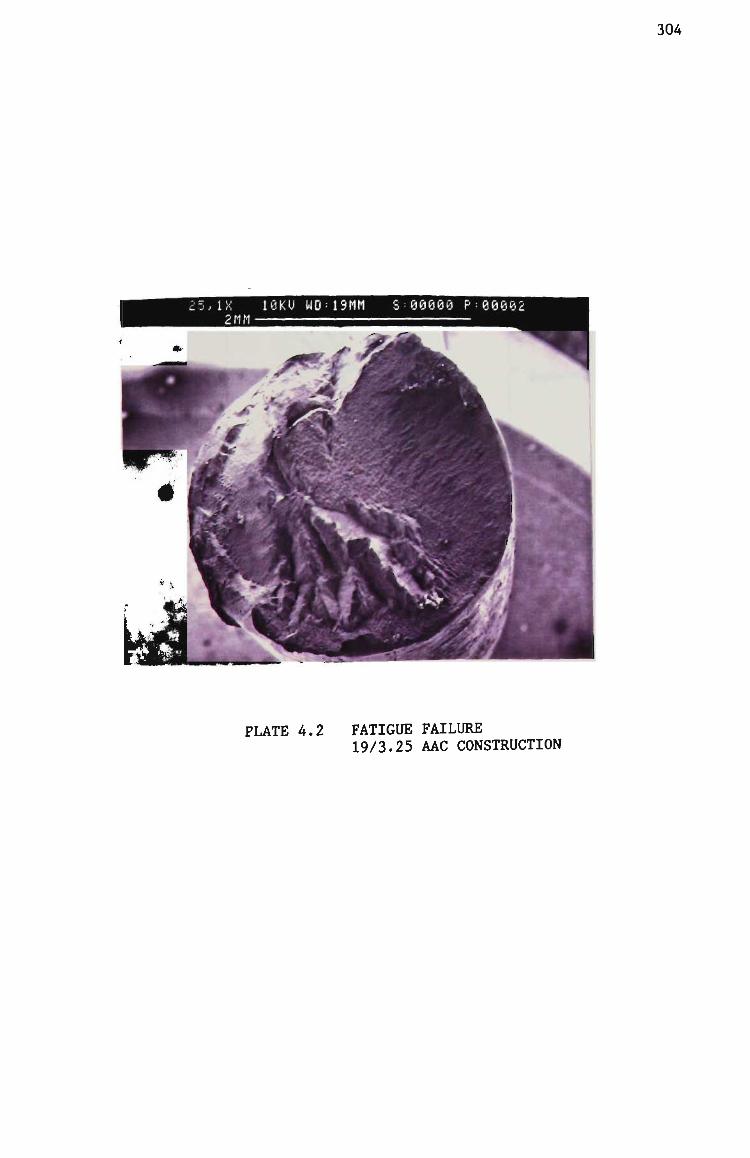
304
i , I X 1 0 K U W0= 19riM 2 r i M -
00000 P:00002
PLATE 4.2 FATIGUE FAILURE 19/3.25 AAC CONSTRUCTION
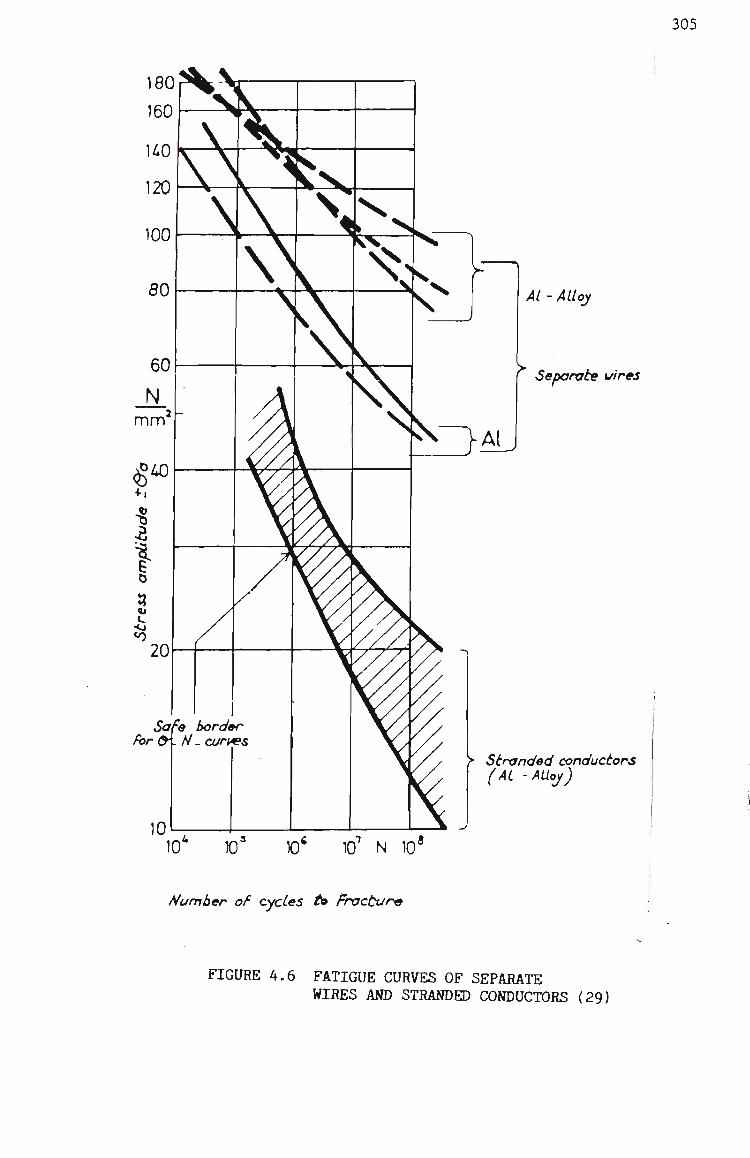
305
Al - Alloy
^ Separate vires
> Stranded conductors (AL - Aiioj)
10'' ra' X)* 10*' N 10*
Number oF cycles i» Fracture
FIGURE 4.6 FATIGUE CURVES OF SEPARATE WIRES AND STRANDED CONDUCTORS (29)
306
2. Daraage incurred is perraanent; and
3. Exposure to several differing stress levels will result in
an accumulation of total damage equal to the sum of the
daraage increments accrued at each individual stress level.
Miner's curaulative daraage theory (58) has been shown to be a
valid cumulative fatigue daraage model for conductor fatigue tests
carried out as part of EPRI's research efforts (35).
Miner's theory is illustrated in Figure 4.7 and is siraply given
as
n 1
N 1
+
n 2
N 2
. . +
n n
_^_^ N
n
= 1 (4.15)
In addition to the previous raentioned assuraptions. Miner followed
four additional assuraptions to validate the theory,
1. the loading cycle is sinusoidal;
2. the total amount of work that can be absorbed produces
failure (that is no work hardening occurs);
3. the relationship between various stress ratios is
approxiraately as described by the modified-Goodman
relationship and S-N experimental work;

307
STRESS
S 1
2
\ ^ S-N CURVE
n,
y \
. " 2
^FAILURE
-
N. N. N CYCLES
FIGURE 4.7 MINERS CUMULATIVE DAMAGE THEORY

308
4. the inception of a crack when observed is considered to
constitute a failure.
The later assumption is difficult to detect in a conductor
fatigue test because of the very nature of the test and the
saraple. This implies that for a conductor the sura of curaulative
damage is likely to be greater than one.
In addition some evidence exists (35) that the load sequence can
affect the life predications by the Miner's Theory.
4.3 FATIGUE TESTS
The primary objective of this part of the study was to design and
Coraraission a conductor fatigue test apparatus that would induce aeolian
vibration standing waves into conductor saraples.
4.3.1 Test Apparatus
The test apparatus consists of 15 metres bench manufactured frora
a redundant overhead crane I steel section. At each end of the
bench a pulley arrangeraent provides a mechanical connection
between the conductor sample and an adjustable static mass. The
static mass provides the conductor static tension. The static
raass consists of a fixed steel raass of approxiraately 250 kg and
adjustable mass of up to 1000 kg. The adjustable raass generally
consists of a corabination of sand and water. Plates 4.3

309
PLATE 4.3 GENERAL ARRANGEMENT OF CONDUCTOR FATIGUE TESTER

310
illustrates the general arrangeraent of the fatigue test apparatus
and the static raass arrangeraent.
Mounted on the bench is two raoveable conductor terraination blocks
and a raovable conductor raechanical actuator.
The conductor terraination block is in two parts that perraits
disasserably to allow conductor samples to be loaded and unloaded
frora the test bench. To prevent raetal to raetal contract, nylon
sleeves are used as means of mechanically insulating the
conductor saraple and the terraination block. The conductor
terraination arrangeraent is illustrated in Plate 4.4.
A sirailar arrangeraent of raechanically insulating the conductor is
used at the mechanical actuator. The raechanical actuator
consists of a 1 kV 3 phase raotor, a five speed adjustable pulley,
an offset cara, a drive shaft and a yoke plate raounted on linear
bearings. Like the terraination block, the yoke plate is in two
parts that perraits loading and unloading of conductor saraples.
The conductor mechanical actuator is illustrated in Plate 4.5.
In addition to the speed adjustable pulley an electronic speed
controller allows precise vibration frequency settings in the
range of 1 Hz to 50 Hz.

311
PLATE 4.4 CONDUCTOR TERMINATION BLOCK AND STATIC STRESS STRAIN GAUGE ARRANGEMENT
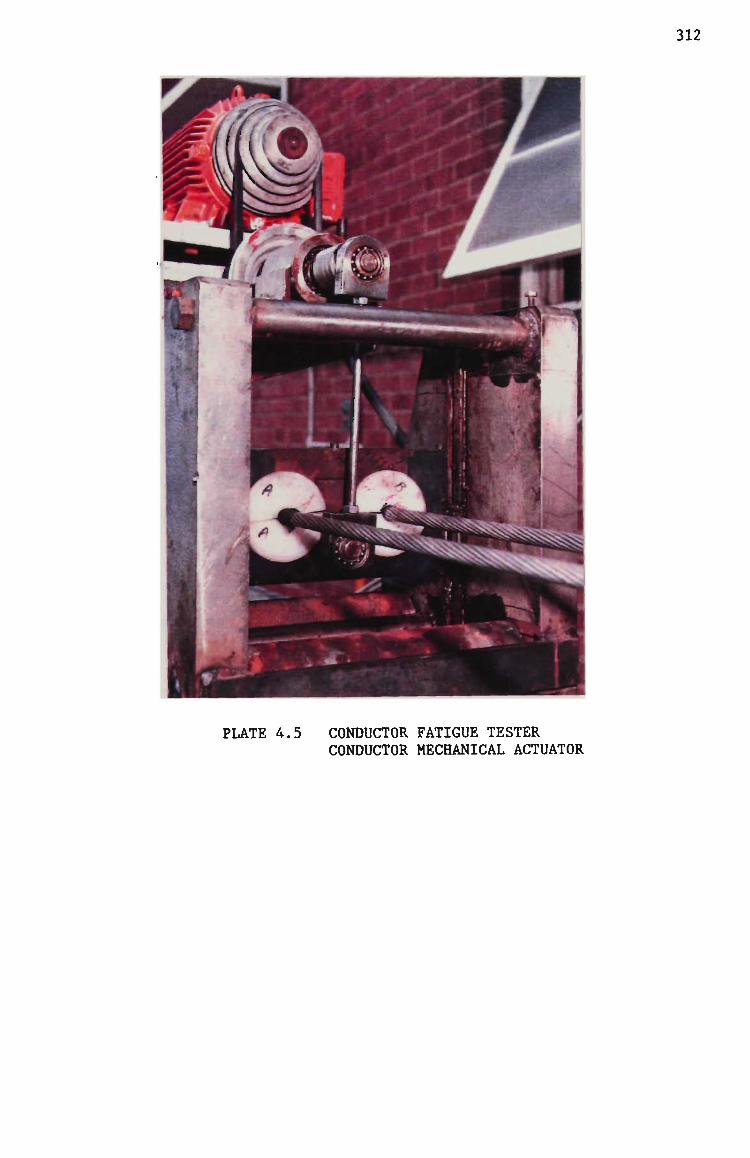
312
PLATE 4.5 CONDUCTOR FATIGUE TESTER CONDUCTOR MECHANICAL ACTUATOR
313
Conductor standing wave deflection is controlled by precisely
locating the terraination blocks and the raechanical actuator.
Further adjustments of offset cara and vibration frequency also
allows accurate deflection control.
4.3.2 Instruraentation
4.3.2.1 Wire Break Detection
The wire detection systera was designed to perforra two critical
functions, detect breaks of wires without test interruption and
provide a reference tirae of each break, hence the nuraber of
cycles to each break.
Resolving the tensile force in the conductor results in three
coraponents, the tensile force in the wire, the force vertical to
the axis and the force producing torque around the axis. These
forces are illustrated in Figure 4.8. The torque on the wire at
radius r is given as,
M = T r = T r sin 9 cos 9 (4.16) 4
or in terms of individual stresses on the wire assuming the
siraple homogeneous conductor case (that is T = a a ) is given
as.
M = a a r sin 9 cos 9 (4.17) c

314
T
M
FIGURE 4.8 CONDUCTOR ROTATING TORQUE

315
For a multi-layer homogenous conductor with successive layers
having differing lay directions and assuming a uniforra stress
distribution in the wires, the rotating torque is given as,
n n
i j M = Z <T N a r sin 9 cos Q - Z cr N a r sin 9 cos 9 (4.18)
i=l i i i i i i j=l J J J J J j
In the event of a wire break a change of rotating torque occurs.
The direction of the change of rotating torque is dependent on
the layer in which a wire breaks. It is this directional change
that is detected via a raoraent arra located at node point and
sensitive detection raicroswitches. The state of the
raicroswitches is detected by TTL logic via an online datataker.
The wire break detection arrangeraent is illustated in Plate 4.6.
4.3.2.2 Conductor Araplitude Detection
To determine the conductor dynamic stress from either equation
(4.7) or (4.11) it is necessary to raeasure the conductor
araplitude at the appropriate location applicable to the equation.
Initially the conductor araplitude was deterrained using an
acceleroraeter. However this raethod was discounted as expensive
and unneccessarily coraplicated. Siraply V-scopes were developed
that enable conductor rainimura peak to peak deflections of 100 ym
to be raeasured. A range of V-scopes were developed for various

316
PLATE 4.6 CONDUCTOR FATIGUE TESTER WIRE BREAK DETECTION ARRANGEMENT
317
deflection ranges and Plate 4.7 illustrates the V-scope
raeasureraent technique based on the iraage of the intersection of
the apparent two triangles.
The V-scopes were attached to the conductor by means of a paper
bull dog clip.
4.3.2.3 Conductor Frequency
Since the first wire break was chosen as the failure criteria of
the conductor, the nuraber of vibration cycles is recorded to
allow the appropriate data point to be plotted on the fatigue
curve.
Accordingly it is necessary to raeasure the vibration frequency
and this was achieved by a corabination of a proxiraity transducer
and a spectrura analyser.
The proxiraity transducer was raounted adjacent to the conductor.
In addition to the vibration frequency, the spectrura analyser
determined the sinusoidal distortion of the induced mechanical
vibration by providing the harmonic components of the vibration.
Hard copies of the vibration frequency spectrura were obtained by
raeans of an X-Y plotter.

318
PLATE 4.7 CONDUCTOR FATIGUE TESTER V-SCOPE MEASUREMENT TECHNIQUE

319
4.3.2.4 Data Logging
Data logging of wire breaks, conductor frequency and duration to
wire breaks was perforraed by a coraraercially available CMOS and
TTL electronic datataker. The output of the datataker was logged
to an online terminal and echoed to a line printer.
4.4.4 Test Program
The test prograra consists of two stages, firstly to determine the
fatigue free stress of alurainiura and alurainiura alloy conductors
and secondly, to deterraine the effect of suspension fittings on
the fatigue free stress. The details of the test prograra are,
1. Carry out sufficient fatigue tests to establish S-N curves
for an identical conductor construction with the exception
of the differing alurainiura and alurainiura alloys coraponent
wires naraely 1350, 1120 and 6201A; and
2. Using the sirailar conductor construction used in the
aboveraentioned tests, establish the effect of an arraour grip
suspension units, arraour rods/suspension clarap corabination
and a suspension clarap on the S-N curves.
It was intended as part of these studies to coraplete stage one of
the test prograra and establish the fatigue curves. The details
of the conductors selected for the tests and the test prograra are
given in Figure 4.10.
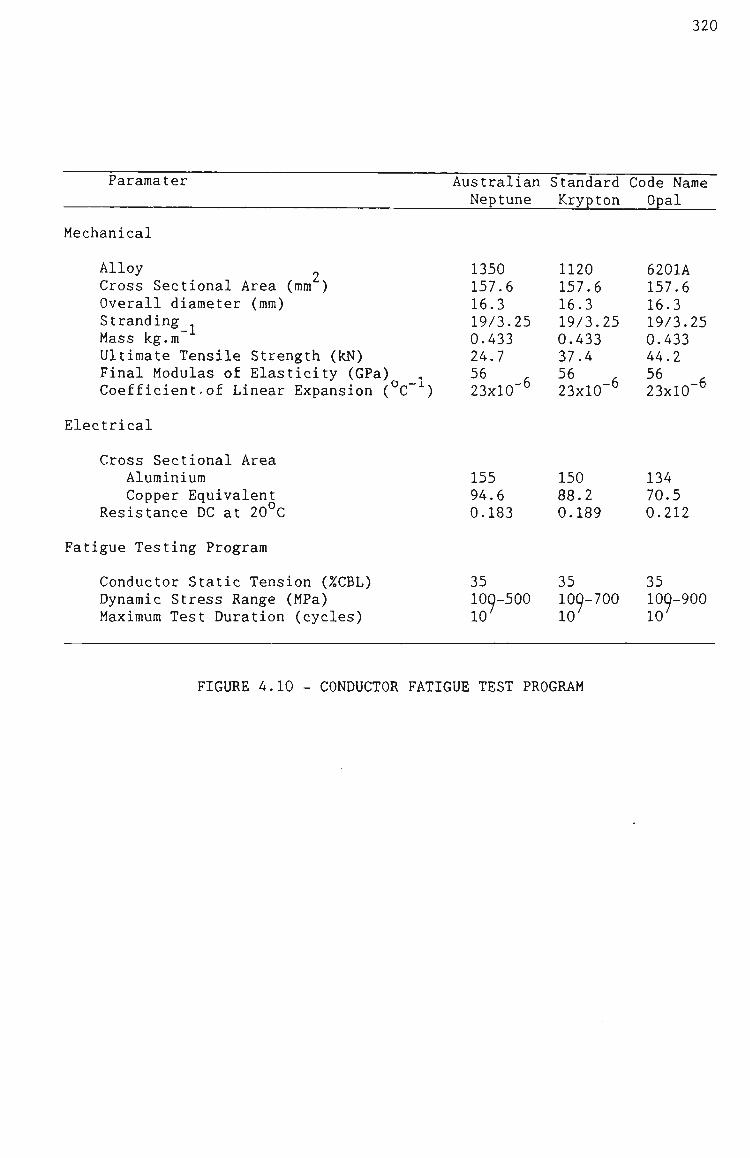
Paramater
320
Australian Standard Code Name Neptune Krypton Opal
Mechanical
Alloy 2 Cross Sectional Area (mra ) Overall diameter (mra) Stranding . Mass kg.ra" Ultimate Tensile Strength (kN) Final Modulas of Elasticity (GPa) Coefficient-of Linear Expansion (°C~^)
1350 157.6 16.3 19/3.25 0.433 24.7 56 23x10
1120 157.6 16.3 19/3.25 0.433 37.4
^^ 6 23x10"°
6201A 157.6 16.3 19/3.25 0.433 44.2
^^ 6 23x10 °
Electrical
Cross Sectional Area Alurainiura Copper Equivalent
Resistance DC at 20°C
155 94.6 0.183
150 88.2 0.189
134 70.5 0.212
Fatigue Testing Prograra
Conductor Static Tension (%CBL) Dynaraic Stress Range (MPa) Maximum Test Duration (cycles)
35 100-500 10^
35 100-700 10^
35 100-900 10^
FIGURE 4.10 - CONDUCTOR FATIGUE TEST PROGRAM
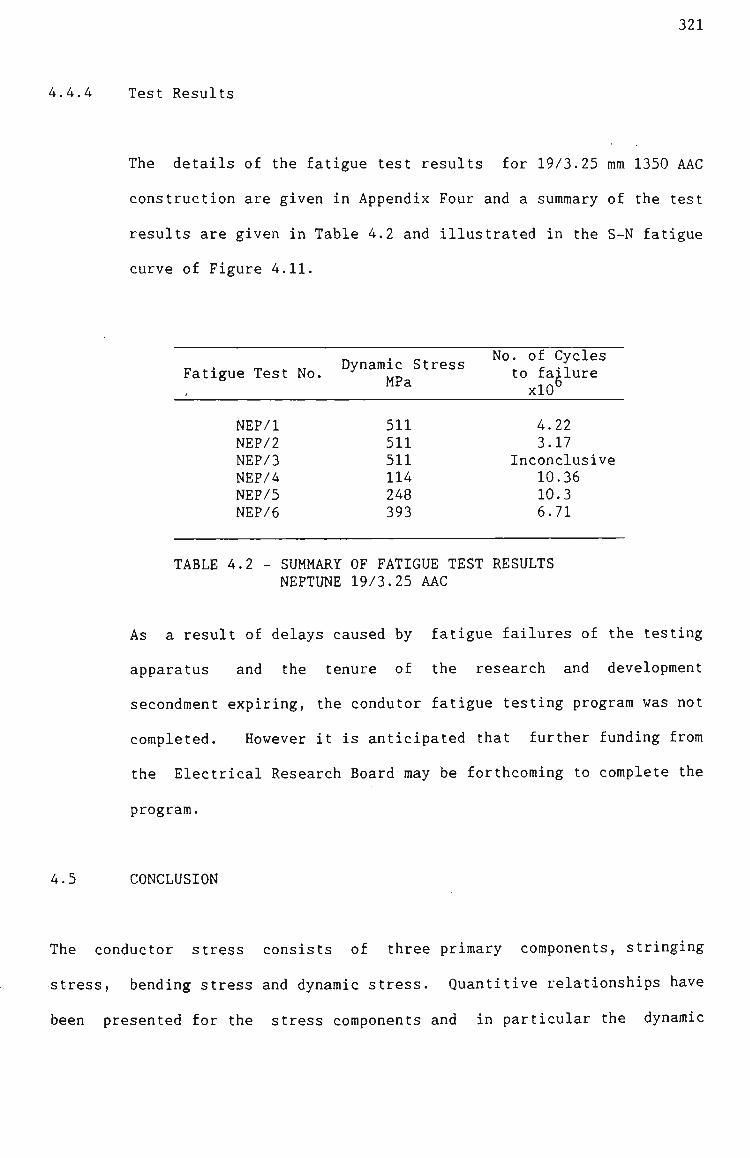
321
4.4.4 Test Results
The details of the fatigue test results for 19/3.25 mra 1350 AAC
construction are given in Appendix Four and a suramary of the test
results are given in Table 4.2 and illustrated in the S-N fatigue
curve of Figure 4.11.
Fatigue Test No. Dynaraic Stress
MPa
No. of Cycles to failure xlO^
NEP/1 NEP/2 NEP/3 NEP/4 NEP/5 NEP/6
511 511 511 114 248 393
4.22 3.17
Inconclusive 10.36 10.3 6.71
TABLE 4.2 - SUMMARY OF FATIGUE TEST RESULTS NEPTUNE 19/3.25 AAC
As a result of delays caused by fatigue failures of the testing
apparatus and the tenure of the research and developraent
secondraent expiring, the condutor fatigue testing prograra was not
completed. However it is anticipated that further funding from
the Electrical Research Board may be forthcoming to complete the
program.
4.5 CONCLUSION
The conductor stress consists of three primary components, stringing
stress, bending stress and dynaraic stress. Quantitive relationships have
been presented for the stress coraponents and in particular the dynaraic
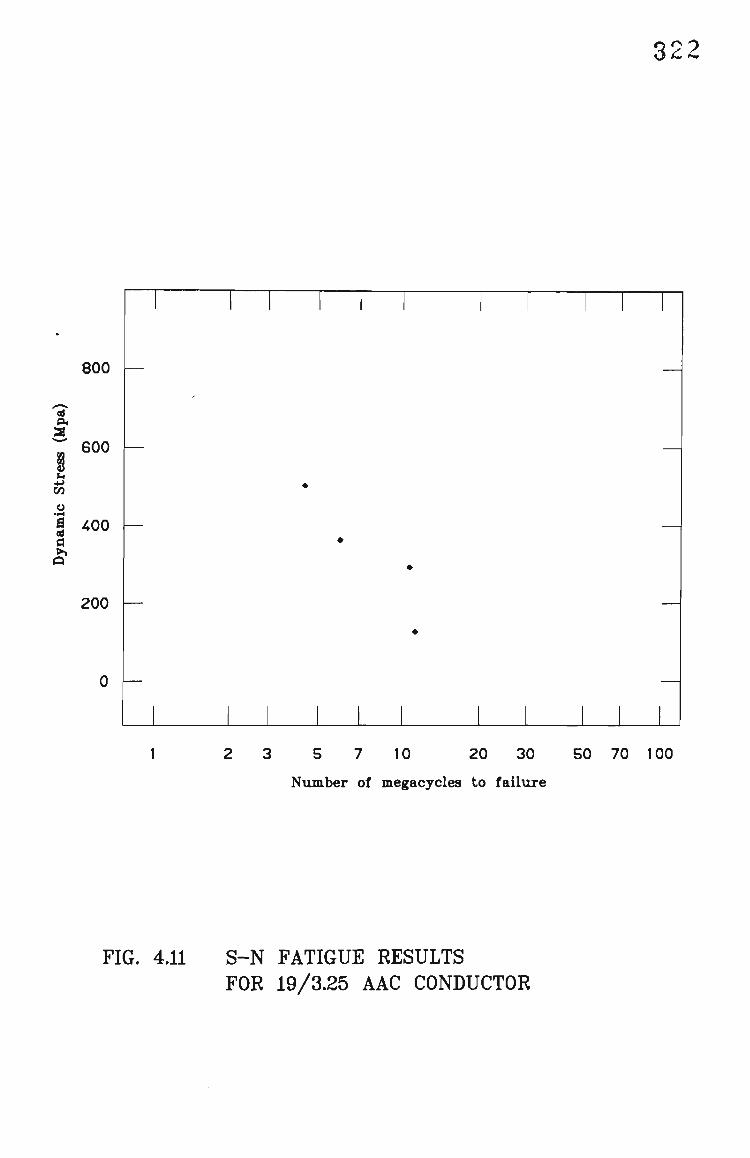
22
800 —
ed
2 600
•*i 73
i 400 CD
a
200 —
3 5 7 10 20 30 50 70 100
Number of megacycles to failure
FIG. 4.11 S-N FATIGUE RESULTS FOR 19/3.25 AAC CONDUCTOR

323
stress relationship as a function of wire and conductor properties and
wind velocity has been derived.
It is suggested, like raany researchers and is illustrated by the
erapirical equations presented that conductor stringing stress is not a
critical factor in the fatigue design of conductors. Accordingly the
stringing stress design should be based on an appropriate safety factors
on alurainiura wires ultimate stress, allowances for fittings and
consideration given to the environmental influences.
A conductor fatigue testing apparatus was coraraissioned and appropriate
instrumentation developed. Fatigue tests to permit the understanding of
the effects of alloying aluminium on the fatigue limit of electrical grade
alurainiura have coraraenced. However, as a result of tirae constraints and
fatigue failures of the testing apparatus, to date the fatigue liraits have
not been quantified.

324 REFBREHCES
1. Alcoa AluDlniiBtaa
2. AluiBlnlvun Development Council of Australia.
Graphic Xethods for Sag Tension Calculations for ACSR and other Conductors. Overhead Conductor Engineering Data Section 8, Rome Cable Division Aluminum Company of America.
Aluminium Standards and Data - Vought Products. Fourth Edition June 1983.
3. ASSI/IBBB Standard
4. ANSI/ASTM Bl17-73
5. Ash, D.O., Dey, P., Gaylard, B. 4 Gibbon, R.R
6. Australian Standard
7. Australian Standard
8. Australian Standard
9. Barrett, J.S., Dutta, S. & Figol, 0.
10. Barrett, J.S., Ralston, P. & Higol, 0.
11. Barrett, J.S. & JTigol, 0.
IEEE Guide to the Installation of Overhead Transmission Line Conductors. AHSI/IBEB Std 524-1960, The Inst, of Electrical and Electronics Engineers, Dec 1980.
Standard Method of Salt Spray <Fog) Testing.
"Conductor Systems for Overhead Lines: Some Considerations in Their Selection." IBB Proc Vol 126, lo. 4, April 1979, pp 333-341.
Aluminium Conductors Steel Reinforced for Transmission Purposes. AS C75, Part 1 1963.
Aluminium Conductors Steel Reinforced for Overhead Transmission Purposes. AS 1220, Parts 1, 2 4 3, 1973.
Aluminium Conductors for Overhead Transmission Purposes. AS 1531, Parts 1, 2 St 3, 1974.
"A Few Computer Model of Conductors." IEEE Trans on PAS Vol PAS-102 Ho. 3, March 1983, pp 614-618
"Mechanical Behaviour of ACSR Conductors." CIGRE 22-09, Ontario Hydro Canada. Paper presented to the Sept, 1982 Session.
"A Hew Model of AC Resistance in ACSR Conductors." IEEE Trans on PAS, Vol PVRD-1, ¥o. 2, April 1986, pp 198-208.

325
12. Barrien, J. "Precise Sags and Tensions in Multiple Span Transmission Lines." Elec. Eng. Trans. lEAust, Vol BE II Fo.l, 1975, pp 6-11.
13. Beers, G.M., Gilligan, S.R., Lis, H.V. & Schamberger, J.M.
"Transmission Conductor Rating." AIBE Trans. Pt III, Oct 1963, pp 767-775.
14. Boal, G.R.
15. Bogardus K.O., Hunter, M.S., Holt, M. & Frank, Jr, G.R.
"Precise Sag-Tension Calculations of Overhead Conductors." Wire Journal, Aug 1977, pp 56-60
"Effects of Prior Creep on the Tensile Properties of Cold Worked Unalloyed Aluminium."
16. Booker, J.R.
17. Boyse, CO. & Simpson, H.G.
18. Bradbury, J., Kuska, G.F. Tarr, D.J.
19. Bradbury, J.
"Natural Aging of ¥on-Energised Alumunium Conductors." IEBB Trans on PAS Vol PVRD-1, Fo. 4, Oct 1986, pp 269-274.
"The Problem of Conductor Sagging on Overhead Transmission Lines." Journal of the Inst, of Blec. Eng. Vol 91, Pt II, Dec 1944, pp 219-231.
"Sag and Tension Calculations For MountanioTis Terrain." IBB Proc. C, Gen., Trans & Distrib, 1982, pp 213-220.
"The Creep of Steel-Cored Aluminium Conductors." Lab Report Fo. RD/L/R 1438 Central Electricity Research Laboratories. 31 Jan 1967.
20. Bradbury, J,
21. Bradbury, J., Dey, P. Orawski, G. & Pickup, K.H.
22. British Standard
"Creep of SCA Conductors at Elevated Temperatures." Lab Report Fo. RD/L/F 134/69 Central Electricity Research Laboratories 5 March 1970.
"Long Term Creep Assessment for Overhead-Line Conductors." IBB Proc Vol 122, Fo. 10, Oct 1975, pp 1146-1151.
Aluminium Conductors Steel Reinforced for Transmission Purposes. BS 215 Part 2, 1956.
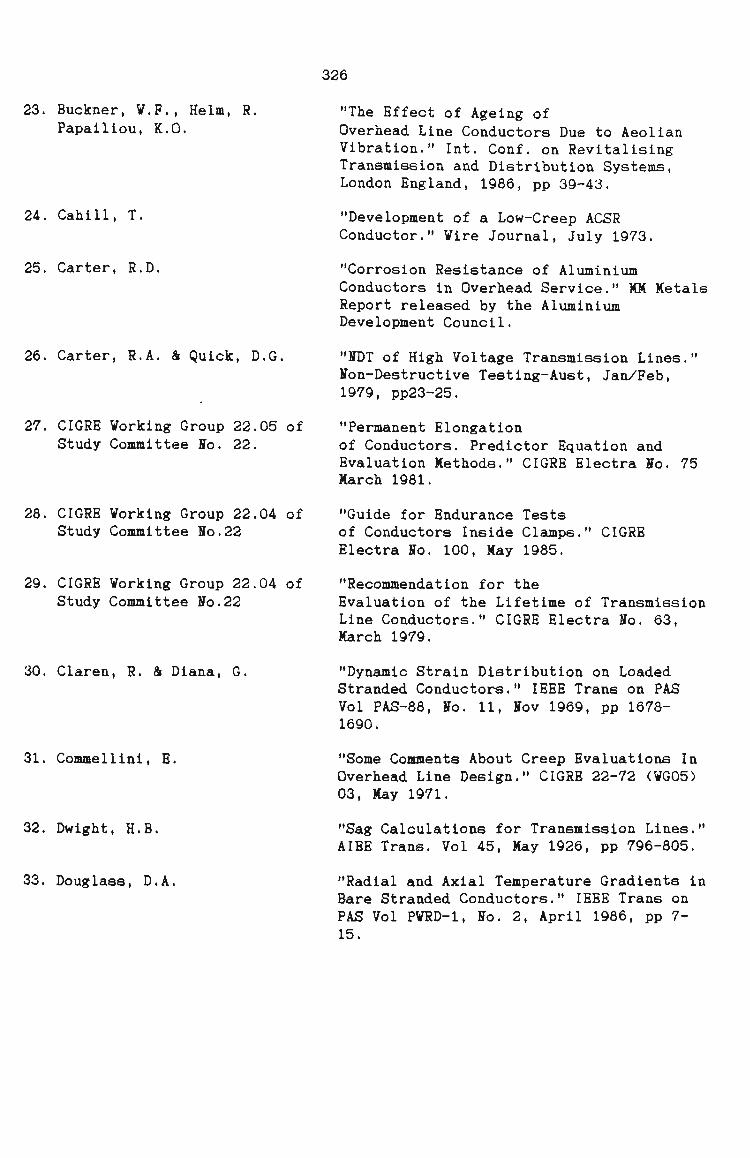
326
23. Buckner, V.F., Helm, R. Papailiou, K.O.
24. Cahill, T.
25. Carter, R.D.
26. Carter, R.A. & Quick, D.G.
27. CIGRE Working Group 22.05 of Study Committee Fo. 22.
28. CIGRE Working Group 22.04 of Study Committee Fo.22
29. CIGRE Working Group 22.04 of Study Committee Fo.22
30. Claren, R. & Diana, G.
31. Commellinl, B.
32. Dwight, H.B.
33. Douglass, D.A.
"The Effect of Ageing of Overhead Line Conductors Due to Aeolian Vibration." Int. Conf. on Revitalising Transmission and Distribution Systems, London England, 1986, pp 39-43.
"Development of a Low-Creep ACSR Conductor." Wire Journal, July 1973.
"Corrosion Resistance of Aluminium Conductors in Overhead Service." MM Metals Report released by the Aluminium Development Council.
"FDT of High Voltage Transmission Lines." Fon-Destructive Testing-Aust, Jan/Feb, 1979, PP23-25.
"Permanent Elongation of Conductors. Predictor Equation and Evaluation Methods." CIGRE Blectra Fo. 75 March 1981.
"Guide for Endurance Tests of Conductors Inside Clamps." CIGRB Blectra Fo. 100, May 1985.
"Recommendation for the Evaluation of the Lifetime of Transmission Line Conductors." CIGRB Blectra Fo. 63, March 1979.
"Dynamic Strain Distribution on Loaded Stranded Conductors." IBBB Trans on PAS Vol PAS-88, Fo. 11, Fov 1969, pp 1678-1690.
"Some Comments About Creep Evaluations In Overhead Line Design." CIGRB 22-72 (WG05> 03, May 1971.
"Sag Calculations for Transmission Lines." AIBE Trans. Vol 45, May 1926, pp 796-805.
"Radial and Axial Temperature Gradients in Bare Stranded Conductors." IBBB Trans on PAS Vol PVRD-1, Fo. 2, April 1986, pp 7-15.
327
34. Ehrenburg, D.O.
35. Electric Power Research Institute
36. Electric Power Research Institute
37. Electricity Development Act 1945
"Transmission Line Catenary Calculations." AIEB Trans. Vol 54, July 1935, pp 719-728.
Conductor Fatigue Life. BPRI BL-4744 Project 1278-1 Final Report, Jan 1987.
Transmission Line Reference Book Wind Induced Conductor Motion. Based on BPRI Research Project 792 1973.
"Overhead Line Construction and Maintenance Regulations, 1962." NSW, as amended.
38. Elton, M.B., Hard, A.R. & Shealy, A.F.
39. Forrest, J.S. & Ward, J.M.
40. Post, D., Lin, S.H. & Carberry, R.
41. Ficke, W.G. & Rawlins, C.B.
42. Fritz, B.
43. Goldman, A. & Sigmond, A.S.
44. Gouch, A.J. & Johnston, G.H.
"Transmission Conductor Vibration Tests." AIBE Trans on PAS Vol 77 Pt III, Aug 1959, pp 528-537.
"Service Experience of the Effect of Corrosion on Steel Cored Aluminium Overhead Line Conductors." IBC Vol 101 Pt II Fo. 81, June 1954, pp 271-283.
"Signifance of Conductor Radial Temperature Gradient within a dynamic Line Rating Methodology." IBBB Trans on PD, Vol PVRD-2, Fo. 2, April 1987, pp 502-511.
"Importance of Fretting in Vibration of Stranded Conductors." IEEE Trans PAS Vol PAS-87, Fo. 6, June 1968, pp 1381-1384.
"The Effect of tighter Conductor Tensions on TL Costs." IBBB Trans Paper Vol PAS 79 1960, pp 513-527.
"Corona Corrosion of Al\iminium in Air." Journal of the Electrochemical Society, Dec 1985, pp 2842-2853.
"Creep, Modulus of Elasticity and Coefficient of Thermal Expansion of Alumini\im Based Overhead Conductors." MM Metals Technical Department, Report Fo. Development Council.

328
45. Gopalan, T.V.
46. Hard, A.R.
47. Harvey, J.R.
48. Harvey, J.R.
49. Harvey, J.R. & Larson, R.E.
50. Haughton, B.A. & Cole, A.
51. Helms, R. & Ziebs, J.
52. Hooker, R.J. & Humphurys V.
"Fatigue Damage Criterion for ACSR." IB Journal BL Vol 65, April 1985, pp 164-166.
"Studies of Conductor Vibration in Laboratory Span, Outdoor Test Span and Actual Transmission Lines." CIGRE Report Fo. 404, 1958.
"Creep of Transmission Line Conductors." IEEE Trans on PAS Vol PAS-88 Fo. 4, April 1969, pp 281-286.
"Effect of Elevated Temperature Operation on the Strength of Aluminium Conductors." IBBB Trans on PAS Vol PAS-91 Fo. 5, Sept/Oct 1972, pp 1769-1772.
"Use of Elevated-Temperature Creep Data in Sag-Tension Calculations." IEEE Trans on PAS Vol PAS-89 Fo. 3, March 1970, pp 380-386.
"Site Corrosion Tests of Aluminium and Aldery and Overhead Line Conductors. Pt 7: Results of 10 Years Exposure at UK Sites and at Karachi." BICC Research and Engineering Ltd., Peport Fo. C0/T.263, April 1979.
"Investigations on Aluminium Conductors Steel Reainforced (ACSR) Under Tensile and Creep Load." CIGRE 22-71 <VG05) 05, Federal Institute For Materials Testing, Paper Presented to CIGRE Study Committee Fo. 22 May 1971.
"Damping of Electrical Transmission Lines Part II - Field and Laboratory Studies."
53. Johnston, G.H. & Stewart, V.H. "Properties Of Aluminium Alloy Conductors." MM Metals Technical Department, Paper presented to the Conference of the BSEA of FSV, Sydney August, 1985.
54. Jordan, C.A. "A Simplified Sag-Tension Method for Steel-Reinforced Aluminium Conductor." AIBE Trans. Vol 71 Pt III, Dec 1952, pp 1108-1117
329
55. Landau, M.
56. Little, J.C, MacMillian, D. Majeriah, J.V.
57. Maddock, B.J.,Allnut, G.R. Ferguson, J.M., Lewis, K.G., Swift, D.A., Teare, P.V. & Tunsatll, M.J.
"Incremental Method for Sag-Tension Calculations." AIBE Trans. Vol 70, Pt II, 1951, pp 1594-1571.
& "Vibration and Fatigue Life of Steel Strands." AIEB Trans Vol 69, 1950, pp 1473-1479.
"Some Investigations of the Aging of Overhead Lines." CIGRB 22-09 Paper Presented 1986 session.
58. Miner, X.A.
59. Morgan, V.T.
60. Morgan, V.T,
"Ctnnulative Damage in Fatigue." Proc. Amer. Soc. Mech.Bng. Metals 67(1945) S.A.-159/64, pp A159-A164.
"Rating of Overhead Conductors for Continuous Currents." IBB Proc Vol 114, Fo. 10, Oct 1967, pp 1473-1482.
"The Loss of Tensile Strength of Hard Drawn Conductors by Annealing in Service." IBBB Trans on PAS Vol PAS-98 Fo. 3, June 1979, pp 700-709.
61. Nakayama, Y. & Kojima, T.
62. Flgol, 0. & Barrett, J.S.
63. Nigol, 0. & Barrett, J.S.
"Field Measurements of the Creep of Overhead Line Conductors." CSC 22-70 (WG05) 02, The Furukawa Electric Co., Ltd. Tokyo, Japan, May 1970.
"Characteristics of ACSR Conductors at High Temperatures and Stresses." IBBB Trans on PAS, Vol PAS-100, Fo. 2, Feb 1981, pp 485-493.
"Development for an Accurate Model of ACSR Conductors for Calculating Sags at High Temperature - Part II: Sag-Tension Program - STESS." Report Prepared for the Canadian Electrical Association, Fov 1980.
64. Figol, 0. & Barrett, J.S. "Development of an Accurate Model of kCSR Conductors for Calculating Sags at High Temperatures - Part III." Report Prepared for the Canadian Electrical Association, March 1980.

65. Occasione, J.F., Brltton, Jr, T. C & Collins, R.C
330 "Atmospheric Corrosion Investigations of Aluminium-Coated, Zinc-Coated, and Steel Wire and Copper-Bearing Steel and Wire Products: A Technical Publication 585A, Aug 1984.
66. Overhead Conductor Design BICC Wire Mill Division Prescot Lancashire England, 1st Edition, Sept 1967.
67. Poffenberger, J.C & Swart, R.L.
68. Philippe, V., Carlshem, V. & Buckner V.
69. Pickins, B.M.
70. Reding, J.L.
71. Richardson, Jr, A.S. & Smith, F.S.
72. Rickard, J.R. & Sproule, J.
"Differential Displacement and Dynamic Conductor Strain." IBBB Trans on PAS Pt III April 1965, pp 281-289.
"The Endurance Capability of Single and Bundle Transmission Line Conductors and its Evaluation." Report Presented to CIGRB Study Committee 22, Working Group 04.
"Sag-Tension Calculation Program for Digitial Computers." AIBE Trans on PAS Vol PAS 77 Pt III, Feb 1958, pp 1308-1315.
"Development and Installation of BPA's Few Generation Transmission Conductors." IEEE Trans on PD Vol PVRD-2, Fo. 3, July 1987, pp 917-923.
"Some Effects of Tension on Static Wire Fatigue in Few England." IEEE Trans on PAS, Vol PAS-100. Fo. 2, Feb 1981, pp 646-654.
"Thermal Rating of Overhead Transmission Lines." ECFSV Internal Document 1/6/61.
73. Roche, J.B. & Dziedzic, E.
74. Roman, G.J.
"Some Factors Affecting Creep and Sag In EHV Transmisson Lines." Pacific Coast Electrical Association San Francisco, California, 28 March 1968.
"Dynamic Thermal Line Rating Summary and Status of the State-of-the-Art Technology." IEEE Trans on PD, Vol PVRD-2, Fo. 3, July 1987, pp 851-858.

331
75. Sakakibara, A., Iisaka, H., Mori, F., Okumura, T. & Kawamura, T.
"Development of Low Vind Pressure Conductors for Compact Transmission Line." IEEE Trans on PAS Vol PAS-103, Fo. 10, Oct 1984, pp 3117-3123.
76. Steidel, R.F,
77. Stickley, G.V.
"Factors Affecting Vibratory Stresses in Cables Fear the Point of Support." AIBE Trans on PAS Vol PAS-77, Pt III, Dec 1959, pp 1207-1213.
"Stress-Strain Studies of Transmission Line Conductors." Paper presented at Summer Convention of AIEB Cleveland Ohio, June 20-24, 1932.
78. Simmons, J.M., Gilmore, K.L, 4 "Damping of Electrical Dulhunty, P.V. Transmission Lines Part I - Analysis and
Fumerical Simulation."
79. Tomkins, J.S., Merrill, L.L. & "Quantitive Relationships in Jones, B.L. Conductor Vibration Damping." AIBE Trans
on PAS Pt III, Oct 1956, pp 879-896.
80. Vinkleman, P.F.
81. Varney, T.
"Sag-tension Computations and Field Measurements of Bonneville Power Administration." AIEB Trans. Pt III, Feb 1960, pp 1532-1548.
"The Vibration of TL Conductors." AIBE Trans, July 1928.

APPENDIX TWO
SAG TENSION TEST RESULTS
A2.1 SURVEY AND CALCULATED DATUM
A2.1.1 Avon Keraps Creek Transmission Line
The "as designed" and "as raeasured" span length, conductor
attachment reduced level, curve constant, insulator longitudinal
swing distance, conductor length and plotted profile for the stated
conductor temperature and survey method for spans 51 to 52, 52 to
53 and 53 to 54 are given in Figures A2.1 to A2.3 respectively.
A2.1.2 Dapto Springhill Transraission Line
The "as designed" and "as raeasured" span length, conductor
attachraent reduced level, curve constant, insulator longitudinal
swing distance, conductor length and plotted profile for the stated
conductor teraperature and survey raethod for spans 317A to 318A,
318A to 319A, 319A to 320A, 320A to 321A and 321A to 322A are given
in Figures A2.4 to A2.8 respectively.
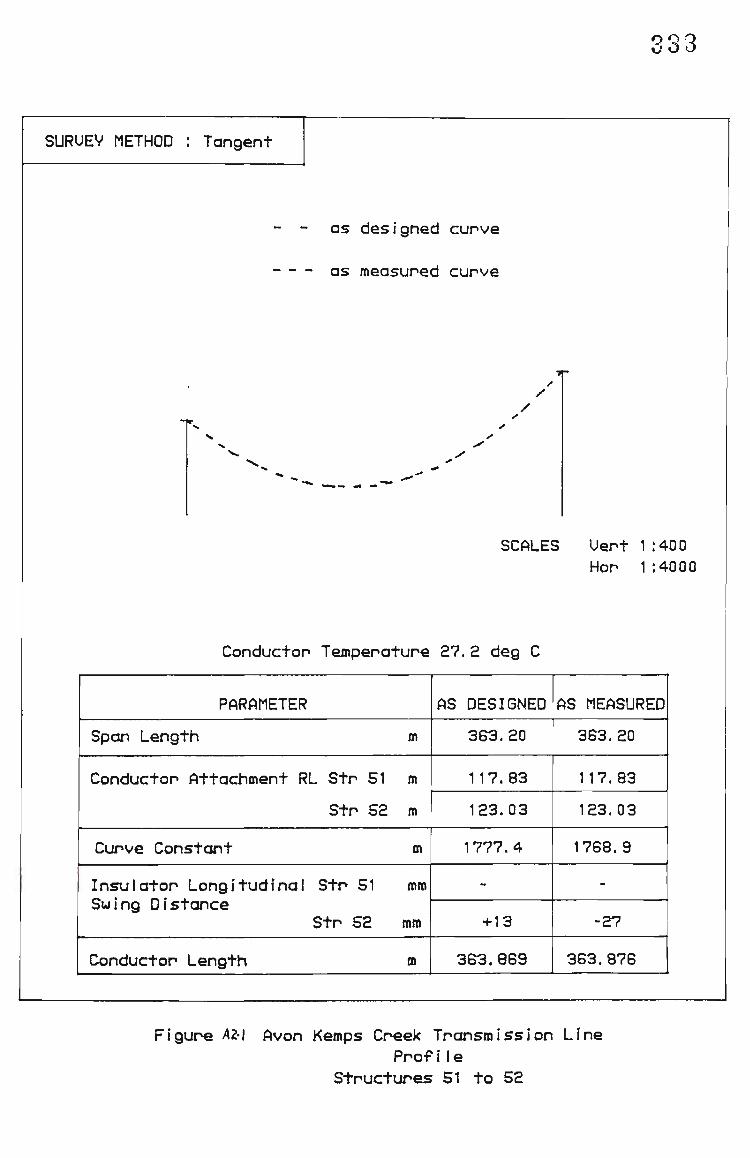
333
SURUEV METHOD : Tangent
as designed curve
as measured curve
/ /
SCALES Uert 1:400 HOP 1:4000
Conductop Tempenatupe 27. 2 deg C
PARAMETER
Span Length
Conductop Attachment RL Stp 51
Stp 52
Cupve Constant
Insulator Longitudinal Str 51 Swing Distance
Stp 52
Conductor Length
m
m
m
m
mm
mm
m
AS DESIGNED
363.20
117.83
123.03
1777.4
-
+13
383.889
AS MEASURED
363.20
117.83
123.03
1768.9
-
-27
363.876
Figure A2-I Avon Kemps Creek Transmission Line Profile
Structures 51 to 52

OO ±
SURUEV METHOD : Tangent
as designed curve
- as measured curve /
/
/ y
\
SCALES Uert 1:400 Hor 1:4000
Conductor Temperature 34.3 deg C
PARAMETER
Span Length
Conductor Attachment RL Str 52
Str 53
Curve Constant
Insulator Longitudinal Str 52 Swing Distance
Str 53
Conductor Length
m
m
m
n
mm
mm
m
AS DESI8NED
448.32
123.03
137.89
1717.5
-75
+27
449. 839
AS MEASURED
448. 32
123.03
137.89
1729. 3
-87
+ 17
449.822
Figure AZ-t Avon Kemps Creek Transmission Line Profile
Structures 52 to 53

335
SURUEV METHOD : Sate I 1i te
\
\
v
as designed curve
as measured curve
SCALES Uert 1:400 Hor 1:4000
Conductor Temperature 34.3 deg C
PARAMETER
Spca Length
Conductor Attachment RL Str 53
Str 54
Curve Constant
Insulator Longitudinal Str 53 Swing Distance
Str 54
Conductor Length
m
m
m
ffl
mm
mm
ffl
AS DESIGNED
195.41
137.89
123.03
1703.6
-75
-
196.081
AS MEASURED
195.41
137.89
123.03
1702.8
-87
-
196.081
Figure AZZ Avon Kemps CreeJ< Transmission Line Profi ie
Structures 53 to 54

338
\ X.
as designed curve
" " as measured curve
SCALES Uert 1:400 Hor 1:4000
Conductor Temperature 31.5 deg C
PARAMETER
Span Length m
Conductor Attachment RL Str 317Am
Str 317Am
Curve Constant m
Insulator Longitudinal Str 317Amro Swing Distance
Str 318Arom
Conductor Length m
AS DESIGNED
266. 66
128. 30
125.05
1574. 0
-
+ 11
266.999
AS MEASURED
266.66
128. 30
125.05
1606.3
-
+11
266. 986
Figure AM Dapto SpringhiI I Transmission Line Profile
Structures 317A to 318A

337
SURUEV METHOD : Tangent
V. \.. .^^
as designed curve
as measured curve
SCALES Uert 1:400 Hor 1:4000
Conductor Temperature 18.6 deg C
PARAMETER
Span Length m
Conductor Attachment RL Str 318Am
Str 319Am
Curve Constant m
Insulator Longitudinal Str 318A mm Swing Distance
Str 319A mn
Conductor Length m
AS DESIGNED
308. 62
125.05
124.54
1752.3
+11
-12
309.019
AS MEASURED
308.62
125.05
124. 54
1667.0
+11
-15
309.061
F i gure AlS' Dapto Spr i ngh i I I Transm i ss i on L i ne Profile
Structures 318A to 319A

338
SURUEV METHOD : Tangent as designed curve
- - as measured curve
V
SCALES Uert 1:400 Hor 1:4000
Conductor Temperature 31.5 deg C
PARAMETER
Span Length m
Conductor Attachment RL Str 319Am
Str 320Am
Curve Constant m
Insulator Longitudinal Str 319A mm Swing Distance
Str 320A mn
Conductor Length m
AS DESIGNED
210.91
124. 54
122. 54
1573.2
-24
+23
211.077
AS MEASURED
210.91
124. 54
122. 54
1580.3
+14
+23
211.076
Figure 2-6 Dapto Springhi I I Transmission Line Profile
Structures 319A to 320A

KJ tj \J
SURUEV METHOD : Tangent
V y
as des i gned curve
- - as measured curve
SCALES Uert 1:400 Hor 1:4000
Conductor Temperature 31.5 deg C
PARAMETER
Span Length m
Conductor Attachment RL Str 320Am
Str 321 Am
Curve Constant m
Insulator Longitudinal Str 320A mm Swing Distance
Str 321A mn
Conductor Length m
AS DESIGNED
278.68
122. 54
123.58
1576.5
+23
+24
279.045
AS MEASURED
278.68
122. 54
123.58
1592.9
+23
+ 14
279.037
Figure Al-l Dapto Springhill Transmission Line Profile
Structures 320A to 321A

340
SURUEV METHOD : Tangent
- - as designed curve
as measured curve
SCALES Uert 1:400 Hor 1:4000
Conductor Temperature 18.6 deg C
PARAMETER
Span Length m
Conductor Attachment RL Str 321 Am
Str 322Am
Curve Constant m
Insulator Longitudinal Str 321A mm Swing Distance
Str 322A mn
Conductor Length m
AS DESIGNED
302.19
123.58
127.16
1754.6
+13
^
30 a. 585
AS MEASURED
302. 19
123.58
127.18
1683.9
+14
-
302.517
F i gure Aze Dapto Springh i11 Transm i ssi on Li ne Profile
Structures 321A to 322A

APPENDIX THREE
MECHANICAL PROPERTIES OF AGED TRANSMISSION LINE CONDUCTORS
TEST RESULTS
A3.1 Metallographic Exaraination
A3.1.1 Macro Examination
A3.1.1.1 Avon to Kemps Creek Transraission Line
On destranding of the arraour rod suspension grip revealed traces of white
powder and the external surface of the conductor was raatt grey in colour.
In addition there was an accuraulation of grit particles in gaps between
the wires. With the exception of the white powder sirailar observations
were made of the conductor away frora the suspension point. The 24 wire
layer or the outer layer is illustrated in Plate A3.1.
On destranding the 24 wire alurainiura layer elliptical areas of surface
daraage could be seen on the underside of the 24 wire layer. A series of
corresponding raarks on the outside surface of the 18 wire layer were
observed. These raarks were unforraly distributed over the conductor
surface and consistent with raarks formed by the closing die of a stranding
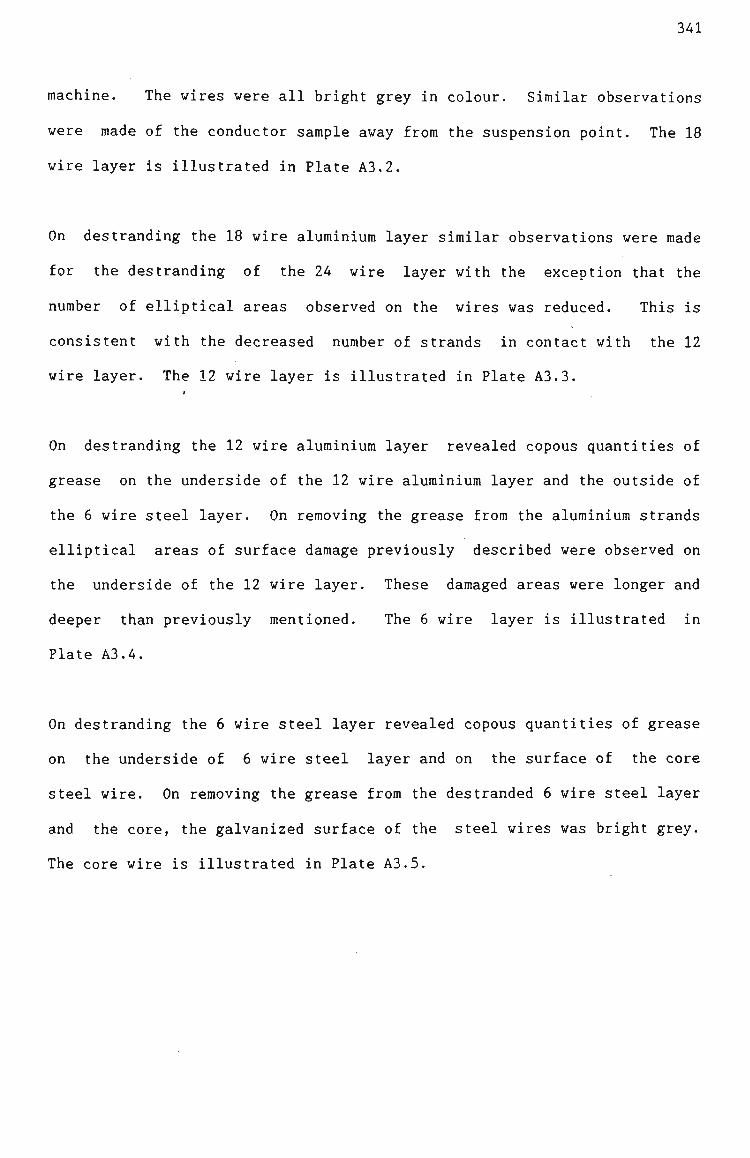
341
machine. The wires were all bright grey in colour. Sirailar observations
were raade of the conductor saraple away frora the suspension point. The 18
wire layer is illustrated in Plate A3.2.
On destranding the 18 wire alurainiura layer sirailar observations were raade
for the destranding of the 24 wire layer with the exception that the
nuraber of elliptical areas observed on the wires was reduced. This is
consistent with the decreased nuraber of strands in contact with the 12
wire layer. The 12 wire layer is illustrated in Plate A3.3.
On destranding the 12 wire alurainiura layer revealed copous quantities of
grease on the underside of the 12 wire alurainiura layer and the outside of
the 6 wire steel layer. On reraoving the grease frora the alurainiura strands
elliptical areas of surface daraage previously described were observed on
the underside of the 12 wire layer. These daraaged areas were longer and
deeper than previously raentioned. The 6 wire layer is illustrated in
Plate A3.4.
On destranding the 6 wire steel layer revealed copous quantities of grease
on the underside of 6 wire steel layer and on the surface of the core
steel wire. On removing the grease frora the destranded 6 wire steel layer
and the core, the galvanized surface of the steel wires was bright grey.
The core wire is illustrated in Plate A3.5.

342
A3.1.1.2 Dapto to Springhill Transmission Line
With the exception of the absence of white powder products mentioned in
the destranding of the arraour rods and the non preforraing of the steel
core, the raacro examinations revealed similar observations for the various
layers raentioned in section A3.1.1.1
Alraost all elliptical areas of surface damage within 50 mra either side of
the suspension clamp contained evidence of abrasion or alurainium fretting.
The 24, 18, 12, 6 wire layers and the core are illustrated in Plates A3.6,
A3.7, A3.8, A3.9 and A3.10 respectively.
A3.1.1.3 Toraago to Taree Transraission Line
On destranding of the arraour rod suspension grip revealed a volurainous
quantity of white powder forraed on the external surface of the conductor.
The external surface of the conductor was raatt grey and there was with
evidence of pitting. Pitting and white powered deposits were not present
on the conductor away frora the suspension point. The 18 wire alurainium
layer frora a suspension site and away frora the suspension site is
illustrated in Plate A3.11 and A3.12 respectively.

343
On destranding the 18 wire alurainiura layer revealed copous quantities of
biturainous tar on the underside of the 18 wire alurainium layer and the
outside of the 12 wire alurainiura layer. The tar was bright black in
colour and very sticky. On removing the tar frora the 18 wire alurainium
strands, elliptical areas of surface damage previously described were
observed on the underside of the 18 wire layer. The 12 wire alurainiura
layer and the underside of the 18 wire alurainiura layer is illustrated in
Plate A3.13.
On destranding the 12 wire alurainiura layer revealed copous quantities of
biturainous tar on the underside of the 12 wire aluminium layer and the
outside of the 6 wire steel layer. The tar was bright black in colour and
very sticky. On reraoving the tar frora the 12 wire alurainiura strands
elliptical areas of surface daraage previously described were observed on
the inside of 12 wire layer. These daraaged areas were longer and deeper
than those of 18 wire layer. The 6 wire steel layer and the underside of
the 12 wire alurainiura layer is illustrated in Plate A3.14.
On destranding the 6 wire steel layer revealed the steel core. Little
biturainous tar was present on the core or the underside of the 6 wire
steel layer. On removal of the tar from the destranded 6 wire layer and
the core, the galvanised surface of the steel wires was dull grey with

344
some evidence of brown strains and rust sites. The destranded 6 wire
steel layer and steel core as found and cleaned wires are illustrated in
Plates A3.15 and A3.16 respectively.
A3.1.1.4 Bellambi to Heathcote Transmission Line
This saraple was reraoved frora a juraper connection, consequently no arraour
rods were fitted on the conductor and the sample was not subjected to
stringing tension.
The external surface of the conductor was matt grey with rainor pitting
evidence. The 18 wire alurainiura layer is illustrated in Plate A3.17.
On destranding the 18 wire layer alurainiura layer revealed bituminous tar
with an accuraulation of dirt particles on the underside of the 18 wire
layer and the outside of the 12 wire layer. The tar was raatt black in
colour and dry. On removing the tar sirailar but sraaller elliptical areas
of surface damage previously described were observed on the underside of
the 18 wire layer. The 12 wire alurainiura layer and the underside of the
18 wire alurainiura layer are illustrated in Plates A3.18.
For the reraainder of the raacroexaraination, the observations for the
remaining layers were similar as raentioned in section A3.1.1.3 with the
exception of the sraaller elliptical areas of surface daraage.
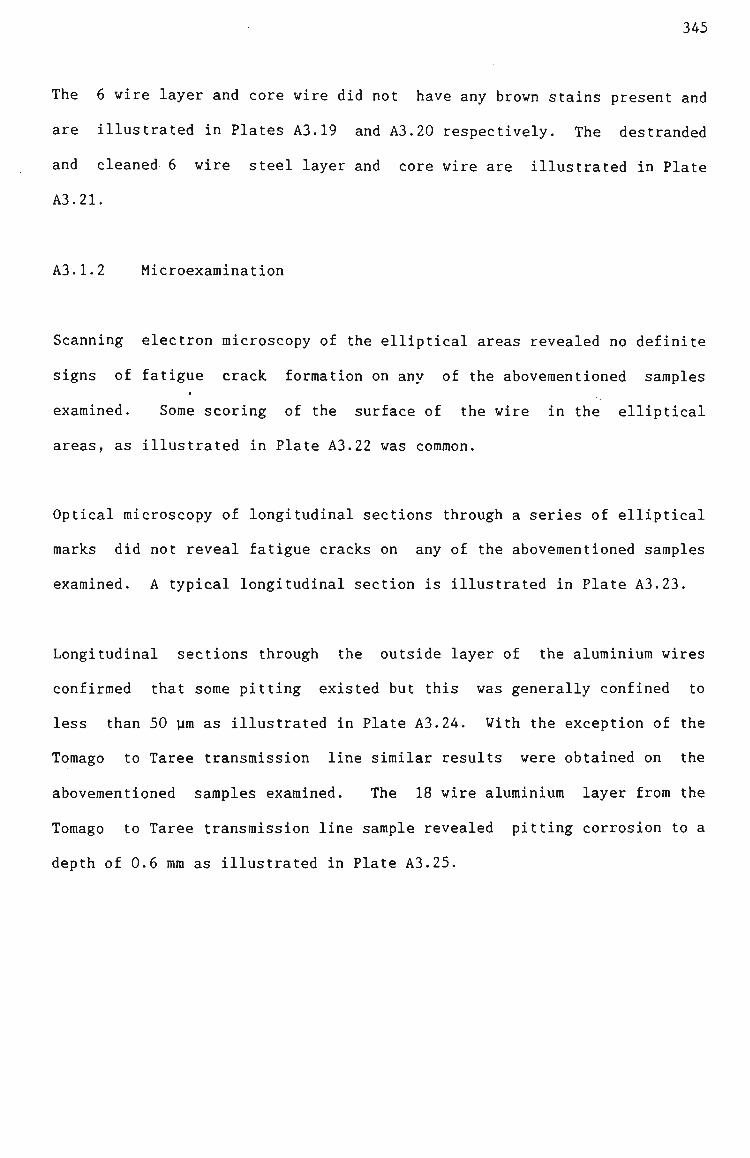
345
The 6 wire layer and core wire did not have any brown stains present and
are illustrated in Plates A3.19 and A3.20 respectively. The destranded
and cleaned 6 wire steel layer and core wire are illustrated in Plate
A3.21.
A3.1.2 Microexamination
Scanning electron microscopy of the elliptical areas revealed no definite
signs of fatigue crack forraation on any of the aboveraentioned saraples
exarained. Some scoring of the surface of the wire in the elliptical
areas, as illustrated in Plate A3.22 was coraraon.
Optical raicroscopy of longitudinal sections through a series of elliptical
marks did not reveal fatigue cracks on any of the aboveraentioned samples
examined. A typical longitudinal section is illustrated in Plate A3.23.
Longitudinal sections through the outside layer of the aluminium wires
confirmed that sorae pitting existed but this was generally confined to
less than 50 ura as illustrated in Plate A3.24. With the exception of the
Tomago to Taree transraission line similar results were obtained on the
aboveraentioned samples exarained. The 18 wire alurainiura layer from the
Tomago to Taree transraission line saraple revealed pitting corrosion to a
depth of 0.6 rara as illustrated in Plate A3.25.

346
Longitudinal sections through the steel wires confirmed that some
galvanising loss has taken place for all of the aboveraentioned saraples
exarained. However, for the Toraago to Taree transraission line saraple, in
some areas the galvanising had eroded away leaving exposed steel that has
coraraenced to corrode. Maxiraura pit depths were 180 yra. The loss of
galvanising and corrosion of the steel core and wires frora the 6 wire
layer are illustrated in Plates A3.26 and A3.27 respectively.
A3.2 Wire Test
A3.2.1 Cross Sectional Area
The cross sectional area of wires that constitute the conductor saraples
from the Avon to Keraps Creek, Dapto to Springhill, Toraago to Taree and
Bellambi to Heathcote transmission lines is given in Tables A3.1 to A3.4
respectively.
A3.2.2 Mechanical Properites
The breaking load, ultimate tensile strength and elongation of the wires
that constitute the conductor saraples from the Avon to Kemps Creek, Dapto
to Springhill, Toraago to Taree and Bellarabi to Heathcote transraission
lines is given in Tables A3.5 to A3.8 respectively.

347
In addition to these test results all wires complied with the requirements
of a wrap test.
A3.2.3 Electrical Properties
The resistivity of the alurainiura wires that constitute the conductor
samples frora the Avon to Keraps Creek, Dapto to Springhill, Toraago to Taree
and the Bellarabi to Heathcote transmission lines is given in Tables A3.9
to A3.12 respectively.
A3.2.4 Galvanised Steel Wire Zinc Coating Mass
The zinc coating raass of the steel wires that constitute the conductor
samples from the Avon to Keraps Creek, Dapto to Springhill, Tomago to Taree
and Bellarabi to Heathcote transraission lines is given in Tables A3.13 to
A3.16 respectively.
A3.2.5 Galvanised Steel Wire Wrap test
The steel wire that constitute the conductor saraples from the Avon to
Kemps Creek, Dapto to Springhill, Tomago to Taree and Bellarabi to
Heathcote transraission lines coraplied with the requireraents of BS443-1961.

348
A3.3 Conductor Tests
A3.3.1 Stress Strain
The raw data plots for the composite and core, derived stress strain plot
and test result data for the conductor sample frora the Toraago to Taree
transraission line are given in Figures A3.1 to A3.3 and Table A3.17
respectively. An additional stress strain raw data and derived plots and
test result data for a second conductor sample frora the Tomago to Taree
transraission line are given in Figures A3.4 to A3.6 and Table A3.18
respectively.
The raw data plots for the coraposite and core, derived stress strain plot
and test result data for the conductor sample from the Dapto to Springhill
transraission line are given in Figures A3.7 to A3.9 and Table A3.19
respectively.
The raw data plots for the coraposite and core, derived stress strain plot
and test result data for the conductor saraple from the Avon to Keraps Creek
transraission line are given in Figures A3.10 to A3.12 and Table A3.20
respectively.

349
As a result of the inadequate saraple length, no stress strain tests were
carried out on the conductor saraple frora the Bellarabi to Heathcote
transraission line.
A3.3.2 Coefficient of Linear Expansion
The raw data plot and linear regression test result, and test result data
for the Toraago to Taree transraission line with test load of 20% CBL is
given in Figures A3.13 and Table A3.21, respectively. An. additional raw
data plot and linear regression test result, and test result data for the
Toraago to Taree transraission line with test load of 40% CBL is given in
Figure A3.14 and Table A3.22, respectively.
The raw data plot and linear regression test result, and test result data
for the Dapto to Springhill transraission line with test load fo 20X CBL is
given in Figure A3.15 and Table A3.23, respectively.
The raw data plot and linear regression test result, and test result data
for the Avon to Keraps Creek transraission line with test load at 20% CBL is
given in Figure A3.16 and Table A3.24, respectively.
As a result of the inadequate saraple length, no coefficient of linear
expansion tests were carried out on the conductor sample frora the Bellarabi
to Heathcote transraission line.

350
A3.3.3 Creep
The raw data linear linear plot, raw data log log plot and regression
lines, and test result data with test loads of 20 and 30% CBL for the
conductor saraple from the Avon to Kemps Creek transraission line is given
in Figures A3.17 and A3.18 and Table A3.25, respectively.
The raw data linear linear plot, raw data log log plot and regression
lines, and test result data with test loads of 20 and 30% CBL for the
condcutor sample frora the Dapto to Springhill transraission line is given
in Figures A3.19 and A3.20 and Table A3.26, respectively.
The conductor teraperature variation during the duration of the creep tests
is given in Figure A3.21.
As a result of the stress strain test results for the conductor saraple
frora the Toraago to Taree transraission line a creep test was not carried
out.
Furthermore, as a result of the inadequate saraple length, no creep test
were carried out on the conductor sample frora the Bellarabi to Heathcote
transraission line.

351
A3.3.4 Breaking Load
The test results and test result datura for the conductor saraple frora the
Tomago to Taree transmission line are given in Figures A3.22 and A3.23 and
Tables A3.27 and A3.28.
The test results and test result datum for the conductor sample from the
Avon to Keraps Creek transraission line are given in Figure A3.24 and A3.25
and Tables A3.29 and A3.30.
The test result and test result datura for the conductor saraple frora the
Dapto to Springhill transraission line are given in Figures A3.26 and A3.27
and Tables A3.31 and A3.32.
Breaking load tests was not carried out on the Bellarabi to Heathcote
transraission line conductor sample.
A3.3.5 Lay Lengths
The lay lengths for the conductor saraples from the Dapto to Springhill and
Avon to Keraps Creek transraission lines are given in Tables A3.33 and A3.34
respectively.
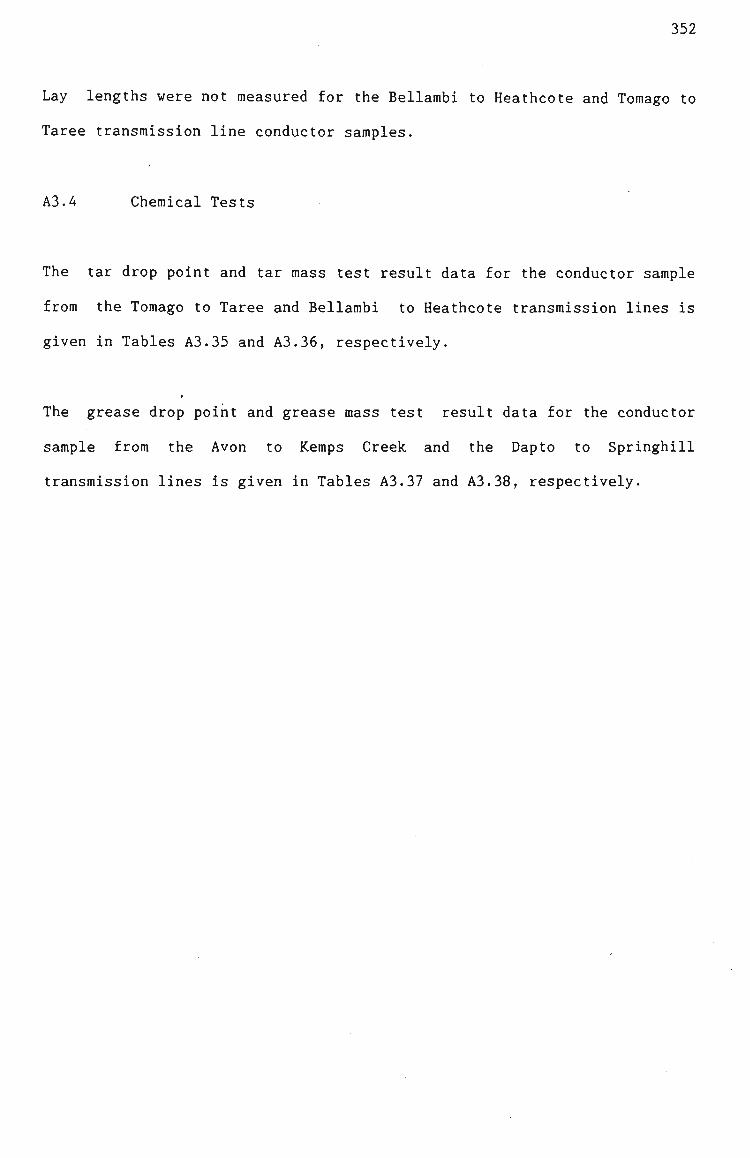
352
Lay lengths were not raeasured for the Bellarabi to Heathcote and Toraago to
Taree transraission line conductor samples.
A3.4 Chemical Tests
The tar drop point and tar raass test result data for the conductor sample
frora the Toraago to Taree and Bellarabi to Heathcote transraission lines is
given in Tables A3.35 and A3.36, respectively.
The grease drop point and grease mass test result data for the conductor
saraple frora the Avon to Keraps Creek and the Dapto to Springhill
transraission lines is given in Tables A3.37 and A3.38, respectively.

353
PLATE A3.1 - AVON TO KEMPS CREEK TRANSMISSION LINE 24 WIRE ALUMINIUM LAYER OR OUTSIDE LAYER
PLATE A3.2 - AVON TO KEMPS CREEK TRANSMISSION LINE 18 WIRE ALUMINIUM LAYER
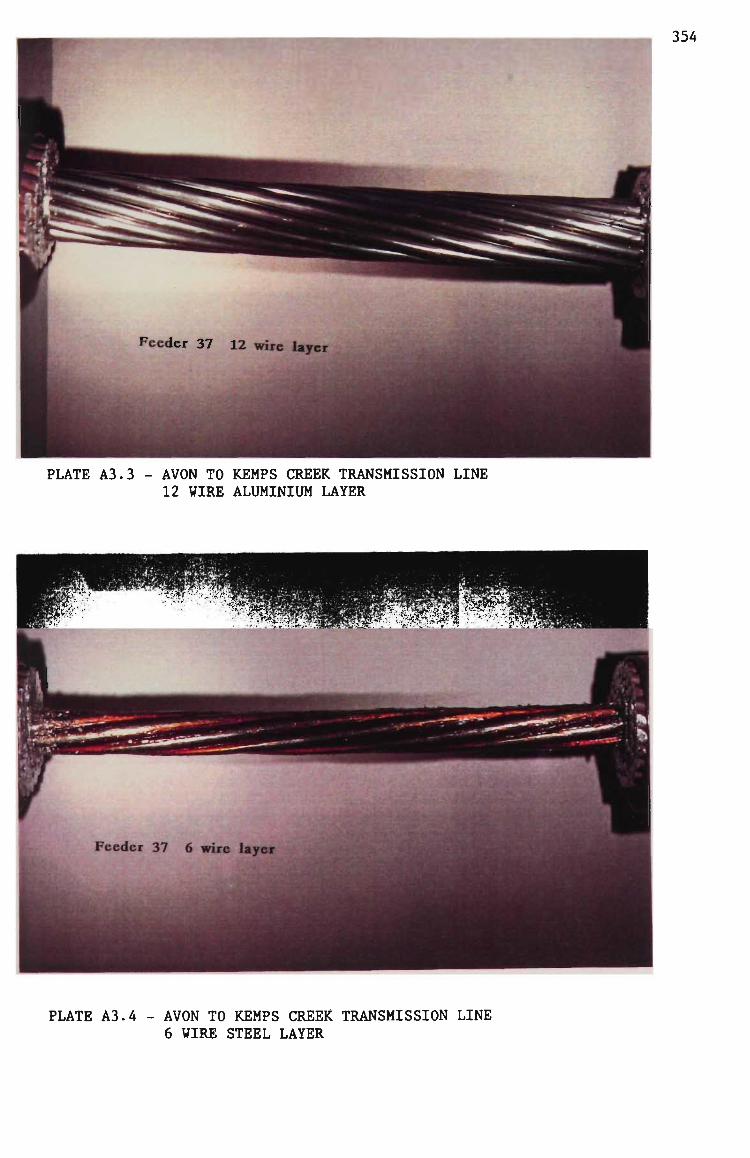
354
PLATE A3.3 - AVON TO KEMPS CREEK TRANSMISSION LINE 12 WIRE ALUMINIUM LAYER
PLATE A3.4 - AVON TO KEMPS CREEK TRANSMISSION LINE 6 WIRE STEEL LAYER
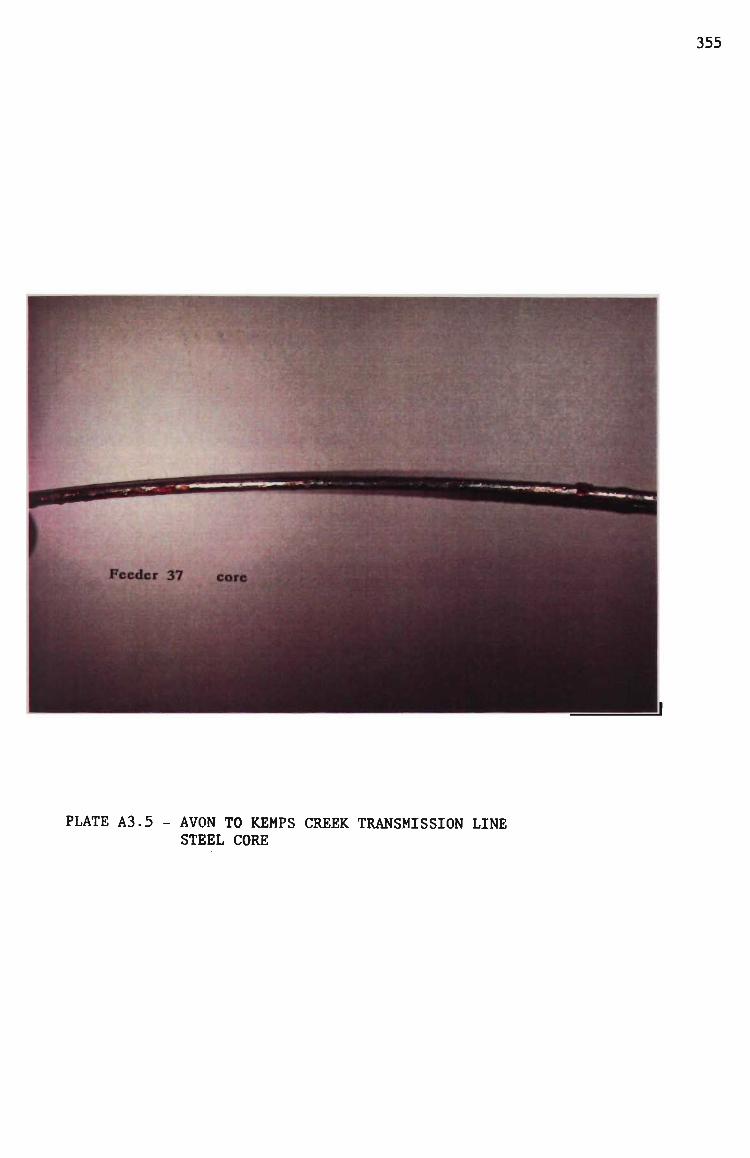
355
PLATE A3.5 - AVON TO KEMPS CREEK TRANSMISSION LINE STEEL CORE
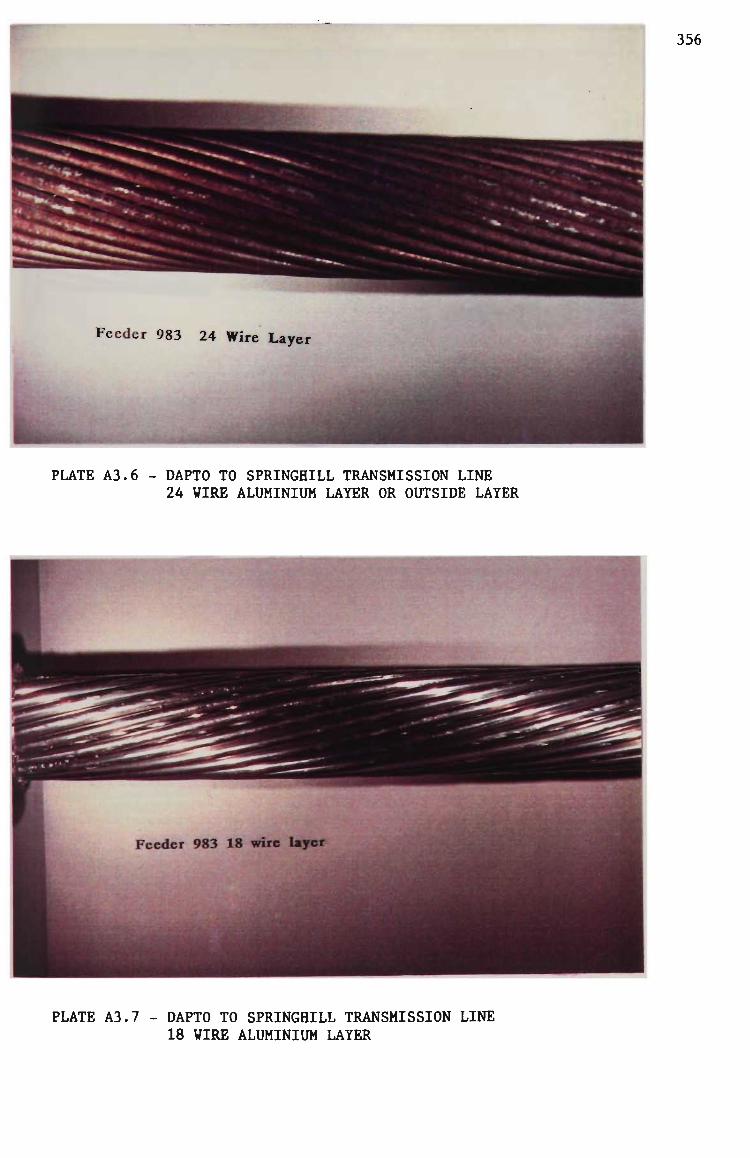
356
Feeder 983 24 Wire Layer
PLATE A3.6 - DAPTO TO SPRINGHILL TRANSMISSION LINE 24 WIRE ALUMINIUM LAYER OR OUTSIDE LAYER
PLATE A3.7 - DAPTO TO SPRINGHILL TRANSMISSION LINE 18 WIRE ALUMINIUM LAYER
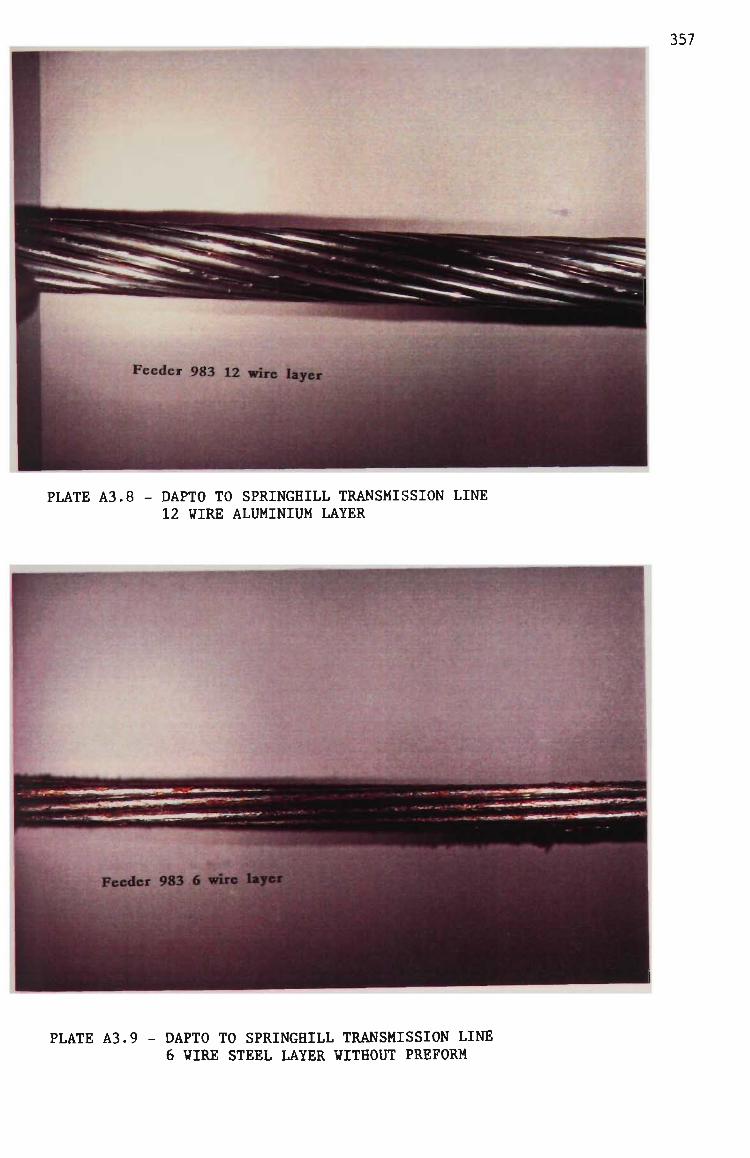
357
PLATE A3.8 - DAPTO TO SPRINGHILL TRANSMISSION LINE 12 WIRE ALUMINIUM LAYER
PLATE A3.9 - DAPTO TO SPRINGHILL TRANSMISSION LINE 6 WIRE STEEL LAYER WITHOUT PREFORM
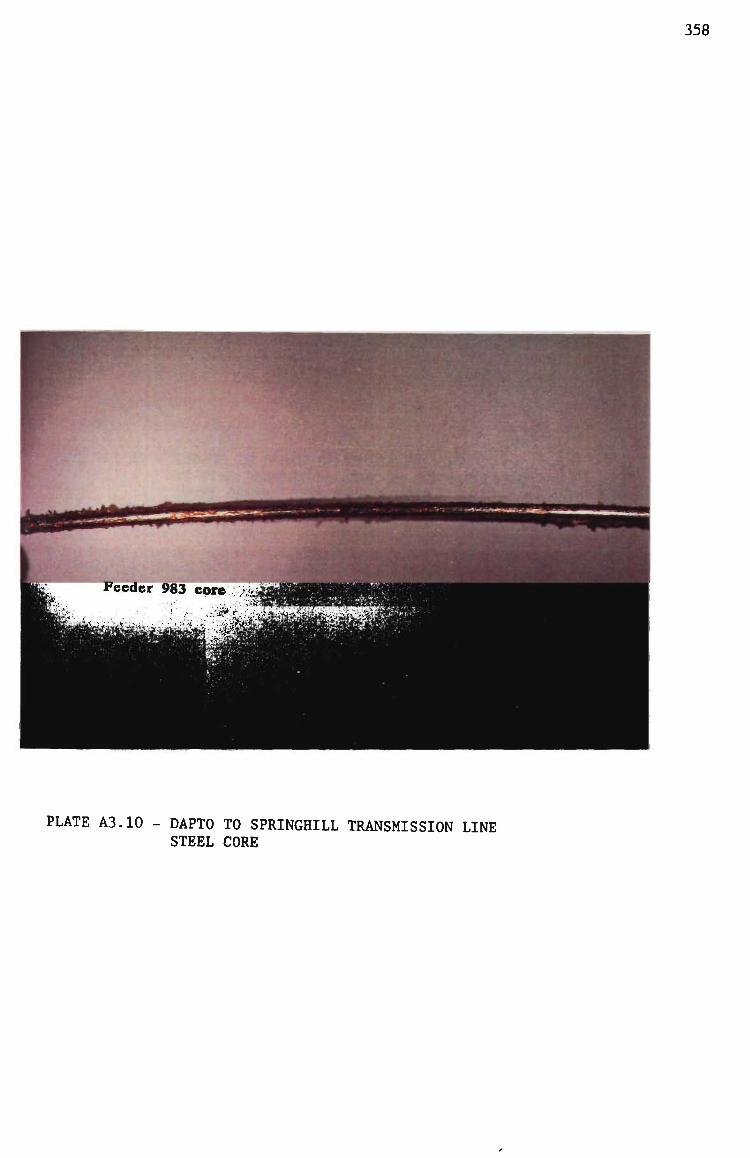
358
PLATE A3.10 - DAPTO TO SPRINGHILL TRANSMISSION LINE STEEL CORE
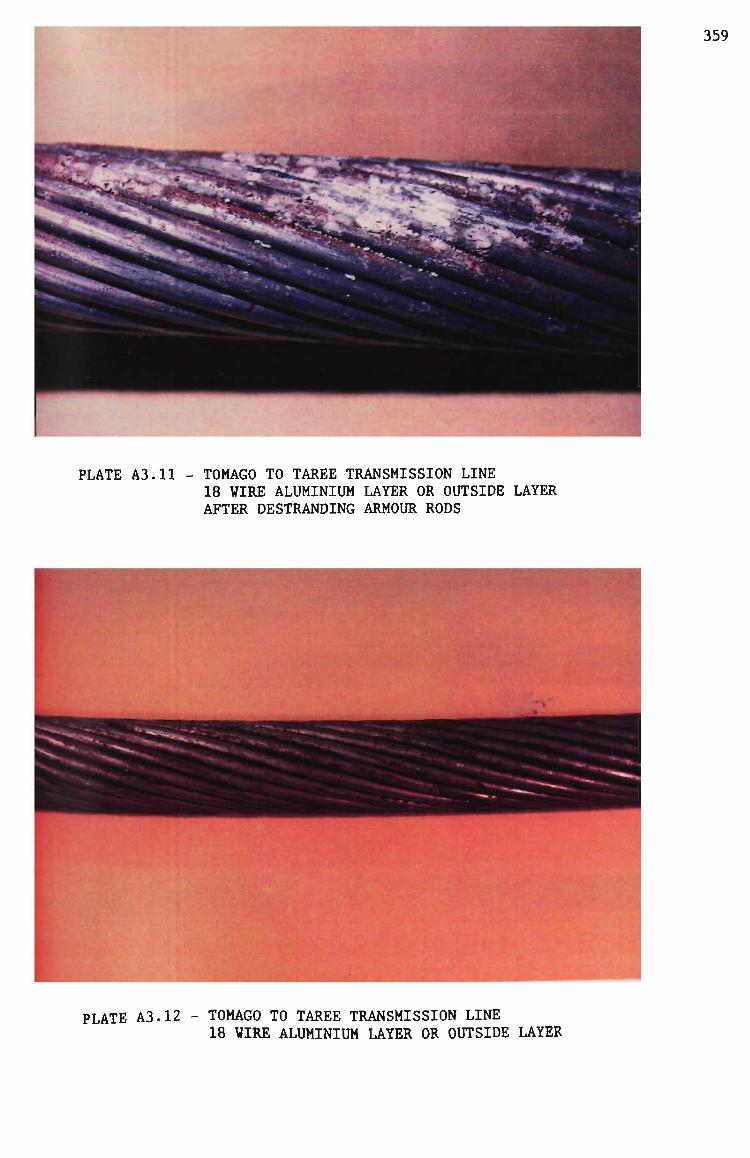
359
PLATE A3.11 - TOMAGO TO TAREE TRANSMISSION LINE 18 WIRE ALUMINIUM LAYER OR OUTSIDE LAYER AFTER DESTRANDING ARMOUR RODS
PLATE A3.12 - TOMAGO TO TAREE TRANSMISSION LINE 18 WIRE ALUMINIUM LAYER OR OUTSIDE LAYER
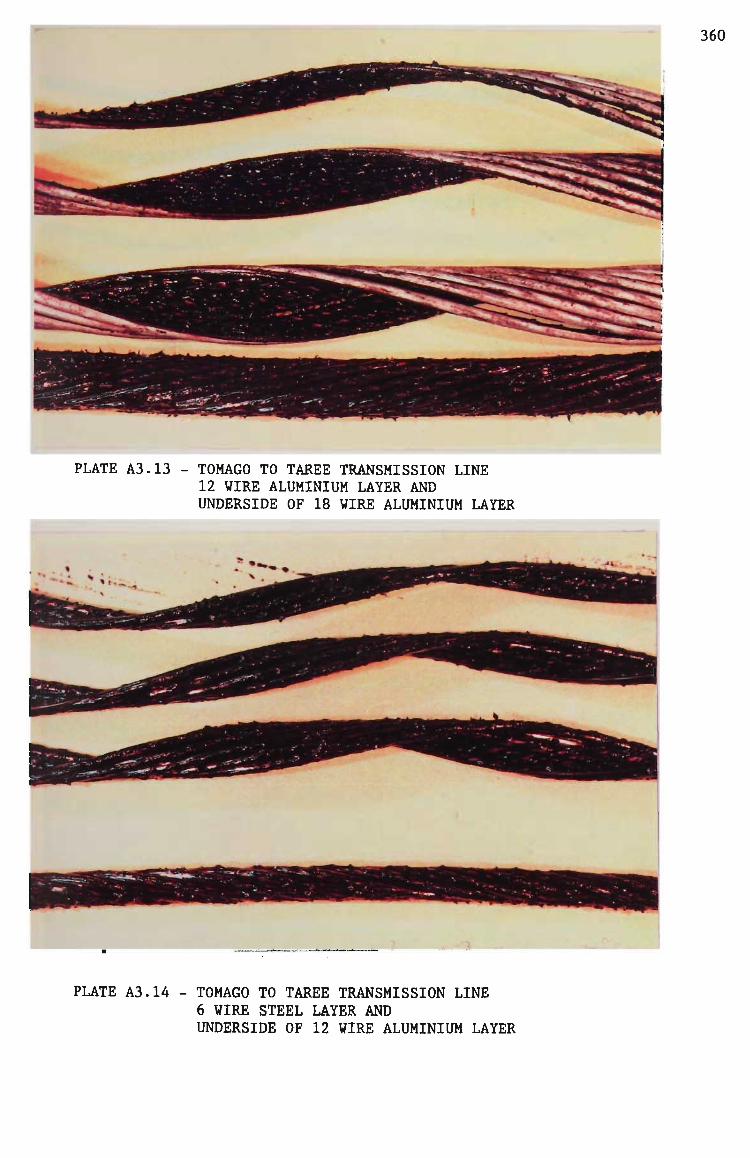
360
PLATE A3.13 TOMAGO TO TAREE TRANSMISSION LINE 12 WIRE ALUMINIUM LAYER AND UNDERSIDE OF 18 WIRE ALUMINIUM LAYER
PLATE A3.14 - TOMAGO TO TAREE TRANSMISSION LINE 6 WIRE STEEL LAYER AND UNDERSIDE OF 12 WIRE ALUMINIUM LAYER
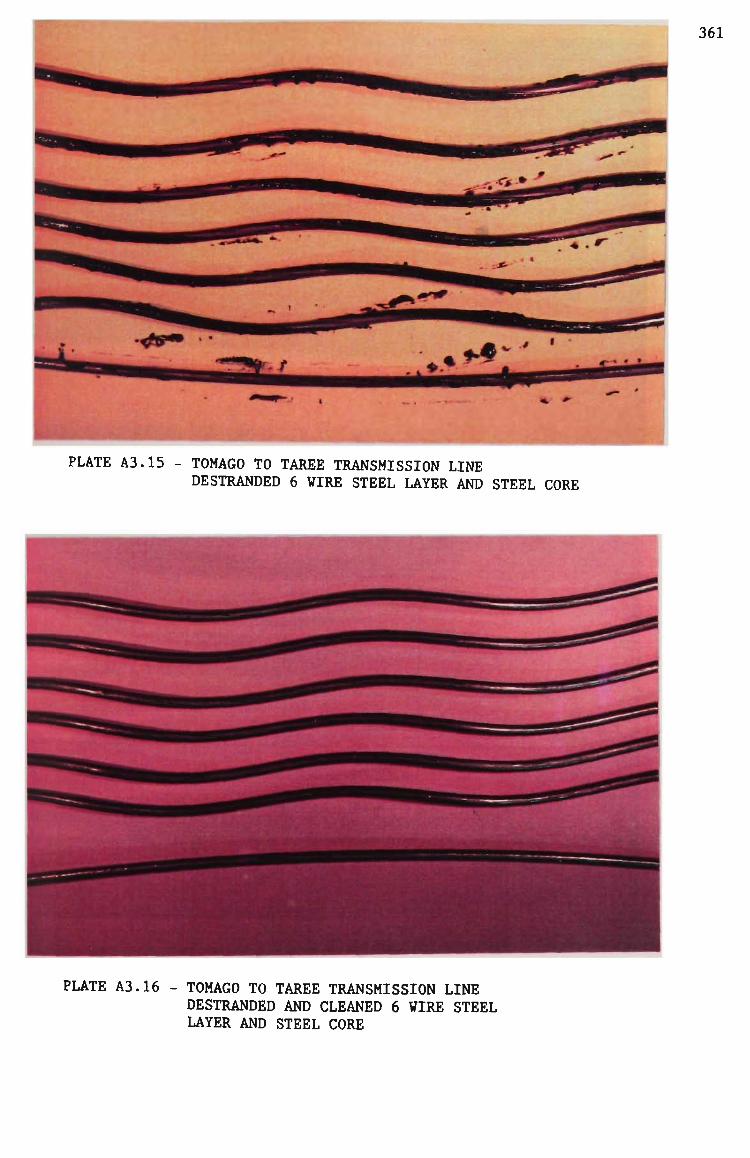
361
PLATE A3.15 - TOMAGO TO TAREE TRANSMISSION LINE DESTRANDED 6 WIRE STEEL LAYER AND STEEL CORE
PLATE A3.16 - TOMAGO TO TAREE TRANSMISSION LINE DESTRANDED AND CLEANED 6 WIRE STEEL LAYER AND STEEL CORE

362
PLATE A3.17 - BELLAMBI TO HEATHCOTE TRANSMISSION LINE 18 WIRE ALUMINIUM LAYER OR OUTSIDE LAYER
PLATE A3.18 - BELLAMBI TO HEATHCOTE TRANSMISSION LINE 12 WIRE ALUMINIUM LAYER AND UNDERSIDE OF 18 WIRE ALUMINIUM LAYER
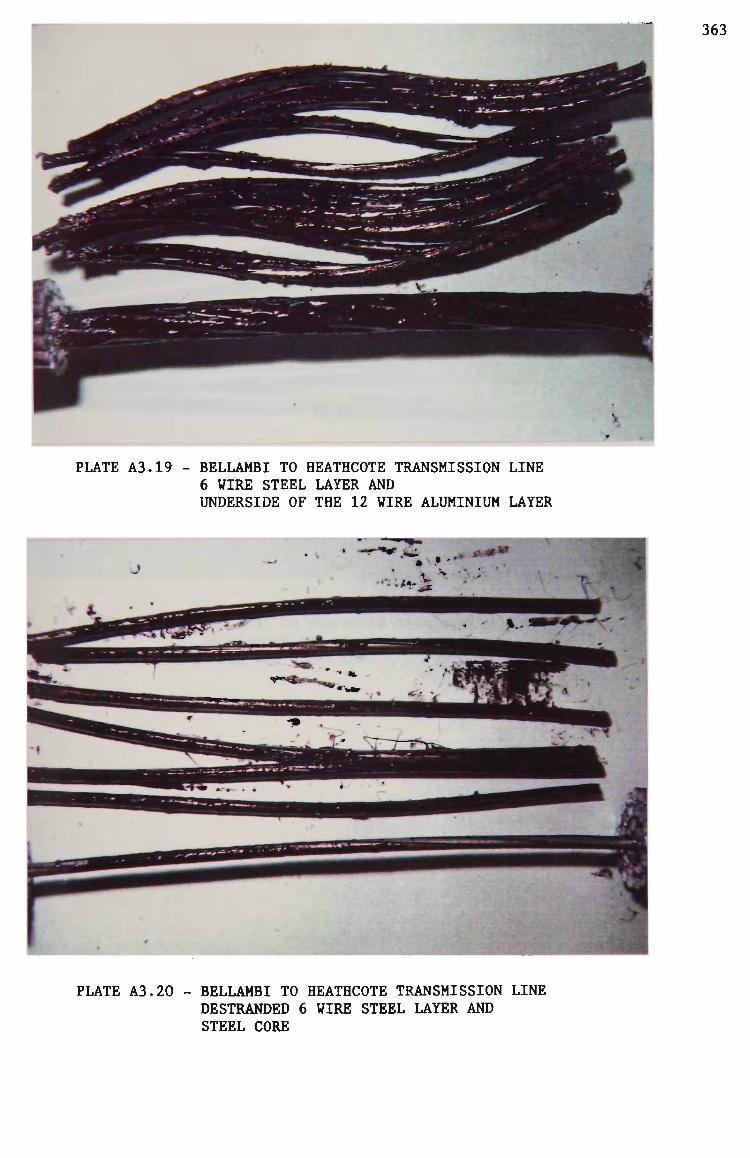
363
PLATE A3.19 - BELLAMBI TO HEATHCOTE TRANSMISSION LINE 6 WIRE STEEL LAYER AND UNDERSIDE OF THE 12 WIRE ALUMINIUM LAYER
PLATE A3.20 BELLAMBI TO HEATHCOTE TRANSMISSION LINE DESTRANDED 6 WIRE STEEL LAYER AND STEEL CORE
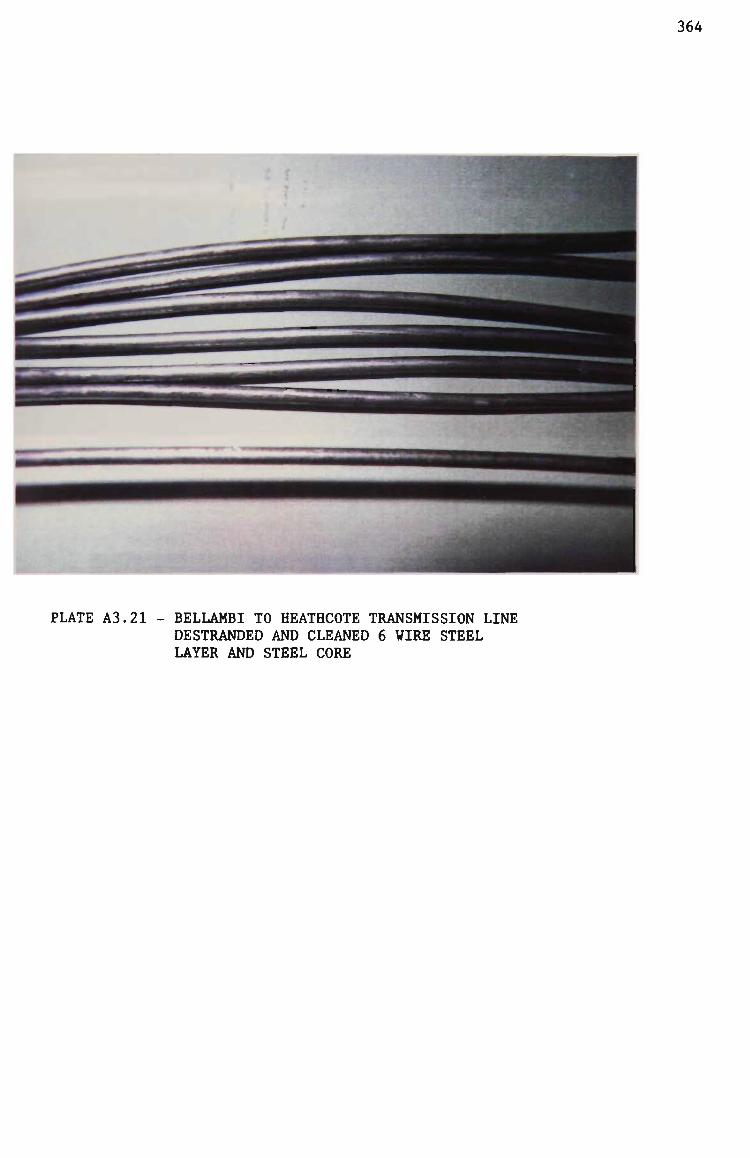
364
PLATE A3.21 - BELLAMBI TO HEATHCOTE TRANSMISSION LINE DESTRANDED AND CLEANED 6 WIRE STEEL LAYER AND STEEL CORE

365
PLATE A3.22 - TYPICAL ELLIPTICAL AREA DAMAGE OF ALUMINIUM STRANDS
PLATE A3.23 - LONGITUDINAL SECTION OF ELLIPTICAL AREA DAMAGE OF ALUMINIUM STRANDS XlOO
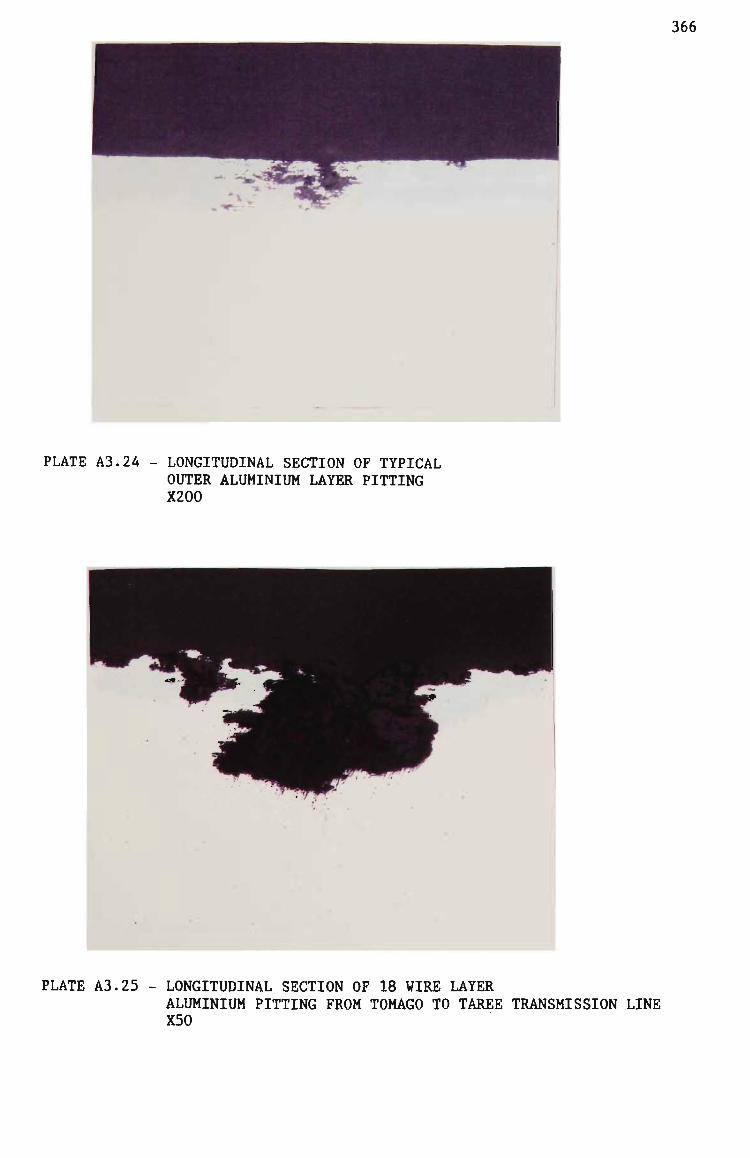
366
PLATE A3.24 - LONGITUDINAL SECTION OF TYPICAL OUTER ALUMINIUM LAYER PITTING X200
PLATE A3.25 - LONGITUDINAL SECTION OF 18 WIRE LAYER ALUMINIUM PITTING FROM TOMAGO TO TAREE TRANSMISSION LINE X50

367
PLATE A3.26 - LOSS OF GALVANIZING FROM STEEL CORE FROM TOMAGO TO TAREE TRANSMISSION LINE X200
PLATE A3.27 - CORROSION OF STEEL WIRE FROM 6 WIRE LAYER FROM TOMAGO TO TAREE TRANSMISSION LINE XlOO

368
u
« >l\
ID U
B
e < <n u
s B
iJ
B e
u
e
V.
« >< « I-I
0 V. •H
ft u>
«<! v> u
B B
u (B 4-> ID B
< u
B
e
u
(D
•H Q
O .H .H O t » 0> VO r * fN vxj ir» ^o 00 r* o> 00 o 00
01 o> 9 \ o> o a>
.r in lO
M • *
in
CO p» in
•w
^ m
ro m n ro
• *
p-
r-
in in OO
fM m OO
in in t-
r> VO I~
m M p«
o n OO
c t t o a > c f \ < j \ o \ o \ o \ o \ o > o \ Q ^
lA tn irt tn
<o CM in
r» CM
m
(N • *
in
rl I"
m ^ fN in
in rM in
o (N m
r o n r o fO (**» CO
VO VO
p- r- r* 00
ro rn fO
CM r» r -
o>
00
o ^ 9 > ^ o ^ o ^ o ^ o > o ^ o ^ o ^ c ^ o ^ o t d a ^ o ^ o ^ o ^
rH
ro in
n fM in
r l
o in
r~ ro
m
00 IN in
VO ro
m
-1 in in
CO (N in
CN CM
m
ro CO in
in ro in
tn iH m at n rr m c>t lo m m m
f o r o p o n r o f O f O f i ro ro ro ro po ro
2
o to w
S 01
H U US
u us o
s o % < u
s < z o IH
u u Ul
Ul
Ul o OS u
ro rH
m
CT>
m o m
m
'J' (N
o>
a>
VO rl o»
o>
^ • *
01
o
n rH 00
o%
rH
r-CO
CT^
in CO
m
cn
VO
a 00
a\
fO
^ o\
(Tl
rH (Tl CO
o>
in
o CO
<j\
a\ rH (3\
(Tl
r p-CO
o\
VO rH
<n
tn
CO CO (T>
(Tl
O r l CO
Ol
(M CO 00
(Tl
O OO CO
o>
rH CM (T»
cn
VO <TI CO
(T>
'S" m CO
(Jl
CM in in
rH in in
^ m m
ro in in
00 m in
^ n m
in VO Ol 00
in m tn
fO PO "« PO o m in
^ m
CO
m in m
• »
m in m
in in
CO in in in in in m
PO PO PO PO ro PO PO PO PO PO
< N P o ^ i n \ O P * o o o > PM n p>i
PO PNI

369
B B
< Ul u
B e u m o B a
u o >. Kl >J
O IH •H
» VO
<: Ul u
e s IH
(B 4J (D e Id
u a >i la bj
(D ki
< Ul U
e s
u (D >. Kl
a O v. •H S 00 rH
e B < Ul u
e a IH
9 U (D s IS
6 S
Ul o
ID
9
s (d
e Id
VO Ol
00 00 CO
CN
o CO
o> >o CO
in ro Ol
CO CO <T>
VO P-o
o\ Oy C-i o\ 9\ o
in in m in in
00 in
VO CM CM in o <TI
P-m CO
rH VO VO
o rH P-
0 > C T I O > O l < T \ d O V d O %
P-o
a> 00 o^ CM
in in in in
in
^ in
CM m m
in in in
l*t f^ M m fO fO CO
a\ ov >o
p-p-p-
cn Ol r~
o\ VO p-
cn m at
o ro l~
r1 CM CO
a\ o\ f
VO VO P-
rl V en
rH
^ p»
r» in CO
p-•a-VO
o in VO
VO rH !J>
in in VO
in CO p-
vo rH O)
o ^ o ^ o ^ O f f » w o ^ o ^ o \ o ^ o ^ o ^ o * o ^ ^ o \ O l O ^
VO to o^ VO <N \o rs m <N in PO PO r*
t n i n t n m i n i n t n i n m
p-in in
rH CM m
CM • *
m ^ o in
m o in
fO
m m
VO o in
o\ CM in
ro m m
M CO (T, {rt pn ro ro ct fry ro
o
o
CN 00
00
in m
CO •-I p-
in p-<n
rH • *
<J>
<N O o>
o o> Ol a^ Ol (T> o iTi 0\ 0\
r o (T\ VO CO CO r H r H CO CTl O (T( O
Tl O
in ro P- rH 0> (T>
m -SI* "^ CM O VO O rH O
O O O
r» m rH O o o
u z ts O Ul
S Ul
•J M
B M
m 0. Ul O tH
o tH B.
<< U
z o
u Ul
Ul Ul O at o
u
tH
'J"
p-in
'S" VO m
p-
^ in
rH VO m
CN VO in
rH VO lO
O VO
in in in in
o in in
(O in in
rl r-m
ro in in
.r p-in
CO VO in
CM in in
PM r-in
VO CO in
Ol r-in
rH
P-in
Ol VO in
CM ro ^ in VO
ro ro ro CO CO
<N Ol CM ro CM
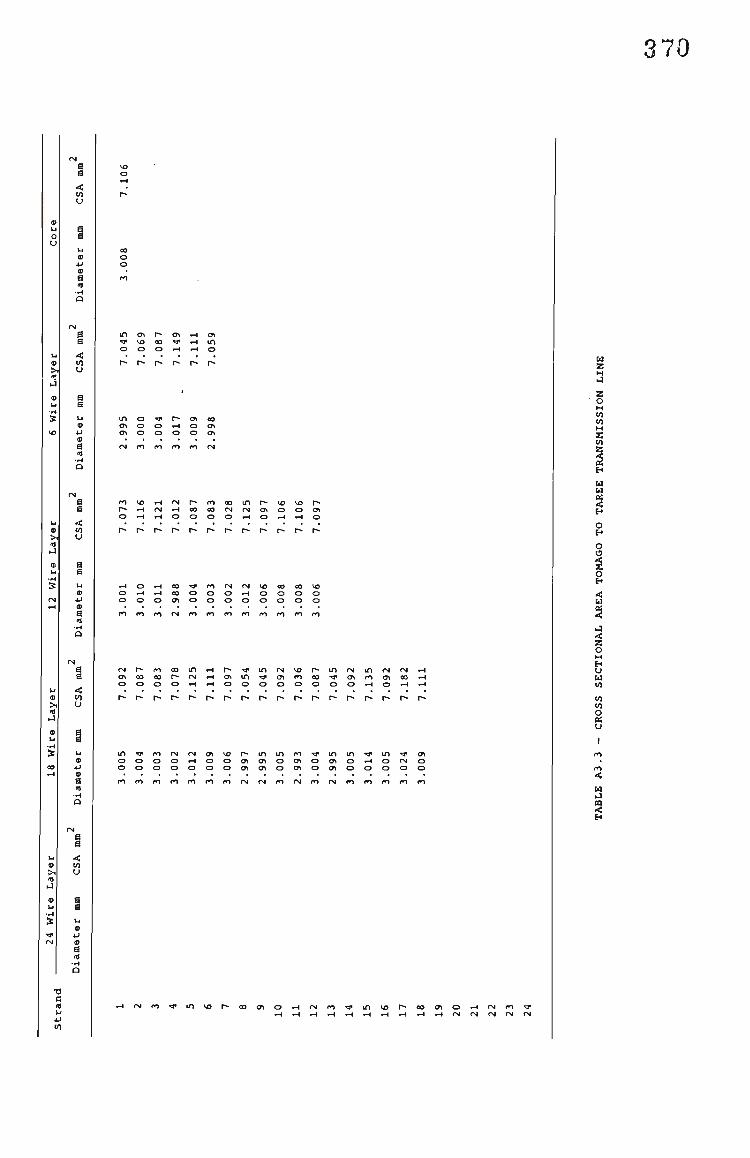
370
k. a > i t • J
B
a < Ul
u
a E < u
B B
u <a
4J 9
a
a a < Ul u
o 9
a Id
IH 9 >. Id
I- )
9 U
B
e < Ul u
a B
Ul
u
9 JJ 9
a Id
•d a Id u
VO
o
o o
VO o
o> lA o
in O l O l
o o o
T
o o
p-r H O
a\ o o
CO
ot O l
ro CO CN
r o VO rH rv| P- rH rv( rH O rH rH
CO 00 i n
O
P-o o r~ p>
VO
o r H
VD O r H
P -O l O
O rH . - I o o o
CO CM CM VO 00 00 VO O O o
r o r o c r i C M r o c o c o m r o m c o r o
CM r» m m CN r H
r H r H r l
P-Ov O
•:r in o
m 'a-o
rvi O l
o
VO CO
o
p-CO
o
m •<3>
o
rM O l
o
m CO r H
f M O l O
p- r~ p- p-
in o
ro (N CM o» O O rH O O O O O
VO
o o
p-O l O l
in O l (Tl
m o o
CO (T l O l
1 «
o o
m < j i <y\
CM CM CO PH
r» r» p- p-
m 'a' Ol o rM o o o o
to ro ro
U
z
z o Ul Ul
s 01
U U
o tH
o <9
o tH
< u I-I < z o M tH u u Ul
Ul Ul
o
H ij
rH CM ro ^ m lO P* rH CM ro m VO i^ CO m rg CM CM
ro fM

371
a a < Ul u
fM <o
O (J
9 4J
Id > - l
Ul
a a u 9 4J 9
a Id
P-P-VO
fM CO Ol P* VO VO
- Ol > p-D VO
in cn VO
o 00 VO
o Ol VO
o\ o p-
9
>^ Id iJ
9 IH
< U l
9 JJ 9
a Id
fM fM 00
VO
<n m
CO in p»
fM ••* VO
o rH CO
Ol CO CO
rH
m ao
o o r-
(Tl VO
PI ro rH rH O
VO 00 VO p-
CO ro
i n rH rH
r~ P-
ro ro
t- rH n (Tl P - VO lO
ro m
9
B B
< Ul
u
00 00
en VO
in
Ol
Ol fM CO o ^ rH O m Ol
9
Id
9 4J 9 a Id
-H Q
a a < U l
u
i n fM Ol ro VO PI
ro P-
.* fM P»
in fM l~
p» CN
r»
VO CM p-
<n r l
r-
pi Ol VO
PO PO PO PO
u
tH
a a u 9
JJ 9 a (d
•o c Id IH
H-l U l
fM ro ^ i n VO P" P I
ro .a* fM PH
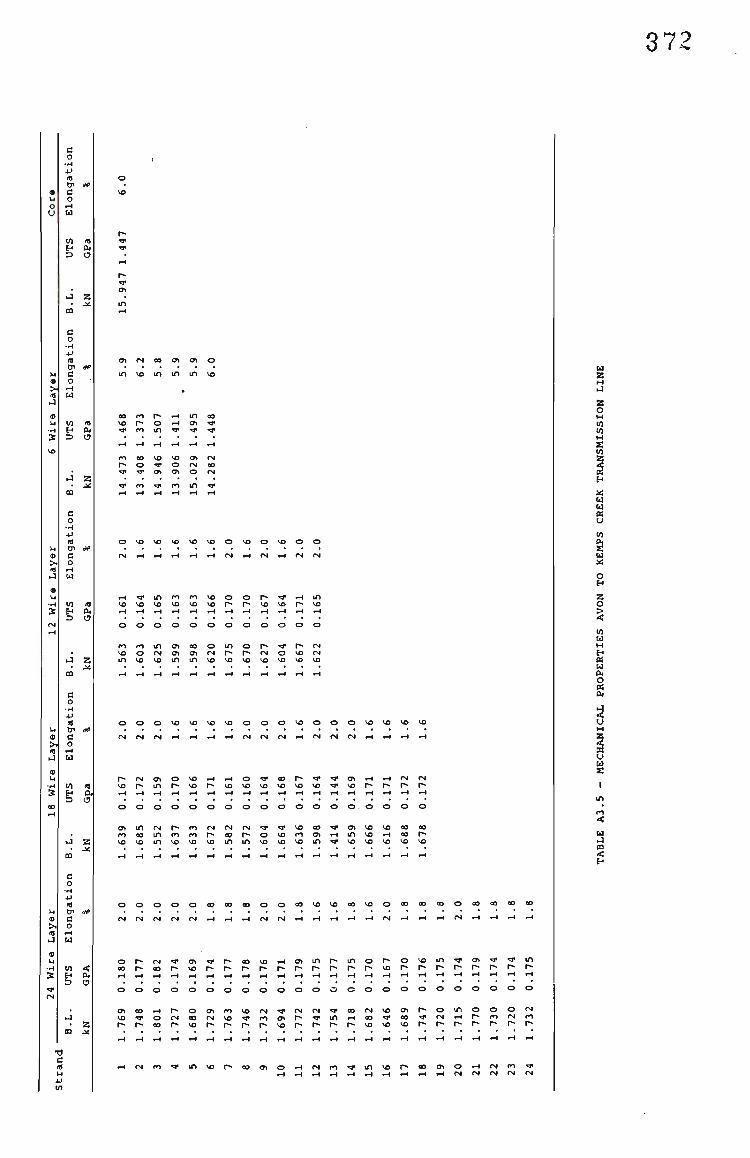
372
o u
C3 o
•H •u Id tJl 0» a o
rH U
Ul Id
^ Z ca
a o H
Id
e o > . -H
Da
Ul tH
D
9
Id
I . 9 >. Id
u a
Id
I-I Z
cn
01 *> a o
Ul (d EH PH
•J z m
o •H HJ Id Ol rfC a
Id
a
•J a
c o
•H JJ (S Ol *(> c o
—I a
Ul « ; tH 0 . 3 a
•J • Z
03 M
c: Id u
Ol
o VO
p~
cn
Ol fM CO Ol o t o
in VO m in in lo
VO
^
ro P-•a"
*)•
t~ CO
CO
o ^ ro
o in
VO •«r Ol
>ii<
rH 1<
VO
o Ol
ro
(Tl •«1"
<n fM
o m
^ «>•
fM 00 CM
.»
v o v o ^ v o v o o v o o v o o o
. - i ^ i n p o p o v o o o r * ' ^ * - i i n v o v D v o v o v o v o r * r * * v o v o r ^ v o
o o o o o o o o o o o o
m VO VO
Ol (Tl
in
OO Ol in
o CM VO
m l~ VO
o p-
vo
1^ CM VO
<• o VO
o o o fM fM <N
VO VO VO VO O O O
rH rH rH rH fM CN fM
O O O VO VO VO VO
fM CM CM rH .H rH rH
CM P>
O P-
o VO
rH rH fM r» P- t~
m in fM ro CO in VO VO in
CN fM rM r» 00 P" VO m m
Ol VO VO rH m «]< VO VO
rH OO VO VO
O O O O O C O O O O O O O C O V O V O O O V O O O O O O C O O O O O O O O C O
( N C N C M f M f M r H r H r H f M C M r H r H r H r H r H C M r H r H r H f M r H r H r H r H
o p ^ f M ^ o ^ T i » p * o o v o r H o i i n r ^ i n o ( ^ o v o i n ' ^ o i ^ ^ i n C O P * C 0 t ^ v O p . I ^ p » p » p - P * P * ^ P ' P " V o P * P * P * P * P ' P » P * P *
O O O O O O O O O O O O w C O O O O O O O O O O
0 1 C 0 r H P * O 0 1 f 0 V 0 C N - . 3 ' C N ( N r f 0 0 f M V 0 O l P * O i n O O O C M V O ^ O f M C O P I V O ^ r O O i r * ^ i n r H O O ^ C O ^ f M r H P * C O f M m
p » i ^ o o p » v o p * p » r ^ t ^ v o P * P ' P * p * v o v o v o p ^ i ^ r ^ p * p * r * i ^
r H C M r o ' V i n v o r ^ c o m o r H f M c o i i i i n v o r ^ c o o i O r H f M r o H j . — I t H r H r H r H r H r H r H r H r H r M C M f M C M C N
u z z o Ul 01
s Ul
H U M O
01
u s<i
o tH z o % 01
u H tH tn u PH
§ 0.
u ij to

373
a o
•H HJ Id O' I**" a o
-H
u 9
>. m i j
9 IH
• H
ft
J
m
c o
• H 4 J Id 0 1
c o rH
u
Ul H s
Z J.;
.»>
(0 p. ID
J z m
o •H 4J Id 01 rfP c o
TJ. CO O VO o o
VO i n VO m VO VO
ro m CN in Ol TT
r H
i n i n
i n
ro VO o
m
CM TT ro
m
r H VO r H
i n
O l r~
^
•fli
ro (T l o
m in in in tn
u
Vi
o
> I d
J
o
S o
• H 4 J Id 0 1
a o - H
z JC
(W
Id
01 Id tH a 3 O
•4 Z • JC
19
C o
•H 4J Id Ol liV C o
rH
rH [~ r^ GO
rH P-[^ VO
t n (Tl VO 00 fM CM CM Ol
VO VO VO VO VO VO ^ ^ VO VO VO VO l O
r O O C M i n v o O l o O r H C M O O r H O i n v O T J i C N V O C O o o c o v o v o c o p » p * o o v o r ^ v o r ^ r ^ r ^ c o p » p » P *
o o o o o o o o o o o o o o o o o o
p-CM CO
TT P -P -
• *
CO m
i n VO p-
f M r» i n
CN Ol CM m VO
73
a Id u
VO VO VO fM V O V O V O ^ C O V O C M V O V O
"a" o p-
"S-i n r«
CO CO CO
O l I ~ I ~
0> ro P*l <N » fN
" J p-r»
<n ro VO
00 VO t~
tn VO tn 00 <7\ VO rg fN
*H fN fO

374
9 U
n u
c o
-H JJ (rt Ol
c 0 rH CO
Ul H
a
iX>
(d 0 . O
• JC
m
a o
•H JJ Id 01 e o
u 9 > i Id iJ
9 U
-H
ft
.J
m
a 0
•rl 4J Id Ol
c o rH
U
01
g
Z JC
«>
Id P I
u 9
>| Id KJ
9 IH
•H
ft
0 •H +J Id Ol
e 0 r-i U
01 tH
• JC ca
Id
IH 9 >1 Id •-)
9 U
•rl
ft
>-I
m
c 0
•H 4J Id 01
c 0 —1
u
Ul
tn a
a JC
oV
«<: p. (3
a Id V . JJ 01
VO CO VO rr 00 VO
in in in in in in
00 VO CM rM (Tl P* r~ rH fM VO rH rH ro ^^ ^* Tj. ^1 .J*
rH rH CO in Ol O P» O O -^ O O
Ol O O O O O
C M ^ O O - ^ O O V O O O V O ' d ' V O O
r H r H r H r H r M r H . - ) r H r H r H . H f M
v o c o v o p - o i i n r o o i v o o r o v o m v o m v o v o i n t n i n i n v o v o t n
o o o o o o o o o o o o
O V O r H t ^ O O C O r O r H r H r H r H f M r H O r H
TT VO r H
v o v o o c o o o c o v o e o o o c o v o o o v o c o o o c o v o
i n m i n c o o r o i n r ^ m i n o i i n i n f M r ^ o o c o c o v o v o v o v o r ^ v o v o v o v o v o v o v o v o v o v o v o v o v o
o o o o o o o o o o o o o o o o o o
r~ r~ t~ en v o p * o o v D r ^ ( T i r ^ v o i n ( n ( j i r ^ v o
rH fM ro rr m VO p- Ol O rH PM . J i m v O P - O O O l O r H f M r O T J i . H r H r H r H r H r H C M C M f M f M C N
z
z o Ul Ul
S Ul
u u
o
o 3
o tH
Ul
u M « u Bl O tn p. <
K CJ
u K1 n < hi
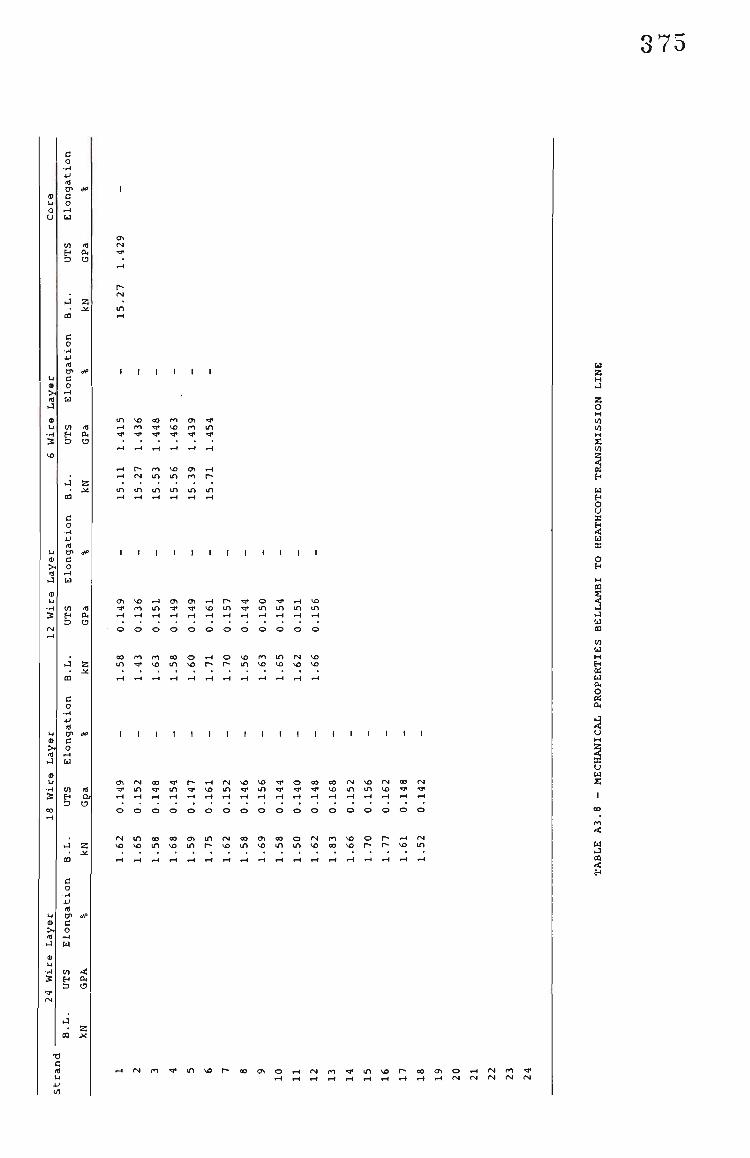
375
9 Id •J
9 u
C o
•rl 4J Id Dl «" a o
rl bl
Ul H S
I d
p. O
cn f M
^ r l
P -PM
J z • JC
CQ
a o
•rl *> Id 01 * • d o
u
01 Id IH 0< a o
u 9
>. Id i J
9 U
• H
ft
•J
M
C 0
• r t U I d 0 1
c; 0
r H
u
0 1 t H
a
a JC
(X"
Id P<
O
J a CO
0 o
•rH •P Id 01 *> a o
rH CI]
01 Id f a a o
u 9 > i Id
I - )
9 LH
• H
ft
J
n
B 0
• H •U Id 0 1
C o
rH
C4
01 FH
a
a JC
*>
< 0. o
c Id k. •u Ul
I I
t n VD CO CO m .1* rH ro .a* VO (n in ^ ^ ^ 1 ^ < ^ ^ ^ 1 ^ft
r H r H
m
r~ f M
m
ro in
in
VO
m i n
O l
ro
tn
r l
1-
in
I I I I I I I I I I
< n v O r H ( n i T l r H P ~ T l « O T I . r H V O
' ^ p o i n ' ^ T 3 < v o i n T r t n t n i n i n
O O O O O O O O O O O O
O O r O C O C O O r H O V o r O i n P M V O
i n T r v o i n v D P * p * i n v o v o v o v D
I I I I I I I I I I I I I I I I
O I P M O O T J i p - r H C M V O V O T J i O C O C O C M V O P M C O C M • g i i n ^ i n ' a i v o i n ' d ' i n T i ' T r . i ' v o i n i n v o ^ ^
O O O O O O O O O O O O O O O O O O
f M i n c o c o t n t n c M G o o i c o o p v i r o v o o r ^ r H C M v o v o i n v o i n p * v o i n v o i n i n v o c o v o p * r * v o i n
fM ro TT m VO O rH fM CO TJ. CM PM CM CN CM
V
s
w •J
<

376
Strand
1 2 3 ' 4 5 6 7 8 9 10 11 12 13 14 15 16 17 18 19 20 21 22 23 24
24 Wire Layer
0.0280 0.0280 0.0280 0.0280 0.0279 0.0280 0.0279 0.0280 0.0280 0.0278 0.0279 0.0280 0.0280 0.0279 0.0279 0.0278 0.0279 0.0280 0.0279 0.0279 0.0280 0.0280 0.0279 0.0278
Resistivity at
18 Wire Layer
0.0279 0.0278 0.0278 0.0277 0.0278 0.0279 0.0277 0.0278 0.0279 0.0279 0.0279 0.0278 0.0277 0.0278 0.0278 0.0278 0.0279 0.0278
20°C ^
12 Wire Layer
0.0278 0.0278 0.0279 0.0278 0.0279 0.0278 0.0279 0.0279 0.0279 0.0279 0.0280 0.0280
TABLE A3.9 - ELECTRICAL PROPERTIES AVON TO KEMPS CREEK TRANSMISSION LINE

377
Strand
1 2 3 ' 4 5 6 7 8 9 10 11 12 13 14 15 16 17 18 19 20 21 22 22 24
24 Wire Layer
0.0282 0.0282 0.0282 0.0282 0.0284 0.0283 0.0284 0.0281 0.0283 0.0283 0.0283 0.0281 0.0283 0.0280 0.0283 0.0282 0.0284 0.0283 0.0283 0.0285 0.0286 0.0283 0.0282 0.0283
Resistivity at
18 Wire Layer
0.0280 0.0280 0.0277 0.0278 0.0281 0.0281 0.0280 0.0281 0.0278 0.0278 0.0278 0.0279 0.0281 0.0280 0.0281 0.0279 0.0279 0.0279
20°C -yOm
12 Wire Layer
0.0279 0.0281 0.0281 0.0280 0.0280 0.0279 0.0273 0.0278 0.0280 0.0280 0.0279 0.0278
TABLE A3.10 - ELECTRICAL PROPERTIES DAPTO TO SPRINGHILL TRANSMISSION LINE
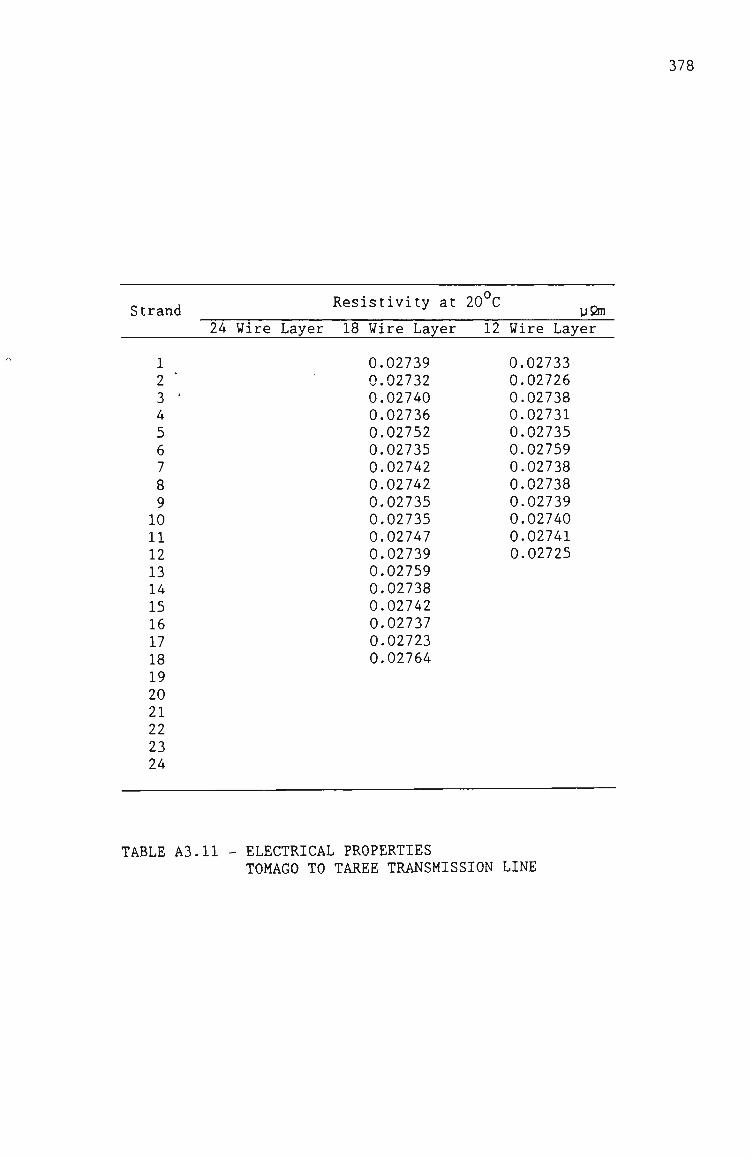
378
Strand Resistivity at 20 C
yfim 24 Wire Layer 18 Wire Layer 12 Wire Layer
1 2 • 3 ' 4 5 6 7 8 9 10 11 12 13 14 15 16 17 18 19 20 21 22 23 24
0.02739 0.02732 0.02740 0.02736 0.02752 0.02735 0.02742 0.02742 0.02735 0.02735 0.02747 0.02739 0.02759 0.02738 0.02742 0.02737 0.02723 0.02764
0.02733 0.02726 0.02738 0.02731 0.02735 0.02759 0.02738 0.02738 0.02739 0.02740 0.02741 0.02725
TABLE A3.11 - ELECTRICAL PROPERTIES TOMAGO TO TAREE TRANSMISSION LINE

379
Strand Resistivity at 20°C ^ ^
24 Wire Layer 18 Wire Layer 12 Wire Layer
1 0.0287 0.0279 2 0.0288 0.0276 3 • 4 - -5 - -6 - -7 - -8 - -9 - -10 - -11 - -12 - -13 14 15 16 17 18 19 20 21 22 23 24
TABLE A3.12 - ELECTRICAL PROPERTIES BELLAMBI TO HEATHCOTE TRANSMISSION LINE
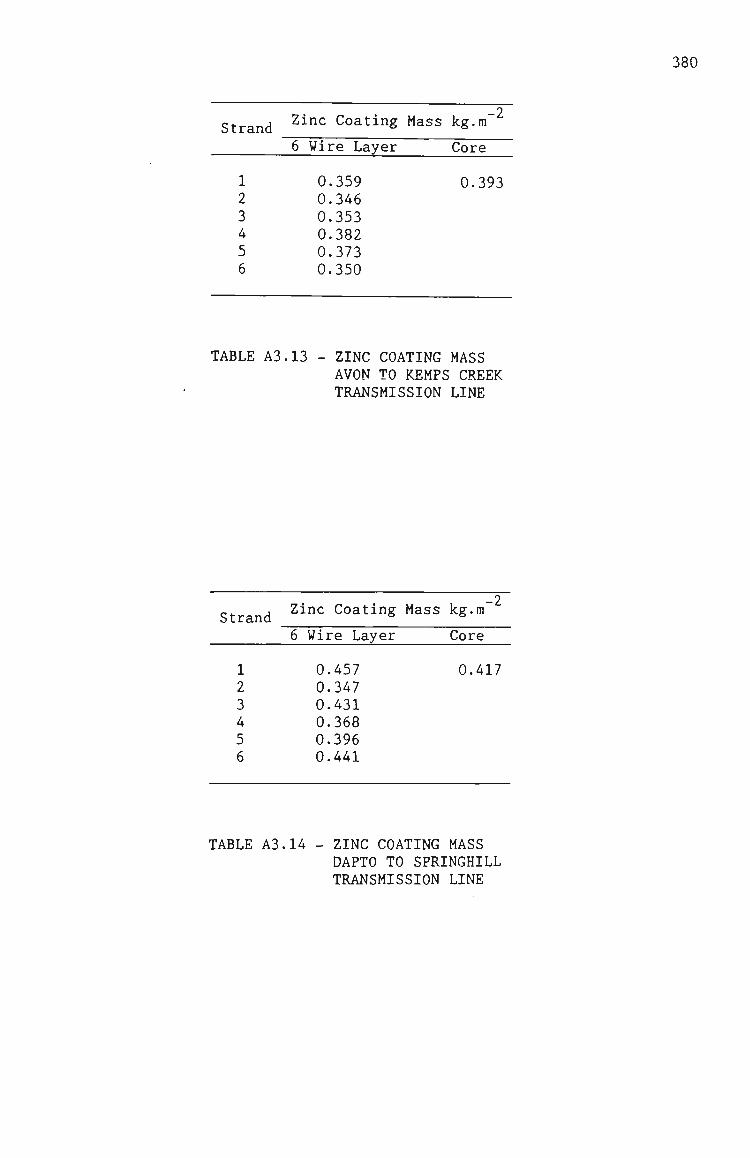
380
-2 Strand ' ' ^ Coating Mass kg.ra
6 Wire Layer Core
1 2 3 4 5 6
0.359 0.346 0.353 0.382 0.373 0.350
0.393
TABLE A3.13 - ZINC COATING MASS AVON TO KEMPS CREEK TRANSMISSION LINE
_2 _ J Zinc Coating Mass kg.m
6 Wire Layer Core
0.417 1 2 3 4 5 6
0.457 0.347 0.431 0.368 0.396 0.441
TABLE A3.14 - ZINC COATING MASS DAPTO TO SPRINGHILL TRANSMISSION LINE
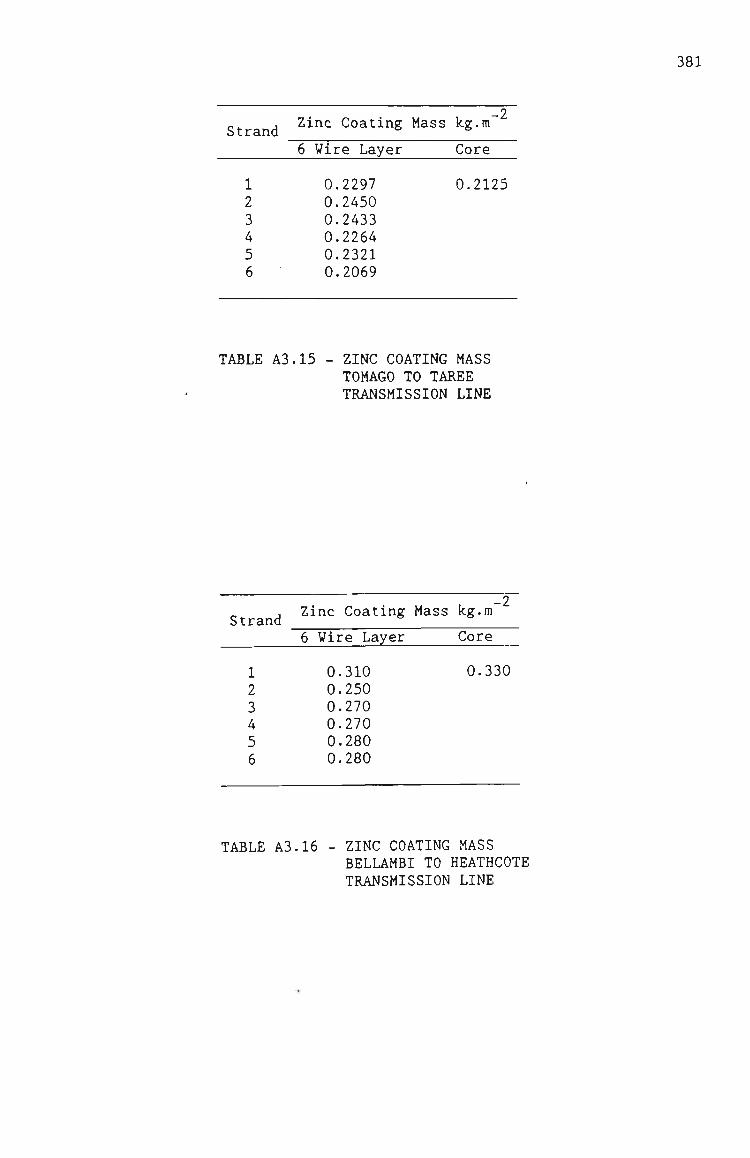
381
_2 „ , Zmc Coating Mass k.g.ra
6 Wire Layer Core
0.2125 1 2 3 4 5 6
0.2297 0.2450 0.2433 0.2264 0.2321 0.2069
TABLE A3.15 - ZINC COATING MASS TOMAGO TO TAREE TRANSMISSION LINE
_2 , Zinc Coating Mass kg.m
Strand 6 Wire Layer Core
1 2 3 4 5 6
0.310 0.250 0.270 0.270 0.280 0.280
0.330
TABLE A3.16 - ZINC COATING MASS BELLAMBI TO HEATHCOTE TRANSMISSION LINE

382
Z
a < o
1000 2000 3000 4000 5000
MICROSTRAIN
FIGURE A3.1 - STRESS STRAIN TEST RAW PLOT OF TEST RESULT DATA TOMAGO TO TAREE TRANSMISSION LINE
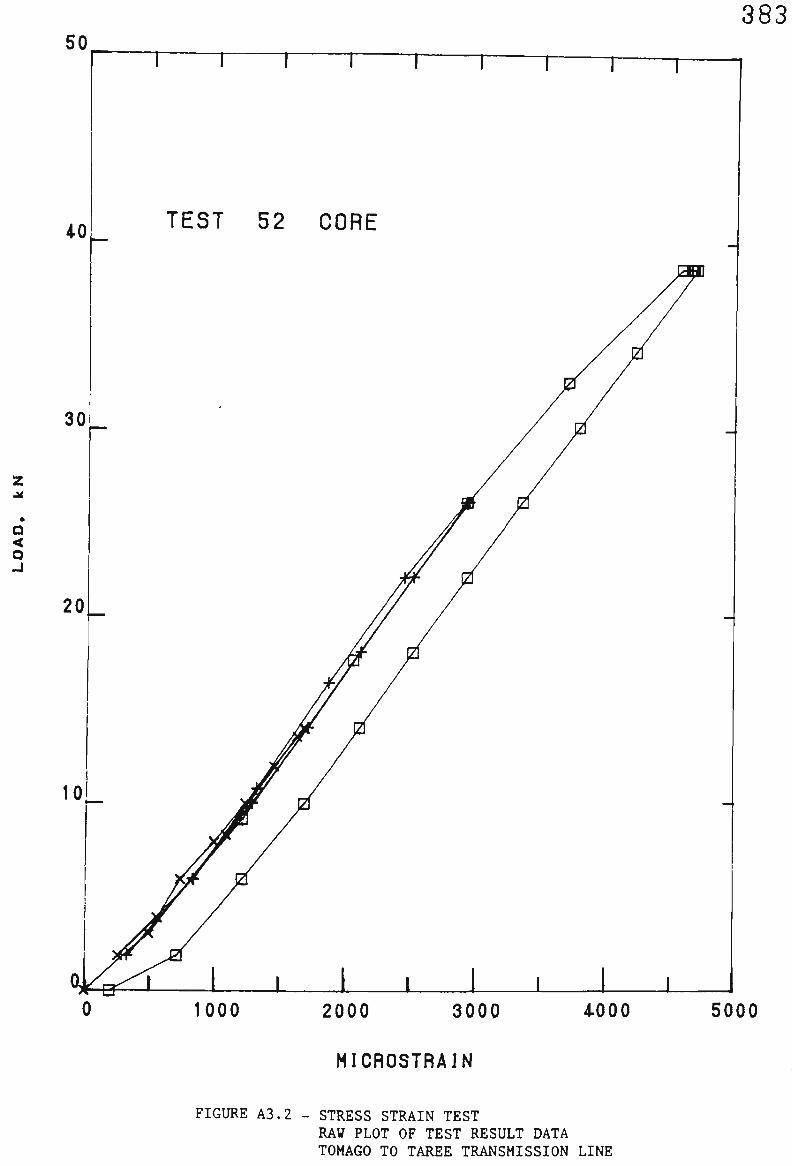
383
2
Q < Q -J
1000 2000 3000 4-000 5000
MICROSTRAIN
FIGURE A3.2 - STRESS STRAIN TEST RAW PLOT OF TEST RESULT DATA TOMAGO TO TAREE TRANSMISSION LINE

250 384
200
150_
r
(0 CO UJ oc (0
100
50
MODULUS TEST 52 PANTHER
X COMPOSITE STEEL ALUMINIUM
1000 2000 3000 4000 5000
MICROSTRAIN
FIGURE A3.3 - STRESS STRAIN TEST DERIVED TEST RESULTS TOMAGO TO TAREE TRANSMISSION LINE
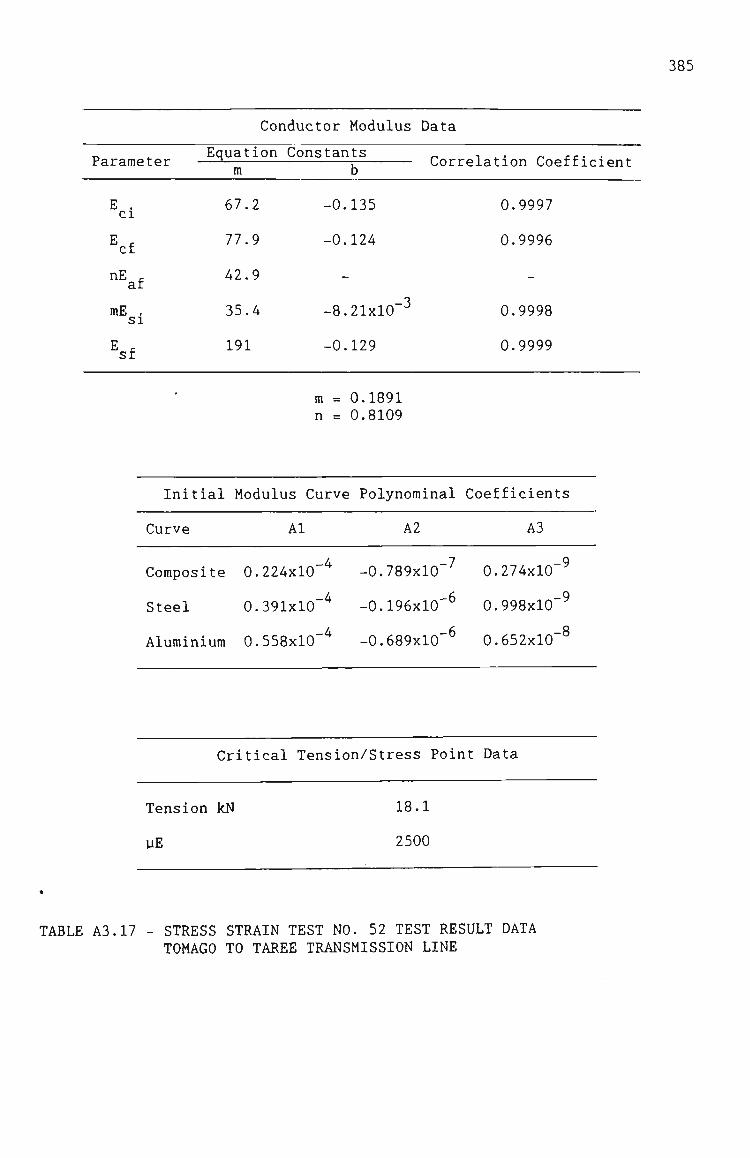
385
Parameter
E . Cl
cf
nE r af
mE , SI
E c sf
Conductor Modulus
Equation m
67.2
77.9
42.9
35.4
191
Constants b
-0.135
-0.124
-
-8.21x10"^
-0.129
Data
Corre ilation Coefficient
0.9997
0.9996
-
0.9998
0.9999
m = 0.1891 n = 0.8109
Initial Modulus Curve Polynominal Coefficients
Curve Al A2 A3
Composite 0.224x10
Steel
-4 -0.789x10 -7 0.274x10 -9
0.391x10"^ -0.196x10'^ 0.998x10 ^
Aluminium 0.558x10 -4 -0.689x10 -6 0.652x10 -8
Critical Tension/Stress Point Data
Tension kN
UE
18.1
2500
TABLE A3.17 - STRESS STRAIN TEST NO. 52 TEST RESULT DATA TOMAGO TO TAREE TRANSMISSION LINE

70
388
Z
Q < O J
TEST 53 COMPOSITE
1000 2000 3000 4000 5000
MICROSTRAIN
FIGURE A3.4 - STRESS STRAIN TEST RAW PLOT OF TEST RESULT DATA TOMAGO TO TAREE TRANSMISSION LINE
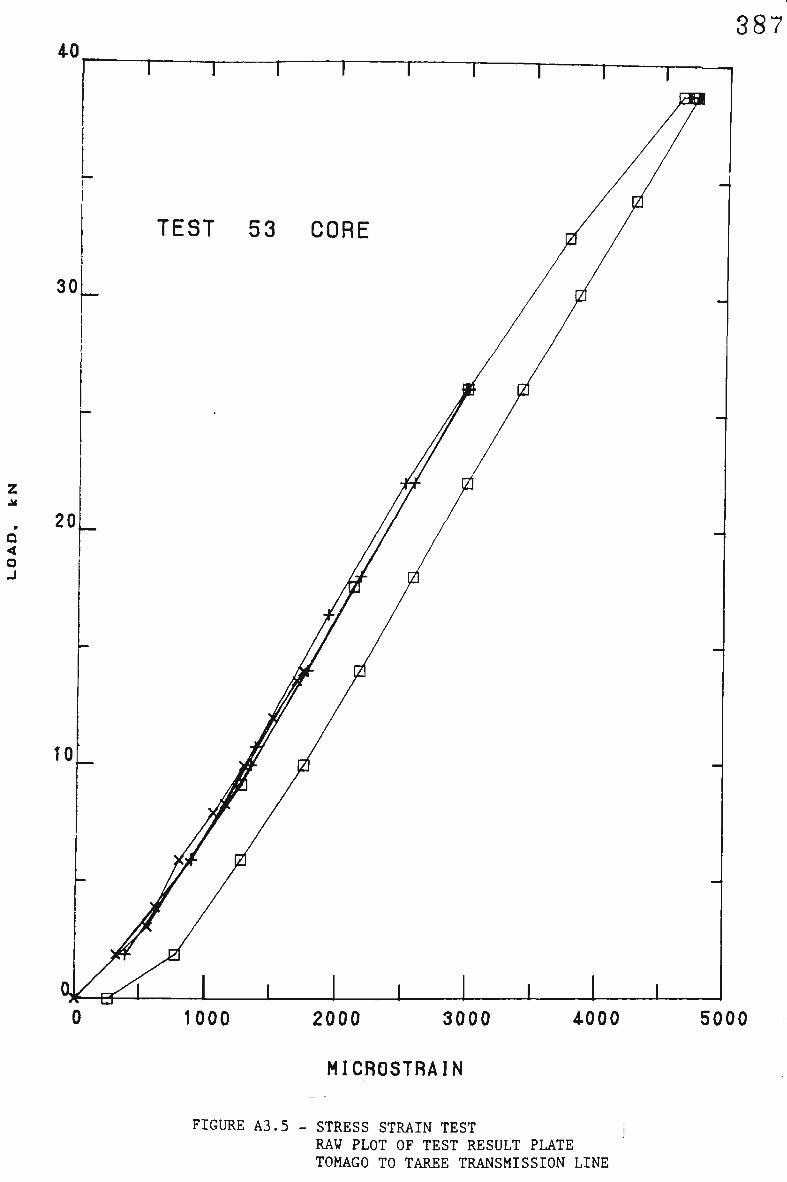
387
z
a < o J
1000 2000 3000 4000 5000
MICROSTRAIN
FIGURE A3.5 - STRESS STRAIN TEST RAW PLOT OF TEST RESULT PLATE TOMAGO TO TAREE TRANSMISSION LINE

250 388
200
150
100
50
MODULUS TEST 53 PANTHER
4< COMPOSITI STEEL ALUMINIUM
1000 2000 3000 4000 5000
MICROSTRAIN
FIGURE A3.6 - STRESS STRAIN TEST DERIVED TEST RESULT TOMAGO TO TAREE TRANSMISSION LINE

389
Parameter
E . Cl
E ^ cf
nE r af
mE . SI
E r sf
'
Conductor Modulus
Equation Constants m b
54.25
80.0
39.8
36.5
191.0
-1.35x10
-0.147
-
-1.00x10"^
-0.129
m = 0.1891 n = 0.8109
Data
Correlation Coefficient
0.9990
0.9999
-
0.9999
0.9999
Initial Modulus Curve Polynominal Coefficients
Curve Al A2 A3
Composite 0.232x10
Steel
-4 -0.819x10 -7 0.294x10 -9
0.315x10 ^ -0.115x10"^
Aluminium 0.810x10 ^ -0.118x10
0.727x10
0.110x10'
-9
Critical Tension/Stress Point Data
Tension kN
yE
19.2
2570
TABLE A3.18 - STRESS STRAIN TEST NO. 53 TEST RESULT DATA TOMAGO TO TAREE TRANSMISSION LINE

390
2
Q < O J
120
1000 2000 3000 4000
MICROSTRAIN
FIGURE A3.7 - STRESS STRAIN TEST RAW PLOT OF TEST RESULT DATA DAPTO TO SPRINGHILL TRANSMISSION LINE

391
Z
Q < a J
1000 2000 3000 4000
MICROSTRAIN
FIGURE A3.8 - STRESS STRAIN TEST RAW PLOT OF TEST RESULT DATA DAPTO TO SPRINGHILL TRANSMISSION LINE

200 392
150
0 a. £
(0 (0 UJ QC h co
100
50
MODULUS TEST 61 MOOSE ACSR/GZ
X COMPOSITE .+.STEEL - ALUMINIUM
1000 2000 3000 4000
MICROSTRAIN
FIGURE A3.9 - STRESS STRAIN TEST DERIVED TEST RESULT DAPTO TO SPRINGHILL TRANSMISSION LINE
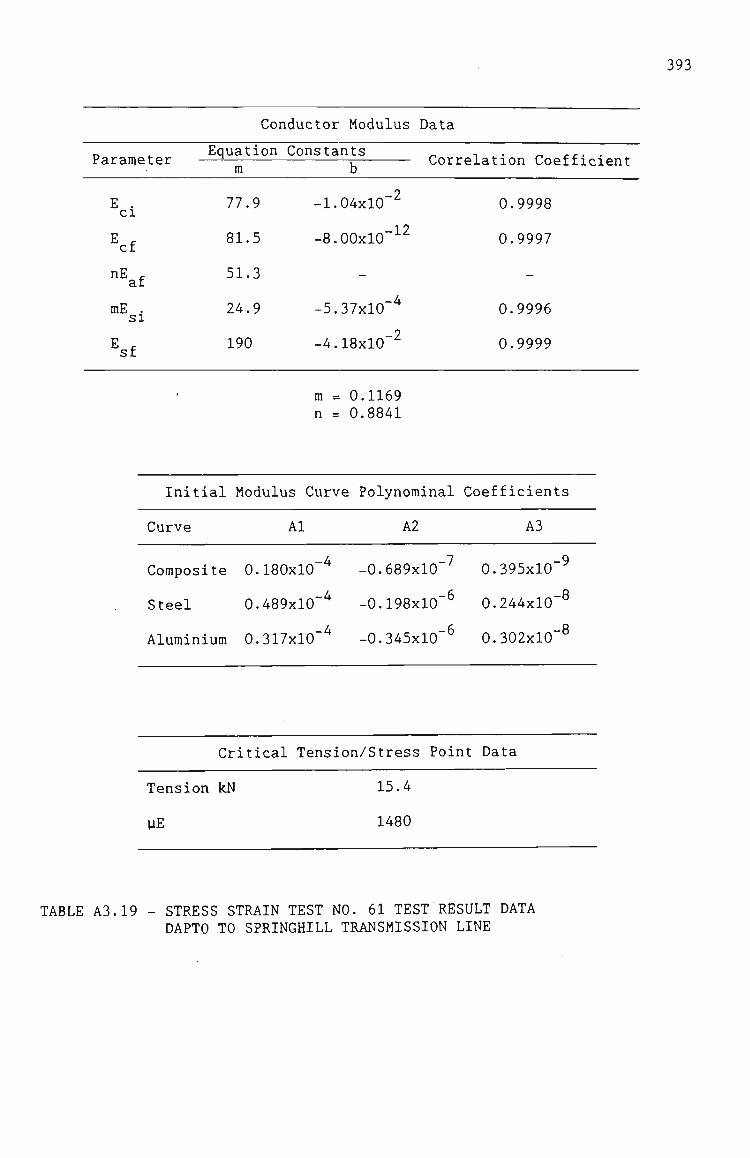
393
Parameter
E . Cl
E f cf
nE r af
mE . SI
E r sf
,
Conductor Modulus
Equation m
77.9
81.5
51.3
24.9
190
Constants b
-1.04xl0~^
-8.00x10"-^^
-
-5.37x10""^
-4.18x10"^
m = 0.1169 n = 0.8841
Data
Con •elation Coefficient
0.9998
0.9997
-
0.9996
0.9999
Initial Modulus Curve Polynominal Coefficients
Curve Al A2 A3
Composite 0.180x10"' -0.689x10"'^ 0.395x10"^
Steel 0.489x10"' -0.198x10"^ 0.244x10"^
Aluminium 0.317x10"" -0.345x10"^ 0.302x10"^
Critical Tension/Stress Point Data
Tension kN 15.4
yE 1480
TABLE A3.19 - STRESS STRAIN TEST NO. 61 TEST RESULT DATA DAPTO TO SPRINGHILL TRANSMISSION LINE
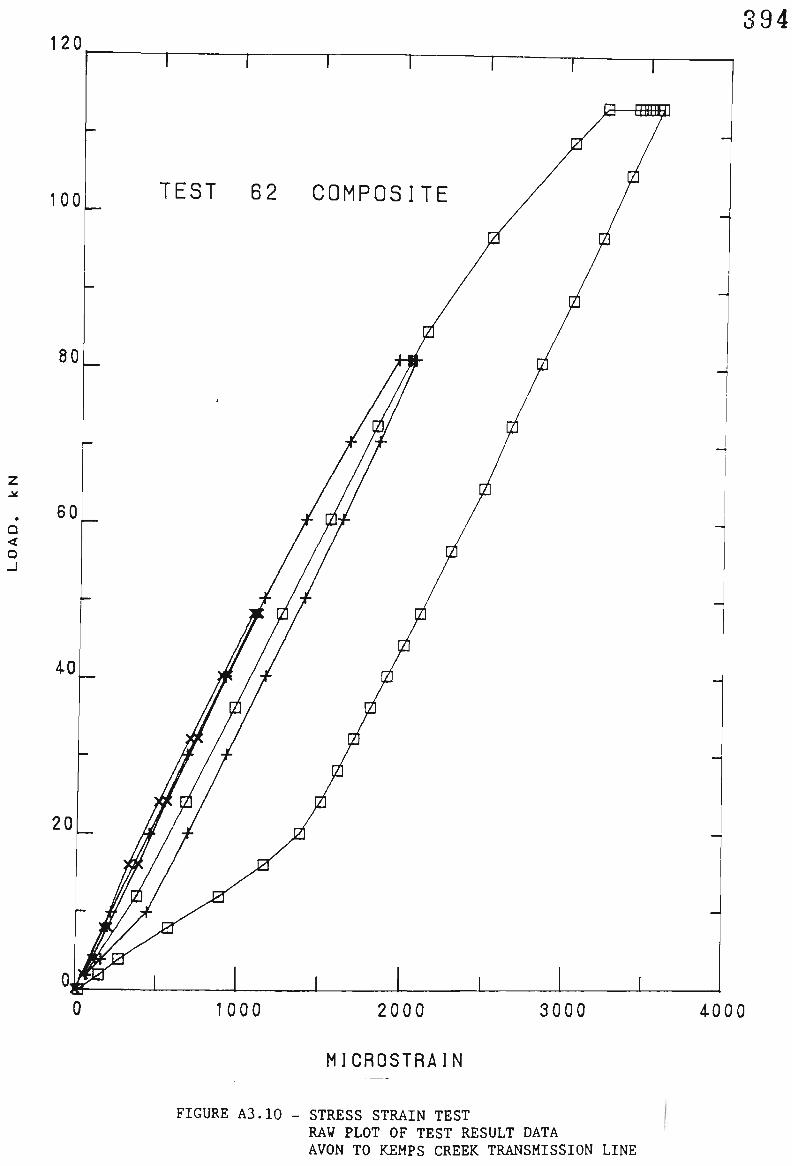
394 120
100
1000 2000 3000 4000
MICROSTRAIN
FIGURE A3.10 - STRESS STRAIN TEST RAW PLOT OF TEST RESULT DATA AVON TO KEMPS CREEK TRANSMISSION LINE

395
1000 2000 4000
MICROSTRAIN
FIGURE A3.11 - STRESS STRAIN TEST RAW PLOT OF TEST RESULT DATA AVON TO KEMPS CREEK TRANSMISSION LINE
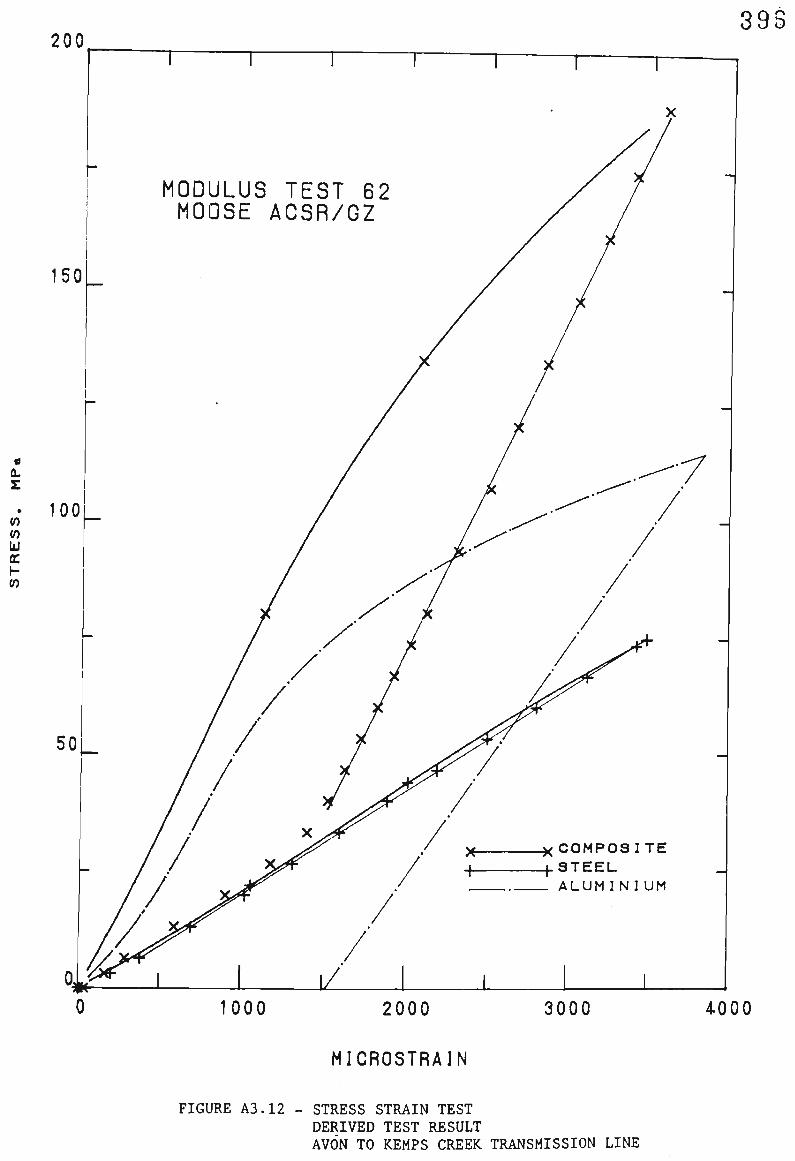
200 393
0 a. z
(0 CO LU CC h co
1000 2000 3000 4000
MICROSTRAIN
FIGURE A3.12 - STRESS STRAIN TEST DERIVED TEST RESULT AVON TO KEMPS CREEK TRANSMISSION LINE
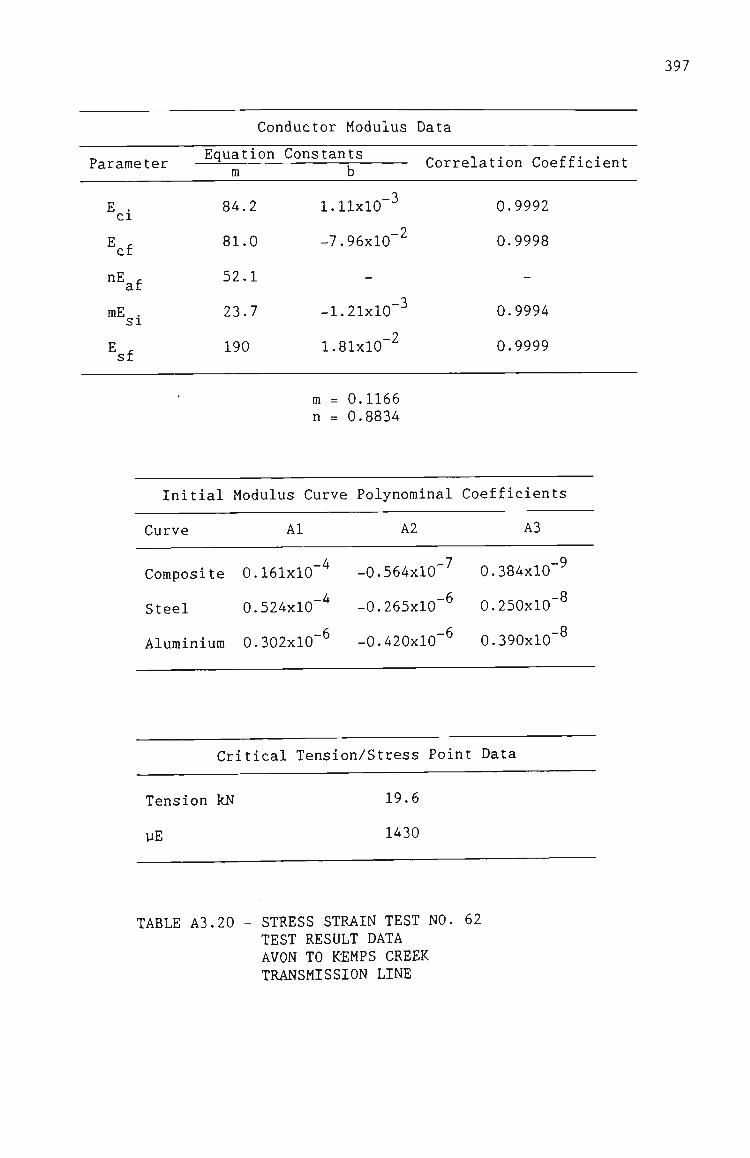
397
Conductor Modulus Data
Equation Constants rarameLeL
E . Cl
E r cf
nE r af
mE . SI
E f sf
-
m
84.2
81.0
52.1
23.7
190
b
1.11x10"-
-7.96x10"^
-
-1.21x10"-^
1.81x10"^
m = 0.1166 n = 0.8834
i. cxet u J.U11 ouci.j.±ijj.t;ii L
0.9992
0.9998
-
0.9994
0.9999
Initial Modulus Curve Polynominal Coefficients
Curve Al A2 A3
Composite 0.161x10 ^ -0.564x10"
Aluminium 0.302x10 ^ -0.420x10
0.384x10 -9
Steel 0.524x10"" -0.265x10 ^ 0.250x10 ^
0.390x10 .-8
Critical Tension/Stress Point Data
Tension kN
yE
19.6
1430
TABLE A3.20 - STRESS STRAIN TEST NO. 62 TEST RESULT DATA AVON TO KEMPS CREEK TRANSMISSION LINE

1200. 398
loo-d CTE TEST 43 3 0 / 7 / 0 . 1 1 8 1nch ACSR/GZ PANTHER
800
< cc h eo o cc u
600
400
200
90 100 110 120
TEMPERATURE C
FIGURE A3.13 - COEFFICIENT OF LINEAR EXPANSION TEST RAW PLOT AND LINEAR REGRESSION TEST RESULTS TOMAGO TO TAREE TRANSMISSION LINE
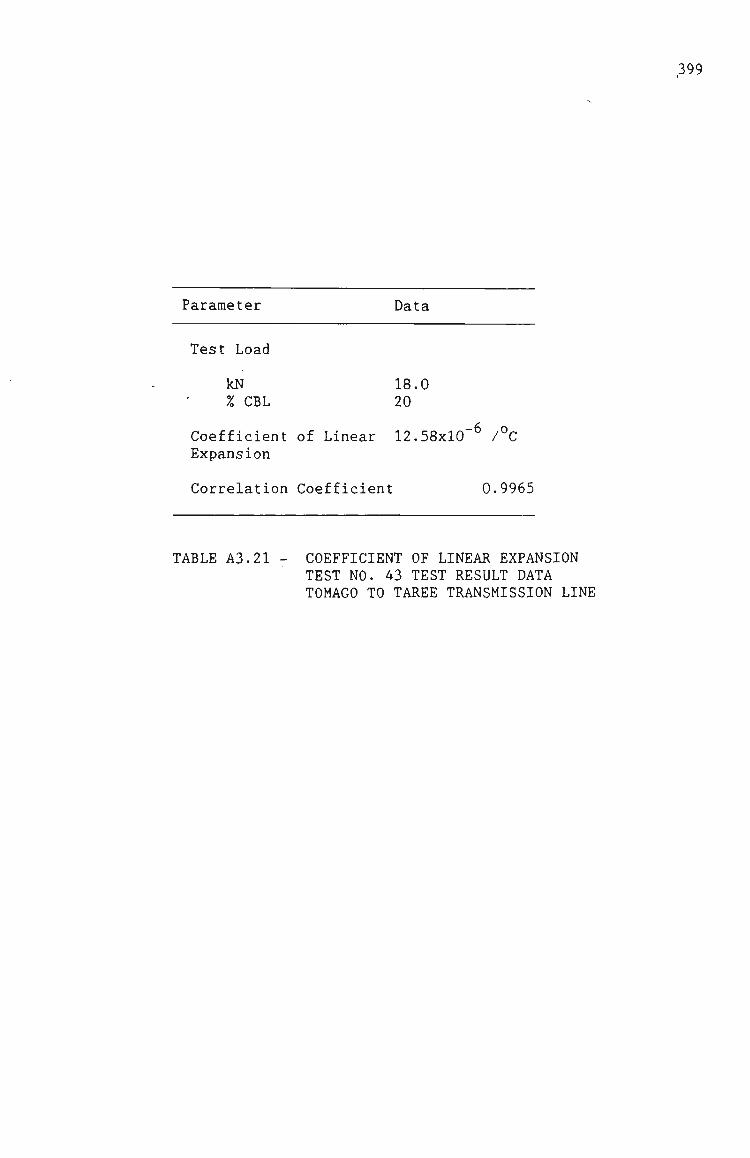
399
Parameter
Test Load
kN X CBL
Coefficient Expansion
Correlation
of Linear
Data
18.0 20
12.58x10"^ /°C
Coefficient 0.9965
TABLE A3.21 - COEFFICIENT OF LINEAR EXPANSION TEST NO. 43 TEST RESULT DATA TOMAGO TO TAREE TRANSMISSION LINE

i6oq 40u ! r - [ 1 1 I 1 1 1
1400.
1200'
1000
< cc h co o cc o
800.
600
400.
200
CTE TEST 44 3 0 / 7 / 0 . 1 1 8 Inch ACSR/GZ PANTHER
oL I V I I 0 10 20 30
1 1
I I 40 50 80 70 80 90 100 110 120
TEMPERATURE C
FIGURE A3.14 - COEFFICIENT OF LINEAR EXPANSION TEST RAW PLOT AND LINEAR REGRESSION TEST RESULTS TOMAGO TO TAREE TRANSMISSION LINE
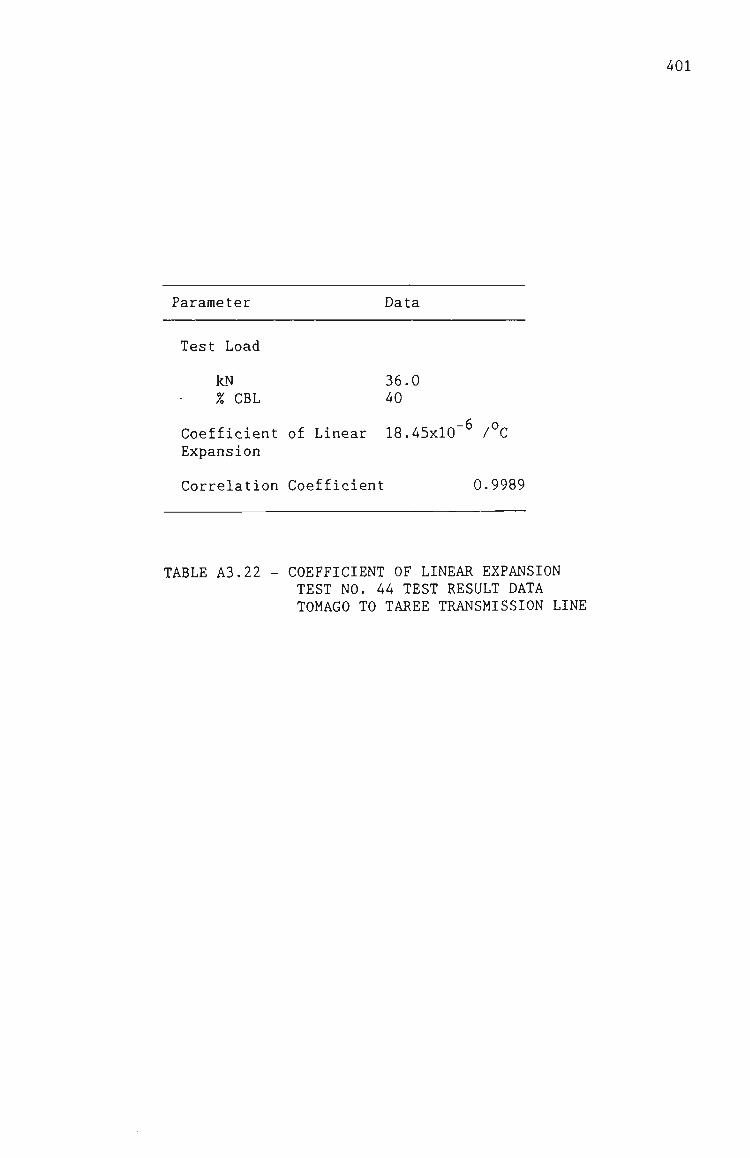
401
Parameter
Test Load
kN X CBL
Coefficient Expansion
Correlation
of Linear
Data
36.0 40
18.45x10"^ /°C
Coefficient 0.9989
TABLE A3.22 - COEFFICIENT OF LINEAR EXPANSION TEST NO. 44 TEST RESULT DATA TOMAGO TO TAREE TRANSMISSION LINE

402 1600
1400
1200
1000
800
600
400
200
CTE TEST 50 5 4 / 6 / 3 . 5 3 + 1 / 3 . 7 1 ACSR/GZ MOOSE
0 10 20 30 40 50 60 70 80 90 100 110 120
TEMPERATURE C
FIGURE A3.15 - COEFFICIENT OF LINEAR EXPANSION TEST RAW PLOT AND LINEAR REGRESSION TEST RESULTS DAPTO TO SPRINGHILL TRANSMISSION LINE

403
Parameter
Test Load
kN X CBL
Coefficient Expansion
Correlation
of Linear
Data
31.9 20
18.27x10"^ /°C
Coefficient 0.9946
TABLE A3.23 - COEFFICIENT OF LINEAR EXPANSION TEST NO. 50 TEST RESULT DATA DAPTO TO SPRINGHILL TRANSMISSION LINE
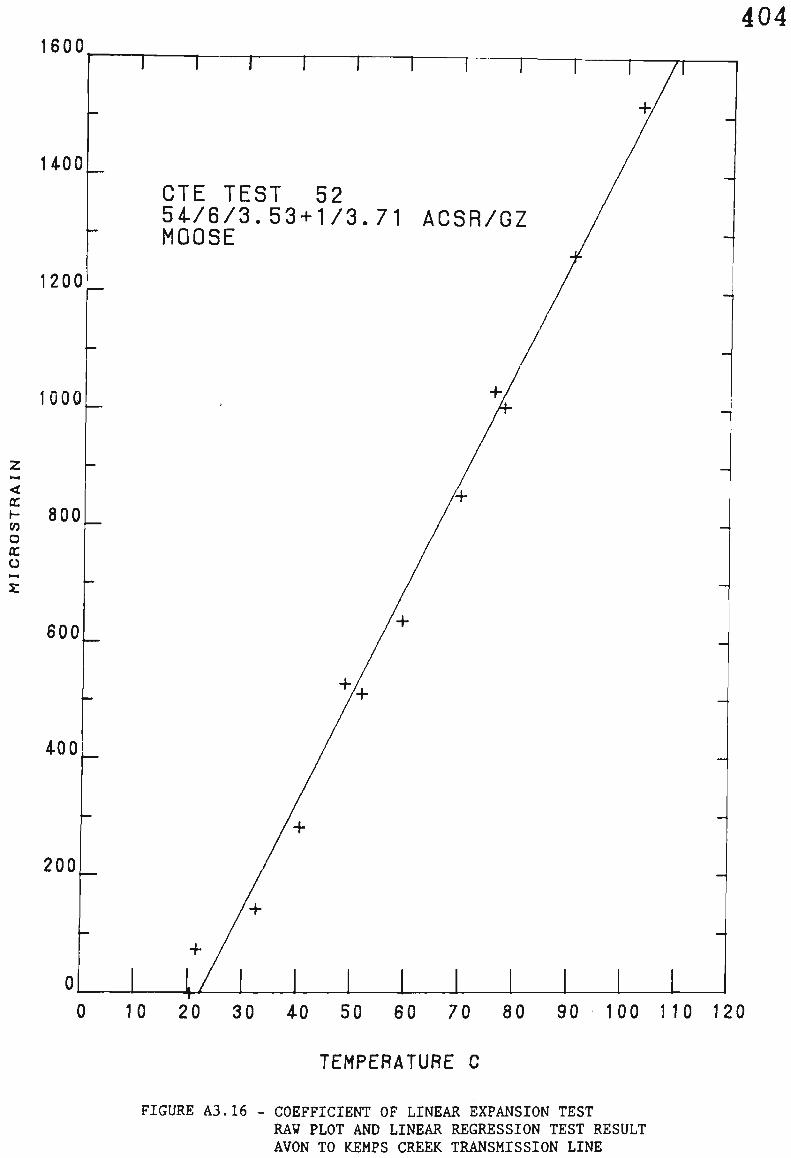
404 1600
1400
1200
1000
< cc h-co o cc o
800
600
400
200
1 1 1 ]
CTE TEST 52 5 4 / 6 / 3 . 5 3 + 1 / 3 . 7 1 ACSR/GZ MOOSE
0 10 20 30 40 50 60 70 80 90 100 110 120
TEMPERATURE C
FIGURE A3.16 - COEFFICIENT OF LINEAR EXPANSION TEST RAW PLOT AND LINEAR REGRESSION TEST RESULT AVON TO KEMPS CREEK TRANSMISSION LINE

405
Parameter
Test Load
kN % CBL
Coefficient Expansion
Correlation
of Linear
Data
31.9 20
18.31x10"^ /°C
Coefficient 0.9957
TABLE A3.24 - COEFFICIENT OF LINEAR EXPANSION TEST NO. 52 TEST RESULT DATA AVON TO KEMPS CREEK TRANSMISSION LINE

40S
CO
CO LU Q UJ LLl IL
CO
CO
m »
CO \ CO N
in
N o oc CO o <
LU CO o o 2:
fFfFf
CD CD
O
M U M I L
11 I I I yv3A 01 1
dV3A I
2
Z o M C/3 CO M C/2
H
OD Cd w a ; B3 u
o o o o o
o o o o
o o o
o o
H CO Cd H Ok Cd Cd
H CO Cd
H O • J 04
<
I
CO
<
CO CLi
Cd £^
O H
o > <
Cd OS
3 O
o • ^ UJ
z:
I I i I L o o c^
o o
o
Nivyisodoiw

407
CO
cr lU a U l LU
u.
CO
CO
in •
CO N CO \ ' ^ in N o \ QC CO O <
LU CO O O 2 :
Ul
NIVUiSOUOIW

408
SINGLE REGRESSION
Load
Stress X CBL
Equation Coefficients
^1 n
Correlation Coefficient
Correlation Coefficient from 500 hrs
EXPODENTIAL
53.38 MPa 20
164x10"^ 0.1880
0.9805
0.9507
EQUATION
80.06 MPa 30
249x10"^ 0.1635
0.9922
0.9452
SINGLE REGRESSION LINEAR EQUATION FROM 500 HRS
Equation Coefficients
a 90.4 _ 149 b 16.7x10 ^ 22.7x10 ^
Correlation Coefficient 0.9629 0.9774
MULTIPLE REGRESSION EXPODENTIAL EQUATION
Equation Coefficients
"1 "2
1.066x10 ^ 0.1759 1.255
Correlation Coefficient 0.9914
TABLE A3.25 - CONDUCTOR CREEP TEST RESULT DATA AVON TO KEMPS CREEK TRANSMISSION LINE

409
mil 1 \f-- 1 \
» \
•*
^—
-
-
^ —
— ~
—
-
1
^
M M
^ -• *
^
—
^ —
-
—
-
_ .*
— *"
• • ^ ^
«• M
-
MM 1 1 1
-n-1 \ \
1
\
\ \ \ 1
\ ^
,
MM 1 i
\ \ 1 \ \
\
% \_
\ I ^
\ ^ >L • '
V
M i l l 1
- h -
_»
*• \
\
v^ \ "•
1
H 1
- J -J OD CD
0 0
>* « 0 C3 CO CM
X -f
+
\ * ' ' V - ^ . , \ ^
Ul I I 1 3dV
H—h-3A 01
dV3A I
\ " ^ ^ X
\ '** * ^ ^ \ • \ \
1
+ X
^ K \ \ X
\ ^
llll\ l
Cd Z M
z M CO CO 1—1
LTS
L TRANSM:
33 J CO M
T RE
INCH
CO OS Cd Ol
H H CO CO Cd H 0 H 0 H
OJ a. 0 Cd H Cd : » CU cc: < < U B5 Q
1
ON t - l
E A3.
FIGUR
^X
K _ X
X
K X
^ ^ +
+
1 1
_
—
— 2
-
~ —
_ _
-_
-
_.!,, • H i
«..
^ —
« i - « n
^
—
^
=
:
^
** ^ —
^
X
=
z _^ 1
" •
C9 O
O O o o
o o o
o o
o
o • ^ LU
z:
o o o
o o
o o
NIVdiSOdOIN

410
ro 00 CD
CC UJ Q UJ UJ U .
* CO
CO in
CO \ CO \ ' ^ in
N o \ CE CO O <
Ul
LO CM
N[VdiSOdOIH
tn

411
SINGLE REGRESSION EXPODENTIAL EQUATION
Load
Stress 53.38 MPa 80.06 MPa
X CBL 20 30
Equation Coefficients
A. 99.3x10"^ 188x10"^ n 0.2028 0.2150
Correlation Coefficient 0.9909 0.9948
Correlation Coefficient 0.9750 0.9859 from 500 hrs
SINGLE REGRESSION LINEAR EQUATION FROM 500 HRS
Equation Coefficients
a 55.25 96.98 _ b 12.69x10 18.37x10 ^
Correlation Coefficient 0.9764 0.9895
MULTIPLE REGRESSION EXPODENTIAL EQUATION
Equation Coefficients
^2 "l "2
Correlation Coefficient
0.8102x10 ^ 0.2089 1.237
0.9955
TABLE A3.26 - CONDUCTOR CREEP TEST RESULT DATA DAPTO TO SPRINGHILL TRANSMISSION LINE

24 - Average Conductop Tempenatupe 21.2 Deg C
u O) CU
•D ^^
LU cn ZJ I -<r cn LU CL
E: LU
22 -
20
m D •QomQ a
oaa • DD m m n an
a m
D p D
D OD
ilean
Maxi
18
Mini
411
± 500 1000 1500
TIME (houps) 2000 2500
FIGURE A3.21 CONDUCTOR CREEP TEST TEMPERATURE UARIATION

413
: I ! •! I
'r^ri a
rt}^::-H.oCjim:i;:::r!..r.:n • t - - ; . ;
Im^ q •> Lil-f-y-; -,.j, -(jy-ir-l-iZ'- i ..\ i I i . i - . U . i . ;-. k t -tO-i-v-i-f-HH-- H-- -.i-4-.i..;...L-i
j - j . ; i.j (
f
14--r'*-r . - -n M-i-f l-(-rH-'-rt- t •
Ljr.i_'-4i,.Li
-1-1
- ^
" I - / • I , ' V ^ T . i - -T-r^-rTT-l—^ - , - - r .!- i - k . , . . . - - ; . . I ;. . ...l_. . ; ' I ^ ' i I I • : ; ' 1 1 1 1 !
. r- : - L - -^ r-L.l
- t - t - f - J - r i -* !•- M i-l.-j-*.-!-.!4-4..i-i ; -,-;..: j . . . . . U i . . i . ; . U .. |.-I •i-i-.i-. .'. .... , .i-ui-i-i.:.J', i.^L...'^.^.i....L.i..l..-
. .4-.4--,.^-.^ ^.;. . 1 . ; ... .. i i_^.^
::rr
- . i . i L. 1 - J . J-^j_.;-..U_.;,.;.
• f - 4 -
1 , T •
. .1 . ! I- ; , :. • t -i J - f
( (.
•Lin:.!-;.T::d-:
.-, - , r
; 1 :
. : 4 - i . . U - . | . :
it n
:.-l.^H.-L.
m
B SI
E455p^E;rEHHFp#E-EiWElS-F^^^T'i^^ ; • ' ^ ' i-r- ^'f '-t \ ' I I • 1-4- ' '--*-• 1 ' - I - i •-^•••-- f-t i - ' - f - i - ^ - r - i - - • •-- - • • ^- '• ^—^
Co ; M - • : i ; ' • ; f I i r f • ' : ; ' r4 ••; ^ . , - : | - . f - , - 4 . : \-\ • • ^ -i ;-f : } - -
^ - - - ' - - • t-f : - - ' - ,-. 1 .J - . .^-f... ; -, . . , . 4 . ^ . ' ^ . u i. _ . i . . , . ., . — ; . ! _ . 4 J .
d±!:
I f
I I I
- • * — — r -
i . J . U i - i . i . .
t ! •i i-
i'lTTTTrr; :n^ ' •*- r - ^ r •• f ' ' ' . 4 . - , . . , . 1 . * . - 4 - r - , - f- f . . f I
Z O Q O <
O . - . i - -• - f-i- r lU -i i.., .-. ..i -[ i \ . . ! - ,
Q. 5 ---r r-r—; j ^ - : - i - j - t -- ! - - ; ^ f r ^ • • ' ;-, ^-^4••'-r i -4r-^—^-•
H"^" i4Tr;";T["tTn!; ] TT': ;Xi,pLi.Lil : p t c u i ; . :
cn
o z on o H H CO O Cd
Q S Q O < U O
Cd H U M 2 CO M
CL. < S Cd O OS O 03
I
CvJ
csl
, , .U. .4 . .
O ui o cc
ffl
- r - h t - i - ; - ' • • " 1 r - f - i r + ! - i I 4 - r - t -i i . ;..;.[J.J..J..
. , ; . , . . , ._ ;-4..L4.!.._ l -~4- | - t .1. L.u;— - r - t - f
;-. -4.-!-:.-^44M^-M
... . . J . . - . . - , , _ .
! 14.:
rH r MTh--4i tu t t - r-4-
•ti-un i i ' i ; M--j_r-s
.;4.4- 1 HrrtrrrWrte
•-f~\-'—:
•N>i 'avoi

414
Stress Strain Test Results
Parameter Data
Load at 0.1% Strain 79.5 kN
Load at 1.0% Strain
Composite Load at Failure 82.4 kN
Total Strain 0.61%
Plastic Strain 0.19%
Steel Load at Failure
Description of Failure: Epoxy termination failure.
TABLE A3.27 - BREAKING LOAD TEST NO. 163 TEST RESULT DATA TOMAGO TO TAREE TRANSMISSION LINE

415
O-z : 00!
LDl
r-iWHt f 1 b-on <iH-i- ty-^-
- i - i -^U. - t - • • - 4 -
n-r—h-- i -[- -
l - l - ' - i - 4 - l 4 f 1 4 4 • - , r - t - : _ . l - . a . ^4-: . - ) - ..,--. U - 1 . L.
t-H-
rf;'p]h%\b-iy^i
itm
Mi
-t-r-pr-p^-t-r— r-f • t . . _ : . . I . . 1 f- '-•.- j - 1 .
i - r -H -ri-^-J- r T i - r ;
. t _ i _
,.;4|4 -*-^-*-r-t—
^T;d:4* i-r; - r t
r^
H-+-I-
- - t ' • -t ( t i - i ! - - f - f - ' - f •}--•-
, P t ! : ,4.TqXpLL.i_i u].-. .n.. H-4-1-M— • ; I t -h-4—*-r ff-
j-Httftit H#f-fliiiti .|.4.;a.|^ 4—T-r-l-fffl
i T T ^ ^ t T T T f l ''4 f
liniii
- -t ; • h
( --t
i 4iEr-^
K_;|....m_a.^
- . -ui-t-4-; .1.. i-i. i. , M-14
ru-r — -U-u ••|4-H4i : .4^^4
H-rt l-HH -H-f-
^.j.j-;.. .p..p___4.4XH.Ui-f4-4 .^4-141^^ i--r-f-T4-t— t i- '• ; • r r t---4-h-l - ' - : ; i -H -^ - i
r;pt!:dtt;-tt4-]x •lU-
flflti-ffiffl-Hiffl-tflii - K
1 -H
cW! k i
_ ;. (,-j.. 1-4-4-.i. 4 - 1 . . ; . . . p ) - ; ^ , I-).
' i h-^44 ! 4; f - f 4 4 t ' h k , ^ : • : , , , - . ; .p f r - r
X]::i:rr; • - i j i i-i }t4-u44f-iTy-^-TT4TTd~i ll'i • t
, ., . ,.,. . .1 pj.-j ^.^...j.i.-, ^ i . I ;- |-i r - ; j4 T^ 4 ' r i • '
r-l-4h+ • <-l *
1,4. ^L-iX T-.i-L I T • T i I 1 [ • ' (
B S -Z
g ® l i s < O LU o cc
CQ
j_ ,.., 4 - _ , _ 4 - p ; - ^ T . - t - - J - - - - ^ - : 1--.-^ •-; f 4 1 " | f •• r : •[• r-^- 1 . , , , . ; , ; . j . i . 4 . ; . , , ,- f^*- r - p > • • I - • • t • • • ; 1- . - • ; • ! - - -
;X-'4-4-i44-iX41- < -J •-• I- ^ I
• r r
. '' \ 1 ••
'.' • '• 4 ,
.: ;.. ,.-! . j I ,-, , , . ; - 4 . .
.... , 4.., .. •i 1 • I . | . . | . ^ - i
B ^ : ; 4- . i . . . J .L .4_u
t -1 ;• I \ -•. ; ' ' • - t • i t - K - i -r-; f - ; - r
o
cc: O H H CO U Cd 3 H Q z a o <; u o
X Cd E-i O M Z CO M O iZ CU < S Ed O OS
u oa I
CO CM CO
< Cd OS 33
M Ci4
r-4 r r -- t-
!• f • - ; r-1-t
t:e'r44r-
^ o^
a: o 00
m 'avoi iWXiri-Ht[KIffi[:[-FF^4tliXtl:iltl:l l:H i 1+Hti-l iLl
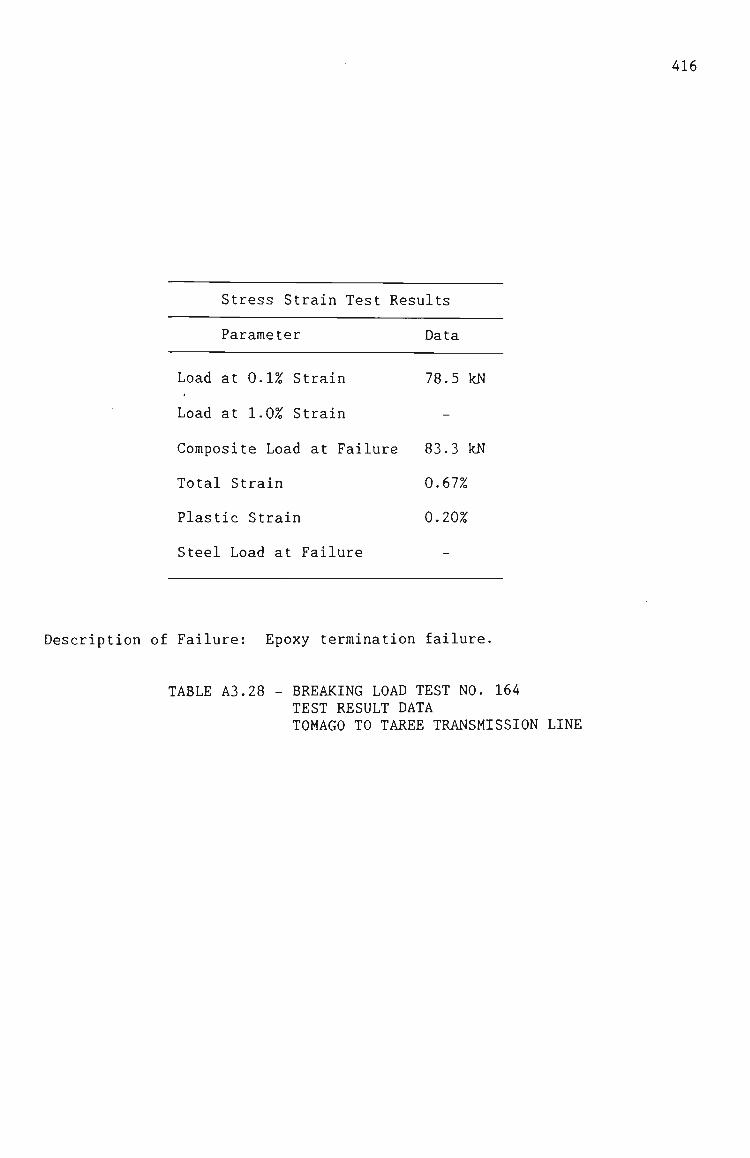
416
Stress Strain Test Results
Parameter Data
Load at 0.1% Strain 78.5 kN
Load at 1.0% Strain
Composite Load at Failure 83.3 kN
Total Strain 0.67%
Plastic Strain 0.20%
Steel Load at Failure
Description of Failure: Epoxy termination failure.
TABLE A3.28 - BREAKING LOAD TEST NO. 164 TEST RESULT DATA TOMAGO TO TAREE TRANSMISSION LINE

miri-T!
. , xt r-f—cr">^ r-t-iq a ; '
i -X-. .^ ..:,(Q o j
- O -_-- .d.>
[Tilsit.
X_i5^P O. n~ a a*: • z -> f-*~ r -.*;.. • •< cn — p W OLiJ .. ' S •
, «.';•-! •r . . . cn _.!(/) ,H a: Q: on cn H K LJ ..
—--LU -HI _i 1 u cn r~r-i±(f, •< H- (_3 ^ - t -Z- U- -H- </) I-I ..
.\-\.<.-[i..-j3 o a: o) ,..Q^.Q'H a. I - a
417
w 'avOT

418
Stress Strain Test Results
Parameter Data
Load at 0.1% Strain 133.0 kN
Load at 1.0% Strain
Composite Load at Failure 133.11 kN
Total Strain 0.69%
Plastic Strain 0.25%
Steel Load at Failure 150.5 kN
Description of Failure: Ten alurainium outer layer wires initially failed at the termination entrance. Remainding aluminium wires failed at or near the termination. The steel core slipped 3 mm from the compression sleeve at some time during the test and ultimately failed. All wires experienced ductile fracture.
TABLE A3.29 - BREAKING LOAD TEST NO. 205 TEST RESULT DATA AVON TO KEMPS CREEK TRANSMISSION LINE

-Q a - - • - • - »
. (O. Q
- : > • \
-•Or--I • ..cx>..
; a
. . 4 _ L .O ..>;.. I. , in o >i a o
"WCTcr) \ a o ' • o
I •
• • i
??os u j < 0 1—1—> t——i ^O^ ' »> .T
I r r '-1
" m 419
CD 03
Z) <
•— <Ti Qi-ui .. 5: < m
a > ci:
h-
z Li-KH- cn < L L - I O O (r CD il5 CD;i- CL h- '-
.. (D ct: - I L U ' • . . C D ' ^ iJ Oil
4
-I—
• r
I • i ., , , .
T • • • t -
- I
i i '
•i -'Si
CC
o I -3 Q Z o o
UJ H
Q < O
-,.. , r -•-
• ' -
---1. -.
i
1 1 " . I - i -
... (
I.
.. ...^
I :
' . .L. ' X — r . i •
1 •
I :
.;.-, - 4 ! .
• f - 'x-
o CM
o Z a
O H H CO O Cd
Q Z Q O < o o
J Cd H O M 2 CO M
o i4 S Cd O OEj
u CO
I
i n CM
< Cd ai 33 O M CL,
OO
o
NO
I— c/)
CD
•N>i 'a vol
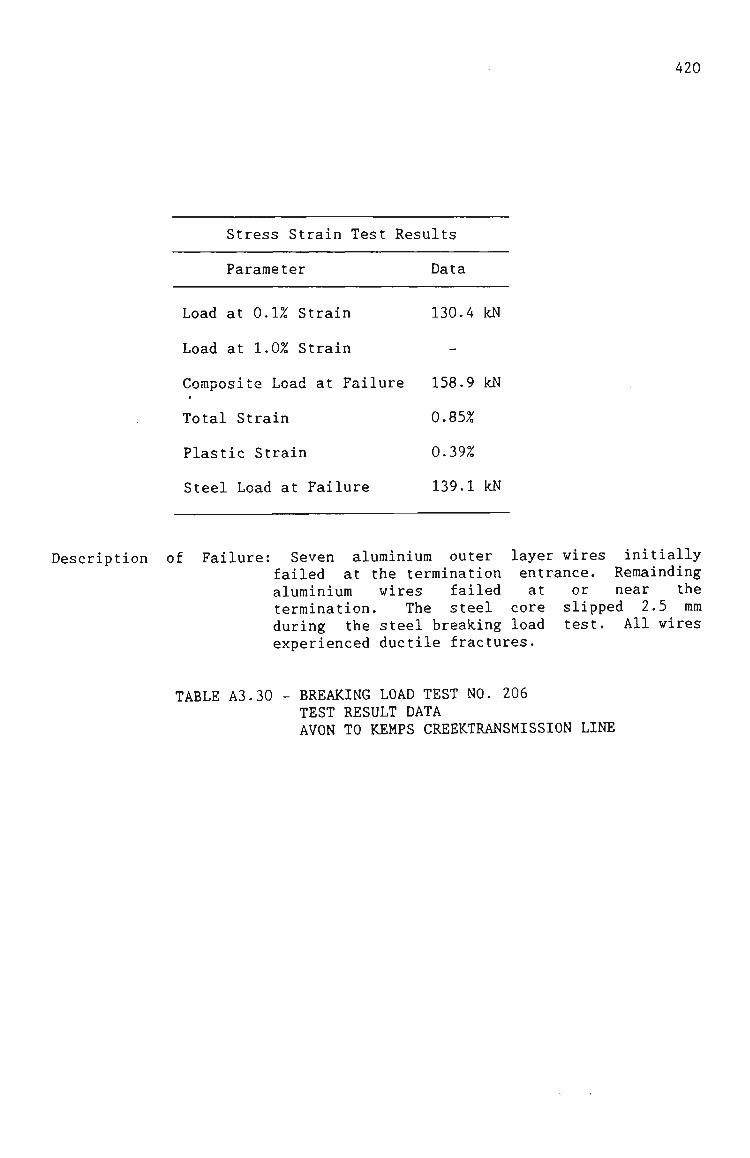
420
Stress Strain Test Results
Parameter Data
Load at 0.1% Strain 130.4 kN
Load at 1.0% Strain
Composite Load at Failure 158.9 kN
Total Strain 0.85%
Plastic Strain 0.39%
Steel Load at Failure 139.1 kN
Description of Failure: Seven aluminium outer layer wires initially failed at the termination entrance. Remainding aluminium wires failed at or near the termination. The steel core slipped 2.5 mm during the steel breaking load test. All wires experienced ductile fractures.
TABLE A3.30 - BREAKING LOAD TEST NO. 206 TEST RESULT DATA AVON TO KEMPS CREEKTRANSMISSION LINE

a' rx4
— a •>• •
.>- . . . : . :a,.. a > • . a C J - . : : •
(v a^ . — ; I. . . - CO
,. . l .Q > ^ . cn a > a a •Q Q-'n . •o o- a • • . • . : • • • •
.oa-oi Lu .. :._: ...i':s:.tD
, . . • - • t - i
.. cn" (- ct cnfr-:-' H Lll tu-_j 1 O- (/>-< H Z LL >- cn .<ii.i;a a Of Of 1 - CL
z < s
• •
ct: Lir CD CD 1—1
(T \-
(D CD
CD D <
. — 1
on
CD Q ',,
CM IT) «•
Q »—1
' I ! } X •!
BA
TTE
RY
V
OL
TA
GE
•• 12
.4
VO
LTS
!" I ' M I 421
! I f I ' I < I : f :
o CM
o Z
Cd O H H CO U Cd 3) H Q Z o o Cd H M CO O OM
z: o
Q <: o X
z
on U CQ
I
•N>f ' a v o l
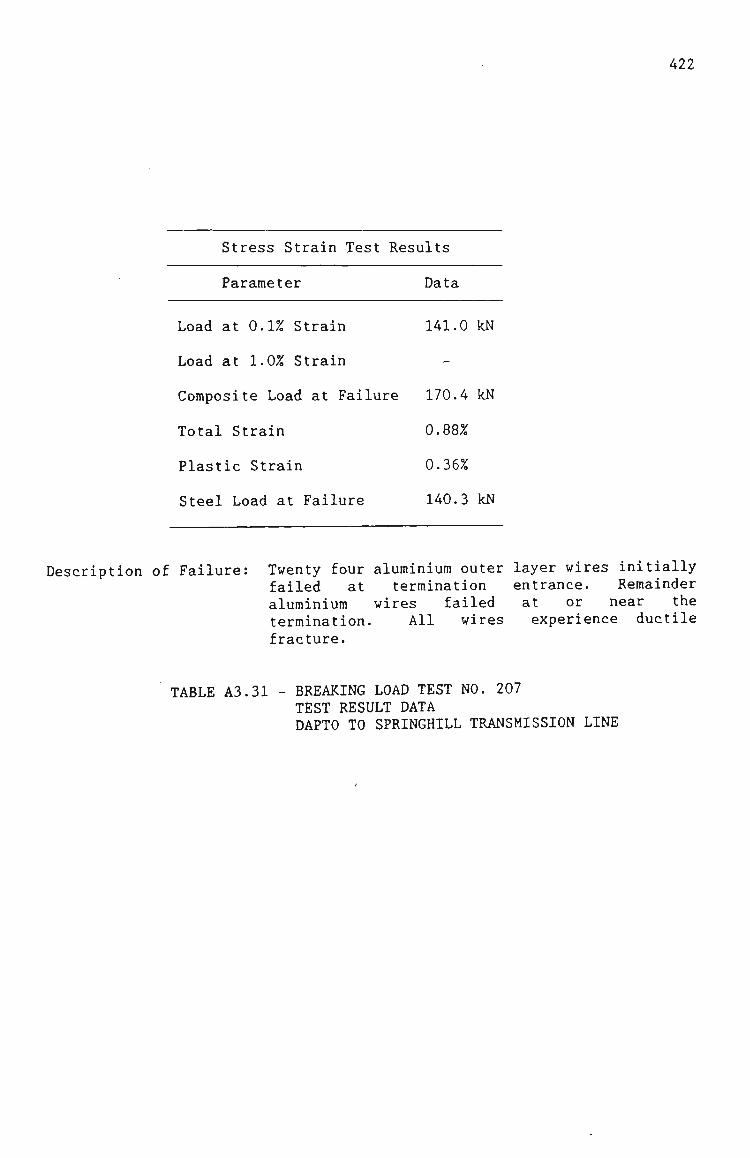
422
Stress Strain Test Results
Parameter Data
Load at 0.1% Strain 141.0 kN
Load at 1.0% Strain
Composite Load at Failure 170.4 kN
Total Strain 0.88%
Plastic Strain 0.36%
Steel Load at Failure 140.3 kN
Description of Failure: Twenty four aluminium outer layer wires initially failed at termination entrance. Remainder aluminium wires failed at or near the termination. All wires experience ductile fracture.
TABLE A3.31 - BREAKING LOAD TEST NO. 207 TEST RESULT DATA DAPTO TO SPRINGHILL TRANSMISSION LINE

r^'s ' i
X.:tn Q'
— > - • •
n.>... - ' -Q o .
-CTCT; "" —r-—-1—*Gf>— " X p ^ ^ J O . . X_>:.-...-- . <J)
' O > _ o O x~;o'"G OO" ." p-cro; a
1-
• 1- 4' ! 1
) . . , - 4 I —
U J < 0 h-t—> »~—'_ <02
- -- ...
CD CD
CD D <
...... •- '. I ..'..
i"! \]Tnj\ i !
- '
V •
_ J . ( J ) . 0 : i j j < m
^ ^ .. cn ' I - or P^^-TT-"" X —i--DJiu-'.j 1
p—-Z-U--i~-</i r-i-isCU-LaCD Li- : (X-oi l - . CL
•N>) ' aVG1
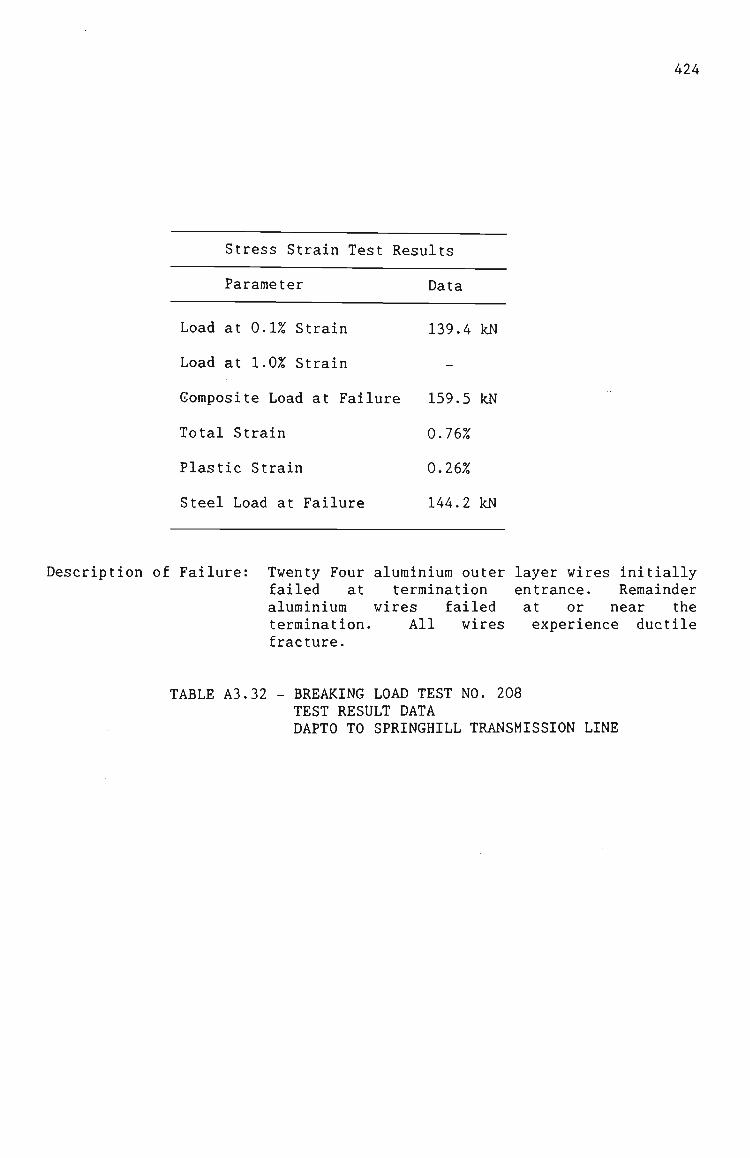
424
Stress Strain Test Results
Parameter Data
Load at 0.1% Strain 139.4 kN
Load at 1.0% Strain
Composite Load at Failure 159.5 kN
Total Strain 0.76%
Plastic Strain 0.26%
Steel Load at Failure 144.2 kN
Description of Failure: Twenty Four alurainium outer layer wires initially failed at termination entrance. Remainder aluminium wires failed at or near the termination. All wires experience ductile fracture.
TABLE A3.32 - BREAKING LOAD TEST NO. 208 TEST RESULT DATA DAPTO TO SPRINGHILL TRANSMISSION LINE

425
Wire Layer
24
18
12
6
Lay Length
10.82
14.79
16.22
24.31
TABLE A3.33 - LAY LENGTH DAPTO TO SPRINGHILL TRANSMISSION LINE
Wire Layer
24
18
12
6
Lay Length
10.84
14.56
16.75
25.83
TABLE A3.34 - LAY LENGTH AVON TO KEMPS CREEK TRANSMISSION LINE
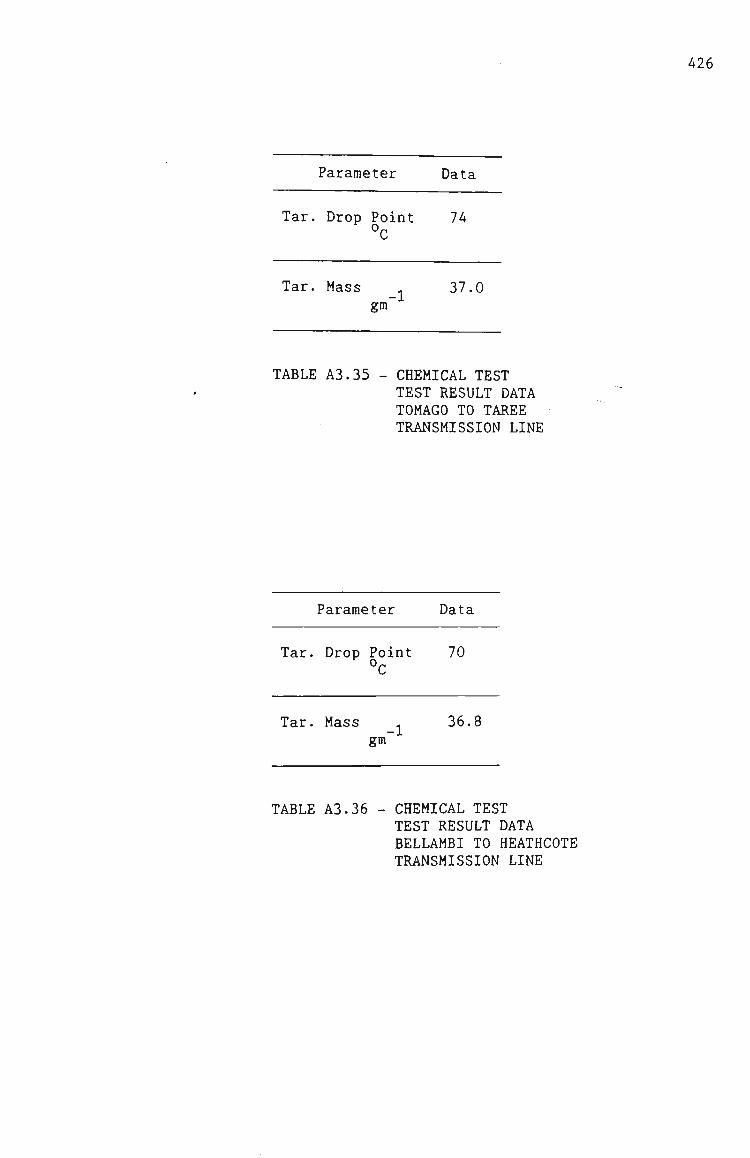
426
Parameter
Tar. Drop Point °C
Tar. Mass . gm~
Data
74
37.0
TABLE A3.35 - CHEMICAL TEST TEST RESULT DATA TOMAGO TO TAREE TRANSMISSION LINE
Parameter
Tar. Drop Point °C
Tar. Mass . gm~
Data
70
36.8
TABLE A3.36 - CHEMICAL TEST TEST RESULT DATA BELLAMBI TO HEATHCOTE TRANSMISSION LINE

APPENDIX FOUR
CONDUCTOR FATIGUE TEST RESULTS
The conductor fatigue test results that constitute this appendix are in
the following order for each fatigue test:
1. Test data sheet,
2. Test frequency spectrum,
3. Test log record,
4. Wire and/or conductor failure report.
Regarding the frequency spectruras the calibration is 1 division equals
2.01 Hz.
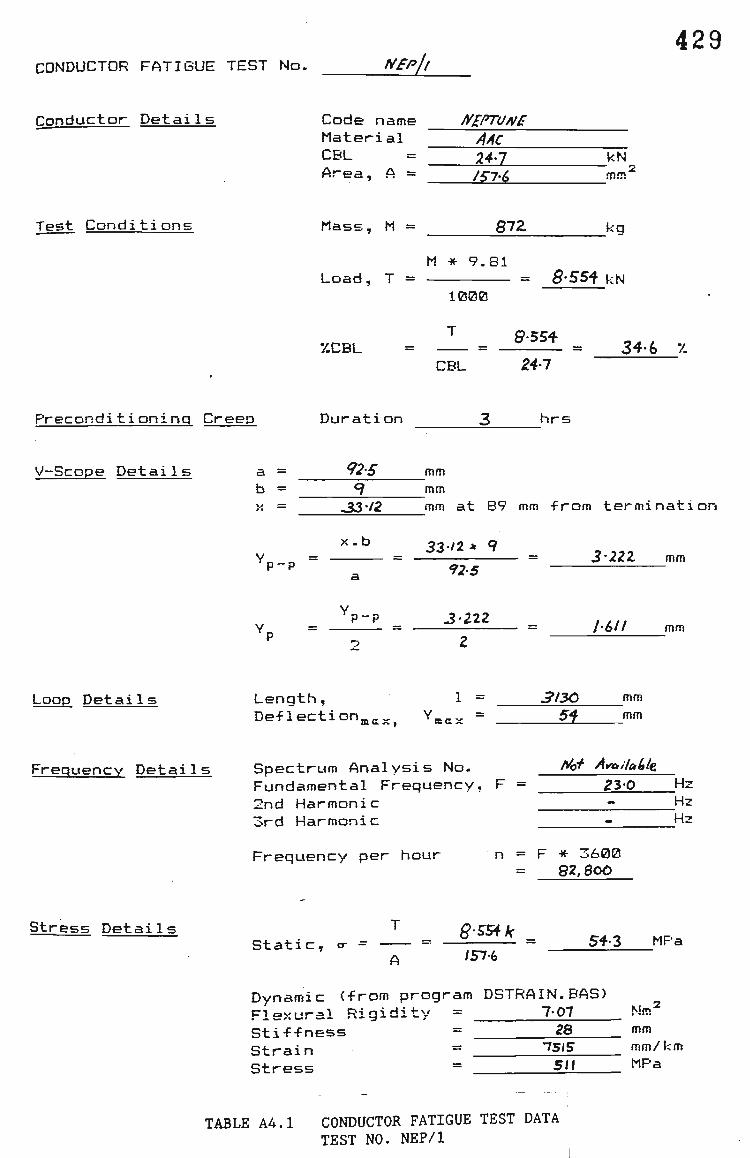
CONDUCTOR F A T I G U E TEST N o . Nfp/t
429
Conductor Deta i ls
Test Conditions
Code name Material CBL Area, A =
Mass, M =
//£/m//tfs AAC 241 /5-7-/S
872
kN mm
kg
M * 9.81 Load, T = = g-SS-f kN
1000
7.CBL CBL Z41
3 4 6 y.
Preconditioning Creep D u r a t i o n hrs
V-Scope Detai1s d —
b = ^2-5 mm
mm 33'/g
X . b
mm at 89 mm -from termination
3 3 / 2 * 9 p - p 925
3'2ZZ mm
p - p -3-222 /'6// mm
Loop Detai1s
Frequency Deta i Is
Length, 1 = De-fiection^^^^ Y^^^ =
Spectrum Analysis No. Fundamental Frequency, F 2nd Harmonic 3rd Harmonic
Frequency per hour
S/30 mm S^ mm
Aiif A^ai/abk F = 23-0
-_
H H H
n = F * 3600 82,800
Stress Detail Static, o- =
/57-6 54-3 MPa
Dynamic (-from program DSTRAIN.BAS) Flexural Rigidity = 7-07 Nm Sti-f-Fness = 28 mm Strain = " SiS mm/km Stress = 511 MPa
TABLE A4.1 CONDUCTOR FATIGUE TEST DATA TEST NO. NEP/1

CONDUCTOR FATIGUE TEST No.
Started Fatigue Test
1 itioss oeio
1 X1I089 oeio
' 2BI088 0^30
i iiiosB oeoe
1 oiuee 074S ! 031166 0740
' 031168 °'S5
//fp//
Ceased Fatigue Test
/630
IS4S
/330
'625
1630
/600
/3-07
Duration^^ d decimal time
8 < 6 7
7-2S0
S-oo
8-2QZ
9-663 '
8-333 '
5-233 '
Page Nc
Ho, o-f cycles
Gil, ZOO
Coo,3oo
4i4, ooo
^6 5, Boo
118,960
^0,000 '
433,320 1
EN Mcycles
S79,200
1, 21L, SOO
1, 690, SOO
2.J7<?,JOO
Z 016.260 '
3, 788^ 760 '
4 , 221,600 i
430
Reason for Stoppage
Ovetmaki' shahionf^i '
« t< 1
»» <» 1
<i 4 1
« «' 1
« n 1
(o/JiK^ hti'/ure. 1
TABLE A4.2 CONDUCTOR FATIGUE TEST LOG TEST NO. NEP/1

431
DATE OF TEST <<oee - osiigg TEST NUMBER ^^PA
TOP
BOTTOM
0 Shear Breaks
0 Ducti le Breaks
Fai lure Location Condudoi- rlo^^ ^irartro
Fa i I ure Descr i p+ i on (onducior wins Ttxikcl sumiMc^Qovs/u
proUUij- GCASL i 07e QJ- iiA> m^
Number of eye 1 es to f a i I ure ^' ^ ^ 0
CONDUCTOR TESTED A^frruA/£ AAc i9/3-2s^n,.
FIGURE A4.1 CONDUCTOR FATIGUE TEST TEST RESULTS TEST NO. NEP/1

CONDUCTOR F A T I G U E T E S T N o . f^EPlZ,
432
C o n d u c t o r D e t a i l s
T e s t C o n d i t i o n s
C o d e n a m e M a t e r i a l CBL .A. '-ea, .A =
M a s s , M =
r\/BrrruA/E AAC U-1 / 5 7 . ^
Gil
kN mm"^
k g
M • 9 . 8 1 L o a d , T = = Q-5S4 k N
1 0 0 0
T 7.CBL
CBL
3'S54
241 34 6 •/.
P r e c o n d i t i o n i n g C r e e p
V - S c o p e D e t a i l s a = b =
D u r a t i o n
9
3 1
mm mm
h r s
X . b
Yp_p =
33-/E mm a t 8 9 mm - f r o m t e r m i n a t i o n
33-12 X q
92-5 3 - 2 2 2 mm
p - p 3-222 1-611 mm
L o o p D e t a i 1 s Length, De-flection.
1 = Nctt RtcoHJ^d mm . J, = A4/- Rttordtdj mm
F r e q u e n c y D e t a i I s S p e c t r u m A n a l y s i s N o . F u n d a m e n t a l F r e q u e n c y , F 2 n d H a r m o n i c 3 r d H a r m o n i c
N4 AvuMk 24-2. Hz
~Hz " H Z
F r e q u e n c y p e r h o u r n = F * 3 6 0 0 81.120
s t r e s s D e t a i l s S t a t i c , tr =
/57-6 54Z MPa
Dynamic (-from program DSTRAIN.BAS) F l e x u r a l R i g i d i t y = S t U ^ - f n e s s = S t r a i n = S t r e s s =
7 0 7
M. ISIS" 511
mm mm/km MPa
TABLE A4.3 CONDUCTOR FATIGUE TEST DATA TEST NO. NEP/2

433
CONDUCTOR FATIGUE TEST N o . I^BHZ- Page No. J/L
Started Fatigue Test
Ceased Fatigue Test
Durationf d decimal time
No, of cycles
ZN ttcycles
Reason tor Stoppage
' Ofi"® ^ « 5 J <630 i 2-OSZ J lei.SOO i lei.SOO ^ Oiy,^icfl,i SUdo^J
• 0^(188 OBIZ /62S Q.oS 1 7o i .3 i t ^ f*fl2 «/«, 1 ' ' v !
' /0/Jgfi 08JO ' /622 ' Q.20 ^ -7/4.364 ' ',5^7,2(30 ' " «> 1
' ///jflB ^XO ' /6/0 1 q.ai ' 542,/W) ' 2,43*? 3<50 ' " ' • ' I
' /4//e8 090S ' '^30 1 5.4/7 ! 733,260 ' 3,172,620 1 S-f/CMc/ ^ w / W '
1 i I I I 1
TABLE A4.4 CONDUCTOR^FATIGUE TEST LOG TEST NO. NEP/2

I
I
434
DATE OF TEST <^sii8e > 1411^ TEST NUMBER nen/i.
TOP
BOTTOM
0 Shear Breaks
0 Duct 11e Breaks
F a i l u p e L o c a t i o n iondoctot' i^^Mg'fioA *^m //is/Jt 7^4»^/^j
Fai lure Description ^'^<s^ ^'^ -Ju'/u/t j
I - ._ . 6 k
1 Number of eye 1 es t o f a i I une 311 10
CONDUCTOR TESTED ^^PTU^E /9/3-2S AAc.
FIGURE A4.2 CONDUCTOR FATIGUE TEST TEST RESULTS TEST NO. NEP/2

CONDUCTOR F A T I G U E TEST N o . /^EPJl
435
rnnductor D e t a i l s
T e s t C o n d i t i o n !
Code name M a t e r i a l CBL A r e a , A =
M a s s , M =
l^tSPTVnfB AAC. 24-7 /S76
eiz
kN mm'
kg
M * 9 . 8 1 L o a d , T = = 8 -554 kN
1 0 0 0
%CBL CBL J24-7
34 6 7.
P r e c o n d i t i o n i n g C r e e p D u r a t i o n 24 hri
V-Scope D e t a i l s a = b = M =
^'S mm mm
33 a
x.b
p-p
mm at 89 mm -from termination
- = 3-Z2Z mm 3312 *<^
n-5
p-p 3111 lUi mm
Loop DetaiIs Length, De-f 1 ec t i on 3,
1 = 3IZO 54
mm mm
Frequency DetaiIs Spectrum Analysis No. Fundamental Frequency, F 2nd Harmonic 3rd Harmonic
SPec/3
2iJ^ 464 -il:^
F r e q u e n c y p e r h o u r n = F * 3 6 0 0 Q2,S20
Hz " H Z
' H Z
S t r e s s D e t a i l s S t a t i c , <T =
SSS4 k _ JSl'G
54-3 MPa
D y n a m i c <-from p r o g r a m DSTRAIN.BAS) ^ F l e x u r a l R i g i d i t y = 7:0Z ^^«' S t i - f - f n e s s S t r a i n S t r e s s
Jfi. 7S/S
mm mm/km
sn MPa
TABLE A4.5 CONDUCTOR FATIGUE TEST DATA TEST NO. NEP/3

r 1
•
, \
'•
*
1 i~ .
1
4 . . . . , ,. . .
1 |.. -.L-.-..-.. T
\Co/tolvcTor ravqijt.
1 1 ' -L - — i -
T e j / ]A/o. h/pp/^
)^P3<f^.^frp L-^JiJ^J^.. j * ^ j _ .5^43^3, ' 1 1 ( 1
\ : i 1
! i
! ! i : i " i i ! • 1 : ' i
• ' • ' ' i ' ' i _. J . . i I • \ i i i • \ i
436 1
j ^
\ I \ ] "^—^
^
<
t I - J ._.. i ' ! • i 1 •
• 1 ! i i -; i • ^ I ~~^
i
1 1 i
J
1
1
i" i j
1
!
1
J
-1 '
i i
t
\ i i 1 : : ' ; ! i 1 i i i ^
1 1
i (^
\.
1 'S ^ | _ _ j ! t ; 1 ! < ^
' , ! ' i i ^ 1—?--> ^
i • i 1 ! 1 ' i . 1 1 1 J '
1 i : I i ! i 1 i ^ ' ' ! i
' ! ' i i \ S.
! 'i
r" ' '" [ i ;
! 1 ! i !
: ! 1
\
1 i 1
i
\ \ : ': • '
i i i ' ' ' . i j
i i i i \ i
i 1 ^ -, " —' 1
1
•i J
!
i !
- = ^
<
/ i
> \
5-1 1
— ^ !
i i i 1 ^ '
1 ' i 1 "1 1
1 1 ! i j 1
1
j i ^ ; i 1 " ' !
1 ^ 3 !
i
i — —
;
_ ) j i
1
1 1
r.-y^ ™ -
• • — *
1
1
1 i
._ i. ' < 1
i i , i 1
' -^
; I i ^
FIGURE A4.3 CONDUCTOR FATIGUE TEST SPECTRUM ANALYSIS TEST NO. NEP/3

CONDUCTOR FATIGUE TEST No.
Started Fatigue Test
\
1 04om 1211
I o^om ceo3
1 loom /535
' uom ///3 I Horn 1410
NZPIZ
Ceased Fatigue Test
' ISSt
IIZI
ICZ8
ns6
Coo'cl /l<9t
Durationf d decimal time
Page Nc
No, of cycles
EN Mcycles
437
3 . ' / / .
Reason for Stoppage
' ^'40 ' 283,'?68 ^ lei,ctGe ^CU'^oii jUcku//> 1 — ' '^ 1 •t
' 3-333 ^ lie.400 ! 5n,36e ^ l^o^e TI^S yS/W 1
' 0-8fi3 ' -73,776 I 63C.I44 l^«v,^A/ skoUoMt 1
' O.7S0 '
• eriaUuC, s^nl
62,640 I 696,164 1
idl'r^ It^le, CutJ \
Maiiot Mi jiii/uy^ 1
>T 0 /^Sl>lJt '
of tx(fvv\4 Medfo/i ^0/y,^Vii>cA Ik c^XfdudoJ- Wires- 1
eyceedfed ;b<i ^layit'c J^Wtti CutU ^fit I ^ /f<j 4 '
a/>ci JD(/M OiyicJUcfotT \-fztdic(. 1 i 1
! TABLE A4.6
1 I I I 1
1 1 1 1 1
i l l 1
I I I 1
I I 1 t
1 1 ! 1
I I I 1
I I I 1
I I I 1
I I I 1
I I I t
1 i 1 1
I I I 1
CONDUCTOR FATIGUE TEST LOG TEST NO. NEP/3

438
DATE OF TEST o^o/a?- noisR
TEST NUMBER tiiJlJi.
TOP fsGy3\
©id^l© iCtlQlCIJ
BOTTOM
©
©
Shear Breaks
Ducti ie Breaks
Fa i 1 upe Locat i on ^ ^ ^ ^ •k^^i^ci^o^ , —
Fa i I ure Desen i pt i on l^sic^ior^our—iv/^ Wt>/ .
Number of eyeles to fai lure /.K./^ ^& rm/^.
CONDUCTOR TESTED 'i^HJ^ ^^ "^''^''-
FIGURE A4.4 CONDUCTOR FATIGUE TEST TEST RESULTS TEST NO. NEP/3

CONDUCTOR FATIGUE TEST No. f^£Pl4 439
rnnductor Details
Test Conditions
Code name Material CBL Area, A =
M a s s , M =
A/£PTUA/£
AAC 24-1 /Sl'G
QIZ
kN m.m'
kg
M • 9 . 8 1 L o a d , T = = 9-554 kN
1000
7.CBL CBL
Q'SS4
Z4-7 346 -/.
P r e c o n d i t i o n i nq
V-ScDpe D e t a i l s
C r e e p
a = b =
D u r a t i o n
925 9 7-4
3 I
mm mm mm a t 89 mm
h r ;
x . b 7-4 r 9 p - p 925
012O mm
Y „ - n »- P
0 120 0-360 mm
Loop D e t a i I s Length, De-flection
sax,
1 =
Y«ax =
24/5 25
mm mm
Frequency DetaiIs Spectrum Analysis No. Fundamental Frequency, F 2nd Harmonic 3rd Harmonic
SPec/4 3Q'0 60-O
Frequency pe r hour n = F • 3 6 0 0 108,000
Hz 'HZ
90O Hz
S t r e s s D e t a i l s S t a t i c , o- =
ff-554 k /S7-(,
54 3 MPa
Dynamic (-from program DSTRAIN.BAS) ^ .P^lsJiural R i g i d i t y = ToT Nm St iHF- fness = 2fi mm S t r a i n = f680 mm/km S t r e s s = f'4'Z ^^^
TABLE A4.7 CONDUCTOR FATIGUE TEST DATA TEST NO. NEP/4

^
o f-l " v —
• •
_ in Q
L.> a . a
Q :— ^ a i
— > — (
a "* m CM I
„-* « cn ^
— m fcM— LU LU . u cn « Z Ll, I-< Li. C
— 0 ^ Q >•
1
i 1 !
1
S-W
1 •
. O i
a z la < I ^ J a. 5f E: O •*—*"* n - QL cn — f c i . . 1 1 1 —
J i CD
p o tt: - g. ^ - —
'
1
'
!
iondvcrot Spte-^v^*^
faT/»^t, ^^ii Va, A/IPU
AnoL^^^ A/o .SPECU
1 1 1
^ 1 t
1 1
1
j 1 1 1 j 1
i
i
1 1
1
I
440
\
i ^ ' ! 1 "1
i
\ \
i I " ! 1 ;
'
1 1
1
:
<
: ) : ' : S
1
!
i ^
1 i ^ 1
1
i 1
1
f
. * = ; — \
1
i
1
! \
1
1 1
1 t 1 1
1 ^
1
i < ! 1
1 1
J
,
r J
p. 1 i 1
1 1
/
^
FIGURE A4.5 CONDUCTOR FATIGUE TEST SPECTRUM ANALYSIS TEST NO. NEP/5

441
CONDUCTOR FATIGUE TEST No. A^£p/4 Page No. t/l
Started Fatigue Test
Ceased Fatigue Test
Durationf d decimal time
No, of EN cycles I Mcycles
Reason for Stoppage
1 nofdi
' ieots9
1 l<ioi8'l
' 2oom
' lOoiSfi
' 230 m
1 *
> u
1 "
1 l»
1 0
1 74oi8<i
• ir
' h
1 o/025<?
' O20284
' 03026<J
' (?702fl<?
' O802B9
1 (/
1 Oq028«»
loso
08\Z
0747
05oq
'541
0^01
0^32.
1027
/«25
i2¥\
K41
0753
09/2
/5i7
/02I
oeoo
oeo4'
Oiil i
ogio '
/Z2q 1
^/6 1
' I5S0
1 /5fO
' /600
' ^^35
' /6/<?
' 0922
' /022
' 1041
1200
^ /- ZZ
' isn
O908
o^ae
2no
1538
/624
0940 '
/6/5 '
J2I9 '
/62ff 1
/6/«7 1
' 5-00 0
7-6 /7
' ff-2/il
' ^ - « 3
' 2-633
K
1 1 1/
ll ll J 4-7/67
7-73 ^
5--783 '
840O 1
/•60<5 1
7-040 1
4-/5 1
J-?53 I
^•017 1
1 54o,ooo
' 62n,coc
' 8e7,4oo
' 4C^ ffoo
' ^ f 403
4554O0
535,200 •
57c?i6oo '
907,200 ^
nz,8oo 1 760,320 1
44e,2oo '
-^30,200 '
5'65r, oo 1
I 540.ooo.
i /, 362,600
1 .?, i5Z>, ooo
' 2.296,090
1 7, 5e/.2oc)
5,036,000
3,87f,8oC '
4 ,442,400 '
5,349.^00 '
5", 522^40© i
6,262,720 1
<;, 7JC> f2^ 1
7,liljt20 1
^ , 0 2 i , W ( j l
'w /n/JiAf 5/?i/'yi>H;/| '
} » »• 1
\ ll H 1
' R/r»» /««/ •hAtjvt.d '
1 OvtTAiifliT sl^UJo¥jn '
/^cdtcl Pu4JltMns '
«te»t/»« « "Rtil/rt of 1
mozof s/ttta Co^tmiitt, .
OWM'<^ k T Sni/Tjtwn '
Vtfttvte of Ttlli/rt ol
W»t7 ikart ni'i^vfJ. '
0^^/fiifhr SA.,/aoiv/j '
•• w {
/J»i^ sAeen •Mtjvtd \
0\rij^,-^t,i fAv/c/c^.t'
iflai^JttAt^ct '
OviA^t'tflif ^myyr/, 1
" 1
TABLE A4.8 CONDUCTOR FATIGUE TEST LOG TEST NO. NEP/4 SHEET 1

442
CONDUCTOR FATISUE TEST N o . /\/£ph Page No. 2jl
Started Ceased Duration, d Fatigue Test j Fatigue Test decimal time
No. of cycles
EN Mcycles
Reason for Stoooage
1 /0025«» 0827 « l(,4e 1 eS5 ^ 901. Boo ' e,<^28 720 J <?uWa4f 5UJc^ 1
1 130269 oeSi ' /62<? ' 7-55 ' 5/5,4co ' %144.no i " " 1
Hozeq Oei<i ' /G35 ' g-267 ^ ^92. Boo ho,63(,,920^ CeaxJ -kxt <^ '
' ' ' ' ' 1 /O cy-ticr. '
1 I ' l * 1 1 1 t
TABLE A4.9 CONDUCTOR FATIGUE TEST LOG TEST NO. NEP/4 SHEET 2

443
DATE OF TEST TEST NUMBER
n
TOP
BOTTOM
©
©
Shear Breaks
OuctiIe Breaks
Fai Iup€ Location
Fa I Iure Descr Ip t i on
/\/o
A/,
niif(/rts
rcif'/vftr
Number of eye Ies t o f a i I u r e io-3(,^(o
CONDUCTOR TESTED »fiPT\/f\/e AAC i<i/3-2S
FIGURE A4.6 CONDUCTOR FATIGUE TEST TEST RESULTS TEST NO. NEP/4

CONDUCTOR FATIGUE TEST No. NBP/5
444
C o n d u c t o r D e t a i l s
T e s t C o n d i t i o n s
C o d e n a m e M a t e r i a l CBL A r e a , .A =
M a s s , M =
/^iPToAfP
AAC
247 /57(>
Q72
kN m-Tj'
kg
M * 9 . 8 1 L o a d , T = = 8SS4 kN
1 0 0 0
7.CBL ' ^ 8-554 ^
CBL 247 34 6 •/.
P r e c o n d i t i o n i n g C r e e p
V - S c o p e D e t a i l s a — b =
Dura t ion
92-5
f8 h r s
mm mm
/G-4-4 mm a t 8 9 mm - f r o m t e r m i n a t i o n
x.b
Yp-p = 16-4 xq
925 t-CO mm
p-p /•6o 0-BO mm
Loop Details Length,
De-f 1 ec t i on „ J. JJ
1 = 1595 45
mm
mm
Frequency DetaiIs Spectrum Analysis No.
Fundamental Frequency, F
2nd Harmonic
3rd Harmonic
SPec/s 29-0 56-0
64 O
Hz " H Z
" H Z
F r e q u e n c y p e r h o u r n F * 3 6 0 0 too, goo
s t r e s s D e t a i l ! S t a t i c , o-
8, SS4k ^
/57-6 S4-3 MPi
Dynamic (-from program DSTRAIN.BAS)
F l e x u i ^ a l . R i g i d i t y ^ = 7-07 Nm S t i - f - f n e s s = 2 ^ mm S t r a i n = 36^3 mm/km S t r e s s = 246-4 MPa
TABLE A4 .10 CONDUCTOR FATIGUE TEST DATA TEST NO. NEP/5

> • -o r 0 ~ > " — 1 a o
t «
Un a (
! > . a
1 ° *.. GJ—— • j "-* o
i cn
j o ' O ! > T-«
! a ^ 1 t t n
; tn i— 1 Ul U - J '."iD to •<
Z Li. t -r-:irWrcj i t r n »— 1
I !
;
5
j
1
1 1
1 i
— — . ...i
1 1
1 1
Conductor M'mut, Ikj^ N^ N^P/5
!5>ec;ftv^i A A A P 4 '•^ SPiclf. \ ' !
; • i •
« i '
j . , i , ,. .^ _: _ ! • \ . ^ j ~
1 ' Ui 1 ] UJ .
C D •> (/I UJ : a Li. i
a 2 to i • ^ Q ^ ^
>- l ,., u. 0 ) i Q; Q: (\j I - LLI
' 1 CD cn — O (M •
a CK '«*• Q_ 1— - • :
i
1 1
,!
I
i
1
1
i
i 1
i ]
j i
i \ r—
J J
! 1
1
1
\ . _« —« ,-.
.1 1
j
t
1 1 i • " 1
*— ' • - — — 4 -
I 1 " " " '
1 1 ( r . 1 - 1
1 I
1
1 4
^
i . . • — • — » i • • • I . — • . . • • — ^ • • —
i
i !
i
— ^ — ^ —
I
,
'IGURE A4
\ :
\ 1
1
1
1
'
1
1
1
< ! j
i J
-'
1 " - * - i" ' •
1 1 1
J
i 1
1
1 \ ! ( r • •
i
1
• • • 1
. 7 CONE SPEC
»UCTOR FA' ;TRUM ANA
i 1
j
i i
i
-i 1
j 1
I 'i
t
]
i
j i
1
i
i
1
.;
i
445
— 1 - I
! 1
i /
-. .— 1
^ 1 ' • '1
i
• ^ '
•
I I
• 1 1
i
1 ) 1 1 1
. :
1
: ^ i
•
. . i . I
i
1 ! /
i 1 i 1
i
i
1 { S J.-1 \
' '• ^ " " ^ i 1 •• \ 1 ^ 1
' 1' ' 1
-
i i
j
1 1 ! 1
i ' J ' ' { i ' )
i 1 ^
I 1 :
i
1 1
riGUE TE5 LYSIS TE5
5T 5T NO. NE
I
P/5
- , J
! — \ i
i '
1 1 1
i

446
CONDUCTOR FATIGUE TEST No. I^BpJs Page No. •JJL
Started Fatigue Test
Ceased Fatigue Test
Durationf d decimal time
No, of cycles
EN Mcycles
Reason for Stoppage
1 /60289 1420 ' /6fO ^ ?-33 ' 3Zi,0oo 1 33&,ooo ' O^^f^f St,i,icA>wn. '
^ 2002«\ 0130 ' / 6 / 0 1 ff&(>7 ^ 813,634 ' l,20<i,634} " * '
lil02fl«l 0730 ' 7625" ' e-9/7 '8'>e,5I4 ' 2,»off 466 1 " " '
1270269 GIZO » /G4S ' 9-2S0 ' ^J2,40<? ' 3 , 0 4 0 5 6 6 ' * '" '
\lloie^ 07tS ' /G4S ' 9'SOO ' 9S7iCrX> ' J,"We. 466 ' " " '
l o e j O720 ' /<j-fO ^ 'y-^oo ' 94o,6oc>' 4 ^ 7 j V ^ e 1 - " '
' 270209 O720 • /640 ' 9ZZ3 ^ 940,Sco} S,6BO,OGB^ " " '
•20O28<? 0735 ^ /64r ' ^'/^5- ' 9J.5:?47 ' ^.^/<J.O/5"' - ' '
\>\02%9 Ol3C ' ^^30 » -OOO. ' 907.2OO ' 7,723,2/5 f " * '
'ozoae<i 0730 ' JZ40O. ' 1(>-SOO » /,663.20t3 ' <?,3e6,4'5" ' '>:tu.<«/=M •vtvwj'ife 1
'o2ozw 240O ' 0840 ' 8-60^ 8l3,^ox> ^ lOj26oo\S^ CccstA ittk d lo'' 1
1 1 1 i l l C«JC4M.
TABLE A4.11 CONDUCTOR FATIGUE TEST LOG TEST NO. NEP/5

447
r' I
• - i
DATE OF TEST /602OT - 020 zg? TEST NUMBER v >V5-
TOP
BOTTOM
®
©
Shear Breaks
Oucti ie Breaks
Fai l u r e Loca t ion AQ 7^,iuf,r
Fai lure Description A6 f^,%rtT
6
Number of eye I es to f a i I ure ^^"^ " '°
CONDUCTOR TESTED ^spru^f AAC n/^is
L_.. ... ^ —-•
'FIGURE A4.8 CONDUCTOR FATIGUE TEST TEST RESULTS TEST NO. NEP/5

CONDUCTOR F A T I G U E T E S T N o . A/£Pk
448
r n n d u c t o r D e t a i l s
T e s t C o n d i t i o n s
C o d e n a m e M a t e r i a l CBL A r e a , .A =
M a s s , M =
fi/£PTVA/£
AAC 24'(. /S7-C.
81Z
kN mm'
kg
M * 9 . 8 1 L o a d , T = = B5S4 kN
1 0 0 0
T 7.CBL
CBL
8S54
24-(, 346 •/.
P r e c o n d i t i o n i n g C r e e p
V - S c o p e D e t a i l s a = b = X =
D u r a t i o n
925 9
Z(>
\
mm mm mm a t 8 9 mm
h r s
p - p
x . b
Y p - p
2(>>r9
925
2'Sl
2-51
/2C5
mm
mm
L o o p D e t a i I s
F r e q u e n c y D e t a i l s
L e n g t h , De-f 1 e c t i o n jjj ^ J,
1 =
S p e c t i ^ u m A n a l y s i s N o . F u n d a m e n t a l F r e q u e n c y , F 2 n d H a r m o n i c 3 r d H a r m o n i c
F r e q u e n c y p e r h o u r
A 6 / Rtco/cttJ Ttfn ^of /i*cofJtd i im
SPec/6 F = 3oe
61-6 92-4
n = F * 3 6 0 0 110,880
Hz Hz Hz
S t r e s s D e t a i l s
S t a t i c , o- = 8-554 h-
/S76 54-26 MPa
D y n a m i c ( - f r o m p r o g r a m D S T R A I N . B A S ) F l e x u r a l R i g i d i t y = 7-07 Nm S t i f - f n e s s = "29 mm S t r a i n = 5177 mm/km S t r e s s = 392-8 MPa
TABLE A4.12 CONDUCTOR FATIGUE TEST DATA TEST NO. NEP/6

— > . . . . . a —a->-1 • • j lO-Q. i
1
1 >
i • °
. w i - ^ — . • - « - « - . _ — - .
1
Cpacifcior
Sfif^cfri//ty J^fjjCfV^
_. .___
^j^-iL-.jy^-^j^i
\ 1
1
1 ; ; . -
i 1
! rH Q i cn
, o ~ cn " > — -O (n. CL _
i a i . a <
! a - * j o 2 CO 1 -J-" -.-f-if-. - < o --1 in CJ UJ .. 3 : 1
j Zu) — - ( / V I — : UJ UJ 1 tJ'C/T-
.2 . U} 1
1 - CK Ot: i n i—1— lxi--,» JJ 1 (J) - * ^ t— fi i n —_
L_2,,u...t:^a)_-; _ 1 -^ *^ • ( K . O
i 1 I.. 1 1 )• ....
1 L -1 1
J 1
^ ;
^
L.. 1 r
f LJ u u:. a hr^Sn-hrr^Tn _ . „ . J
1 1 )
t
^.,-».^.,^ ^ i
•
1 1
1
\
1
ISpee^C i
j
i
i !- - - . j- - .
1
1 j !
1 j 1
- - j — -\ -- --• 1
i
.._- .
. • - " - ' - • - . - - . — i
i
- | - ' • • •
1
! ' i 1
- -1 ] 1 1
• • , 1
! j i
1
I
1 ... _ . .._ ._.
""'M T
M--.- ] 1
]_ ! _ i
M " "" 1 — -
r i
1 i
— . tz:"
1 i
t
1
1
T
1
i _ . i
i '
449 .T....:.""'
-i.Li_.r. !
' < " J ' '
!
— -
- - -
• • • ! - - -
• - ' - - • - - - ' • - —
..—...-...,..,.
-—-.—.
—
— • • • • • • ' • • • '
... .......
...........
— —
..
.._
------
,. ...-._...
- - • -
i
.j -
i
1
j
...
•1 -.
1
i
- — — — —
.. L. ..-_. J 1
i - .y
1
•~'r - • -
•M " " i
1 1
1 1
..• • r
i i ! 1
] |. ! ~1 ! i
j
I
1
• • ' - I
FIGURE A
•
4 . 9 COl
SP]
[ 1 1
WUCTOR F ECTRUM AN
ATIGUE T ALYSIS T
- ; — ^ .- L . . . .
i
!
i T 1
1
1 i
EST EST NO. ^
;^
- r h : 1
. j . . . - .i I !
"' i ! 1
! [ ! i
. . i 1
1
IEP/6
i 1
-~-H
I
- ... -^... ..——
..-.
•
1 1 ,
1
1 1 1
1
1 1 1
1
i 1
i
, , . .

450
CONDUCTOR FATIGUE TEST No. mp/s Page No. ///.
Started Fatigue Test
Ceased Fatigue Test
Durationf d No, of decimal time cycles
EN Mcycles
Reason for Stoppage
1^6048*^ /045 ' 5-30. ' 6-75 ' 748440 ! 748,440. 1 Ov^/^k-f SUdow^i.^
070469 815 ' 4.4S ' ff.so ' 942460 ! / 6 90920 \ " ' ' I
I0046*i QTJO . ' 2400. ' /S-U7 ' [137,\20 1 342604-0. ' - '
' 11046^ OooO 1 240O ' 24firO 1 2Gil,l2.0 ' C,06%1(>0 ' — '
1 /Z04M OOOO. 1 OS37 1 S-G/7 ' 622,776 ' C,7U^3(, ' JV/Ve -^/'/vre. '
1 I ' l * I I I 1
i 1 1 1 1 ! 1
1 1 1 1 1 ! 1
TABLE A4.13 CONDUCTOR FATIGUE TEST LOG TEST NO. NEP/6

451
DATE OF TEST 06o*&^ - no^sc,
TEST NUMBER f A
TOP
BOTTOM
0 0
Shear Breaks
Oucti ie Breaks
Fai lure Location ConoCutA-yf- ^fr/n,l, «>/, <V7
Failure Description ^fnet 'z W'^t TCijlurQ.
Number of cycles to failure 6-n xio^-
CONDUCTOR TESTED N£PTl»JB AAC J9/3-25
L. ,.j
FIGURE A4.10 CONDUCTOR FATIGUE TEST TEST RESULTS TEST NO. NEP/6