Embed Size (px)
Citation preview
Methodology – Calculating Heat Demand
The methodology was designed with the following factors in mind:
• Spatial accuracy
• Repeatability across Scottish LA’s
• Access to data
• Consistency
• Ability to be updated
The Heat Demand Model is based upon assigning an energy value to every address with a potential demand for heat within the Highland Council area


Heat Demand Methodology
Residential data from the Corporate
Address Gazetteer (CAG), the Highland
Assessors & the Scottish House
Condition Survey
Commercial & Industrial Rateable Floor Areas from
Highland Assessors combined with
energy use benchmark data
CIBSE TM46
Significant Point Source (Existing buildings) energy
consumption plotted – including THC
properties, hospitals & other public
buildings
Data on proposed new residential
property
Data on proposed new commercial and
industrial property
Data on proposed new public buildings
HEAT MAP
Residential Commercial & Industrial Public

Heat Map - Data Sources
Heat Demand
Corporate Address Gazetteer (CAG)The Highland Council
Assessors dataThe Highland Assessor
Public buildings energy consumption
The Highland Council
HospitalsNHS Highland
Energy benchmarksChartered Institution of
Building Services Engineers (CIBSE)
Scottish Household Condition SurveyScottish Government
Potential Heat Supply
Fossil fuel suppliers
yell
Woodfuel suppliersUsewoodfuelscotland
Existing District Heating networks
Gas networkScotia Gas
Existing industrial heat production
SPRI
Existing landfill sitesSPRI
Skills & Technology
SuppliersMicrogeneration
Certification Scheme
Education
Opportunities & Constraints
DesignationsSNH
Flood RiskSEPA
Highland Forest and Woodland
StrategyThe Highland Council
Expansion/ regeneration opportunities
The Highland Council
Planning applications
The Highland Council

Heat Demand – Key Issue & Solution
Key dataset Highland Assessors data
AdvantagesProvides good quality information about:
• property type
• property age
• internal floor area
Disadvantages• Data completeness
• Data currency
Solution• Use of weighted averages
• Future planned updates

Heat Demand ModelScottish House Condition Survey (2009)The SHCS has been used to predict a range of heat energy predictions for different types and ages of property. The data in SHCS indicate the following energy intensities (kWh/m²/yr for space and water heating) for the 20 different categories:
Pre 1919
1919-1944
1945-1964
1965-1982
Post 1983
Detached 594 627 505 404 276
Semi 456 350 305 249 181
Terrace 349 251 249 204 149
Flats 268 203 156 129 106

Heat Demand Model - PredictionsScottish House Condition Survey (2009)
The Heat Map can also be used to predict the impact of development on future heat demand in an area. We have taken the basic philosophy that users can input their own values based on the timing and design of the development.
Otherwise default values can be calculated for residential development using the following figures:
2011 – 2016: 65 kWh/m² per annum
2017 onwards:Flats and Terraces – 39 kWh/m² per annum
Detached & Semi-detached – 46 kWh/ m² per annum
For non-domestic properties, values would be calculated as a % of the CIBSE benchmark figures:
2011 – 2016: 70% reduction (e.g. restaurant 111 kWh/m² from 370 kWh/m²)
2017 onwards: 95% reduction

The base data used for the map is the CAG. For the Highland Council area this provided a total of 142,730 CAG records. Each record was then assigned a heat demand value. The method for assigning this value is broken down below:
• 93296 Assessors records – demand predicted using floor area, age and property type
• 788 HC properties – actual energy consumption used
• 18 NHS properties
• 5661 benchmarked properties – using floor areas derived from Assessors data or MasterMap footprints
• 11506 CAG records without energy demand
• 136 records – unquantifiable demand
• 212 records – possible heat supply and/or demand
Results
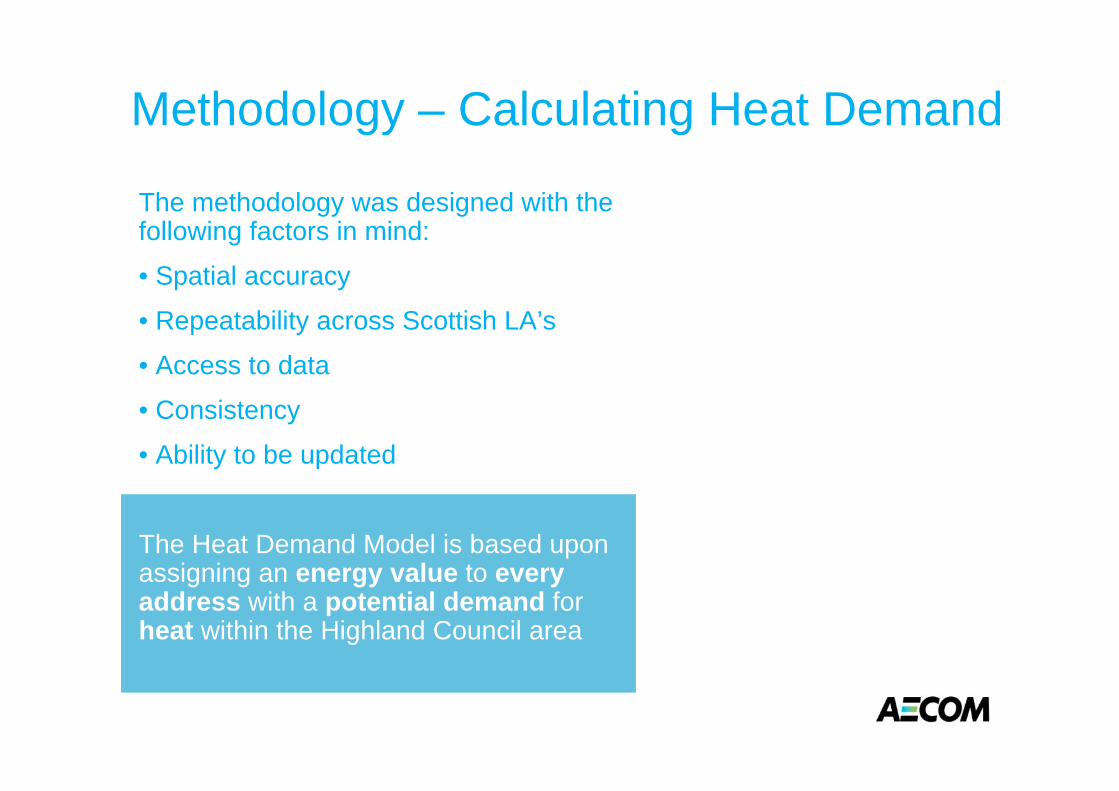
During the development of the Heat Map it was clear that some information was more reliable then others.
A confidence layer was developed to allow users to understand the degree of accuracy associated with different locations on the map.
The confidence levels will improve over time as new and updated information is added to the map
Confidence Levels


Nairn Swimming Pool – 1,166,410
Nairn Hospital – 1,061,191Nairn Academy – 413,416