Embed Size (px)
Citation preview
INITIAL PARTICIPATORY RURALAPPRAISAL OF MONA SCARP
AREA
METHODOLGY REPORT -II
INITIAL PARTICIPATORY RURAL APPRAISAL OF MONAPROJECT USING PARTICIPATORY DIALOGUES WITHCOMMUNITTIES OF THE SELECTED VILLAGES TO DEVELOPMETHODOLOGY FOR SELECTION OF SITES AND OPTIONSFOR SKIMMING WELLS AND PRESSURIZED IRRIGATIONSYSTEMS UNDER THE “ROOTZONE SALINITY MANAGEMENTPROJECT”.
WATER RESOURCES RESEARCH INSTITUTE NATIONAL AGRICULTURAL RESEARCH CENTRE
ISLAMABADMarch 2000

CONTRIBUTORS
WATER RESOURCES RESEARCH INSTITUTE
Dr. Shahid AhmadMr. Muhammad YasinDr. Muhammad Munir AhmadMr. Ghani AkbarMr. Zahid Khan
MONA RECLAMATION EXPERIMENTAL PROJECT
Dr. Muhammad Akram KahlownMr. Zafar Iqbal Raza
INTERNATIONAL WATER MANAGEMENT INSTITUTE
Dr. M. S. ShafiqDr. Muhammad Aslam
INITIAL PARTICIPATORY RURAL APPRAISAL OF MONA SCARP AREA
1. INTRODUCTION
1.1. Background of Skimming Wells and Pressurised Irrigation Systemsand NDP
Exploitation of groundwater for agricultural, municipal and industrial uses is severely hamperedin many parts of the world by the encroachment of brackish groundwater in response to freshwater withdrawals. Examples of brackish groundwater intrusion are common in coastal aquifers,but are sometimes present in inland aquifers as well. Probably, the most important example ofthe latter case exists in the Indus Basin Irrigation System (IBIS). The IBIS has caused disruptionof hydraulic regime due to seepage from extensive water conveyance and distribution system, aswell as deep percolation from irrigation and precipitation. The native groundwater that existed inthe pre-irrigation period (early 19th century) was salty because of the underlying geologicformation being of marine origin. Now, this native salty groundwater is overlain by freshgroundwater due to seepage from rivers and canals of the IBIS. Thus, shallow fresh groundwaterzone occurs between the native pre-irrigation and the present day water tables.
Near the rivers and canals, the fresh surface water seepage has improved the quality of the nativegroundwater to 120 to 150 m depths. However, in some areas, the thickness of the shallowgroundwater zone ranges from less than 60 m along the margins of Doabs (area enclosedbetween two rivers) to 30 m or more in the lower or central parts of Doabs. Recently, it has beenestimated that nearly 200 billion m3 of fresh groundwater (mostly in the form of a thin layer) islying on salty groundwater. Obviously, if proper technology is applied, the referred thin freshgroundwater layer can be skimmed from the aquifer with minimum disturbance of the saltygroundwater zone. In the short irrigation water supply environment of Pakistan, such extractionswould become a significant part of supplemental irrigation.
The explosion of pumping technology in the private sector, high capacity tubewells of more than28 lps discharge are being installed even in the thin fresh groundwater zones. Framers arenormally interested to install tubewells of higher discharges to have efficient basin irrigation.This can be regarded as a psychological issue rather than based on techno-economics oftubewells or physical conditions of the aquifer.
In such zones, these tubewells are likely to draw a substantial portion of their discharge from thesalty groundwater. The primary problem is that the tubewell discharges are too large for thegiven physical situation of the aquifer. This is particularly true for the tubewells located in thecentral regions of Doabs in Punjab province of Pakistan. The exception would be tubewellslocated adjacent to rivers and large canals where large quantities of seepage are recharging thegroundwater reservoir.
Thus, if such tubewells are not replaced with fractional skimming wells, there is a seriousconcern that the pumped groundwater will become increasingly salty with time. Already, many
high capacity public tubewells are being shutdown at the request of farmers in these areas, as thepumped water has become salty (saline, saline-sodic or sodic) with time. In addition, there is ahigh expectation that many private tubewells will have to be abandoned during the next comingyears. Therefore, it is imperative to introduce fractional skimming well technology to addressthese future concerns.
Taking into consideration the vital importance and urgent need for developing skimming wellsand pressurised irrigation technology, a tripartite institutional arrangement (Water ResourcesResearch Institute, NARC; Mona Reclamation Experimental Project, Bhalwal and theInternational Water Management Institute) was developed to initiate a collaborative projectentitled "Root-Zone Salinity Management using Skimming Wells and Pressurised IrrigationSystems". The project was financed by WAPDA under the National Drainage Programme andinitiated in the Target Area at the Mona Reclamation Experimental Project, Bhalwal duringNovember 1998.
1.2. Need and Location of the Participatory Rural Appraisal
The project is aimed to develop and test technology for skimming wells and pressurisedirrigation for adaptation in the farming environment. In the beginning, a spatial and temporalanalysis was conducted for the groundwater quality of SCARP tubewells in the Mona Unit toidentify potential locations in the Target Area based on spatial analysis of deep groundwaterquality.
The potential locations identified in the Target Area using GIS study had to be validated by thefarmers. Therefore, Participatory Rural Appraisal (PRA) was necessary to document farmers'perceptions regarding the problems and to assess their willingness to participate in the projectactivities, especially the testing and adaptation of the technology. In addition the informationprovided by the farming community will be useful in the design and layout of skimming wellsand pressurised irrigation systems. Taking into consideration the need for PRA, a study wasinitiated in the Target Area, where thirteen villages were selected for PRA (Figure 1).
1.3. Classification of SCARP Tubewells in the Target Area
According to the GIS study, the potential villages selected represent freshwater, marginallysaline, marginally saline-sodic, and hazardous quality of deep groundwater. The freshwatervillages are selected to validate that whether the SCARP tubewells represent the overall pictureof the area or not. In eleven villages out of thirteen selected for the PRA study, the SCARPtubewells were installed. The number of tubewells ranges between 2 to 5 (Table 1).
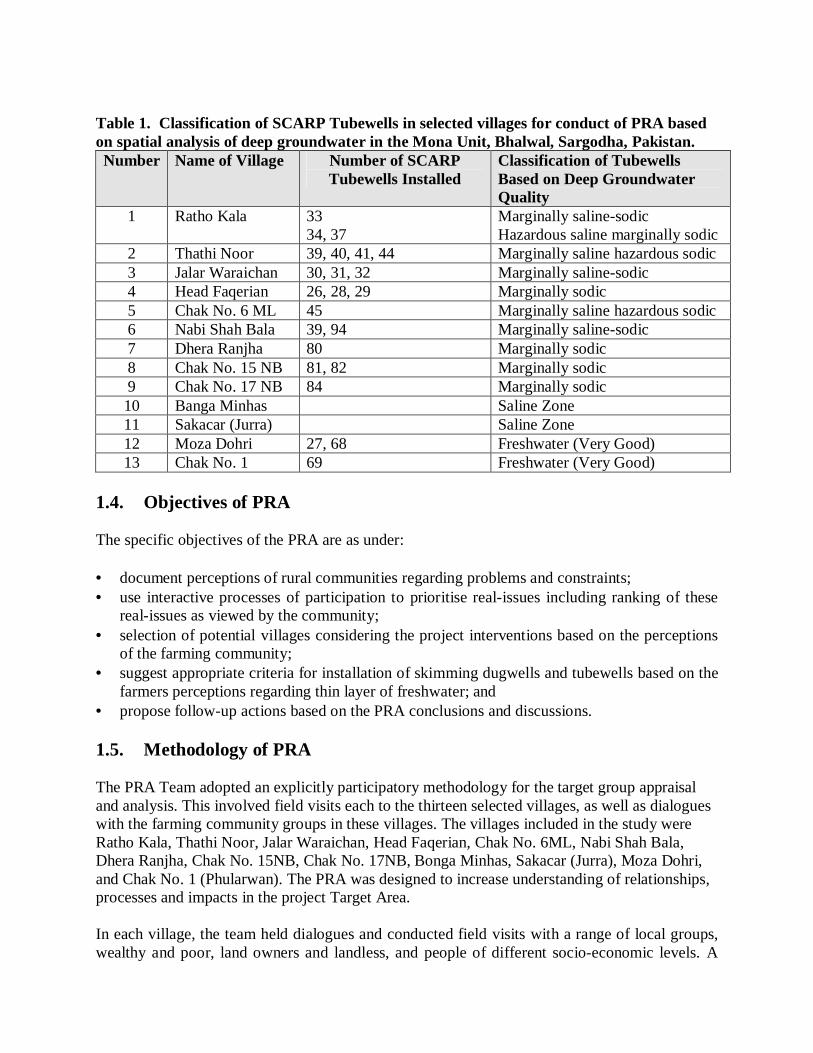
Table 1. Classification of SCARP Tubewells in selected villages for conduct of PRA basedon spatial analysis of deep groundwater in the Mona Unit, Bhalwal, Sargodha, Pakistan.Number Name of Village Number of SCARP
Tubewells InstalledClassification of TubewellsBased on Deep GroundwaterQuality
1 Ratho Kala 3334, 37
Marginally saline-sodicHazardous saline marginally sodic
2 Thathi Noor 39, 40, 41, 44 Marginally saline hazardous sodic3 Jalar Waraichan 30, 31, 32 Marginally saline-sodic4 Head Faqerian 26, 28, 29 Marginally sodic5 Chak No. 6 ML 45 Marginally saline hazardous sodic6 Nabi Shah Bala 39, 94 Marginally saline-sodic7 Dhera Ranjha 80 Marginally sodic8 Chak No. 15 NB 81, 82 Marginally sodic9 Chak No. 17 NB 84 Marginally sodic10 Banga Minhas Saline Zone11 Sakacar (Jurra) Saline Zone12 Moza Dohri 27, 68 Freshwater (Very Good)13 Chak No. 1 69 Freshwater (Very Good)
1.4. Objectives of PRA
The specific objectives of the PRA are as under:
• document perceptions of rural communities regarding problems and constraints;• use interactive processes of participation to prioritise real-issues including ranking of these
real-issues as viewed by the community;• selection of potential villages considering the project interventions based on the perceptions
of the farming community;• suggest appropriate criteria for installation of skimming dugwells and tubewells based on the
farmers perceptions regarding thin layer of freshwater; and• propose follow-up actions based on the PRA conclusions and discussions.
1.5. Methodology of PRA
The PRA Team adopted an explicitly participatory methodology for the target group appraisaland analysis. This involved field visits each to the thirteen selected villages, as well as dialogueswith the farming community groups in these villages. The villages included in the study wereRatho Kala, Thathi Noor, Jalar Waraichan, Head Faqerian, Chak No. 6ML, Nabi Shah Bala,Dhera Ranjha, Chak No. 15NB, Chak No. 17NB, Bonga Minhas, Sakacar (Jurra), Moza Dohri,and Chak No. 1 (Phularwan). The PRA was designed to increase understanding of relationships,processes and impacts in the project Target Area.
In each village, the team held dialogues and conducted field visits with a range of local groups,wealthy and poor, land owners and landless, and people of different socio-economic levels. A
wide range of participatory methods was used including historical trends, livelihood analysis,seasonal analysis, and scorings. These dialogues were held in the villages and transect walkswere made along with the farmers groups. The team on every afternoon arranged discussions toestablish trustworthiness of the findings.
Six essential elements of the PRA methodology used in the Target Area are: a) a definedmethodology and systemic learning process; b) multiple perspective; c) group learning process;d) context specific; e) facilitating experts and stakeholders; and f) leading to sustained action.The participatory methods used in these systems of learning and action can be structured intothree classes: a) methods for group and team dynamics; b) methods for sampling; and c) methodsfor interviewing and dialogues.
It is the collection of these methods into unique approaches, or assemblages of methods, thatconstitute different systems of learning and action. The techniques used under each method arepresented in Table 2.
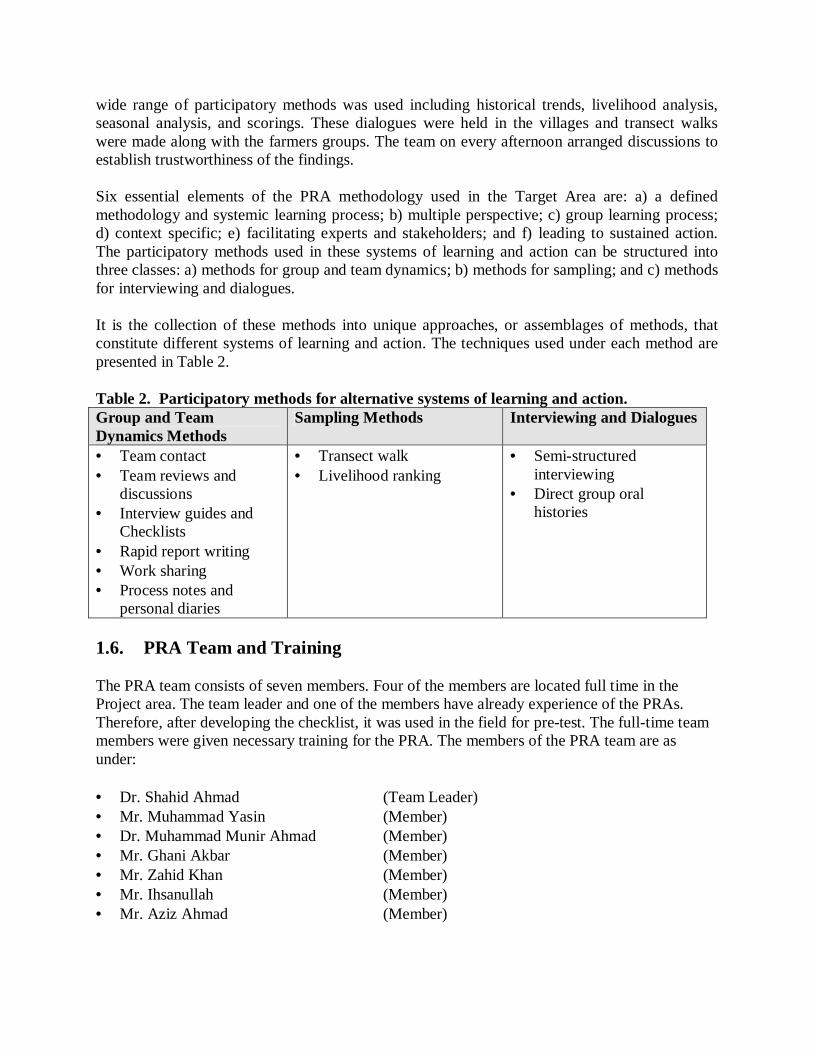
Table 2. Participatory methods for alternative systems of learning and action.Group and TeamDynamics Methods
Sampling Methods Interviewing and Dialogues
• Team contact• Team reviews and
discussions• Interview guides and
Checklists• Rapid report writing• Work sharing• Process notes and
personal diaries
• Transect walk• Livelihood ranking
• Semi-structuredinterviewing
• Direct group oralhistories
1.6. PRA Team and Training
The PRA team consists of seven members. Four of the members are located full time in theProject area. The team leader and one of the members have already experience of the PRAs.Therefore, after developing the checklist, it was used in the field for pre-test. The full-time teammembers were given necessary training for the PRA. The members of the PRA team are asunder:
• Dr. Shahid Ahmad (Team Leader)• Mr. Muhammad Yasin (Member)• Dr. Muhammad Munir Ahmad (Member)• Mr. Ghani Akbar (Member)• Mr. Zahid Khan (Member)• Mr. Ihsanullah (Member)• Mr. Aziz Ahmad (Member)

1.7. PRA Checklist
PRA Checklist was prepared to focus the methods of group and team dynamics. The Checklistincludes all elements relevant to the project activities and household system in the selectedvillages. The major elements of the Checklist are:• Household system;• Resources availability and use;• Water resources and related aspects;• Agricultural productivity;• PRA discussions and conclusions;• Interventions; and• Recommendations.
The detailed Checklist is presented in Annex. I.
2. PRA FINDINGS
2.1. Household System
2.1.1. Family Size
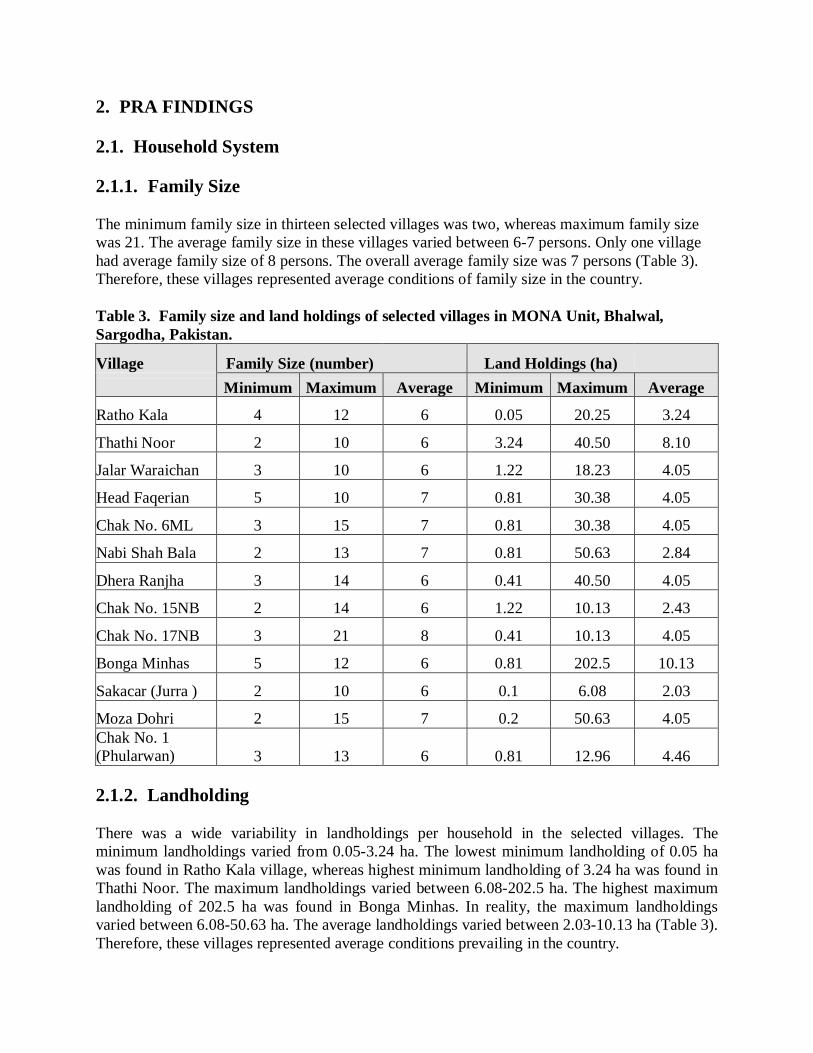
The minimum family size in thirteen selected villages was two, whereas maximum family sizewas 21. The average family size in these villages varied between 6-7 persons. Only one villagehad average family size of 8 persons. The overall average family size was 7 persons (Table 3).Therefore, these villages represented average conditions of family size in the country.
Table 3. Family size and land holdings of selected villages in MONA Unit, Bhalwal,Sargodha, Pakistan.
Village Family Size (number) Land Holdings (ha)Minimum Maximum Average Minimum Maximum Average
Ratho Kala 4 12 6 0.05 20.25 3.24
Thathi Noor 2 10 6 3.24 40.50 8.10
Jalar Waraichan 3 10 6 1.22 18.23 4.05
Head Faqerian 5 10 7 0.81 30.38 4.05
Chak No. 6ML 3 15 7 0.81 30.38 4.05
Nabi Shah Bala 2 13 7 0.81 50.63 2.84
Dhera Ranjha 3 14 6 0.41 40.50 4.05
Chak No. 15NB 2 14 6 1.22 10.13 2.43
Chak No. 17NB 3 21 8 0.41 10.13 4.05
Bonga Minhas 5 12 6 0.81 202.5 10.13
Sakacar (Jurra ) 2 10 6 0.1 6.08 2.03
Moza Dohri 2 15 7 0.2 50.63 4.05Chak No. 1(Phularwan) 3 13 6 0.81 12.96 4.46
2.1.2. Landholding
There was a wide variability in landholdings per household in the selected villages. Theminimum landholdings varied from 0.05-3.24 ha. The lowest minimum landholding of 0.05 hawas found in Ratho Kala village, whereas highest minimum landholding of 3.24 ha was found inThathi Noor. The maximum landholdings varied between 6.08-202.5 ha. The highest maximumlandholding of 202.5 ha was found in Bonga Minhas. In reality, the maximum landholdingsvaried between 6.08-50.63 ha. The average landholdings varied between 2.03-10.13 ha (Table 3).Therefore, these villages represented average conditions prevailing in the country.
2.1.3. Livestock
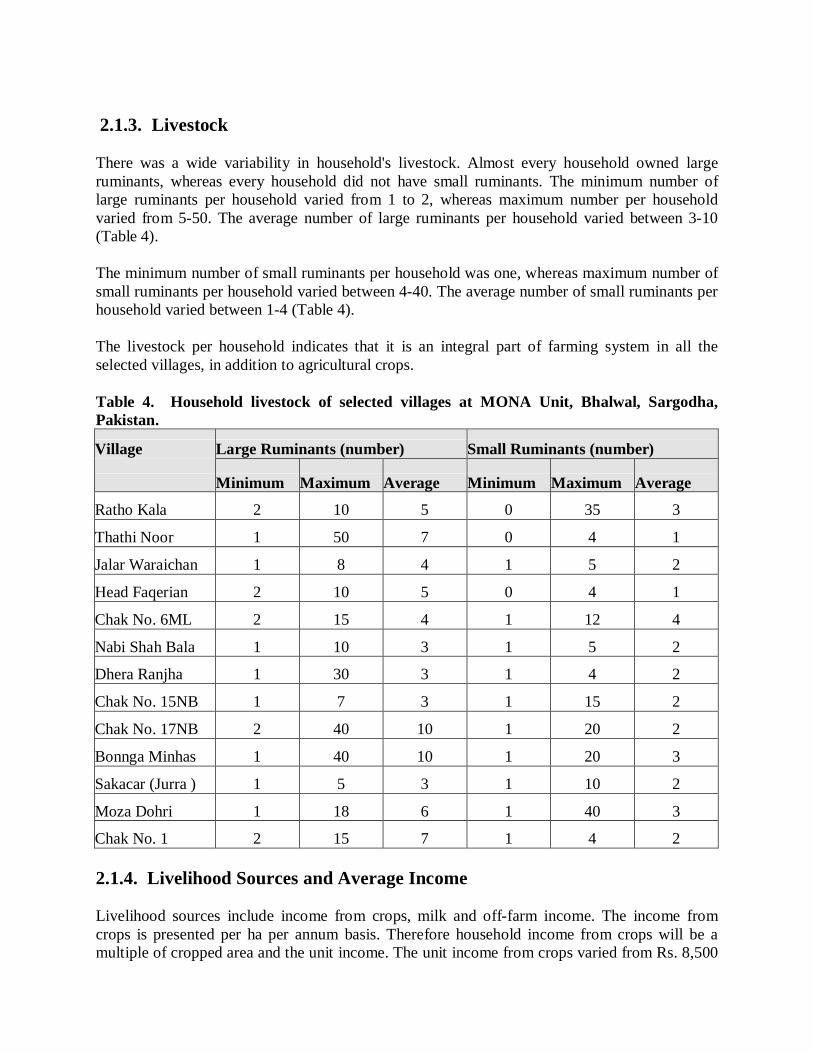
There was a wide variability in household's livestock. Almost every household owned largeruminants, whereas every household did not have small ruminants. The minimum number oflarge ruminants per household varied from 1 to 2, whereas maximum number per householdvaried from 5-50. The average number of large ruminants per household varied between 3-10(Table 4).
The minimum number of small ruminants per household was one, whereas maximum number ofsmall ruminants per household varied between 4-40. The average number of small ruminants perhousehold varied between 1-4 (Table 4).
The livestock per household indicates that it is an integral part of farming system in all theselected villages, in addition to agricultural crops.
Table 4. Household livestock of selected villages at MONA Unit, Bhalwal, Sargodha,Pakistan.
Village Large Ruminants (number) Small Ruminants (number)
Minimum Maximum Average Minimum Maximum Average
Ratho Kala 2 10 5 0 35 3
Thathi Noor 1 50 7 0 4 1
Jalar Waraichan 1 8 4 1 5 2
Head Faqerian 2 10 5 0 4 1
Chak No. 6ML 2 15 4 1 12 4
Nabi Shah Bala 1 10 3 1 5 2
Dhera Ranjha 1 30 3 1 4 2
Chak No. 15NB 1 7 3 1 15 2
Chak No. 17NB 2 40 10 1 20 2
Bonnga Minhas 1 40 10 1 20 3
Sakacar (Jurra ) 1 5 3 1 10 2
Moza Dohri 1 18 6 1 40 3
Chak No. 1 2 15 7 1 4 2
2.1.4. Livelihood Sources and Average Income
Livelihood sources include income from crops, milk and off-farm income. The income fromcrops is presented per ha per annum basis. Therefore household income from crops will be amultiple of cropped area and the unit income. The unit income from crops varied from Rs. 8,500
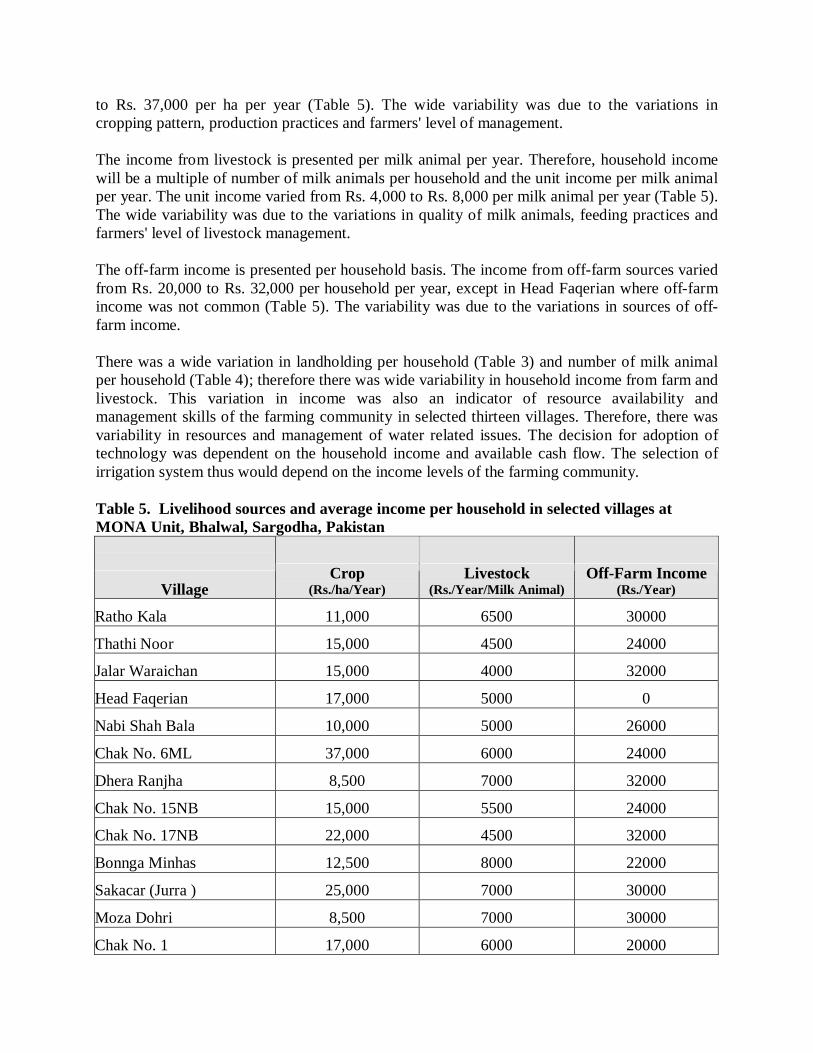
to Rs. 37,000 per ha per year (Table 5). The wide variability was due to the variations incropping pattern, production practices and farmers' level of management.
The income from livestock is presented per milk animal per year. Therefore, household incomewill be a multiple of number of milk animals per household and the unit income per milk animalper year. The unit income varied from Rs. 4,000 to Rs. 8,000 per milk animal per year (Table 5).The wide variability was due to the variations in quality of milk animals, feeding practices andfarmers' level of livestock management.
The off-farm income is presented per household basis. The income from off-farm sources variedfrom Rs. 20,000 to Rs. 32,000 per household per year, except in Head Faqerian where off-farmincome was not common (Table 5). The variability was due to the variations in sources of off-farm income.
There was a wide variation in landholding per household (Table 3) and number of milk animalper household (Table 4); therefore there was wide variability in household income from farm andlivestock. This variation in income was also an indicator of resource availability andmanagement skills of the farming community in selected thirteen villages. Therefore, there wasvariability in resources and management of water related issues. The decision for adoption oftechnology was dependent on the household income and available cash flow. The selection ofirrigation system thus would depend on the income levels of the farming community.
Table 5. Livelihood sources and average income per household in selected villages atMONA Unit, Bhalwal, Sargodha, Pakistan
VillageCrop
(Rs./ha/Year)Livestock
(Rs./Year/Milk Animal)Off-Farm Income
(Rs./Year)
Ratho Kala 11,000 6500 30000
Thathi Noor 15,000 4500 24000
Jalar Waraichan 15,000 4000 32000
Head Faqerian 17,000 5000 0
Nabi Shah Bala 10,000 5000 26000
Chak No. 6ML 37,000 6000 24000
Dhera Ranjha 8,500 7000 32000
Chak No. 15NB 15,000 5500 24000
Chak No. 17NB 22,000 4500 32000
Bonnga Minhas 12,500 8000 22000
Sakacar (Jurra ) 25,000 7000 30000
Moza Dohri 8,500 7000 30000
Chak No. 1 17,000 6000 20000
2.1.5. Education
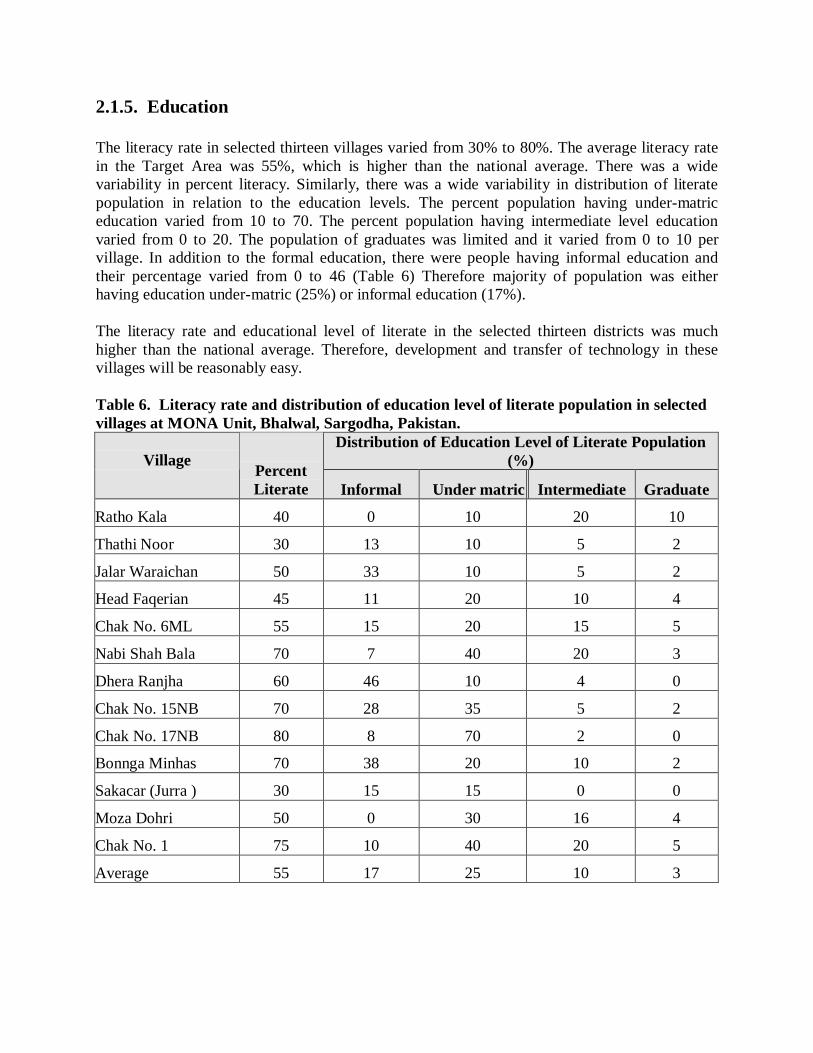
The literacy rate in selected thirteen villages varied from 30% to 80%. The average literacy ratein the Target Area was 55%, which is higher than the national average. There was a widevariability in percent literacy. Similarly, there was a wide variability in distribution of literatepopulation in relation to the education levels. The percent population having under-matriceducation varied from 10 to 70. The percent population having intermediate level educationvaried from 0 to 20. The population of graduates was limited and it varied from 0 to 10 pervillage. In addition to the formal education, there were people having informal education andtheir percentage varied from 0 to 46 (Table 6) Therefore majority of population was eitherhaving education under-matric (25%) or informal education (17%).
The literacy rate and educational level of literate in the selected thirteen districts was muchhigher than the national average. Therefore, development and transfer of technology in thesevillages will be reasonably easy.
Table 6. Literacy rate and distribution of education level of literate population in selectedvillages at MONA Unit, Bhalwal, Sargodha, Pakistan.
VillageDistribution of Education Level of Literate Population
(%)PercentLiterate Informal Under matric Intermediate Graduate
Ratho Kala 40 0 10 20 10
Thathi Noor 30 13 10 5 2
Jalar Waraichan 50 33 10 5 2
Head Faqerian 45 11 20 10 4
Chak No. 6ML 55 15 20 15 5
Nabi Shah Bala 70 7 40 20 3
Dhera Ranjha 60 46 10 4 0
Chak No. 15NB 70 28 35 5 2
Chak No. 17NB 80 8 70 2 0
Bonnga Minhas 70 38 20 10 2
Sakacar (Jurra ) 30 15 15 0 0
Moza Dohri 50 0 30 16 4
Chak No. 1 75 10 40 20 5
Average 55 17 25 10 3
2.2. Resource Availability and Use
2.2.1. Number of Households
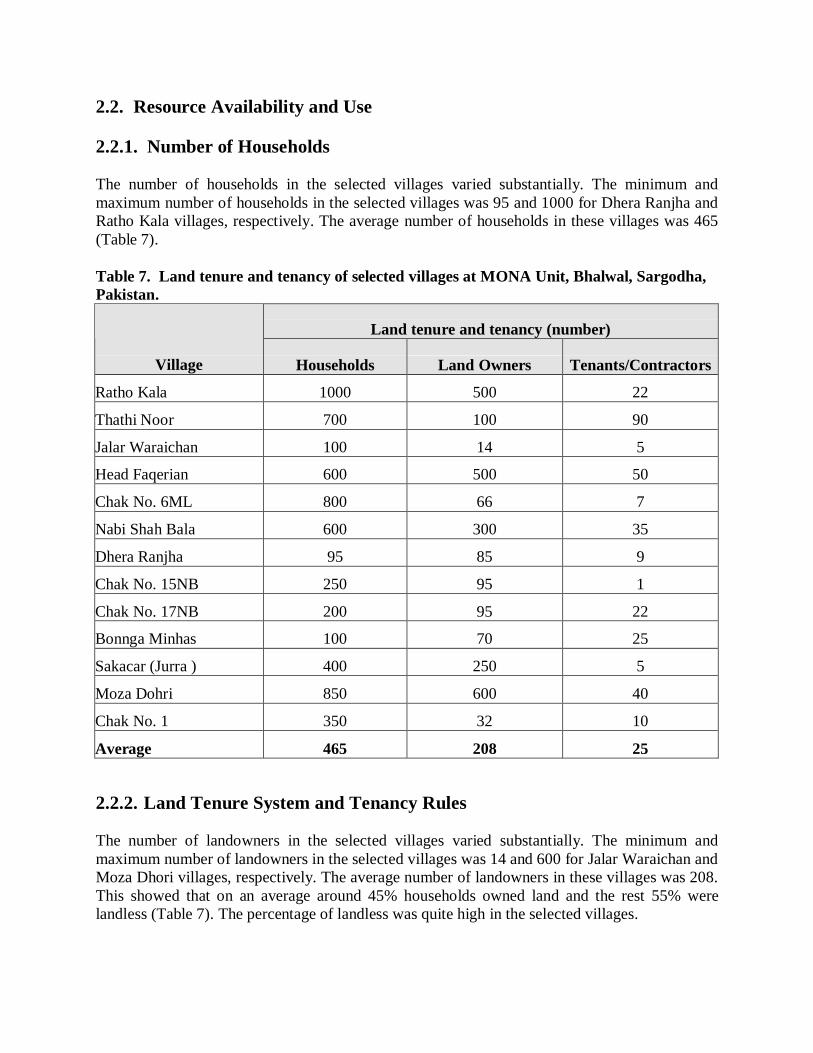
The number of households in the selected villages varied substantially. The minimum andmaximum number of households in the selected villages was 95 and 1000 for Dhera Ranjha andRatho Kala villages, respectively. The average number of households in these villages was 465(Table 7).
Table 7. Land tenure and tenancy of selected villages at MONA Unit, Bhalwal, Sargodha,Pakistan.
Land tenure and tenancy (number)
Village Households Land Owners Tenants/Contractors
Ratho Kala 1000 500 22
Thathi Noor 700 100 90
Jalar Waraichan 100 14 5
Head Faqerian 600 500 50
Chak No. 6ML 800 66 7
Nabi Shah Bala 600 300 35
Dhera Ranjha 95 85 9
Chak No. 15NB 250 95 1
Chak No. 17NB 200 95 22
Bonnga Minhas 100 70 25
Sakacar (Jurra ) 400 250 5
Moza Dohri 850 600 40
Chak No. 1 350 32 10
Average 465 208 25
2.2.2. Land Tenure System and Tenancy Rules
The number of landowners in the selected villages varied substantially. The minimum andmaximum number of landowners in the selected villages was 14 and 600 for Jalar Waraichan andMoza Dhori villages, respectively. The average number of landowners in these villages was 208.This showed that on an average around 45% households owned land and the rest 55% werelandless (Table 7). The percentage of landless was quite high in the selected villages.
Out of 55% of the landless households, around 10% were involved in farming as tenants. Thepercentage of landowners and tenants was thus 50% of the total households. Therefore, 50%households were involved in off-farm activities in earning their livelihood (Table 7). However,variability was high in different villages based on resources available to different households.
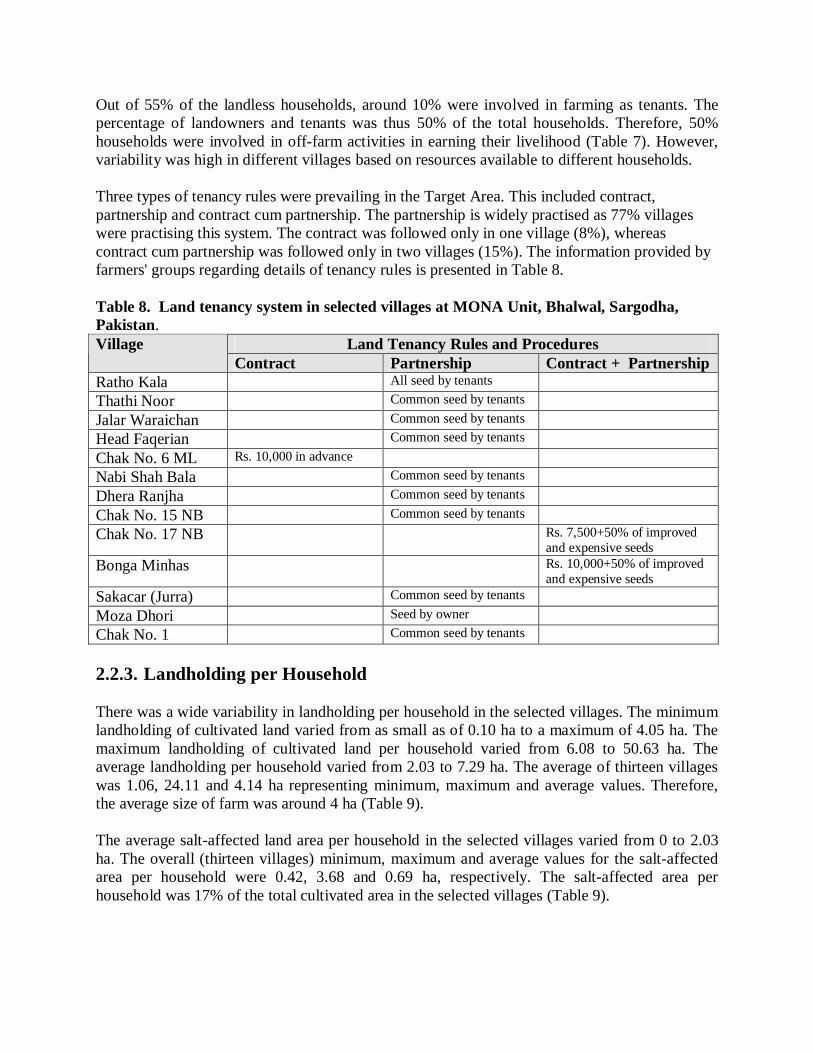
Three types of tenancy rules were prevailing in the Target Area. This included contract,partnership and contract cum partnership. The partnership is widely practised as 77% villageswere practising this system. The contract was followed only in one village (8%), whereascontract cum partnership was followed only in two villages (15%). The information provided byfarmers' groups regarding details of tenancy rules is presented in Table 8.
Table 8. Land tenancy system in selected villages at MONA Unit, Bhalwal, Sargodha,Pakistan.
Land Tenancy Rules and ProceduresVillageContract Partnership Contract + Partnership
Ratho Kala All seed by tenantsThathi Noor Common seed by tenantsJalar Waraichan Common seed by tenantsHead Faqerian Common seed by tenantsChak No. 6 ML Rs. 10,000 in advanceNabi Shah Bala Common seed by tenantsDhera Ranjha Common seed by tenantsChak No. 15 NB Common seed by tenantsChak No. 17 NB Rs. 7,500+50% of improved
and expensive seedsBonga Minhas Rs. 10,000+50% of improved
and expensive seedsSakacar (Jurra) Common seed by tenantsMoza Dhori Seed by ownerChak No. 1 Common seed by tenants
2.2.3. Landholding per Household
There was a wide variability in landholding per household in the selected villages. The minimumlandholding of cultivated land varied from as small as of 0.10 ha to a maximum of 4.05 ha. Themaximum landholding of cultivated land per household varied from 6.08 to 50.63 ha. Theaverage landholding per household varied from 2.03 to 7.29 ha. The average of thirteen villageswas 1.06, 24.11 and 4.14 ha representing minimum, maximum and average values. Therefore,the average size of farm was around 4 ha (Table 9).
The average salt-affected land area per household in the selected villages varied from 0 to 2.03ha. The overall (thirteen villages) minimum, maximum and average values for the salt-affectedarea per household were 0.42, 3.68 and 0.69 ha, respectively. The salt-affected area perhousehold was 17% of the total cultivated area in the selected villages (Table 9).
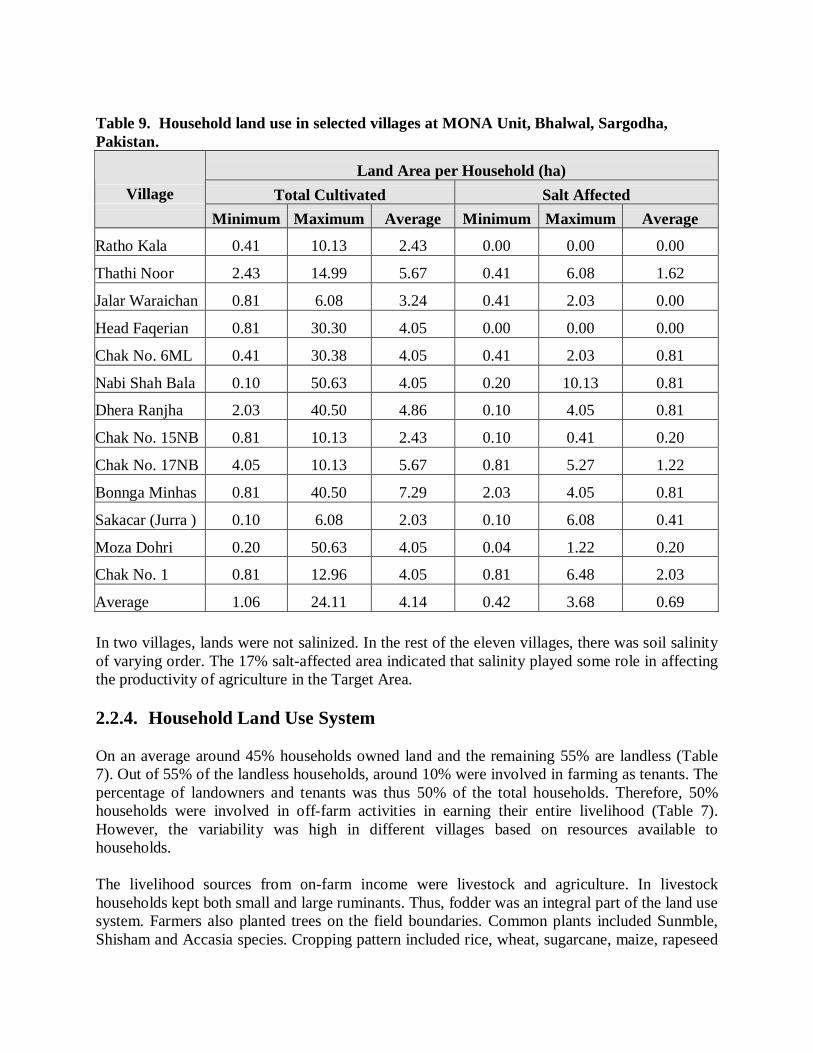
Table 9. Household land use in selected villages at MONA Unit, Bhalwal, Sargodha,Pakistan.
Land Area per Household (ha)Village Total Cultivated Salt Affected
Minimum Maximum Average Minimum Maximum Average
Ratho Kala 0.41 10.13 2.43 0.00 0.00 0.00
Thathi Noor 2.43 14.99 5.67 0.41 6.08 1.62
Jalar Waraichan 0.81 6.08 3.24 0.41 2.03 0.00
Head Faqerian 0.81 30.30 4.05 0.00 0.00 0.00
Chak No. 6ML 0.41 30.38 4.05 0.41 2.03 0.81
Nabi Shah Bala 0.10 50.63 4.05 0.20 10.13 0.81
Dhera Ranjha 2.03 40.50 4.86 0.10 4.05 0.81
Chak No. 15NB 0.81 10.13 2.43 0.10 0.41 0.20
Chak No. 17NB 4.05 10.13 5.67 0.81 5.27 1.22
Bonnga Minhas 0.81 40.50 7.29 2.03 4.05 0.81
Sakacar (Jurra ) 0.10 6.08 2.03 0.10 6.08 0.41
Moza Dohri 0.20 50.63 4.05 0.04 1.22 0.20
Chak No. 1 0.81 12.96 4.05 0.81 6.48 2.03
Average 1.06 24.11 4.14 0.42 3.68 0.69
In two villages, lands were not salinized. In the rest of the eleven villages, there was soil salinityof varying order. The 17% salt-affected area indicated that salinity played some role in affectingthe productivity of agriculture in the Target Area.
2.2.4. Household Land Use System
On an average around 45% households owned land and the remaining 55% are landless (Table7). Out of 55% of the landless households, around 10% were involved in farming as tenants. Thepercentage of landowners and tenants was thus 50% of the total households. Therefore, 50%households were involved in off-farm activities in earning their entire livelihood (Table 7).However, the variability was high in different villages based on resources available tohouseholds.
The livelihood sources from on-farm income were livestock and agriculture. In livestockhouseholds kept both small and large ruminants. Thus, fodder was an integral part of the land usesystem. Farmers also planted trees on the field boundaries. Common plants included Sunmble,Shisham and Accasia species. Cropping pattern included rice, wheat, sugarcane, maize, rapeseed
and mustard, etc. Citrus was also commonly grown as orchards. The land use system thus couldbe described as integration of crops, orchards and livestock.
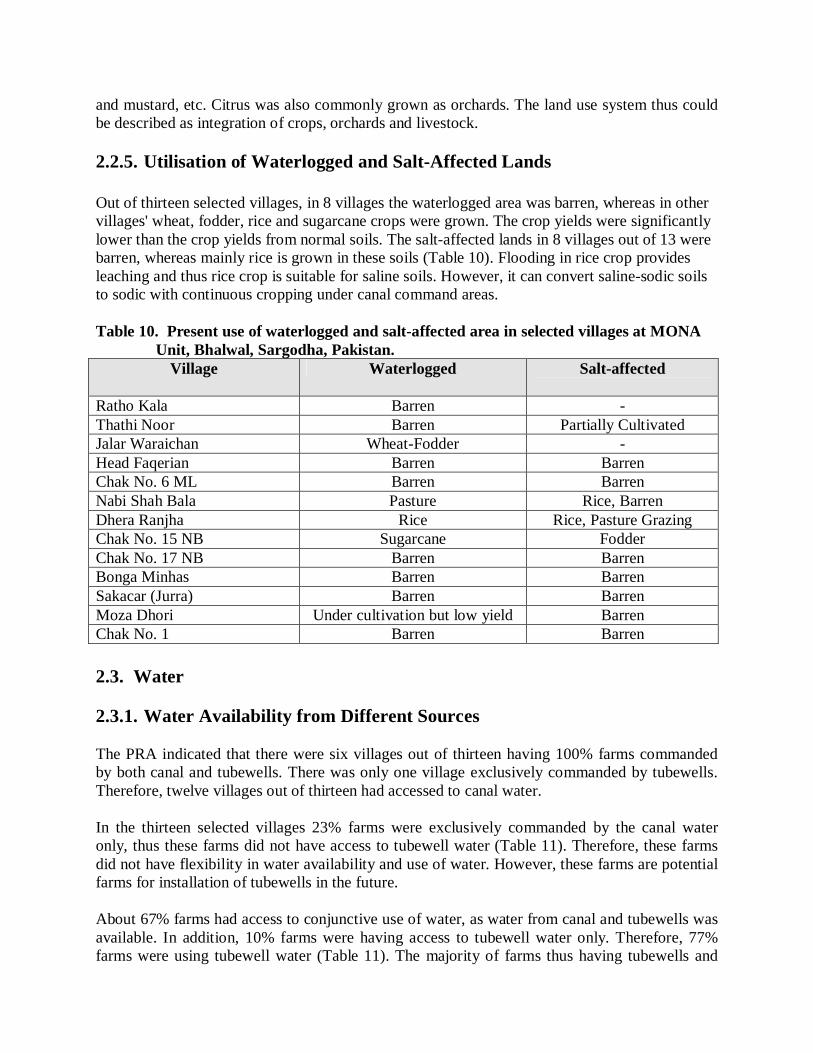
2.2.5. Utilisation of Waterlogged and Salt-Affected Lands
Out of thirteen selected villages, in 8 villages the waterlogged area was barren, whereas in othervillages' wheat, fodder, rice and sugarcane crops were grown. The crop yields were significantlylower than the crop yields from normal soils. The salt-affected lands in 8 villages out of 13 werebarren, whereas mainly rice is grown in these soils (Table 10). Flooding in rice crop providesleaching and thus rice crop is suitable for saline soils. However, it can convert saline-sodic soilsto sodic with continuous cropping under canal command areas.
Table 10. Present use of waterlogged and salt-affected area in selected villages at MONAUnit, Bhalwal, Sargodha, Pakistan.
Village Waterlogged Salt-affected
Ratho Kala Barren -Thathi Noor Barren Partially CultivatedJalar Waraichan Wheat-Fodder -Head Faqerian Barren BarrenChak No. 6 ML Barren BarrenNabi Shah Bala Pasture Rice, BarrenDhera Ranjha Rice Rice, Pasture GrazingChak No. 15 NB Sugarcane FodderChak No. 17 NB Barren BarrenBonga Minhas Barren BarrenSakacar (Jurra) Barren BarrenMoza Dhori Under cultivation but low yield BarrenChak No. 1 Barren Barren
2.3. Water
2.3.1. Water Availability from Different Sources
The PRA indicated that there were six villages out of thirteen having 100% farms commandedby both canal and tubewells. There was only one village exclusively commanded by tubewells.Therefore, twelve villages out of thirteen had accessed to canal water.
In the thirteen selected villages 23% farms were exclusively commanded by the canal wateronly, thus these farms did not have access to tubewell water (Table 11). Therefore, these farmsdid not have flexibility in water availability and use of water. However, these farms are potentialfarms for installation of tubewells in the future.
About 67% farms had access to conjunctive use of water, as water from canal and tubewells wasavailable. In addition, 10% farms were having access to tubewell water only. Therefore, 77%farms were using tubewell water (Table 11). The majority of farms thus having tubewells and
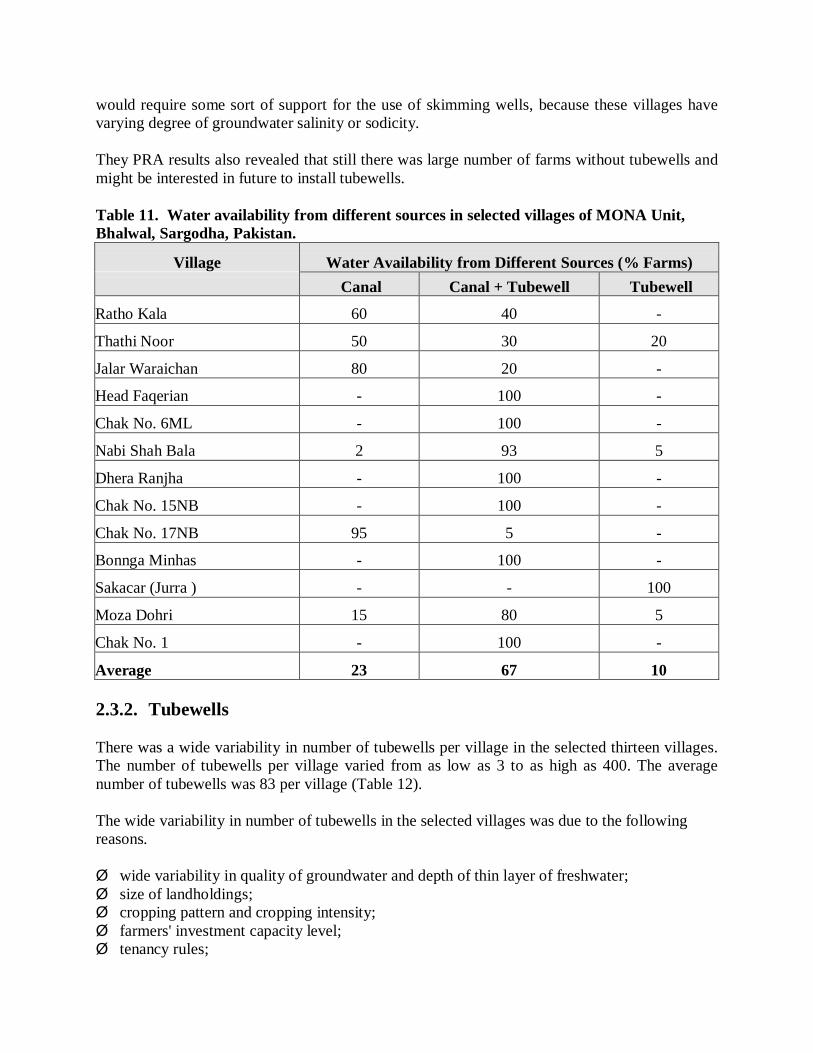
would require some sort of support for the use of skimming wells, because these villages havevarying degree of groundwater salinity or sodicity.
They PRA results also revealed that still there was large number of farms without tubewells andmight be interested in future to install tubewells.
Table 11. Water availability from different sources in selected villages of MONA Unit,Bhalwal, Sargodha, Pakistan.
Village Water Availability from Different Sources (% Farms) Canal Canal + Tubewell Tubewell
Ratho Kala 60 40 -
Thathi Noor 50 30 20
Jalar Waraichan 80 20 -
Head Faqerian - 100 -
Chak No. 6ML - 100 -
Nabi Shah Bala 2 93 5
Dhera Ranjha - 100 -
Chak No. 15NB - 100 -
Chak No. 17NB 95 5 -
Bonnga Minhas - 100 -
Sakacar (Jurra ) - - 100
Moza Dohri 15 80 5
Chak No. 1 - 100 -
Average 23 67 10
2.3.2. Tubewells
There was a wide variability in number of tubewells per village in the selected thirteen villages.The number of tubewells per village varied from as low as 3 to as high as 400. The averagenumber of tubewells was 83 per village (Table 12).
The wide variability in number of tubewells in the selected villages was due to the followingreasons.
Ø wide variability in quality of groundwater and depth of thin layer of freshwater;Ø size of landholdings;Ø cropping pattern and cropping intensity;Ø farmers' investment capacity level;Ø tenancy rules;
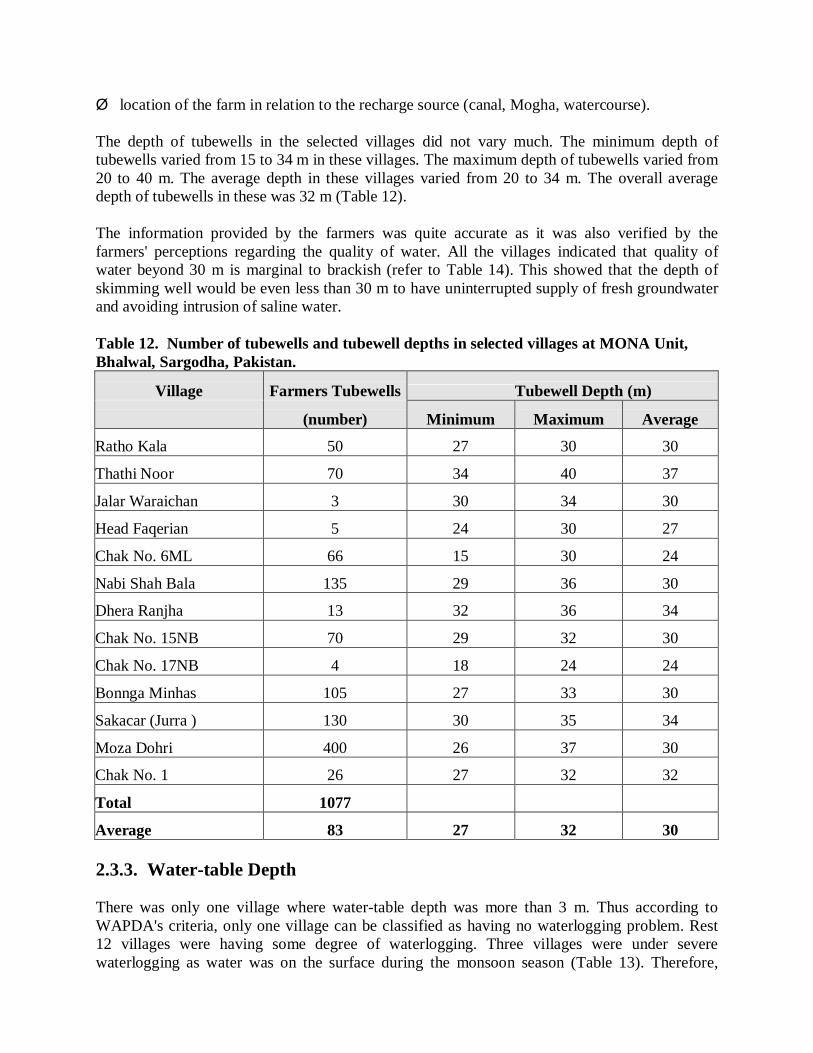
Ø location of the farm in relation to the recharge source (canal, Mogha, watercourse).
The depth of tubewells in the selected villages did not vary much. The minimum depth oftubewells varied from 15 to 34 m in these villages. The maximum depth of tubewells varied from20 to 40 m. The average depth in these villages varied from 20 to 34 m. The overall averagedepth of tubewells in these was 32 m (Table 12).
The information provided by the farmers was quite accurate as it was also verified by thefarmers' perceptions regarding the quality of water. All the villages indicated that quality ofwater beyond 30 m is marginal to brackish (refer to Table 14). This showed that the depth ofskimming well would be even less than 30 m to have uninterrupted supply of fresh groundwaterand avoiding intrusion of saline water.
Table 12. Number of tubewells and tubewell depths in selected villages at MONA Unit,Bhalwal, Sargodha, Pakistan.
Village Farmers Tubewells Tubewell Depth (m)
(number) Minimum Maximum Average
Ratho Kala 50 27 30 30
Thathi Noor 70 34 40 37
Jalar Waraichan 3 30 34 30
Head Faqerian 5 24 30 27
Chak No. 6ML 66 15 30 24
Nabi Shah Bala 135 29 36 30
Dhera Ranjha 13 32 36 34
Chak No. 15NB 70 29 32 30
Chak No. 17NB 4 18 24 24
Bonnga Minhas 105 27 33 30
Sakacar (Jurra ) 130 30 35 34
Moza Dohri 400 26 37 30
Chak No. 1 26 27 32 32
Total 1077
Average 83 27 32 30
2.3.3. Water-table Depth
There was only one village where water-table depth was more than 3 m. Thus according toWAPDA's criteria, only one village can be classified as having no waterlogging problem. Rest12 villages were having some degree of waterlogging. Three villages were under severewaterlogging as water was on the surface during the monsoon season (Table 13). Therefore,
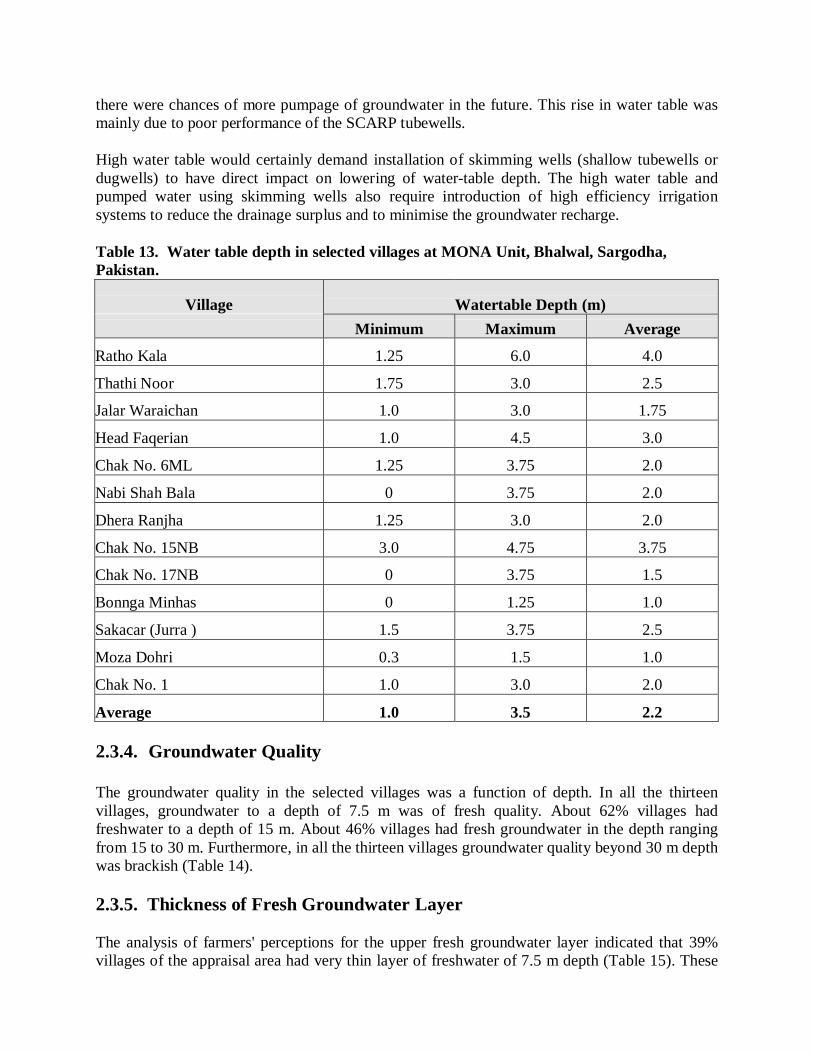
there were chances of more pumpage of groundwater in the future. This rise in water table wasmainly due to poor performance of the SCARP tubewells.
High water table would certainly demand installation of skimming wells (shallow tubewells ordugwells) to have direct impact on lowering of water-table depth. The high water table andpumped water using skimming wells also require introduction of high efficiency irrigationsystems to reduce the drainage surplus and to minimise the groundwater recharge.
Table 13. Water table depth in selected villages at MONA Unit, Bhalwal, Sargodha,Pakistan.
Village Watertable Depth (m)Minimum Maximum Average
Ratho Kala 1.25 6.0 4.0
Thathi Noor 1.75 3.0 2.5
Jalar Waraichan 1.0 3.0 1.75
Head Faqerian 1.0 4.5 3.0
Chak No. 6ML 1.25 3.75 2.0
Nabi Shah Bala 0 3.75 2.0
Dhera Ranjha 1.25 3.0 2.0
Chak No. 15NB 3.0 4.75 3.75
Chak No. 17NB 0 3.75 1.5
Bonnga Minhas 0 1.25 1.0
Sakacar (Jurra ) 1.5 3.75 2.5
Moza Dohri 0.3 1.5 1.0
Chak No. 1 1.0 3.0 2.0
Average 1.0 3.5 2.2
2.3.4. Groundwater Quality
The groundwater quality in the selected villages was a function of depth. In all the thirteenvillages, groundwater to a depth of 7.5 m was of fresh quality. About 62% villages hadfreshwater to a depth of 15 m. About 46% villages had fresh groundwater in the depth rangingfrom 15 to 30 m. Furthermore, in all the thirteen villages groundwater quality beyond 30 m depthwas brackish (Table 14).
2.3.5. Thickness of Fresh Groundwater Layer
The analysis of farmers' perceptions for the upper fresh groundwater layer indicated that 39%villages of the appraisal area had very thin layer of freshwater of 7.5 m depth (Table 15). These
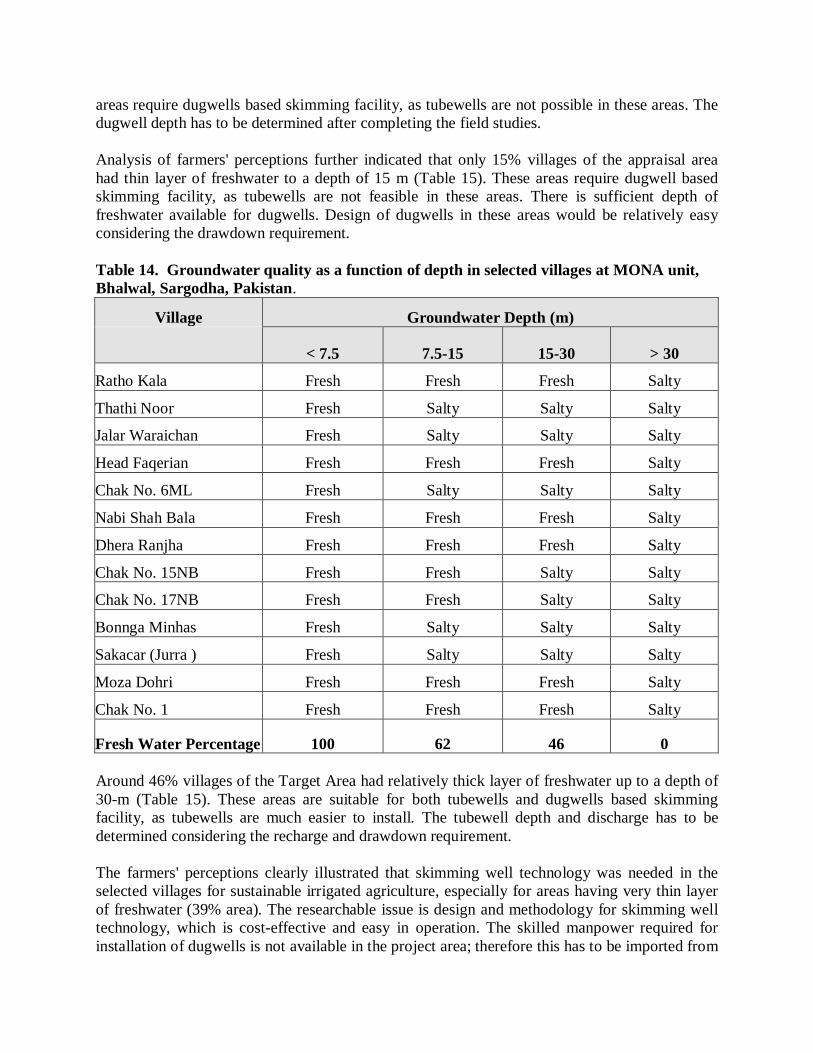
areas require dugwells based skimming facility, as tubewells are not possible in these areas. Thedugwell depth has to be determined after completing the field studies.
Analysis of farmers' perceptions further indicated that only 15% villages of the appraisal areahad thin layer of freshwater to a depth of 15 m (Table 15). These areas require dugwell basedskimming facility, as tubewells are not feasible in these areas. There is sufficient depth offreshwater available for dugwells. Design of dugwells in these areas would be relatively easyconsidering the drawdown requirement.
Table 14. Groundwater quality as a function of depth in selected villages at MONA unit,Bhalwal, Sargodha, Pakistan.
Village Groundwater Depth (m)
< 7.5 7.5-15 15-30 > 30
Ratho Kala Fresh Fresh Fresh Salty
Thathi Noor Fresh Salty Salty Salty
Jalar Waraichan Fresh Salty Salty Salty
Head Faqerian Fresh Fresh Fresh Salty
Chak No. 6ML Fresh Salty Salty Salty
Nabi Shah Bala Fresh Fresh Fresh Salty
Dhera Ranjha Fresh Fresh Fresh Salty
Chak No. 15NB Fresh Fresh Salty Salty
Chak No. 17NB Fresh Fresh Salty Salty
Bonnga Minhas Fresh Salty Salty Salty
Sakacar (Jurra ) Fresh Salty Salty Salty
Moza Dohri Fresh Fresh Fresh Salty
Chak No. 1 Fresh Fresh Fresh Salty
Fresh Water Percentage 100 62 46 0
Around 46% villages of the Target Area had relatively thick layer of freshwater up to a depth of30-m (Table 15). These areas are suitable for both tubewells and dugwells based skimmingfacility, as tubewells are much easier to install. The tubewell depth and discharge has to bedetermined considering the recharge and drawdown requirement.
The farmers' perceptions clearly illustrated that skimming well technology was needed in theselected villages for sustainable irrigated agriculture, especially for areas having very thin layerof freshwater (39% area). The researchable issue is design and methodology for skimming welltechnology, which is cost-effective and easy in operation. The skilled manpower required forinstallation of dugwells is not available in the project area; therefore this has to be imported from
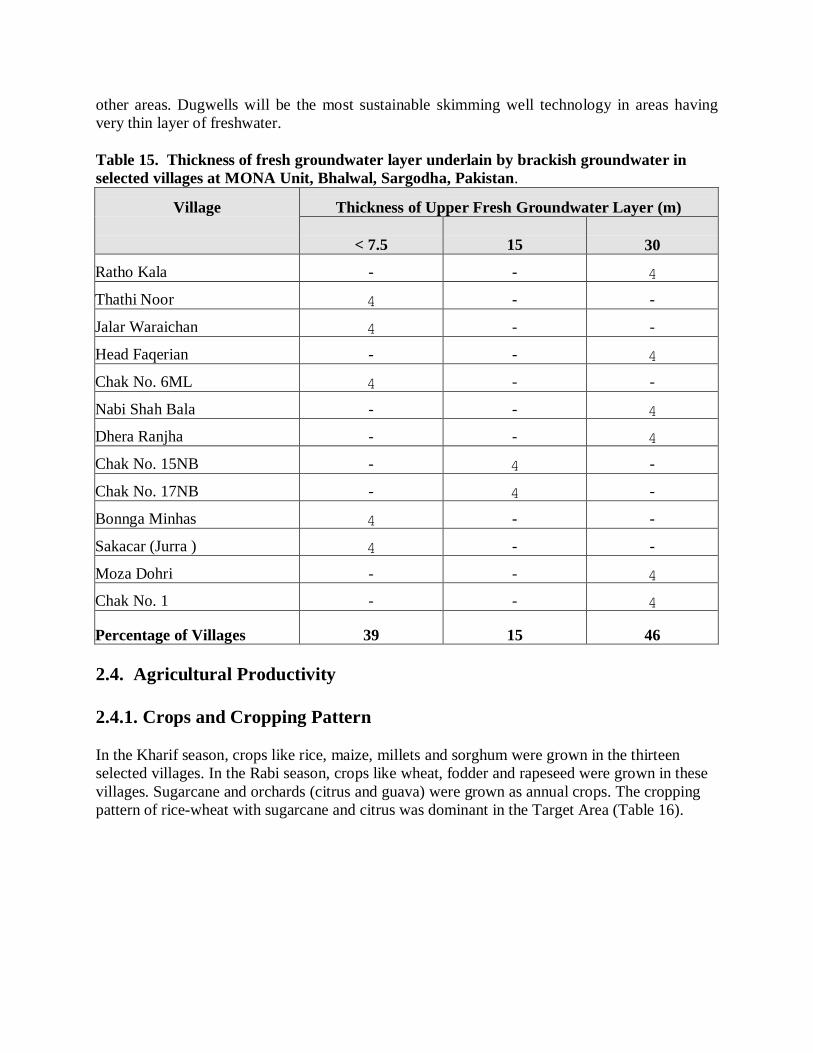
other areas. Dugwells will be the most sustainable skimming well technology in areas havingvery thin layer of freshwater.
Table 15. Thickness of fresh groundwater layer underlain by brackish groundwater inselected villages at MONA Unit, Bhalwal, Sargodha, Pakistan.
Village Thickness of Upper Fresh Groundwater Layer (m)
< 7.5 15 30
Ratho Kala - - 4
Thathi Noor 4 - -
Jalar Waraichan 4 - -
Head Faqerian - - 4
Chak No. 6ML 4 - -
Nabi Shah Bala - - 4
Dhera Ranjha - - 4
Chak No. 15NB - 4 -
Chak No. 17NB - 4 -
Bonnga Minhas 4 - -
Sakacar (Jurra ) 4 - -
Moza Dohri - - 4
Chak No. 1 - - 4
Percentage of Villages 39 15 46
2.4. Agricultural Productivity
2.4.1. Crops and Cropping Pattern
In the Kharif season, crops like rice, maize, millets and sorghum were grown in the thirteenselected villages. In the Rabi season, crops like wheat, fodder and rapeseed were grown in thesevillages. Sugarcane and orchards (citrus and guava) were grown as annual crops. The croppingpattern of rice-wheat with sugarcane and citrus was dominant in the Target Area (Table 16).
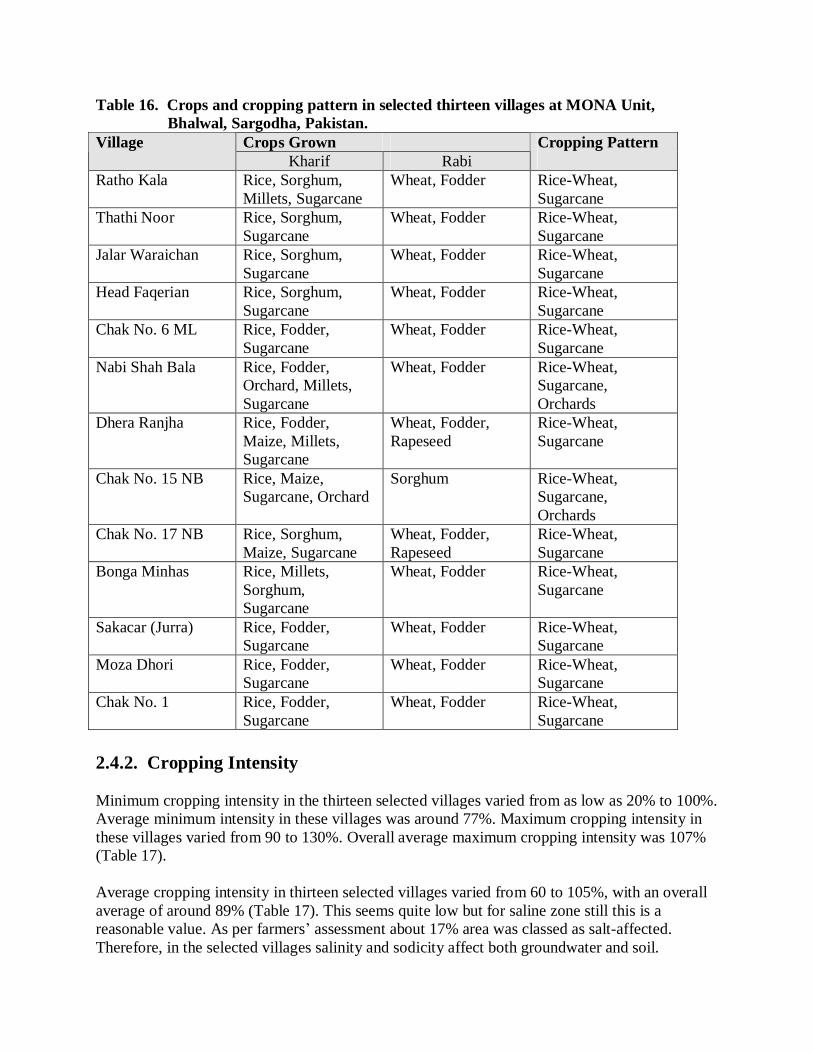
Table 16. Crops and cropping pattern in selected thirteen villages at MONA Unit,Bhalwal, Sargodha, Pakistan.
Crops GrownVillageKharif Rabi
Cropping Pattern
Ratho Kala Rice, Sorghum,Millets, Sugarcane
Wheat, Fodder Rice-Wheat,Sugarcane
Thathi Noor Rice, Sorghum,Sugarcane
Wheat, Fodder Rice-Wheat,Sugarcane
Jalar Waraichan Rice, Sorghum,Sugarcane
Wheat, Fodder Rice-Wheat,Sugarcane
Head Faqerian Rice, Sorghum,Sugarcane
Wheat, Fodder Rice-Wheat,Sugarcane
Chak No. 6 ML Rice, Fodder,Sugarcane
Wheat, Fodder Rice-Wheat,Sugarcane
Nabi Shah Bala Rice, Fodder,Orchard, Millets,Sugarcane
Wheat, Fodder Rice-Wheat,Sugarcane,Orchards
Dhera Ranjha Rice, Fodder,Maize, Millets,Sugarcane
Wheat, Fodder,Rapeseed
Rice-Wheat,Sugarcane
Chak No. 15 NB Rice, Maize,Sugarcane, Orchard
Sorghum Rice-Wheat,Sugarcane,Orchards
Chak No. 17 NB Rice, Sorghum,Maize, Sugarcane
Wheat, Fodder,Rapeseed
Rice-Wheat,Sugarcane
Bonga Minhas Rice, Millets,Sorghum,Sugarcane
Wheat, Fodder Rice-Wheat,Sugarcane
Sakacar (Jurra) Rice, Fodder,Sugarcane
Wheat, Fodder Rice-Wheat,Sugarcane
Moza Dhori Rice, Fodder,Sugarcane
Wheat, Fodder Rice-Wheat,Sugarcane
Chak No. 1 Rice, Fodder,Sugarcane
Wheat, Fodder Rice-Wheat,Sugarcane
2.4.2. Cropping Intensity
Minimum cropping intensity in the thirteen selected villages varied from as low as 20% to 100%.Average minimum intensity in these villages was around 77%. Maximum cropping intensity inthese villages varied from 90 to 130%. Overall average maximum cropping intensity was 107%(Table 17).
Average cropping intensity in thirteen selected villages varied from 60 to 105%, with an overallaverage of around 89% (Table 17). This seems quite low but for saline zone still this is areasonable value. As per farmers assessment about 17% area was classed as salt-affected.Therefore, in the selected villages salinity and sodicity affect both groundwater and soil.
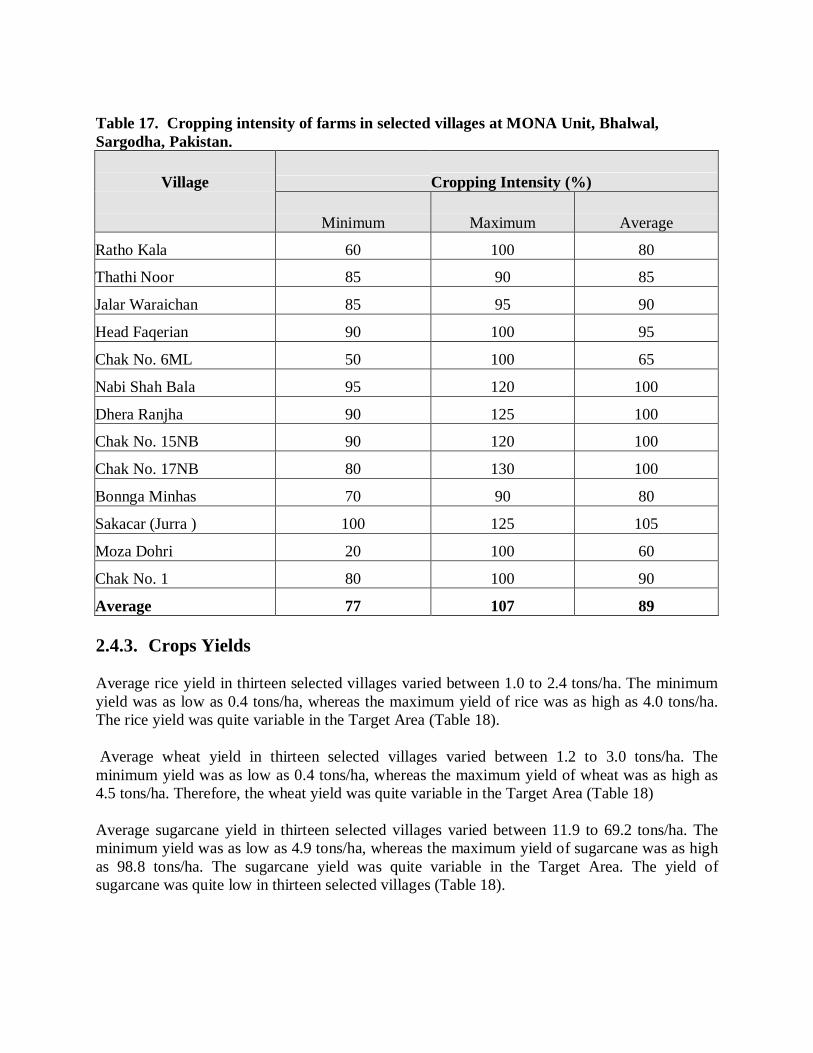
Table 17. Cropping intensity of farms in selected villages at MONA Unit, Bhalwal,Sargodha, Pakistan.
Village Cropping Intensity (%)
Minimum Maximum Average
Ratho Kala 60 100 80
Thathi Noor 85 90 85
Jalar Waraichan 85 95 90
Head Faqerian 90 100 95
Chak No. 6ML 50 100 65
Nabi Shah Bala 95 120 100
Dhera Ranjha 90 125 100
Chak No. 15NB 90 120 100
Chak No. 17NB 80 130 100
Bonnga Minhas 70 90 80
Sakacar (Jurra ) 100 125 105
Moza Dohri 20 100 60
Chak No. 1 80 100 90
Average 77 107 89
2.4.3. Crops Yields
Average rice yield in thirteen selected villages varied between 1.0 to 2.4 tons/ha. The minimumyield was as low as 0.4 tons/ha, whereas the maximum yield of rice was as high as 4.0 tons/ha.The rice yield was quite variable in the Target Area (Table 18).
Average wheat yield in thirteen selected villages varied between 1.2 to 3.0 tons/ha. Theminimum yield was as low as 0.4 tons/ha, whereas the maximum yield of wheat was as high as4.5 tons/ha. Therefore, the wheat yield was quite variable in the Target Area (Table 18)
Average sugarcane yield in thirteen selected villages varied between 11.9 to 69.2 tons/ha. Theminimum yield was as low as 4.9 tons/ha, whereas the maximum yield of sugarcane was as highas 98.8 tons/ha. The sugarcane yield was quite variable in the Target Area. The yield ofsugarcane was quite low in thirteen selected villages (Table 18).
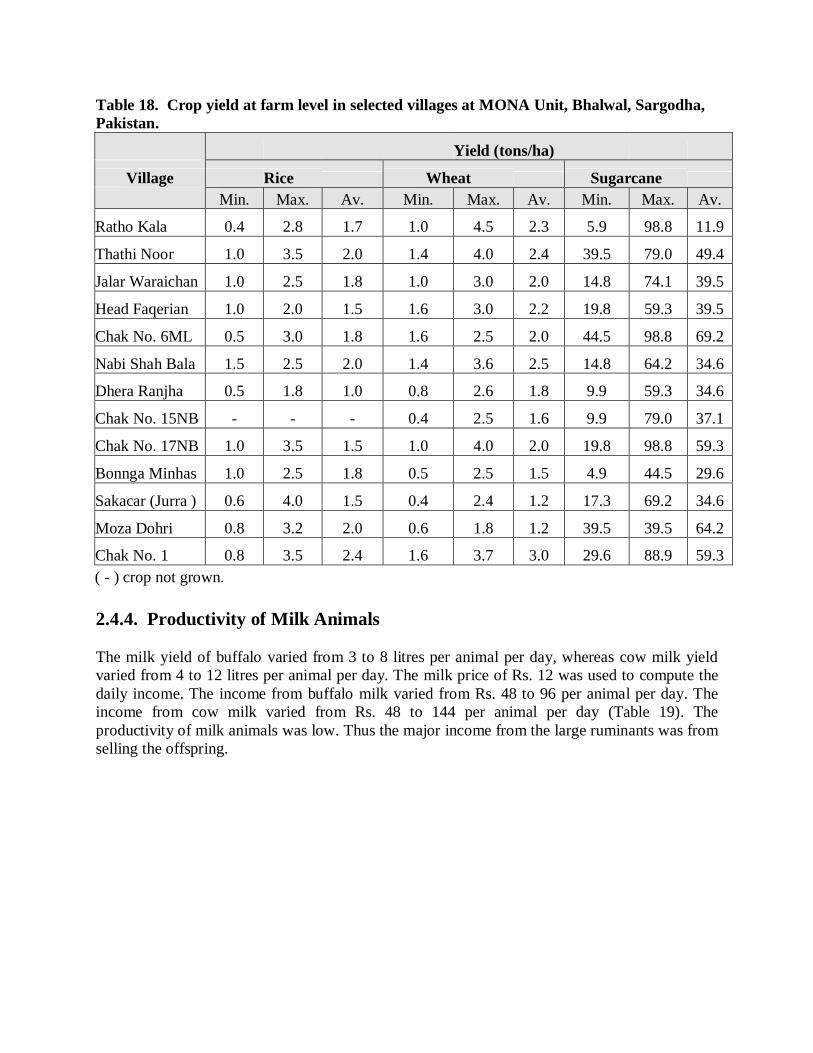
Table 18. Crop yield at farm level in selected villages at MONA Unit, Bhalwal, Sargodha,Pakistan.
Yield (tons/ha)
Village Rice Wheat SugarcaneMin. Max. Av. Min. Max. Av. Min. Max. Av.
Ratho Kala 0.4 2.8 1.7 1.0 4.5 2.3 5.9 98.8 11.9
Thathi Noor 1.0 3.5 2.0 1.4 4.0 2.4 39.5 79.0 49.4
Jalar Waraichan 1.0 2.5 1.8 1.0 3.0 2.0 14.8 74.1 39.5
Head Faqerian 1.0 2.0 1.5 1.6 3.0 2.2 19.8 59.3 39.5
Chak No. 6ML 0.5 3.0 1.8 1.6 2.5 2.0 44.5 98.8 69.2
Nabi Shah Bala 1.5 2.5 2.0 1.4 3.6 2.5 14.8 64.2 34.6
Dhera Ranjha 0.5 1.8 1.0 0.8 2.6 1.8 9.9 59.3 34.6
Chak No. 15NB - - - 0.4 2.5 1.6 9.9 79.0 37.1
Chak No. 17NB 1.0 3.5 1.5 1.0 4.0 2.0 19.8 98.8 59.3
Bonnga Minhas 1.0 2.5 1.8 0.5 2.5 1.5 4.9 44.5 29.6
Sakacar (Jurra ) 0.6 4.0 1.5 0.4 2.4 1.2 17.3 69.2 34.6
Moza Dohri 0.8 3.2 2.0 0.6 1.8 1.2 39.5 39.5 64.2
Chak No. 1 0.8 3.5 2.4 1.6 3.7 3.0 29.6 88.9 59.3( - ) crop not grown.
2.4.4. Productivity of Milk Animals
The milk yield of buffalo varied from 3 to 8 litres per animal per day, whereas cow milk yieldvaried from 4 to 12 litres per animal per day. The milk price of Rs. 12 was used to compute thedaily income. The income from buffalo milk varied from Rs. 48 to 96 per animal per day. Theincome from cow milk varied from Rs. 48 to 144 per animal per day (Table 19). Theproductivity of milk animals was low. Thus the major income from the large ruminants was fromselling the offspring.
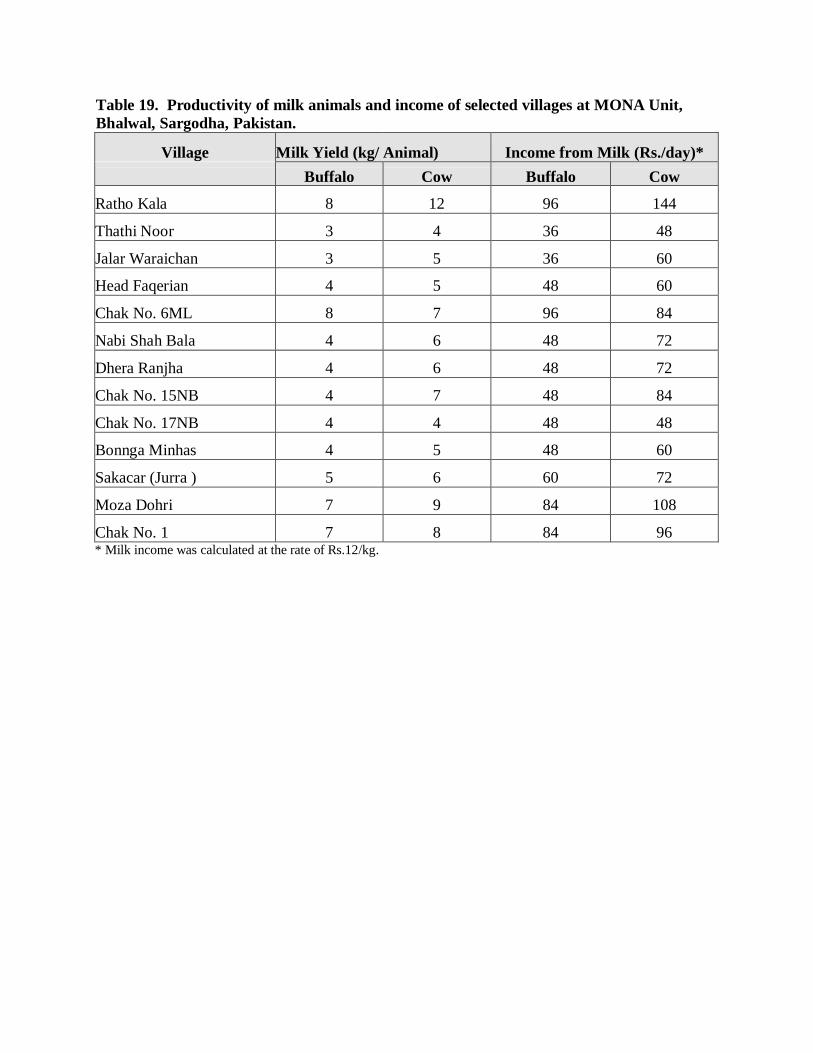
Table 19. Productivity of milk animals and income of selected villages at MONA Unit,Bhalwal, Sargodha, Pakistan.
Village Milk Yield (kg/ Animal) Income from Milk (Rs./day)*Buffalo Cow Buffalo Cow
Ratho Kala 8 12 96 144
Thathi Noor 3 4 36 48
Jalar Waraichan 3 5 36 60
Head Faqerian 4 5 48 60
Chak No. 6ML 8 7 96 84
Nabi Shah Bala 4 6 48 72
Dhera Ranjha 4 6 48 72
Chak No. 15NB 4 7 48 84
Chak No. 17NB 4 4 48 48
Bonnga Minhas 4 5 48 60
Sakacar (Jurra ) 5 6 60 72
Moza Dohri 7 9 84 108
Chak No. 1 7 8 84 96* Milk income was calculated at the rate of Rs.12/kg.
3. PRA DISCUSSIONS AND CONCLUSIONS
3.1. Problems and Constraints Assessment and Priority
3.1.1. Problems and Constraints
The farmers groups in selected thirteen villages of the Target Area identified thirteen problemsand constraints (Table 20). The problems and constraints as perceived by the farming communityare described as under:
1. Shortage of canal water supplies;2. Waterlogging and salinity;3. Non-availability and high price of seed, fertilisers and pesticides;4. Lack of credit availability;5. In-effective surface drainage and closure of SCARP tubewells;6. Limited availability and high cost of labour;7. Low output prices, insufficient support prices of commodities and delayed payment
especially from sugar factories;8. Water conveyance losses;9. In-appropriate Mogha size and location;10. Higher rates of diesel fuel;11. Unskilled tenants and other related issues;12. Non-availability of government subsidy; and13. Non-availability of services from input delivery and other service channels and insufficient
infrastructure.
The farmers' groups in different villages identified two to six problems and constraints related toagricultural productivity and production system. Maximum six problems were identified. Eachgroup was asked to rank the problems. The ranking of problems by different farmers groups canalso be presented for each village. As the objective of the PRA is to identify and select suitablelocations for the field research of skimming well and pressurised irrigation technology, thereforeranking of problems per village basis is not provided in this report. However, the percentage ofrespondents will help to describe weight of different problems and constraints.
The problems identified by the farmers' group of the selected thirteen villages cover wide range.The thirteen problems identified in total can be described in the following seven broad areas.
Ø Mogha size and location;Ø Water conveyance losses and canal water supplies;Ø Waterlogging and salinity;Ø Drainage and SCARP tubewells;Ø Input availability and high prices (seed, fertiliser, pesticides, diesel fuel, credit and labour);Ø Output prices (support price and payments), provision of services and subsidy;Ø Infrastructure
Some of these problem areas are not directly related to the project objectives. Therefore, thesehave to be further ranked considering the project objectives.
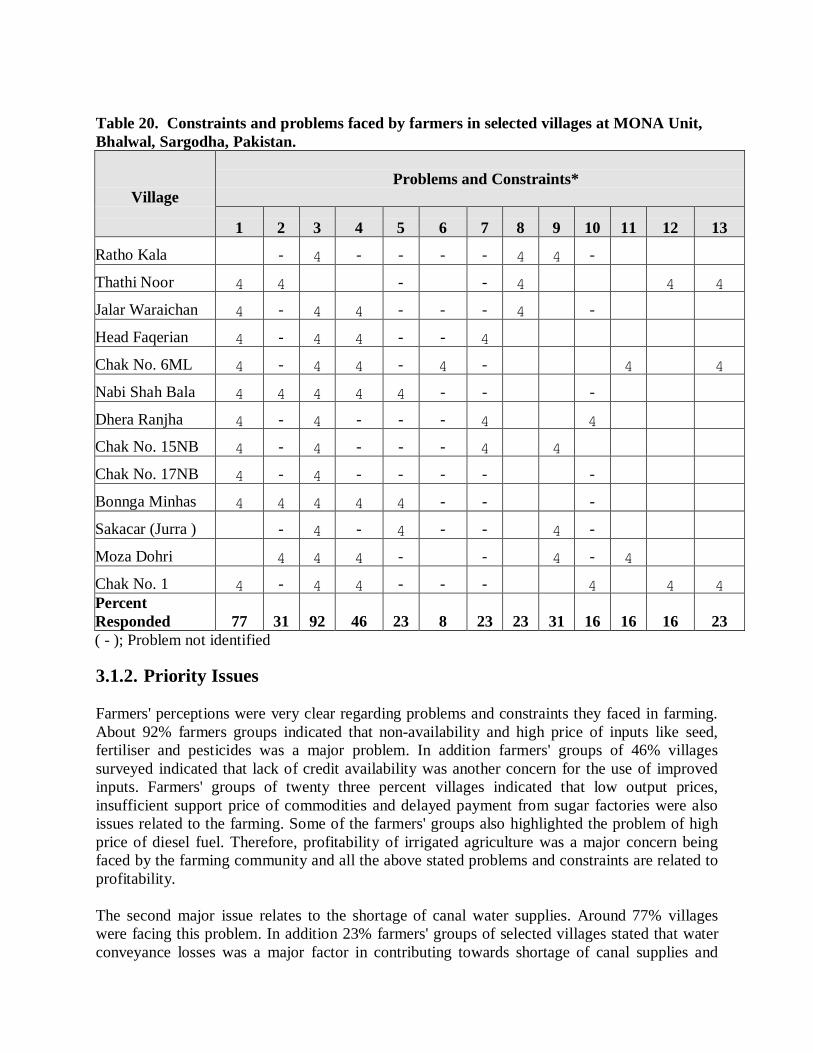
Table 20. Constraints and problems faced by farmers in selected villages at MONA Unit,Bhalwal, Sargodha, Pakistan.
VillageProblems and Constraints*
1 2 3 4 5 6 7 8 9 10 11 12 13
Ratho Kala - 4 - - - - 4 4 -
Thathi Noor 4 4 - - 4 4 4
Jalar Waraichan 4 - 4 4 - - - 4 -
Head Faqerian 4 - 4 4 - - 4
Chak No. 6ML 4 - 4 4 - 4 - 4 4
Nabi Shah Bala 4 4 4 4 4 - - -
Dhera Ranjha 4 - 4 - - - 4 4
Chak No. 15NB 4 - 4 - - - 4 4
Chak No. 17NB 4 - 4 - - - - -
Bonnga Minhas 4 4 4 4 4 - - -
Sakacar (Jurra ) - 4 - 4 - - 4 -
Moza Dohri 4 4 4 - - 4 - 4
Chak No. 1 4 - 4 4 - - - 4 4 4PercentResponded 77 31 92 46 23 8 23 23 31 16 16 16 23( - ); Problem not identified
3.1.2. Priority Issues
Farmers' perceptions were very clear regarding problems and constraints they faced in farming.About 92% farmers groups indicated that non-availability and high price of inputs like seed,fertiliser and pesticides was a major problem. In addition farmers' groups of 46% villagessurveyed indicated that lack of credit availability was another concern for the use of improvedinputs. Farmers' groups of twenty three percent villages indicated that low output prices,insufficient support price of commodities and delayed payment from sugar factories were alsoissues related to the farming. Some of the farmers' groups also highlighted the problem of highprice of diesel fuel. Therefore, profitability of irrigated agriculture was a major concern beingfaced by the farming community and all the above stated problems and constraints are related toprofitability.
The second major issue relates to the shortage of canal water supplies. Around 77% villageswere facing this problem. In addition 23% farmers' groups of selected villages stated that waterconveyance losses was a major factor in contributing towards shortage of canal supplies and
waterlogging. This is an indicator for the need of additional water supplies from tubewells tomeet crop water requirements. The appraisal also indicated that 10 and 67% villages aredependent on tubewells and tubewells plus canal water supplies, respectively. Therefore,tubewell irrigation is an essential element to have reliable and timely supply of water to meetpeak irrigation water requirement of crops. Normally, the canal supplies in the peak demandperiods of March and September are limited.
Farmers groups of around 31% villages of the surveyed area indicated that waterlogging andsalinity were concerns for agricultural productivity. This figure is very much in line with thenational average figure of saline and waterlogged area in the IBIS.
The three main issues faced by the community based on the participatory appraisal are stated asunder:
Ø Profitability of irrigated agriculture as the input prices were higher and farmers were notgetting right prices of their produce. The situation becomes critical when they have toface problem in availability of inputs and delayed payment of their marketable productsespecially the payment by the sugar mills.
Ø Shortage of canal water supplies and water conveyance losses resulted into reducedsurface water supplies at the farm level. Therefore, farmers were forced to usegroundwater for supplemental purposes. The use of poor quality groundwater furtheradded to the secondary salinization and sodification of soils. The cost of per m3 oftubewell water was almost twenty times of the canal water, thus it further adds towardhigh cost of production and reduced profitability.
Ø Waterlogging and salinity was a serious concern in certain areas, where productivity andprofitability of irrigated agriculture was being affected drastically.
The above mentioned three issues seem logical. The first issue is beyond the scope of the project.However, the project can address indirectly the other two issues. The analysis by farmers andtheir perceptions support the research hypothesis to develop technology for skimming freshgroundwater and efficient utilisation.
3.2. Potential Locations for Project Interventions
The villages were categorised based on the depth of thin layer of fresh groundwater overlain bythe brackish groundwater. Five villages out of thirteen included in the PRA study were foundslightly suitable for skimming dugwells (Table 21). However, the thickness of the layer offreshwater is less than 7.5 m. Therefore, design of dugwell should be based on the recharge tothe well and the drawdown pattern in a given location. These villages thus have low potential fordugwells and discharge has to be limited to avoid intrusion of poor quality groundwater.
Two villages out of thirteen included in the PRA study were found highly suitable for skimmingdugwells (Table 21). The thickness of the layer of freshwater is less than 15 m. Therefore, designof dugwell should be based on the recharge to the well based on the drawdown pattern in a givenlocation. These villages thus have high potential for dugwells and discharge has to be limited toavoid intrusion of poor quality groundwater.
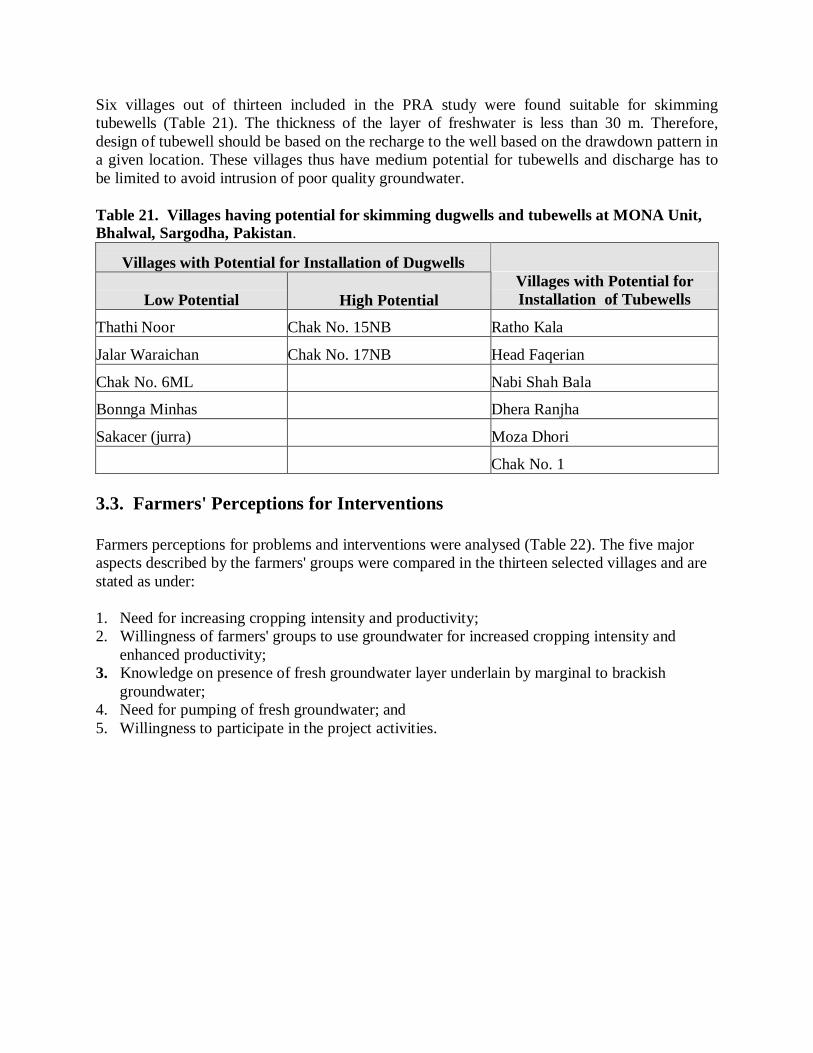
Six villages out of thirteen included in the PRA study were found suitable for skimmingtubewells (Table 21). The thickness of the layer of freshwater is less than 30 m. Therefore,design of tubewell should be based on the recharge to the well based on the drawdown pattern ina given location. These villages thus have medium potential for tubewells and discharge has tobe limited to avoid intrusion of poor quality groundwater.
Table 21. Villages having potential for skimming dugwells and tubewells at MONA Unit,Bhalwal, Sargodha, Pakistan.
Villages with Potential for Installation of Dugwells
Low Potential High PotentialVillages with Potential forInstallation of Tubewells
Thathi Noor Chak No. 15NB Ratho Kala
Jalar Waraichan Chak No. 17NB Head Faqerian
Chak No. 6ML Nabi Shah Bala
Bonnga Minhas Dhera Ranjha
Sakacer (jurra) Moza Dhori
Chak No. 1
3.3. Farmers' Perceptions for Interventions
Farmers perceptions for problems and interventions were analysed (Table 22). The five majoraspects described by the farmers' groups were compared in the thirteen selected villages and arestated as under:
1. Need for increasing cropping intensity and productivity;2. Willingness of farmers' groups to use groundwater for increased cropping intensity and
enhanced productivity;3. Knowledge on presence of fresh groundwater layer underlain by marginal to brackish
groundwater;4. Need for pumping of fresh groundwater; and5. Willingness to participate in the project activities.
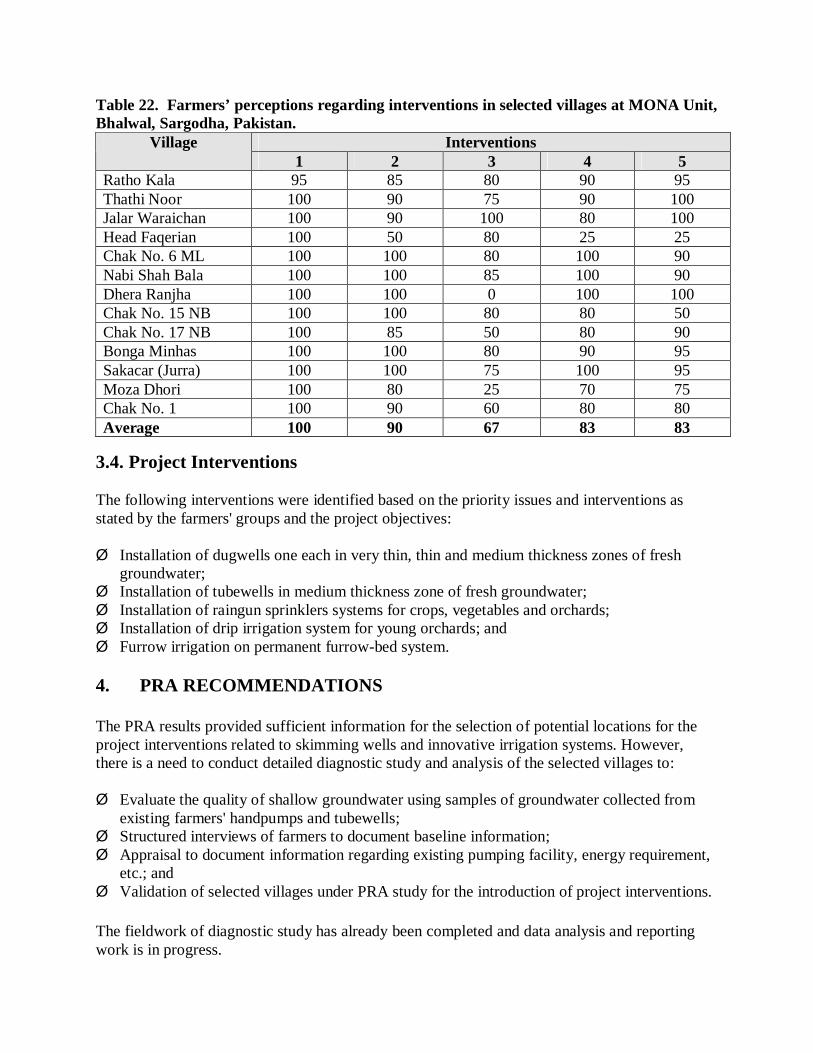
Table 22. Farmers’ perceptions regarding interventions in selected villages at MONA Unit,Bhalwal, Sargodha, Pakistan.
InterventionsVillage1 2 3 4 5
Ratho Kala 95 85 80 90 95Thathi Noor 100 90 75 90 100Jalar Waraichan 100 90 100 80 100Head Faqerian 100 50 80 25 25Chak No. 6 ML 100 100 80 100 90Nabi Shah Bala 100 100 85 100 90Dhera Ranjha 100 100 0 100 100Chak No. 15 NB 100 100 80 80 50Chak No. 17 NB 100 85 50 80 90Bonga Minhas 100 100 80 90 95Sakacar (Jurra) 100 100 75 100 95Moza Dhori 100 80 25 70 75Chak No. 1 100 90 60 80 80Average 100 90 67 83 83
3.4. Project Interventions
The following interventions were identified based on the priority issues and interventions asstated by the farmers' groups and the project objectives:
Ø Installation of dugwells one each in very thin, thin and medium thickness zones of freshgroundwater;
Ø Installation of tubewells in medium thickness zone of fresh groundwater;Ø Installation of raingun sprinklers systems for crops, vegetables and orchards;Ø Installation of drip irrigation system for young orchards; andØ Furrow irrigation on permanent furrow-bed system.
4. PRA RECOMMENDATIONS
The PRA results provided sufficient information for the selection of potential locations for theproject interventions related to skimming wells and innovative irrigation systems. However,there is a need to conduct detailed diagnostic study and analysis of the selected villages to:
Ø Evaluate the quality of shallow groundwater using samples of groundwater collected fromexisting farmers' handpumps and tubewells;
Ø Structured interviews of farmers to document baseline information;Ø Appraisal to document information regarding existing pumping facility, energy requirement,
etc.; andØ Validation of selected villages under PRA study for the introduction of project interventions.
The fieldwork of diagnostic study has already been completed and data analysis and reportingwork is in progress.
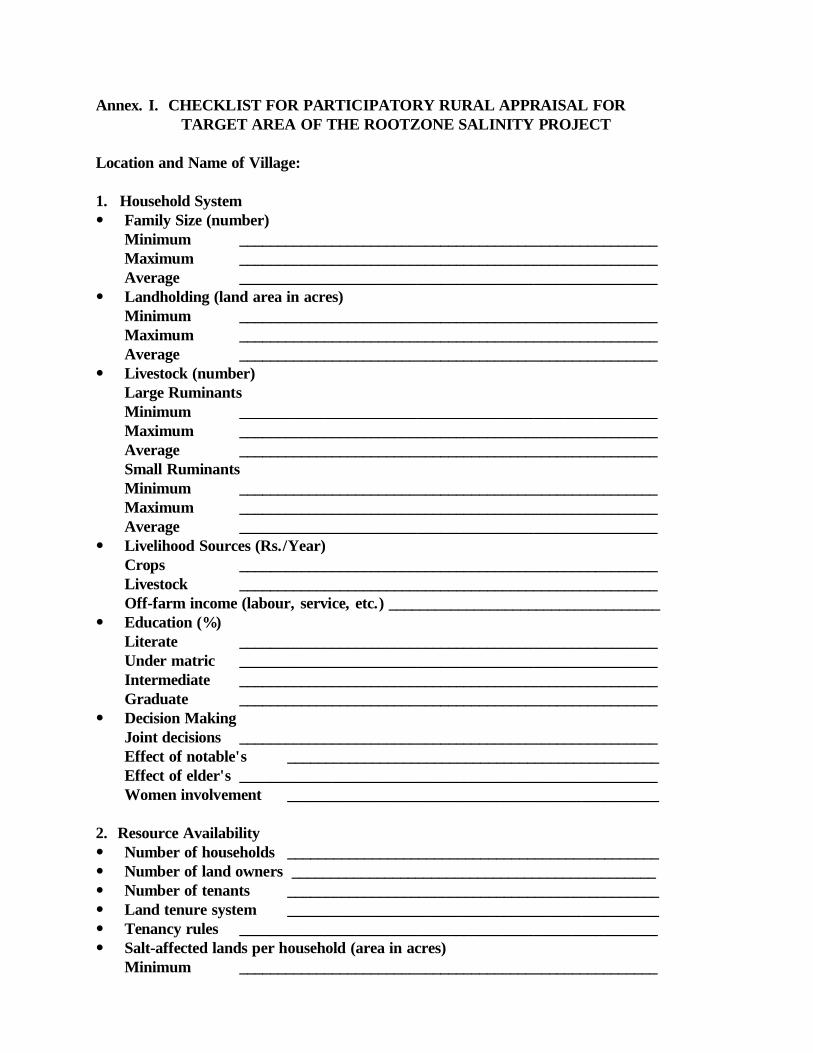
Annex. I. CHECKLIST FOR PARTICIPATORY RURAL APPRAISAL FOR TARGET AREA OF THE ROOTZONE SALINITY PROJECT
Location and Name of Village:
1. Household System Family Size (number)
Minimum ______________________________________________________ Maximum ______________________________________________________ Average ______________________________________________________ Landholding (land area in acres)
Minimum ______________________________________________________ Maximum ______________________________________________________ Average ______________________________________________________ Livestock (number)
Large Ruminants Minimum ______________________________________________________ Maximum ______________________________________________________ Average ______________________________________________________ Small Ruminants Minimum ______________________________________________________ Maximum ______________________________________________________ Average ______________________________________________________ Livelihood Sources (Rs./Year)
Crops ______________________________________________________ Livestock ______________________________________________________ Off-farm income (labour, service, etc.) ___________________________________ Education (%)
Literate ______________________________________________________ Under matric ______________________________________________________ Intermediate ______________________________________________________ Graduate ______________________________________________________ Decision Making
Joint decisions ______________________________________________________ Effect of notable's ________________________________________________ Effect of elder's ______________________________________________________ Women involvement ________________________________________________
2. Resource Availability Number of households ________________________________________________ Number of land owners _______________________________________________ Number of tenants ________________________________________________ Land tenure system ________________________________________________ Tenancy rules ______________________________________________________ Salt-affected lands per household (area in acres)
Minimum ______________________________________________________
Maximum ______________________________________________________ Average ______________________________________________________ Cultivated land per household (area in acres)
Minimum ______________________________________________________ Maximum ______________________________________________________ Average ______________________________________________________ No. of tubewells in the survey area _____________________________________ Type of wells (Tubewells/deep tubewells/dugwells) Depth of wells (feet)
Minimum ______________________________________________________ Maximum ______________________________________________________ Average ______________________________________________________ Quality of Groundwater
Very shallow (<25 ft) Saline/saline-sodic/sodic/fresh Shallow (25-50 ft) Saline/saline-sodic/sodic/fresh Moderate deep (50-100 ft) Saline/saline-sodic/sodic/fresh deep (>100 ft) Saline/saline-sodic/sodic/fresh Depth of groundwater table in the area (ft.)
Minimum ______________________________________________________ Maximum ______________________________________________________ Average ______________________________________________________
3. Agricultural Productivity Crops Grown
- Kharif ______________________________________________________ - Rabi ______________________________________________________ Cropping Patterns ________________________________________________ Cropping Intensity per farmer (%)
Minimum ______________________________________________________ Maximum ______________________________________________________ Average ______________________________________________________ Crop yields per farmer (Maunds/acre)
Minimum ______________________________________________________ Maximum ______________________________________________________ Average ______________________________________________________ Livestock-milk (seers/day)
Buffalo ______________________________________________________ Cow ______________________________________________________ Goat ______________________________________________________ Sheep ______________________________________________________ Price of per animal (in Rs.)
Buffalo ______________________________________________________ Cow ______________________________________________________ Goat ______________________________________________________ Bull ______________________________________________________ Camel ______________________________________________________

Donkey ______________________________________________________ Fisheries - Average yield/year ____________________________________ Fisheries - Average price/year _____________________________________ Any other ___________________________________________________________
4. Resource Use Water availability (percent of farmers)
- Canal water only ________________________________________________ - Canal + tubewell water ___________________________________________ - Tubewell water only _______________________________________________ Present use of waterlogged area Present use of salt-affect area
5. Resource Degradation Historical trends (area in acres or number of farms)
Parameters 1950s 1960s 1970s 1980s 1990s
- Rise of groundwater table
- Waterlogged area
- Salt affected area
- Secondary salinization
- Secondary sodification
- Deterioration of groundwater
6. Constraints and Problems Faced by Farmers and Ranking of Problems
7. Farmers' Perception Regarding Solutions and Interventions
8. Do the farmers realise that their cropping intensities and productivity are low? Indicate percent of farmers.
9. Are the farmers willing to use groundwater to increase their cropping intensities? and productivity? Indicate percent of farmers.
10. Farmers' urge to pump fresh groundwater to maintain soil health on long term basis. Indicate percent of farmers.
11. Are the farmers willing to participate in the project activities? Indicate percent of farmers.
12. Is the fresh groundwater layer underlain by marginal to brackish groundwater? layer? What are farmers' perceptions? Also indicate percent of farmers having a
particular perception.
13. Farmers Awareness (percent of farmers) Shallow freshwater layer ______________________________________________ Thin layer of freshwater _______________________________________________ Poor quality of freshwater _____________________________________________ Intrusion of brackish water into freshwater zone __________________________ Skimming well concepts _______________________________________________ Dugwell as skimming well _____________________________________________ Farmers acceptance of dugwells as skimming well _________________________ Problem of low discharges with skimming wells ___________________________ Efficient application of skimmed water using
- Furrow irrigation _________________________________________________ - Sprinkler irrigation ________________________________________________ - Drip irrigation ____________________________________________________