Embed Size (px)
Citation preview
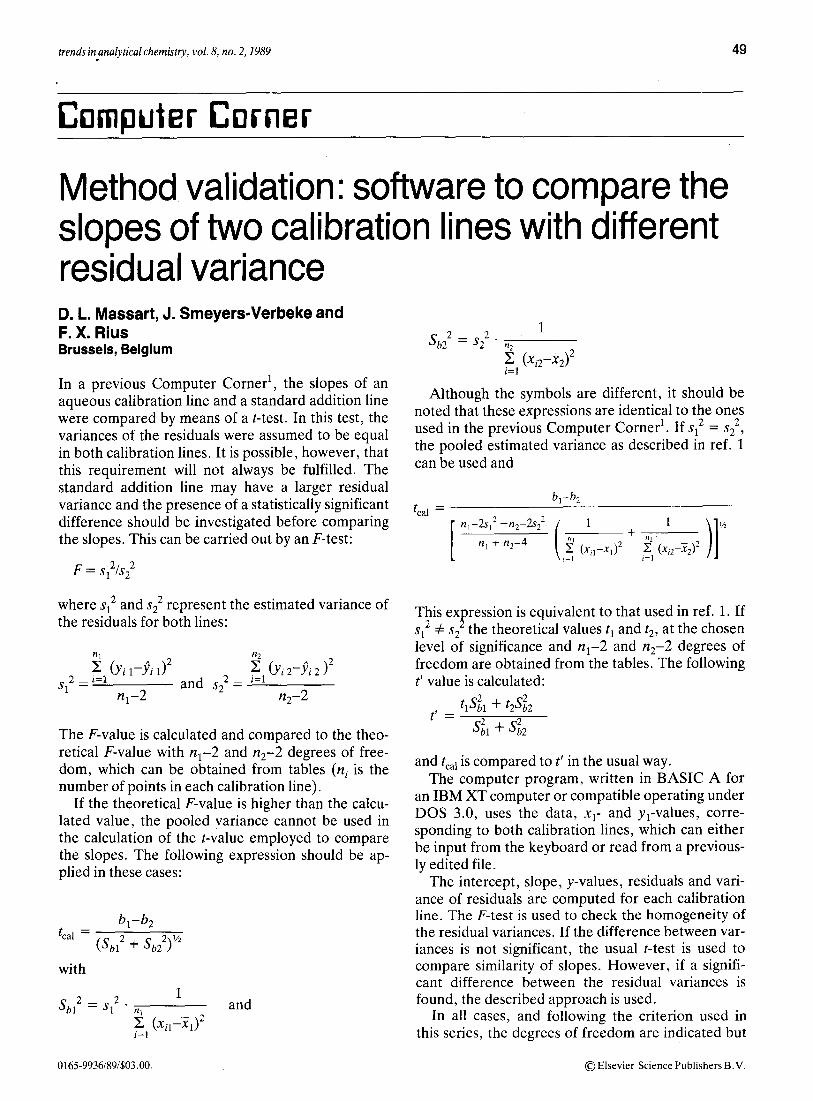
trends inpnalytical chemistry, vol. 8, no. 2,1989 49
Method validation: software to compare the slopes of two calibration lines with different residual variance D. L. Massart, J. Smeyerderbeke and F. X. Rius Brussels, Belgium
In a previous Computer Corner’, the slopes of an aqueous calibration line and a standard addition line were compared by means of a t-test. In this test, the variances of the residuals were assumed to be equal in both calibration lines. It is possible, however, that this requirement will not always be fulfilled. The standard addition line may have a larger residual variance and the presence of a statistically significant difference should be investigated before comparing the slopes. This can be carried out by an F-test:
F = s 21s 2 1 2
where si2 and s22 represent the estimated variance of the residuals for both lines:
2 112 2 Sl 2
k2-Pi2)2 _ - i=l
CYi 1-A and 2 s 2 - - i=l
q-2 n2-2
The F-value is calculated and compared to the theo- retical F-value with q-2 and n,-2 degrees of free- dom, which can be obtained from tables (q is the number of points in each calibration line).
If the theoretical F-value is higher than the calcu- lated value, the pooled variance cannot be used in the calculation of the t-value employed to compare the slopes. The following expression should be ap- plied in these cases:
t h-b2
ca1 = (Sb12 + Sb22)%
with
s 2= bl s12 *
016599361891$03.00
and
2_ 1
sb2 - s22 . n2
El (xi2-x2)2
Although the symbols are different, it should be noted that these expressions are identical to the ones used in the previous Computer Corner’. If s12 = s2’, the pooled estimated variance as described in ref. 1 can be used and
b,-b, t cal =
n,-2s,’ +n,-2sz2 1 1
)I 1% + II, + n,-4 lg (%-%)2 2 (q-T2)2
I=1
This expression is equivalent to that used in ref. 1. If s12 # s2 the theoretical values t, and t2, at the chosen level of significance and n,-2 and n,-2 degrees of freedom are obtained from the tables. The following t’ value is calculated:
t’ = 4% + t2$2
Sk + $2
and teal is compared to t’ in the usual way. The computer program, written in BASIC A for
an IBM XT computer or compatible operating under DOS 3.0, uses the data, x1- and y,-values, corre- sponding to both calibration lines, which can either be input from the keyboard or read from a previous- ly edited file.
The intercept, slope, y-values, residuals and vari- ance of residuals are computed for each calibration line. The F-test is used to check the homogeneity of the residual variances. If the difference between var- iances is not significant, the usual t-test is used to compare similarity of slopes. However, if a signifi- cant difference between the residual variances is found, the described approach is used.
In all cases, and following the criterion used in this series, the degrees of freedom are indicated but
0 Elsevier Science Publishers B.V.
50 trends in analytical chemistry, vol. 8, no: 2,1989
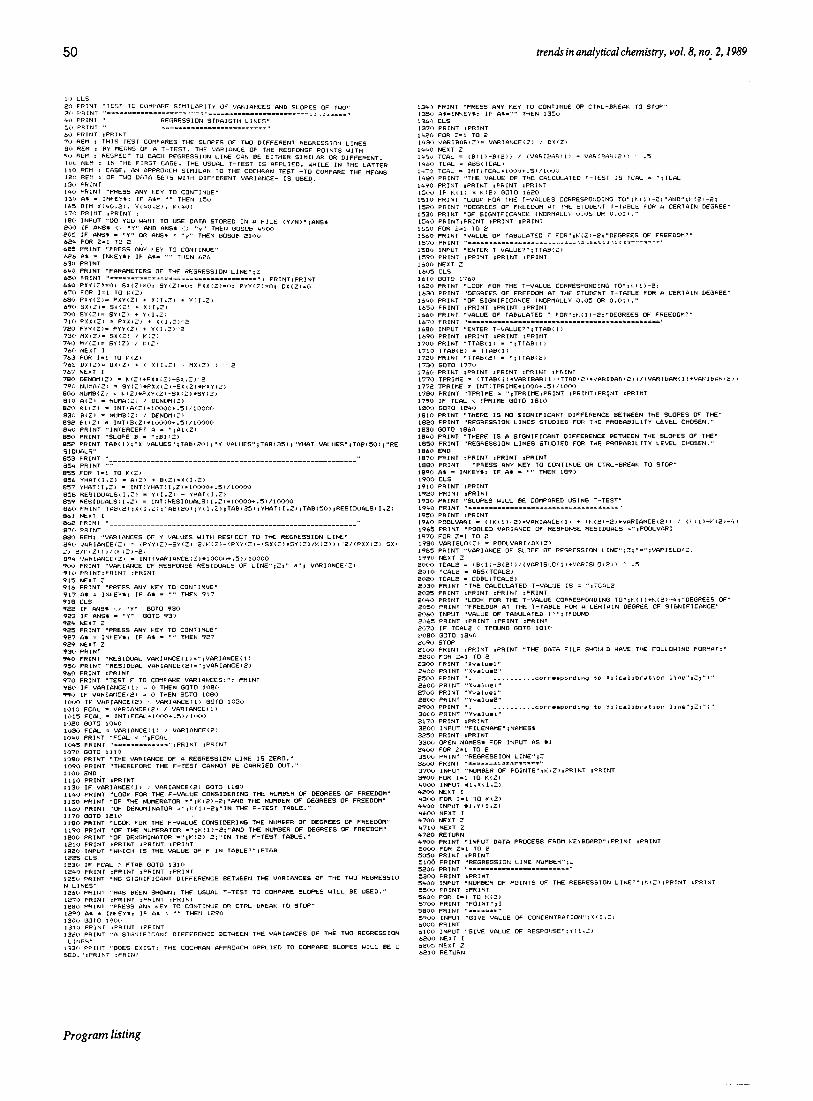
Program listing
trends in analytical chemistry, vol. 8, no. 2,1989 51
the theoretical F- and t-values have to be obtained from statistical tables.
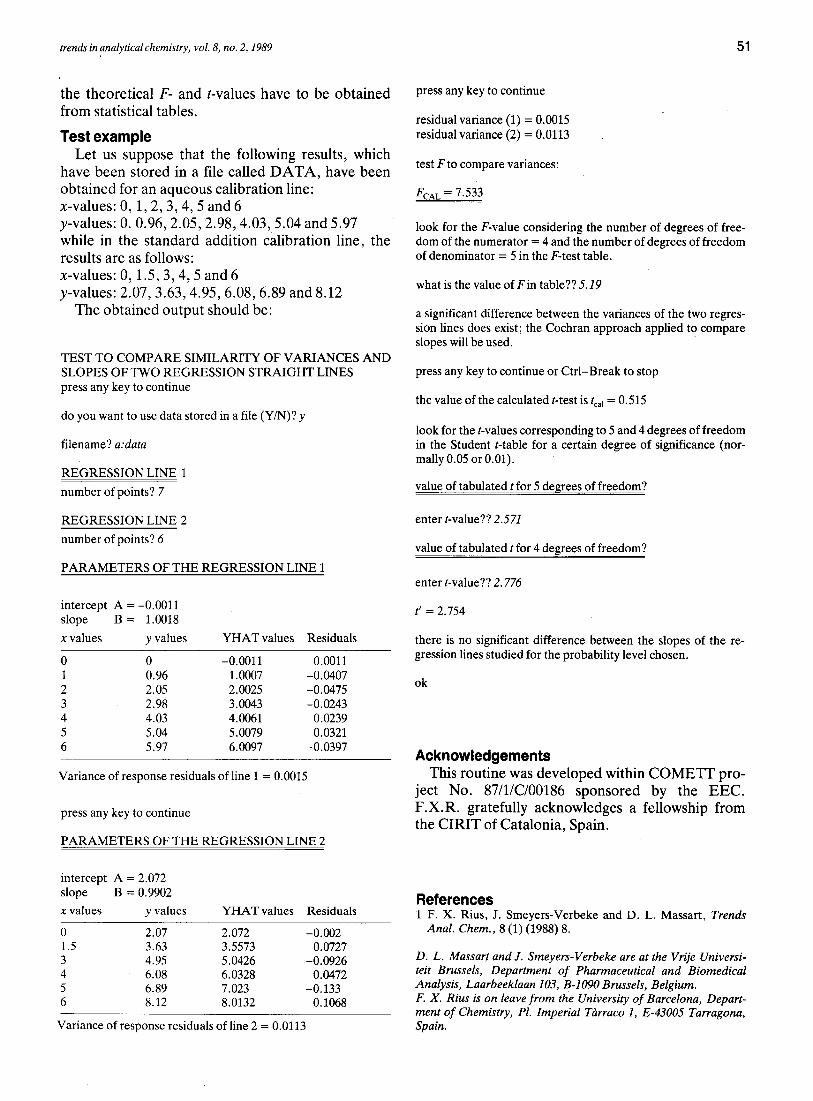
Test example Let us suppose that the following results, which
have been stored in a file called DATA, have been obtained for an aqueous calibration line: x-values: 0, 1,2,3,4,5 and 6 y-values: 0. 0.96,2.05,2.98,4.03,5.04 and 5.97 while in the standard addition calibration line, the results are as follows: x-values: 0,1.5,3,4,5 and 6 y-values: 2.07,3.63,4.95,6.08,6.89 and 8.12
The obtained output should be:
TEST TO COMPARE SIMILARITY OF VARIANCES AND SLOPES OF TWO REGRESSION STRAIGHT LINES press any key to continue
do you want to use data stored in a file (Y/N)? y
filename? a:data
REGRESSION LINE 1
number of points? 7
REGRESSION LINE 2
number of points? 6
press any key to continue
residual variance (1) = 0.0015 residual variance (2) = 0.0113
test F to compare variances:
F CAL = 7.533
look for the F-value considering the number of degrees of free- dom of the numerator = 4 and the number of degrees of freedom of denominator = 5 in the F-test table.
what is the value of Fin table?? 5.19
a significant difference between the variances of the two regres- sion lines does exist; the Cochran approach applied to compare slopes will be used.
press any key to continue or Ctrl-Break to stop
the value of the calculated t-test is fca, = 0.515
look for the t-values corresponding to 5 and 4 degrees of freedom in the Student t-table for a certain degree of significance (nor- mally 0.05 or 0.01).
value of tabulated t for 5 degrees of freedom?
enter t-value?? 2.571
value of tabulated 1 for 4 degrees of freedom?
PARAMETERS OF THE REGRESSION LINE 1 enter t-value?? 2.776
intercept A = -0.0011 slope B = 1.0018
x values y values YHAT values Residuals
0 0 -0.0011 0.0011 1 0.96 1.0007 -0.0407 2 2.05 2.0025 -0.0475 3 2.98 3.0043 -0.0243 4 4.03 4.0061 0.0239 5 5.04 5.0079 0.0321 6 5.97 6.0097 -0.0397
Variance of response residuals of line 1 = 0.0015
press any key to continue
PARAMETERS OF THE REGRESSION LINE 2
intercept A = 2.072 slope B = 0.9902
x values y values YHAT values Residuals
0 2.07 2.072 -0.002 1.5 3.63 3.5573 0.0727 3 4.95 5.0426 -0.0926 4 6.08 6.0328 0.0472 5 6.89 7.023 -0.133 6 8.12 8.0132 0.1068
Variance of response residuals of line 2 = 0.0113
t’ = 2.754
there is no significant difference between the slopes of the re- gression lines studied for the probability level chosen.
ok
Acknowledgements This routine was developed within COMETT pro-
ject No. 87/1/C/00186 sponsored by the EEC. F.X.R. gratefully acknowledges a fellowship from the CIRIT of Catalonia, Spain.
References 1 F. X. Rius, J. Smeyers-Verbeke and D. L. Massart, Trends
Anal. Chem., 8 (1) (1988) 8.
D. L. Massart and J. Smeyers-Verbeke are at the Vrije Universi- teit Brussels, Department of Pharmaceutical and Biomedical Analysis, Laarbeeklaan 103, B-1090 Brussels, Belgium. F. X. Rius is on leave from the University of Barcelona, Depart- ment of Chemistry, PI. Imperial Tdrraco I, E-43005 Tarragona, Spain.