Embed Size (px)
Citation preview
1
METHOD Tutorial
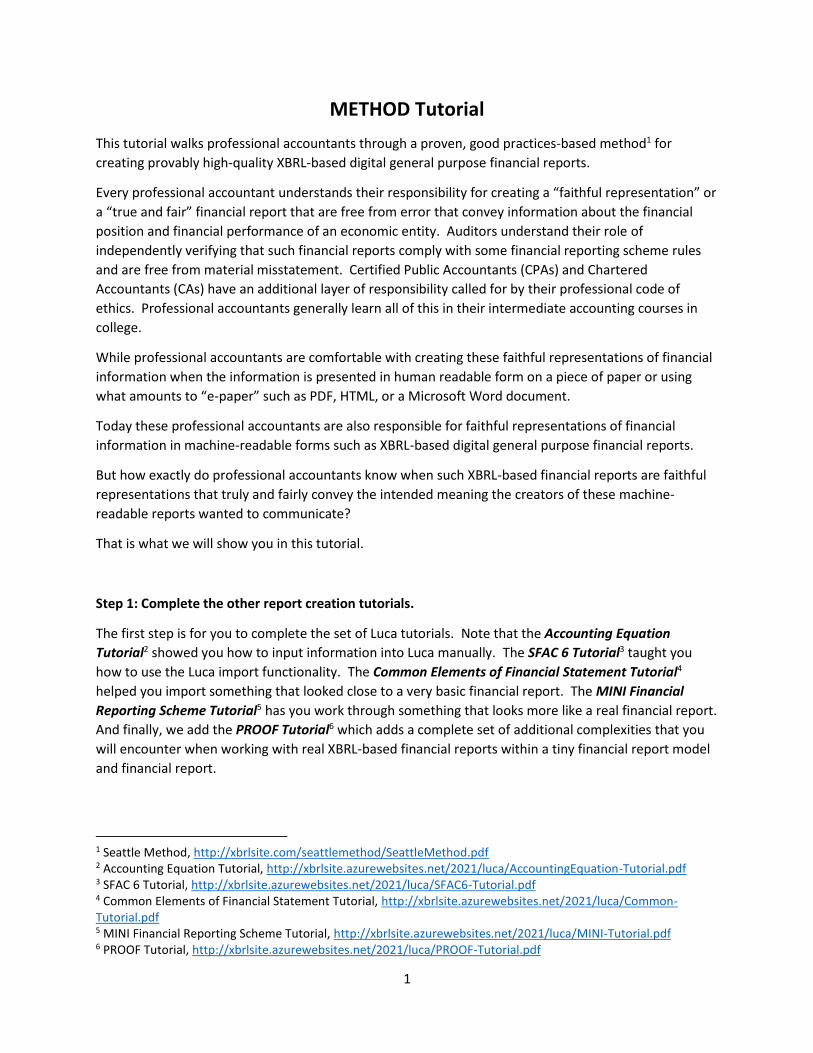
This tutorial walks professional accountants through a proven, good practices-based method1 for
creating provably high-quality XBRL-based digital general purpose financial reports.
Every professional accountant understands their responsibility for creating a “faithful representation” or
a “true and fair” financial report that are free from error that convey information about the financial
position and financial performance of an economic entity. Auditors understand their role of
independently verifying that such financial reports comply with some financial reporting scheme rules
and are free from material misstatement. Certified Public Accountants (CPAs) and Chartered
Accountants (CAs) have an additional layer of responsibility called for by their professional code of
ethics. Professional accountants generally learn all of this in their intermediate accounting courses in
college.
While professional accountants are comfortable with creating these faithful representations of financial
information when the information is presented in human readable form on a piece of paper or using
what amounts to “e-paper” such as PDF, HTML, or a Microsoft Word document.
Today these professional accountants are also responsible for faithful representations of financial
information in machine-readable forms such as XBRL-based digital general purpose financial reports.
But how exactly do professional accountants know when such XBRL-based financial reports are faithful
representations that truly and fairly convey the intended meaning the creators of these machine-
readable reports wanted to communicate?
That is what we will show you in this tutorial.
Step 1: Complete the other report creation tutorials.
The first step is for you to complete the set of Luca tutorials. Note that the Accounting Equation
Tutorial2 showed you how to input information into Luca manually. The SFAC 6 Tutorial3 taught you
how to use the Luca import functionality. The Common Elements of Financial Statement Tutorial4
helped you import something that looked close to a very basic financial report. The MINI Financial
Reporting Scheme Tutorial5 has you work through something that looks more like a real financial report.
And finally, we add the PROOF Tutorial6 which adds a complete set of additional complexities that you
will encounter when working with real XBRL-based financial reports within a tiny financial report model
and financial report.
1 Seattle Method, http://xbrlsite.com/seattlemethod/SeattleMethod.pdf 2 Accounting Equation Tutorial, http://xbrlsite.azurewebsites.net/2021/luca/AccountingEquation-Tutorial.pdf 3 SFAC 6 Tutorial, http://xbrlsite.azurewebsites.net/2021/luca/SFAC6-Tutorial.pdf 4 Common Elements of Financial Statement Tutorial, http://xbrlsite.azurewebsites.net/2021/luca/Common-Tutorial.pdf 5 MINI Financial Reporting Scheme Tutorial, http://xbrlsite.azurewebsites.net/2021/luca/MINI-Tutorial.pdf 6 PROOF Tutorial, http://xbrlsite.azurewebsites.net/2021/luca/PROOF-Tutorial.pdf
2
What these report model and report creation tools do is help you understand the logical components
that make up an XBRL-based digital financial report.
This tutorial will help you understand what a properly functioning logical system that is complete,
consistent, and precise is and how to determine if your XBRL-based digital financial report fits those
criteria.
Step 2: Understanding that it is about the Logic.
So, do XBRL-based digital financial reports need to be proper XBRL technical format? Absolutely. But
checking the XBRL technical format is as simple as having the right piece of software, a fully compliant
XBRL processor, and pressing a button. It is literally that simple. Why? Because XBRL International
publishes a conformance suite7 that every conformant XBRL processor is required to pass in order to say
that they are a fully conformant XBRL processor.
Now, you still need to understand how to know when an XBRL processor is a fully conformant XBRL
processor.
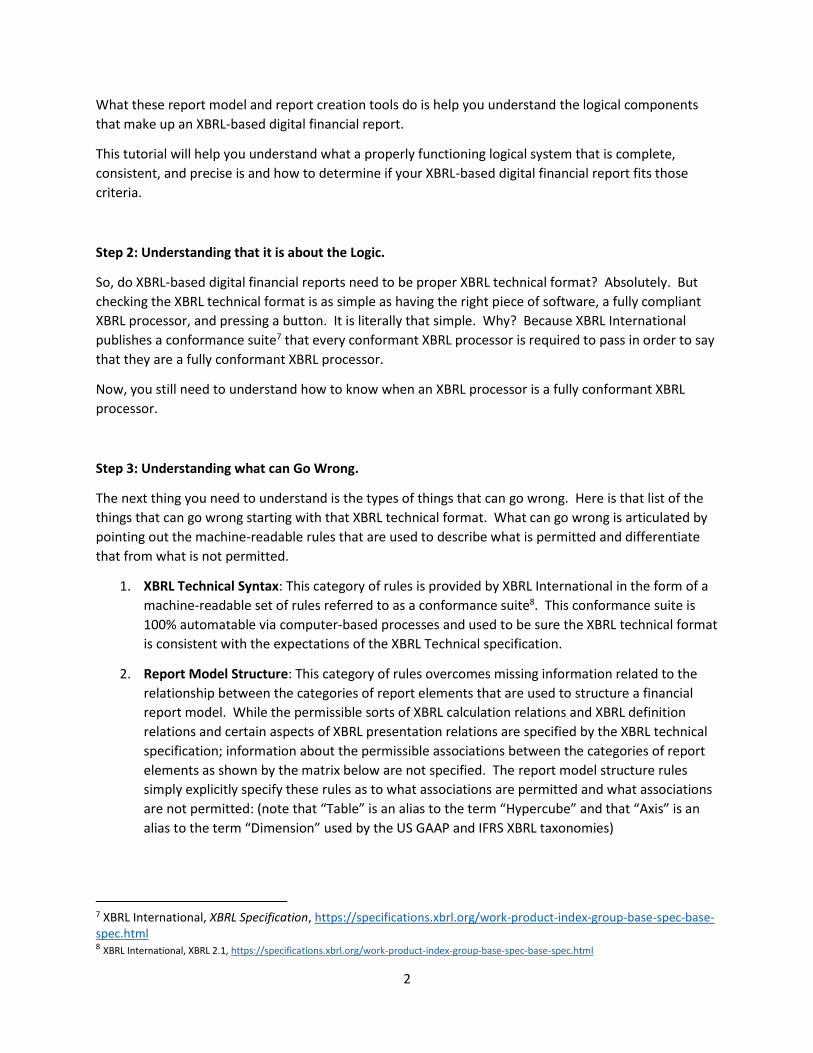
Step 3: Understanding what can Go Wrong.
The next thing you need to understand is the types of things that can go wrong. Here is that list of the
things that can go wrong starting with that XBRL technical format. What can go wrong is articulated by
pointing out the machine-readable rules that are used to describe what is permitted and differentiate
that from what is not permitted.
1. XBRL Technical Syntax: This category of rules is provided by XBRL International in the form of a
machine-readable set of rules referred to as a conformance suite8. This conformance suite is
100% automatable via computer-based processes and used to be sure the XBRL technical format
is consistent with the expectations of the XBRL Technical specification.
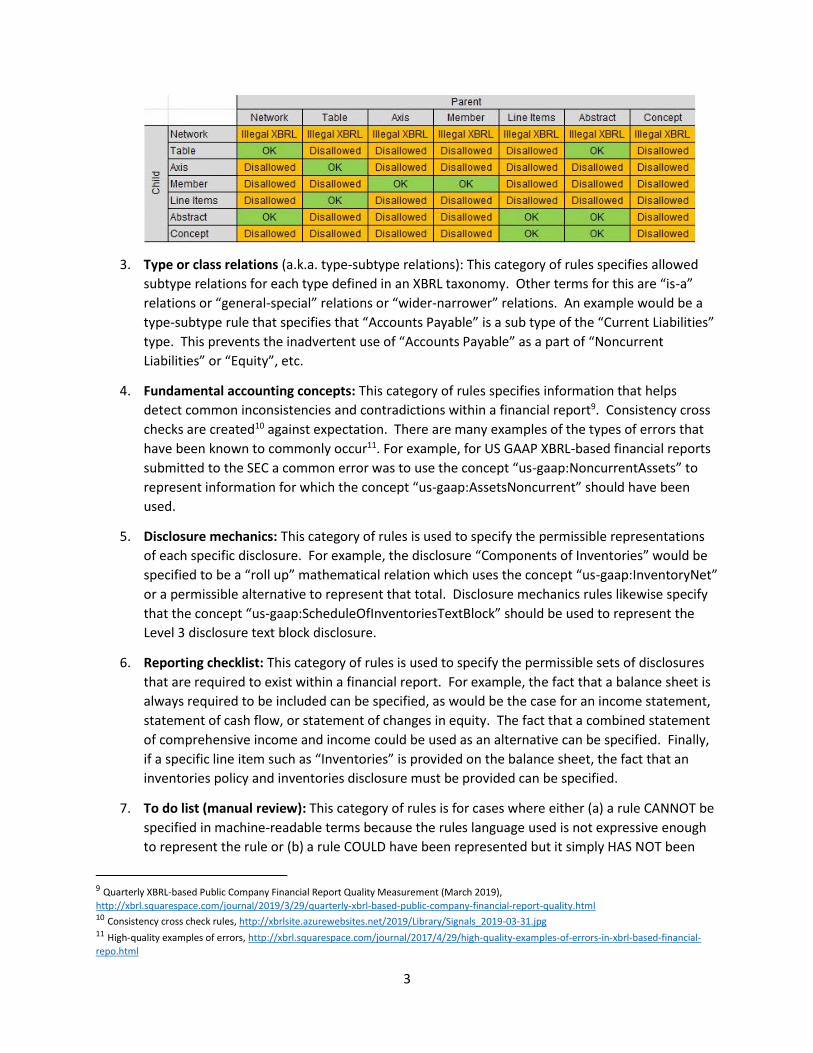
2. Report Model Structure: This category of rules overcomes missing information related to the
relationship between the categories of report elements that are used to structure a financial
report model. While the permissible sorts of XBRL calculation relations and XBRL definition
relations and certain aspects of XBRL presentation relations are specified by the XBRL technical
specification; information about the permissible associations between the categories of report
elements as shown by the matrix below are not specified. The report model structure rules
simply explicitly specify these rules as to what associations are permitted and what associations
are not permitted: (note that “Table” is an alias to the term “Hypercube” and that “Axis” is an
alias to the term “Dimension” used by the US GAAP and IFRS XBRL taxonomies)
7 XBRL International, XBRL Specification, https://specifications.xbrl.org/work-product-index-group-base-spec-base-spec.html 8 XBRL International, XBRL 2.1, https://specifications.xbrl.org/work-product-index-group-base-spec-base-spec.html
3
3. Type or class relations (a.k.a. type-subtype relations): This category of rules specifies allowed
subtype relations for each type defined in an XBRL taxonomy. Other terms for this are “is-a”
relations or “general-special” relations or “wider-narrower” relations. An example would be a
type-subtype rule that specifies that “Accounts Payable” is a sub type of the “Current Liabilities”
type. This prevents the inadvertent use of “Accounts Payable” as a part of “Noncurrent
Liabilities” or “Equity”, etc.
4. Fundamental accounting concepts: This category of rules specifies information that helps
detect common inconsistencies and contradictions within a financial report9. Consistency cross
checks are created10 against expectation. There are many examples of the types of errors that
have been known to commonly occur11. For example, for US GAAP XBRL-based financial reports
submitted to the SEC a common error was to use the concept “us-gaap:NoncurrentAssets” to
represent information for which the concept “us-gaap:AssetsNoncurrent” should have been
used.
5. Disclosure mechanics: This category of rules is used to specify the permissible representations
of each specific disclosure. For example, the disclosure “Components of Inventories” would be
specified to be a “roll up” mathematical relation which uses the concept “us-gaap:InventoryNet”
or a permissible alternative to represent that total. Disclosure mechanics rules likewise specify
that the concept “us-gaap:ScheduleOfInventoriesTextBlock” should be used to represent the
Level 3 disclosure text block disclosure.
6. Reporting checklist: This category of rules is used to specify the permissible sets of disclosures
that are required to exist within a financial report. For example, the fact that a balance sheet is
always required to be included can be specified, as would be the case for an income statement,
statement of cash flow, or statement of changes in equity. The fact that a combined statement
of comprehensive income and income could be used as an alternative can be specified. Finally,
if a specific line item such as “Inventories” is provided on the balance sheet, the fact that an
inventories policy and inventories disclosure must be provided can be specified.
7. To do list (manual review): This category of rules is for cases where either (a) a rule CANNOT be
specified in machine-readable terms because the rules language used is not expressive enough
to represent the rule or (b) a rule COULD have been represented but it simply HAS NOT been
9 Quarterly XBRL-based Public Company Financial Report Quality Measurement (March 2019),
http://xbrl.squarespace.com/journal/2019/3/29/quarterly-xbrl-based-public-company-financial-report-quality.html 10 Consistency cross check rules, http://xbrlsite.azurewebsites.net/2019/Library/Signals_2019-03-31.jpg 11 High-quality examples of errors, http://xbrl.squarespace.com/journal/2017/4/29/high-quality-examples-of-errors-in-xbrl-based-financial-
repo.html
4
represented and therefore manual work is necessary to verify report logic that could have been
automated.
Can other things go wrong? Absolutely. For example, a report can be wrong because it has a spelling
error in one of the disclosures. The fix? Add additional machine-readable rules or check the other
things manually.
I am not saying that these seven categories of rules are necessarily sufficient to prove everything that
can go wrong within an XBRL-based financial report. What I am saying is that these are the types of
things that other XBRL-based financial reports have commonly gotten wrong, can lead to logical
contradictions and inconsistencies, are necessary to be right in order to make use of reported financial
information, and are therefore necessary to check. Are other rule categories necessary? Absolutely; for
example further restrictions specified by the SEC or the ESMA are good examples. Those rules must be
checked also if you report to one of those regulators.
Step 4: Specific Logical Details of What can Go Wrong.
You can understand the specific types of logical errors that can occur in the Microsoft 10-K or any US
GAAP or IFRS based XBRL-based financial report by looking at the types of errors that can exist in the
accounting equation representation. This section explains those logical error types.
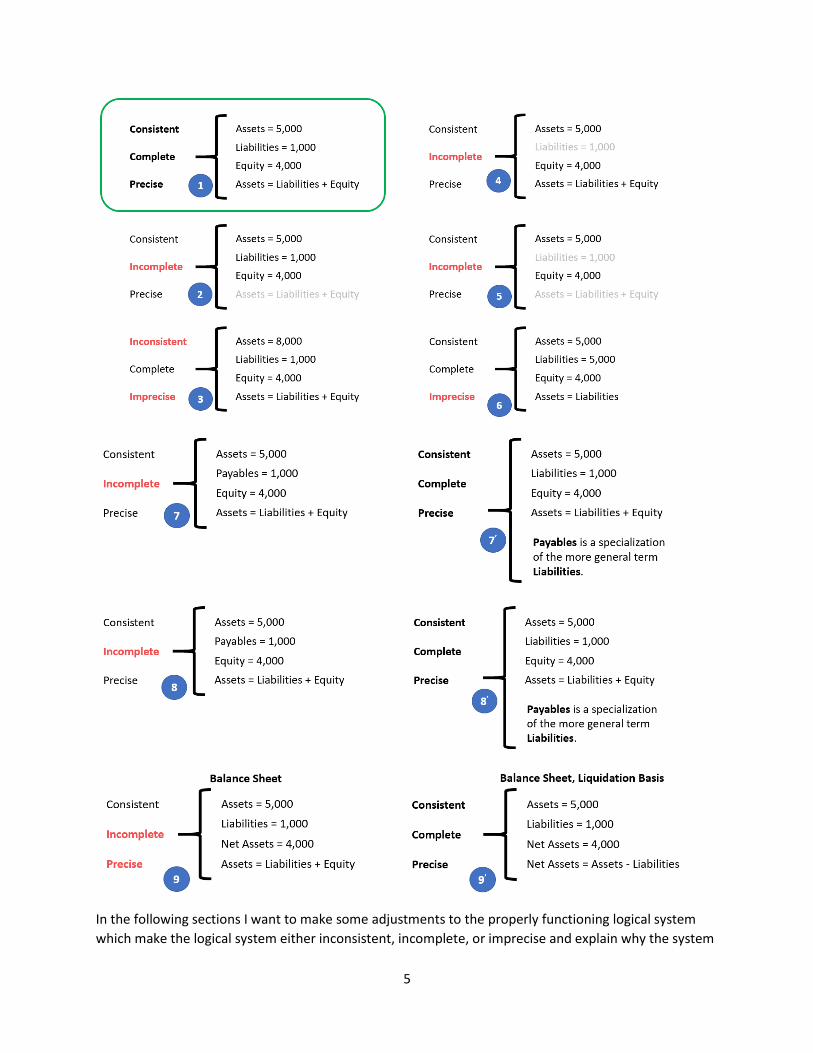
The following is a comparison of 9 states of the same simple financial report logical system, the
accounting equation12. The point of using such a simple financial report logical system is to explain
specific things that can go wrong so that a reader can understand why each of the categories of rules are
necessary.
These 9 states can occur in any financial report with one fragment, two fragments, or 194 fragments like
the Microsoft 10 K.
There are many ways to get a report wrong. Here is a summary of all nine states of an improperly
functioning financial report logical system. These things that can go wrong are the impediments that get
in the way of you creating a properly functioning logical system.
But first we want to establish a baseline of what a correct financial report looks like which is our state
#1. In the graphic below the first state outlined in green being the only properly functioning logical
system proven to be complete, consistent, and precise:
12 Accounting equation, http://xbrlsite.azurewebsites.net/2020/master/ae/index.html
5
In the following sections I want to make some adjustments to the properly functioning logical system
which make the logical system either inconsistent, incomplete, or imprecise and explain why the system
6
is then not a properly functioning logical system. I made videos that explain each of these impediments
to a properly functioning logical system which you can see in this video playlist, Understanding the
Financial Report Logical System13.
Again, before we get to the improperly functioning logical systems, let’s take one final look at the
properly functioning logical system so that you can use that as a baseline for comparing and contrasting
the properly functioning and improperly functioning logical systems so that you can understand they
sorts of errors that could occur in any XBRL-based financial report.
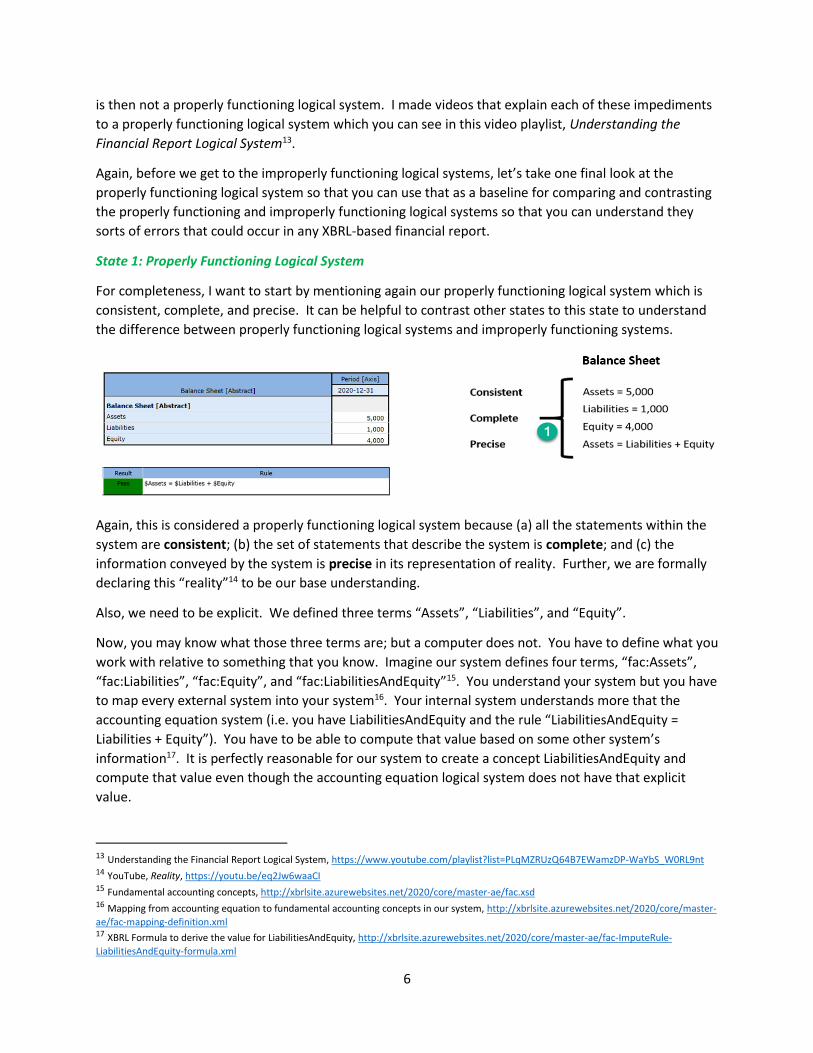
State 1: Properly Functioning Logical System
For completeness, I want to start by mentioning again our properly functioning logical system which is
consistent, complete, and precise. It can be helpful to contrast other states to this state to understand
the difference between properly functioning logical systems and improperly functioning systems.
Again, this is considered a properly functioning logical system because (a) all the statements within the
system are consistent; (b) the set of statements that describe the system is complete; and (c) the
information conveyed by the system is precise in its representation of reality. Further, we are formally
declaring this “reality”14 to be our base understanding.
Also, we need to be explicit. We defined three terms “Assets”, “Liabilities”, and “Equity”.
Now, you may know what those three terms are; but a computer does not. You have to define what you
work with relative to something that you know. Imagine our system defines four terms, “fac:Assets”,
“fac:Liabilities”, “fac:Equity”, and “fac:LiabilitiesAndEquity”15. You understand your system but you have
to map every external system into your system16. Your internal system understands more that the
accounting equation system (i.e. you have LiabilitiesAndEquity and the rule “LiabilitiesAndEquity =
Liabilities + Equity”). You have to be able to compute that value based on some other system’s
information17. It is perfectly reasonable for our system to create a concept LiabilitiesAndEquity and
compute that value even though the accounting equation logical system does not have that explicit
value.
13 Understanding the Financial Report Logical System, https://www.youtube.com/playlist?list=PLqMZRUzQ64B7EWamzDP-WaYbS_W0RL9nt 14 YouTube, Reality, https://youtu.be/eq2Jw6waaCI 15 Fundamental accounting concepts, http://xbrlsite.azurewebsites.net/2020/core/master-ae/fac.xsd 16 Mapping from accounting equation to fundamental accounting concepts in our system, http://xbrlsite.azurewebsites.net/2020/core/master-
ae/fac-mapping-definition.xml 17 XBRL Formula to derive the value for LiabilitiesAndEquity, http://xbrlsite.azurewebsites.net/2020/core/master-ae/fac-ImputeRule-
LiabilitiesAndEquity-formula.xml
7
The point is that different economic entities have different models; but all models of a financial
reporting scheme are reconcilable from/to one another in some manner18.
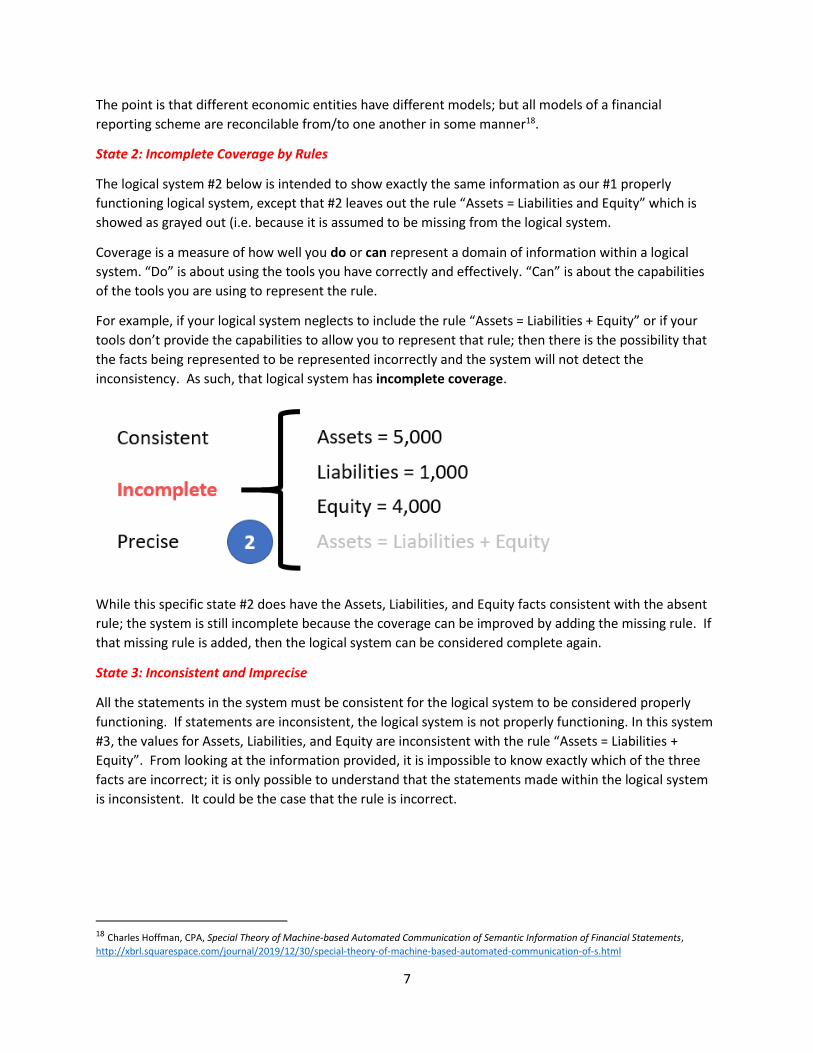
State 2: Incomplete Coverage by Rules
The logical system #2 below is intended to show exactly the same information as our #1 properly
functioning logical system, except that #2 leaves out the rule “Assets = Liabilities and Equity” which is
showed as grayed out (i.e. because it is assumed to be missing from the logical system.
Coverage is a measure of how well you do or can represent a domain of information within a logical
system. “Do” is about using the tools you have correctly and effectively. “Can” is about the capabilities
of the tools you are using to represent the rule.
For example, if your logical system neglects to include the rule “Assets = Liabilities + Equity” or if your
tools don’t provide the capabilities to allow you to represent that rule; then there is the possibility that
the facts being represented to be represented incorrectly and the system will not detect the
inconsistency. As such, that logical system has incomplete coverage.
While this specific state #2 does have the Assets, Liabilities, and Equity facts consistent with the absent
rule; the system is still incomplete because the coverage can be improved by adding the missing rule. If
that missing rule is added, then the logical system can be considered complete again.
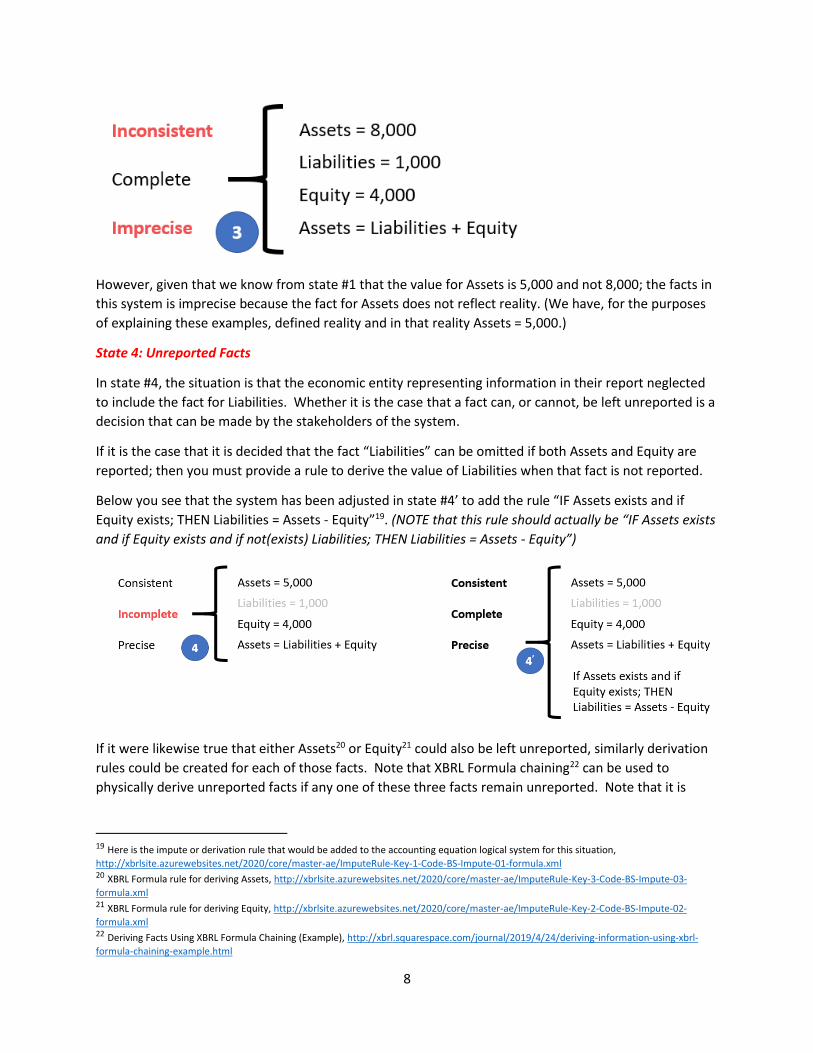
State 3: Inconsistent and Imprecise
All the statements in the system must be consistent for the logical system to be considered properly
functioning. If statements are inconsistent, the logical system is not properly functioning. In this system
#3, the values for Assets, Liabilities, and Equity are inconsistent with the rule “Assets = Liabilities +
Equity”. From looking at the information provided, it is impossible to know exactly which of the three
facts are incorrect; it is only possible to understand that the statements made within the logical system
is inconsistent. It could be the case that the rule is incorrect.
18 Charles Hoffman, CPA, Special Theory of Machine-based Automated Communication of Semantic Information of Financial Statements,
http://xbrl.squarespace.com/journal/2019/12/30/special-theory-of-machine-based-automated-communication-of-s.html
8
However, given that we know from state #1 that the value for Assets is 5,000 and not 8,000; the facts in
this system is imprecise because the fact for Assets does not reflect reality. (We have, for the purposes
of explaining these examples, defined reality and in that reality Assets = 5,000.)
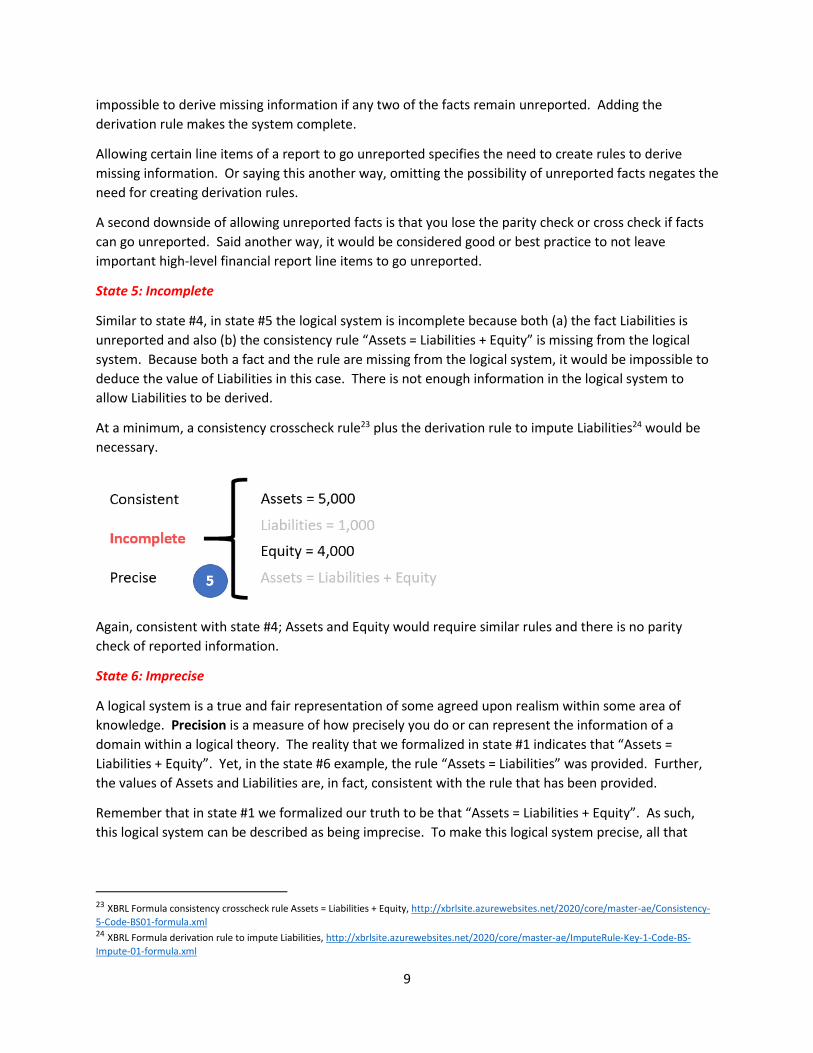
State 4: Unreported Facts
In state #4, the situation is that the economic entity representing information in their report neglected
to include the fact for Liabilities. Whether it is the case that a fact can, or cannot, be left unreported is a
decision that can be made by the stakeholders of the system.
If it is the case that it is decided that the fact “Liabilities” can be omitted if both Assets and Equity are
reported; then you must provide a rule to derive the value of Liabilities when that fact is not reported.
Below you see that the system has been adjusted in state #4’ to add the rule “IF Assets exists and if
Equity exists; THEN Liabilities = Assets - Equity”19. (NOTE that this rule should actually be “IF Assets exists
and if Equity exists and if not(exists) Liabilities; THEN Liabilities = Assets - Equity”)
If it were likewise true that either Assets20 or Equity21 could also be left unreported, similarly derivation
rules could be created for each of those facts. Note that XBRL Formula chaining22 can be used to
physically derive unreported facts if any one of these three facts remain unreported. Note that it is
19 Here is the impute or derivation rule that would be added to the accounting equation logical system for this situation,
http://xbrlsite.azurewebsites.net/2020/core/master-ae/ImputeRule-Key-1-Code-BS-Impute-01-formula.xml 20 XBRL Formula rule for deriving Assets, http://xbrlsite.azurewebsites.net/2020/core/master-ae/ImputeRule-Key-3-Code-BS-Impute-03-
formula.xml 21 XBRL Formula rule for deriving Equity, http://xbrlsite.azurewebsites.net/2020/core/master-ae/ImputeRule-Key-2-Code-BS-Impute-02-
formula.xml 22 Deriving Facts Using XBRL Formula Chaining (Example), http://xbrl.squarespace.com/journal/2019/4/24/deriving-information-using-xbrl-
formula-chaining-example.html
9
impossible to derive missing information if any two of the facts remain unreported. Adding the
derivation rule makes the system complete.
Allowing certain line items of a report to go unreported specifies the need to create rules to derive
missing information. Or saying this another way, omitting the possibility of unreported facts negates the
need for creating derivation rules.
A second downside of allowing unreported facts is that you lose the parity check or cross check if facts
can go unreported. Said another way, it would be considered good or best practice to not leave
important high-level financial report line items to go unreported.
State 5: Incomplete
Similar to state #4, in state #5 the logical system is incomplete because both (a) the fact Liabilities is
unreported and also (b) the consistency rule “Assets = Liabilities + Equity” is missing from the logical
system. Because both a fact and the rule are missing from the logical system, it would be impossible to
deduce the value of Liabilities in this case. There is not enough information in the logical system to
allow Liabilities to be derived.
At a minimum, a consistency crosscheck rule23 plus the derivation rule to impute Liabilities24 would be
necessary.
Again, consistent with state #4; Assets and Equity would require similar rules and there is no parity
check of reported information.
State 6: Imprecise
A logical system is a true and fair representation of some agreed upon realism within some area of
knowledge. Precision is a measure of how precisely you do or can represent the information of a
domain within a logical theory. The reality that we formalized in state #1 indicates that “Assets =
Liabilities + Equity”. Yet, in the state #6 example, the rule “Assets = Liabilities” was provided. Further,
the values of Assets and Liabilities are, in fact, consistent with the rule that has been provided.
Remember that in state #1 we formalized our truth to be that “Assets = Liabilities + Equity”. As such,
this logical system can be described as being imprecise. To make this logical system precise, all that
23 XBRL Formula consistency crosscheck rule Assets = Liabilities + Equity, http://xbrlsite.azurewebsites.net/2020/core/master-ae/Consistency-
5-Code-BS01-formula.xml 24 XBRL Formula derivation rule to impute Liabilities, http://xbrlsite.azurewebsites.net/2020/core/master-ae/ImputeRule-Key-1-Code-BS-
Impute-01-formula.xml
10
needs to be done is to fix the rule “Assets = Liabilities” and make that rule consistent with our reality
which states that “Assets = Liabilities + Equity”.
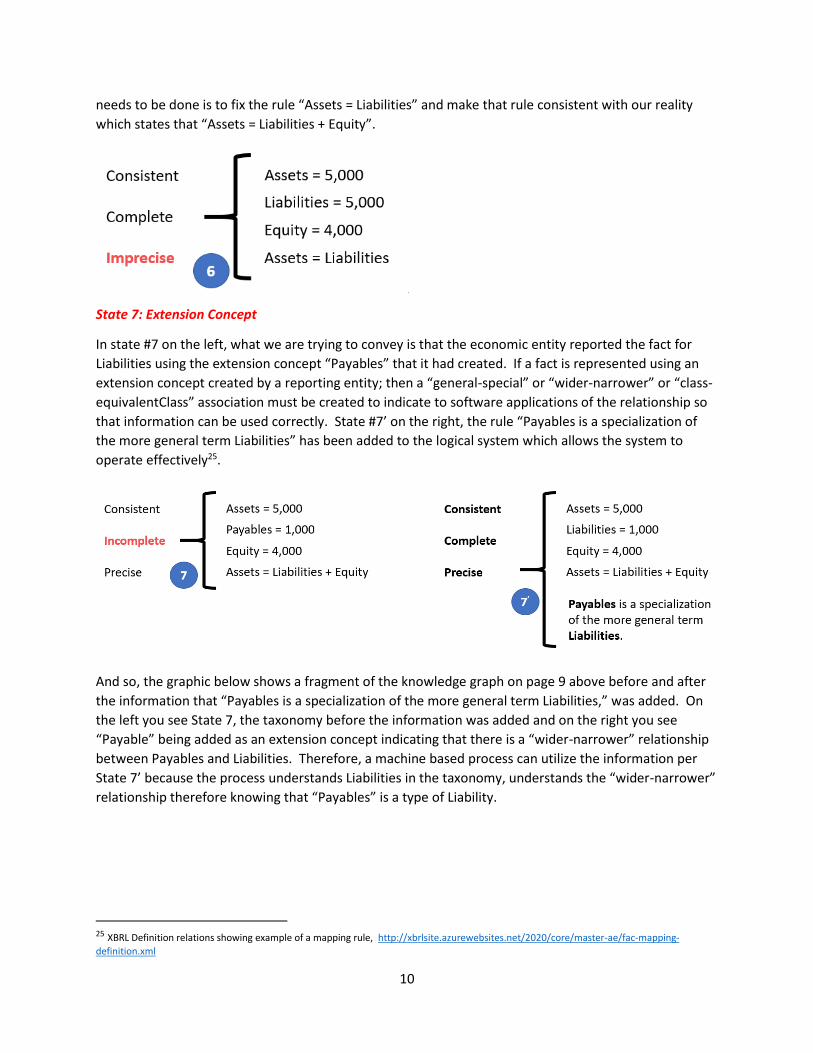
State 7: Extension Concept
In state #7 on the left, what we are trying to convey is that the economic entity reported the fact for
Liabilities using the extension concept “Payables” that it had created. If a fact is represented using an
extension concept created by a reporting entity; then a “general-special” or “wider-narrower” or “class-
equivalentClass” association must be created to indicate to software applications of the relationship so
that information can be used correctly. State #7’ on the right, the rule “Payables is a specialization of
the more general term Liabilities” has been added to the logical system which allows the system to
operate effectively25.
And so, the graphic below shows a fragment of the knowledge graph on page 9 above before and after
the information that “Payables is a specialization of the more general term Liabilities,” was added. On
the left you see State 7, the taxonomy before the information was added and on the right you see
“Payable” being added as an extension concept indicating that there is a “wider-narrower” relationship
between Payables and Liabilities. Therefore, a machine based process can utilize the information per
State 7’ because the process understands Liabilities in the taxonomy, understands the “wider-narrower”
relationship therefore knowing that “Payables” is a type of Liability.
25 XBRL Definition relations showing example of a mapping rule, http://xbrlsite.azurewebsites.net/2020/core/master-ae/fac-mapping-
definition.xml
11
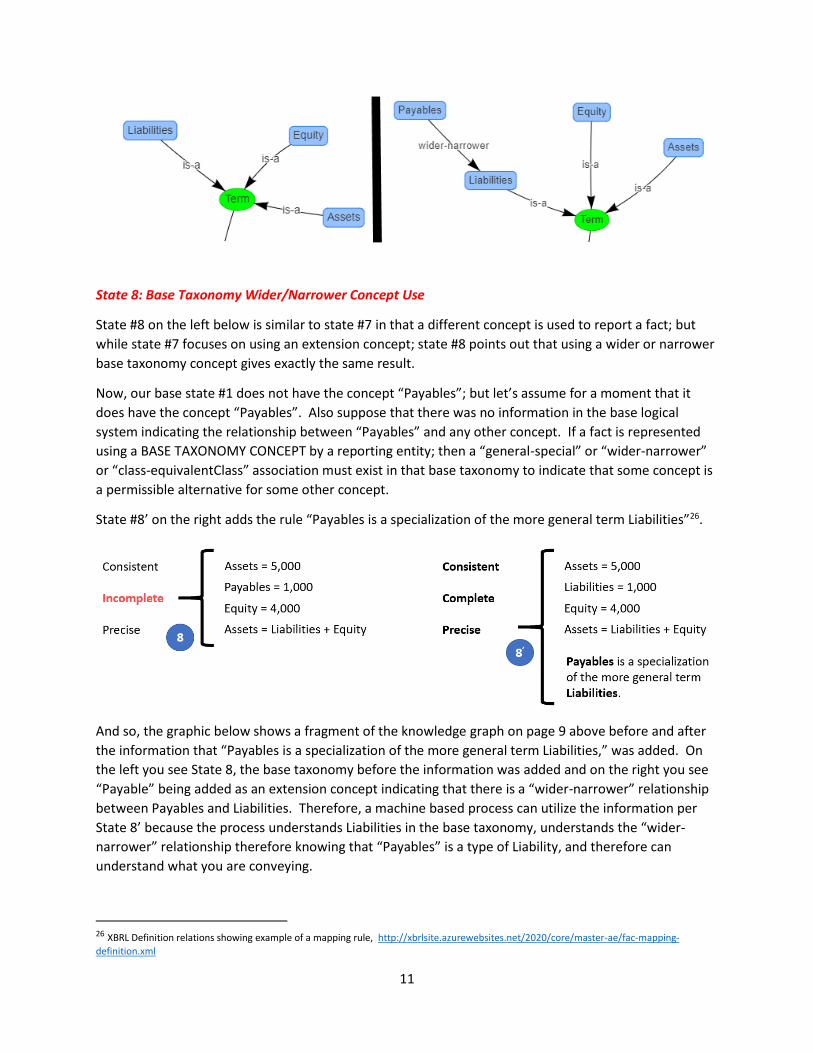
State 8: Base Taxonomy Wider/Narrower Concept Use
State #8 on the left below is similar to state #7 in that a different concept is used to report a fact; but
while state #7 focuses on using an extension concept; state #8 points out that using a wider or narrower
base taxonomy concept gives exactly the same result.
Now, our base state #1 does not have the concept “Payables”; but let’s assume for a moment that it
does have the concept “Payables”. Also suppose that there was no information in the base logical
system indicating the relationship between “Payables” and any other concept. If a fact is represented
using a BASE TAXONOMY CONCEPT by a reporting entity; then a “general-special” or “wider-narrower”
or “class-equivalentClass” association must exist in that base taxonomy to indicate that some concept is
a permissible alternative for some other concept.
State #8’ on the right adds the rule “Payables is a specialization of the more general term Liabilities”26.
And so, the graphic below shows a fragment of the knowledge graph on page 9 above before and after
the information that “Payables is a specialization of the more general term Liabilities,” was added. On
the left you see State 8, the base taxonomy before the information was added and on the right you see
“Payable” being added as an extension concept indicating that there is a “wider-narrower” relationship
between Payables and Liabilities. Therefore, a machine based process can utilize the information per
State 8’ because the process understands Liabilities in the base taxonomy, understands the “wider-
narrower” relationship therefore knowing that “Payables” is a type of Liability, and therefore can
understand what you are conveying.
26 XBRL Definition relations showing example of a mapping rule, http://xbrlsite.azurewebsites.net/2020/core/master-ae/fac-mapping-
definition.xml
12
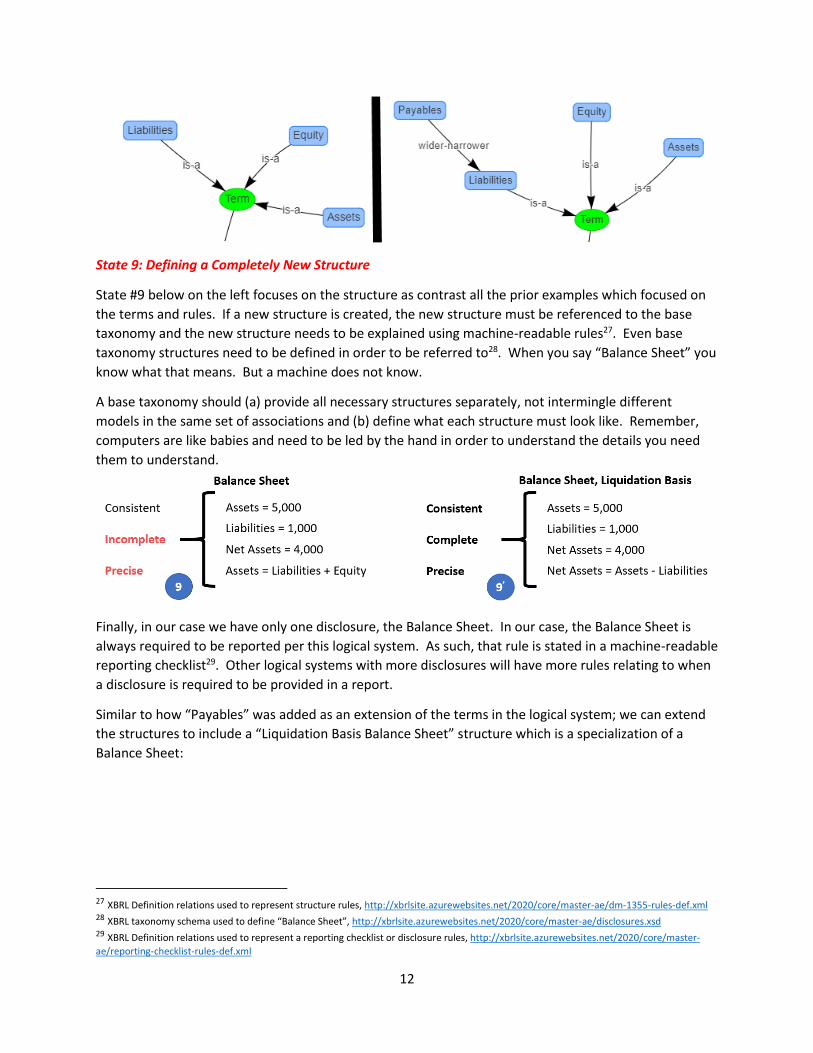
State 9: Defining a Completely New Structure
State #9 below on the left focuses on the structure as contrast all the prior examples which focused on
the terms and rules. If a new structure is created, the new structure must be referenced to the base
taxonomy and the new structure needs to be explained using machine-readable rules27. Even base
taxonomy structures need to be defined in order to be referred to28. When you say “Balance Sheet” you
know what that means. But a machine does not know.
A base taxonomy should (a) provide all necessary structures separately, not intermingle different
models in the same set of associations and (b) define what each structure must look like. Remember,
computers are like babies and need to be led by the hand in order to understand the details you need
them to understand.
Finally, in our case we have only one disclosure, the Balance Sheet. In our case, the Balance Sheet is
always required to be reported per this logical system. As such, that rule is stated in a machine-readable
reporting checklist29. Other logical systems with more disclosures will have more rules relating to when
a disclosure is required to be provided in a report.
Similar to how “Payables” was added as an extension of the terms in the logical system; we can extend
the structures to include a “Liquidation Basis Balance Sheet” structure which is a specialization of a
Balance Sheet:
27 XBRL Definition relations used to represent structure rules, http://xbrlsite.azurewebsites.net/2020/core/master-ae/dm-1355-rules-def.xml 28 XBRL taxonomy schema used to define “Balance Sheet”, http://xbrlsite.azurewebsites.net/2020/core/master-ae/disclosures.xsd 29 XBRL Definition relations used to represent a reporting checklist or disclosure rules, http://xbrlsite.azurewebsites.net/2020/core/master-
ae/reporting-checklist-rules-def.xml
13
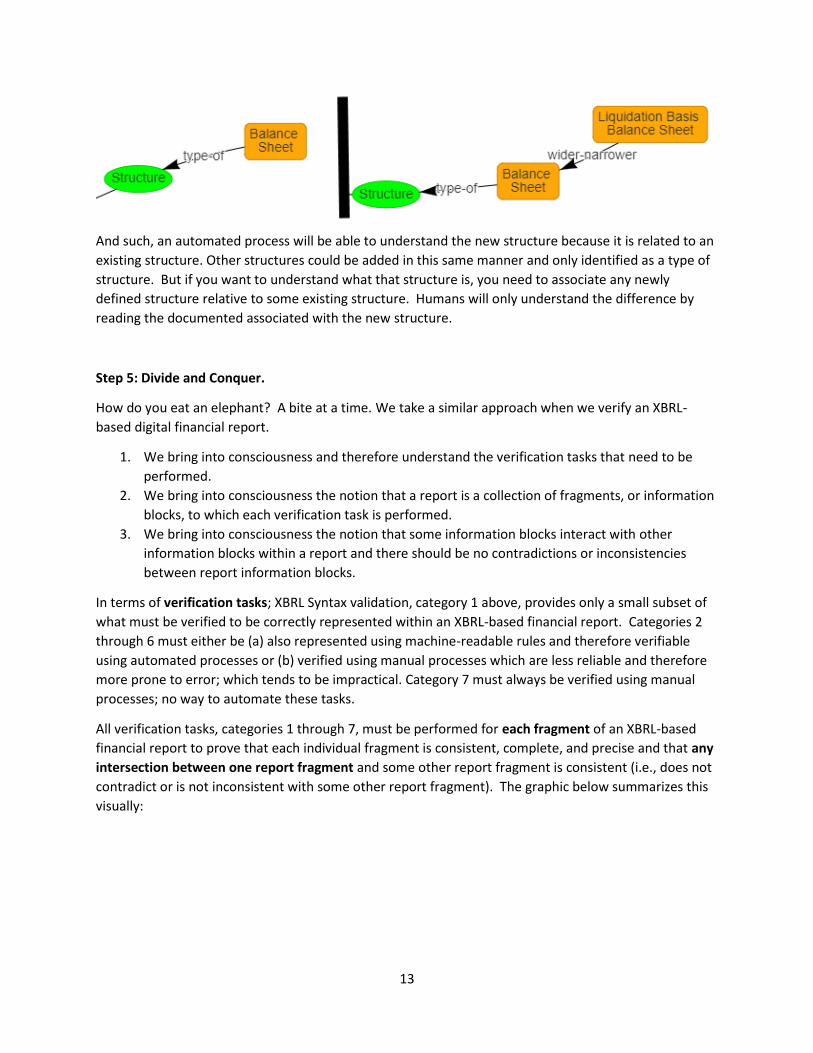
And such, an automated process will be able to understand the new structure because it is related to an
existing structure. Other structures could be added in this same manner and only identified as a type of
structure. But if you want to understand what that structure is, you need to associate any newly
defined structure relative to some existing structure. Humans will only understand the difference by
reading the documented associated with the new structure.
Step 5: Divide and Conquer.
How do you eat an elephant? A bite at a time. We take a similar approach when we verify an XBRL-
based digital financial report.
1. We bring into consciousness and therefore understand the verification tasks that need to be
performed.
2. We bring into consciousness the notion that a report is a collection of fragments, or information
blocks, to which each verification task is performed.
3. We bring into consciousness the notion that some information blocks interact with other
information blocks within a report and there should be no contradictions or inconsistencies
between report information blocks.
In terms of verification tasks; XBRL Syntax validation, category 1 above, provides only a small subset of
what must be verified to be correctly represented within an XBRL-based financial report. Categories 2
through 6 must either be (a) also represented using machine-readable rules and therefore verifiable
using automated processes or (b) verified using manual processes which are less reliable and therefore
more prone to error; which tends to be impractical. Category 7 must always be verified using manual
processes; no way to automate these tasks.
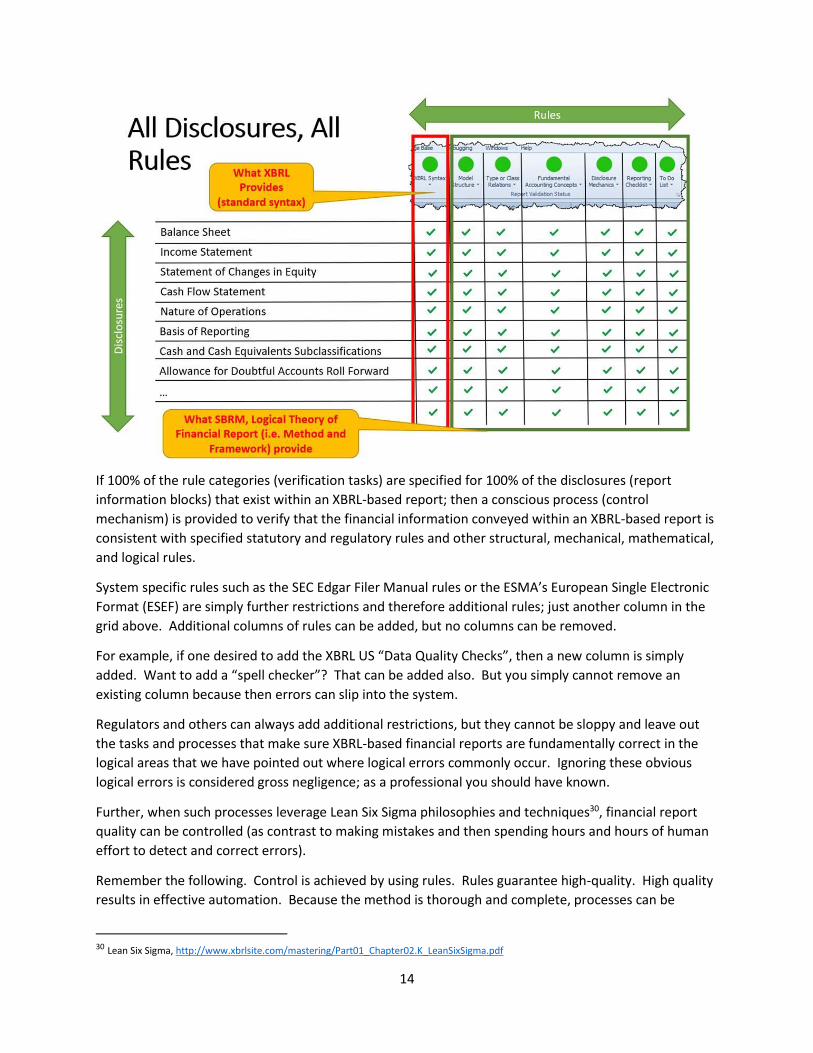
All verification tasks, categories 1 through 7, must be performed for each fragment of an XBRL-based
financial report to prove that each individual fragment is consistent, complete, and precise and that any
intersection between one report fragment and some other report fragment is consistent (i.e., does not
contradict or is not inconsistent with some other report fragment). The graphic below summarizes this
visually:
14
If 100% of the rule categories (verification tasks) are specified for 100% of the disclosures (report
information blocks) that exist within an XBRL-based report; then a conscious process (control
mechanism) is provided to verify that the financial information conveyed within an XBRL-based report is
consistent with specified statutory and regulatory rules and other structural, mechanical, mathematical,
and logical rules.
System specific rules such as the SEC Edgar Filer Manual rules or the ESMA’s European Single Electronic
Format (ESEF) are simply further restrictions and therefore additional rules; just another column in the
grid above. Additional columns of rules can be added, but no columns can be removed.
For example, if one desired to add the XBRL US “Data Quality Checks”, then a new column is simply
added. Want to add a “spell checker”? That can be added also. But you simply cannot remove an
existing column because then errors can slip into the system.
Regulators and others can always add additional restrictions, but they cannot be sloppy and leave out
the tasks and processes that make sure XBRL-based financial reports are fundamentally correct in the
logical areas that we have pointed out where logical errors commonly occur. Ignoring these obvious
logical errors is considered gross negligence; as a professional you should have known.
Further, when such processes leverage Lean Six Sigma philosophies and techniques30, financial report
quality can be controlled (as contrast to making mistakes and then spending hours and hours of human
effort to detect and correct errors).
Remember the following. Control is achieved by using rules. Rules guarantee high-quality. High quality
results in effective automation. Because the method is thorough and complete, processes can be
30 Lean Six Sigma, http://www.xbrlsite.com/mastering/Part01_Chapter02.K_LeanSixSigma.pdf
15
effectively automated. How exactly can you be sure your financial report is a true and fair
representation of the financial position and financial performance of your entity without testing it to be
sure the report is working effectively? If you cannot measure it, you cannot control it.
Process automation and automated verification reduces the risk of noncompliance. Hope and chance
are not good strategies for complying with statutory and regulatory reporting rules.
Being able to effectively exchange information between processes which enables the automation of
those processes provides social benefit. Among those benefits are cost reduction, process quality
improvement, ability to provide new products/services, and improved functioning of capital markets
resulting from these process improvements.
So, we will start small and explain step-by-step how this method works. We will start with a tiny
financial report where we represent the apex of double entry accounting, the accounting equation.
From the accounting equation we increase the number of disclosures (fragments) from one to three.
Common elements of financial reports increase things more. Proof adds sophistication of reported
components. Then the MINI Financial Reporting Scheme helps you see what a basic financial reporting
scheme looks like31. Finally, we apply this method to a real XBRL-based financial report, the Microsoft
10-K.
Step 6: Examining Incrementally Larger XBRL-based Financial Reports.
We are now going to walk through incrementally larger and larger XBRL-based financial reports to help
you understand, and believe, that the simple accounting equation examples of impediments to a
properly functioning logical system can explain common things that go wrong in significantly larger
XBRL-based financial reports such as annual financial reports submitted to the SEC or ESMA.
But, let’s start small and grow your understanding!
Accounting Equation
The accounting equation represents the fundamental model of double entry accounting: Assets =
Liabilities + Equity. This implies three terms: Assets, Liabilities, Equity. A report created to represent the
accounting equation in the form of an XBRL-based digital financial report would include:
• Three terms: Assets, Liabilities, Equity
• One structure: Balance Sheet
• Three associations: Assets is part of a Balance Sheet; Liabilities is part of a Balance Sheet; Equity
is part of a Balance Sheet.
• One rule: Assets = Liabilities + Equity
• Three facts: Assets of 5000; Liabilities of 1000; Equity of 4000
31 Updated Luca Documenation and Tutorials, http://xbrl.squarespace.com/journal/2021/10/11/updated-luca-tutorial-documentation-learn-
about-digital-fina.html
16
There are other unimportant details that you could deal with but which we will ignore here such as
labels, languages, currency units, and so forth. All of these details are handled by XBRL and the
examination of a detailed example can help you understand those details32.
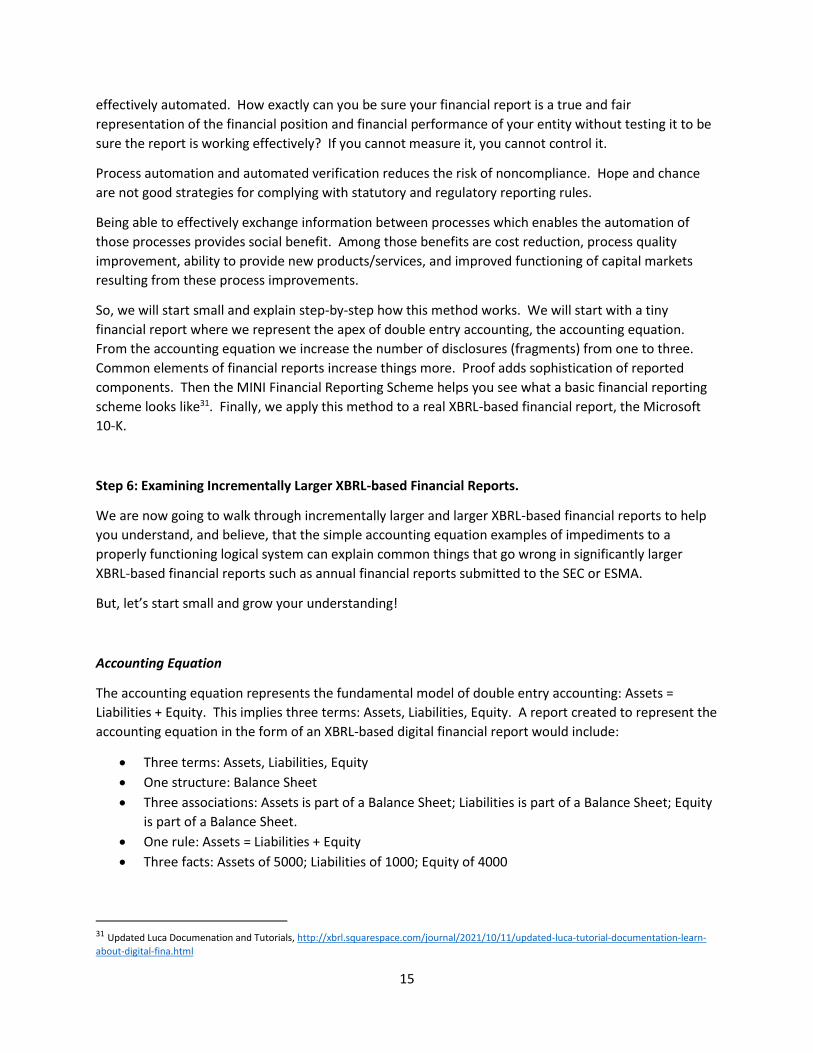
Our focus is on a higher. We want to help you see that a report is made up of blocks of information,
that disclosures are represented using these blocks of information, and that you can determine whether
your report contains all the required disclosures represented by the blocks of information.
Visually, this is what our tiny accounting equation report would look like in an application that can load
such an XBRL-based digital financial report:
The following provides a summary of the details we will be focusing on from an XBRL-based financial
report. We will be focusing on these specific details in the other report examples as we build up to what
an accountant would consider to be a real example of a financial report.
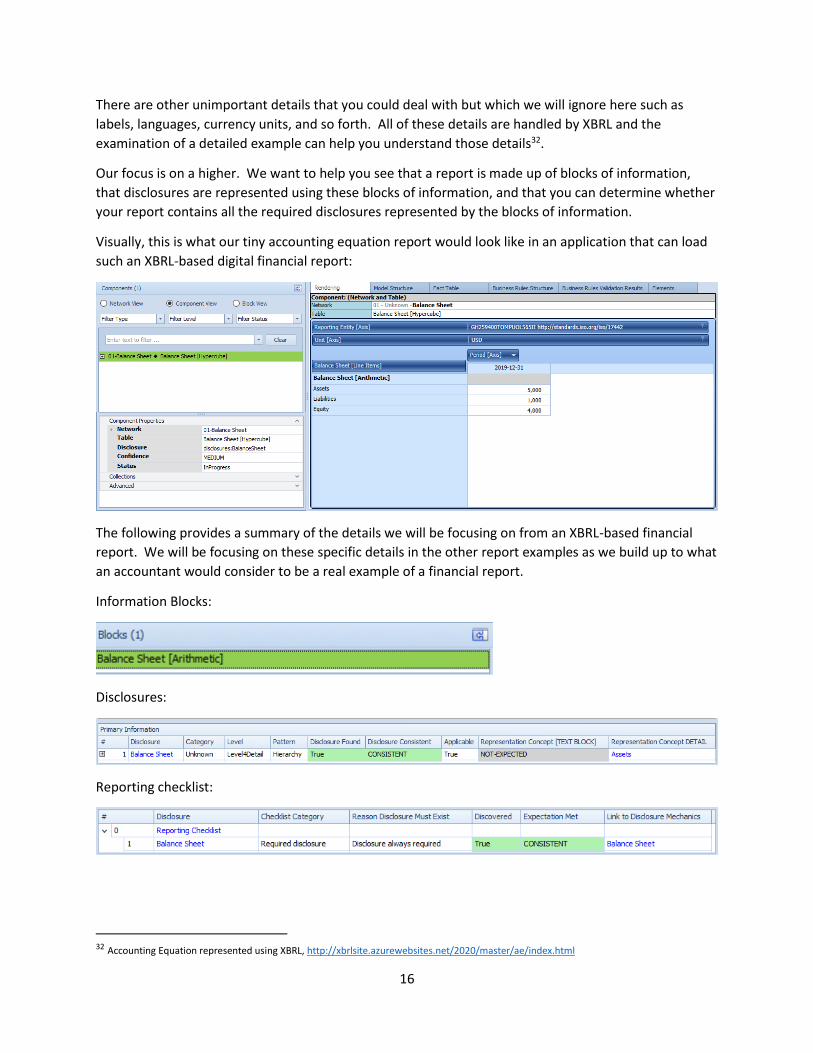
Information Blocks:
Disclosures:
Reporting checklist:
32 Accounting Equation represented using XBRL, http://xbrlsite.azurewebsites.net/2020/master/ae/index.html
17
We are going to take the time to describe what you should be focusing on as you proceed through the
coming examples. The objective is to see and understand the similarities, or patterns, that exist for each
of these small reports and also for the larger “real” XBRL-based digital financial report.
In this accounting equation example, we see that:
• We have one information block, “Balance Sheet [Arithmetic]”
• That single information block is used to represent the one disclosure in this example, “Balance
Sheet” disclosure.
o This disclosure follows the mechanical rules for representing that disclosure using the
XBRL technical syntax.
• The reporting checklist specifies that the disclosure “Balance Sheet” is required to exist.
All of the above is enforced using XBRL-based machine-readable rules that, when processed by a
logic/rules/reasoning engine, can determine if a block of information is properly functioning.
Our focus here is not on those rules or how the rules are processed. Our focus is on the blocks of
information; that each block of information can be verified to be properly functioning, complete, and
precise; and that if we can do this for one block of information then the same technique can be applied
to other blocks of information in a similar manner.
The accounting equation example has exactly one block of information that is used to represent one
disclosure that is the one required fragment that needs to exist within this tiny financial report we have
specified as the accounting equation. But let’s now expand our example slightly.
SFAC 6
SFAC 6 represents the Elements of Financial Statements33 defined by the FASB in SFAC 6. SFAC 6 builds
on the accounting equation and adds a handful of additional elements. The elements are: Assets,
Liabilities, Equity, Comprehensive Income, Revenues, Expenses, Gains, Losses, Investments by Owners,
Distributions to Owners. The 10 elements are organized into three structures: Balance sheet,
Comprehensive Income, Changes in Equity. There are three rules that describe the mathematical
relationships of the elements: Assets = Liabilities + Equity; Comprehensive Income = Revenues -
Expenses + Gains - Losses; EquityT1 = EquityT0 + Comprehensive Income + Investments by Owners -
Distributions to owners.
We are not going to explain all the details, but will rather focus on the specific details which help the
reader see the patterns we are pointing out.
33 SFAC 6 representation, http://xbrlsite.azurewebsites.net/2020/master/sfac6/index.html
18
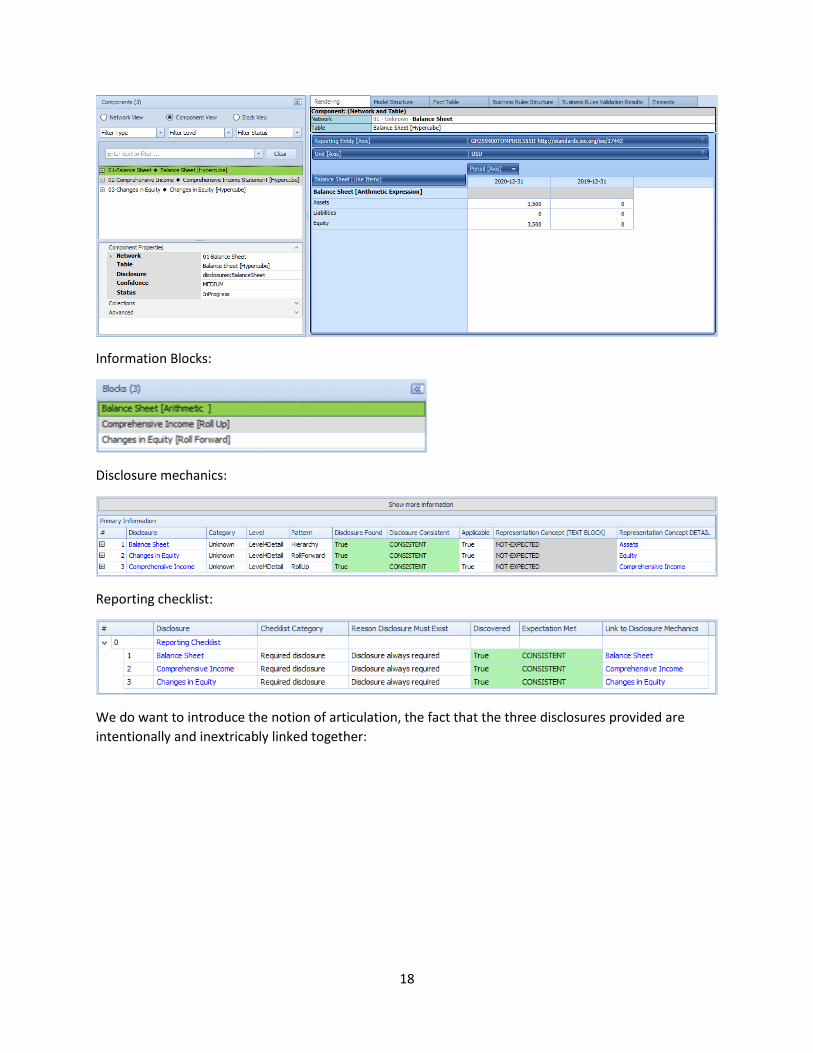
Information Blocks:
Disclosure mechanics:
Reporting checklist:
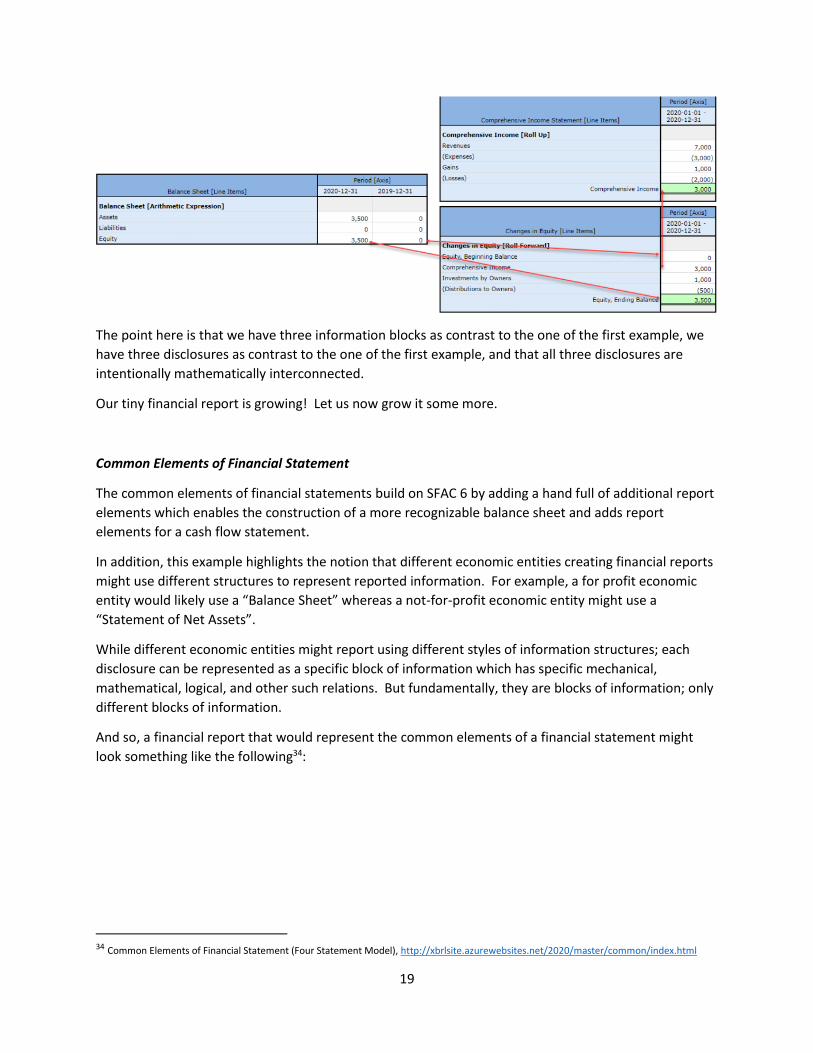
We do want to introduce the notion of articulation, the fact that the three disclosures provided are
intentionally and inextricably linked together:
19
The point here is that we have three information blocks as contrast to the one of the first example, we
have three disclosures as contrast to the one of the first example, and that all three disclosures are
intentionally mathematically interconnected.
Our tiny financial report is growing! Let us now grow it some more.
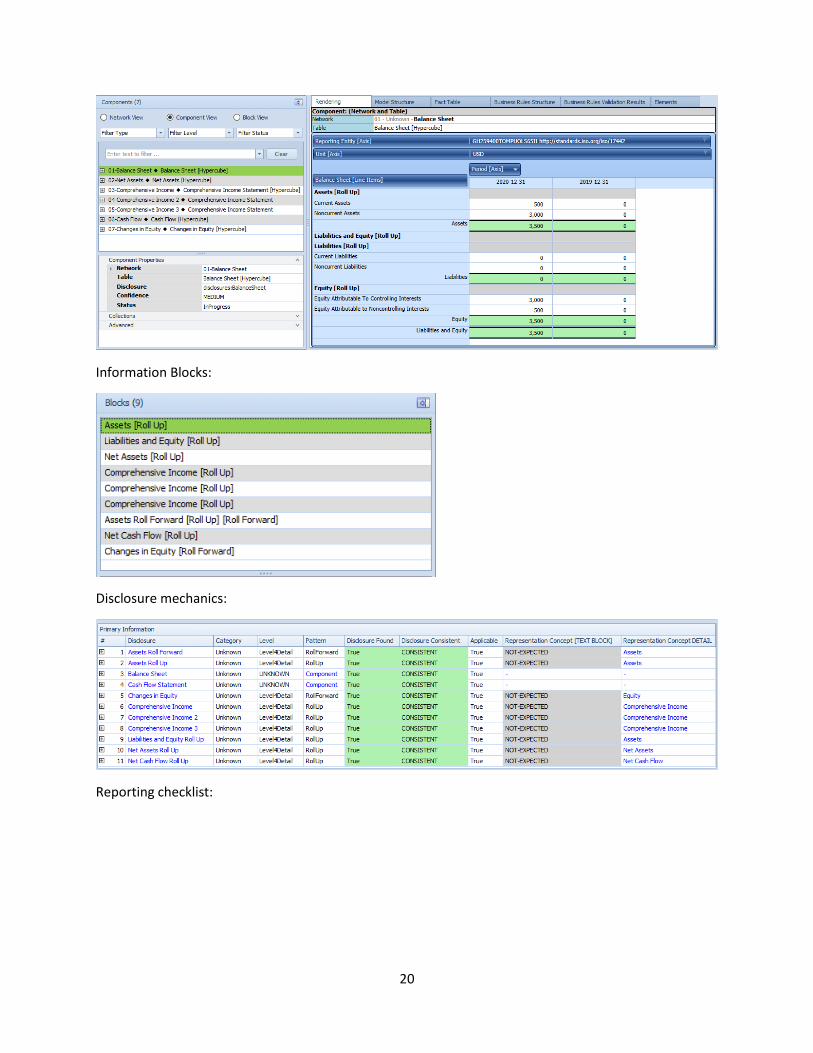
Common Elements of Financial Statement
The common elements of financial statements build on SFAC 6 by adding a hand full of additional report
elements which enables the construction of a more recognizable balance sheet and adds report
elements for a cash flow statement.
In addition, this example highlights the notion that different economic entities creating financial reports
might use different structures to represent reported information. For example, a for profit economic
entity would likely use a “Balance Sheet” whereas a not-for-profit economic entity might use a
“Statement of Net Assets”.
While different economic entities might report using different styles of information structures; each
disclosure can be represented as a specific block of information which has specific mechanical,
mathematical, logical, and other such relations. But fundamentally, they are blocks of information; only
different blocks of information.
And so, a financial report that would represent the common elements of a financial statement might
look something like the following34:
34 Common Elements of Financial Statement (Four Statement Model), http://xbrlsite.azurewebsites.net/2020/master/common/index.html
20
Information Blocks:
Disclosure mechanics:
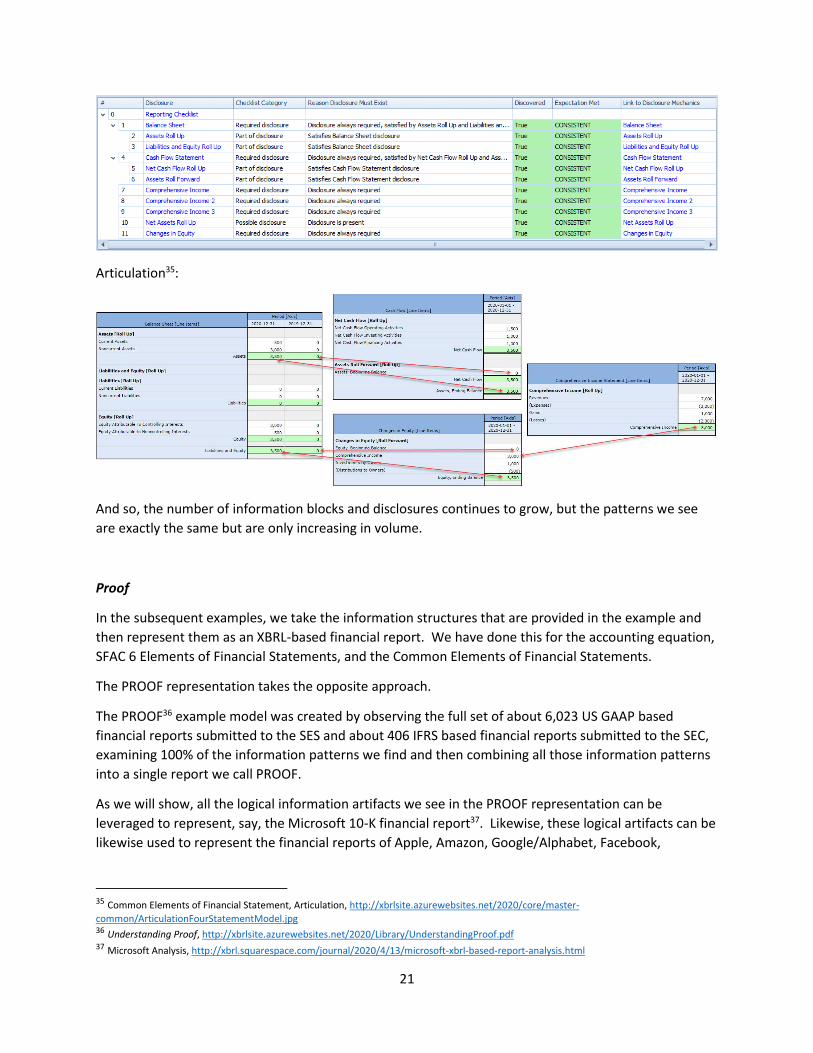
Reporting checklist:
21
Articulation35:
And so, the number of information blocks and disclosures continues to grow, but the patterns we see
are exactly the same but are only increasing in volume.
Proof
In the subsequent examples, we take the information structures that are provided in the example and
then represent them as an XBRL-based financial report. We have done this for the accounting equation,
SFAC 6 Elements of Financial Statements, and the Common Elements of Financial Statements.
The PROOF representation takes the opposite approach.
The PROOF36 example model was created by observing the full set of about 6,023 US GAAP based
financial reports submitted to the SES and about 406 IFRS based financial reports submitted to the SEC,
examining 100% of the information patterns we find and then combining all those information patterns
into a single report we call PROOF.
As we will show, all the logical information artifacts we see in the PROOF representation can be
leveraged to represent, say, the Microsoft 10-K financial report37. Likewise, these logical artifacts can be
likewise used to represent the financial reports of Apple, Amazon, Google/Alphabet, Facebook,
35 Common Elements of Financial Statement, Articulation, http://xbrlsite.azurewebsites.net/2020/core/master-
common/ArticulationFourStatementModel.jpg 36 Understanding Proof, http://xbrlsite.azurewebsites.net/2020/Library/UnderstandingProof.pdf 37 Microsoft Analysis, http://xbrl.squarespace.com/journal/2020/4/13/microsoft-xbrl-based-report-analysis.html
22
Salesforce38. Likewise, these logical artifacts are all that you need to represent any one of the 6,023 10-
K financial reports which submits information using XBRL to the SEC using the US GAAP or IFRS financial
reporting schemes39.
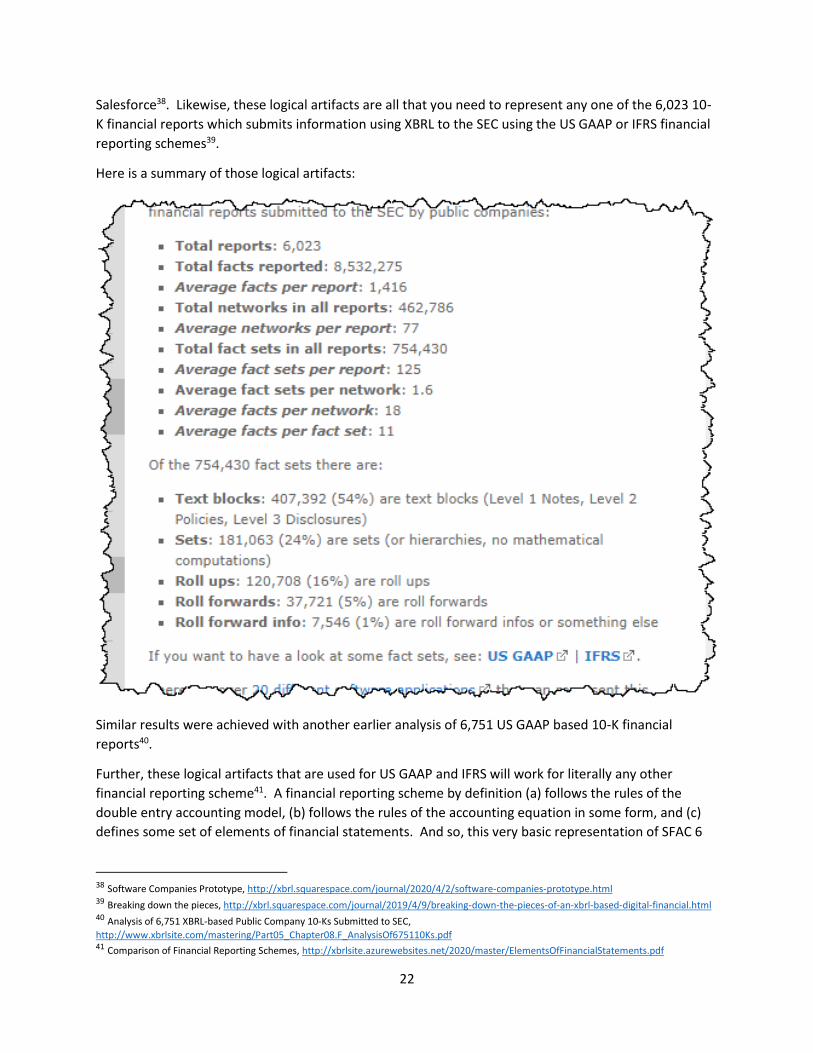
Here is a summary of those logical artifacts:
Similar results were achieved with another earlier analysis of 6,751 US GAAP based 10-K financial
reports40.
Further, these logical artifacts that are used for US GAAP and IFRS will work for literally any other
financial reporting scheme41. A financial reporting scheme by definition (a) follows the rules of the
double entry accounting model, (b) follows the rules of the accounting equation in some form, and (c)
defines some set of elements of financial statements. And so, this very basic representation of SFAC 6
38 Software Companies Prototype, http://xbrl.squarespace.com/journal/2020/4/2/software-companies-prototype.html 39 Breaking down the pieces, http://xbrl.squarespace.com/journal/2019/4/9/breaking-down-the-pieces-of-an-xbrl-based-digital-financial.html 40 Analysis of 6,751 XBRL-based Public Company 10-Ks Submitted to SEC,
http://www.xbrlsite.com/mastering/Part05_Chapter08.F_AnalysisOf675110Ks.pdf 41 Comparison of Financial Reporting Schemes, http://xbrlsite.azurewebsites.net/2020/master/ElementsOfFinancialStatements.pdf
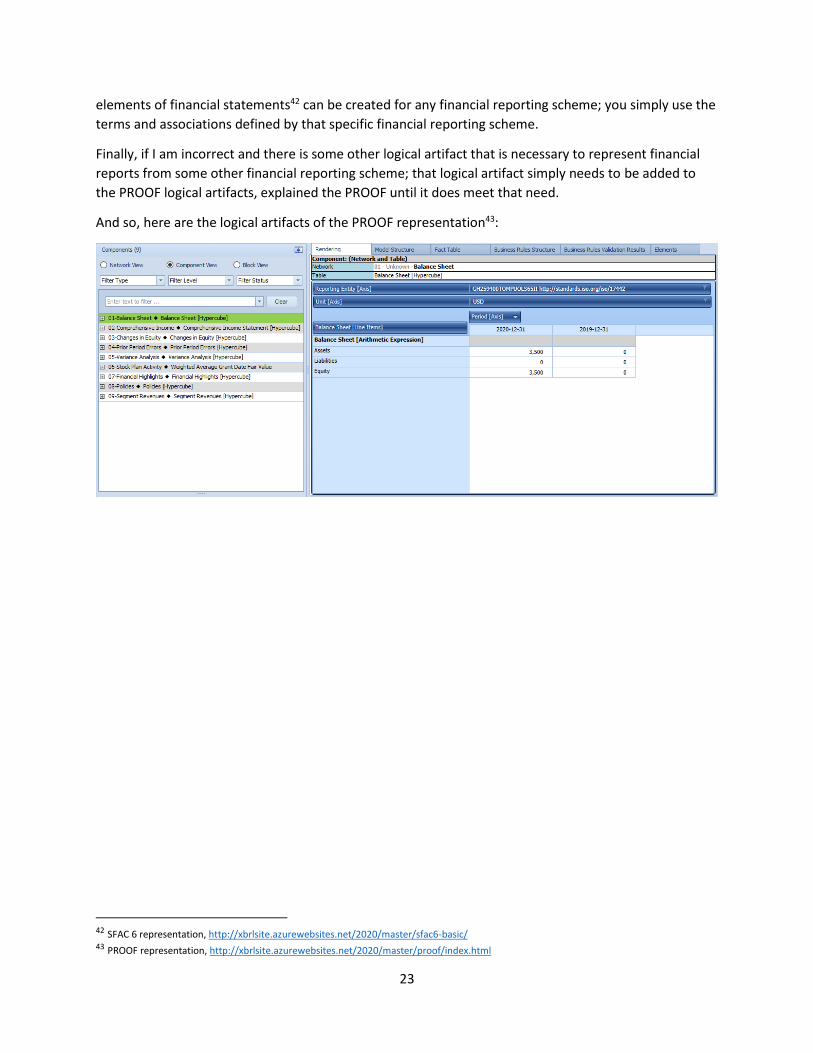
23
elements of financial statements42 can be created for any financial reporting scheme; you simply use the
terms and associations defined by that specific financial reporting scheme.
Finally, if I am incorrect and there is some other logical artifact that is necessary to represent financial
reports from some other financial reporting scheme; that logical artifact simply needs to be added to
the PROOF logical artifacts, explained the PROOF until it does meet that need.
And so, here are the logical artifacts of the PROOF representation43:
42 SFAC 6 representation, http://xbrlsite.azurewebsites.net/2020/master/sfac6-basic/ 43 PROOF representation, http://xbrlsite.azurewebsites.net/2020/master/proof/index.html
24
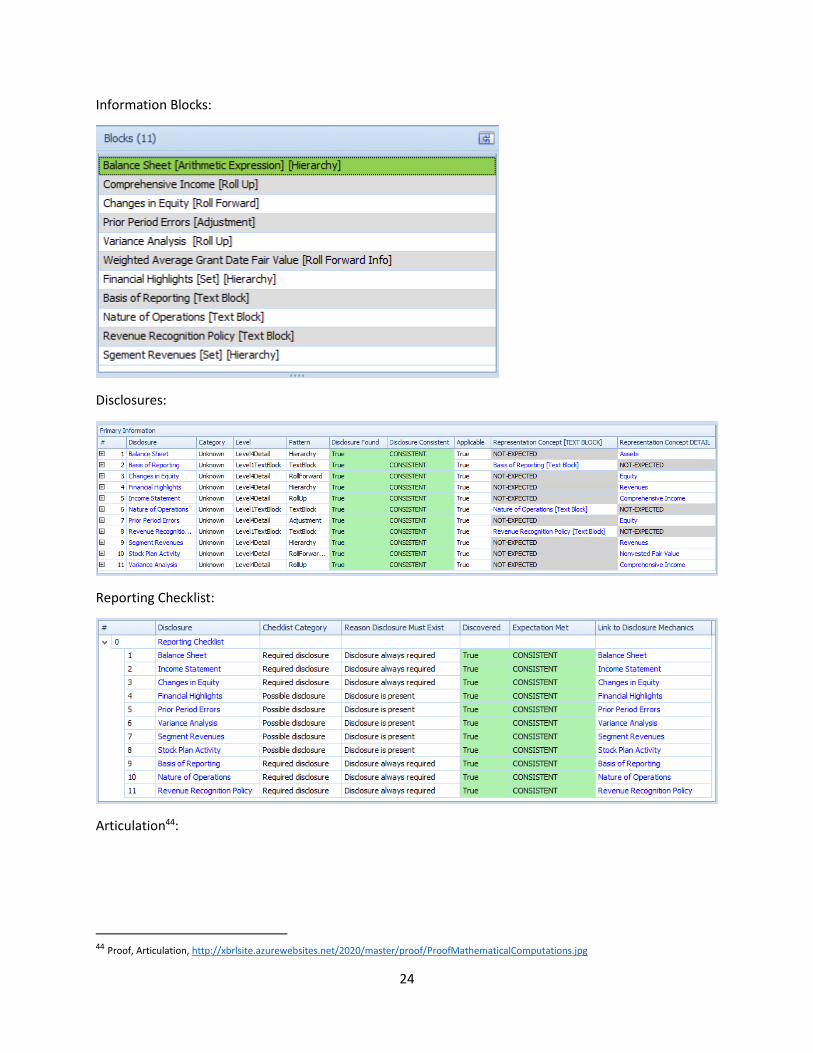
Information Blocks:
Disclosures:
Reporting Checklist:
Articulation44:
44 Proof, Articulation, http://xbrlsite.azurewebsites.net/2020/master/proof/ProofMathematicalComputations.jpg
25
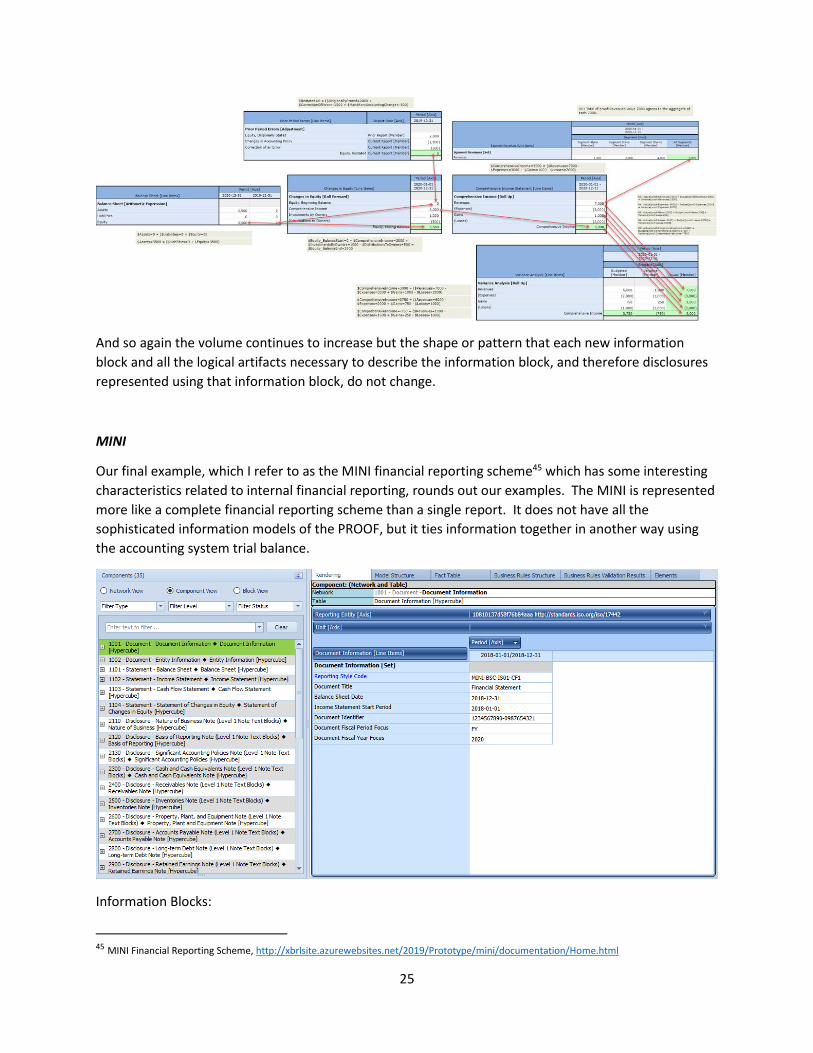
And so again the volume continues to increase but the shape or pattern that each new information
block and all the logical artifacts necessary to describe the information block, and therefore disclosures
represented using that information block, do not change.
MINI
Our final example, which I refer to as the MINI financial reporting scheme45 which has some interesting
characteristics related to internal financial reporting, rounds out our examples. The MINI is represented
more like a complete financial reporting scheme than a single report. It does not have all the
sophisticated information models of the PROOF, but it ties information together in another way using
the accounting system trial balance.
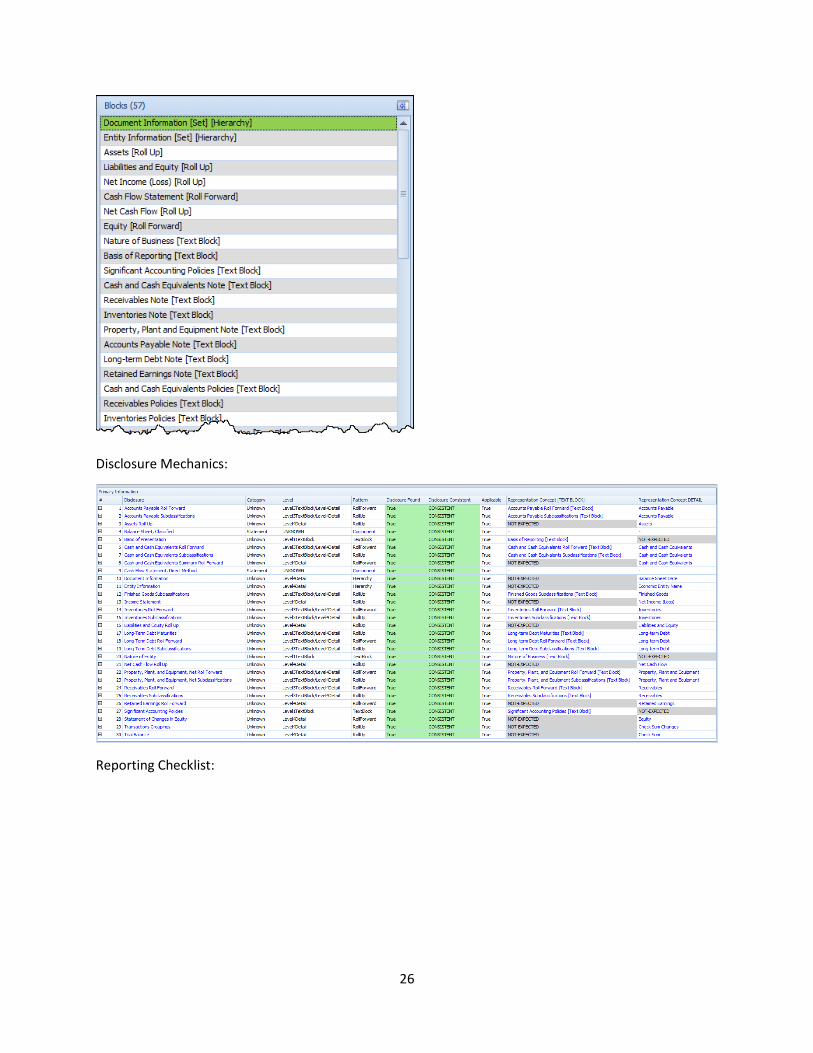
Information Blocks:
45 MINI Financial Reporting Scheme, http://xbrlsite.azurewebsites.net/2019/Prototype/mini/documentation/Home.html
26
Disclosure Mechanics:
Reporting Checklist:
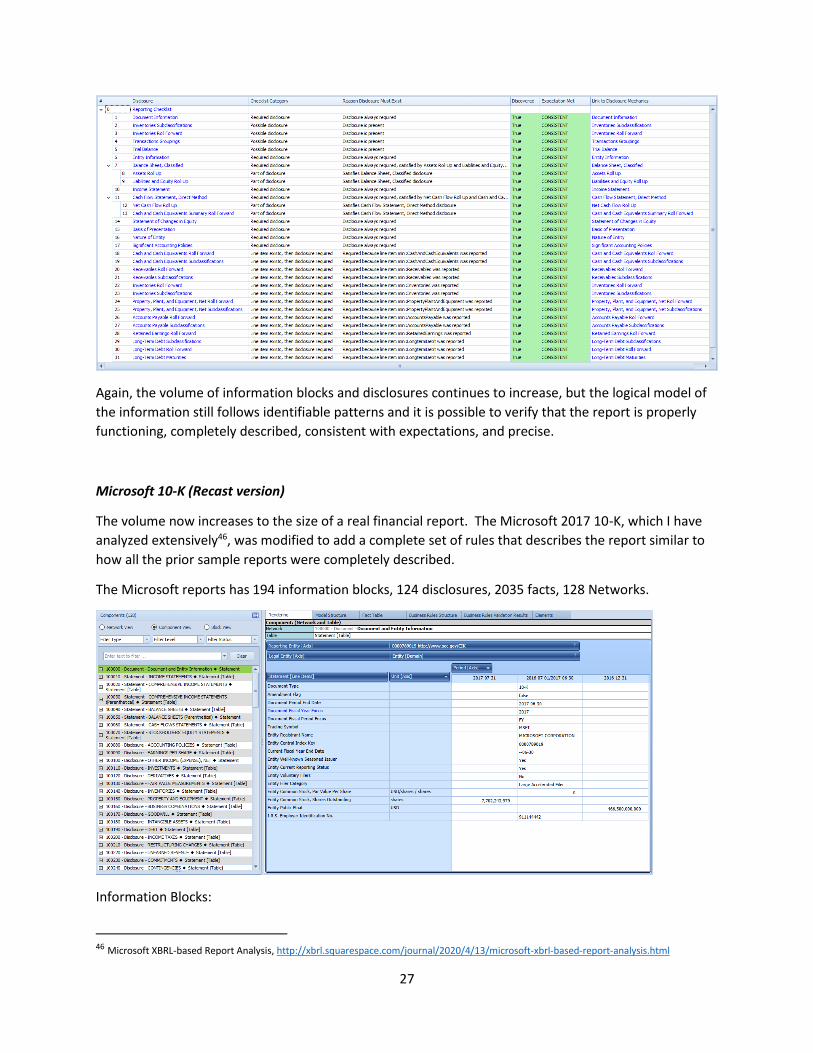
27
Again, the volume of information blocks and disclosures continues to increase, but the logical model of
the information still follows identifiable patterns and it is possible to verify that the report is properly
functioning, completely described, consistent with expectations, and precise.
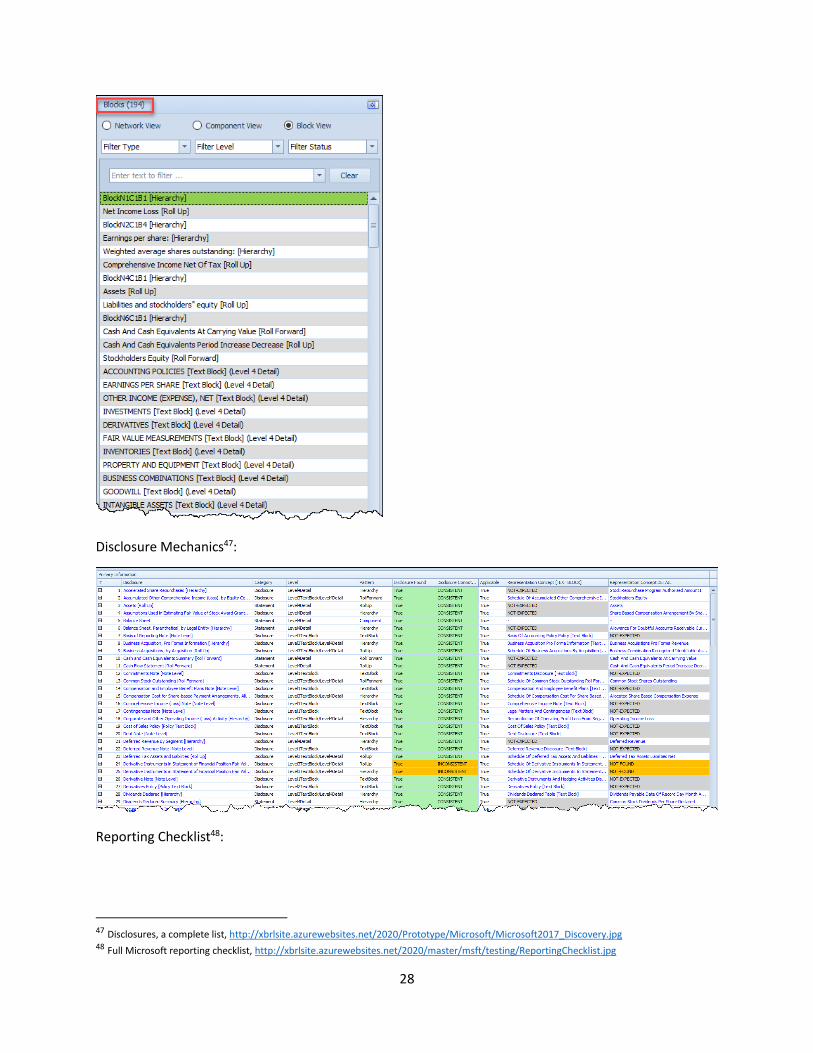
Microsoft 10-K (Recast version)
The volume now increases to the size of a real financial report. The Microsoft 2017 10-K, which I have
analyzed extensively46, was modified to add a complete set of rules that describes the report similar to
how all the prior sample reports were completely described.
The Microsoft reports has 194 information blocks, 124 disclosures, 2035 facts, 128 Networks.
Information Blocks:
46 Microsoft XBRL-based Report Analysis, http://xbrl.squarespace.com/journal/2020/4/13/microsoft-xbrl-based-report-analysis.html
28
Disclosure Mechanics47:
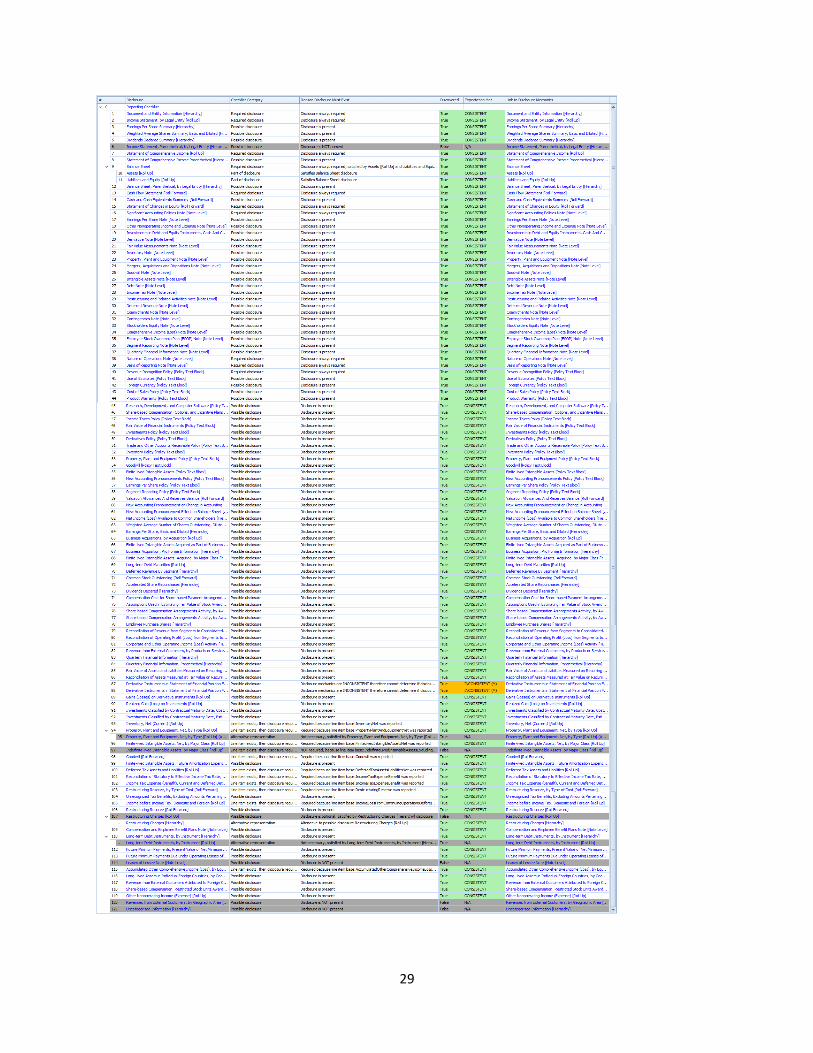
Reporting Checklist48:
47 Disclosures, a complete list, http://xbrlsite.azurewebsites.net/2020/Prototype/Microsoft/Microsoft2017_Discovery.jpg 48 Full Microsoft reporting checklist, http://xbrlsite.azurewebsites.net/2020/master/msft/testing/ReportingChecklist.jpg
29
30
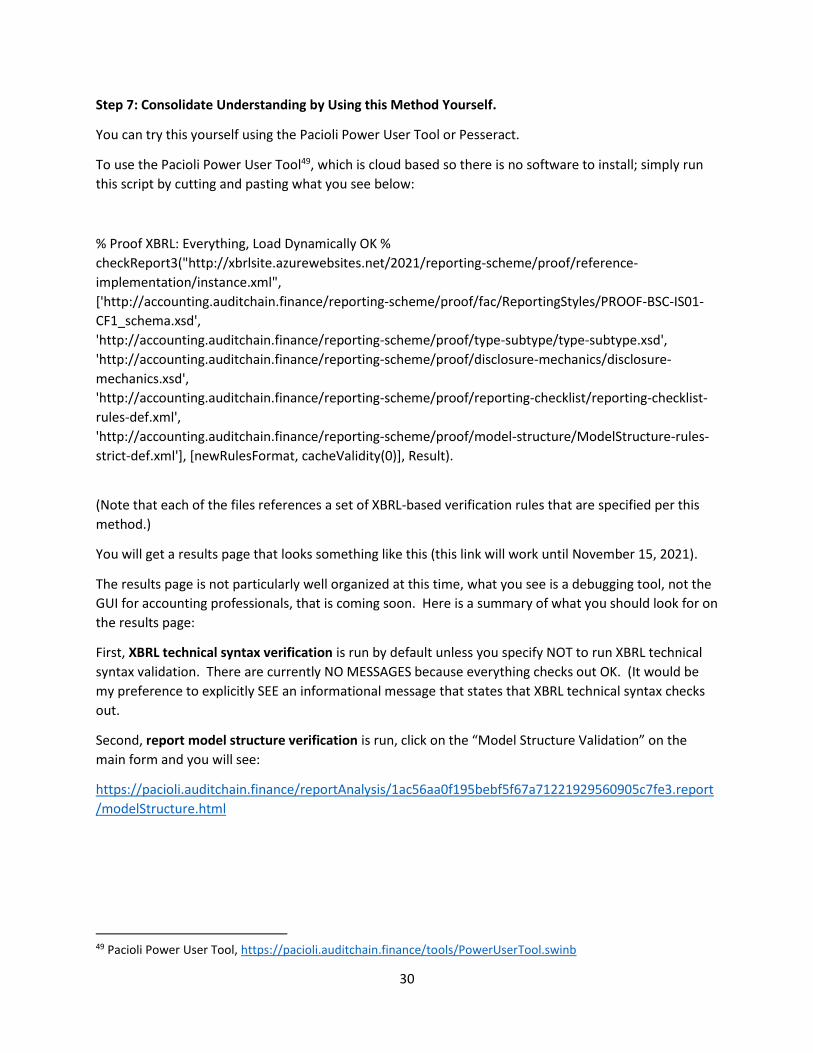
Step 7: Consolidate Understanding by Using this Method Yourself.
You can try this yourself using the Pacioli Power User Tool or Pesseract.
To use the Pacioli Power User Tool49, which is cloud based so there is no software to install; simply run
this script by cutting and pasting what you see below:
% Proof XBRL: Everything, Load Dynamically OK %
checkReport3("http://xbrlsite.azurewebsites.net/2021/reporting-scheme/proof/reference-
implementation/instance.xml",
['http://accounting.auditchain.finance/reporting-scheme/proof/fac/ReportingStyles/PROOF-BSC-IS01-
CF1_schema.xsd',
'http://accounting.auditchain.finance/reporting-scheme/proof/type-subtype/type-subtype.xsd',
'http://accounting.auditchain.finance/reporting-scheme/proof/disclosure-mechanics/disclosure-
mechanics.xsd',
'http://accounting.auditchain.finance/reporting-scheme/proof/reporting-checklist/reporting-checklist-
rules-def.xml',
'http://accounting.auditchain.finance/reporting-scheme/proof/model-structure/ModelStructure-rules-
strict-def.xml'], [newRulesFormat, cacheValidity(0)], Result).
(Note that each of the files references a set of XBRL-based verification rules that are specified per this
method.)
You will get a results page that looks something like this (this link will work until November 15, 2021).
The results page is not particularly well organized at this time, what you see is a debugging tool, not the
GUI for accounting professionals, that is coming soon. Here is a summary of what you should look for on
the results page:
First, XBRL technical syntax verification is run by default unless you specify NOT to run XBRL technical
syntax validation. There are currently NO MESSAGES because everything checks out OK. (It would be
my preference to explicitly SEE an informational message that states that XBRL technical syntax checks
out.
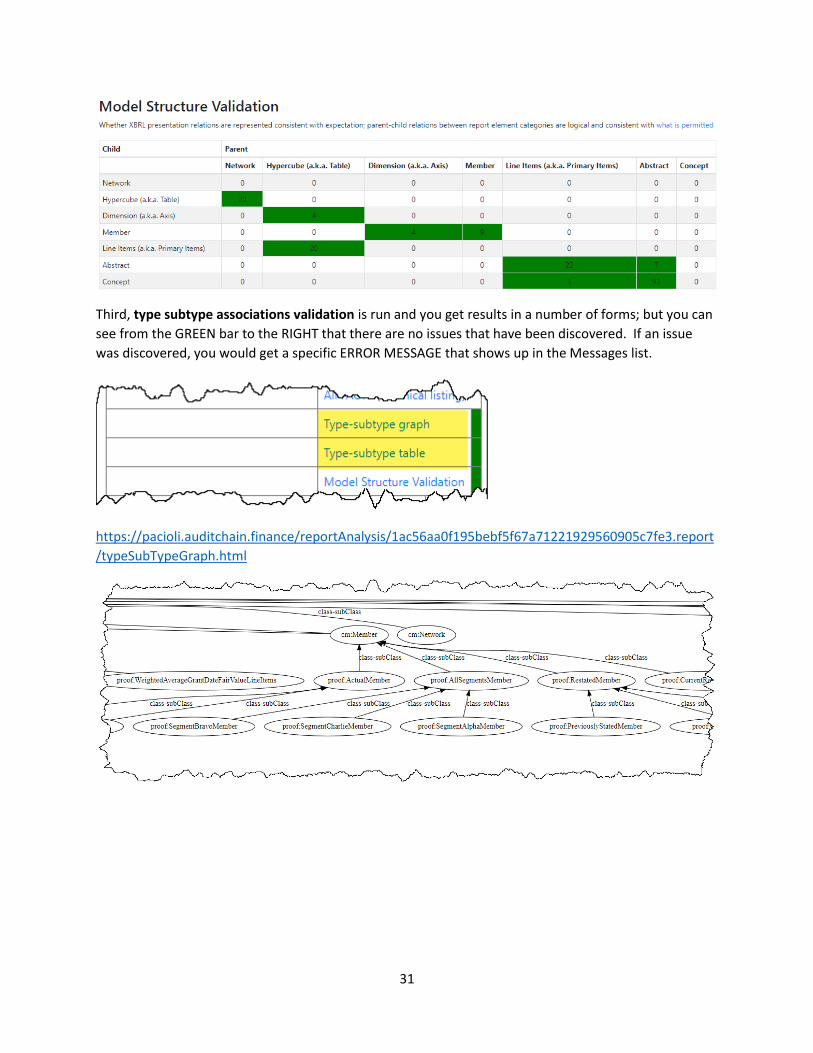
Second, report model structure verification is run, click on the “Model Structure Validation” on the
main form and you will see:
https://pacioli.auditchain.finance/reportAnalysis/1ac56aa0f195bebf5f67a71221929560905c7fe3.report
/modelStructure.html
49 Pacioli Power User Tool, https://pacioli.auditchain.finance/tools/PowerUserTool.swinb
31
Third, type subtype associations validation is run and you get results in a number of forms; but you can
see from the GREEN bar to the RIGHT that there are no issues that have been discovered. If an issue
was discovered, you would get a specific ERROR MESSAGE that shows up in the Messages list.
https://pacioli.auditchain.finance/reportAnalysis/1ac56aa0f195bebf5f67a71221929560905c7fe3.report
/typeSubTypeGraph.html
32
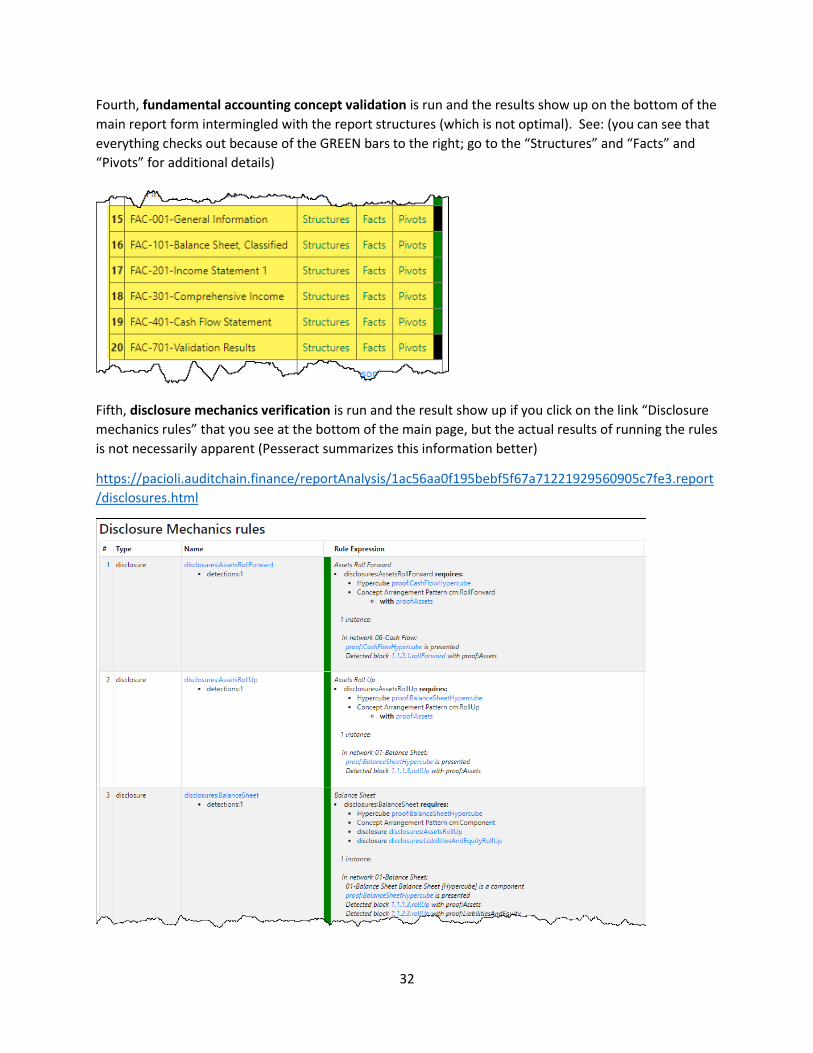
Fourth, fundamental accounting concept validation is run and the results show up on the bottom of the
main report form intermingled with the report structures (which is not optimal). See: (you can see that
everything checks out because of the GREEN bars to the right; go to the “Structures” and “Facts” and
“Pivots” for additional details)
Fifth, disclosure mechanics verification is run and the result show up if you click on the link “Disclosure
mechanics rules” that you see at the bottom of the main page, but the actual results of running the rules
is not necessarily apparent (Pesseract summarizes this information better)
https://pacioli.auditchain.finance/reportAnalysis/1ac56aa0f195bebf5f67a71221929560905c7fe3.report
/disclosures.html
33
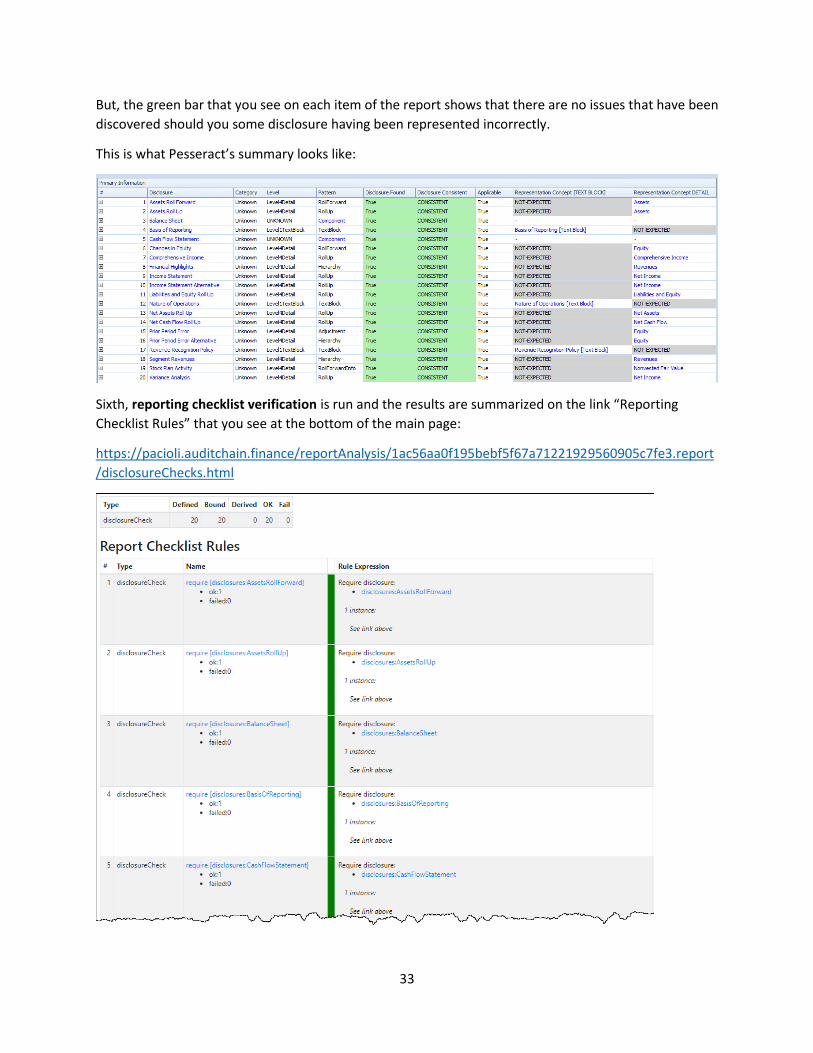
But, the green bar that you see on each item of the report shows that there are no issues that have been
discovered should you some disclosure having been represented incorrectly.
This is what Pesseract’s summary looks like:
Sixth, reporting checklist verification is run and the results are summarized on the link “Reporting
Checklist Rules” that you see at the bottom of the main page:
https://pacioli.auditchain.finance/reportAnalysis/1ac56aa0f195bebf5f67a71221929560905c7fe3.report
/disclosureChecks.html
34
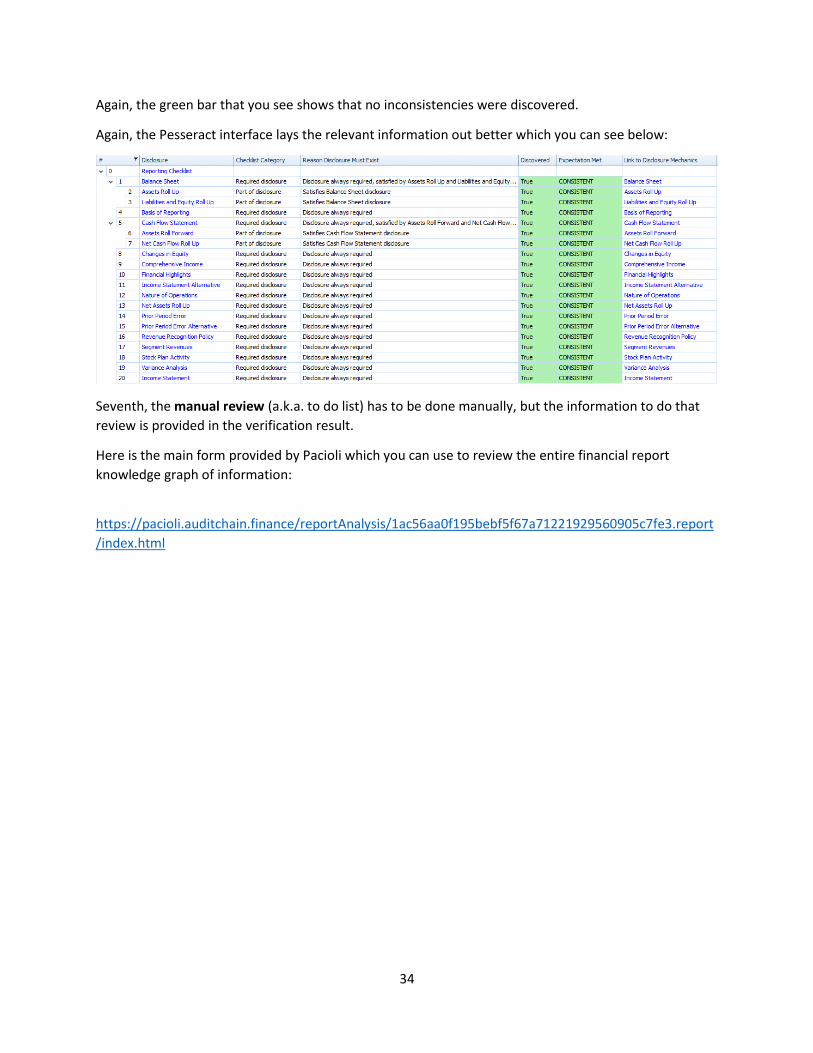
Again, the green bar that you see shows that no inconsistencies were discovered.
Again, the Pesseract interface lays the relevant information out better which you can see below:
Seventh, the manual review (a.k.a. to do list) has to be done manually, but the information to do that
review is provided in the verification result.
Here is the main form provided by Pacioli which you can use to review the entire financial report
knowledge graph of information:
https://pacioli.auditchain.finance/reportAnalysis/1ac56aa0f195bebf5f67a71221929560905c7fe3.report
/index.html
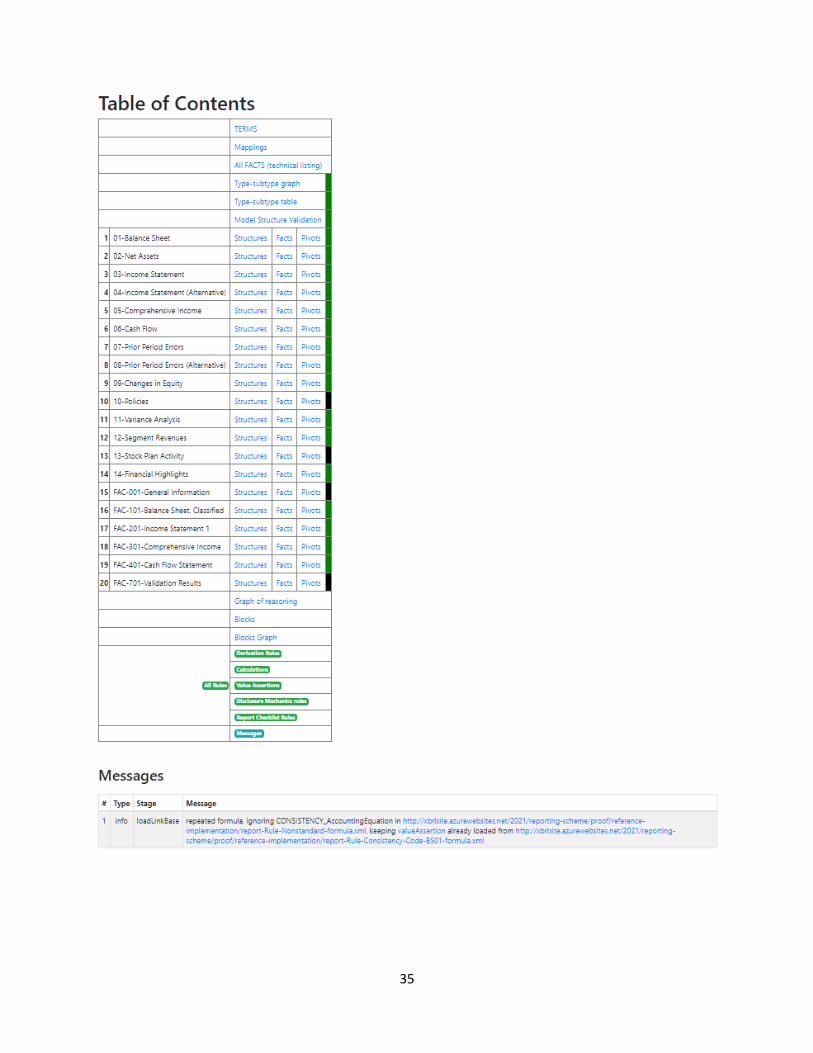
35
36
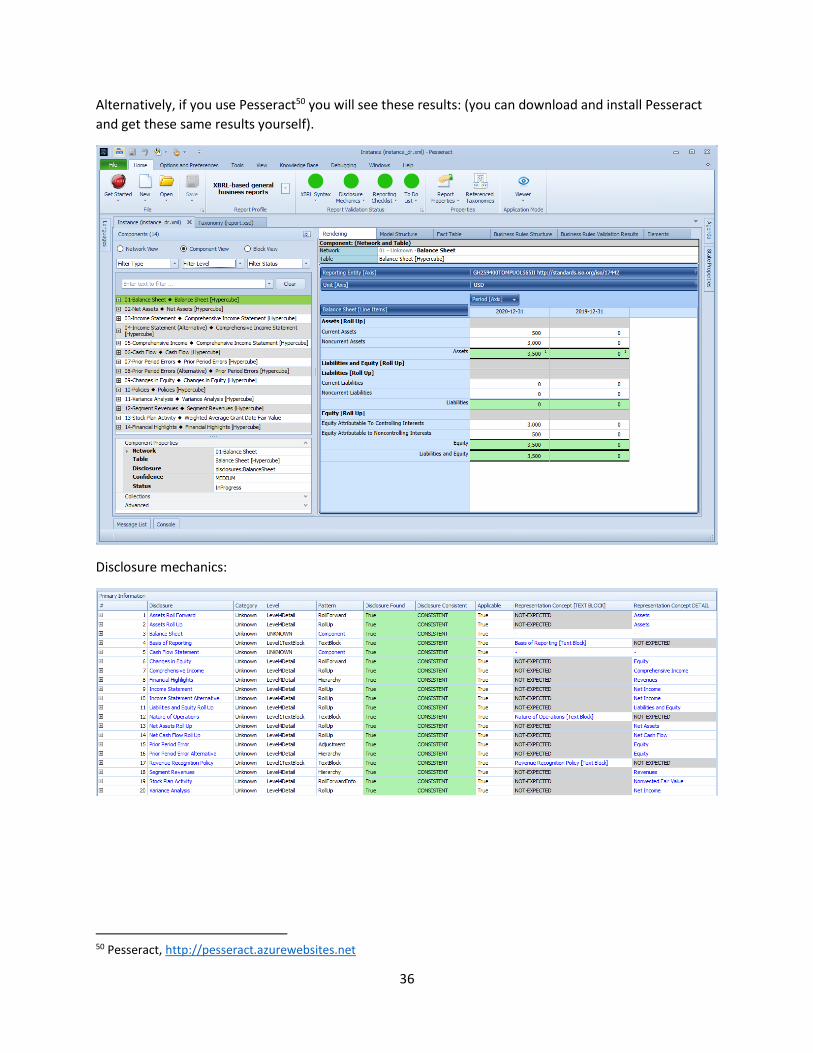
Alternatively, if you use Pesseract50 you will see these results: (you can download and install Pesseract
and get these same results yourself).
Disclosure mechanics:
50 Pesseract, http://pesseract.azurewebsites.net
37
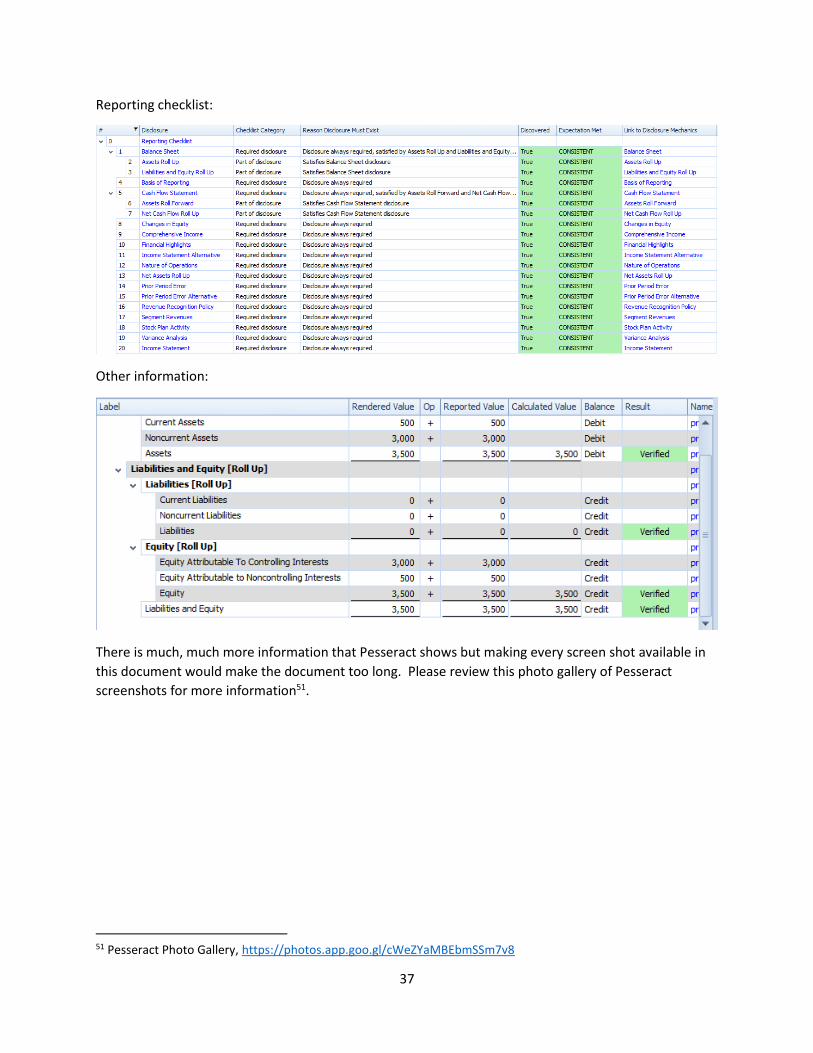
Reporting checklist:
Other information:
There is much, much more information that Pesseract shows but making every screen shot available in
this document would make the document too long. Please review this photo gallery of Pesseract
screenshots for more information51.
51 Pesseract Photo Gallery, https://photos.app.goo.gl/cWeZYaMBEbmSSm7v8
38
Conclusion.
Financial reports are ‘faithful” and “true and fair” representations of the financial position and financial
performance of an economic entity. Professional accountants that want to thrive, or even survive, in
the fourth industrial revolution, the information age, need to be able to provide that both human-
readable and machine-readable financial reports are properly functioning logical systems that convey
the intended meaning of the report creator and are complete, consistent, and precise.
To do otherwise is gross negligence on part of the professional accountant.
This method when used with the proper software tools and principles will help professional accountants
achieve their goals of creating properly functioning logical systems that are faithful, true, and fair
representations of the financial position and financial performance of an economic entity.