1
Jooyeon Hwang, Gurumurthy Ramachandran, Peter C. Raynor, Bruce H. Alexander , and Jeffrey H. Mandel Division of Environmental Health Sciences, School of Public Health, University of Minnesota, Minneapolis, Minnesota. Jooyeon Hwang: 1260 Mayo MMC 807, 420 Delaware St. S.E. Minneapolis, MN, USA 55455, [email protected] Method to Convert Fiber Counts Asbestos and Non-asbestos Based on NIOSH 7400/7402 into Counts Based on Other Fiber Definitions Introduction Methods Acknowledgements Contact Information Results Conclusion Different definitions of asbestos fibers have been proposed as most relevant to respiratory health end-points such as mesothelioma and lung cancer. We demonstrate a methodology to convert personal exposures to asbestos fibers using NIOSH 7400/7402 methods into exposures based on different ranges of fiber length and width. Results show that the conversion factors (CF) varied by the geologically different eastern (CF=0.43-5.21, p <0.05) and western (CF=0.13-1.74, p <0.05) zones of the Iron Range. Using the variance components of exposure, we were able to calculate the contrast between the 27 similar exposure groups (SEGs) into which the workers in the taconite industry were classified. A high contrast (Ɛ) in fiber exposures was observed between the SEGs based on all fiber definitions (Ɛ=0.84-0.94). • Analysis demonstrated the importance of well-defined SEGs when inferences are made regarding exposures based on different fiber definitions. • The conversion factor for asbestos fibers has a larger range of values in the eastern zone. • The conversion factor for non-asbestos fibers has a larger range of values in the western zone. • Contrasts between SEGs were higher in the eastern zone than in the western zone for asbestos and non-asbestos fibers. • The high contrast between SEGs indicated that exposure misclassification will be minimized in epidemiology studies based on them. Stage 3 (3200-5600 nm) Stage 5 (1000-1800 nm) Stage 7 (320-560 nm) Stage 9 (100-180 nm) Stage 11 (32-56 nm) Figure 1. Asbestos fiber area size fraction sampler and sampling analysis (above) and personal sampler (below). Nano-MOUDI (Model125R, MSP Co.) Zone * Mine SEGs Workers Fiber samples /worker Personal sample Area sample Eastern Northshore 22 56 6 332 110 Western Keetac 21 34 6 220 105 Minntac 24 46 6 325 120 ArcelarMittal 22 22 6 159 110 Hibbtac ** 22 34 6 239 110 Utac ** 27 38 6 285 135 Total 230 1560 690 Table 1. Number of area & personal asbestos fiber samples per mine * Amphiboles which are regulated as asbestos are prevalent in eastern zone while phyllosilicates which are regulated as non-asbestos are prevalent in western zone. ** Sampling analysis is in progress. Electron diffraction (ED) Energy disperse x-ray analysis Authors Year Width Length Aspect ratio Analysis methods Suzuki et al. 2005 ≤0.25 ≤5 NA Electron microscopy Stanton et al. 1981 ≤0.25 >8 NA Electron, light Chatfield 2007 0.04< W < 1.5 NA 20< AR< 1000 TEM Quinn et al. 2000 <6 >5 ≥3 SEM, TEM Lippmann * 1988 <0.1 >5 NA NA Pott et al. 1974 <1 >3 >5 NA NIOSH A rule 1994 NA >5 ≥3 PCM Stayner et al. 2008 <0.25 10<L<20 NA PCM, TEM *This fiber dimension is indices of mesothelioma. Authors Asbestos Non-asbestos Eastern Western Eastern Western Suzuki 5.21 1.74(0.27) * 0.43 0.13 Stanton NA NA 1.06 1.01 Chatfield 0.45 NA 0.98 1.01 Lippmann NA NA 1.07 1.01 Pott 1.58 0.94 0.91 0.97 Stayner NA NA 1.07 1.01 * ( ) is the intercept and all conversion factors are based on p < 0.5. Both slope and intercept were zero by Quinn asbestos fiber definition. Table 2. Conversion factor from the regression model (SAS 9.2) Hans Kromhout and Dick Heederik, Occupational epidemiology in the rubber industry: Implications of exposure variability, AJIM 27: 171-185 Table 3. Different asbestos fiber definitions π = 1 S 2 WG /k +S 2 WJ /kn Ɛ = S 2 BG S 2 BG + S 2 WG α i ~ N(0, σ 2 BG ), β ij ~ N(0, σ 2 WG ), ε ijk ~(0, σ 2 WW ) σ 2 BG ~ S 2 BG , σ 2 WG ~ S 2 WG , σ 2 WW ~ S 2 WJ =GSD BG , = GSD WG , = GSD WW ~ ~ ~ S 2 BG Assumptions : S 2 WG S 2 WW Figure 2. Contrast by asbestos and non-asbestos fiber definitions for each zone The original formation of SEGs was focused on exposure to asbestos fibers. Therefore, new SEGs based on the mean of non-asbestos fiber concentration in the western zone were created for non-asbestos fiber exposures. Three different sets of SEGs (n=27, 12, and 6) were created to compare the contrast ( 0.06, 0.09, 0.20, respectively) Western Eastern NIOSH 7400 PCM Definition: > 5 μm in length and ≥ 3 μm in aspect ratio Counting: fiber dimension and fiber shape NIOSH 7402 TEM Identification: asbestos fibers and non-asbestos fibers Counting: PCM + ISO TEM State of Minnesota and Minnesota Department of Health • Conversion factor ijzy = Each fiber definition to NIOSH conversion factor for SEG i , fiber diameter category j , length category z , and zone y • F ijzy = Proportion of all PCM fibers that are equivalent to TEM fibers in SEG i and zone y and that fall into fiber diameter category j and length category z by each fiber definition • FNIOSH iy = Proportion of all PCM fibers that are equivalent to TEM fibers that are counted using the NIOSH definition for SEG i and zone y 0.0 0.2 0.4 0.6 0.8 1.0 Asbestos Non-Asbestos Contrast Conversion factor ijzy = F ijzy FNIOSH iy ISO TEM 13794 Fiber Dimension (μm) Length Width Fiber 1 0.35 0.01 Fiber 2 0.70 0.25 Mg Si Fe

Method to Convert Fiber Counts Asbestos and Non-asbestos ...taconiteworkers.umn.edu/results/pdf/Poster_Hwang_AIHCE_2011.pdf · NIOSH 7400/7402 into Counts Based on Other Fiber Definitions

Embed Size (px)

Citation preview

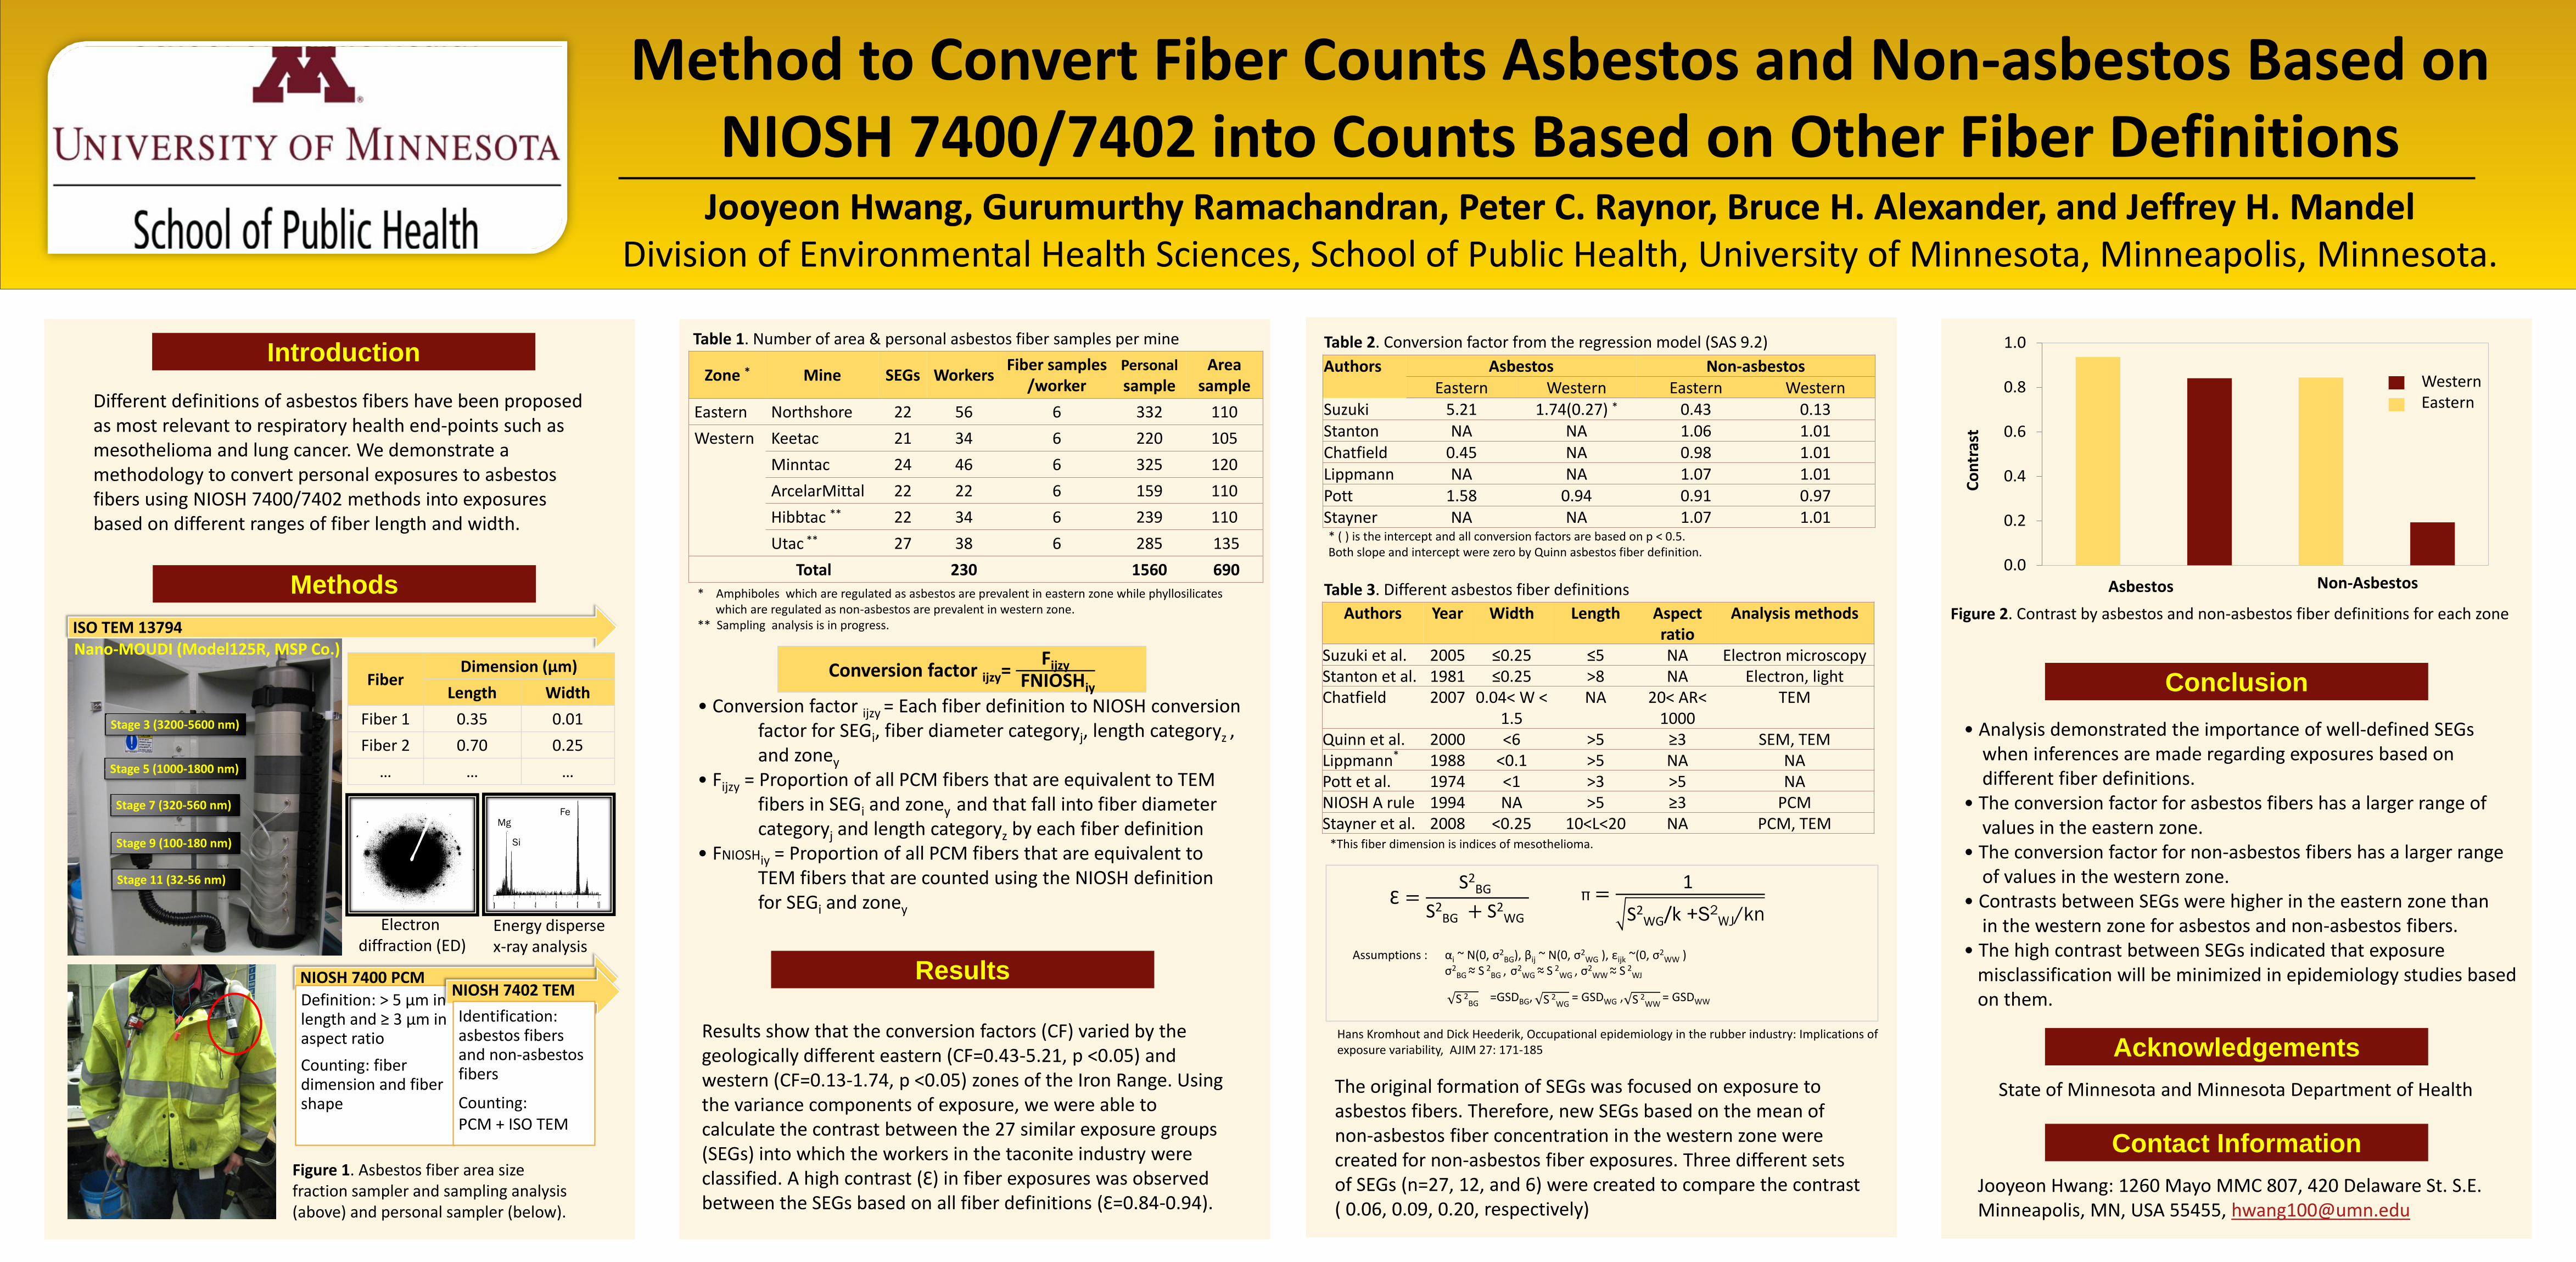
Jooyeon Hwang, Gurumurthy Ramachandran, Peter C. Raynor, Bruce H. Alexander, and Jeffrey H. Mandel Division of Environmental Health Sciences, School of Public Health, University of Minnesota, Minneapolis, Minnesota.

Jooyeon Hwang: 1260 Mayo MMC 807, 420 Delaware St. S.E. Minneapolis, MN, USA 55455, [email protected]

Method to Convert Fiber Counts Asbestos and Non-asbestos Based on NIOSH 7400/7402 into Counts Based on Other Fiber Definitions

Introduction

Methods

Acknowledgements

Contact Information

Results

Conclusion

Different definitions of asbestos fibers have been proposed as most relevant to respiratory health end-points such as mesothelioma and lung cancer. We demonstrate a methodology to convert personal exposures to asbestos fibers using NIOSH 7400/7402 methods into exposures based on different ranges of fiber length and width.

Results show that the conversion factors (CF) varied by the geologically different eastern (CF=0.43-5.21, p <0.05) and western (CF=0.13-1.74, p <0.05) zones of the Iron Range. Using the variance components of exposure, we were able to calculate the contrast between the 27 similar exposure groups (SEGs) into which the workers in the taconite industry were classified. A high contrast (Ɛ) in fiber exposures was observed between the SEGs based on all fiber definitions (Ɛ=0.84-0.94).

• Analysis demonstrated the importance of well-defined SEGs when inferences are made regarding exposures based on different fiber definitions. • The conversion factor for asbestos fibers has a larger range of values in the eastern zone. • The conversion factor for non-asbestos fibers has a larger range of values in the western zone. • Contrasts between SEGs were higher in the eastern zone than in the western zone for asbestos and non-asbestos fibers. • The high contrast between SEGs indicated that exposure misclassification will be minimized in epidemiology studies based on them.

Stage 3 (3200-5600 nm)

Stage 5 (1000-1800 nm)

Stage 7 (320-560 nm)

Stage 9 (100-180 nm)

Stage 11 (32-56 nm)

Figure 1. Asbestos fiber area size fraction sampler and sampling analysis (above) and personal sampler (below).

Nano-MOUDI (Model125R, MSP Co.)

Zone * Mine SEGs

Workers Fiber samples

/worker Personal sample

Area sample

Eastern Northshore 22 56 6 332 110

Western Keetac 21 34 6 220 105

Minntac 24 46 6 325 120

ArcelarMittal 22 22 6 159 110

Hibbtac ** 22 34 6 239 110

Utac ** 27 38 6 285 135

Total 230 1560 690

Table 1. Number of area & personal asbestos fiber samples per mine

* Amphiboles which are regulated as asbestos are prevalent in eastern zone while phyllosilicates which are regulated as non-asbestos are prevalent in western zone. ** Sampling analysis is in progress.

Electron diffraction (ED)

Energy disperse x-ray analysis

Authors Year Width Length Aspect ratio

Analysis methods

Suzuki et al. 2005 ≤0.25 ≤5 NA Electron microscopy Stanton et al. 1981 ≤0.25 >8 NA Electron, light Chatfield 2007 0.04< W <

1.5 NA 20< AR<

1000 TEM

Quinn et al. 2000 <6 >5 ≥3 SEM, TEM Lippmann* 1988 <0.1 >5 NA NA Pott et al. 1974 <1 >3 >5 NA NIOSH A rule 1994 NA >5 ≥3 PCM Stayner et al. 2008 <0.25 10<L<20 NA PCM, TEM

*This fiber dimension is indices of mesothelioma.

Authors Asbestos Non-asbestos Eastern Western Eastern Western

Suzuki 5.21 1.74(0.27) * 0.43 0.13 Stanton NA NA 1.06 1.01 Chatfield 0.45 NA 0.98 1.01 Lippmann NA NA 1.07 1.01 Pott 1.58 0.94 0.91 0.97 Stayner NA NA 1.07 1.01 * ( ) is the intercept and all conversion factors are based on p < 0.5. Both slope and intercept were zero by Quinn asbestos fiber definition.

Table 2. Conversion factor from the regression model (SAS 9.2)

Hans Kromhout and Dick Heederik, Occupational epidemiology in the rubber industry: Implications of exposure variability, AJIM 27: 171-185

Table 3. Different asbestos fiber definitions

π =1

S2WG/k +S2

WJ/kn Ɛ =

S2BG

S2BG + S2

WG

αi ~ N(0, σ2BG), βij ~ N(0, σ2

WG ), εijk ~(0, σ2WW )

σ2BG ~ S 2

BG , σ2

WG ~ S 2WG , σ

2WW ~ S 2

WJ

=GSDBG, = GSDWG , = GSDWW

~ ~ ~

S 2

BG

Assumptions :

S 2

WG S 2

WW

Figure 2. Contrast by asbestos and non-asbestos fiber definitions for each zone

The original formation of SEGs was focused on exposure to asbestos fibers. Therefore, new SEGs based on the mean of non-asbestos fiber concentration in the western zone were created for non-asbestos fiber exposures. Three different sets of SEGs (n=27, 12, and 6) were created to compare the contrast ( 0.06, 0.09, 0.20, respectively)

Western Eastern

NIOSH 7400 PCM

Definition: > 5 μm in length and ≥ 3 μm in aspect ratio

Counting: fiber dimension and fiber shape

NIOSH 7402 TEM

Identification: asbestos fibers and non-asbestos fibers

Counting: PCM + ISO TEM

State of Minnesota and Minnesota Department of Health

• Conversion factor ijzy = Each fiber definition to NIOSH conversion factor for SEGi, fiber diameter categoryj, length categoryz , and zoney • Fijzy = Proportion of all PCM fibers that are equivalent to TEM fibers in SEGi and zoney and that fall into fiber diameter categoryj and length categoryz by each fiber definition • FNIOSHiy = Proportion of all PCM fibers that are equivalent to TEM fibers that are counted using the NIOSH definition for SEGi and zoney

0.0

0.2

0.4

0.6

0.8

1.0

Asbestos Non-Asbestos

Co

ntr

ast

Conversion factor ijzy= Fijzy

FNIOSHiy

ISO TEM 13794

Fiber Dimension (µm)

Length Width

Fiber 1 0.35 0.01

Fiber 2 0.70 0.25

… … …

Mg

Si

Fe