Embed Size (px)
Citation preview
1
Method of Evaluating the Effect of Air Conditioning on Vehicle Energy Management
Karamjit Sandhu, Chris Chatham, Alen Milosevic, Deji Adekeye, Matt Warner
Abstract
The current focus on vehicle efficiency requires that components and systems are designed with the focus on entire vehicle energy management. Therefore, the im-pact of air conditioning (A/C) system design on overall vehicle energy management must be considered, especially as government regulations evolve to include driving cycles with air conditioning systems turned on within the overall calculation of vehicle fuel economy. Within the A/C system design process, it is necessary to weigh the trade-offs between system performance and energy consumption. This is especially true in hybrid or electric vehicles, where the A/C system design and its control algo-rithms may significantly affect "battery only" driving range, and where the A/C circuit may be used to cool batteries or electrical components. To study these trade-offs in a cost effective and efficient manner, it is necessary to use a system simulation tool. This paper presents a methodology for studying the trade-offs between cabin com-fort, energy consumption, and battery cooling using GT-SUITE simulation software. This methodology was used to study the impact of various A/C system configurations for a Land Rover vehicle. Various compressors, evaporator configurations and bat-tery cooling options were assessed to determine their impact on cooling performance and energy consumption. The modeling of one A/C system configuration will be pre-sented, where the possibility to easily extrapolate to many different A/C configura-tions can be observed. The analyzed A/C system consists of electrically driven com-pressor, evaporator, internal heat exchanger, condenser, thermal expansion valve and battery cooler. Systems included in the simulation are the A/C refrigerant circuit with battery cooling, underhood airflow and vehicle cabin. The system model was run and validated at different steady-state conditions. Subsequently, the system was investigated to observe pulldown characteristics inside vehicle cabin at 43̊ C ambient temperature.
1. Introduction
The current focus on vehicle efficiency requires that components and systems are designed with the focus on energy management for the entire vehicle. Therefore, the impact of air conditioning (A/C) system design on overall vehicle energy management must be considered, especially as government regulations evolve to include driving cycles with air conditioning systems turned on within the overall calculation of vehicle fuel economy.

2
Within the A/C system design process, it is necessary to weigh the trade-offs be-tween system performance and energy consumption. This is especially true in hybrid or electric vehicles, where the A/C system design and its control algorithms may sig-nificantly affect "battery only" driving range, and where the A/C circuit may be used to cool batteries or electrical components. To study these trade-offs in a cost effective and efficient manner, it is necessary to have a defined methodology using a system simulation tool. This paper presents a methodology for studying the trade-offs between cabin comfort, energy consumption, and battery cooling using GT-SUITE simulation software. This methodology was used to study the impact of various A/C system configurations for a Land Rover vehicle. In this paper, the methodology is presented for one particu-lar A/C system, but by extension could easily be used to compare different system architectures and components. All of the modelling work was performed using GT-SUITE software, which includes all necessary building blocks to model any A/C system, as well as the capability to inte-grate an A/C system with other vehicle subsystems, such as engine, coolant, oil, un-derhood, driveline, etc. GT-SUITE solves the Navier-Stokes equations for com-pressible 1-D flow (conservation of continuity, momentum, and energy), which makes the tool inherently stable as well as accurate during transient operation.
2. Modeling A/C System Components Out of several A/C system configurations studied using this method, one was se-lected to be presented in this paper. This configuration consists of an electrically driven compressor, three evaporators, accompanying thermal expansion valves, in-ternal heat exchanger and condenser. Two of the evaporators are supplying cooled air to the front and rear of the vehicle cabin, while the third is removing the heat re-jected to coolant from the hybrid battery and inverter.
Fig.1: Schematic of the modelled A/C system
3
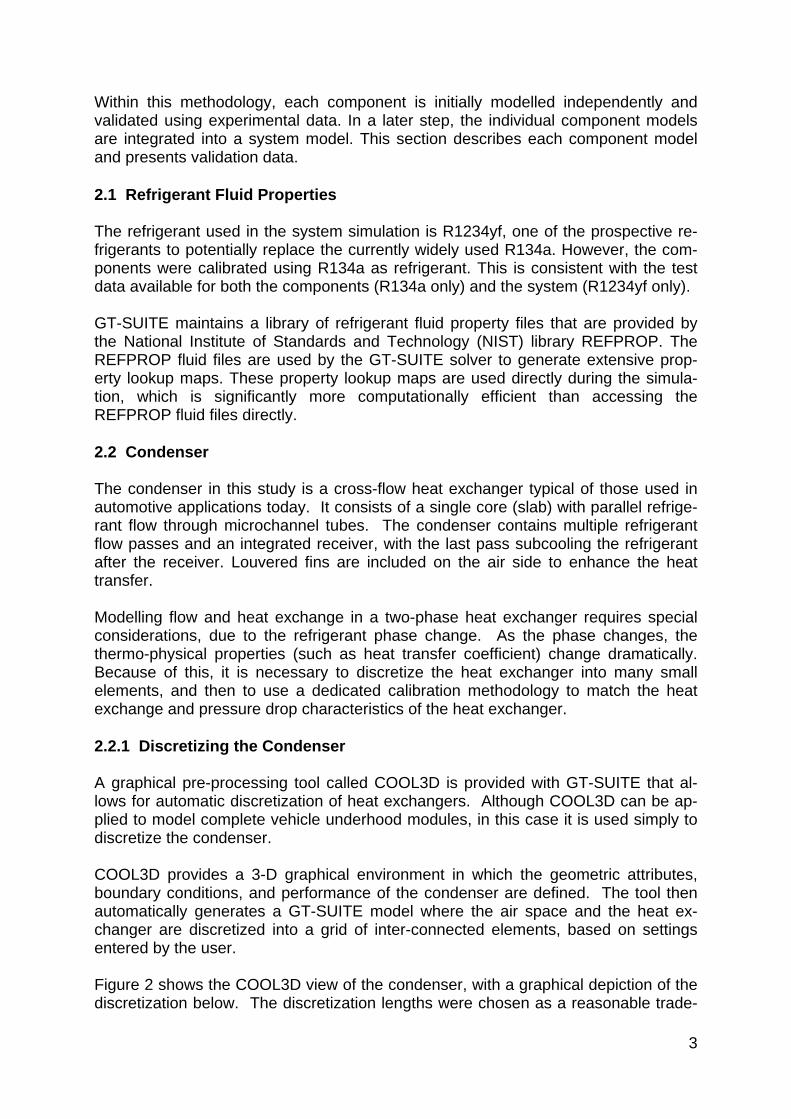
Within this methodology, each component is initially modelled independently and validated using experimental data. In a later step, the individual component models are integrated into a system model. This section describes each component model and presents validation data. 2.1 Refrigerant Fluid Properties The refrigerant used in the system simulation is R1234yf, one of the prospective re-frigerants to potentially replace the currently widely used R134a. However, the com-ponents were calibrated using R134a as refrigerant. This is consistent with the test data available for both the components (R134a only) and the system (R1234yf only). GT-SUITE maintains a library of refrigerant fluid property files that are provided by the National Institute of Standards and Technology (NIST) library REFPROP. The REFPROP fluid files are used by the GT-SUITE solver to generate extensive prop-erty lookup maps. These property lookup maps are used directly during the simula-tion, which is significantly more computationally efficient than accessing the REFPROP fluid files directly. 2.2 Condenser The condenser in this study is a cross-flow heat exchanger typical of those used in automotive applications today. It consists of a single core (slab) with parallel refrige-rant flow through microchannel tubes. The condenser contains multiple refrigerant flow passes and an integrated receiver, with the last pass subcooling the refrigerant after the receiver. Louvered fins are included on the air side to enhance the heat transfer. Modelling flow and heat exchange in a two-phase heat exchanger requires special considerations, due to the refrigerant phase change. As the phase changes, the thermo-physical properties (such as heat transfer coefficient) change dramatically. Because of this, it is necessary to discretize the heat exchanger into many small elements, and then to use a dedicated calibration methodology to match the heat exchange and pressure drop characteristics of the heat exchanger. 2.2.1 Discretizing the Condenser A graphical pre-processing tool called COOL3D is provided with GT-SUITE that al-lows for automatic discretization of heat exchangers. Although COOL3D can be ap-plied to model complete vehicle underhood modules, in this case it is used simply to discretize the condenser. COOL3D provides a 3-D graphical environment in which the geometric attributes, boundary conditions, and performance of the condenser are defined. The tool then automatically generates a GT-SUITE model where the air space and the heat ex-changer are discretized into a grid of inter-connected elements, based on settings entered by the user. Figure 2 shows the COOL3D view of the condenser, with a graphical depiction of the discretization below. The discretization lengths were chosen as a reasonable trade-

4
off between solver runtime and solution accuracy. In this model, there are 5 sub-volumes along each refrigerant pass.
Fig.2: COOL3D model of the condenser 2.2.2 Calibrating the Condenser GT-SUITE provides a methodology for performing the calibration of the heat transfer and pressure drop of a two-phase heat exchanger. This methodology depends on the use of phase-dependent heat transfer correlations on the refrigerant side, while the air side heat transfer correlation is used to calibrate the model to measured perfor-mance data. Table 1 shows the list of refrigerant-side heat transfer coefficient correlations utilized for the condenser: Table 1 - Condenser refrigerant-side heat transfer correlations Single phase (vapor/liquid): Dittus-Boelter
Dkh ⋅⋅⋅= 4.08.0 PrRe0243.0 (heating) (1)
Dkh ⋅⋅⋅= 3.08.0 PrRe0243.0 (cooling) (2)
Two-phase: Shah
( ) ( )Dk
PxxxNuh
rdL ⋅
−⋅⋅−⋅= 38.0
04.076.08.0 18.31 (3)
4.08.0 PrRe023.0 LLLNu ⋅⋅= (4)

5
In the Table 1 above, constituents in the correlations are: h - Heat transfer coefficient Re - Reynolds number Pr - Prandtl number k - Thermal conductivity D - Characteristic dimension
crrd P
PP = - Reduced pressure
P - Actual pressure crP - Critical pressure
x - Refrigerant quality LNu - Liquid phase Nusselt number
On the air side, a Nusselt correlation is also used, but in this case the coefficient and exponent are parameters to be determined within the calibration process.
nmCNu PrRe ⋅⋅= (5) For this purpose, GT-SUITE provides an Excel spreadsheet, which solves for the coefficient and exponent in Nusselt correlation, based on heat exchanger test data and geometry. The coefficient "C" and exponent "m" obtained from the spreadsheet are entered into the model, and steady state simulations are run at the same operating points used within the spreadsheet calibration process. Adjustments are made iteratively to the air-side Nusselt correlation coefficient and optionally to the refrigerant-side heat transfer multipliers until a good agreement with measured performance is obtained. The calibration of pressure drop on both air and refrigerant sides is accomplished by adjusting the friction multipliers in the heat exchanger elements and the discharge coefficients at the outlet connections until the results correspond well to test data. In this study, the standard pipe friction model available within GT-SUITE was used, al-though it is worth noting that the Friedel correlation is also available within GT-SUITE to model refrigerant two-phase pressure drop. 2.2.3 Calibrating the Integrated Receiver The condenser has an integrated receiver, which is initially modelled independently to match the pressure drop test data provided, then integrated within the condenser component model before the last refrigerant pass. Figure 3 shows the setup of the receiver calibration model. The solver based optimization tool provided with GT-SUITE was used to determine the discharge coefficient of the receiver orifice that best matches the measured pressure drop of the receiver. Figure 4 shows the opti-mization results, from which one can see that a discharge coefficient of 0.181 matches the pressure drop most closely.

6
Fig.3: Receiver calibration
Fig.4: Receiver calibration - optimizing discharge coefficient to match the pressure drop
2.2.4 Completed Condenser Model and Results The final GT-SUITE model of the condenser (set up for calibration described in the previous section) is shown below. The condenser is shown as a single sub-assembly on the map, but internally contains many discretized air and heat exchanger ele-ments and the integrated receiver.
Fig.5: Condenser calibration

7
In this model, the inlet mass flow rates and temperatures and outlet pressures are imposed on each side of heat exchanger. The resulting heat exchange and pressure drops are shown below compared to measured data.
Fig.6: Condenser - test vs. simulation results 2.3 Evaporators Both front and rear evaporator in the study have microchannel tubes as internal ge-ometry, whereas the external geometry consists of louvered fins. Both evaporators have two cores with 2 passes in each core.
Fig.7: Evaporator internal flow arrangement

8
Modelling two-phase flow in the evaporators is similar to the condenser modelling. The COOL3D pre-processing tool is used to automatically discretize each evaporator into a number of small subvolumes and heat exchanger elements. Then the previ-ously described heat exchanger performance calibration method is applied. All of the refrigerant heat transfer and pressure drop correlations are used as with condenser, with the exception of the heat transfer coefficient in the two-phase region, where the correlation from Klimenko is chosen:
Dk
kk
h l
l
w
l
vl ⋅
⋅
⋅⋅⋅=
09.02.06.0 6
1PrRe087.0ρρ (6)
With: lρ - Liquid density
vρ - Vapor density
lk - Liquid thermal conductivity
wk - Wall material thermal conductivity An important difference between condenser and evaporator modelling is the humidity and its effect on the air-side heat transfer. The effect of humidity and the amount of condensate are accounted for in GT-SUITE, both in the heat exchanger calibration process and in the solver during simulation. A comparison of evaporator cooling capacity to experimental results is shown below in Fig.8.
Fig.8: Evaporators - test vs. simulation results 2.4 Compressor The compressor is modeled using a performance lookup map based on test data in-cluding four parameters:
- Rotational speed - Mass flow rate - Pressure ratio - Isentropic efficiency

9
At each timestep during the simulation, the compressor mass flow rate and efficiency are determined from the performance map based on the current rotational speed and pressure ratio. Figure 9 shows some of the compressor parameters compared to the test data.
Fig.9: Compressor - test vs. simulation results 2.5 Expansion Devices There are three expansion devices in the modeled A/C system configuration. All ex-pansion devices in the system are the block type, bulb-less, sensing evaporator out-let pressure without the need for an external equalizer. A typical block type thermal expansion valve (TXV) is shown in the Figure 10 below.
Fig.10: Automotive block-type TXV The template supplied in GT-SUITE for modeling the TXV regulates the superheat at the outlet of the evaporator by dynamically controlling the flow area of the TXV orifice at the evaporator inlet. The target superheat value is supplied as a model input and the following equation is used to determine the orifice area for each timestep:
( )nom
ettSHnom T
TTA
dtdA
⋅
−⋅=
τarg (7)

10
In the above equation, the valve response time is modeled with the TXV time con-stant τ , which influences the rate of change of the orifice area. Figure 11 below shows the transient response of the TXV associated with chiller. The time constant was set to be 2 seconds, while the target superheat was 10 K.
Figure 11 - Chiller TXV valve behavior
2.6 Internal Heat Exchanger The internal heat exchanger (IHX) shown in Figure 12 is a counter flow heat ex-changer, with tube-in-tube geometry.
Fig.12 IHX schematic For counter flow (or parallel flow) heat exchanger geometry, the COOL3D prepro-cessing tool is not required to discretize the heat exchanger. Instead, a specific tem-plate called 'HxFlowDiscretized' is provided directly in GT-SUITE for this purpose. Using this template, the IHX is represented as a single part on the project map, but

11
the solver will internally discretize the heat exchanger into a user-defined number of small internal and external pipe elements, connected via the same number of thermal masses. A graphical representation of the masses and volumes solved internally to the solver using this approach is shown below:
Fig.13 "Internal structure" of the 'HxFlowDiscretized' template The heat transfer and pressure drop correlations utilized are same as in the case of condenser and evaporator. As both fluid sides are refrigerant, adjustments are made in the heat transfer coefficient and friction multipliers to match the performance. The capacity comparison is shown in Fig.14 below.
Fig.14 IHX - test vs. simulation results
(Internal to Solver)

12
2.7 Battery Cooler The purpose of the third evaporator in the A/C system is to cool the hybrid electric system battery and inverter. The heat exchanger is a counter flow heat exchanger, with the A/C refrigerant cooling a mixture of water and glysantine (50% by volume). Although both the electrical components and the complete coolant circuit could be modeled in GT-SUITE, in this case the battery cooling circuit is represented by an imposed coolant flow rate, heat exchanger inlet temperature and heat exchanger out-let pressure. Because the heat exchanger has counterflow geometry, the 'HxFlowDiscretized' template is used to discretize the heat exchanger. The heat transfer and pressure drop correlations utilized are as same as in the case of front and rear evaporator. The battery cooler model and results are shown in the figures below.
Fig.15 - IHX calibration model view
Fig.16 Battery cooler - test vs. simulation data

13
3. Steady State Simulation of the Complete A/C System After all of the components have been individually calibrated, they are assembled into a closed loop A/C system model. The components were connected by pipes and flow splits as needed to match the system geometry. GT-SUITE provides a tool that al-lows for the pipe objects to be automatically created directly from a CAD file. The A/C system model built is shown in the Fig.17 below. Some of the pipe sections that consists of many complex bends are represented by a single part on the project map that allows for the pipe centerline to be defined by a series of (X, Y, Z) points.
Fig.17 A/C system model assembled, with accompanying tubing
As previously mentioned, the A/C system uses R1234yf as refrigerant, however the available component data uses R134a. This means that some of the calibrated com-ponents require adjustment to be appropriate for R1234yf. Effectively, component performance is adjusted to maintain identical boundary conditions, while taking into account the differences in thermo-physical properties between the two refrigerants. For the heat exchangers, this meant that superheat/subcooling values and pressures were maintained, while the mass flow rates were scaled to match the capacities. For the compressor, the inlet superheat and pressure conditions were maintained, while the measured mass flow rates were scaled by the ratio of densities of the two refrige-rants. The model is run at a series of operating points to validate the steady state system behavior. In these simulations, the initial air temperature, refrigerant temperature, and all wall temperatures are set to 300 K. The initial refrigerant density is deter-mined based on the known refrigerant charge in the system.

14
The system boundary conditions imposed in the simulation are the following:
- Compressor speed - Air-side flow rate, inlet temperature and outlet pressure for condenser, front
and rear evaporator - Inlet relative humidity for front and rear evaporator - TXV superheat settings for the front and rear evaporator and battery chiller - Coolant flow rate, inlet temperature and outlet pressure in the battery cooling
coolant circuit
The overview of the operating steady state conditions is shown in Table 2 below:
Table 2 - Steady state conditions The following table shows that the target TXV superheat values are achieved in the simulation:
Table 3 - Overview of achieved superheats in test and simulation data The comparison with experimental data for three steady-state conditions is shown in the plots below (Figure 18). In the available experimental data, refrigerant mass flow rates are measured only in the main branch and not in the three evaporator circuits. Therefore, refrigerant-side capacities were not available for comparison. In addition, the air- and coolant-side data did not contain enough information to estimate air-side capacities with accuracy; only dry-side heat transfer rates could be calculated from available test data. However, the comparison is made for various system pressures and temperatures, and shows good agreement.

15
Fig.18 A/C system; overview and comparison with experimental steady-state results

16
4. Simulation of A/C System integrated with Vehicle Cabin (transient pull-down tests) Once the A/C system model was validated at steady operating conditions, the model was tested in a transient simulation to predict the "pull down" performance. The pull down transient test is used to determine the transient cabin temperature over a 90 minute period. The test conditions for the pull down transient are described below:
Ambient Temperature = 43ºC Relative Humidity = 40% Solar Load = 1000 W/m2 Initial cabin average interior temperature = 60ºC
Air recirculation: 100%
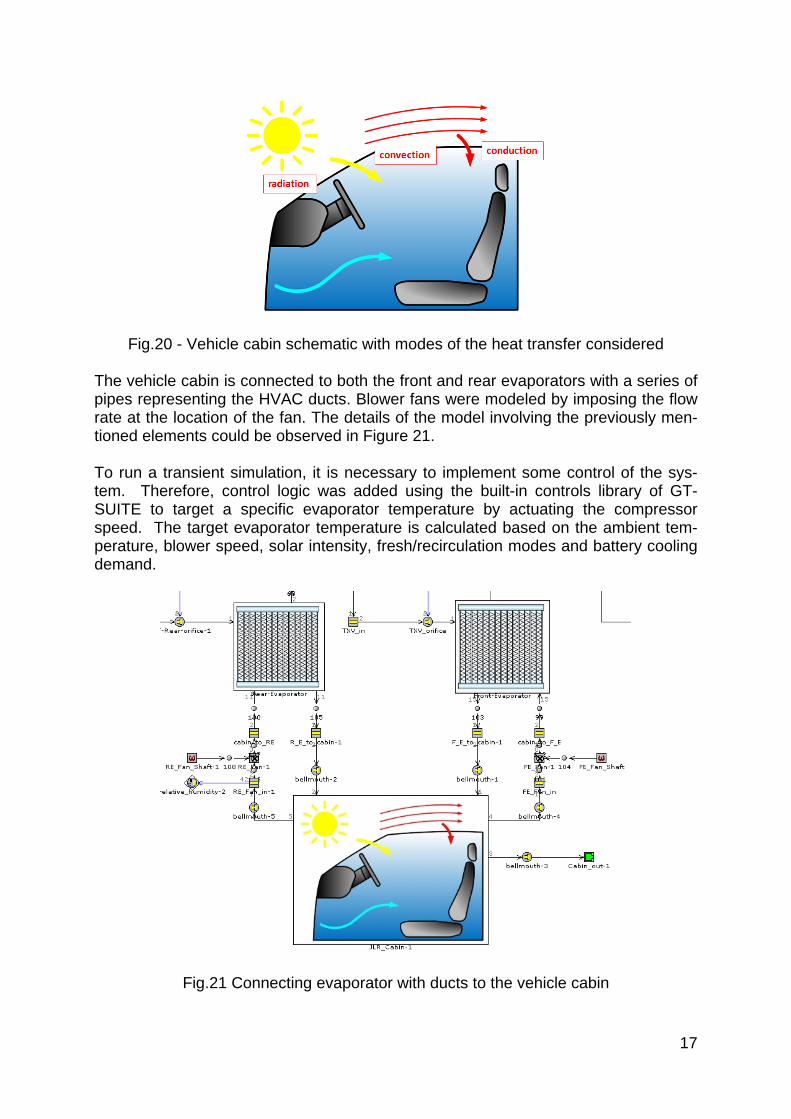
Fig.19 - Overview of the test conditions during the pulldown mode To simulate the behavior of the system within this transient, it is necessary to add a model of the vehicle cabin. A cabin template that uses a lumped capacitance and resistance approach is supplied in GT-SUITE. This template accounts for all of the modes of heat transfer shown in Figure 20 below, as well as any heat rejected by passengers. It is assumed that the temperature and humidity inside the passenger compartment is spatially uniform at any time during the pull down process.
17
Fig.20 - Vehicle cabin schematic with modes of the heat transfer considered The vehicle cabin is connected to both the front and rear evaporators with a series of pipes representing the HVAC ducts. Blower fans were modeled by imposing the flow rate at the location of the fan. The details of the model involving the previously men-tioned elements could be observed in Figure 21. To run a transient simulation, it is necessary to implement some control of the sys-tem. Therefore, control logic was added using the built-in controls library of GT-SUITE to target a specific evaporator temperature by actuating the compressor speed. The target evaporator temperature is calculated based on the ambient tem-perature, blower speed, solar intensity, fresh/recirculation modes and battery cooling demand.
Fig.21 Connecting evaporator with ducts to the vehicle cabin

18
Figure 22 displays the predicted cabin temperature and compressor power consump-tion during the pull down test. The results show the expected pulldown behavior, and will be compared to experimental data, when it becomes available.
Fig.22 - Transient pull down cabin temperature and compressor power 5. Summary and Conclusions A methodology is presented for the simulation of automotive air conditioning systems, using GT-SUITE software. This tool allows for modeling of individual components or complete systems, at steady operating points or in fully transient operation. The methodology is presented for one particular A/C system on a Land Rover ve-hicle, but by extension could easily be used to compare different system architec-tures and components in terms of performance and energy consumption.
19
This methodology allows for evaluation of a greater number of design alternatives earlier in the vehicle release process. This becomes critical as new hybrid/electrical components of vehicles place new cooling demands on the air conditioning system. Using this methodology, it is possible to evaluate a large number of potential system architectures (i.e. one evaporator vs. two) or system components (i.e. compressor A vs. compressor B). As the vehicle release cycle progresses and the system architecture is solidified, the methodology allows for a reduction in prototype expense, and a faster turn-around time to evaluate proposed design changes. In addition, it provides a method of eva-luating different ambient conditions (or component failures) that may be difficult or expensive to test on prototype vehicles. The use of GT-SUITE differentiates this methodology from others used in industry today. The single multi-domain platform offered by GT-SUITE allows for the A/C sys-tem to be integrated with any other vehicle sub-system as needed (coolant, lubrica-tion, engine, vehicle). In addition the integrated controls library allows for easy im-plementation of control algorithms that are a convenience for steady operation, but a requirement for transient simulation. Finally, the use of the Navier-Stokes equations provides a truly transient solution which remains stable, even during sudden changes such as a compressor cycling on or off. The methodology presented enables A/C system engineers to quantify the inherent trade-offs between cabin comfort, energy consumption, battery cooling, and system cost, at minimal cost Literature [1] Miller, D.S., Internal Flow Systems, Second Edition, BHR Group Limited, 1990. [2] Stoecker, W. F. and Jones, J.W. Refrigeration and air conditioning, 2nd edition,
1982, (McGraw Hill, New York, USA). [3] Hesselgreaves, Compact Heat Exchangers, 2001, Elsevier Science & Technol-
ogy Books
[4] NIST Reference Fluid Thermodynamic and Transport Properties Database REFPROP
[5] Numerical heat transfer and fluid flow, Suhas V. Patankar [6] Chang YJ, Wang CC. Air side performance of brazed aluminum heat exchang-
ers. J Enhanc Heat Transf 1996;3:15–28. [7] Chang YJ, Wang CC. A generalized heat transfer correlation for louver fin geo-
metry. Int J Heat Mass Transfer 1997;40:533–44.

20
[8] Chang et al. A generalized friction correlation for louver fin geometry. Int J Heat Mass Tran 2000;43:2237–43.
[9] Kays WM, London AL. Compact heat exchangers. 3rd ed. New York: McGraw-
Hill Book Company; 1984. [10] Colebrook, C. F., "Turbulent flow in pipes, with particular reference to the transi-
tion region between smooth and rough pipe laws," Jour. Ist. Civil Engrs., London, Feb. 1939.
[11] Nikuradse, J., “Strömungsgesetze in rauhen Rohren.” VDI-Forschungsheft 361. Beilage zu “Forschung auf dem Gebiete des Ingenieurwesens” Ausgabe B Band 4, July/August 1933.
[12] Serghides, T.K., “Estimate friction factor accurately.” Chemical Engineering, 91, 63-64, 1984.
[13] Wagner, W., Strömung und Druckverlust. Vogel Fachbuch Kamprath-Reihe, 2001.
[14] White, F.M., Fluid Mechanics 2nd Edition. McGraw Hill, 1986.
[15] Idelchik, I.E., Handbook of Hydraulic Resistance, JAICO, 2003. [16] Fox, R. and McDonald, A., Introduction to Fluid Mechanics, Fourth Edition, John
Wiley and Sons, Inc.: New York, N.Y., 1992.
[17] Klimenko, V. V, "A generalized correlation for two-phase forced flow heat trans-fer," Int. J. Heat Mass Transfer, 31, 541-552 (1988)
[18] Chen, J. C., 1966, "A correlation for boiling heat transfer to saturated fluids in
vertical flow", I & EC Process Design and Development, Vol. 5. No. 3, pp. 322-339
[19] Shah, M.M. 1976. A new correlation for heat transfer during boiling through
pipes. ASHRAE Transactions 82(2): 66-86 [20] 2005 ASHRAE Handbook - Fundamentals [21] Hoffman, Joe D., Numerical Methods for Engineers and Scientists, CRC Press,
2nd Edition, 2001