Embed Size (px)
Citation preview

Journal of Colloid and Interface Science 327 (2008) 169–179
Contents lists available at ScienceDirect
Journal of Colloid and Interface Science
www.elsevier.com/locate/jcis
Method for analysis of the composition of acid soaps by electrolytic conductivitymeasurements
Peter A. Kralchevsky a,∗, Mariana P. Boneva a, Krassimir D. Danov a, Kavssery P. Ananthapadmanabhan b, Alex Lips b
a Laboratory of Chemical Physics and Engineering, Faculty of Chemistry, Sofia University, 1164 Sofia, Bulgariab Unilever Research and Development, Trumbull, CT 06611, USA
a r t i c l e i n f o a b s t r a c t
Article history:Received 17 May 2008Accepted 1 August 2008Available online 7 August 2008
Keywords:Carboxylate soap solutionsAcid-soap crystallites, stoichiometryPotassium myristateElectrolytic conductivityMolar ionic conductances
Here, we propose a method for determining the stoichiometry of acid-soap crystallites. The methodis based on dissolving the crystallites in water at an appropriate working temperature, followed bymeasurement of the electrolytic conductivity of the obtained solutions. The working temperature ischosen in such a way that the only precipitate in the solutions is that of carboxylic acid, whereasthe carboxylate salt is dissociated, and its content in the dissolved crystals determines the solution’sconductivity. In the theoretical model for data interpretation, we took into account the dependence of themolar conductance on the ionic strength. The method was applied for determining the stoichiometry ofacid-soap crystals collected from solutions of potassium myristate (tetradecanoate) at 25 ◦C. The crystalswere dissolved in water at working temperature of 40 ◦C, at which the conductivity was measured. Thestoichiometry of all samples determined in the present study coincides with that independently obtainedby another method that is based on in situ pH measurements.
© 2008 Elsevier Inc. All rights reserved.
1. Introduction
The sodium and potassium carboxylates (dodecanoates, tetra-decanoates, hexadecanoates, and octadecanoates, which are popu-lar, respectively, as laurates, myristates, palmitates, and stearates)have a broad application in many consumer products like soapbars; cleaning products; cosmetics; facial cleaners; shaving creams,and deodorants [1–3]. The dissolving of carboxylates in water is ac-companied by increase of the solution’s pH due to the spontaneoushydrolysis (protonation) of the carboxylate anion [4]:
Z− + H2O ↔ HZ + OH−.
Here we use the notations in Ref. [4], viz. Z− is carboxylate an-ion, and HZ is non-dissociated carboxylic acid. The non-dissociatedHZ with 12 and more carbon atoms is weakly soluble in waterand forms crystalline precipitates at relatively low carboxylate con-centrations (�10−5 M). Moreover, the hydrogen-bonding interac-tion between the carboxylic-acid molecules and carboxylate anionsleads to the formation of j:n acid-soap complexes that also formcrystalline precipitates [5–9]:
jHZ + nZ− + nM+ ↔ (HZ) j(MZ)n.
Here, M+ is a metal cation (usually Na+ or K+), and (HZ) j(MZ)nis the acid soap. The acid soaps were investigated by Ekwall et al.
* Corresponding author. Fax: +359 2 962 5643.E-mail address: [email protected] (P.A. Kralchevsky).
0021-9797/$ – see front matter © 2008 Elsevier Inc. All rights reserved.doi:10.1016/j.jcis.2008.08.006
[5–7,10–12], McBain et al. [8,9], and in subsequent studies [3,4,13–21]. Soaps of different stoichiometry, j:n = 1:1, 1:2, 2:1, 3:2, 4:1,etc., have been experimentally detected [3,12–14,19–21]. In fact,the turbidity of the soap solutions is due to the formation of fine(micrometer and submicrometer) j:n acid-soap crystallites.
As mentioned above, the solution’s pH increases with the riseof the total input concentration of carboxylate, ct. For the acid-soap precipitates, the ratio n/ j increases with the rise of ct; itsvalue can be determined from the slope of the experimental pH-vs-ct dependence, or from plots of precipitate characteristic func-tions [4,21]. Above a certain threshold concentration, separationof MZ from the solution begins in the form of either MZ crystal-lites [21] or micelles [22]. In the case of two coexisting solids, viz.acid-soap and MZ crystallites, the solution’s pH remains constant(independent of ct) in agreement with the Gibbs phase rule [4,21].In the case of coexisting j:n acid soap and micelles, the soap sto-ichiometry and micelle charge can be determined by analysis ofexperimental data from parallel in situ measurements of pH andconductivity [22].
Sometimes, the results obtained by in situ measurements withthe carboxylate solutions can be uncertain. For example, the con-centration range with a given acid-soap precipitate could be rathernarrow, or the value of a given solubility product, which is neededto interpret the data, is unknown. For this reason, it is desirableto determine the acid-soap stoichiometry by using an independentmethod. We could separate crystallites from a given carboxylatesolution and to subject them to chemical analysis. One analyti-
170 P.A. Kralchevsky et al. / Journal of Colloid and Interface Science 327 (2008) 169–179
cal method, which has been applied to identify acid soaps, is theIR spectroscopy [3,15,23]. One difficulty with this method is thelack of reference spectra for the whole variety of possible j:n acidsoaps.
Here, we propose another direct method for analyzing the sto-ichiometry of (HZ) j(MZ)n acid soaps. The principle of this methodis the following. Acid-soap crystallites of unknown stoichiometryare collected from a carboxylate solution at a given temperature.Further, these crystallites are dissolved in water at a higher tem-perature, at which HZ is insoluble, but MZ is dissociated to M+and Z− ions. By measuring the conductivity of the latter solution,we can determine the stoichiometry of the dissolved acid soap.
The paper is organized as follows. In Section 2 we describe theproposed method. In Section 3 we quantify the dependence of theconductivity of MZ-solutions on the MZ concentration, for the caseof potassium myristate (KMy) by using an approach based on thestudies by Walden et al. [24,25]. Finally, in Section 4 we presentexperimental data and their interpretation; demonstrate how theproposed method works, and discuss the limits of its applicability.
2. Description of the proposed method
We assume that a sample of solid (crystalline) acid soap isavailable. This sample could be obtained by taking crystallites outof a carboxylate solution at a given temperature and carboxylateconcentration (details in Section 4 below). Our aim is to determinethe stoichiometry of the investigated sample of (HZ) j(MZ)n acidsoap. For this goal, we propose the following working procedure.
First, we dissolve the acid-soap crystallites in water at appropri-ate working conditions. The latter are chosen in such a way thatthe only precipitate in the solution is that of HZ, whereas MZ isdissociated to M+ and Z− ions.
Second, the electrolytic conductivity, κ , of the solutions is mea-sured. κ will be greater if the content of MZ in the (HZ) j(MZ)n
acid soap is greater. In this way, by quantitative data analysis, wecan determine the stoichiometry, j:n, of the acid soap (see below).
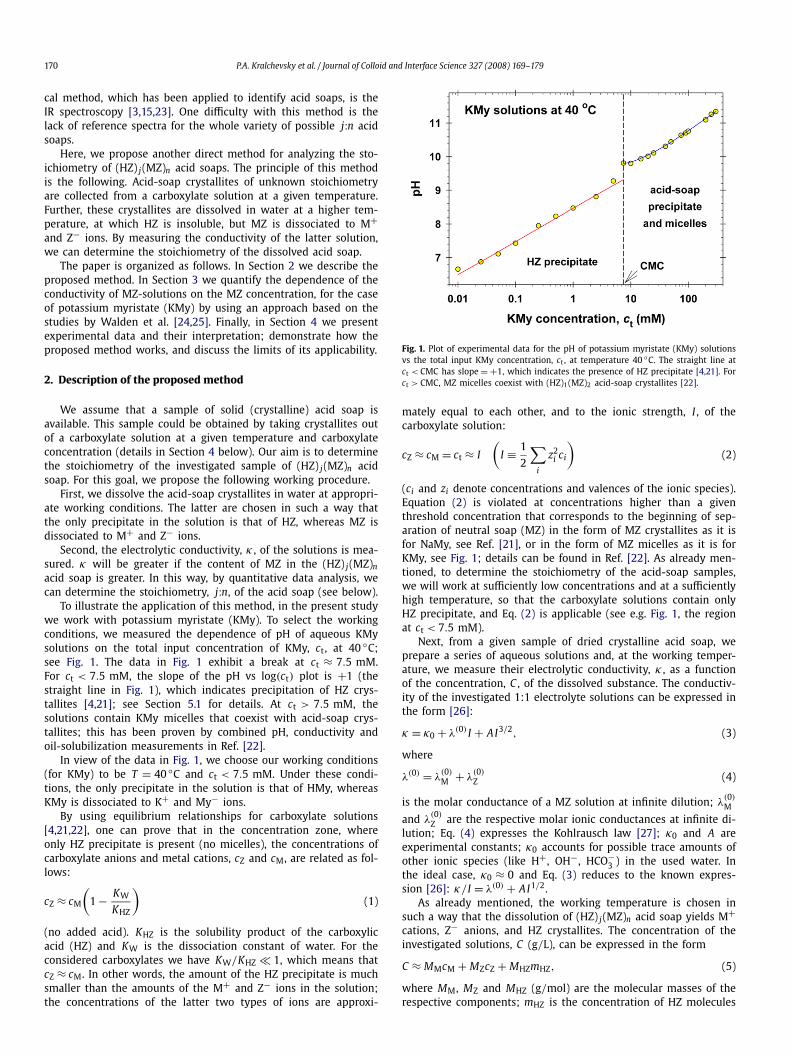
To illustrate the application of this method, in the present studywe work with potassium myristate (KMy). To select the workingconditions, we measured the dependence of pH of aqueous KMysolutions on the total input concentration of KMy, ct, at 40 ◦C;see Fig. 1. The data in Fig. 1 exhibit a break at ct ≈ 7.5 mM.For ct < 7.5 mM, the slope of the pH vs log(ct) plot is +1 (thestraight line in Fig. 1), which indicates precipitation of HZ crys-tallites [4,21]; see Section 5.1 for details. At ct > 7.5 mM, thesolutions contain KMy micelles that coexist with acid-soap crys-tallites; this has been proven by combined pH, conductivity andoil-solubilization measurements in Ref. [22].
In view of the data in Fig. 1, we choose our working conditions(for KMy) to be T = 40 ◦C and ct < 7.5 mM. Under these condi-tions, the only precipitate in the solution is that of HMy, whereasKMy is dissociated to K+ and My− ions.
By using equilibrium relationships for carboxylate solutions[4,21,22], one can prove that in the concentration zone, whereonly HZ precipitate is present (no micelles), the concentrations ofcarboxylate anions and metal cations, cZ and cM, are related as fol-lows:
cZ ≈ cM
(1 − KW
KHZ
)(1)
(no added acid). KHZ is the solubility product of the carboxylicacid (HZ) and KW is the dissociation constant of water. For theconsidered carboxylates we have KW/KHZ � 1, which means thatcZ ≈ cM. In other words, the amount of the HZ precipitate is muchsmaller than the amounts of the M+ and Z− ions in the solution;the concentrations of the latter two types of ions are approxi-
Fig. 1. Plot of experimental data for the pH of potassium myristate (KMy) solutionsvs the total input KMy concentration, ct , at temperature 40 ◦C. The straight line atct < CMC has slope = +1, which indicates the presence of HZ precipitate [4,21]. Forct > CMC, MZ micelles coexist with (HZ)1(MZ)2 acid-soap crystallites [22].
mately equal to each other, and to the ionic strength, I , of thecarboxylate solution:
cZ ≈ cM = ct ≈ I
(I ≡ 1
2
∑i
z2i ci
)(2)
(ci and zi denote concentrations and valences of the ionic species).Equation (2) is violated at concentrations higher than a giventhreshold concentration that corresponds to the beginning of sep-aration of neutral soap (MZ) in the form of MZ crystallites as it isfor NaMy, see Ref. [21], or in the form of MZ micelles as it is forKMy, see Fig. 1; details can be found in Ref. [22]. As already men-tioned, to determine the stoichiometry of the acid-soap samples,we will work at sufficiently low concentrations and at a sufficientlyhigh temperature, so that the carboxylate solutions contain onlyHZ precipitate, and Eq. (2) is applicable (see e.g. Fig. 1, the regionat ct < 7.5 mM).
Next, from a given sample of dried crystalline acid soap, weprepare a series of aqueous solutions and, at the working temper-ature, we measure their electrolytic conductivity, κ , as a functionof the concentration, C , of the dissolved substance. The conductiv-ity of the investigated 1:1 electrolyte solutions can be expressed inthe form [26]:
κ = κ0 + λ(0) I + AI3/2, (3)
where
λ(0) = λ(0)M + λ
(0)Z (4)
is the molar conductance of a MZ solution at infinite dilution; λ(0)M
and λ(0)Z are the respective molar ionic conductances at infinite di-
lution; Eq. (4) expresses the Kohlrausch law [27]; κ0 and A areexperimental constants; κ0 accounts for possible trace amounts ofother ionic species (like H+, OH−, HCO−
3 ) in the used water. Inthe ideal case, κ0 ≈ 0 and Eq. (3) reduces to the known expres-sion [26]: κ/I = λ(0) + AI1/2.
As already mentioned, the working temperature is chosen insuch a way that the dissolution of (HZ) j(MZ)n acid soap yields M+cations, Z− anions, and HZ crystallites. The concentration of theinvestigated solutions, C (g/L), can be expressed in the form
C ≈ MMcM + MZcZ + MHZmHZ, (5)
where MM, MZ and MHZ (g/mol) are the molecular masses of therespective components; mHZ is the concentration of HZ molecules

P.A. Kralchevsky et al. / Journal of Colloid and Interface Science 327 (2008) 169–179 171
in the form of HZ precipitate per unit volume of the solution; theconcentration of molecularly dissolved carboxylic acid, cHZ, is verysmall and it is neglected; here, the dimension of cZ, cM, and mHZis mol/L. In view of the stoichiometry of the dissolved (HZ) j(MZ)nacid soap, we have:
cM
mHZ= n
j, hence mHZ = j
ncM. (6)
With the help of Eqs. (2) and (6), we can represent Eq. (5) in theform:
I = C
MMZ + ( j/n)MHZ, (7)
where MMZ = MM + MZ is the molecular mass of the neutral soap.The theoretical dependence κ(C) is determined by Eqs. (3)
and (7). For a given C , and for a tentative value of j/n, we cal-culate I from Eq. (7), and then the value of I is substituted inEq. (3) to calculate κ . The molecular masses MMZ and MHZ areknown. The parameters κ0, λ(0) and A are determined in a sepa-rate experiment (see Section 3). The ratio j/n can be determinedas a single adjustable parameter from the fit of the data for κ(C);see Section 4.
3. Concentration dependence of the conductivity of carboxylatesolutions
3.1. Theoretical background
As known, with the increase of the total carboxylate concentra-tion, ct, different kinds of solid precipitates (HZ and j:n acid soaps)and micelles appear in the aqueous carboxylate solutions [3,12–14,19–21]. The electrolytic conductivity of these solutions, κ , mayexhibit one or more kinks when plotted as a function of ct [21,22,28–30]. This is due to the fact that the appearance of micellesand/or acid soap precipitates of different stoichiometry affects thetypes and concentrations of the ionic species in the solution. Inprinciple, the detailed analysis of the composition of the carboxy-late solutions, like that in Refs. [4,21,22], could reveal the types ofthe precipitates/micelles and allow a quantitative interpretation ofthe data for κ vs ct.
According to the theory by Onsager and Fuoss [31], the mo-lar conductance of a binary solution can be expressed in the form[26,31]:
λ = λ(0) − (A1 + A2)(2I)1/2, (8)
where
A j = 1.970 × 10⁶|z1z2|qλ(0)j
(εT )3/2(1 + q1/2)+ 28.98|z j |
η(εT )1/2( j = 1,2), (9)
ε and η are the dielectric constant and viscosity (in poises) of thesolvent; T is the absolute temperature; z1 and z2 are the valencesof the cations and anions; λ
(0)1 and λ
(0)2 are their molar conduc-
tances at infinite dilution:
q = |z1z2|(λ(0)1 + λ
(0)2 )
(|z1| + |z2|)(|z2|λ(0)1 + |z2|λ(0)
2 ). (10)
For 1:1 electrolyte, we have q = 0.5. In addition, the ionic molarconductance can be expressed in the form [26]:
λ(0)j = z je2N A
6πηr j, (11)
where e is the electronic charge, N A is the Avogadro number, andr j is the radius of the ion.
The first term in the right-hand side of Eq. (9) accounts forthe relaxation effect; this term depends on the ionic radius, r j ,
(a)
(b)
Fig. 2. (a) Molar conductance of solution of four electrolytes (NaCl, KCl, NaI, and KI)vs the solutions’ ionic strength, I . (b) Plot of the correction term, �λ = λ(0) − λ, vsI for the same electrolytes. Plots of data from Refs. [26] and [32].
through λ(0)j . The last term in Eq. (9) accounts for the elec-
trophoretic effect; this term is independent of the ionic radius, r j ,and is the same for different ions of the same valence.
On the basis of a set of experimental data, Walden et al. [24,25]arrived at the following semiempirical equation:
λ = λ(0) − AI1/2, A ≈ 65.7
εη, (12)
which was found to be applicable to a large number of electrolytesin different solvents [26]. Equation (12) implies that only λ(0) issensitive to the type of the ion (through r j—see Eq. (11)), whereasthe parameter A in the correction term is the same for different1:1 electrolytes [24–26].
To check the applicability of the Walden’s approach, in Fig. 2we have plotted literature data for λ from Refs. [26] and [32] forfour electrolytes, NaCl, KCl, NaI, and KI, at 25 ◦C. On the one hand(Fig. 2a), there is a difference between some of the experimen-tal curves, which are mostly due to the different λ
(0)j for the Na+
and K+ ions (λ(0)Na = 50.1 vs λ
(0)K = 73.5 cm2 S/mol; 25 ◦C). On the
other hand, the correction term, �λ ≡ λ(0) − λ, is almost the samefor these four different electrolytes (Fig. 2b). This result is agree-ment with the Walden’s approach; see Eq. (12). In view of Eq. (9),this implies that the electrophoretic effect is predominant. [If the

172 P.A. Kralchevsky et al. / Journal of Colloid and Interface Science 327 (2008) 169–179
(a)
(b)
Fig. 3. Plots of the limiting molar ionic conductance of (a) K+ and (b) Cl− ions asfunctions of the inverse viscosity of water, η−1. The lines are linear regressions.
relaxation effect were important, this would lead to influence of r j
on �λ through λ(0)j , see Eqs. (9) and (11), which is not the case.]
Following the Walden’s approach, below we check whether thecorrection term, �λ ≡ λ(0) −λ, is the same for KCl and KMy. If thisis confirmed, we may use �λ, obtained from the available accurateset of data for the conductivity of KCl, to interpret the conductivitydata for solutions of KMy and its acid soaps.
3.2. Temperature dependence of λ(0)
To analyze our data, we need the values of λ(0)j for K+ and
Cl− ions at 40 ◦C. For this goal, we used literature data for λ(0)j (T )
from Ref. [33], which were interpolated to determine the value at40 ◦C, see Fig. 3. The same interpolation curves might be used toobtain the value of λ
(0)j at other temperatures. We utilized the fact
that the main temperature dependence of λ(0)j originates from the
strong dependence of the viscosity of water, η, on temperature. Forthis reason, in Fig. 3 we plot λ
(0)j vs η−1, which turns out to be a
straight line:
λ(0)X = aX + bX (13)
η
Table 1Molar ionic conductances, λ
(0)j (cm2 S/mol), of several ions in aqueous solutions at
infinite dilution, and at three different temperatures
Conductance 10 ◦C 25 ◦C 40 ◦C
λ(0)Na 34.88 50.10 67.56
λ(0)K 52.96 73.50 95.69
λ(0)
Cl 54.32 76.35 100.6
λ(0)H 275.4 349.8 419.1
λ(0)OH 141.4 198.3 260.6
λ(0)HCO3
30.34 44.50 60.66
12 λ
(0)CO3
47.24 69.30 94.47
Fig. 4. Plot of experimental data for the conductivity, κ , of KCl solutions vs the KClconcentration, c. The line is the best fit by Eq. (14).
(X = K, Cl, . . .). The coefficients aX and bX, determined from theinterpolating linear regression, are given in Fig. 3. Similar approachis applicable also to other ions. For example, for Na+ ions, Eq. (13)is applicable with aX = 2.19 and bX = 42.70 (the same units as inFig. 3). As an illustration of the temperature effect, results that areuseful for the analysis of conductivity of carboxylate solutions areshown in Table 1 for several ions at three different temperatures:10, 25 and 40 ◦C.
3.3. Comparison of the conductivities of KMy and KCl at 40 ◦C
In this case, the conductivity of the investigated solutions canbe described by the expression:
κ = κ0 + λ(0)c − Ac3/2 (T = 40 ◦C), (14)
where c = I is the concentration of the 1:1 electrolyte solution; κ0is the same as in Eq. (3).
Fig. 4 shows our experimental data for the conductivity κ(c)of KCl at 40 ◦C. For this system, the coefficient λ(0) in Eq. (14) isknown: from Table 1 we find λ(0) = λ
(0)K +λ
(0)
Cl = 196.29 cm2 S/mol.Using the latter value, we fitted the data in Fig. 4 by meansof Eq. (14), and determined κ0 and A as adjustable parame-ters. Thus, we obtained: κ0 = 0.064 ± 0.02 mS cm−1, A = 204.4 ±1.5 mS cm−1 M−3/2.
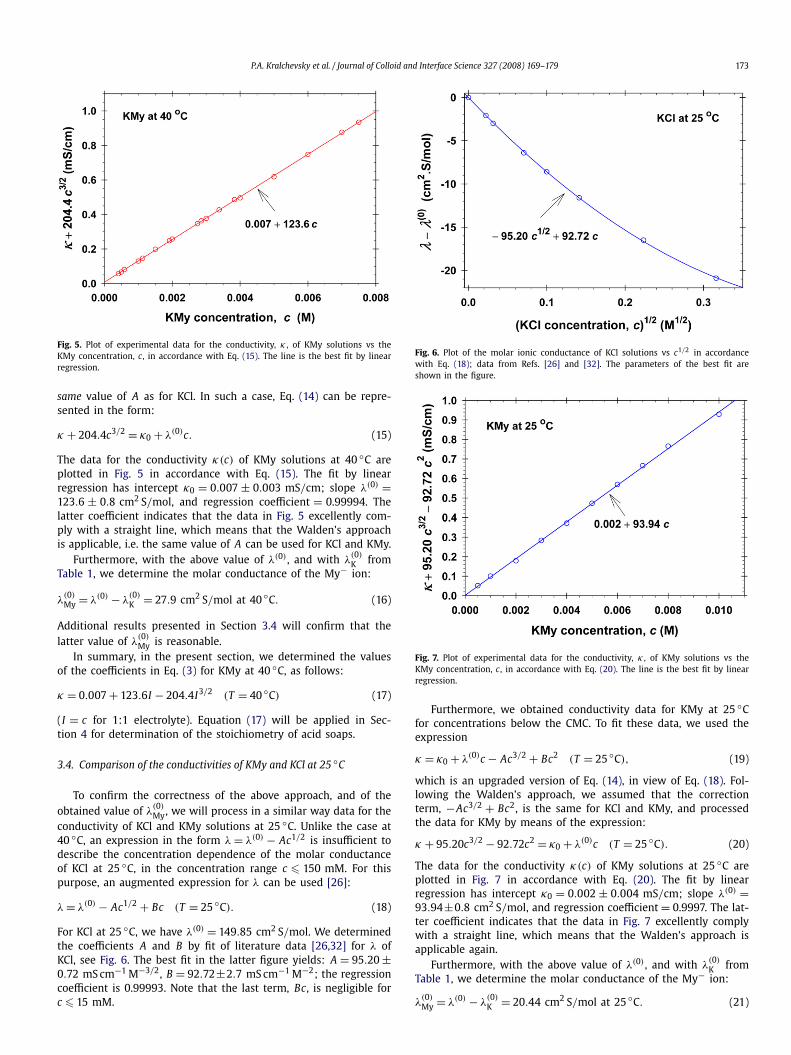
In addition, we obtained data for the conductivity of KMy solu-tions at 40 ◦C and at concentrations c < 7.5 mM (below the CMC).Under these conditions, the solutions contain K+ and Z− ions, andHZ precipitate. To process the conductivity data for KMy, we willapply Eq. (14). Following the Walden’s approach we will use the
P.A. Kralchevsky et al. / Journal of Colloid and Interface Science 327 (2008) 169–179 173
Fig. 5. Plot of experimental data for the conductivity, κ , of KMy solutions vs theKMy concentration, c, in accordance with Eq. (15). The line is the best fit by linearregression.
same value of A as for KCl. In such a case, Eq. (14) can be repre-sented in the form:
κ + 204.4c3/2 = κ0 + λ(0)c. (15)
The data for the conductivity κ(c) of KMy solutions at 40 ◦C areplotted in Fig. 5 in accordance with Eq. (15). The fit by linearregression has intercept κ0 = 0.007 ± 0.003 mS/cm; slope λ(0) =123.6 ± 0.8 cm2 S/mol, and regression coefficient = 0.99994. Thelatter coefficient indicates that the data in Fig. 5 excellently com-ply with a straight line, which means that the Walden’s approachis applicable, i.e. the same value of A can be used for KCl and KMy.
Furthermore, with the above value of λ(0) , and with λ(0)K from
Table 1, we determine the molar conductance of the My− ion:
λ(0)My = λ(0) − λ
(0)K = 27.9 cm2 S/mol at 40 ◦C. (16)
Additional results presented in Section 3.4 will confirm that thelatter value of λ
(0)My is reasonable.
In summary, in the present section, we determined the valuesof the coefficients in Eq. (3) for KMy at 40 ◦C, as follows:
κ = 0.007 + 123.6I − 204.4I3/2 (T = 40 ◦C) (17)
(I = c for 1:1 electrolyte). Equation (17) will be applied in Sec-tion 4 for determination of the stoichiometry of acid soaps.
3.4. Comparison of the conductivities of KMy and KCl at 25 ◦C
To confirm the correctness of the above approach, and of theobtained value of λ
(0)My, we will process in a similar way data for the
conductivity of KCl and KMy solutions at 25 ◦C. Unlike the case at40 ◦C, an expression in the form λ = λ(0) − Ac1/2 is insufficient todescribe the concentration dependence of the molar conductanceof KCl at 25 ◦C, in the concentration range c � 150 mM. For thispurpose, an augmented expression for λ can be used [26]:
λ = λ(0) − Ac1/2 + Bc (T = 25 ◦C). (18)
For KCl at 25 ◦C, we have λ(0) = 149.85 cm2 S/mol. We determinedthe coefficients A and B by fit of literature data [26,32] for λ ofKCl, see Fig. 6. The best fit in the latter figure yields: A = 95.20 ±0.72 mS cm−1 M−3/2, B = 92.72±2.7 mS cm−1 M−2; the regressioncoefficient is 0.99993. Note that the last term, Bc, is negligible forc � 15 mM.
Fig. 6. Plot of the molar ionic conductance of KCl solutions vs c1/2 in accordancewith Eq. (18); data from Refs. [26] and [32]. The parameters of the best fit areshown in the figure.
Fig. 7. Plot of experimental data for the conductivity, κ , of KMy solutions vs theKMy concentration, c, in accordance with Eq. (20). The line is the best fit by linearregression.
Furthermore, we obtained conductivity data for KMy at 25 ◦Cfor concentrations below the CMC. To fit these data, we used theexpression
κ = κ0 + λ(0)c − Ac3/2 + Bc2 (T = 25 ◦C), (19)
which is an upgraded version of Eq. (14), in view of Eq. (18). Fol-lowing the Walden’s approach, we assumed that the correctionterm, −Ac3/2 + Bc2, is the same for KCl and KMy, and processedthe data for KMy by means of the expression:
κ + 95.20c3/2 − 92.72c2 = κ0 + λ(0)c (T = 25 ◦C). (20)
The data for the conductivity κ(c) of KMy solutions at 25 ◦C areplotted in Fig. 7 in accordance with Eq. (20). The fit by linearregression has intercept κ0 = 0.002 ± 0.004 mS/cm; slope λ(0) =93.94±0.8 cm2 S/mol, and regression coefficient = 0.9997. The lat-ter coefficient indicates that the data in Fig. 7 excellently complywith a straight line, which means that the Walden’s approach isapplicable again.
Furthermore, with the above value of λ(0) , and with λ(0)K from
Table 1, we determine the molar conductance of the My− ion:
λ(0)My = λ(0) − λ
(0)K = 20.44 cm2 S/mol at 25 ◦C. (21)

174 P.A. Kralchevsky et al. / Journal of Colloid and Interface Science 327 (2008) 169–179
On the other hand, using Eq. (16) we calculate
λ(0)My(25 ◦C) ≈ η(40 ◦C)
η(25 ◦C)λ
(0)My(40 ◦C) = 20.5 cm2 S/mol, (22)
where the intercept aX in Eq. (13) has been neglected, and therespective values of the viscosity of water have been substituted:η (25 ◦C) = 0.8903 and η (40 ◦C) = 0.6531 (mPa s). The values ofλ
(0)My in Eqs. (21) and (22) agree very well, which confirms the ap-
plicability of the used approach.In summary, in the present section, we determined the coeffi-
cients in the concentration dependence of conductivity for KMy at25 ◦C:
κ = 0.002 + 93.94I − 95.20I3/2 + 92.72I2 (T = 25 ◦C), (23)
which is used for interpretation of our data for the conductivity ofKMy solutions in Ref. [22].
4. Determination of the acid-soap stoichiometry
4.1. Experimental procedure
Solutions of potassium myristate (KMy) were prepared by usingtwo different procedures.
Procedure 1: KMy solutions were obtained by dissolving stoi-chiometric amounts of myristic acid (HMy, Fluka, 98% pure) andpotassium hydroxide (KOH, Teokom, pure for analysis) at 60 ◦C, andstirring for 30 min. Then, the solutions were cooled down to 25 ◦C.
Procedure 2: The same as Procedure 1, but commercial KMy(producer Viva Corporation) was dissolved.
In some experiments (Procedure 1), the amount of KOH was87.5% of that needed for full neutralization of HMy. The obtainedsolutions contain 87.5% KMy and 12.5% HMy. Thus, we checked theeffect of added HMy on the precipitates in the investigated solu-tions. In other experiments, KCl (product of Sigma) was added tothe solutions.
In many of the investigated solutions, we observe the forma-tion of crystallites of size greater than 1 μm, which can be seenby optical microscopy. To separate these crystallites from the so-lution, the latter was poured in a filtration module, with a porousglass filter S3 at the bottom. In our experiments, we used a glassmembrane of maximum pore size 33 μm. The aqueous phase issucked out from the filtration module by a water pump for about5–10 min depending on the volume of the filtrated solution. Thecrystallites are deposited at the upper surface of the glass filter.After that, they are placed in a Petri dish and dried in a vacuumdrier at room temperature.
The working solutions for conductivity analysis were preparedby dissolving corresponding amounts of the collected crystallites at60 ◦C to obtain a solution of a given concentration, C g/L. Finally,the solutions were cooled down to the working temperature of40 ◦C, and their electrolytic conductivity, κ , was measured. In ourfirst set of κ-measurements, we maintained 40 ± 2 ◦C, which ledto some scattering of the data. Further, we improved the tempera-ture control and succeeded to maintain 40 ± 0.1 ◦C, which resultedin smoother experimental curves.
4.2. Experimental results and their interpretation
Fig. 8a shows κ-vs-C experimental data for dissolved acid-soapcrystallites that have been initially formed in a solution of 8.5 mMKMy at 25 ◦C, prepared by Procedure 1. This concentration is justabove the CMC, which is 7.5 mM KMy for this system [22]. Duringthe conductivity analysis, the temperature was maintained 40 ±0.1 ◦C for the points denoted by circles, and 40±2 ◦C for the pointsdenoted by triangles. The theoretical line is drawn by means ofEqs. (7) and (17) for j/n = 1. The fact that this theoretical line
(a)
(b)
Fig. 8. κ-vs-C plot of experimental data for dissolved acid-soap crystallites that havebeen initially formed in (a) solution of 8.5 mM KMy at 25 ◦C, prepared by Proce-dure 1, and (b) solution of 20 mM KMy at 25 ◦C, prepared by Procedure 2. Thetemperature is maintained 40 ± 0.1 ◦C and ±2 ◦C, respectively, for the points de-noted by circles and triangles. The theoretical lines are drawn by means of Eqs. (7)and (17) for j/n = 1.
complies very well with the experimental data indicates that theinvestigated crystallites are of 1:1 acid soap.
Fig. 8b shows κ-vs-C experimental data for dissolved acid-soapcrystallites that have been initially formed in a solution of 20 mMKMy at 25 ◦C, prepared by Procedure 2. This concentration corre-sponds to about 3 times the CMC. During the conductivity analysis,the temperature was maintained 40±0.1 ◦C for the points denotedby circles, and 40 ± 2 ◦C for the points denoted by triangles. Thetheoretical line is drawn by means of Eqs. (7) and (17) for j/n = 1.Again, the theoretical line agrees very well with the experimen-tal data indicating that the investigated crystallites are of 1:1 acidsoap.
Fig. 9a shows κ-vs-C experimental data for dissolved acid-soapcrystallites that have been initially formed in a 100 mM solutionof 87.5% KMy and 12.5% HMy at 25 ◦C (without added KCl), pre-pared by Procedure 1. This concentration is 10 times the CMC,which corresponds to a total surfactant concentration of 10 mM forthis system [22]. During the conductivity analysis, the temperaturewas maintained 40 ± 0.1 ◦C. The theoretical line, which is drawnby means of Eqs. (7) and (17) for j/n = 1, complies very well withthe experimental data indicating that the investigated crystallitesare of 1:1 acid soap, again.

P.A. Kralchevsky et al. / Journal of Colloid and Interface Science 327 (2008) 169–179 175
(a)
(b)
Fig. 9. κ-vs-C plot of experimental data for dissolved acid-soap crystallites that havebeen initially formed in 100 mM solutions of 87.5% KMy and 12.5% HMy at 25 ◦C,prepared by Procedure 1: (a) Without added KCl at T = 40 ± 0.1 ◦C; the fit is drawnfor j/n = 1. (b) With added 100 mM KCl at T = 40 ± 2 ◦C; the fit is drawn forj/n = 3/2. In both cases, Eqs. (7) and (17) have been used to fit the data.
Fig. 9b shows κ-vs-C experimental data for dissolved acid-soapcrystallites that have been initially formed in a 100 mM solutionof 87.5% KMy and 12.5% HMy + 100 mM KCl at 25 ◦C, preparedby Procedure 1. This concentration is 50 times the CMC, whichcorresponds to a total surfactant concentration of 2 mM for thissystem [22]. During the conductivity analysis, the temperature wasmaintained 40 ± 2 ◦C. The theoretical line is drawn by means ofEqs. (7) and (17) for j/n = 3/2. The fact that this theoretical lineagrees very well with the experimental data indicates that the in-vestigated crystallites are of 3:2 acid soap.
In Fig. 10, we compare the κ-vs-C experimental data and the-oretical curves obtained for different samples of soap crystallites.The upper curve (A) represents a part of the results for KMy shownin Fig. 5. The symbols denoted by B, C, and D are the data fromFigs. 8a, 8b, and 9a. The diamond symbols denoted by E corre-spond to the data in Fig. 9b. The symbols denoted by F and G aredata for crystallites taken, respectively, from 4 and 150 mM KMysolutions at 25 ◦C; the fit shows that both of them are of 1:1 acidsoap.
The comparison of the results in Fig. 10 indicates that the pro-posed conductivity method for analysis of acid soaps is sensitiveenough to distinguish between soaps of different stoichiometry
Fig. 10. Comparison of κ-vs-C plots of experimental data and theoretical curvesobtained for different samples of soap crystallites. The upper curve (A) representsa part of the results for KMy shown in Fig. 5. The other curves are obtained bydissolving (at 40 ◦C) crystallites that have been collected at 25 ◦C from the followingaqueous solutions: B—8.5 mM KMy (Fig. 8a); C—20 mM KMy (Fig. 8b); D—100 mMsolution of 87.5% KMy and 12.5% HMy (Fig. 9a); E—100 mM solution of 87.5% KMyand 12.5% HMy + 100 mM KCl (Fig. 9b); F—4 mM KMy; G—150 mM KMy.
supposedly the working temperature during the conductivity mea-surements (40 ◦C in the present study) is maintained with a suffi-cient accuracy.
4.3. Discussion
A new step in the present article is that the conductivity isused as a quantitative method for analysis of carboxylate solutions.In the previous papers on this theme [21,28–30], only the kinksin the conductivity curves were used as indicators for the appear-ance of micelles or changes in the stoichiometry of the acid-soapprecipitates. This is related to the known fact that the populartheoretical expression by Onsager and Fuoss, Eqs. (8)–(9), is notquantitative, i.e. it does not agree well with the experiment. Here,we combined an empirical (but quantitative) expression for con-ductivity, Eq. (3) or Eq. (19), with the Walden’s finding [24,25] thatthe correction term, and in particular the coefficients A and B (un-like λ(0)) are not sensitive to the ionic size. We first determined Aand B for KCl (Figs. 4 and 6), and the results were further appliedto KMy solutions to determine λ
(0)My at the respective temperature
(Figs. 5 and 7). In this way, we find all coefficients in Eq. (3) orEq. (19), which in combination with Eq. (7) gives the theoreticaldependence κ(C). The latter contains a single adjustable parame-ter, the acid-soap stoichiometry, j/n, which is finally determinedfrom the fit of the experimental data for κ ; see Figs. 8–10.
From the viewpoint of future applications, it should be notedthat the values of the coefficients A and B can be found in somehandbooks [34] for many electrolytes at some temperatures. Al-ternatively, we could experimentally determine A and B at theworking temperature, as this is done in the present study.
One limitation of the proposed method is that it is not applica-ble when the ratio j/n is very small. Indeed, the term ( j/n)MHZ inEq. (7) must not be negligible in comparison with MMZ. Otherwise,the solution’s ionic strength and conductivity will be insensitive tothe stoichiometry of the dissolved acid soap.
The second limitation of this method, and of all methods thatare based on the use of samples of dried acid- or neutral-soapcrystals, is that in some cases the amount of crystallites in the so-lution is very small, or their size is very small (smaller than 1 μm),so that it is very difficult to prepare samples of dried crystals. Inthe latter case, one could use the in situ method [4,21,22], which isbased on pH measurements directly in the mother solutions, with-out the necessity to separate and dry crystallites; see Section 5.
176 P.A. Kralchevsky et al. / Journal of Colloid and Interface Science 327 (2008) 169–179
5. Confirmation of the results by independent pH measurements
5.1. Theoretical background
In the case when a precipitate of carboxylic acid (HZ) crystal-lites is present in the solution, the respective chemical equilibriumrelation reads [4,21]:
cHcZγ2± = KHZ, (24)
where cH and cZ are the concentrations of the respective ionsin the solution; KHZ = const. is the solubility product of HZ; γ±is the activity coefficient tabulated in [33]. The combination ofEq. (24) with the electroneutrality condition and other chemical-equilibrium relationships leads to the expression [4,21]:
(ct + cH)cHγ 2± = Kt = const. (25)
The total input concentration of carboxylate (in our case K My)is known, and cH is determined by pH measurements [pH ≡− log(cHγ±)]. Equation (25) can be compared with the experimen-tal data in two different ways.
First, as suggested by Lucassen [4] for cH � ct and γ± ≈ 1,Eq. (25) can be represented in the form:
pH ≈ log ct − log Kt, (26)
i.e. the slope of the pH vs log ct plot is +1 if a HZ precipitate ispresent [4]; see Fig. 11a.
Second, taking log of Eq. (25) we define the characteristic func-tion for precipitate of carboxylic acid [21]:
fHZ ≡ log[(ct + cH)cHγ 2±
] = log Kt = const. (27)
The concentration region, in which HZ precipitate is present, isidentified in the following way. The function fHZ, defined byEq. (27), is plotted vs ct using the experimental cH(ct) dependence(determined by pH measurements). In the concentration regionwhere a precipitate of HZ is present, the curve fHZ(ct) exhibitsa plateau, whose height is equal to log Kt; see Fig. 11b.
In the case when a precipitate of j:n acid soap, (HZ) j(MZ)n , ispresent in the solution, the respective chemical equilibrium rela-tion reads [21]:
c jHcn
Mc j+nZ γ
2 j+2n± = K jn ( j,n = 1,2,3, . . .), (28)
where K jn = const. is the solubility product for the j:n acid-soapcrystallites. Under typical experimental conditions, we have cZ ≈ ctand cM ≈ ct + c A [21], where c A is the concentration of the addedinorganic electrolyte (in our case KCl), and then Eq. (28) acquiresthe form:
c jH(ct + c A)nc j+n
t γ2 j+2n± ≈ K jn = const. (29)
Equation (29) can be compared with the experimental data in thefollowing two ways.
First, for γ± ≈ 1 and c A = 0, Eq. (29) can be represented in theform [21]:
pH ≈ (1 + 2n/ j) log ct − (1/ j) log K jn, (30)
i.e. the slope of the pH vs log ct plot is equal to (1 + 2n/ j) if aj:n acid-soap precipitate is present; see e.g. Fig. 11a, where (1 +2n/ j) = 3 for 1:1 acid-soap precipitate.
Second, taking log of Eq. (29) we define the characteristic func-tion for precipitate of j:n acid soap [21]:
f jn ≈ log[(ct + c A)nc j+n
t γj+2n
±] − jpH, (31)
j,n = 1,2,3, . . . . The concentration region, in which j:n acid-soapprecipitate is present, is identified in the following way. The func-tion f jn , defined by Eq. (31), is plotted vs ct using the experi-mental cH(ct) dependence (determined by pH measurements). In
the concentration region where a precipitate of j:n acid soap ispresent, the curve f jn(ct) exhibits a plateau, whose height is equalto log K jn . We have to check for which values of j and n the char-acteristic function f jn exhibits a horizontal plateau. In Fig. 11b, thisis the case of j = n = 1, i.e. the precipitate is of 1:1 acid soap.
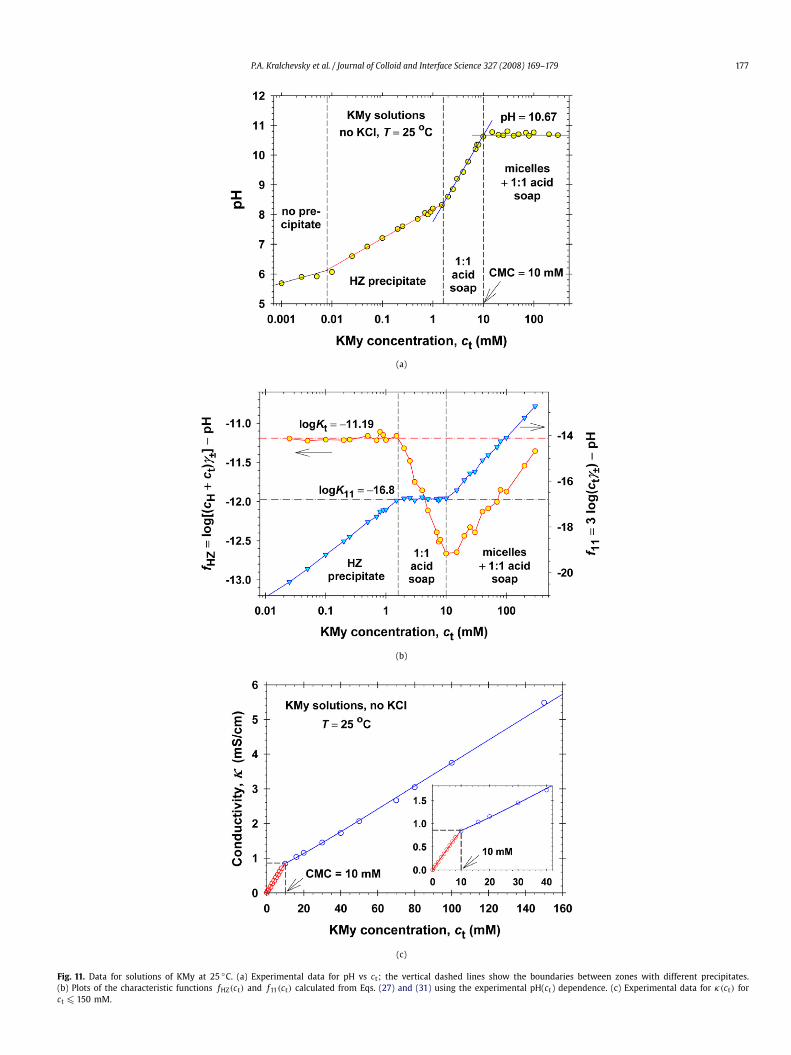
5.2. Solutions of KMy at 25 ◦C
Fig. 11a shows of experimental data for pH vs ct measuredfor KMy solutions at 25 ◦C. In the concentration region 0.008 <
ct < 1.6 (mM) the data comply with a straight line of slope +1,which indicates that the precipitate in these solutions is of HZ; seeEq. (26). This is confirmed by the plateau of the function fHZ(ct)
in Fig. 11b.Further, in the concentration region 1.6 < ct < 10 (mM) the
data in Fig. 11a comply with a straight line of slope +3, whichindicates that the precipitate in these solutions is of 1:1 acid soap;see Eq. (30). This is also confirmed by the plateau of the functionf11(ct) in Fig. 11b. Because the concentrations 4 and 8.5 mM, atwhich crystallites have been taken from a KMy solution at 25 ◦C,belongs to the interval 1.6 < ct < 10 (mM), these crystallites are of1:1 acid soap, which is in agreement with the result of the inde-pendent conductivity method proposed in the present article; seeFig. 8a, Fig. 10—curve F, and the related text.
The results in Fig. 11a indicate also that in the region 1.6 < ct <
10 (mM) the precipitate cannot be a mixture of acid soaps. Thisis guaranteed by the Gibbs phase rule. Indeed, if a second kindof acid-soap crystals (of different stoichiometry) were present, thepH would be constant as it follows from the Gibbs phase rule [4],which is not fulfilled in this concentration region.
In Fig. 11a, pH is constant for ct > 10 mM. In addition, Fig. 11cshows that the conductivity of these solutions exhibits a kink atct = 10 mM. At ct > 10 mM the conductivity increases, but witha smaller slope (as compared to the slope at ct < 10 mM). Sucha behavior of conductivity indicates the formation of micelles inthese solutions for ct > 10 mM. This is confirmed by independentoil-solubilization and film-stratification experiments in Ref. [22].At 25 ◦C and ct > 10 mM, the KMy solutions contain also micro-crystalline precipitates, which are seen by direct microscopic ob-servations. We collected such crystallites (from solutions of 20 and150 mM KMy, see Fig. 8b and Fig. 10—curve G) as explained inSection 4.1, and subjected them to conductivity analysis at 40 ◦C.The results (like those in Fig. 10—curves C and G) show that theprecipitate above the CMC is of 1:1 acid soap, at least in the in-vestigated range, 10 < ct < 150 mM, i.e. the micelles appear on thebackground of the 1:1 acid soap crystallites, which are also presentin the solutions in the neighboring concentration region below theCMC, 1.6 < ct < 10 mM; see above. In other words, the appearanceof micelles does not change the stoichiometry of the acid-soapcrystallites. In Ref. [22], this conclusion is confirmed by indepen-dent theoretical analysis from the value pH = 10.67 (Fig. 11a) andfrom the slope of the κ vs ct dependence (Fig. 11c) at ct > 10 mM.
It is worthwhile noting that the lack of a second kink of theκ vs ct dependence in the region 10 < ct < 150 mM (Fig. 11c) in-dicates that there is no appearance of liquid-crystalline phases orother changes in the type of precipitate in this concentration re-gion.
5.3. Solutions of 87.5% KMy and 12.5% HMy + 100 mM KCl at 25 ◦C
We chose to analyze this type of solutions, because the con-ductivity analysis (Fig. 9b) shows that they contain acid soap ofdifferent stoichiometry, viz. 3:2 acid soap.
Fig. 12a shows of experimental data for pH vs ct measuredat 25 ◦C for solutions that contain 87.5% KMy and 12.5% HMy +100 mM KCl. For ct < 0.4 (mM) the data comply with a straight
P.A. Kralchevsky et al. / Journal of Colloid and Interface Science 327 (2008) 169–179 177
(a)
(b)
(c)
Fig. 11. Data for solutions of KMy at 25 ◦C. (a) Experimental data for pH vs ct; the vertical dashed lines show the boundaries between zones with different precipitates.(b) Plots of the characteristic functions fHZ(ct) and f11(ct) calculated from Eqs. (27) and (31) using the experimental pH(ct) dependence. (c) Experimental data for κ(ct) forct � 150 mM.

178 P.A. Kralchevsky et al. / Journal of Colloid and Interface Science 327 (2008) 169–179
(a)
(b)
(c)
Fig. 12. Data for solutions of 87.5% KMy and 12.5% HMy + 100 nM KCl at 25 ◦C. (a) pH vs ct; the vertical dashed lines are boundaries between zones with differentprecipitates. (b) The characteristic functions fHZ(ct) and f32(ct) calculated from Eqs. (27) and (31) using the experimental pH(ct) dependence. (c) Experimental data for κ(ct)
for ct � 110 mM. ct is the total input concentration of myristate due to both KMy and HMy; x = 0.125 is the molar fraction of HMy.

P.A. Kralchevsky et al. / Journal of Colloid and Interface Science 327 (2008) 169–179 179
Table 2Comparison of the values of j:n determined by the conductivity method (Section 4)and by the in situ pH method (Section 5 and Ref. [22])
Mother solution(25 ◦C)
j:nSection 4
j:nSection 5 andRef. [22]
4 mM KMy 1:1 1:18.5 mM KMy 1:1 1:120 mM KMy 1:1 1:1150 mM KMy 1:1 1:1100 mM (87.5% KMy + 12.5% HMy) 1:1 1:1100 mM (87.5% KMy + 12.5% HMy) + 100 mM KCl 3:2 3:2
line of slope +1, which indicates that the precipitate in these so-lutions is of HZ; see Eq. (26). This is confirmed by the plateau ofthe function fHZ(ct) in Fig. 12b.
Further, in the concentration region 0.4 < ct < 5 (mM) thepH(ct) data in Fig. 12a exhibits a linear dependence of a greaterslope. In this case, Eq. (30) is not applicable, because c A = 100 mMKCl, and γ± is essentially smaller than 1. However, the methodbased on Eq. (31) works and gives that the crystalline precipitatesin these solutions are of 3:2 acid soap ( j = 3, n = 2), see Fig. 12b.As seen in Figs. 12a and 12b, the transition from HZ to 3:2 acid-soap precipitates causes a considerable jump in the pH.
We see that in Fig. 12a we have pH ≈ constant for ct > 5 mM.In addition, Fig. 12c shows that the conductivity of these so-lutions exhibits a kink at ct = 5 mM. At ct > 5 mM the con-ductivity increases, but with a smaller slope (as compared tothe slope at ct < 5 mM). As in Fig. 11c, such behavior of con-ductivity indicates the formation of micelles in the respectivesolutions (at ct > 5 mM). This is confirmed by independent oil-solubilization and film-stratification experiments in Ref. [22]. At25 ◦C and ct > 5 mM, the investigated solutions contain alsomicro-crystalline precipitates. We collected such crystallites fromsolutions of 100 mM myristate (87.5% KMy + 12.5% HMy) as ex-plained in Section 4.1, and subjected them to conductivity analysisat 40 ◦C. The results (Fig. 9b) show that the precipitate above theCMC (5 mM) is of 3:2 acid soap, i.e. the micelles appear on thebackground of the 3:2 acid soap crystallites, which are also presentin the solutions in the neighboring concentration region below theCMC, 0.4 < ct < 5 mM; see above. In other words, the appearanceof micelles does not change the stoichiometry of the acid-soapcrystallites in these solutions. In Ref. [22], this conclusion is con-firmed by independent theoretical analysis from the values of pH(Fig. 12a) and the slope of the κ vs ct dependence (Fig. 12c) atct > 5 mM.
It should be also noted that the lack of a second kink of theκ vs ct dependence in the region 5 < ct < 110 mM (Fig. 12c) in-dicates that there is no appearance of liquid-crystalline phases orother changes in the type of precipitate in this concentration re-gion.
We compared the conductivity method from Section 4 with thepH method from Section 5 also for several other solutions. Theresults are summarized in Table 2. We see that in all investigatedcases the two methods give coinciding results for the stoichiometryof the acid soaps.
6. Summary and conclusions
A method for determining the stoichiometry of acid soap crys-tallites is developed, which is based on electrolytic conductivitymeasurements. It is applied to aqueous solutions of potassium
myristate (KMy), for which the working temperature is chosen tobe 40 ◦C. At this temperature, the only precipitate is that of HZfor concentrations below the CMC (Fig. 1). In the theoretical modeldata interpretation, we took into account the dependence of themolar conductance on the electrolyte concentration by using theWalden’s approach, which is semiempirical, but quantitative (Sec-tion 3). The fits of the data were drawn by means of Eqs. (7)and (17). The method was applied to determine the compositionof six different samples of acid-soap crystallites (Figs. 8–10). Themethod is sensitive enough to distinguish between acid soaps ofdifferent composition (Fig. 10). The stoichiometry of all samplesobtained in the present study coincides with that independentlydetermined by pH measurements in the mother solutions (fromwhich the crystallites have been collected); see Section 5, Table 2,and Ref. [22].
Acknowledgments
We gratefully acknowledge the support of Unilever Research &Development, Trumbull, CT, and of EU COST Action D43 for thisstudy. The authors are thankful to Prof. I.B. Ivanov for the stimu-lating discussions.
References
[1] R.G. Bartolo, M.L. Lynch, Kirk-Othmers Encyclopedia of Chemical Technologies,fourth ed., Wiley, New York, 1997.
[2] M.R. Porter, Handbook of Surfactants, Blackie Academic & Professional, London,1997.
[3] M.L. Lynch, F. Wireko, M. Tarek, M. Klein, J. Phys. Chem. B 105 (2001) 552–561.[4] J. Lucassen, J. Phys. Chem. 70 (1966) 1824–1830.[5] P. Ekwall, W. Mylius, Ber. Deutsch. Chem. Ges. 62 (1929) 1080–1084.[6] P. Ekwall, W. Mylius, Ber. Deutsch. Chem. Ges. 62 (1929) 2687–2690.[7] P. Ekwall, Z. Anorg. Allg. Chem. 210 (1933) 337–349.[8] J.W. McBain, M.C. Field, J. Phys. Chem. 37 (1933) 675–684.[9] J.W. McBain, M.C. Field, J. Chem. Soc. (1933) 920–924.
[10] P. Ekwall, Kolloid-Z. 92 (1940) 141–157.[11] P. Ekwall, L.G. Lindblad, Kolloid-Z. 94 (1941) 42–57.[12] P. Ekwall, Colloid Polym. Sci. 266 (1988) 279–282.[13] M.L. Lynch, Y. Pan, R.G. Laughlin, J. Phys. Chem. 100 (1996) 357–361.[14] M.L. Lynch, Curr. Opin. Colloid Interface Sci. 2 (1997) 495–500.[15] X. Wen, E.I. Franses, J. Colloid Interface Sci. 231 (2000) 42–51.[16] X. Wen, J. Lauterbach, E.I. Franses, Langmuir 16 (2000) 6987–6994.[17] J.R. Kanicky, D.O. Shah, Langmuir 19 (2003) 2034–2038.[18] A.M. Saitta, M.L. Klein, J. Chem. Phys. 118 (2003) 1–3.[19] M. Heppenstall-Butler, M.F. Butler, Langmuir 19 (2003) 10061–10072.[20] S. Zhu, M. Heppenstall-Butler, M.F. Butler, P.D.A. Pudney, D. Ferdinando, K.J.
Mutch, J. Phys. Chem. B 109 (2005) 11753–11761.[21] P.A. Kralchevsky, K.D. Danov, C.I. Pishmanova, S.D. Kralchevska, N.C. Christov,
K.P. Ananthapadmanabhan, A. Lips, Langmuir 23 (2007) 3538–3553.[22] P.A. Kralchevsky, K.D. Danov, M.P. Boneva, S.D. Kralchevska, K.P. Anantha-
padmanabhan, A. Lips, Adv. Colloid Interface Sci. (2008), in preparation.[23] W. Jiang, J. Hao, Z. Wu, Langmuir 24 (2008) 3150–3156.[24] P. Walden, E.J. Birr, Z. Phys. Chem. A 144 (1929) 269.[25] P. Walden, H. Gloy, Z. Phys. Chem. A 144 (1929) 395.[26] H.S. Harned, B.B. Owen, The Physical Chemistry of Electrolytic Solutions, second
ed., Reinhold Publishing Corp., New York, 1950.[27] F. Kohlrausch, On the conductivity of electrolytes dissolved in water in relation
to the migration of their components, Paper presented before the GöttingenAcademy of Sciences, May 6, 1876.
[28] A.N. Campbell, G.R. Lakshminarayanan, Can. J. Chem. 43 (1965) 1729–1737.[29] Y. Zimmels, I.J. Lin, Colloid Polym. Sci. 252 (1974) 594–612.[30] R.P. Varma, H. Goel, Colloids Surf. A 85 (1994) 69–73.[31] L. Onsager, R.M. Fuoss, J. Phys. Chem. 36 (1932) 2689–2778.[32] F. Daniels, R.A. Alberty, Physical Chemistry, fourth ed., Wiley, New York, 1975.[33] R.A. Robinson, R.H. Stokes, Electrolyte Solutions, second ed., Butterworths, Lon-
don, 1965.[34] A.A. Ravdel, A.M. Ponomareva (Eds.), Concise Handbook of Physiochemical
Quantities, eighth ed., Khimiya, Leningrad, 1983 [in Russian].