Embed Size (px)
Citation preview

From concepts to real-world applications
www.openness-project.eu
METHOD FACTSHEET
QUICKScan
Introduction
Conceptual framework
The QUICKScan software and QUICKScan tool (http://QUICKScan.pro) encompasses a modelling
environment with functionalities to assess societal and environmental conditions, diagnose patterns and
interactions, implement alternative responses and evaluate the impacts of those responses. The
QUICKScan modelling environment enables the linkage of GIS data to qualitative and/or quantitative rules
and allows the user to identify not only the direct, but also the indirect, impacts of spatial strategies. It
enables analyses of causes; the user can dynamically and interactively adapt the strategies and/or rules to
reach a desired state. The QUICKScan framework addresses five questions (after Winograd 2007):
1. What aspects are relevant with respect to ecosystems and human well-being?
2. What typical ‘pictures’ of the past and current condition exist and what are the trends?
3. What elements and interactions are relevant for the persistence of these patterns, trends and impacts?
4. Which strategies and options can be devised to preserve, restore, use, improve, mitigate, or adapt?
5. Which hotspot areas, services or land covers could be identified as targets for policy actions?
General application of QUICKScan
QUICKScan is an empty modelling shell which needs to be filled on a case by case basis with GIS data,
qualitative and/or quantitative rules, and map algebra. The tool is not restricted to a specific geographic
location or spatial resolution; similar to word processing software (e.g. Microsoft Word) which is not
restricted to a specific document (type). The system enables the definition of ‘if..then..else’ rules and links
those to available data to create derived data. Typically the rules use quantitative classifications or
qualitative typologies to help define the situation and options for change (Verweij et al. 2012). Rules may
also be linked together to form a chain of rules. Alternative (chains of) rules are used to capture different
options. Derived data from alternatives can be aggregated (e.g. by administrative units, or biophysical units
such as catchments or climatic zones) to be displayed in tables and charts for overviews (see Figure 1 and
http://quickscan.pro/features.html).
OPENNESS METHOD FACTSHEET 2
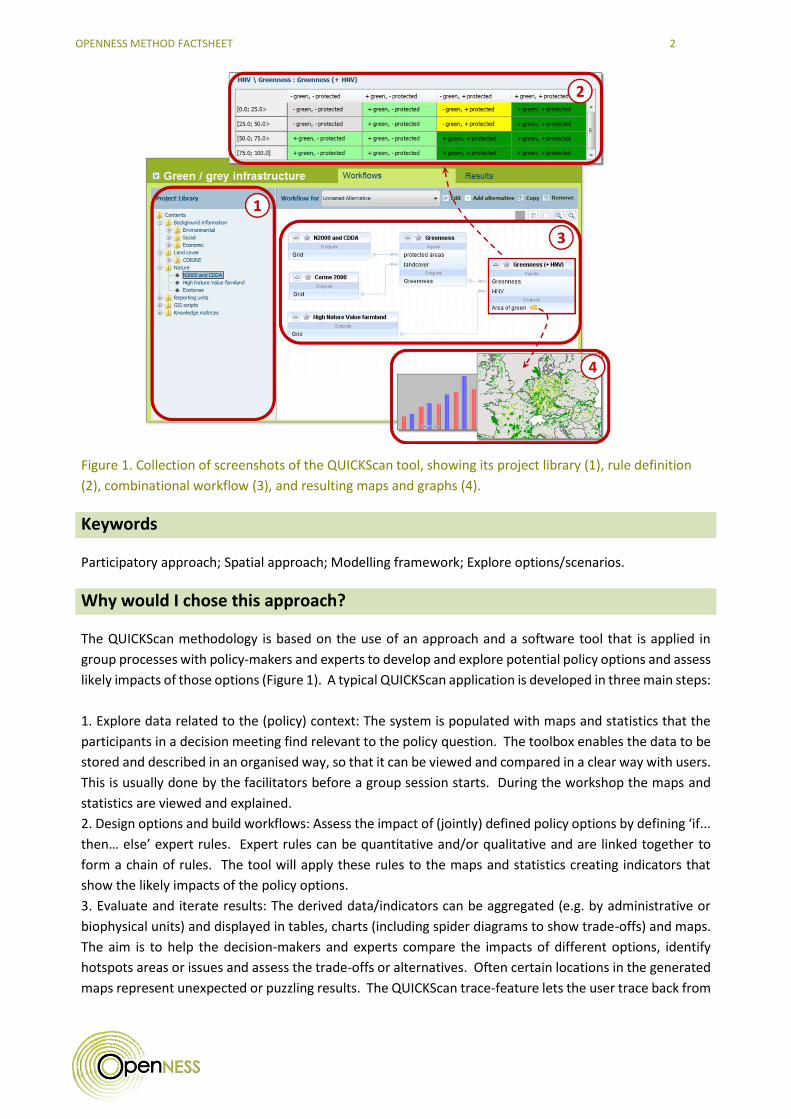
Figure 1. Collection of screenshots of the QUICKScan tool, showing its project library (1), rule definition
(2), combinational workflow (3), and resulting maps and graphs (4).
Keywords
Participatory approach; Spatial approach; Modelling framework; Explore options/scenarios.
Why would I chose this approach?
The QUICKScan methodology is based on the use of an approach and a software tool that is applied in
group processes with policy-makers and experts to develop and explore potential policy options and assess
likely impacts of those options (Figure 1). A typical QUICKScan application is developed in three main steps:
1. Explore data related to the (policy) context: The system is populated with maps and statistics that the
participants in a decision meeting find relevant to the policy question. The toolbox enables the data to be
stored and described in an organised way, so that it can be viewed and compared in a clear way with users.
This is usually done by the facilitators before a group session starts. During the workshop the maps and
statistics are viewed and explained.
2. Design options and build workflows: Assess the impact of (jointly) defined policy options by defining ‘if...
then… else’ expert rules. Expert rules can be quantitative and/or qualitative and are linked together to
form a chain of rules. The tool will apply these rules to the maps and statistics creating indicators that
show the likely impacts of the policy options.
3. Evaluate and iterate results: The derived data/indicators can be aggregated (e.g. by administrative or
biophysical units) and displayed in tables, charts (including spider diagrams to show trade-offs) and maps.
The aim is to help the decision-makers and experts compare the impacts of different options, identify
hotspots areas or issues and assess the trade-offs or alternatives. Often certain locations in the generated
maps represent unexpected or puzzling results. The QUICKScan trace-feature lets the user trace back from

OPENNESS METHOD FACTSHEET 3
the output maps to the applied rules. This is visualised by displaying the causal relationships between all
used rules and GIS data resulting in the map and highlighting the decision path in each of the rules as
applied for the location of interest. This helps to either explain the result or allows iterative fine-tuning of
the rules. If needed iterations with new rules or for new options and alternatives can then be implemented.
What are the main advantages of the approach?
QUICKScan is spatially-explicit.
It can easily combine and handle a wide variety of different spatial data and knowledge rules.
It has an open model structure with a direct response to all the implemented expert knowledge
rules. This is often highly valued and seen as a possible future advance for more in-depth modelling
approaches, e.g. the ease to test and trace back expert knowledge could not be replicated with
current known standard GIS software without a lot of extra effort. The transparency of QUICKScan
enables the easy transformation of the captured knowledge into other systems if/once this is
judged feasible and desirable.
It allows for the explicit and transparent implementation of all the calculation steps and knowledge
rules required for addressing the impact of measures on ES and costs.
It supports the use of Python for map algebra if this is required. The Python code can potentially
be re-used in other programs or modules, if desirable at a later stage.
What are the constraints/limitations of the approach?
Limited to spatially-explicit issues.
No system dynamics, no feedback loops.
Currently restricted to use with ArcGIS 10.0.
It is developed for, and mainly used in, (relatively) short and participatory workshops. However,
the tool can be deployed as an additional desktop tool alongside existing GIS software programs.
For many basic GIS functionalities, QUICKScan cannot be compared with the performances of
commercially available GIS packages. It is questionable if a (pure) desktop application of
QUICKScan is therefore of much added value.
Defining solid causal relations to express final output indicators, related to the available spatial and
temporal data, can be a complex and quite difficult task. Since the focus is often more on
developing a proof of concept than to approximate the absolute truth, there are certainly many
uncertainties in the finally used knowledge rules. When further implementation is required, a
debate is needed as to what extent absolute numbers can be used and when a more relative
approach could be sufficient.
What types of value can the approach help me understand?
Quickscan combined the benefits of a quantified, spatial approach with a deliberative, stakeholder process.
It can be used to explore most categories of value (biophysical, monetary, socio-cultural as well as aspects
related to the intrinsic value of nature). What values are explored will depend on the individuals involved
and the priorities of the case study.
How does the approach address uncertainty?

OPENNESS METHOD FACTSHEET 4
Uncertainty can be expressed explicitly within the rules used if needed. Often uncertainty is addressed
within a rule showing different options for classification (e.g. the upper and lower sustainability boundaries
of an indicator). Where and how this uncertainty is dispersed can then be assess spatially under different
alternatives, as well as summarised as the total potential uncertainty in the region of interest.
How do I apply the approach?
The QUICKScan software encompasses a modelling environment that needs to be filled with spatial
and/or statistical data during the preparation phase. The tool is not restricted to a specific geographic
location or spatial resolution. Knowledge rules, capturing participant knowledge, are used to combine
data and derive indicators. Typically the rules use classifications to describe quantitative data and
typologies to give qualitative data meaning. Rules may be linked together to form a chain of rules.
Alternative (chains of) rules are used to capture different options. Derived data from alternatives can be
aggregated (e.g. by administrative units or biophysical units, such as catchments or climatic zones) to be
displayed in tables and charts for overviews.
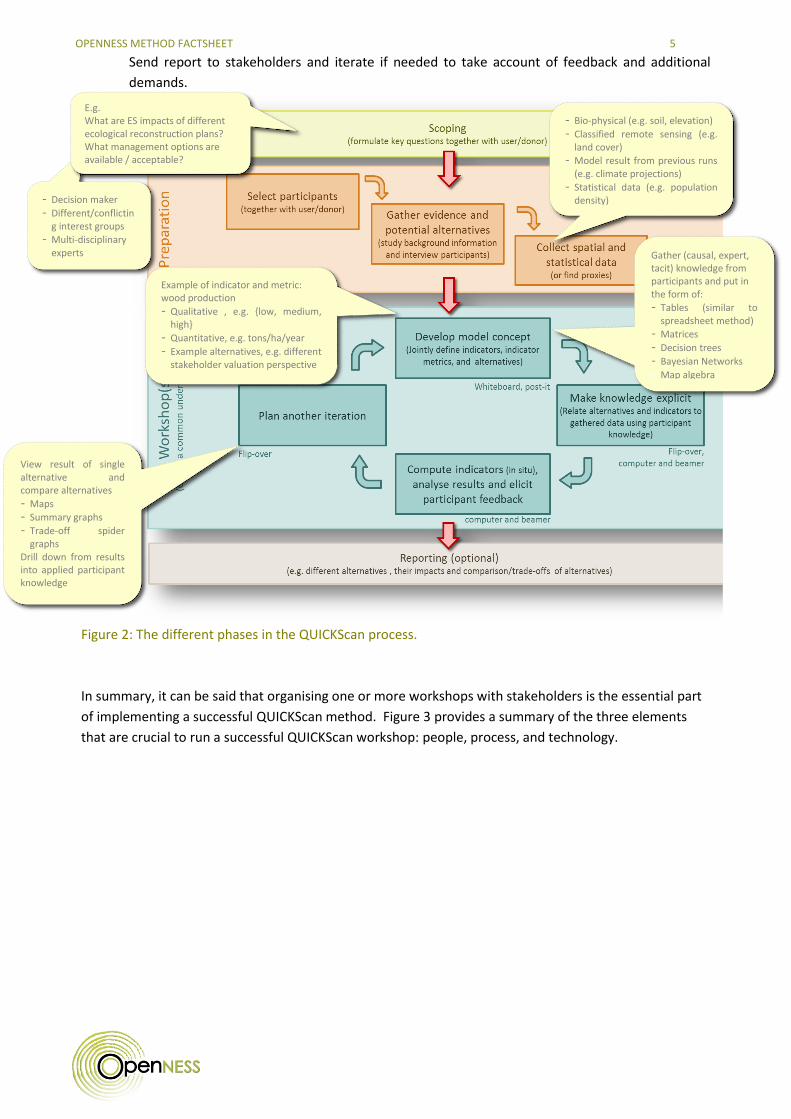
Figure 2 shows the different phases which are generally formulated using QUICKScan in a participative
setting: (i) scoping; (ii) preparation; (iii) the workshop(s); and (iv) reporting. The scoping in the first phase
is intended to identify and formulate key questions together with the stakeholders (Figure 2). The second
phase is needed to prepare the spatial datasets to be used in the workshop. The third phase is the
workshop itself which focuses on creating a common understanding about the key questions, their
options and alternatives. To ensure good outputs and ease participation in this phase, the chained rules
are often first defined in a simplified way, and then refined in iterations based on results and stakeholder
needs. New iterations are also often used to incorporate new insight and demands. If needed, a
summarising report in the form of a PowerPoint or a Document is produced describing the results from
the workshop and the prior phases (Figure 2).
Below is an example of how an exploratory two day workshop could be organised and carried out:
A) Before the workshop:
Define the program around a policy question.
Search, obtain and organise the data needed.
B) At the workshop: example agenda
Day 1 Morning (9:30 - 12:30)
Define storylines.
Determine how to measure the impact (key outputs/key indicators).
Day 1 Afternoon (14:00 - 18:00)
Build workflow for policy alternatives
Relate alternatives and key output to data.
Day 2 Morning (9:30 - 12:00)
Present results, discuss and iterate.
Define next steps and needs.
C) After the workshop:
Produce the report.
OPENNESS METHOD FACTSHEET 5
Send report to stakeholders and iterate if needed to take account of feedback and additional
demands.
Figure 2: The different phases in the QUICKScan process.
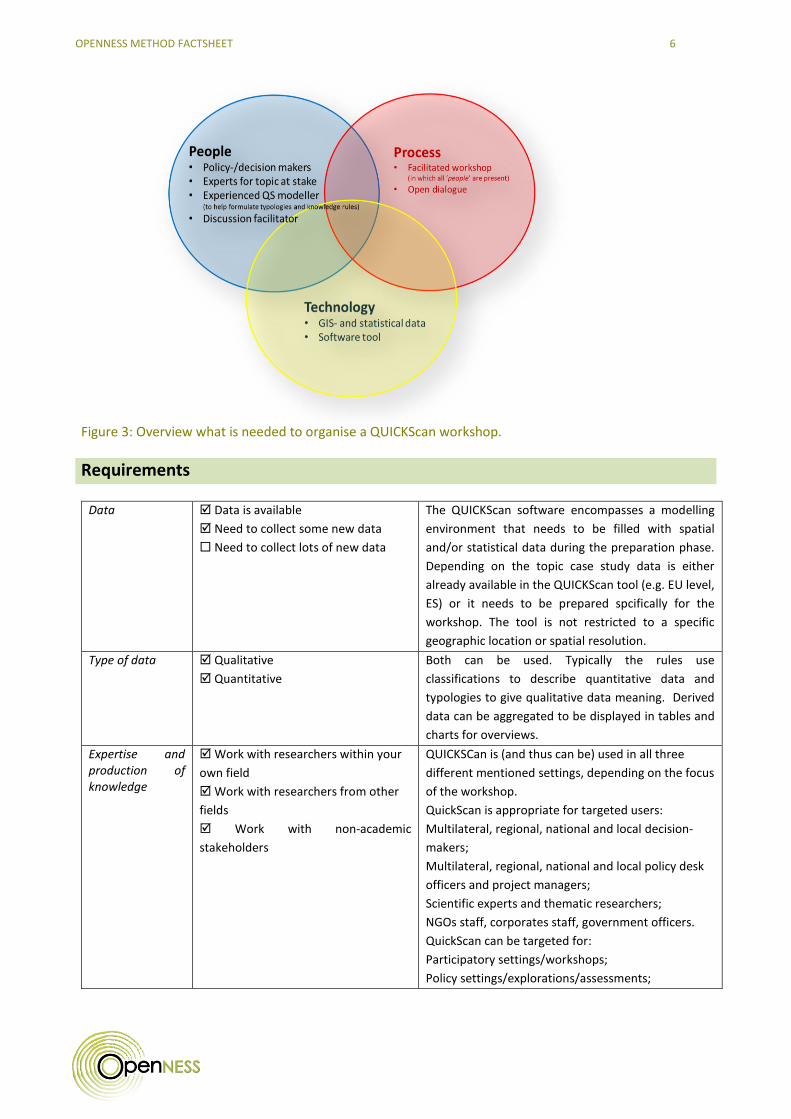
In summary, it can be said that organising one or more workshops with stakeholders is the essential part
of implementing a successful QUICKScan method. Figure 3 provides a summary of the three elements
that are crucial to run a successful QUICKScan workshop: people, process, and technology.
- Decision maker
- Different/conflicting interest groups
- Multi-disciplinary experts
- Bio-physical (e.g. soil, elevation)
- Classified remote sensing (e.g. land cover)
- Model result from previous runs (e.g. climate projections)
- Statistical data (e.g. population density)
- Spatial plans
E.g. What are ES impacts of different ecological reconstruction plans? What management options are available / acceptable?
Gather (causal, expert, tacit) knowledge from participants and put in the form of:
- Tables (similar to spreadsheet method)
- Matrices
- Decision trees
- Bayesian Networks
- Map algebra
View result of single alternative and compare alternatives
- Maps
- Summary graphs
- Trade-off spider graphs
Drill down from results into applied participant knowledge
Example of indicator and metric: wood production
- Qualitative , e.g. {low, medium, high}
- Quantitative, e.g. tons/ha/year
- Example alternatives, e.g. different stakeholder valuation perspective
-
OPENNESS METHOD FACTSHEET 6
Figure 3: Overview what is needed to organise a QUICKScan workshop.
Requirements
Data Data is available
Need to collect some new data
Need to collect lots of new data
The QUICKScan software encompasses a modelling
environment that needs to be filled with spatial
and/or statistical data during the preparation phase.
Depending on the topic case study data is either
already available in the QUICKScan tool (e.g. EU level,
ES) or it needs to be prepared spcifically for the
workshop. The tool is not restricted to a specific
geographic location or spatial resolution.
Type of data Qualitative
Quantitative
Both can be used. Typically the rules use
classifications to describe quantitative data and
typologies to give qualitative data meaning. Derived
data can be aggregated to be displayed in tables and
charts for overviews.
Expertise and production of knowledge
Work with researchers within your
own field
Work with researchers from other
fields
Work with non-academic
stakeholders
QUICKSCan is (and thus can be) used in all three
different mentioned settings, depending on the focus
of the workshop.
QuickScan is appropriate for targeted users:
Multilateral, regional, national and local decision-
makers;
Multilateral, regional, national and local policy desk
officers and project managers;
Scientific experts and thematic researchers;
NGOs staff, corporates staff, government officers.
QuickScan can be targeted for:
Participatory settings/workshops;
Policy settings/explorations/assessments;

OPENNESS METHOD FACTSHEET 7
Scientific baselines/iterations/validations;
Ex-ante/ex-post impact assessments.
Software Freely available
Software licence required
Advanced software knowledge
required
Two versions exist:
1. Community-edition: Light-weight latest version
with up to 10 user defined rules. No support provided.
2. Ultimate edition: Full featured, latest stable version
with an installation set, a user manual, support and
free upgrades for a year. Software licence is required.
Time resources Short-term (< 1 year)
Medium-term (1-2 years)
Long-term (more than 2 years)
QUICKScan usually requires some days of data
preparation and one or two days for the workshop
itself. Usually from start to finish it requires less than
a month of lead time.
Economic resources
< 6 person-months
6-12 person-months
> 12 person-months
Usually two or three persons are involved in both the
preparation phase and the workshop itself, requiring
less than one person month in total.
Other requirements
Where do I go for more information?
For further reading and references see the QUICKScan website: http://quickscan.pro, which includes an
overview of the most important QUICKScan reports and case studies. The following references are
mentioned on the website (http://quickscan.pro/showcases.html):
EEA (2011), Green infrastructure and territorial cohesion, EEA technical report 18.
Eshitera, A. (2013), Assessing Agricultural Land Carrying Capacity for Sustainable Livelihoods and
Resettlement of Internally Displaced Persons in South Darfur, MSc thesis, supervisors: Boerboom,L.,
Dopheide, M., Faculty of Geo-Information Science and Earth Observation of the University of Twent
Eupen M van, B. Pedroli, C Huang, X. Wang (2007), Impact modelling of scenarios on vegetation and fauna
in the Yellow River Delta. Yellow River Delta Environmental Flow Study Sino-Dutch Study Programme
Final Report 2007 YRCC, Yellow River Water Resources Protection Bureau, Alterra, Delft Hydraulics,
Arcadis Euroconsult.
Roos-Klein Lankhorst, J., de Vries, S., Buijs, A. (2011) Mapping landscape attractiveness, a GIS based
landscape appreciation model for the Dutch countryside, Exploring the visual landscape, Advances in
physiognomic landscape research in the Netherlands, edited by Steffen Nijhuis, Ron van Lammeren,
Frank van der Hoeven (pp 147 – 161); Research in Urbanism Series (RiUS), Volume 2, ISSN 1875-0192
(print), ISSN 1879-8217 (online). http://rius.tudelft.nl/article/view/210/265
Losekoot, S. (2013), The Landscape appreciation model: construction and evaluation of two prototypes,
Technical report, Van Hall-Larenstein – wildlife management, Leeuwarden
Verweij, P. van Eupen, M., Roos-Klein Lankhorst, J., Nieuwenhuizen, W. (2010), Qualitative reasoning in
participatory spatial planning: the use of OSIRIS in the Yellow River Delta, in: International
Environmental Modelling and Software Society (iEMSs) 2010 International Congress on Environmental
Modelling and Software Modelling for Environment’s Sake, Fifth Biennial Meeting, Ottawa, Canada;
OPENNESS METHOD FACTSHEET 8
David A. Swayne, Wanhong Yang, A. A. Voinov, A. Rizzoli, T. Filatova (Eds.)
www.iemss.org/iemss2010/index.php?n=Main.Proceedings
Verweij, P., Winograd, M., Perez-Soba, M., Knapen, R., van Randen, Y. (2012), QUICKScan: a pragmatic
approach to decision support, In: International Environmental Modelling and Software Society (iEMSs)
2012 International Congress on Environmental Modelling and Software Managing Resources of a
Limited Planet, Sixth Biennial Meeting, Leipzig, Germany R. Seppelt, A.A. Voinov, S. Lange, D. Bankamp
(Eds.) www.iemss.org/society/index.php/iemss-2012-proceedings
Xingong Wang, Yu Lian, Chong Huang, Xiaojun Wang, Ruiling Wang, Kai Shan, Bas Pedroli, Michiel Eupen,
Amgad ElMahdi, Mahtab Ali (2012). Environmental flows and its evaluation of restoration effect based
on LEDESS model in Yellow River Delta wetlands. Mitigation and Adaptation Strategies for Global
Change, 17(4): 357.
Factsheet prepared by Peter Verweij, Michiel van Eupen, Anouk Cormont, Marta Perez-Soba & Manuel
Winograd