Embed Size (px)
Citation preview
University of Texas at El Paso University of Texas at El Paso
ScholarWorks@UTEP ScholarWorks@UTEP
Open Access Theses & Dissertations
2020-01-01
Method Development For The Analysis Of Fatty Acids In Adipose Method Development For The Analysis Of Fatty Acids In Adipose
Tissue Using Stir Bar Sorptive Extraction Coupled With Gas Tissue Using Stir Bar Sorptive Extraction Coupled With Gas
Chromatography-Mass Spectrometry Chromatography-Mass Spectrometry
Angela Marisol Encerrado Manriquez University of Texas at El Paso
Follow this and additional works at: https://scholarworks.utep.edu/open_etd
Part of the Analytical Chemistry Commons
Recommended Citation Recommended Citation Encerrado Manriquez, Angela Marisol, "Method Development For The Analysis Of Fatty Acids In Adipose Tissue Using Stir Bar Sorptive Extraction Coupled With Gas Chromatography-Mass Spectrometry" (2020). Open Access Theses & Dissertations. 3092. https://scholarworks.utep.edu/open_etd/3092
This is brought to you for free and open access by ScholarWorks@UTEP. It has been accepted for inclusion in Open Access Theses & Dissertations by an authorized administrator of ScholarWorks@UTEP. For more information, please contact [email protected].
METHOD DEVELOPMENT FOR THE ANALYSIS OF FATTY ACIDS IN ADIPOSE
TISSUE USING STIR BAR SORPTIVE EXTRACTION COUPLED WITH GAS
CHROMATOGRAPHY-MASS SPECTROMETRY
ANGELA MARISOL ENCERRADO MANRIQUEZ
Master’s Program in Chemistry
APPROVED:
Wen-Yee Lee, Ph.D., Chair
Jose Ramon Peralta-Videa, Ph.D.
Chuan Xiao, Ph.D.
Jie Xu, Ph.D.
Stephen L. Crites, Jr., Ph.D.
Dean of the Graduate School

Copyright ©
by
Angela Marisol Encerrado Manriquez
2020
DEDICATION
In order to pursue higher education, my parents moved from rural Mexico to the city of
Juarez which borders with the United States. For them, education was the way out of poverty and
into a life with more opportunities. Therefore, within our family, they always placed great value
in higher education; in such a way that my siblings and I are all pursuing Masters’s degrees in our
respective fields of study. I want to dedicate this thesis to their many efforts that are now bringing
me here.
To my mom and dad, I love you, now and forever.
Thank you for making me the person I am today.
Para lograr tener una mejor educación, mis padres se mudaron del México rural, a ciudad
Juárez, que es frontera con Estados Unidos. Para ellos, la educación fue un modo de alejarse de la
pobreza y acercarse a una vida con más oportunidades. Por ello, dentro de nuestro núcleo familiar,
siempre dieron un lugar importante a la educación. Tanto fue así que sus tres hijos hoy buscan
conseguir maestrías en sus diferentes especialidades. Por eso, quiero dedicar esta tesis a sus
esfuerzos que me han traído hasta aquí.
Para mi mamá y mi papá, los amo, ahora y siempre.
Gracias por haberme hecho la persona que soy hoy en día.
METHOD DEVELOPMENT FOR THE ANALYSIS OF FATTY ACIDS IN ADIPOSE
TISSUE USING STIR BAR SORPTIVE EXTRACTION COUPLED WITH GAS
CHROMATOGRAPHY-MASS SPECTROMETRY
by
ANGELA MARISOL ENCERRADO MANRÍQUEZ, B.S.
THESIS
Presented to the Faculty of the Graduate School of
The University of Texas at El Paso
in Partial Fulfillment
of the Requirements
for the Degree of
MASTER OF SCIENCE
Department of Chemistry and Biochemistry
THE UNIVERSITY OF TEXAS AT EL PASO
August 2020

v
ACKNOWLEDGEMENTS
I would like to recognize the amazing work of my advisor, Dr. Wen-Yee Lee, for all her
current and previous support. Thank you for all the care, guidance, patience, knowledge, and
opportunities you provided me during both my undergraduate and graduate studies. Thank you for
always looking at the bigger picture, even when I doubted myself. I can honestly say that I would
have not managed to be here if you would have not pushed me out of my comfort zone, constantly
daring me to become better than before. You are truly an example of life. I would also like to thank
my committee members, Dr. Chuan Xiao “River”, Dr. Jie Xu, and Dr. Jose Peralta for giving me
constructive criticism and for taking the time and attention in giving me advice. I express my
gratitude to all the professors from whom I learned valuable lessons through their unique areas of
expertise. I hope one day I can transmit the same passion to my students. Special thank you to Dr.
Skye Fortier, for allowing me to collaborate with your students in various projects through my MS
degree.
I am grateful for having the chance to work with my present and former lab mates.
Especially, Alma Loya and Qin Gao. You are my confidants, my teachers, and most importantly
my friends. Qin, thank you for always feeding me when I forgot to eat, thank you for listening to
my complaints and frustrations, and thank you for being a shoulder to cry on whenever I needed
one. Thank you to the Chemistry Department, and Graduate School for providing a space to grow
as a researcher and as a person. Thanks to all my friends, both inside and outside of the department,
who made my birthdays happier, my sadness lighter, and my days brighter.
I thank my parents, brother, sister, cousins, aunts, and uncles for the unconditional support
you have always shown to my dreams and my career. I will never be able to repay all the

vi
unconditional love you have given me, all the kindness you have shown me, and all the
opportunities you provided me.
vii
ABSTRACT
The project was aimed to develop an easy and sensitive analytical tool to study the role of
fatty acids (FAs) profile in periprostatic adipose tissue (PPAT) and prostate cancer (PCa). PCa
is the second leading cause of cancer-related death among American men. Although obesity has
been mostly ruled out by many researchers as a risk factor for developing PCa, it has shown to be
associated with PCa metastasis and progression. Periprostatic adipose tissue, which was present
on 48% of prostatic surfaces, has been reported to act as energy sources for facilitating a positive
microenvironment for PCa tumor progression. To understand the role of PPAT fatty acid profile
in relationship to PCa aggressiveness, this project was set out to develop a green method to analyze
the fatty acids (FAs) in adipose tissue using a solvent-less sample preparation technique, known
as stir-bar sorptive extraction, coupled with thermal desorption-Gas Chromatography/Mass
Spectrometry.
To detect FAs by Gas Chromatography-Mass Spectrometry, we used pork fat as the model
adipose tissue. FAs in pork fat were first subjected to transesterification. Several conditions to
optimize the transesterification process such as time, temperature, and acid amount in the solvent
mixture were studied. The best transesterification condition was found to be at 60-70 oC (regardless
of the heating methods, either in an oven or sonicator), with the reaction time of 1hr and using a
solvent mixture of CH3OH:HCl:CHCl3 (10:3:1, v/v/v). After transesterification, fatty acid methyl
esters (FAMEs) were extracted by stir bar sorptive extraction (SBSE). We studied factors that
could promote the extraction efficiency of FAMEs by SBSE. These factors included stirring
time, solvent addition, and stirring speed. We found that 1hr at 1500 RPM and no solvent addition
would give the best extraction efficiency of FAMEs. By estimate, the concentrations of FAMEs
detected in the fat samples ranged from 0.18 ppb (µg/L) to 114.82 ppb (µg/L). Therefore, the limit

viii
of detection for our method could be below 0.18 ppb (µg/L) for various FAMEs in fat tissue. The
sample preparation developed in this report has provided a green and sensitive alternative for the
study of FAs in adipose tissue, which will provide a valuable tool for future studies in the FAs
profile in PPAT and its impacts on PCa progression.
ix
TABLE OF CONTENT
ACKNOWLEDGEMENTS .............................................................................................................v
ABSTRACT .................................................................................................................................. vii
TABLE OF CONTENT ................................................................................................................. ix
LIST OF TABLES ......................................................................................................................... xi
LIST OF FIGURES ..................................................................................................................... xiii
CHAPTER 1 INTRODUCTION .....................................................................................................1
1.1 Prostate Cancer Overview ..........................................................................................................1
1.2 Prostate Cancer and Adipose Tissue ..........................................................................................1
1.3 Effect of Fatty Acid Profile in Cancer - It Is Not All About Quantity, it is Also About the
Quality.....................................................................................................................................2
1.4 Current Analytical Methodologies for Fatty Acid Analysis ......................................................4
1.5 Significance and Objectives .......................................................................................................7
CHAPTER 2 METHODOLOGY ....................................................................................................9
2.1 Chemicals and Reagents ............................................................................................................9
2.2 Method Development.................................................................................................................9
2.2.1 Sample Preparation .............................................................................................10
Homogenization ..................................................................................................10
Transesterification...............................................................................................11
2.2.2 Sample Analysis..................................................................................................11
Stir Bar Sorptive Extraction (SBSE)...................................................................11
Chemical Analysis (TD 3.5+ - GC-MS) .............................................................13
2.3 Statistical Analysis ...................................................................................................................13
CHAPTER 3. RESULTS AND DISCUSSION .............................................................................14
3.1 Sample Preparation ..................................................................................................................14
3.1.1 Transesterification...............................................................................................14
x
3.2 FAMEs Extraction ...................................................................................................................17
3.2.1 Solvent Addition and Stirring Time ....................................................................20
3.2.2 Stirring Speed......................................................................................................23
CHAPTER 4. CONCLUSIONS ....................................................................................................26
REFERENCES ..............................................................................................................................29
APPENDICES ...............................................................................................................................36
VITA ..............................................................................................................................................43
xi
LIST OF TABLES
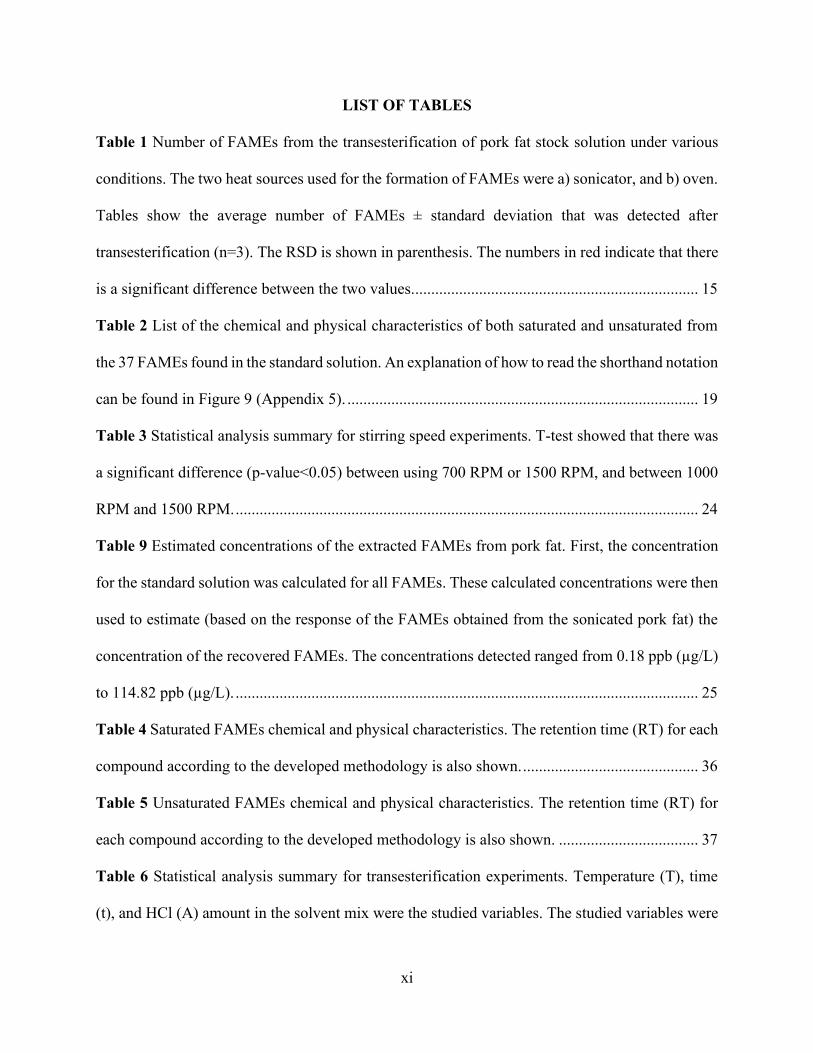
Table 1 Number of FAMEs from the transesterification of pork fat stock solution under various
conditions. The two heat sources used for the formation of FAMEs were a) sonicator, and b) oven.
Tables show the average number of FAMEs ± standard deviation that was detected after
transesterification (n=3). The RSD is shown in parenthesis. The numbers in red indicate that there
is a significant difference between the two values........................................................................ 15
Table 2 List of the chemical and physical characteristics of both saturated and unsaturated from
the 37 FAMEs found in the standard solution. An explanation of how to read the shorthand notation
can be found in Figure 9 (Appendix 5). ........................................................................................ 19
Table 3 Statistical analysis summary for stirring speed experiments. T-test showed that there was
a significant difference (p-value<0.05) between using 700 RPM or 1500 RPM, and between 1000
RPM and 1500 RPM. .................................................................................................................... 24
Table 9 Estimated concentrations of the extracted FAMEs from pork fat. First, the concentration
for the standard solution was calculated for all FAMEs. These calculated concentrations were then
used to estimate (based on the response of the FAMEs obtained from the sonicated pork fat) the
concentration of the recovered FAMEs. The concentrations detected ranged from 0.18 ppb (µg/L)
to 114.82 ppb (µg/L). .................................................................................................................... 25
Table 4 Saturated FAMEs chemical and physical characteristics. The retention time (RT) for each
compound according to the developed methodology is also shown. ............................................ 36
Table 5 Unsaturated FAMEs chemical and physical characteristics. The retention time (RT) for
each compound according to the developed methodology is also shown. ................................... 37
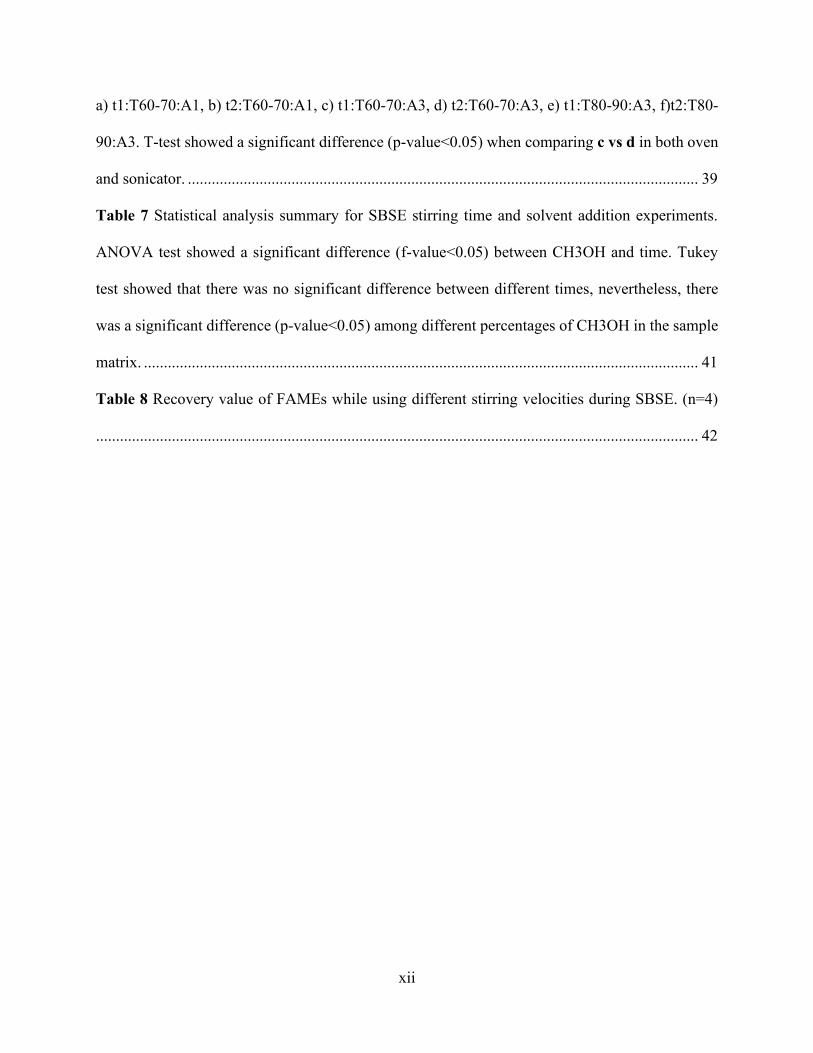
Table 6 Statistical analysis summary for transesterification experiments. Temperature (T), time
(t), and HCl (A) amount in the solvent mix were the studied variables. The studied variables were
xii
a) t1:T60-70:A1, b) t2:T60-70:A1, c) t1:T60-70:A3, d) t2:T60-70:A3, e) t1:T80-90:A3, f)t2:T80-
90:A3. T-test showed a significant difference (p-value<0.05) when comparing c vs d in both oven
and sonicator. ................................................................................................................................ 39
Table 7 Statistical analysis summary for SBSE stirring time and solvent addition experiments.
ANOVA test showed a significant difference (f-value<0.05) between CH3OH and time. Tukey
test showed that there was no significant difference between different times, nevertheless, there
was a significant difference (p-value<0.05) among different percentages of CH3OH in the sample
matrix. ........................................................................................................................................... 41
Table 8 Recovery value of FAMEs while using different stirring velocities during SBSE. (n=4)
....................................................................................................................................................... 42
xiii
LIST OF FIGURES
Figure 1 An illustration showing the transesterification of FAs from lipids, triglyceride molecules.
A triglyceride molecule is formed of glycerol and three molecules of FAs. The molecules of FAs
forming the triglyceride can be of different length and have a different amount of saturations. The
FAMEs structures were obtained from PubChem.31....................................................................... 5
Figure 2 Diverse methodologies developed for the extraction, transesterification, and analysis of
FAMEs from biological samples. ................................................................................................... 6
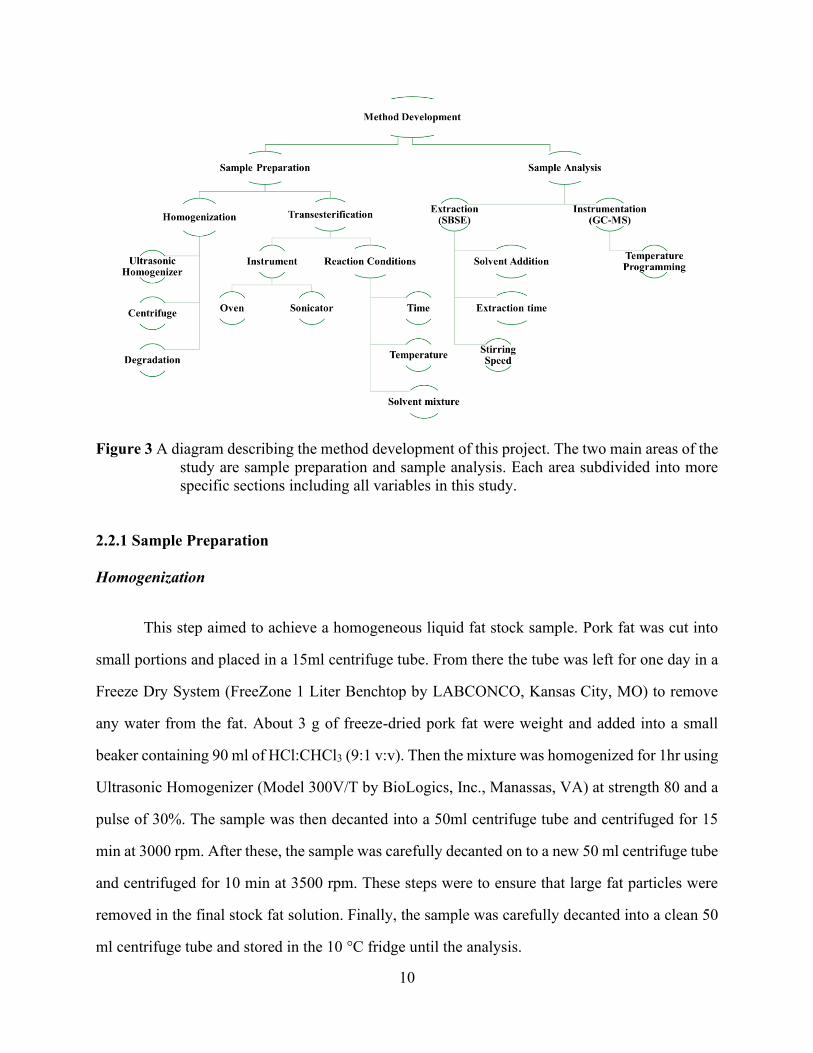
Figure 3 A diagram describing the method development of this project. The two main areas of the
study are sample preparation and sample analysis. Each area subdivided into more specific sections
including all variables in this study. ............................................................................................. 10
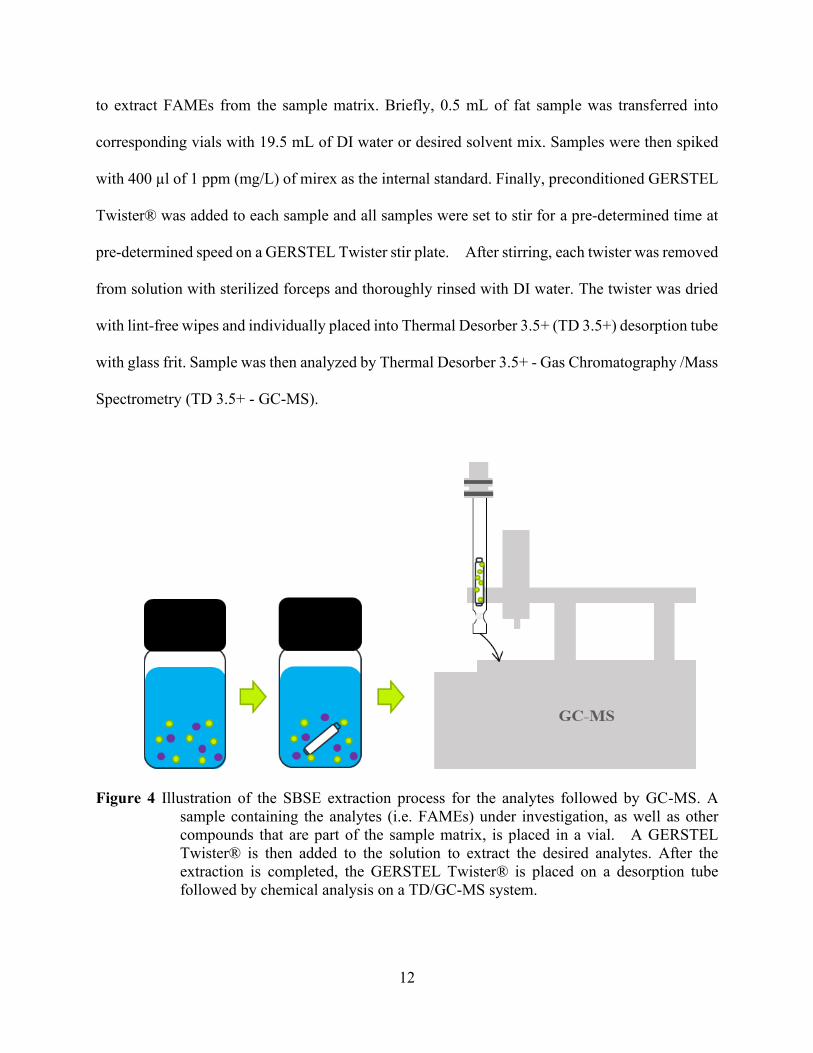
Figure 4 Illustration of the SBSE extraction process for the analytes followed by GC-MS. A
sample containing the analytes (i.e. FAMEs) under investigation, as well as other compounds that
are part of the sample matrix, is placed in a vial. A GERSTEL Twister® is then added to the
solution to extract the desired analytes. After the extraction is completed, the GERSTEL Twister®
is placed on a desorption tube followed by chemical analysis on a TD/GC-MS system. ............ 12
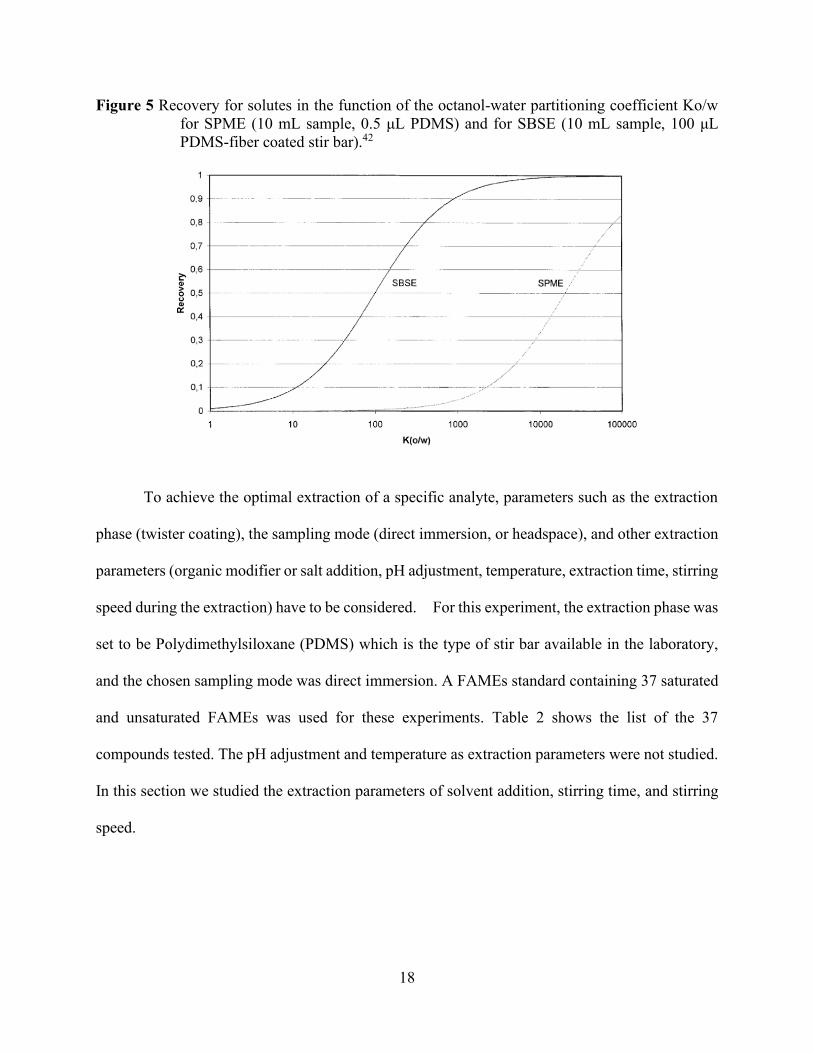
Figure 5 Recovery for solutes in the function of the octanol-water partitioning coefficient Ko/w
for SPME (10 mL sample, 0.5 μL PDMS) and for SBSE (10 mL sample, 100 μL PDMS-fiber
coated stir bar).42 ........................................................................................................................... 18
Figure 6 Comparison of FAMEs recoveries using SBSE across different stirring times and CH3OH
percentages. Each graph shows a stirring time for the extraction of each of the 36 FAMEs found
in the standard stock solution, at times of a)1 hr, b)2 hrs, c)3 hrs, d)6 hrs, and e)12 hrs. The
presence of different percentages of CH3OH (0%, 5%, 10%, and 30%) in the extraction matrix was
evaluated as a possible factor to increase the recovery of FAMEs with Log P >3 (n=6). ............ 22
xiv
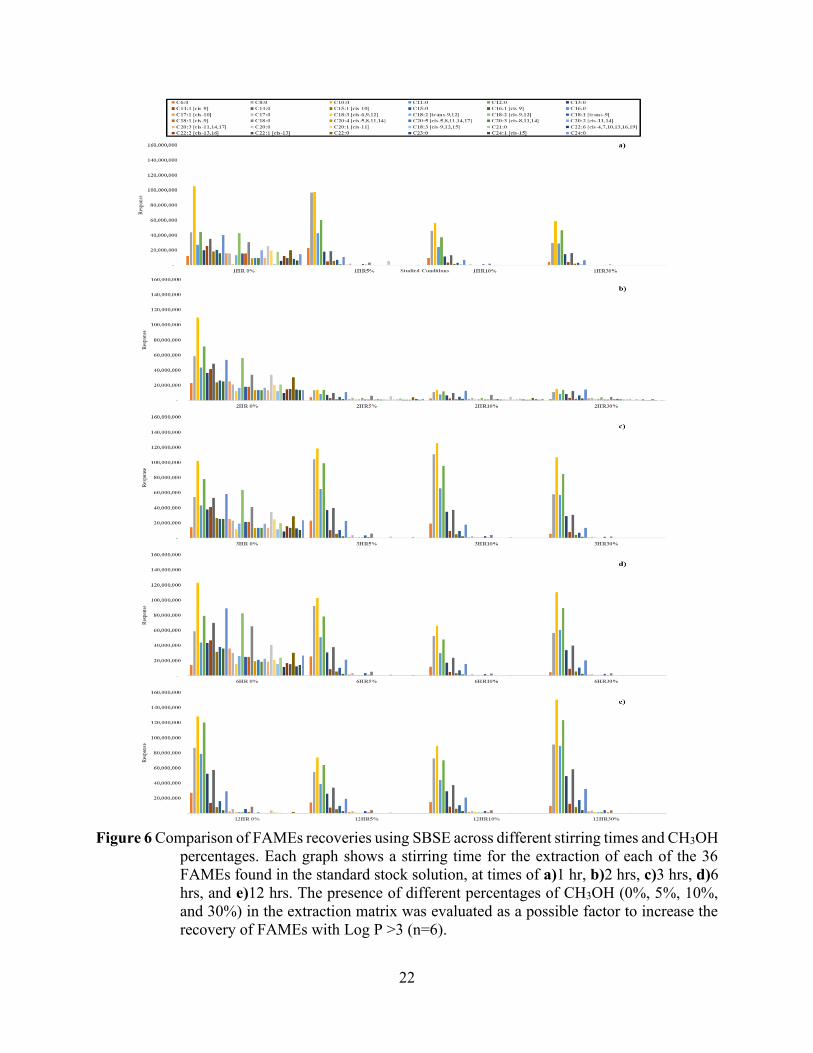
Figure 7 Recovery of FAMEs using SBSE. The extraction was studied at 700 RPM, 1000 RPM,
1500 RPM for the duration of 1hour. (n=4) .................................................................................. 23
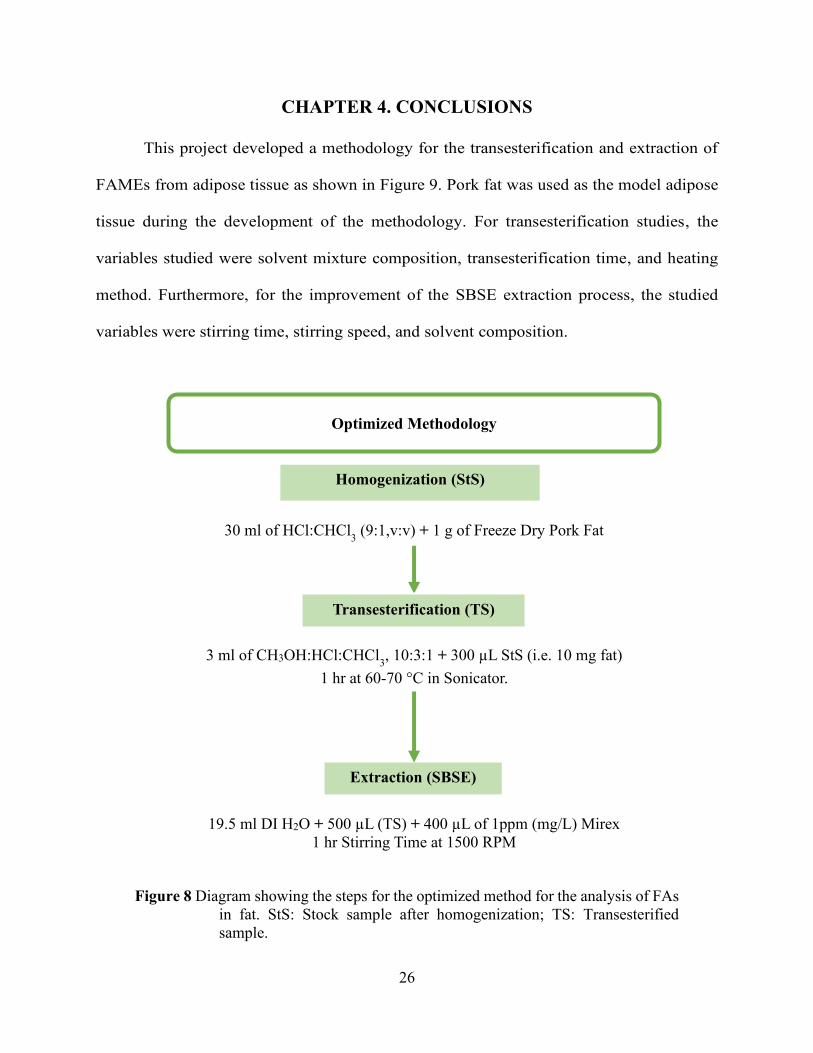
Figure 8 Diagram showing the steps for the optimized method for the analysis of FAs in fat. StS:
Stock sample after homogenization; TS: Transesterified sample. ................................................ 26
Figure 9 This figure gives a short explanation of the shorthand notation used for naming FAMEs.
The number after C represents the number of carbons present on the chain (this including the
methyl group present on the ester side). The next number represents the degree of unsaturation of
specific FAME. The next portion on the brackets gives further specifications about the
unsaturations present in the carbon chain. If the unsaturations are on a cis or trans mode, and where
are the unsaturations located throughout the chain. The FAME structure showed on the white box
was obtained from PubChem.31 .................................................................................................... 40
1
CHAPTER 1 INTRODUCTION
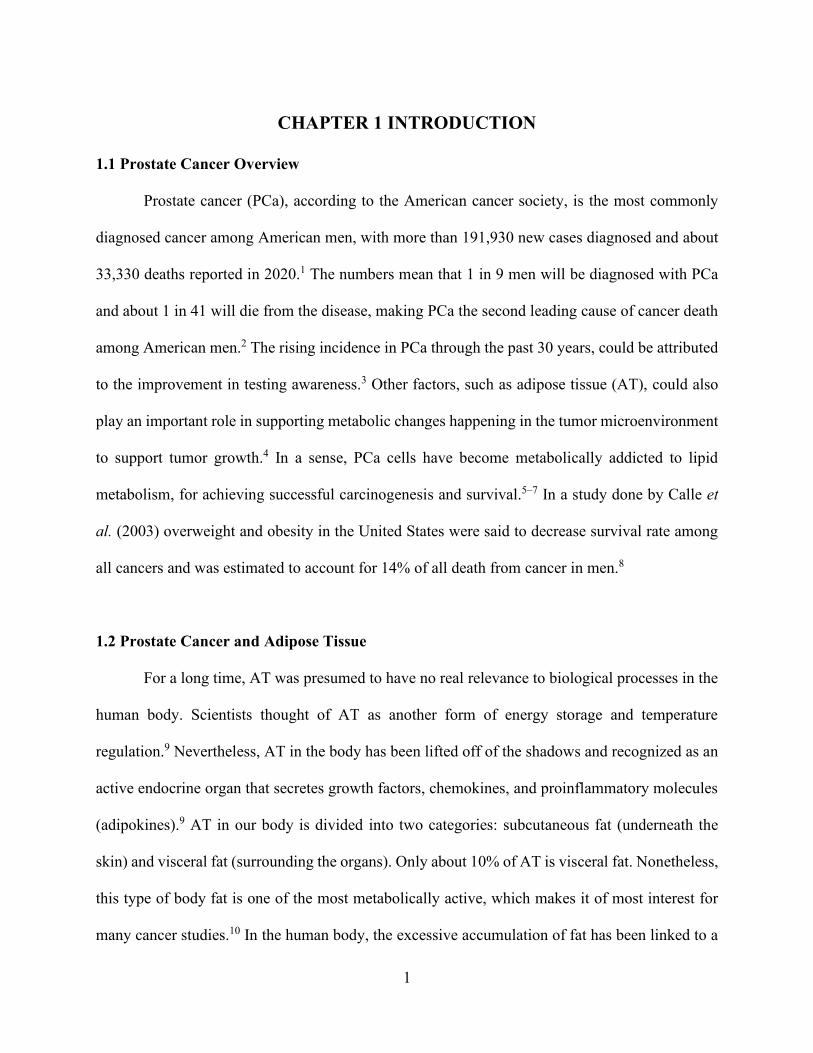
1.1 Prostate Cancer Overview
Prostate cancer (PCa), according to the American cancer society, is the most commonly
diagnosed cancer among American men, with more than 191,930 new cases diagnosed and about
33,330 deaths reported in 2020.1 The numbers mean that 1 in 9 men will be diagnosed with PCa
and about 1 in 41 will die from the disease, making PCa the second leading cause of cancer death
among American men.2 The rising incidence in PCa through the past 30 years, could be attributed
to the improvement in testing awareness.3 Other factors, such as adipose tissue (AT), could also
play an important role in supporting metabolic changes happening in the tumor microenvironment
to support tumor growth.4 In a sense, PCa cells have become metabolically addicted to lipid
metabolism, for achieving successful carcinogenesis and survival.5–7 In a study done by Calle et
al. (2003) overweight and obesity in the United States were said to decrease survival rate among
all cancers and was estimated to account for 14% of all death from cancer in men.8
1.2 Prostate Cancer and Adipose Tissue
For a long time, AT was presumed to have no real relevance to biological processes in the
human body. Scientists thought of AT as another form of energy storage and temperature
regulation.9 Nevertheless, AT in the body has been lifted off of the shadows and recognized as an
active endocrine organ that secretes growth factors, chemokines, and proinflammatory molecules
(adipokines).9 AT in our body is divided into two categories: subcutaneous fat (underneath the
skin) and visceral fat (surrounding the organs). Only about 10% of AT is visceral fat. Nonetheless,
this type of body fat is one of the most metabolically active, which makes it of most interest for
many cancer studies.10 In the human body, the excessive accumulation of fat has been linked to a
2
variety of health problems that have detrimentally affected organs sensitive to metabolic changes,
encouraging the development and progression of a range of metabolic disorders.11,12
For prostate cancer, the narration between its correlation to adiposity has long been
debated. Some researchers have questioned whether high body mass index (BMI) is a risk factor
for developing PCa. MacInnis et al. (2006) reported that obesity was weakly related to the risk of
developing PCa.13 On the other hand, De Pergola et al. (2013) reported that obesity was related to
higher cancer risk through BMI, weight increase, visceral fat, and lifestyle factors.14 More recently,
Markozannes et al. (2016) reported that aspects of diet, adiposity, and physical activity may affect
PCa risk, yet, evidence was not concise enough to identify these aspects as risk factors for PCa.15
Other researchers have found stronger evidence that BMI is not related to PCa risk and rather is
related to PCa grade. Cao et al. (2011) reported that cancer-free people with high BMI had a higher
risk of dying from PCa if they developed the disease.16 Discacciati et al. (2012) reported that as
BMI increases, the risk of a localized PCa decreases, while a direct association with advanced PCa
was observed.17 Vidal et al. (2014) reported that BMI, independent of PSA levels and other clinical
covariates, is associated with a low risk of developing PCa, but a high risk of having a high-grade
non-localized more aggressive PCa.18 Lastly, Zhang et al. (2015) reported that obesity was
significantly associated with PCa aggressiveness and progression, thus increasing overall
mortality.19
1.3 Effect of Fatty Acid Profile in Cancer - It Is Not All About Quantity, it is Also About
the Quality
For a long time, BMI has been the main representation of adiposity and obesity in the
human body. However, BMI does not show a direct correlation between obesity in men and PCa
3
aggressiveness.3,10 Research has reported that the volume of AT surrounding the prostate, known
as periprostatic adipose tissue (PPAT), has been significantly correlated to a high Gleason score,
which is indicative of an advanced stage of PCa.10 This is attributed to the extracapsular extension
of PCa into the PPAT and the vascularization of the prostate, which promotes paracrine
mechanisms for PCa progression.3,20 As people get older, the amount of bone marrow adiposity
increases, which tied to a large PPAT volume provides a pathway that fuels PCa cells to
metastasize in the bone.21 In an estimate, about 90% of the patients with an aggressive PCa develop
metastasis in the bone.9 Moreover, when looking at the composition of PPAT, it provides a better
understanding of the possible correlation between PCa and AT, linking to metabolic alterations
required for cancer cell survival.7
PPAT is composed of fatty acids (FAs) with different lengths of carbon chains and
saturation. The FAs in PPAT are stored within complex lipids such as ceramides, phospholipids,
diacylglycerol, and triacylglycerol.22 In visceral adipose tissue, the majority of FAs (75%) present
are oleate (C18:1), palmitate (C16:0), palmitoleate (C16:1), stearate (C18:0), and vacceneate (C19:1).23
Through paracrine mechanisms, PPAT provides PCa cells with FAs to fulfill metabolic
necessities.20 Also, as cancer progress and the demand for FA increases, de novo FA synthesis is
used by PCa cells to allow tumor proliferation and metastasis.5,9,22,24,25
In PCa, FAs are used for membrane synthesis (allowing cell growth and proliferation),
membrane saturation (providing oxidative stress resistance), lipid droplet formation (for survival
under energy stress), beta-oxidation (energy production), NADH oxidation (for redox balance),
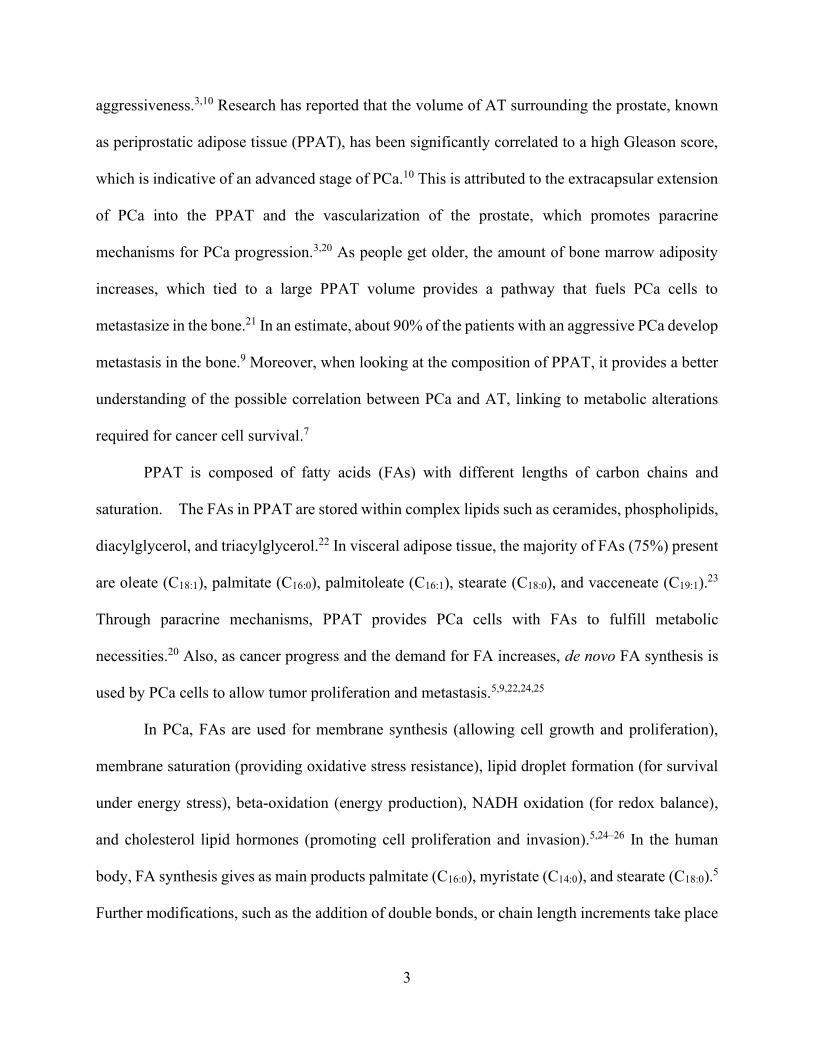
and cholesterol lipid hormones (promoting cell proliferation and invasion).5,24–26 In the human
body, FA synthesis gives as main products palmitate (C16:0), myristate (C14:0), and stearate (C18:0).5
Further modifications, such as the addition of double bonds, or chain length increments take place
4
in these FA and that can further benefit the tumor microenvironment for PCa cell proliferation.
For example, the elongation of FA chains is done by a family of elongates which add two carbons
at the end of a chain in each cycle of reactions.26 Tamura et al. reported that the overexpression of
ELOVL7 in PCa was involved in FA elongation of saturated very long chains (C20:0~) for the
formation of phospholipids, which are essential for membrane stabilization and raft formation
(signaling).27 Longer and more unsaturated fatty acids in human visceral fat are associated with
negative metabolic outcomes.23
Another modification is the degree of saturation or unsaturation of the FA chains.
Saturation (SFA) and mono-unsaturation (MUFA) of FAs by de novo lipogenesis are needed for
PCa cell membranes formation. Zadra et al. has reported that, when compared to normal tissue,
PCa tumors showed an increase in the content of SFA and MUFA and a decrease in
polyunsaturated chains (PUFA).26 When lipid chains are saturated, they are more densely packed
which alters the membrane cell dynamics affecting, for instance, the efficacy of
chemotherapeutics.24,25 The saturation protects the cancerous cells from lipid peroxidation and
oxidative stress-induced cell death.5 However, the FA profile in PPAT of PCa is yet to be closely
investigated.
1.4 Current Analytical Methodologies for Fatty Acid Analysis
Lipids are often thought to be difficult to work with because of the complexity of the
nomenclature surrounding them, the poor understanding of their role in cell functions, and the lack
of methodologies for their study.28 To study FAs in lipid tissue, these compounds first must be
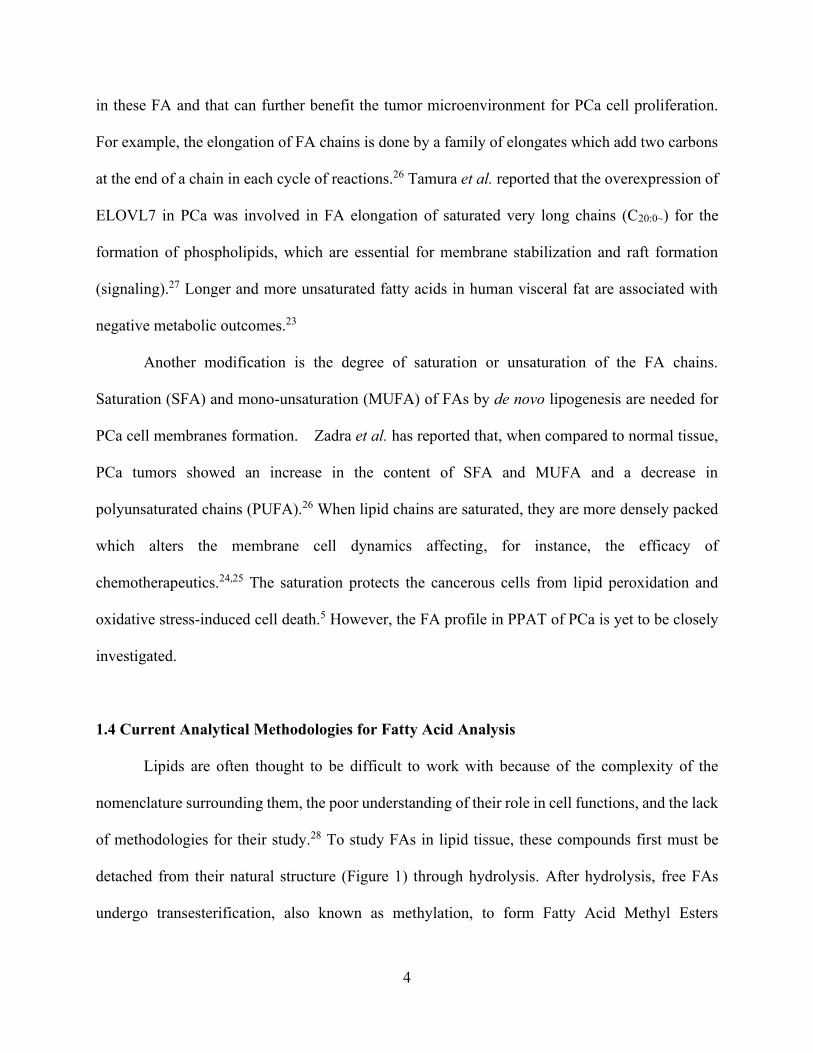
detached from their natural structure (Figure 1) through hydrolysis. After hydrolysis, free FAs
undergo transesterification, also known as methylation, to form Fatty Acid Methyl Esters
5
(FAMEs). Contrary to FA, the apolar and semi-volatile structure of FAMEs allows for their
identification and quantification using Gas Chromatography (GC).29,30
Figure 1 An illustration showing the transesterification of FAs from lipids, triglyceride molecules.
A triglyceride molecule is formed of glycerol and three molecules of FAs. The
molecules of FAs forming the triglyceride can be of different length and have a
different amount of saturations. The FAMEs structures were obtained from
PubChem.31
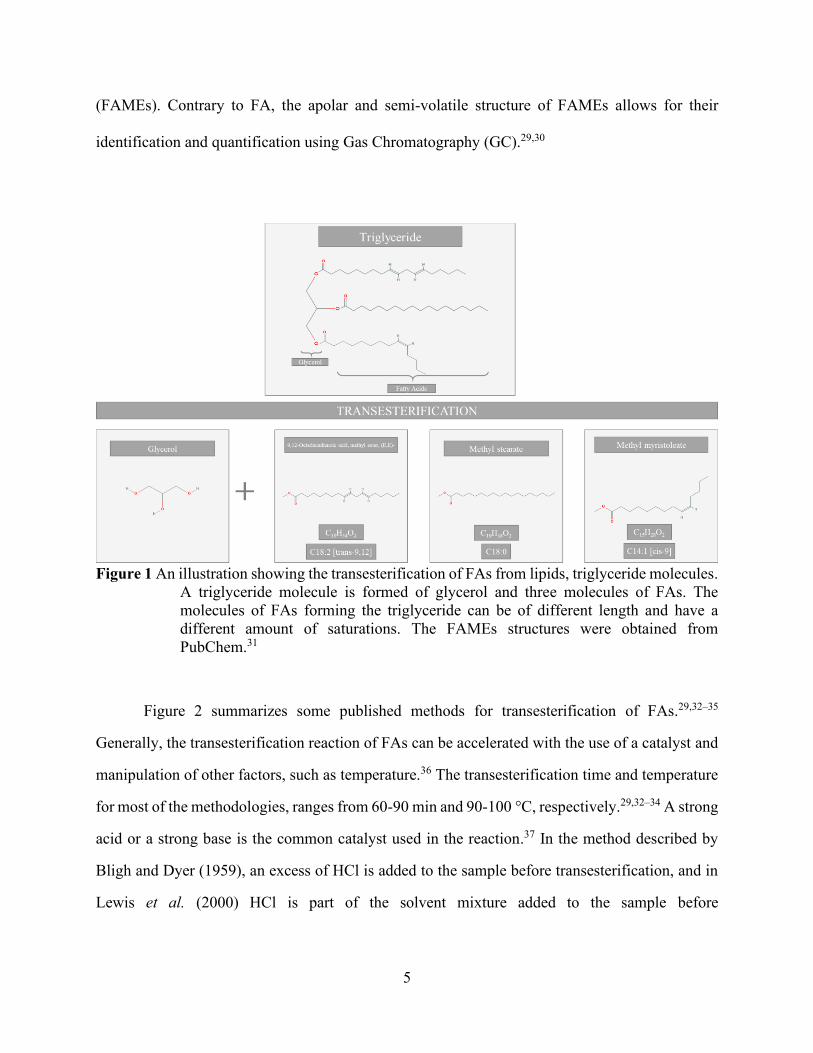
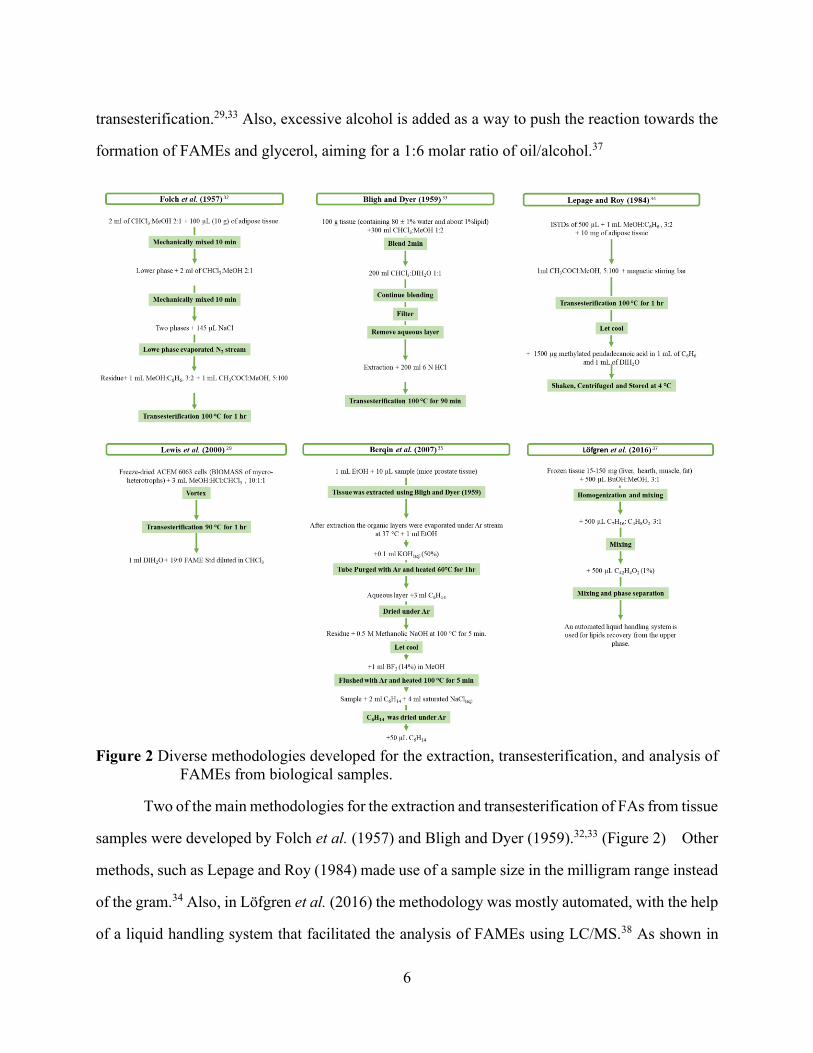
Figure 2 summarizes some published methods for transesterification of FAs.29,32–35
Generally, the transesterification reaction of FAs can be accelerated with the use of a catalyst and
manipulation of other factors, such as temperature.36 The transesterification time and temperature
for most of the methodologies, ranges from 60-90 min and 90-100 °C, respectively.29,32–34 A strong
acid or a strong base is the common catalyst used in the reaction.37 In the method described by
Bligh and Dyer (1959), an excess of HCl is added to the sample before transesterification, and in
Lewis et al. (2000) HCl is part of the solvent mixture added to the sample before
6
transesterification.29,33 Also, excessive alcohol is added as a way to push the reaction towards the
formation of FAMEs and glycerol, aiming for a 1:6 molar ratio of oil/alcohol.37
Figure 2 Diverse methodologies developed for the extraction, transesterification, and analysis of
FAMEs from biological samples.
Two of the main methodologies for the extraction and transesterification of FAs from tissue
samples were developed by Folch et al. (1957) and Bligh and Dyer (1959).32,33 (Figure 2) Other
methods, such as Lepage and Roy (1984) made use of a sample size in the milligram range instead
of the gram.34 Also, in Löfgren et al. (2016) the methodology was mostly automated, with the help
of a liquid handling system that facilitated the analysis of FAMEs using LC/MS.38 As shown in

7
Figure 2, these methods either require a large volume of organic solvents or are labor-intensive.
It is important to promote the use of green chemistry principles, such as the solvent-less sample
preparation technique, known as stir-bar sorptive extraction (SBSE), in advancing new
methodologies for the extraction and transesterification of FAs, as well as for the subsequent
extraction of FAMEs from the sample matrix.
1.5 Significance and Objectives
Diagnosing cancer staging is one of the main areas of interest in cancer research.39 The
correct staging of PCa patients is important to provide a proper evaluation, develop a personalized
treatment, and improve overall PCa prognosis for patients.40,41 PCa cells have adapted mechanisms
that ensure an optimal tumor microenvironment for cell survival and proliferation. Dietary and de
novo FAs are important for PCa cells since they are part of the energy, structural, and signaling
pathways. Many of these FAs are provided to PCa cells with the help of various molecules secreted
from PPAT. For example, FABP4 promotes the binding of long chains of FAs, which in turn can
be used in PCa cell membranes.12 It was hypothesized that the type of FA chains present in PPAT
is unique to the PCa tumor necessities, and in turn, the FA profile in PPAT could be a potential
tool for understanding the cancer metabolic microenvironment for PCa. The overarching goal of
our research is to use the FAs profile of the PPAT to develop an accurate staging tool for PCa. To
accomplish the goal, a fast and sensitive analytical tool is essential. This project was aimed to
develop a simple and solvent-less (i.e. green) method for the analysis of FAs profile in fat using
stir bar sorptive extraction (SBSE) and gas chromatography-mass spectrometry (GC-MS). We
hypothesized that by optimizing stirring time, speed, and solvent content of the sample matrix
during SBSE we can effectively extract the highly hydrophobic fatty acid methyl esters from the

8
matrices and provide an overall more effective sample preparation process for the analysis of FAs
in fat. The optimized method will allow us to study the FAs profile and PCa stage, helping in the
understanding of the tumor microenvironment, and staging of the disease.
9
CHAPTER 2 METHODOLOGY
2.1 Chemicals and Reagents
Commercially available pork fat was used as the model adipose tissue for all
experiments. Pork fat was stored at 4°C until the preparation of the fat stock solution. Food
Industry Fatty Acid Methyl Ester (FAME) Mix (2%wt/wt) standard was purchased from
RESTEK Corporation (Bellefonte, PA). A list of the 37 FAMEs in the standard is included
in Appendix 1 and 2. The concentration of FAME primary stock solution was 2.6512×10³
ppm (mg/L) in methanol (CH3OH, LC-MS Grade, Omni Solve Millipore Sigma, Billerica,
MA).
Mirex, as the internal standard, was purchased from Crescent Chemical (Islandia,
NY). Hydrochloric acid (HCl, 37% ACS grade) was purchased from Sigma Aldrich, Inc. (St.
Louis, MO). Chloroform was purchased from Fisher Scientific (Fair Lawn, NY). Acetonitrile
LC/MS grade was purchased from Fisher Chemical (Fair Lawn, NJ). Sodium Chloride
(NaCl), ACS reagent (>=99.0%) was purchased from Sigma Aldrich, Inc. (St. Louis, MO).
Deionized (DI) water was obtained using a Milli-Q system from Millipore (Bedford, MA,
USA).
2.2 Method Development
This methodology was developed following the diagram showed in Figure 3. The process
was divided into two main sections: sample preparation and sample analysis. The first part was
focused on fat sample handling, storage, homogenization, and transesterification parameters.
Sample analysis was centered around the extraction conditions and instrumentation parameters to
get an optimal separation, recovery, and identification of the analytes.
10
Figure 3 A diagram describing the method development of this project. The two main areas of the
study are sample preparation and sample analysis. Each area subdivided into more
specific sections including all variables in this study.
2.2.1 Sample Preparation
Homogenization
This step aimed to achieve a homogeneous liquid fat stock sample. Pork fat was cut into
small portions and placed in a 15ml centrifuge tube. From there the tube was left for one day in a
Freeze Dry System (FreeZone 1 Liter Benchtop by LABCONCO, Kansas City, MO) to remove
any water from the fat. About 3 g of freeze-dried pork fat were weight and added into a small
beaker containing 90 ml of HCl:CHCl3 (9:1 v:v). Then the mixture was homogenized for 1hr using
Ultrasonic Homogenizer (Model 300V/T by BioLogics, Inc., Manassas, VA) at strength 80 and a
pulse of 30%. The sample was then decanted into a 50ml centrifuge tube and centrifuged for 15
min at 3000 rpm. After these, the sample was carefully decanted on to a new 50 ml centrifuge tube
and centrifuged for 10 min at 3500 rpm. These steps were to ensure that large fat particles were
removed in the final stock fat solution. Finally, the sample was carefully decanted into a clean 50
ml centrifuge tube and stored in the 10 °C fridge until the analysis.
11
Transesterification
To promote the detection of FAs by GC-MS, transesterification of the FA contained in the
stock pork fat was necessary prior to sample analysis. The transesterification procedure developed
in this project was inspired by Lewis et al. (2000).29 Optimization of transesterification to form
fatty acid methyl esters (FAMEs) is described as follows.
Heating Method by Oven (VWR International, 1326 Gravity Oven)
300 µL pork fat stock solution (10 mg) were added into a 15 ml centrifuge tube containing
3ml of CH3OH:HCl:CHCl3 ,10:3:1 ratio. The sample was left in the oven at a temperature-
controlled between 60°C -70 °C for 2 hr. After transesterification was completed, the sample was
stored at 10 °C fridge until analysis.
Heating Method by Sonicator (Bransonic®, ultrasonic cleaner)
300 µL pork fat stock solution (10 mg) were added into a 15 ml centrifuge tube containing
3ml of CH3OH:HCl:CHCl3 ,10:3:1 ratio. Then the sample was left in the water bath on the
sonicator at a temperature fluctuating between 60°C -70°C for 1hr. After transesterification was
completed, the sample was stored at 10 °C fridge until analysis.
2.2.2 Sample Analysis
Stir Bar Sorptive Extraction (SBSE)
The basic steps of SBSE are illustrated in Figure 4. Pre-conditioned GERSTEL
TwistersTM coated with polydimethylsiloxane (PDMS, 1 mm thickness, 10 mm length) were used
12
to extract FAMEs from the sample matrix. Briefly, 0.5 mL of fat sample was transferred into
corresponding vials with 19.5 mL of DI water or desired solvent mix. Samples were then spiked
with 400 µl of 1 ppm (mg/L) of mirex as the internal standard. Finally, preconditioned GERSTEL
Twister® was added to each sample and all samples were set to stir for a pre-determined time at
pre-determined speed on a GERSTEL Twister stir plate. After stirring, each twister was removed
from solution with sterilized forceps and thoroughly rinsed with DI water. The twister was dried
with lint-free wipes and individually placed into Thermal Desorber 3.5+ (TD 3.5+) desorption tube
with glass frit. Sample was then analyzed by Thermal Desorber 3.5+ - Gas Chromatography /Mass
Spectrometry (TD 3.5+ - GC-MS).
Figure 4 Illustration of the SBSE extraction process for the analytes followed by GC-MS. A
sample containing the analytes (i.e. FAMEs) under investigation, as well as other
compounds that are part of the sample matrix, is placed in a vial. A GERSTEL
Twister® is then added to the solution to extract the desired analytes. After the
extraction is completed, the GERSTEL Twister® is placed on a desorption tube
followed by chemical analysis on a TD/GC-MS system.
13
Chemical Analysis (TD 3.5+ - GC-MS)
After SBSE, the GERSTEL Twisters were removed and placed in a TD 3.5+ desorption
tube with glass frit. The desorption tube was then placed in a GERSTEL TD 3.5+ for the analysis
of FA methyl esters by GC-MS. Instrumental settings were as follows. TD 3.5+ initial temperature
was programmed to have an initial temperature of 50 °C and then ramp to a final temperature of
260 °C (held for 3 min) at a rate of 100 °C/min. The transfer line temperature was set at 300 °C.
During the thermal desorption, compounds were cryo-focused in a baffled glass liner CIS4 using
the GERSTEL Cooled Injection System (CIS) under liquid nitrogen at -40 °C (equilibration time
0.5min). Once desorption was completed, the CIS was heated from -40 to 300 °C (held for 1 min)
at a rate of 12 °C/s. The separation of all FAMEs analytes was completed on an Agilent
8890/5977B GC-MSD system (Agilent, CA, USA) fitted with a J&W HP-5MS ultra inert capillary
column (0.25 mm × 30 m × 0.25 um, Agilent, CA, USA). The GC oven was programmed to have
an initial temperature of 50°C which was first increased to 200 °C (held for 1 min) at a rate of
10°C/min, then the temperature was increased to 260 °C at a rate of 3 °C/min, and finally, the
temperature was increased to 300 °C (held for 5 min) at a rate of 10 °C/min. Ultra-high purity
helium was used as the carrier gas with a constant flow of 0.9 mL/min.
2.3 Statistical Analysis
T-test was performed using Microsoft Excel for Office 365 MSO to compare the means of
the number of FAMEs found under various conditions while studying transesterification. Tukey
test and ANOVA were performed using R to compare the recovery means of the 36 FAMEs across
different times and percentages of CH3OH.
14
CHAPTER 3. RESULTS AND DISCUSSION
3.1 Sample Preparation
This section shows the results for the optimization of the transesterification process, for
which several factors were studied. For transesterification, we studied the temperature effect on
the formation of FAMEs (60-70 °C and 80-90 °C), as well as the effect of having different times
of duration for the overall reaction (1 hr vs 2 hrs), and finally, we studied different quantities of
the acid in the solvent mixture (10:1:1, CH3OH:HCl:CHCl3, v/v/v and 10:3:1,
CH3OH:HCl:CHCl3, v/v/v). These conditions were studied using two available heating sources
which were a sonicator and an oven. The performance of each condition was evaluated by the
quantities of FAMEs which were determined by the instrument response on a GC-MS.
3.1.1 Transesterification
Two heating devices were used to determine the best transesterification temperatures for
the fat samples: an oven and a sonicator. The studied parameters were temperature,
transesterification time, and HCl ratio in the overall solvent mixture used for the transesterification.
A total of six different conditions were investigated, t1:T60-70:A1, t2:T60-70:A1, t1:T60-70:A3,
t2:T60-70:A3, t1:T80-90:A3, t2:T80-90:A3, where t stands for time, T stands for temperature, and
A for the HCl used in the solvent mixture (A1: 10:1:1, CH3OH:HCl:CHCl3, v/v/v, and A3: 10:3:1,
CH3OH:HCl:CHCl3, v/v/v)). Table 1 shows the number of FAMEs that were produced and
detected by the conditions under investigation. Data collection and analysis protocols were detailed
in Appendix 3. Only FAMEs that were identified by the library with a matching quality greater
than 50% were considered in the data analysis. Samples were run in triplicates for each variable
combination and the statistical analysis results are summarized in Appendix 4.
15
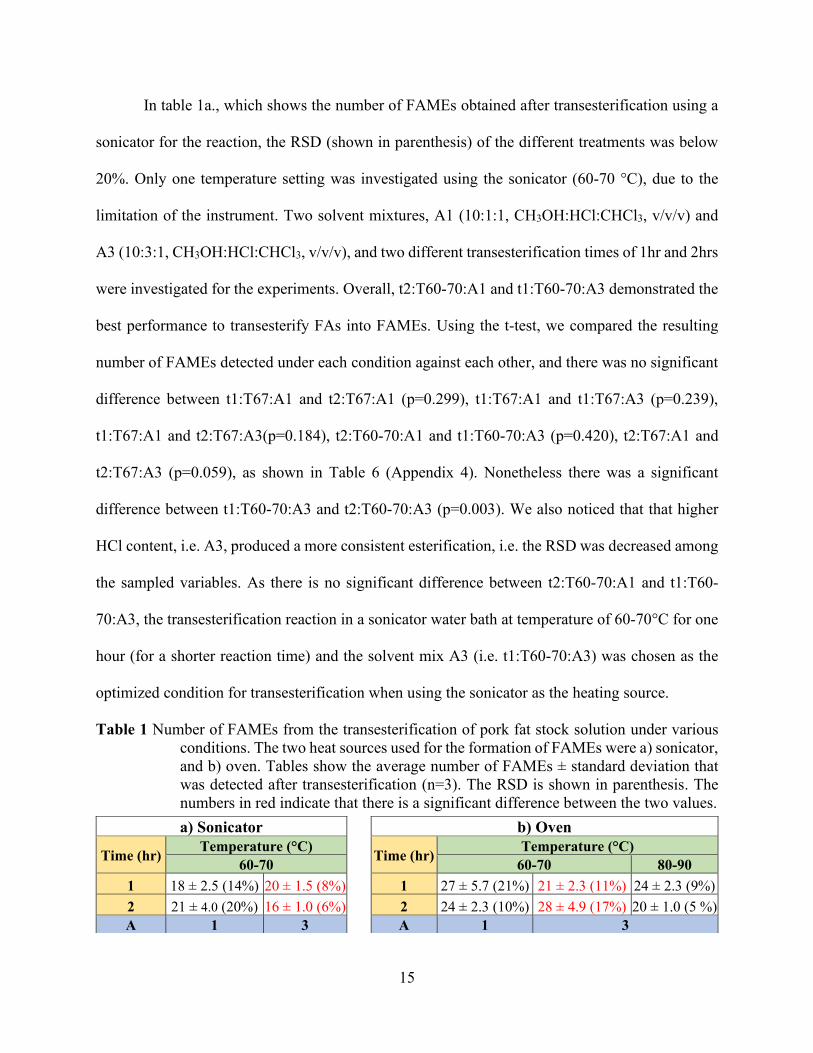
In table 1a., which shows the number of FAMEs obtained after transesterification using a
sonicator for the reaction, the RSD (shown in parenthesis) of the different treatments was below
20%. Only one temperature setting was investigated using the sonicator (60-70 °C), due to the
limitation of the instrument. Two solvent mixtures, A1 (10:1:1, CH3OH:HCl:CHCl3, v/v/v) and
A3 (10:3:1, CH3OH:HCl:CHCl3, v/v/v), and two different transesterification times of 1hr and 2hrs
were investigated for the experiments. Overall, t2:T60-70:A1 and t1:T60-70:A3 demonstrated the
best performance to transesterify FAs into FAMEs. Using the t-test, we compared the resulting
number of FAMEs detected under each condition against each other, and there was no significant
difference between t1:T67:A1 and t2:T67:A1 (p=0.299), t1:T67:A1 and t1:T67:A3 (p=0.239),
t1:T67:A1 and t2:T67:A3(p=0.184), t2:T60-70:A1 and t1:T60-70:A3 (p=0.420), t2:T67:A1 and
t2:T67:A3 (p=0.059), as shown in Table 6 (Appendix 4). Nonetheless there was a significant
difference between t1:T60-70:A3 and t2:T60-70:A3 (p=0.003). We also noticed that that higher
HCl content, i.e. A3, produced a more consistent esterification, i.e. the RSD was decreased among
the sampled variables. As there is no significant difference between t2:T60-70:A1 and t1:T60-
70:A3, the transesterification reaction in a sonicator water bath at temperature of 60-70°C for one
hour (for a shorter reaction time) and the solvent mix A3 (i.e. t1:T60-70:A3) was chosen as the
optimized condition for transesterification when using the sonicator as the heating source.
Table 1 Number of FAMEs from the transesterification of pork fat stock solution under various
conditions. The two heat sources used for the formation of FAMEs were a) sonicator,
and b) oven. Tables show the average number of FAMEs ± standard deviation that
was detected after transesterification (n=3). The RSD is shown in parenthesis. The
numbers in red indicate that there is a significant difference between the two values.
a) Sonicator b) Oven
Time (hr) Temperature (°C) Time (hr)
Temperature (°C)
60-70 60-70 80-90
1 18 ± 2.5 (14%) 20 ± 1.5 (8%) 1 27 ± 5.7 (21%) 21 ± 2.3 (11%) 24 ± 2.3 (9%)
2 21 ± 4.0 (20%) 16 ± 1.0 (6%) 2 24 ± 2.3 (10%) 28 ± 4.9 (17%) 20 ± 1.0 (5 %)
A 1 3 A 1 3
16
Table 1b. shows the data obtained for transesterification using an oven for the reaction.
Two temperature variables were studied at 60-70 °C and 80-90 °C under the same solvent mixture
systems and times as those tested in the sonication experiment. The highest number of FAMEs
was produced under t2:T60-70:A3 followed by the results under t1:T60-70:A1. The higher
temperature did not favor the degree of transesterification. Based on the t-test, there was a
significant difference when comparing t1:T60-70:A3 to t2:T60-70:A3 (p=0.04); and no significant
difference among any of the other conditions. The results showed that the conditions of
temperature range 60-70 °C for two hours using the solvent mix A3 resulted in the greatest number
of FAMEs (28 ± 5).
We noticed that the heating in the oven may produce a more consistent heat transfer to the
reaction which, in turn, resulted in better transesterification of FAs into FAMEs. Table 1a had less
number of recovered FAMEs when compared to the conditions on table 1b. Nevertheless, the RSD
was lower for most of the conditions in Table 1a (t1:T67:A1, t1:T67:A3, t2:T67:A3) in contrast to
Table 1b, except for one condition ( t2:T67:A1). In regard to reaction time, the production of
FAMEs under 1 hour reaction time was generally equal to or better than the performance in 2 hours
using sonicator as shown in table 1a. As for the oven heating experiment, two hours of the reaction
was better for achieving a high number of FAMEs formed. This difference of time between the
oven and the sonicator could be due to the active mixing of the sample happening in the sonicator,
while in the oven the sample remains static through the heating process.
Overall a transesterification protocol was optimized for both the oven and the sonicator.
When comparing the number of FAMEs in obtained in the best condition of the sonicator (t1:T60-
70:A3) versus the best condition in the oven (t2:T60-70:A3) there was a significant difference
between both results (p=0.028). But for safety concerns, the sonicator was selected as the heating
17
source of choice considering the volatility of the compounds used in the solvent mixture and the
acids used in the reaction. A sonicator can be placed inside of a fume hood, making it a safer
instrument to be used during the transesterification of FAs. Overall based on the findings it was
decided that the condition for the optimal transesterification of FAs moving forward would be
maintaining a temperature between 60-70 °C for 1 hr using a solvent mixture of 10:3:1,
CH3OH:HCl:CHCl3, v/v/v using the sonicator.
3.2 FAMEs Extraction
After the esterification, FAMEs were extracted from the matrices prior to the chemical
analysis. As showed in the schematic of Figure 1, the extraction of the FAMEs from the sample
was achieved using SBSE. SBSE was first introduced to the analytical world of extractions by
Baltussen et al. (1999). 42 The technique is solventless and acts to preconcentrate the analyte before
instrumental analysis. It is similar to solid-phase micro-extraction (SPME), which is also a solvent-
free sample preparation technique that includes the use of a solid sorbent in the form of a syringe
for the extraction of the analyte of interest from the sample.43 Nevertheless, the surface area
occupied by the polymer is larger in SBSE than that in SPME, allowing a higher amount of analyte
to be extracted. The theory behind the technique is based on the sorption of the analyte on to the
specific polymer coating the stir bar (twister). The extraction then depends on the octanol-water
partition coefficient (Ko/w, also expressed in Log scale, i.e. log P) of each specific analyte. SBSE
is used for the extraction of medium-polar and non-polar compounds. In general, the theoretical
extraction efficiency reaches 100% for solutes with log P greater than 2.7 (Figure 5).
18
Figure 5 Recovery for solutes in the function of the octanol-water partitioning coefficient Ko/w
for SPME (10 mL sample, 0.5 μL PDMS) and for SBSE (10 mL sample, 100 μL
PDMS-fiber coated stir bar).42
To achieve the optimal extraction of a specific analyte, parameters such as the extraction
phase (twister coating), the sampling mode (direct immersion, or headspace), and other extraction
parameters (organic modifier or salt addition, pH adjustment, temperature, extraction time, stirring
speed during the extraction) have to be considered. For this experiment, the extraction phase was
set to be Polydimethylsiloxane (PDMS) which is the type of stir bar available in the laboratory,
and the chosen sampling mode was direct immersion. A FAMEs standard containing 37 saturated
and unsaturated FAMEs was used for these experiments. Table 2 shows the list of the 37
compounds tested. The pH adjustment and temperature as extraction parameters were not studied.
In this section we studied the extraction parameters of solvent addition, stirring time, and stirring
speed.
19
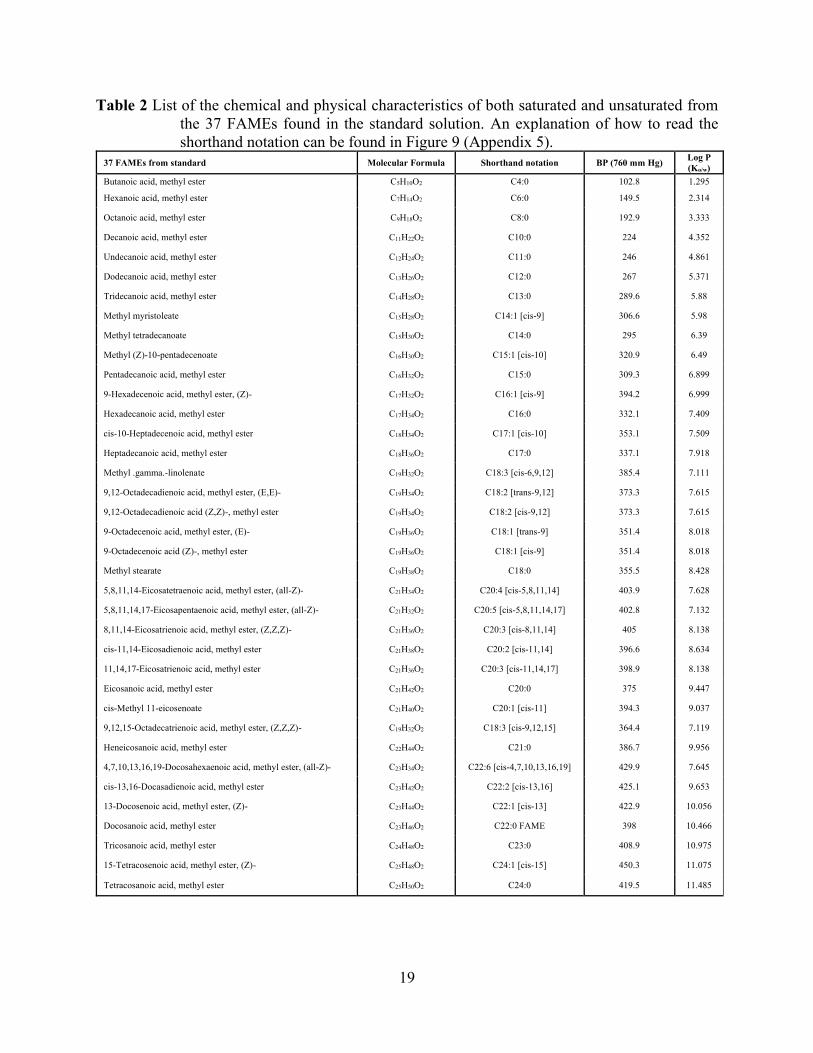
Table 2 List of the chemical and physical characteristics of both saturated and unsaturated from
the 37 FAMEs found in the standard solution. An explanation of how to read the
shorthand notation can be found in Figure 9 (Appendix 5).
37 FAMEs from standard Molecular Formula Shorthand notation BP (760 mm Hg) Log P
(Ko/w)
Butanoic acid, methyl ester C5H10O2 C4:0 102.8 1.295
Hexanoic acid, methyl ester C7H14O2 C6:0 149.5 2.314
Octanoic acid, methyl ester C9H18O2 C8:0 192.9 3.333
Decanoic acid, methyl ester C11H22O2 C10:0 224 4.352
Undecanoic acid, methyl ester C12H24O2 C11:0 246 4.861
Dodecanoic acid, methyl ester C13H26O2 C12:0 267 5.371
Tridecanoic acid, methyl ester C14H28O2 C13:0 289.6 5.88
Methyl myristoleate C15H28O2 C14:1 [cis-9] 306.6 5.98
Methyl tetradecanoate C15H30O2 C14:0 295 6.39
Methyl (Z)-10-pentadecenoate C16H30O2 C15:1 [cis-10] 320.9 6.49
Pentadecanoic acid, methyl ester C16H32O2 C15:0 309.3 6.899
9-Hexadecenoic acid, methyl ester, (Z)- C17H32O2 C16:1 [cis-9] 394.2 6.999
Hexadecanoic acid, methyl ester C17H34O2 C16:0 332.1 7.409
cis-10-Heptadecenoic acid, methyl ester C18H34O2 C17:1 [cis-10] 353.1 7.509
Heptadecanoic acid, methyl ester C18H36O2 C17:0 337.1 7.918
Methyl .gamma.-linolenate C19H32O2 C18:3 [cis-6,9,12] 385.4 7.111
9,12-Octadecadienoic acid, methyl ester, (E,E)- C19H34O2 C18:2 [trans-9,12] 373.3 7.615
9,12-Octadecadienoic acid (Z,Z)-, methyl ester C19H34O2 C18:2 [cis-9,12] 373.3 7.615
9-Octadecenoic acid, methyl ester, (E)- C19H36O2 C18:1 [trans-9] 351.4 8.018
9-Octadecenoic acid (Z)-, methyl ester C19H36O2 C18:1 [cis-9] 351.4 8.018
Methyl stearate C19H38O2 C18:0 355.5 8.428
5,8,11,14-Eicosatetraenoic acid, methyl ester, (all-Z)- C21H34O2 C20:4 [cis-5,8,11,14] 403.9 7.628
5,8,11,14,17-Eicosapentaenoic acid, methyl ester, (all-Z)- C21H32O2 C20:5 [cis-5,8,11,14,17] 402.8 7.132
8,11,14-Eicosatrienoic acid, methyl ester, (Z,Z,Z)- C21H36O2 C20:3 [cis-8,11,14] 405 8.138
cis-11,14-Eicosadienoic acid, methyl ester C21H38O2 C20:2 [cis-11,14] 396.6 8.634
11,14,17-Eicosatrienoic acid, methyl ester C21H36O2 C20:3 [cis-11,14,17] 398.9 8.138
Eicosanoic acid, methyl ester C21H42O2 C20:0 375 9.447
cis-Methyl 11-eicosenoate C21H40O2 C20:1 [cis-11] 394.3 9.037
9,12,15-Octadecatrienoic acid, methyl ester, (Z,Z,Z)- C19H32O2 C18:3 [cis-9,12,15] 364.4 7.119
Heneicosanoic acid, methyl ester C22H44O2 C21:0 386.7 9.956
4,7,10,13,16,19-Docosahexaenoic acid, methyl ester, (all-Z)- C23H34O2 C22:6 [cis-4,7,10,13,16,19] 429.9 7.645
cis-13,16-Docasadienoic acid, methyl ester C23H42O2 C22:2 [cis-13,16] 425.1 9.653
13-Docosenoic acid, methyl ester, (Z)- C23H44O2 C22:1 [cis-13] 422.9 10.056
Docosanoic acid, methyl ester C23H46O2 C22:0 FAME 398 10.466
Tricosanoic acid, methyl ester C24H48O2 C23:0 408.9 10.975
15-Tetracosenoic acid, methyl ester, (Z)- C25H48O2 C24:1 [cis-15] 450.3 11.075
Tetracosanoic acid, methyl ester C25H50O2 C24:0 419.5 11.485
20
3.2.1 Solvent Addition and Stirring Time
Solvent addition and stirring time were analyzed together as possible variables that had the
capability of improving the extraction efficiency of FAMEs (Figure 6). The use of an organic
solvent in the sample matrix can increase the solubility of non-polar compounds (log p >3) by
minimizing the interaction of the analyte to the container (e.g. glass vial).42 Tables 4 & 5
(Appendix 1 & 2) show a detailed list of the physical and chemical characteristics of the FAMEs
analyzed in this project. The Log P (Ko/w) is a measurement that allows us to understand the
hydrophilicity of a compound. Since most of the FAMEs have a Log P>3, it was considered that
the use of an organic solvent would help to maximize the recovery of the analytes. CH3OH was
the solvent of choice for these experiments. The addition of CH3OH to the sample matrix was
studied at 0%, 5%, 10%, and 30% of the total solvent composition. The statistical analysis of the
experiment is shown in Table 6 (Appendix 4). Results indicate that all CH3OH conditions were
significantly different as compared to 0% CH3OH. After looking at the peak area (i.e. the
instrument response) of each compound under every condition, it was concluded that the extraction
of most of the FAMEs from the matrix solution was achieved with better efficiency without adding
CH3OH to the extraction matrix. It could be due to the fact that CH3OH also increases the solubility
of FAMEs in the solvent, hence reduce the extraction of those compounds onto the stir bar.
Stirring time was also evaluated since it is known that extraction time plays an important
role in extraction effectiveness.42 In Figure 6 every CH3OH condition was evaluated at the stirring
times of 1 hr, 2 hr, 3 hr, 6 hr, and 12 hr. The effect of the studied variables was analyzed in each
of the compounds both individually and as a group. Figure 6a shows the response of each FAMEs
found in the sample while stirring for 1hr and having different percentages of CH3OH in the
extraction matrix. Figure 6a had the highest response for the majority of the compounds at 0%
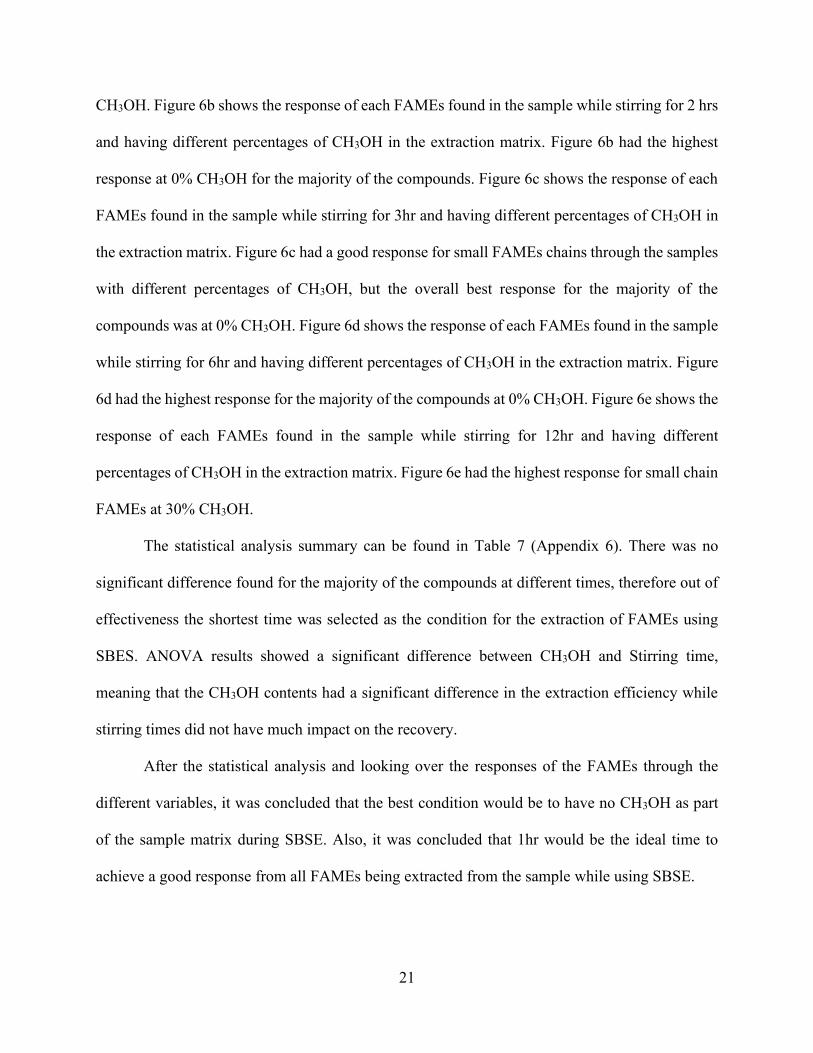
21
CH3OH. Figure 6b shows the response of each FAMEs found in the sample while stirring for 2 hrs
and having different percentages of CH3OH in the extraction matrix. Figure 6b had the highest
response at 0% CH3OH for the majority of the compounds. Figure 6c shows the response of each
FAMEs found in the sample while stirring for 3hr and having different percentages of CH3OH in
the extraction matrix. Figure 6c had a good response for small FAMEs chains through the samples
with different percentages of CH3OH, but the overall best response for the majority of the
compounds was at 0% CH3OH. Figure 6d shows the response of each FAMEs found in the sample
while stirring for 6hr and having different percentages of CH3OH in the extraction matrix. Figure
6d had the highest response for the majority of the compounds at 0% CH3OH. Figure 6e shows the
response of each FAMEs found in the sample while stirring for 12hr and having different
percentages of CH3OH in the extraction matrix. Figure 6e had the highest response for small chain
FAMEs at 30% CH3OH.
The statistical analysis summary can be found in Table 7 (Appendix 6). There was no
significant difference found for the majority of the compounds at different times, therefore out of
effectiveness the shortest time was selected as the condition for the extraction of FAMEs using
SBES. ANOVA results showed a significant difference between CH3OH and Stirring time,
meaning that the CH3OH contents had a significant difference in the extraction efficiency while
stirring times did not have much impact on the recovery.
After the statistical analysis and looking over the responses of the FAMEs through the
different variables, it was concluded that the best condition would be to have no CH3OH as part
of the sample matrix during SBSE. Also, it was concluded that 1hr would be the ideal time to
achieve a good response from all FAMEs being extracted from the sample while using SBSE.
22
Figure 6 Comparison of FAMEs recoveries using SBSE across different stirring times and CH3OH
percentages. Each graph shows a stirring time for the extraction of each of the 36
FAMEs found in the standard stock solution, at times of a)1 hr, b)2 hrs, c)3 hrs, d)6
hrs, and e)12 hrs. The presence of different percentages of CH3OH (0%, 5%, 10%,
and 30%) in the extraction matrix was evaluated as a possible factor to increase the
recovery of FAMEs with Log P >3 (n=6).
23
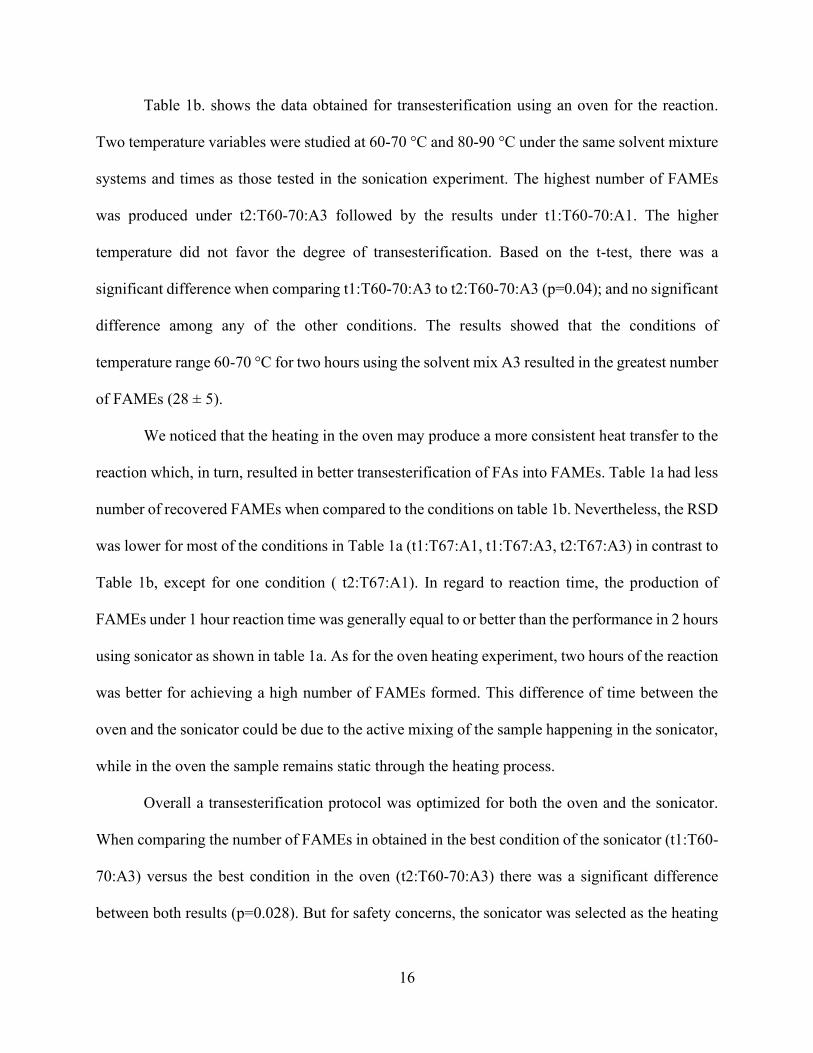
3.2.2 Stirring Speed
The stirring speed during extraction was analyzed as a possible variable to improve the
extraction efficiency of FAMEs. Based on previous results, 1 hour of stirring time was used in the
study of the effect of stirring speed on the recovery. To avoid excessive or too little agitation, the
studied speeds were 700, 1000, and 1500 RPM, which are normally the recommended speeds.42
As shown in Figure 7, the recovery of each FAME compound was impacted by the different
stirring speeds. Also, it was observed that the recovery of smaller chains of FAMEs was higher
compared to the recovery of larger chains of FAMEs through all stirring speeds.
Figure 7 Recovery of FAMEs using SBSE. The extraction was studied at 700 RPM, 1000 RPM,
1500 RPM for the duration of 1hour. (n=4)
Taking the average mean of the total response for the compounds at different stirring
speeds, a t-test looked at the statistical difference between these means. The statistical analysis
results in Table 3 showed that there was a large significant difference (p-value= 0.004) between
-
50,000,000
100,000,000
150,000,000
200,000,000
250,000,000
C6
:0
C8
:0
C1
0:0
C1
1:0
C1
2:0
C1
3:0
C1
4:1
[ci
s-9
]
C1
4:0
C1
5:1
[ci
s-1
0]
C1
5:0
C1
6:1
[ci
s-9
]
C1
6:0
C1
7:1
[ci
s-1
0]
C1
7:0
C1
8:3
[ci
s-6
,9,1
2]
C1
8:2
[tr
ans-
9,1
2]
C1
8:2
[ci
s-9
,12]
C1
8:1
[tr
ans-
9]
C1
8:1
[ci
s-9
]
C1
8:0
C2
0:4
[ci
s-…
C2
0:5
[ci
s-…
C2
0:3
[ci
s-8
,11,1
4]
C2
0:2
[ci
s-1
1,1
4]
C2
0:3
[ci
s-…
C2
0:0
C2
0:1
[ci
s-1
1]
C1
8:3
[ci
s-9
,12,1
5]
C2
1:0
C2
2:6
[ci
s-…
C2
2:2
[ci
s-1
3,1
6]
C2
2:1
[ci
s-1
3]
C2
2:0
FA
ME
C2
3:0
C2
4:1
[ci
s-1
5]
C2
4:0
Res
po
nse
700 RPM 1000 RPM 1500 RPM
24
using 700 RPM and 1500 RPM; also there was a slightly significant difference (p-value= 0.035)
between using 1000 RPM and 1500 RPM as stirring speed, but no significant difference (p-
value=0.182) between using 1000 RPM and 700 RPM as stirring speed. When looking at
individual compounds and comparing them through different stirring speeds Table 8 (Appendix 7)
it was observed that at higher speed (1500 RPM) promotes the recovery of long-chain FAMEs
from the sample. Therefore, 1500 RPM was the stirring speed chosen for the method.
Table 3 Statistical analysis summary for stirring speed experiments. T-test showed that there was
a significant difference (p-value<0.05) between using 700 RPM or 1500 RPM, and
between 1000 RPM and 1500 RPM.
T-test (p-value)
RPM 1000 1500
700 0.182 0.004
1000 0.035
Finally, we attempted to use the optimized methodology to estimate the concentration of
the FAMEs extracted from pork fat. During SBSE procedures, 1 µL of the stock standard (at
2.6512×10³ ppm, mg/L) was diluted in 20 mL of water giving the final concentration of the
solution at 0.132 ppm (mg/L). This concentration and the percent contribution of each of
FAMEs in the standard44 were then used to calculate the concentration of each FAMEs in
the SBSE solution. The response obtained from each extracted FAMEs was assumed to
account for 100% extraction efficacy for that compound. Using the relationship between
the concentration of each FAME in the standard solution and their instrument response, we were
then able to estimate the concentration of the FAMEs extracted from pork fat by doing a linear
extrapolation.
25
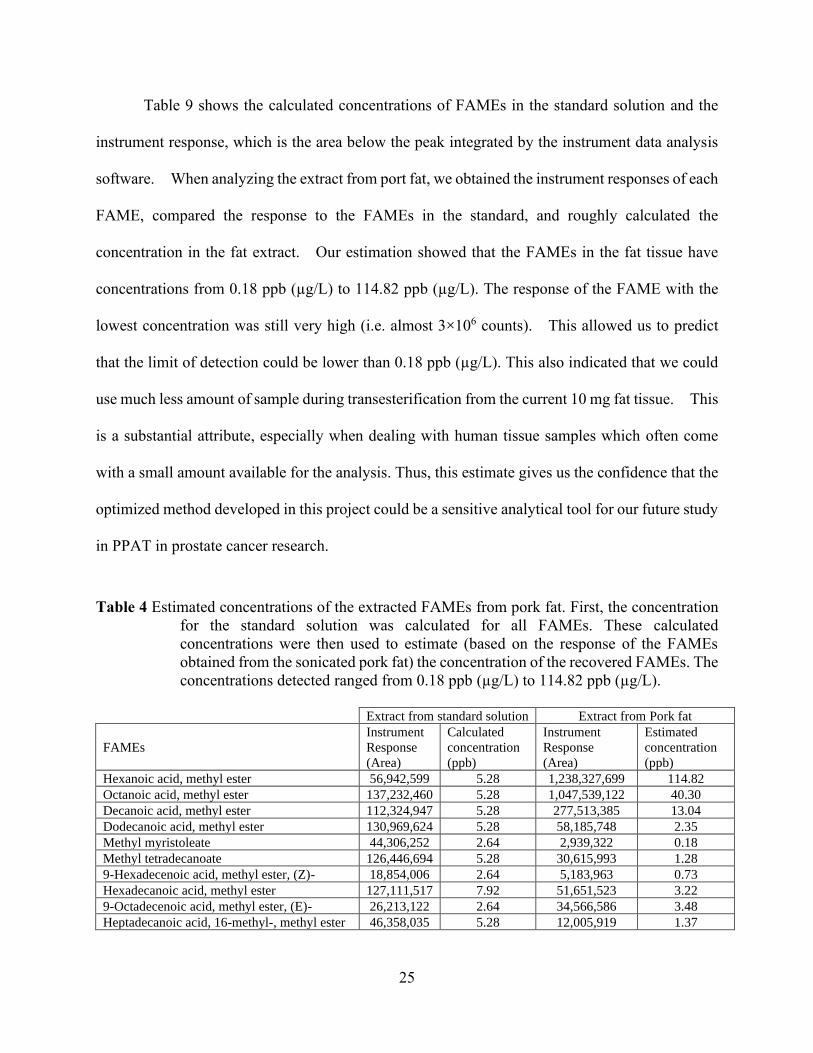
Table 9 shows the calculated concentrations of FAMEs in the standard solution and the
instrument response, which is the area below the peak integrated by the instrument data analysis
software. When analyzing the extract from port fat, we obtained the instrument responses of each
FAME, compared the response to the FAMEs in the standard, and roughly calculated the
concentration in the fat extract. Our estimation showed that the FAMEs in the fat tissue have
concentrations from 0.18 ppb (µg/L) to 114.82 ppb (µg/L). The response of the FAME with the
lowest concentration was still very high (i.e. almost 3×10⁶ counts). This allowed us to predict
that the limit of detection could be lower than 0.18 ppb (µg/L). This also indicated that we could
use much less amount of sample during transesterification from the current 10 mg fat tissue. This
is a substantial attribute, especially when dealing with human tissue samples which often come
with a small amount available for the analysis. Thus, this estimate gives us the confidence that the
optimized method developed in this project could be a sensitive analytical tool for our future study
in PPAT in prostate cancer research.
Table 4 Estimated concentrations of the extracted FAMEs from pork fat. First, the concentration
for the standard solution was calculated for all FAMEs. These calculated
concentrations were then used to estimate (based on the response of the FAMEs
obtained from the sonicated pork fat) the concentration of the recovered FAMEs. The
concentrations detected ranged from 0.18 ppb (µg/L) to 114.82 ppb (µg/L).
Extract from standard solution Extract from Pork fat
FAMEs
Instrument
Response
(Area)
Calculated
concentration
(ppb)
Instrument
Response
(Area)
Estimated
concentration
(ppb)
Hexanoic acid, methyl ester 56,942,599 5.28 1,238,327,699 114.82
Octanoic acid, methyl ester 137,232,460 5.28 1,047,539,122 40.30
Decanoic acid, methyl ester 112,324,947 5.28 277,513,385 13.04
Dodecanoic acid, methyl ester 130,969,624 5.28 58,185,748 2.35
Methyl myristoleate 44,306,252 2.64 2,939,322 0.18
Methyl tetradecanoate 126,446,694 5.28 30,615,993 1.28
9-Hexadecenoic acid, methyl ester, (Z)- 18,854,006 2.64 5,183,963 0.73
Hexadecanoic acid, methyl ester 127,111,517 7.92 51,651,523 3.22
9-Octadecenoic acid, methyl ester, (E)- 26,213,122 2.64 34,566,586 3.48
Heptadecanoic acid, 16-methyl-, methyl ester 46,358,035 5.28 12,005,919 1.37
26
CHAPTER 4. CONCLUSIONS
This project developed a methodology for the transesterification and extraction of
FAMEs from adipose tissue as shown in Figure 9. Pork fat was used as the model adipose
tissue during the development of the methodology. For transesterification studies, the
variables studied were solvent mixture composition, transesterification time, and heating
method. Furthermore, for the improvement of the SBSE extraction process, the studied
variables were stirring time, stirring speed, and solvent composition.
Homogenization (StS)
30 ml of HCl:CHCl3 (9:1,v:v) + 1 g of Freeze Dry Pork Fat
Transesterification (TS)
3 ml of CH3OH:HCl:CHCl3, 10:3:1 + 300 µL StS (i.e. 10 mg fat)
1 hr at 60-70 °C in Sonicator.
Extraction (SBSE)
19.5 ml DI H2O + 500 µL (TS) + 400 µL of 1ppm (mg/L) Mirex
1 hr Stirring Time at 1500 RPM
Optimized Methodology
Figure 8 Diagram showing the steps for the optimized method for the analysis of FAs
in fat. StS: Stock sample after homogenization; TS: Transesterified
sample.
27
Based on our results, we chose the solvent mixture CH3OH:HCl:CHCl3, 10:3:1
(v/v/v) as the solvent condition tested for the transesterification as it gave the most number
of FAs extracted from the fat while using the sonicator as the heating source for1 hr. The
transesterification could take place in either heating source, nevertheless, using the
sonicator was recommended over the oven for safety concern, since a sonicator could be
used inside the hood during transesterification of the samples to avoid the emission of
harmful chemical fumes.
For SBSE there was no significant difference found across different extraction times,
therefore it was decided that 1hr was the best stirring time to be used. There was a
significant difference found among various CH3OH contents, with 0% CH3OH giving the
highest recovery for the majority of the compounds.
These results from this study demonstrated a green chemistry approach for the analysis of
FAs (in forms of FAMEs) in adipose tissue samples. In contrast to previous methodologies, this
method used a solventless (i.e. green chemistry) extraction techniques by using SBSE. As
compared to the existing methods, the optimized method used no organic solvent and minimal
labor during the extraction process. Also, the sample size required for the developed methodology
was less (10 mg) than that reported in previously developed methodologies (15 – 1000 mg shown
in Figure 2).
Based on our estimation, the optimized method could be capable of detecting FAMEs at a
concentration below 0.18 ppb (µg/L). The amount of fat tissue used in this study was 10 mg.
This finding indicated that we could potentially handle the analysis of FAs in a PPAT sample as
small as 1 mg or less. This will be an important benefit for this kind of study when the mass of
samples is limited.
28
Overall, the project has laid a foundation for an easy, green, and sensitive method for the
analysis of FAs in fat tissue. To our knowledge, it is the first methodology currently developed
that uses SBSE as the extraction technique. For future improvement, we will continue working
on determining the linearity and the method detection limit. In the future, this project could
become a tool to study the profile of FAs in PPAT for a better understanding of the role of FAs in
prostate cancer progression and aggressiveness.
29
REFERENCES
(1) American Cancer Society | Cancer Facts & Statistics
http://cancerstatisticscenter.cancer.org/ (accessed Apr 14, 2020).
(2) Key Statistics for Prostate Cancer | Prostate Cancer Facts
https://www.cancer.org/cancer/prostate-cancer/about/key-statistics.html (accessed Nov 9,
2019).
(3) Nassar, Z. D.; Aref, A. T.; Miladinovic, D.; Mah, C. Y.; Raj, G. V.; Hoy, A. J.; Butler, L.
M. Peri-Prostatic Adipose Tissue: The Metabolic Microenvironment of Prostate Cancer.
BJU Int. 2018, 121 Suppl 3, 9–21. https://doi.org/10.1111/bju.14173.
(4) Nieman, K. M.; Romero, I. L.; Van Houten, B.; Lengyel, E. Adipose Tissue and Adipocytes
Support Tumorigenesis and Metastasis. Biochim. Biophys. Acta 2013, 1831 (10), 1533–
1541. https://doi.org/10.1016/j.bbalip.2013.02.010.
(5) Suburu, J.; Chen, Y. Q. Lipids and Prostate Cancer. Prostaglandins & Other Lipid
Mediators 2012, 98 (1), 1–10. https://doi.org/10.1016/j.prostaglandins.2012.03.003.
(6) Zaidi, N.; Lupien, L.; Kuemmerle, N. B.; Kinlaw, W. B.; Swinnen, J. V.; Smans, K.
Lipogenesis and Lipolysis: The Pathways Exploited by the Cancer Cells to Acquire Fatty
Acids. Progress in Lipid Research 2013, 52 (4), 585–589.
https://doi.org/10.1016/j.plipres.2013.08.005.
(7) Wu, X.; Daniels, G.; Lee, P.; Monaco, M. E. Lipid Metabolism in Prostate Cancer. Am J
Clin Exp Urol 2014, 2 (2), 111–120.
(8) Calle, E. E.; Rodriguez, C.; Walker-Thurmond, K.; Thun, M. J. Overweight, Obesity, and
Mortality from Cancer in a Prospectively Studied Cohort of U.S. Adults. New England
Journal of Medicine 2003, 348 (17), 1625–1638. https://doi.org/10.1056/NEJMoa021423.
30
(9) Uehara, H.; Kobayashi, T.; Matsumoto, M.; Watanabe, S.; Yoneda, A.; Yoshimi, B.
Adipose Tissue:Critical Contributor to the Development of Prostate Cancer. J. Med. Invest.
2018, 65 (1.2), 9–17. https://doi.org/10.2152/jmi.65.9.
(10) Tan, W. P.; Lin, C.; Chen, M.; Deane, L. A. Periprostatic Fat: A Risk Factor for Prostate
Cancer? Urology 2016, 98, 107–112. https://doi.org/10.1016/j.urology.2016.07.042.
(11) Sethi, J. K.; Vidal-Puig, A. J. Thematic Review Series: Adipocyte Biology. Adipose Tissue
Function and Plasticity Orchestrate Nutritional Adaptation. J Lipid Res 2007, 48 (6), 1253–
1262. https://doi.org/10.1194/jlr.R700005-JLR200.
(12) McKillop, I. H.; Girardi, C. A.; Thompson, K. J. Role of Fatty Acid Binding Proteins
(FABPs) in Cancer Development and Progression. Cellular Signalling 2019, 62, 109336.
https://doi.org/10.1016/j.cellsig.2019.06.001.
(13) MacInnis, R. J.; English, D. R. Body Size and Composition and Prostate Cancer Risk:
Systematic Review and Meta-Regression Analysis. Cancer Causes Control 2006, 17 (8),
989–1003. https://doi.org/10.1007/s10552-006-0049-z.
(14) De Pergola, G.; Silvestris, F. Obesity as a Major Risk Factor for Cancer
https://www.hindawi.com/journals/jobe/2013/291546/ (accessed Apr 14, 2020).
https://doi.org/10.1155/2013/291546.
(15) Markozannes, G.; Tzoulaki, I.; Karli, D.; Evangelou, E.; Ntzani, E.; Gunter, M. J.; Norat,
T.; Ioannidis, J. P.; Tsilidis, K. K. Diet, Body Size, Physical Activity and Risk of Prostate
Cancer: An Umbrella Review of the Evidence. Eur. J. Cancer 2016, 69, 61–69.
https://doi.org/10.1016/j.ejca.2016.09.026.
31
(16) Cao, Y.; Ma, J. Body Mass Index, Prostate Cancer-Specific Mortality, and Biochemical
Recurrence: A Systematic Review and Meta-Analysis. Cancer Prev Res (Phila) 2011, 4 (4),
486–501. https://doi.org/10.1158/1940-6207.CAPR-10-0229.
(17) Discacciati, A.; Orsini, N.; Wolk, A. Body Mass Index and Incidence of Localized and
Advanced Prostate Cancer—a Dose–Response Meta-Analysis of Prospective Studies.
Annals of Oncology 2012, 23 (7), 1665–1671. https://doi.org/10.1093/annonc/mdr603.
(18) Vidal, A. C.; Howard, L. E.; Moreira, D. M.; Castro-Santamaria, R.; Andriole, G. L.;
Freedland, S. J. Obesity Increases the Risk for High-Grade Prostate Cancer: Results from
the REDUCE Study. Cancer Epidemiol Biomarkers Prev 2014, 23 (12), 2936–2942.
https://doi.org/10.1158/1055-9965.EPI-14-0795.
(19) Zhang, X.; Zhou, G.; Sun, B.; Zhao, G.; Liu, D.; Sun, J.; Liu, C.; Guo, H. Impact of Obesity
upon Prostate Cancer-Associated Mortality: A Meta-Analysis of 17 Cohort Studies. Oncol
Lett 2015, 9 (3), 1307–1312. https://doi.org/10.3892/ol.2014.2841.
(20) Estève, D.; Roumiguié, M.; Manceau, C.; Milhas, D.; Muller, C. Periprostatic Adipose
Tissue: A Heavy Player in Prostate Cancer Progression. Current Opinion in Endocrine and
Metabolic Research 2020, 10, 29–35. https://doi.org/10.1016/j.coemr.2020.02.007.
(21) Herroon, M.; Rajagurubandara, E.; Hardaway, A. L.; Powell, K.; Turchick, A.; Feldmann,
D.; Podgorski, I. Bone Marrow Adipocytes Promote Tumor Growth in Bone via FABP4-
Dependent Mechanisms. Oncotarget 2013, 4 (11), 2108–2123.
https://doi.org/10.18632/oncotarget.1482.
(22) Watt, M. J.; Clark, A. K.; Selth, L. A.; Haynes, V. R.; Lister, N.; Rebello, R.; Porter, L. H.;
Niranjan, B.; Whitby, S. T.; Lo, J.; Huang, C.; Schittenhelm, R. B.; Anderson, K. E.; Furic,
L.; Wijayaratne, P. R.; Matzaris, M.; Montgomery, M. K.; Papargiris, M.; Norden, S.;
32
Febbraio, M.; Risbridger, G. P.; Frydenberg, M.; Nomura, D. K.; Taylor, R. A. Suppressing
Fatty Acid Uptake Has Therapeutic Effects in Preclinical Models of Prostate Cancer.
Science Translational Medicine 2019, 11 (478).
https://doi.org/10.1126/scitranslmed.aau5758.
(23) Yew Tan, C.; Virtue, S.; Murfitt, S.; Roberts, L. D.; Phua, Y. H.; Dale, M.; Griffin, J. L.;
Tinahones, F.; Scherer, P. E.; Vidal-Puig, A. Adipose Tissue Fatty Acid Chain Length and
Mono-Unsaturation Increases with Obesity and Insulin Resistance. Scientific Reports 2015,
5 (1), 1–11. https://doi.org/10.1038/srep18366.
(24) Santos, C. R.; Schulze, A. Lipid Metabolism in Cancer. The FEBS Journal 2012, 279 (15),
2610–2623. https://doi.org/10.1111/j.1742-4658.2012.08644.x.
(25) Rysman, E.; Brusselmans, K.; Scheys, K.; Timmermans, L.; Derua, R.; Munck, S.;
Veldhoven, P. P. V.; Waltregny, D.; Daniëls, V. W.; Machiels, J.; Vanderhoydonc, F.;
Smans, K.; Waelkens, E.; Verhoeven, G.; Swinnen, J. V. De Novo Lipogenesis Protects
Cancer Cells from Free Radicals and Chemotherapeutics by Promoting Membrane Lipid
Saturation. Cancer Res 2010, 70 (20), 8117–8126. https://doi.org/10.1158/0008-
5472.CAN-09-3871.
(26) Zadra, G.; Photopoulos, C.; Loda, M. The Fat Side of Prostate Cancer. Biochimica et
Biophysica Acta (BBA) - Molecular and Cell Biology of Lipids 2013, 1831 (10), 1518–1532.
https://doi.org/10.1016/j.bbalip.2013.03.010.
(27) Tamura, K.; Makino, A.; Hullin-Matsuda, F.; Kobayashi, T.; Furihata, M.; Chung, S.;
Ashida, S.; Miki, T.; Fujioka, T.; Shuin, T.; Nakamura, Y.; Nakagawa, H. Novel Lipogenic
Enzyme ELOVL7 Is Involved in Prostate Cancer Growth through Saturated Long-Chain
33
Fatty Acid Metabolism. Cancer Res 2009, 69 (20), 8133–8140.
https://doi.org/10.1158/0008-5472.CAN-09-0775.
(28) Muro, E.; Atilla-Gokcumen, G. E.; Eggert, U. S. Lipids in Cell Biology: How Can We
Understand Them Better? MBoC 2014, 25 (12), 1819–1823.
https://doi.org/10.1091/mbc.e13-09-0516.
(29) Lewis, T.; Nichols, P. D.; McMeekin, T. A. Evaluation of Extraction Methods for Recovery
of Fatty Acids from Lipid-Producing Microheterotrophs. Journal of Microbiological
Methods 2000, 43 (2), 107–116. https://doi.org/10.1016/S0167-7012(00)00217-7.
(30)
Solution_9_Automated_Accurate_and_reproducible_fatty_acid_derivatization_and_deter
mination.Pdf.
(31) PubChem. PubChem https://pubchem.ncbi.nlm.nih.gov/ (accessed Jul 21, 2020).
(32) Folch, J.; Lees, M.; Stanley, G. H. S. A Simple Method for the Isolation and Purification of
Total Lipides from Animal Tissues. J. Biol. Chem. 1957, 226 (1), 497–509.
(33) Bligh, E. G.; Dyer, W. J. A Rapid Method of Total Lipid Extraction and Purification. Can.
J. Biochem. Physiol. 1959, 37 (8), 911–917. https://doi.org/10.1139/o59-099.
(34) Lepage, G.; Roy, C. C. Improved Recovery of Fatty Acid through Direct Transesterification
without Prior Extraction or Purification. J. Lipid Res. 1984, 25 (12), 1391–1396.
(35) Berquin, I. M.; Min, Y.; Wu, R.; Wu, J.; Perry, D.; Cline, J. M.; Thomas, M. J.; Thornburg,
T.; Kulik, G.; Smith, A.; Edwards, I. J.; D’Agostino, R.; Zhang, H.; Wu, H.; Kang, J. X.;
Chen, Y. Q. Modulation of Prostate Cancer Genetic Risk by Omega-3 and Omega-6 Fatty
Acids. J Clin Invest 2007, 117 (7), 1866–1875. https://doi.org/10.1172/JCI31494.
34
(36) Otera, Junzo. Transesterification. Chem. Rev. 1993, 93 (4), 1449–1470.
https://doi.org/10.1021/cr00020a004.
(37) Koberg, M.; Gedanken, A. Chapter 9 - Using Microwave Radiation and SrO as a Catalyst
for the Complete Conversion of Oils, Cooked Oils, and Microalgae to Biodiesel. In New
and Future Developments in Catalysis; Suib, S. L., Ed.; Elsevier: Amsterdam, 2013; pp
209–227. https://doi.org/10.1016/B978-0-444-53878-9.00010-2.
(38) Löfgren, L.; Forsberg, G.-B.; Ståhlman, M. The BUME Method: A New Rapid and Simple
Chloroform-Free Method for Total Lipid Extraction of Animal Tissue. Scientific Reports
2016, 6 (1), 27688. https://doi.org/10.1038/srep27688.
(39) What’s New in Prostate Cancer Research? https://www.cancer.org/cancer/prostate-
cancer/about/new-research.html (accessed Apr 14, 2020).
(40) Kyrgiou, M.; Kalliala, I.; Markozannes, G.; Gunter, M. J.; Paraskevaidis, E.; Gabra, H.;
Martin-Hirsch, P.; Tsilidis, K. K. Adiposity and Cancer at Major Anatomical Sites:
Umbrella Review of the Literature. BMJ 2017, 356. https://doi.org/10.1136/bmj.j477.
(41) Sung, M.-T.; Eble, J. N.; Cheng, L. Invasion of Fat Justifies Assignment of Stage PT3a in
Prostatic Adenocarcinoma. Pathology 2006, 38 (4), 309–311.
https://doi.org/10.1080/00313020600820914.
(42) Baltussen, E.; Sandra, P.; David, F.; Cramers, C. Stir Bar Sorptive Extraction (SBSE), a
Novel Extraction Technique for Aqueous Samples: Theory and Principles. Journal of
Microcolumn Separations 1999, 11 (10), 737–747. https://doi.org/10.1002/(SICI)1520-
667X(1999)11:10<737::AID-MCS7>3.0.CO;2-4.
35
(43) Ouyang, G. 6 - Calibration. In Handbook of Solid Phase Microextraction; Pawliszyn, J.,
Ed.; Elsevier: Oxford, 2012; pp 167–199. https://doi.org/10.1016/B978-0-12-416017-
0.00006-1.
(44) Food Industry FAME Mix / Reference Standards / Chromatography Products at Restek.com
https://www.restek.com/catalog/view/6098 (accessed Aug 12, 2020).
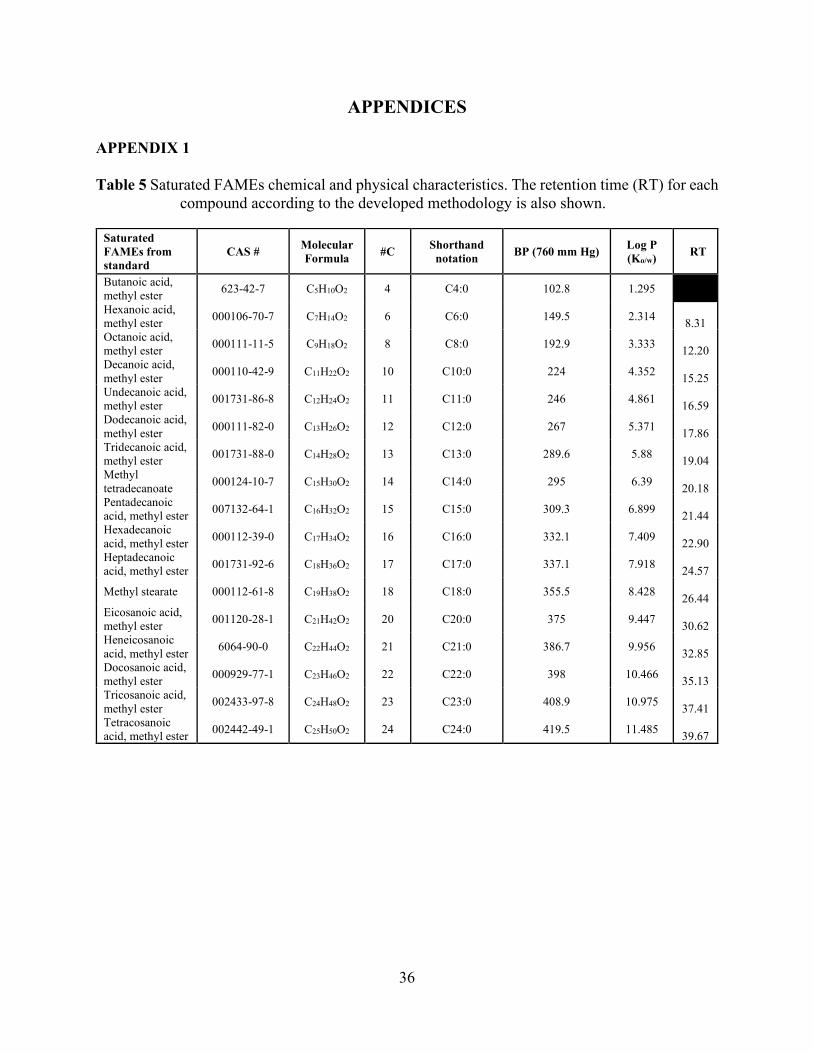
36
APPENDICES
APPENDIX 1
Table 5 Saturated FAMEs chemical and physical characteristics. The retention time (RT) for each
compound according to the developed methodology is also shown.
Saturated
FAMEs from
standard
CAS # Molecular
Formula #C
Shorthand
notation BP (760 mm Hg)
Log P
(Ko/w) RT
Butanoic acid,
methyl ester 623-42-7 C5H10O2 4 C4:0 102.8 1.295
Hexanoic acid,
methyl ester 000106-70-7 C7H14O2 6 C6:0 149.5 2.314
8.31
Octanoic acid,
methyl ester 000111-11-5 C9H18O2 8 C8:0 192.9 3.333
12.20
Decanoic acid,
methyl ester 000110-42-9 C11H22O2 10 C10:0 224 4.352
15.25
Undecanoic acid,
methyl ester 001731-86-8 C12H24O2 11 C11:0 246 4.861
16.59
Dodecanoic acid,
methyl ester 000111-82-0 C13H26O2 12 C12:0 267 5.371
17.86
Tridecanoic acid,
methyl ester 001731-88-0 C14H28O2 13 C13:0 289.6 5.88
19.04
Methyl
tetradecanoate 000124-10-7 C15H30O2 14 C14:0 295 6.39
20.18
Pentadecanoic
acid, methyl ester 007132-64-1 C16H32O2 15 C15:0 309.3 6.899
21.44
Hexadecanoic
acid, methyl ester 000112-39-0 C17H34O2 16 C16:0 332.1 7.409
22.90
Heptadecanoic
acid, methyl ester 001731-92-6 C18H36O2 17 C17:0 337.1 7.918
24.57
Methyl stearate 000112-61-8 C19H38O2 18 C18:0 355.5 8.428
26.44
Eicosanoic acid,
methyl ester 001120-28-1 C21H42O2 20 C20:0 375 9.447
30.62
Heneicosanoic
acid, methyl ester 6064-90-0 C22H44O2 21 C21:0 386.7 9.956
32.85
Docosanoic acid,
methyl ester 000929-77-1 C23H46O2 22 C22:0 398 10.466
35.13
Tricosanoic acid,
methyl ester 002433-97-8 C24H48O2 23 C23:0 408.9 10.975
37.41
Tetracosanoic
acid, methyl ester 002442-49-1 C25H50O2 24 C24:0 419.5 11.485
39.67
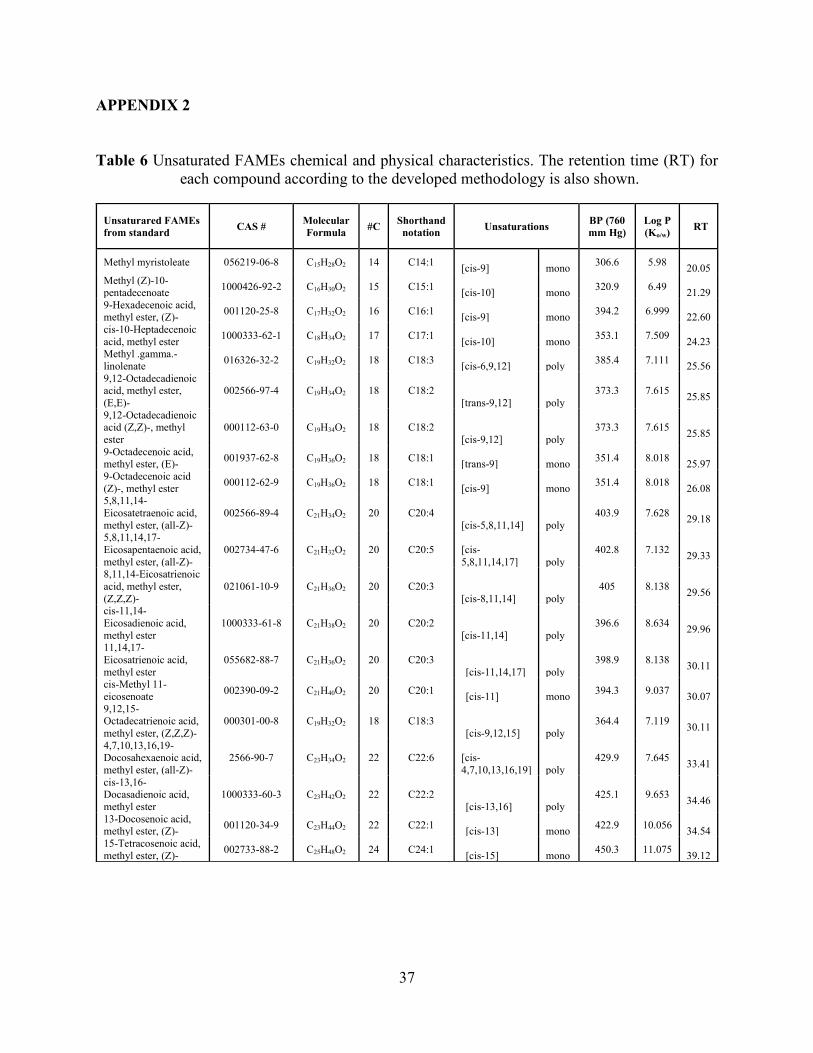
37
APPENDIX 2
Table 6 Unsaturated FAMEs chemical and physical characteristics. The retention time (RT) for
each compound according to the developed methodology is also shown.
Unsaturared FAMEs
from standard CAS #
Molecular
Formula #C
Shorthand
notation Unsaturations
BP (760
mm Hg)
Log P
(Ko/w) RT
Methyl myristoleate 056219-06-8 C15H28O2 14 C14:1 [cis-9] mono
306.6 5.98
20.05
Methyl (Z)-10-pentadecenoate
1000426-92-2 C16H30O2 15 C15:1 [cis-10] mono
320.9 6.49
21.29
9-Hexadecenoic acid, methyl ester, (Z)-
001120-25-8 C17H32O2 16 C16:1 [cis-9] mono
394.2 6.999
22.60
cis-10-Heptadecenoic
acid, methyl ester 1000333-62-1 C18H34O2 17 C17:1
[cis-10] mono 353.1 7.509
24.23 Methyl .gamma.-
linolenate 016326-32-2 C19H32O2 18 C18:3
[cis-6,9,12] poly 385.4 7.111
25.56
9,12-Octadecadienoic acid, methyl ester,
(E,E)-
002566-97-4 C19H34O2 18 C18:2
[trans-9,12] poly
373.3 7.615
25.85
9,12-Octadecadienoic acid (Z,Z)-, methyl
ester
000112-63-0 C19H34O2 18 C18:2
[cis-9,12] poly
373.3 7.615
25.85
9-Octadecenoic acid, methyl ester, (E)-
001937-62-8 C19H36O2 18 C18:1 [trans-9] mono
351.4 8.018
25.97
9-Octadecenoic acid
(Z)-, methyl ester 000112-62-9 C19H36O2 18 C18:1
[cis-9] mono 351.4 8.018
26.08 5,8,11,14-
Eicosatetraenoic acid,
methyl ester, (all-Z)-
002566-89-4 C21H34O2 20 C20:4
[cis-5,8,11,14] poly
403.9 7.628
29.18
5,8,11,14,17-
Eicosapentaenoic acid,
methyl ester, (all-Z)-
002734-47-6 C21H32O2 20 C20:5 [cis-
5,8,11,14,17] poly
402.8 7.132
29.33
8,11,14-Eicosatrienoic
acid, methyl ester,
(Z,Z,Z)-
021061-10-9 C21H36O2 20 C20:3
[cis-8,11,14] poly
405 8.138
29.56
cis-11,14-
Eicosadienoic acid,
methyl ester
1000333-61-8 C21H38O2 20 C20:2
[cis-11,14] poly
396.6 8.634
29.96
11,14,17-
Eicosatrienoic acid,
methyl ester
055682-88-7 C21H36O2 20 C20:3
[cis-11,14,17] poly
398.9 8.138
30.11
cis-Methyl 11-
eicosenoate 002390-09-2 C21H40O2 20 C20:1
[cis-11] mono 394.3 9.037
30.07
9,12,15-Octadecatrienoic acid,
methyl ester, (Z,Z,Z)-
000301-00-8 C19H32O2 18 C18:3
[cis-9,12,15] poly
364.4 7.119
30.11
4,7,10,13,16,19-Docosahexaenoic acid,
methyl ester, (all-Z)-
2566-90-7 C23H34O2 22 C22:6 [cis-
4,7,10,13,16,19] poly
429.9 7.645
33.41
cis-13,16-Docasadienoic acid,
methyl ester
1000333-60-3 C23H42O2 22 C22:2
[cis-13,16] poly
425.1 9.653
34.46
13-Docosenoic acid, methyl ester, (Z)-
001120-34-9 C23H44O2 22 C22:1 [cis-13] mono
422.9 10.056
34.54
15-Tetracosenoic acid,
methyl ester, (Z)- 002733-88-2 C25H48O2 24 C24:1
[cis-15] mono 450.3 11.075
39.12
38
APPENDIX 3
Protocol for Data Analysis of Transesterification Experiments
1. Data Extraction from the Chromatogram.
i. Instrument Analysis
ii. File<Load the File
iii. Integrate
iv. Spectrum<Percent Report
v. Chromatography<Library Search Report
2. Filter the Extracted Data.
i. Copy the data from the GC-MS computer to the Excel.
ii. Organize the data by peak number, retention time, area, library, CAS, and quality.
iii. Filter Mirex and methyl esters from data.
iv. Deal with the replicated compounds
⚫ Find out the compound with the highest quality.
⚫ Delete the compound(s) with quality <10% of that of the highest quality peak.
⚫ Consider the retention time. If the difference between the retention times of peaks
identified with the same CAS# is more than 0.5s, delete the one with lower quality
and keep the one with higher quality (when the qualities are the same, keep the one
with higher amount of area).
⚫ Mark in the compound list of the sample, the compound(s) which can be found in
empty TDT and control samples. Then delete the compound in the sample list, if it
has the same area, as the compound from empty TDT or control.
v. Look over the quality and the retention time of every methyl ester, then delete those which
have the quality <50%.
vi. Count the number of methyl esters of every sample.
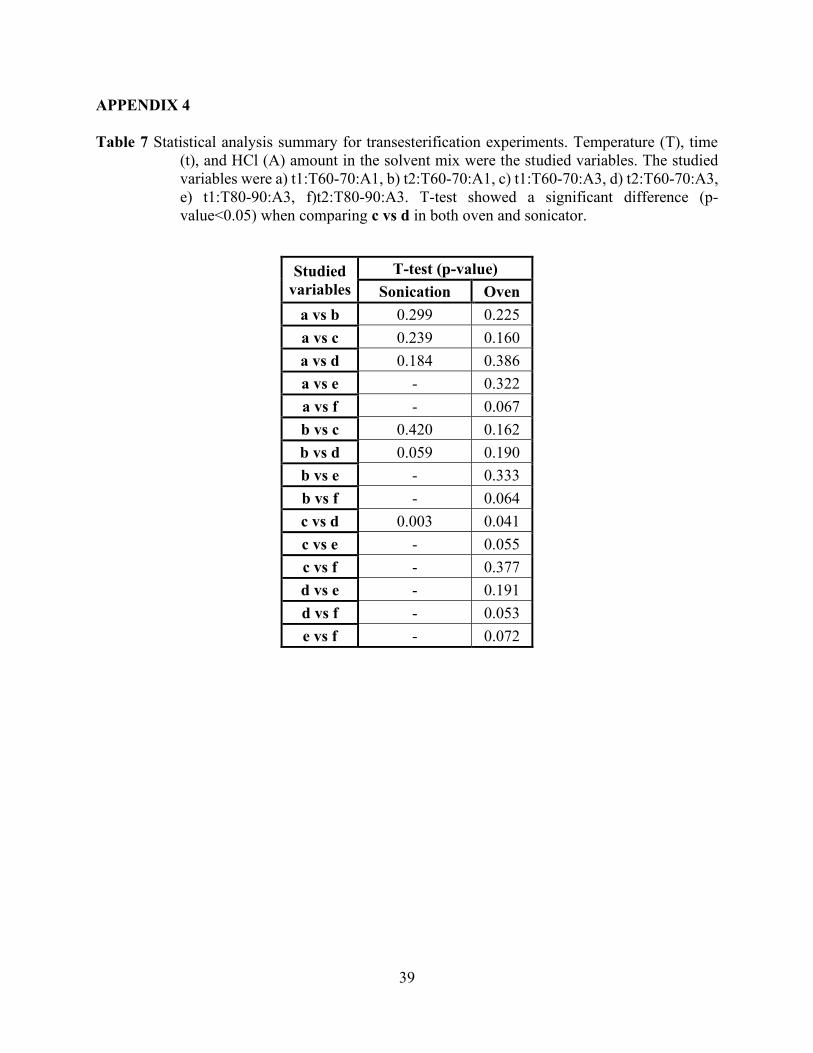
39
APPENDIX 4
Table 7 Statistical analysis summary for transesterification experiments. Temperature (T), time
(t), and HCl (A) amount in the solvent mix were the studied variables. The studied
variables were a) t1:T60-70:A1, b) t2:T60-70:A1, c) t1:T60-70:A3, d) t2:T60-70:A3,
e) t1:T80-90:A3, f)t2:T80-90:A3. T-test showed a significant difference (p-
value<0.05) when comparing c vs d in both oven and sonicator.
Studied
variables
T-test (p-value)
Sonication Oven
a vs b 0.299 0.225
a vs c 0.239 0.160
a vs d 0.184 0.386
a vs e - 0.322
a vs f - 0.067
b vs c 0.420 0.162
b vs d 0.059 0.190
b vs e - 0.333
b vs f - 0.064
c vs d 0.003 0.041
c vs e - 0.055
c vs f - 0.377
d vs e - 0.191
d vs f - 0.053
e vs f - 0.072
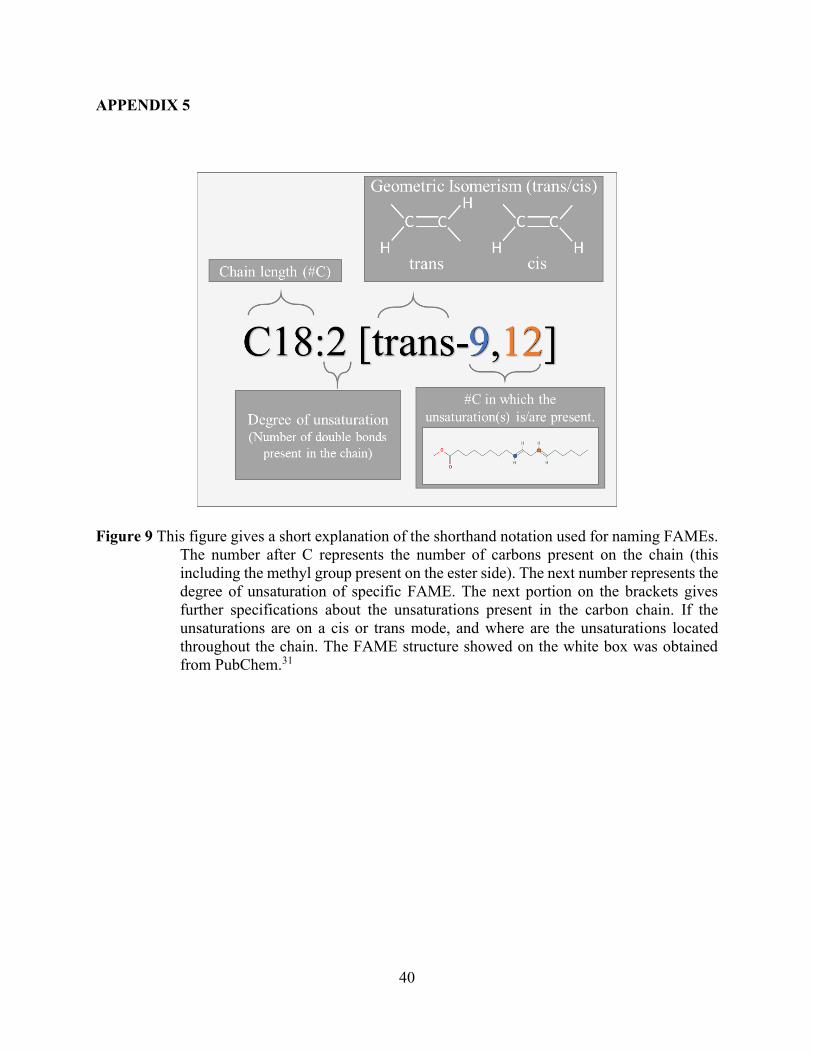
40
APPENDIX 5
Figure 9 This figure gives a short explanation of the shorthand notation used for naming FAMEs.
The number after C represents the number of carbons present on the chain (this
including the methyl group present on the ester side). The next number represents the
degree of unsaturation of specific FAME. The next portion on the brackets gives
further specifications about the unsaturations present in the carbon chain. If the
unsaturations are on a cis or trans mode, and where are the unsaturations located
throughout the chain. The FAME structure showed on the white box was obtained
from PubChem.31
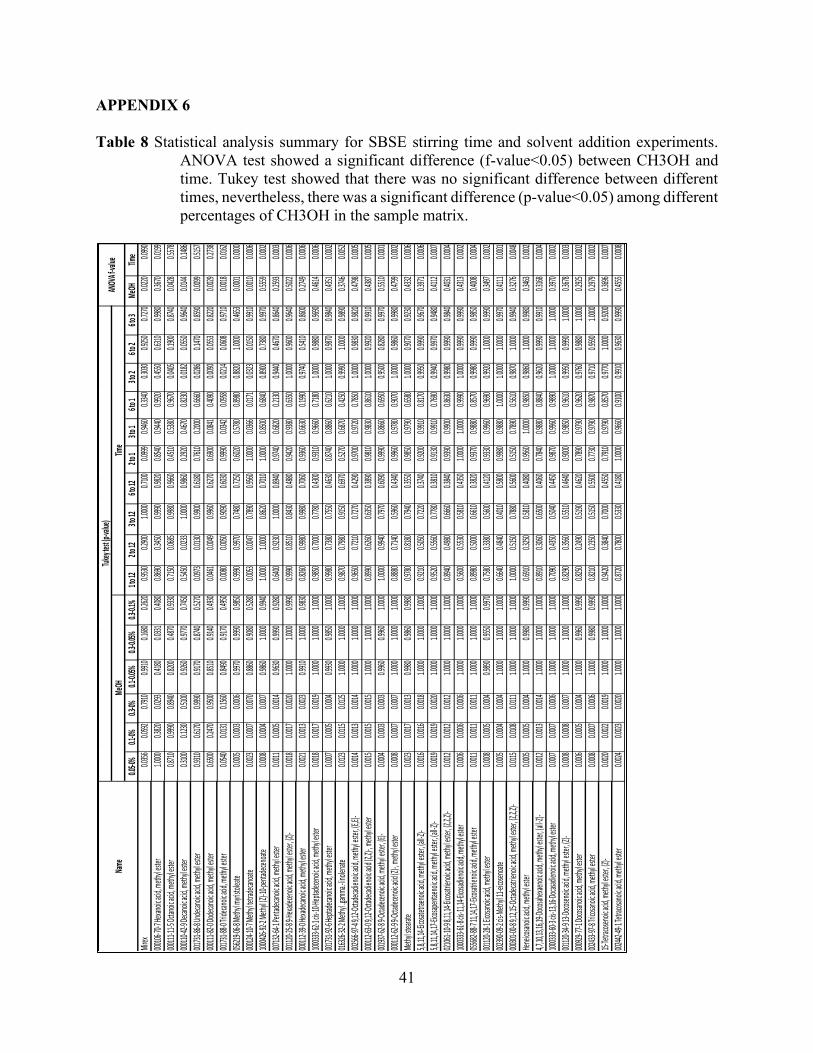
41
APPENDIX 6
Table 8 Statistical analysis summary for SBSE stirring time and solvent addition experiments.
ANOVA test showed a significant difference (f-value<0.05) between CH3OH and
time. Tukey test showed that there was no significant difference between different
times, nevertheless, there was a significant difference (p-value<0.05) among different
percentages of CH3OH in the sample matrix.
0.05-0
%0.1
-0%0.3
-0%0.1
-0.05
%0.3
-0.05
%0.3
-0.1%
1 to 1
22 t
o 12
3 to 1
26 t
o 12
2 to 1
3 to 1
6 to 1
3 to 2
6 to 2
6 to 3
MeOH
Time
Mirex
0.035
60.0
592
0.791
00.9
910
0.168
00.2
620
0.953
00.2
900
1.000
00.7
100
0.099
90.9
460
0.334
00.3
030
0.925
00.7
270
0.022
00.0
990
0001
06-70
-7 He
xano
ic acid
, meth
yl este
r1.0
000
0.382
00.0
293
0.418
00.0
331
0.408
00.8
690
0.345
00.9
990
0.982
00.8
540
0.944
00.9
920
0.455
00.6
310
0.998
00.3
670
0.019
9
0001
11-11
-5 Oc
tanoic
acid,
meth
yl este
r0.8
710
0.999
00.8
940
0.820
00.4
870
0.933
00.7
150
0.068
50.9
980
0.966
00.4
510
0.538
00.9
670
0.040
50.1
900
0.874
00.0
428
0.557
8
0001
10-42
-9 De
canoic
acid,
meth
yl este
r0.3
100
0.123
00.5
100
0.926
00.9
770
0.745
00.5
450
0.023
31.0
000
0.986
00.2
920
0.467
00.8
230
0.018
20.0
550
0.964
00.0
144
0.148
6
0017
31-86
-8 Un
decan
oic ac
id, m
ethyl e
ster
0.931
00.6
170
0.999
00.9
170
0.874
00.5
270
0.097
30.0
130
0.990
00.6
180
0.761
00.2
000
0.666
00.0
286
0.147
00.8
590
0.009
90.5
157
0001
11-82
-0 Do
decan
oic ac
id, m
ethyl e
ster
0.650
00.2
470
0.950
00.8
510
0.914
00.4
930
0.046
10.0
049
0.996
00.6
270
0.690
00.0
841
0.409
00.0
090
0.055
30.8
220
0.002
90.2
738
0017
31-88
-0 Tri
decan
oic ac
id, m
ethyl e
ster
0.054
00.0
131
0.156
00.8
490
0.917
00.4
950
0.008
00.0
050
0.909
00.6
030
0.999
00.0
342
0.095
80.0
214
0.060
80.9
710
0.001
80.0
162
0562
19-06
-8 Me
thyl m
yristo
leate
0.000
50.0
003
0.000
60.9
970
0.999
00.9
850
0.999
00.9
970
0.748
00.7
250
0.602
00.5
780
0.898
00.8
820
1.000
00.4
653
0.000
10.0
000
0001
24-10
-7 Me
thyl te
trade
canoa
te0.0
023
0.000
70.0
070
0.886
00.9
080
0.528
00.0
053
0.004
70.7
890
0.956
01.0
000
0.036
60.0
171
0.032
30.0
150
0.991
00.0
010
0.000
6
1000
426-9
2-2 M
ethyl (
Z)-10
-penta
decen
oate
0.000
80.0
004
0.000
70.9
860
1.000
00.9
940
1.000
01.0
000
0.862
00.7
010
1.000
00.8
500
0.684
00.8
900
0.738
00.9
970
0.555
90.0
002
0071
32-64
-1 Pe
ntade
canoic
acid,
meth
yl este
r0.0
011
0.000
50.0
014
0.963
00.9
990
0.928
00.6
400
0.923
01.0
000
0.894
00.9
740
0.682
00.2
130
0.944
00.4
670
0.864
00.2
593
0.000
3
0011
20-25
-8 9-H
exad
eceno
ic acid
, meth
yl este
r, (Z)-
0.001
80.0
017
0.002
01.0
000
1.000
00.9
990
0.999
00.8
510
0.843
00.4
880
0.942
00.9
380
0.635
01.0
000
0.960
00.9
640
0.502
20.0
006
0001
12-39
-0 He
xade
canoic
acid,
meth
yl este
r0.0
021
0.001
30.0
023
0.991
01.0
000
0.983
00.8
260
0.998
00.9
980
0.706
00.9
360
0.663
00.1
990
0.974
00.5
410
0.860
00.2
749
0.000
6
1000
333-6
2-1 cis
-10-He
ptade
cenoic
acid,
meth
yl este
r0.0
018
0.001
70.0
019
1.000
01.0
000
1.000
00.9
850
0.700
00.7
780
0.430
00.9
310
0.966
00.7
180
1.000
00.9
880
0.969
00.4
614
0.000
6
0017
31-92
-6 He
ptade
canoic
acid,
meth
yl este
r0.0
007
0.000
50.0
004
0.993
00.9
850
1.000
00.9
980
0.738
00.7
550
0.463
00.8
740
0.886
00.6
210
1.000
00.9
870
0.984
00.4
351
0.000
2
0163
26-32
-2 Me
thyl .g
amma
.-lino
lenate
0.012
30.0
115
0.012
51.0
000
1.000
01.0
000
0.987
00.7
980
0.915
00.6
970
0.527
00.6
870
0.425
00.9
990
1.000
00.9
890
0.374
60.0
052
0025
66-97
-4 9,1
2-Octa
decad
ienoic
acid,
meth
yl este
r, (E,E
)-0.0
014
0.001
30.0
014
1.000
01.0
000
1.000
00.9
650
0.721
00.7
270
0.429
00.9
700
0.972
00.7
850
1.000
00.9
830
0.982
00.4
798
0.000
5
0001
12-63
-0 9,1
2-Octa
decad
ienoic
acid
(Z,Z)-
, meth
yl este
r0.0
015
0.001
50.0
015
1.000
01.0
000
1.000
00.8
990
0.626
00.6
350
0.389
00.9
810
0.983
00.8
610
1.000
00.9
920
0.991
00.4
387
0.000
5
0019
37-62
-8 9-O
ctade
cenoic
acid,
meth
yl este
r, (E)-
0.000
40.0
003
0.000
30.9
960
0.996
01.0
000
1.000
00.9
940
0.797
00.6
090
0.999
00.8
660
0.695
00.9
500
0.828
00.9
970
0.551
00.0
001
0001
12-62
-9 9-O
ctade
cenoic
acid
(Z)-, m
ethyl e
ster
0.000
80.0
007
0.000
71.0
000
1.000
01.0
000
0.888
00.7
140
0.596
00.4
340
0.996
00.9
780
0.907
01.0
000
0.986
00.9
980
0.479
90.0
002
Methy
l stea
rate
0.002
30.0
017
0.001
30.9
980
0.986
00.9
980
0.978
00.8
180
0.794
00.3
550
0.985
00.9
790
0.658
01.0
000
0.907
00.9
230
0.433
20.0
006
5,8,11
,14-Ei
cosate
traen
oic ac
id, m
ethyl e
ster, (
all-Z)
-0.0
016
0.001
60.0
018
1.000
01.0
000
1.000
00.9
210
0.505
00.7
220
0.374
00.9
200
0.991
00.8
170
0.995
00.9
990
0.967
00.3
971
0.000
6
5,8,11
,14,17
-Eicos
apen
taeno
ic acid
, meth
yl este
r, (all
-Z)-
0.001
90.0
019
0.002
01.0
000
1.000
01.0
000
0.952
00.5
560
0.778
00.3
810
0.913
00.9
910
0.769
00.9
940
0.997
00.9
480
0.411
20.0
007
0210
61-10
-9 8,1
1,14-E
icosat
rieno
ic acid
, meth
yl este
r, (Z,Z
,Z)-
0.001
20.0
012
0.001
21.0
000
1.000
01.0
000
0.894
00.4
980
0.666
00.3
840
0.939
00.9
900
0.863
00.9
980
0.999
00.9
840
0.403
10.0
004
1000
333-6
1-8 cis
-11,14
-Eicos
adien
oic ac
id, m
ethyl e
ster
0.000
60.0
006
0.000
61.0
000
1.000
01.0
000
0.560
00.5
530
0.581
00.4
350
1.000
01.0
000
0.999
01.0
000
0.999
00.9
990
0.431
30.0
002
0556
82-88
-7 11
,14,17
-Eicos
atrien
oic ac
id, m
ethyl e
ster
0.001
10.0
011
0.001
11.0
000
1.000
01.0
000
0.898
00.5
000
0.661
00.3
820
0.937
00.9
880
0.857
00.9
980
0.999
00.9
850
0.400
80.0
004
0011
20-28
-1 Eic
osano
ic acid
, meth
yl este
r0.0
008
0.000
50.0
004
0.989
00.9
550
0.997
00.7
580
0.338
00.5
600
0.412
00.9
330
0.996
00.9
690
0.992
01.0
000
0.999
00.3
497
0.000
2
0023
90-09
-2 cis
-Meth
yl 11-e
icosen
oate
0.000
50.0
004
0.000
41.0
000
1.000
01.0
000
0.664
00.4
840
0.401
00.5
800
0.998
00.9
880
1.000
01.0
000
1.000
00.9
970
0.411
10.0
001
0003
01-00
-8 9,1
2,15-O
ctade
catrie
noic a
cid, m
ethyl e
ster, (
Z,Z,Z)
-0.0
115
0.010
80.0
111
1.000
01.0
000
1.000
01.0
000
0.515
00.7
880
0.560
00.5
150
0.789
00.5
610
0.987
01.0
000
0.994
00.3
276
0.004
8
Hene
icosan
oic ac
id, m
ethyl e
ster
0.000
50.0
005
0.000
41.0
000
0.998
00.9
990
0.691
00.3
250
0.581
00.4
080
0.956
01.0
000
0.985
00.9
860
1.000
00.9
980
0.346
30.0
002
4,7,10
,13,16
,19-D
ocosah
exae
noic a
cid, m
ethyl e
ster, (
all-Z)
-0.0
012
0.001
30.0
014
1.000
01.0
000
1.000
00.8
910
0.306
00.6
500
0.406
00.7
840
0.988
00.8
840
0.962
00.9
990
0.991
00.3
168
0.000
4
1000
333-6
0-3 cis
-13,16
-Docas
adien
oic ac
id, m
ethyl e
ster
0.000
70.0
007
0.000
61.0
000
1.000
01.0
000
0.709
00.4
350
0.504
00.4
450
0.987
00.9
960
0.989
01.0
000
1.000
01.0
000
0.397
00.0
002
0011
20-34
-9 13
-Doco
senoic
acid,
meth
yl este
r, (Z)-
0.000
80.0
008
0.000
71.0
000
1.000
01.0
000
0.829
00.3
560
0.551
00.4
640
0.900
00.9
850
0.961
00.9
950
0.999
01.0
000
0.367
80.0
003
0009
29-77
-1 Do
cosan
oic ac
id, m
ethyl e
ster
0.000
60.0
005
0.000
41.0
000
0.996
00.9
990
0.825
00.2
490
0.519
00.4
620
0.789
00.9
790
0.962
00.9
760
0.988
01.0
000
0.292
50.0
002
0024
33-97
-8 Tri
cosan
oic ac
id, m
ethyl e
ster
0.000
80.0
007
0.000
61.0
000
0.998
00.9
990
0.821
00.2
350
0.515
00.5
500
0.773
00.9
790
0.987
00.9
710
0.959
01.0
000
0.297
90.0
002
15-Te
tracos
enoic
acid,
meth
yl este
r, (Z)-
0.002
00.0
022
0.001
91.0
000
1.000
01.0
000
0.942
00.3
840
0.700
00.4
550
0.791
00.9
790
0.857
00.9
770
1.000
00.9
200
0.369
60.0
007
0024
42-49
-1 Te
tracos
anoic
acid,
meth
yl este
r0.0
024
0.002
30.0
020
1.000
01.0
000
1.000
00.8
720
0.780
00.5
330
0.418
01.0
000
0.966
00.9
100
0.991
00.9
630
0.999
00.4
555
0.000
8
Tuke
y test
(p-va
lue)
ANOV
A f-va
lueMe
OHTim
eNa
me
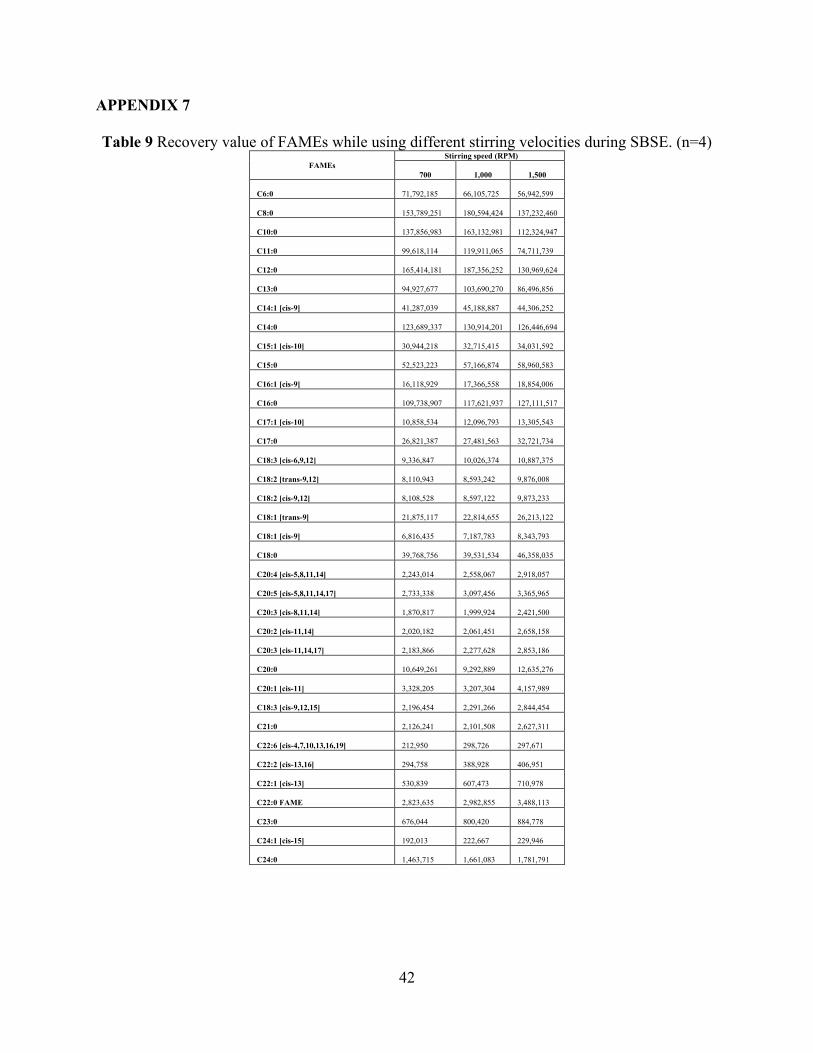
42
APPENDIX 7
Table 9 Recovery value of FAMEs while using different stirring velocities during SBSE. (n=4)
FAMEs
Stirring speed (RPM)
700
1,000
1,500
C6:0
71,792,185
66,105,725
56,942,599
C8:0
153,789,251
180,594,424
137,232,460
C10:0
137,856,983
163,132,981
112,324,947
C11:0
99,618,114
119,911,065
74,711,739
C12:0
165,414,181
187,356,252
130,969,624
C13:0
94,927,677
103,690,270
86,496,856
C14:1 [cis-9]
41,287,039
45,188,887
44,306,252
C14:0
123,689,337
130,914,201
126,446,694
C15:1 [cis-10]
30,944,218
32,715,415
34,031,592
C15:0
52,523,223
57,166,874
58,960,583
C16:1 [cis-9]
16,118,929
17,366,558
18,854,006
C16:0
109,738,907
117,621,937
127,111,517
C17:1 [cis-10]
10,858,534
12,096,793
13,305,543
C17:0
26,821,387
27,481,563
32,721,734
C18:3 [cis-6,9,12]
9,336,847
10,026,374
10,887,375
C18:2 [trans-9,12]
8,110,943
8,593,242
9,876,008
C18:2 [cis-9,12]
8,108,528
8,597,122
9,873,233
C18:1 [trans-9]
21,875,117
22,814,655
26,213,122
C18:1 [cis-9]
6,816,435
7,187,783
8,343,793
C18:0
39,768,756
39,531,534
46,358,035
C20:4 [cis-5,8,11,14]
2,243,014
2,558,067
2,918,057
C20:5 [cis-5,8,11,14,17]
2,733,338
3,097,456
3,365,965
C20:3 [cis-8,11,14]
1,870,817
1,999,924
2,421,500
C20:2 [cis-11,14]
2,020,182
2,061,451
2,658,158
C20:3 [cis-11,14,17]
2,183,866
2,277,628
2,853,186
C20:0
10,649,261
9,292,889
12,635,276
C20:1 [cis-11]
3,328,205
3,207,304
4,157,989
C18:3 [cis-9,12,15]
2,196,454
2,291,266
2,844,454
C21:0
2,126,241
2,101,508
2,627,311
C22:6 [cis-4,7,10,13,16,19]
212,950
298,726
297,671
C22:2 [cis-13,16]
294,758
388,928
406,951
C22:1 [cis-13]
530,839
607,473
710,978
C22:0 FAME
2,823,635
2,982,855
3,488,113
C23:0
676,044
800,420
884,778
C24:1 [cis-15]
192,013
222,667
229,946
C24:0
1,463,715
1,661,083
1,781,791
43
VITA
Angela Marisol Encerrado Manríquez was born in Hidalgo del Parral, Chihuahua, México.
She grew up in Ciudad Juarez, Chihuahua and at age 18 she emigrated to the neighboring city of
El Paso, Texas, to pursue her dream of becoming an environmental researcher. She started
volunteering research laboratories in the Chemistry and Biochemistry department at UTEP during
her second week of college. She attended the University of Texas at El Paso (UTEP) starting in
Fall 2013 to pursue a bachelor’s degree in environmental science and chemistry and graduated in
Spring 2018. During most of this time, Angela worked under the mentoring of Dr. Wen Yee Lee
in her environmental analytical chemistry laboratory, developing various project in the area of
analytical chemistry and participating three years as an intern in the annual program MERITUS
(Mentor Experiences in Research, Inquiry, and Creativity for Undergraduate Students), as well as
in the Diana Natalicio Environmental internship. Her active role in research made her recipient of
the Undergraduate Academic & Research Excellence in Environmental Science Award in Spring
2018.
In Fall 2018 Angela continued her studies at UTEP to pursue her Master of Science in
Chemistry. Here she continued to explore the area of method development while collaborating on
various projects across the Chemistry department. While pursuing her graduate degree she worked
as a Teaching Assistant for General and Organic Chemistry laboratories in the Department of
Chemistry. After receiving her Master’s degree during the COVID pandemic, she will be attending
the University of California at Davis to continue her graduate education in the Agricultural and
Environmental Chemistry Doctoral program.
Contact Information: [email protected]
This thesis was typed by Angela Marisol Encerrado Manríquez.