Embed Size (px)
Citation preview
METHOD DEVELOPMENT AND VALIDATION FOR THE
SIMULTANEOUS ESTIMATION OF CEFUROXIME AXETIL AND
LINEZOLID IN PHARMACEUTICAL DOSAGE
FORM BY RP-HPLC AND HPTLC METHOD
Dissertation work submitted to The Tamilnadu Dr. M.G.R Medical University,Chennai in partial fulfilment for the award of degree of
MASTER OF PHARMACY
IN
Pharmaceutical Analysis
Submitted by
PRASANTH A R
Reg. No: 261530656
Under the guidance of
Institutional Guide: Industrial Guide:
Dr.W.D.SAM SOLOMON,M. Pharm Ph.D., Dr.TENSON ANTONY
Professor & Head Quality Mnager,Laboratory
Department of Pharmaceutical Analysis, Care Kealam,koratty,
RVS College of Pharmaceutica l Sciences, Thrissur,Kerala-680309
Sulur, Coimbatore – 641 402
May – 2017
DEPARTMENT OF PHARMACEUTICAL ANALYSIS,
RVS COLLEGE OF PHARMACEUTICAL SCIENCES,
SULUR, COIMBATORE – 641402, TAMIL NADU

Cert ificate
This is to certify that the dissertation work entitled “Method Development
and validation for the simultaneous estimation of Cefuroxime axetil and Linezolid
in pharmaceutical dosage form by RP-HPLC and HPTLC” is a bonafide work of
Mr.PRASANTH A R carried out in Care keralam,koratty,Thrisur,kerala under my
guidance and supervision of Dr.Tenson antony,Quality manager,for the partial
fulfillment of the award of degree of Master of Pharmacy in Pharmaceutical
Analysis, RVS college of Pharmaceutical Sciences, Sulur, Coimbatore, affiliated to
The Tamilnadu Dr. M.G.R Medical University, Chennai.
Dr.W.D.SAM SOLOMON,M.Pharm,PhD
Date:
Place: Sulur
Cert ificate
This is to certify that the dissertation work entitled “Method Development
and validation for the simultaneous estimation of Cefuroxime axetil and Linezolid
in pharmaceutical dosage form by RP-HPLC and HPTLC” is a bonafide work of
Mr.PRASANTH A R carried out in Care keralam,koratty,Thrisur,kerala under the
supervision of Dr.Tenson antony,Quality manager, and the guidance of
Dr.W.D.Sam Solomon in the department of Pharmaceutical Analysis, for the
partial fulfillment of the award of degree of Master of Pharmacy in Pharmaceutical
Analysis, RVS college of Pharmaceutical Sciences, Sulur, Coimbatore, affiliated to
The Tamilnadu Dr. M.G.R Medical University, Chennai.
Dr.R. VENKATANARAYANAN,M.Pharm,Ph.D
Date:
Place:Sulur
Cert ificate
This is to certify that the dissertation entitled “Method Development and
validation for the simultaneous estimation of Cefuroxime axetil and Linezolid in
pharmaceutical dosage form by RP-HPLC and HPTLC” is a bonafide work done
by Mr.PRASANTH A R ,RVS College of Pharmaceutical Sciences,
Sulur,Coimbatore, for the partial fulfillment of the University rules and regulations
for the award of Master of Pharmacy in Pharmaceutical Analysis under my
guidance and supervision during the academic year 2016-17
Dr.W.D.SAM SOLOMON,M.Pharm,PhD
Dr.R. VENKATANARAYANAN,M.Pharm,Ph.D
Evaluat ion Cert ificate
Dissertation title : “Method Development and validation for the simultaneous
estimation of Cefuroxime axetil and Linezolid in pharmaceutical dosage form by
RP-HPLC and HPTLC”
Name of the Candidate : Mr.PRASANTH A R
Course of study : Master of Pharmacy in Pharmaceutical Analysis
Institution Name : RVS college of Pharmaceutical Sciences, Sulur,
Coimbatore
INTERNAL EXAMINER EXTERNAL EXAMINER
Date: Date:
Place: Sulur Place: Sulur

ACKNOWLEDGEMENT
The secret of success is undaunted ardour, motivation, dedication,
confidence on self and above all the blessings of God. I bow in reverence to the
Almighty for bestowing upon me all this kindness that has helped me throughout
the journey of my life. Success is an outcome of collaborated efforts aimed at
achieving different goals. I hereby take this opportunity to acknowledge all those
who have helped me in the completion of this dissertation work.
work.
First and foremost I thank to my God for my successful completion of this
I sincerely acknowledge my deep sense of gratitude and hearty thanks
to Dr. W.D. Sam Solomon, M.Pharm., PhD., Professor and HOD, Department of
Pharmaceutical Analysis, RVS College of Pharmaceutical Sciences, Sulur,
Coimbatore, for his valuable guidance encouragement and continued support
throughout the course of this work.
I express my sincere thanks to Dr. Tenson Antony Quality manager,Care
Keralam for providing the facilities to carry out my project work in this esteemed
organization.
I am highly indebted to Dr. R. Venkatanarayanan, M.Pharm.,Ph.D.,
Principal, RVS College of Pharmaceutical Sciences, Sulur, Coimbatore, for
providing necessary laboratory facilities, encouragement and continued support
throughout the course of this work.
With great pleasure I am thankful to Dr.Vijaianand,M.Pharm., PhD,
Professor of Pharmaceutical Analysis, R.V.S. College of Pharmaceutical
Sciences, Sulur, Coimbatore, for their valuable suggestions and help throughout
the course of work.

I express my sincere thanks to Mr.P.Kumar Nallasivan, M.pharm
professor, Department of Pharmaceutical Analysis for their valuable
advices,help and support during my academic and project work.
I express my sincere thanks to Mr. Gopalakrishnan.G General manager,
Care Keralam for providing the facilities to carry out my project work in this
esteemed organization.
I express my thanks to my friends for their help and moral support in
the successful completion of this project work.
I convey my sincere thanks to all the staff members of RVS college of
pharmaceutical Analysis who have contributed to my thesis work.
Words have no power to pay regards to my most beloved parents,who
sacrificed a lot for my welfare and brought me up to this esteemed stage.I
expressed my love and gratitude to my father and other family members for their
endless love and sincere prayers through the duration of my studies
PRASANTH A R
261530656
CONTENTS
Sl.NO TOPICPAGE
NO
LIST OF TABLES
LIST OF FIGURES
LIST OF ABBREVIATIONS
1. INTRODUCTION
1.1 Analytical chemistry 1
1.2 Importance of drug analysis 1
1.3 Relevance of analytical methods 2
1.4 Analytical methods 2
1.5 High performance liquid chromatography 3
1.6 High performance thin layer chromatography 10
1.7 Analytical method Development and validation 15
2. REVIEW OF LITERATURE
2.1 Literature Review 22
2.2 Drug Profile 30
3. AIM AND PLAN OF WORK
3.1 Aim and Objective 32
3.2 Plan of Work 32
4. MATERIALS & METHODS
4.1 MATERIALS AND METHOD FOR HPLC 33
4.2 MATERIALS AND METHOD FOR HPTLC 55
5. RESULT AND DISCUSSION 79
6. CONCLUSION 114
7. BIBLIOGRAPHY 116
Introduction
RVS College of Pharmaceutical Sciences Page 1
1. INTRODUCTION
1.1. ANALYTICAL CHEMISTRY 1-4
Analytical Chemistry is defined as “The science and the art of determining
the composition of materials in terms of the elements or compounds contained.”
This branch of chemistry, which deals with both theoretical, practical science and
practiced in a large number of laboratories in many diverse ways. Methods of
analysis are routinely developed, improved, validated, collaboratively studied and
applied. In analytical chemistry it is of prime importance to gain information about
the qualitative and quantitative composition of substances and chemical species
that is to find out what substance is composed and exactly how much. In
quantitative analysis the question is how much is present. The research work in
this thesis is based on this criterion. Pharmaceutical analysis deals not only with
medicaments (drugs and their formulations) but also with their precursors i.e. with
the raw material on which degree of purity and quality of medicament depends.
The quality of the drug is determined after establishing its authenticity by testing
its purity and the quality of pure substance in the drug and its formulations.
Quality is important in every product or service but it is vital in medicine as it
involves life. Unlike ordinary consumer goods there can be no “second quality” in
drugs. Quality control is a concept, which strives to produce a perfect product by
series of measures designed to prevent and eliminate errors at different stages of
production.
1.2. IMPORTANCE OF DRUG ANALYSIS
Medicines are key part of the health care system. Numerous medicines
are introduced into the world-market and also, that is increasing every year.These
medicines are being either new entities or partial structural modification of the
existing one. So, evaluation of quality and efficacy of these medicines are
important Right from the beginning of discovery of any medicine, quality and
efficacy of the same are checked by quantification means. Quality and efficacy
are checked by either observing effect of drug on various animal models or by
analytical means the option of animal models is not practically suitable for every
batch of medicine as it requires long time, high cost and more man-power. Later
option of analytical way is more suitable, highly precise, safe and selective.
Introduction
RVS College of Pharmaceutical Sciences Page 2
1.3. Relevance of Analytical Methods 5-7
1.4. Analytical methods
The analytical way deals with quality standards which are assigned for
products to have desirable efficacy of the medicines. Sample representing any
batch are analyzed for these standards and it is assumed that drug/medicine
complying with those standards are having desired effect on use. Quality control
is a concept, which strives to produce a perfect product by series of measures
designed to prevent and eliminate errors at different stage of production. The
decision to release or reject a product is based on one or more type of control
action. Due to rapid growth of pharmaceutical industry during last several years,
number of pharmaceutical formulations enter as a part of health care system and
thus, there has been rapid progress in the field of pharmaceutical analysis.
Developing analytical method for newly introduced pharmaceutical formulation is
a matter of most importance because drug or drug combination may not be
official in any pharmacopoeias and thus, no analytical method for quantification is
available. To check the quality standards of the medicine various analytical
methods are used. Modern analytical techniques are playing key role in
assessing chemical quality standards of medicine. Thus analytical techniques are
required for fixing standards of medicines and its regular checking. Out of all
analytical techniques, the technique which is widely used to check the quality of
drug is known as "chromatography’.
Analytical methods which are a measure of quality of the drugs
play a very comprehensive role in drug development and follow up activities. It
assures that a drug product meets the established standard, is stable and will
continue to meet purported quality throughout its shelf life.These methods should
be selective and sensitive to monitor the known and unknown impurities and
have to be written in a format such that they can be reproduced over a period of
time and from laboratory to laboratory, i.e., these methods should be validated.
Pharmaceutical analysis plays an important role right from the testing of
raw materials; in-process quality checks and analysis of finished products.
Introduction
RVS College of Pharmaceutical Sciences Page 3
In analytical chemistry, it is of prime importance to gain information about
the qualitative and quantitative compositions of substances and chemical
species, that is, to find out what a substance is composed of and exactly how
much. In general terms, pharmaceutical analysis comprises of those procedures
necessary to determine the “identity, strength, quality and purity” of drugs.
1.5. High Performance Liquid Chromatography
3) packed in glass columns in 1903. High pressure liquid
Pharmaceutical analysis is considered to determine the identity, strength, quality
and purity of drug samples.
Analytical methods are required to characterize the drug substances and
drug product composition during all phases of pharmaceutical development.
Early phase methods must support changes in synthetic routes and dosage form
and elucidate the structures and levels of impurities. In later phases, goals
change to the development of rapid and robust methods for release and stability
evaluation.
Analysis includes a wide range of simple and instrumental analytical
methods, but the most widely used methods for quality assurance are
spectroscopy and chromatography. Most quantitative analysis requires
measuring specified components in the presence of sample matrix and/or related
substances; therefore isolation or separation of the components are required
preceding such analysis. In such cases chromatographic techniques are used for
quantitative analysis. In case, where matrix interference is not observed
quantitative measurements are made using spectroscopic or titration methods.
Method validation is an integral part of method development. It is the
process of demonstrating that analytical procedures are suitable for their
intended use and that they support the identity, quality, purity, and potency of the
drug substances and drug products. Simply, method validation is the process
of proving that an analytical method is acceptable for its intended purpose.
The term chromatography meaning “color writing,” was first discovered by
Mikhail Tswett, a Russian botanist who separated plant pigments on chalk
(CaCO
Introduction
RVS College of Pharmaceutical Sciences Page 4
Four major separation modes of HPLC are normal phase, reversed phase,
ion exchange chromatography, and size exclusion chromatography (gel
permeation and gel filtration chromatography.
Normal-Phase Chromatography (NPC)8-9
Reversed-Phase Chromatography (RPC)
chromatography was developed in the mid-1970’s andquickly improved with the
development of column packing materials and the additional convenience of
online detectors. In the late 1970’s, new methods including reverse phase liquid
chromatography allowed for improved separation between very similar
compounds. By the 1980’s HPLC was commonly used for the separation of
chemical compounds. Computers and automation added to the convenience of
HPLC.
Liquid chromatography (LC) is a physical separation technique conducted
in the liquid phase. Analyte is forced to flow through a column under high
pressure. Then it is separated into its constituent components by distributing
between the mobile phase (a flowing liquid) and a stationary phase (sorbents
packed inside a column).
NPC is the traditional separation mode based on adsorption/desorption of
the analyte onto a polar stationary phase (typically silica or alumina). In this
technique, nonpolar compounds travel faster and are eluted first because of the
lower affinity between the nonpolar compounds and the stationary phase. Polar
compounds are retained for a longer time because of their higher affinity
towards the stationary phase. Normal phase mode of separation is,
therefore, not generally used for pharmaceutical applications because most of
the drug molecules are polar in nature and hence take longer time to elute.
Reversed phase mode is the most popular mode for analytical and
preparative separations of compounds of interest in chemical, biological,
pharmaceutical, food and biomedical sciences. In this mode, the stationary phase
is nonpolar hydrophobic packing with octyl or octadecyl functional group bonded
to silica gel and the mobile phase is a polar solvent. An aqueous mobile phase
Introduction
RVS College of Pharmaceutical Sciences Page 5
18,
C8, C4 etc., (in the order of increasing polarity of the stationary phase).
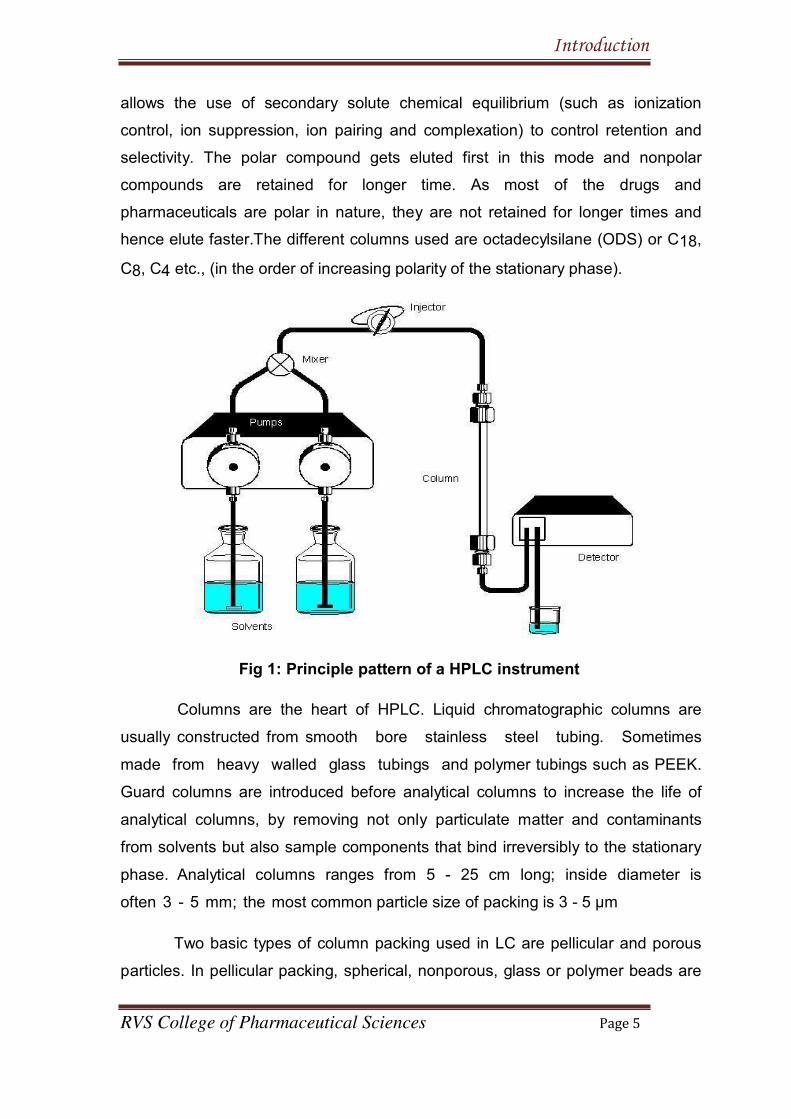
Fig 1: Principle pattern of a HPLC instrument
Two basic types of column packing used in LC are pellicular and porous
particles. In pellicular packing, spherical, nonporous, glass or polymer beads are
allows the use of secondary solute chemical equilibrium (such as ionization
control, ion suppression, ion pairing and complexation) to control retention and
selectivity. The polar compound gets eluted first in this mode and nonpolar
compounds are retained for longer time. As most of the drugs and
pharmaceuticals are polar in nature, they are not retained for longer times and
hence elute faster.The different columns used are octadecylsilane (ODS) or C
Columns are the heart of HPLC. Liquid chromatographic columns are
usually constructed from smooth bore stainless steel tubing. Sometimes
made from heavy walled glass tubings and polymer tubings such as PEEK.
Guard columns are introduced before analytical columns to increase the life of
analytical columns, by removing not only particulate matter and contaminants
from solvents but also sample components that bind irreversibly to the stationary
phase. Analytical columns ranges from 5 - 25 cm long; inside diameter is
often 3 - 5 mm; the most common particle size of packing is 3 - 5 µm
Introduction
RVS College of Pharmaceutical Sciences Page 6
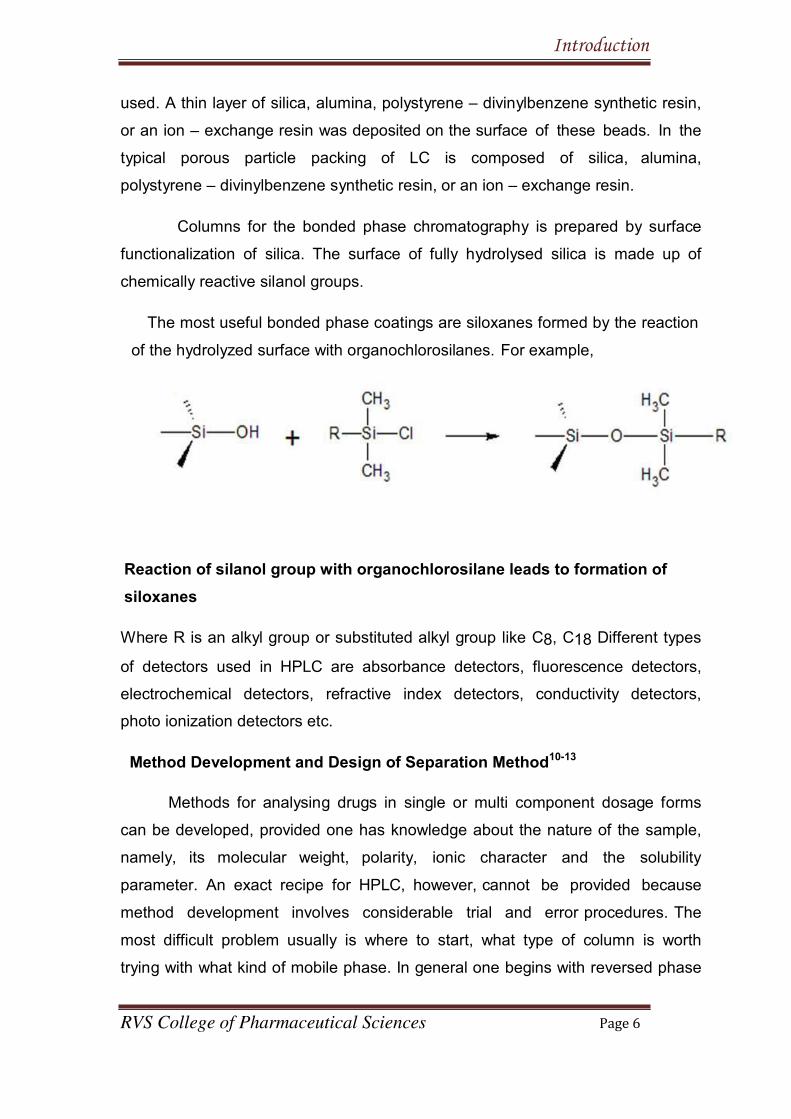
Columns for the bonded phase chromatography is prepared by surface
functionalization of silica. The surface of fully hydrolysed silica is made up of
chemically reactive silanol groups.
The most useful bonded phase coatings are siloxanes formed by the reaction
of the hydrolyzed surface with organochlorosilanes. For example,
Reaction of silanol group with organochlorosilane leads to formation of
siloxanes
Where R is an alkyl group or substituted alkyl group like C8, C18 Different types
of detectors used in HPLC are absorbance detectors, fluorescence detectors,
electrochemical detectors, refractive index detectors, conductivity detectors,
photo ionization detectors etc.
Method Development and Design of Separation Method10-13
Methods for analysing drugs in single or multi component dosage forms
can be developed, provided one has knowledge about the nature of the sample,
namely, its molecular weight, polarity, ionic character and the solubility
parameter. An exact recipe for HPLC, however, cannot be provided because
method development involves considerable trial and error procedures. The
most difficult problem usually is where to start, what type of column is worth
trying with what kind of mobile phase. In general one begins with reversed phase
used. A thin layer of silica, alumina, polystyrene – divinylbenzene synthetic resin,
or an ion – exchange resin was deposited on the surface of these beads. In the
typical porous particle packing of LC is composed of silica, alumina,
polystyrene – divinylbenzene synthetic resin, or an ion – exchange resin.
Introduction
RVS College of Pharmaceutical Sciences Page 7
chromatography, when the compounds are hydrophilic in nature with many polar
groups and are water soluble.
The organic phase concentration required for the mobile phase can be
estimated by gradient elution method. For aqueous sample mixtures, the best
way to start is with gradient reversed phase chromatography. Gradient can be
started with 5-10 % organic phase in the mobile phase and the organic phase
concentration (methanol or acetonitrile) can be increased up to 100 % within
30-45 min. Separation can then be optimized by changing the initial
mobile phase composition and the slope of the gradient according to the
chromatogram obtained from the preliminary run. The initial mobile phase
composition can be estimated on the basis of where the compounds of interest
were eluted,namely at what mobile phase composition.
Changing the polarity of mobile phase can alter elution of drug
molecules. The elution strength of a mobile phase depends upon its polarity,
the stronger the polarity, higher is the elution. Ionic samples (acidic or basic)
can be separated, if they are present in undissociated form. Dissociation of ionic
samples may be suppressed by the proper selection of pH. The pH of the
mobile phase has to be selected in such a way that the compounds are not
ionized. If the retention times are too short, the decrease of the organic phase
concentration in the mobile phase can be in steps of 5%. If the retention times
are too long, an increase of the organic phase concentration is needed.
In UV detection, good analytical results are obtained only when the
wavelength is selected carefully. This requires knowledge of the UV spectra of
the individual present in the sample. If analyte standards are available, their UV
spectra can be measured prior to HPLC method development.
The molar absorbance at the detection wavelength is also an important
parameter. When peaks are not detected in the chromatograms, it is possible
that the sample quantity is not enough for the detection. An injection of volume
of 20 μL from a solution of 1 mg/mL concentration normally provides good
signals for UV active compounds around 220 nm. Even if the compounds
exhibit higher λmax, they absorb strongly at lower wavelength.
Introduction
RVS College of Pharmaceutical Sciences Page 8
It is not always necessary to detect compounds at their maximum
absorbance. It is, however, advantageous to avoid the detection at the
sloppy part of the UV spectrum for precise quantitation. When acceptable
peaks are detected on the chromatogram, the investigation of the peak shapes
can help further method development.
The addition of peak modifiers to the mobile phase can affect the
separation of ionic samples. For examples, the retention of the basic
compounds can be influenced by the addition of small amounts of
triethylamine (a peak modifier) to the mobile phase. Similarly for acidic
compounds small amounts of acids such as acetic acid can be used. This
can lead to useful changes in selectivity. When tailing or fronting is observed,
it means that the mobile phase is not totally compatible with the solutes. In
most case the pH is not properly selected and hence partial dissociation or
protonation takes place. When the peak shape does not improve by lower (1-2)
or higher (8-9) pH, then ion-pair chromatography can be used. For acidic
compounds, cationic ion pair molecules at higher pH and for basic
compounds, anionic ion-pair molecules at lower pH can be used. For
amphoteric solutes or a mixture of acidic and basic compounds, ion-pair
chromatography is the method of choice.
The low solubility of the sample in the mobile phase can also cause bad
peak shapes. It is always advisable to use the same solvents for the preparation
of sample solution as the mobile phase to avoid precipitation of the compounds in
the column or injector.
Optimization can be started only after a reasonable chromatogram has
been obtained. A reasonable chromatogram means that more or less
symmetrical peaks on the chromatogram detect all the compounds. By sight
change of the mobile phase composition, the position of the peaks can be
predicted within the range of investigated changes. An optimized chromatogram
is the one in which all the peaks are symmetrical and are well separated in less
runtime.

Introduction
RVS College of Pharmaceutical Sciences Page 9
The peak resolution can be increased by using a more efficient column
(column with higher theoretical plate number, N) which can be achieved by
using a column of smaller particle size, or a longer column. These factors,
however, will increase the analysis time. Flow rate does not influence resolution,
but it has a strong effect on the analysis time.
Unfortunately, theoretical predictions of mobile phase and stationary
phase interactions with a given set of sample components are not always
accurate, but they do help to narrow down the choices for method
development. The separation scientist must usually perform a series of trial and
error experiments with different mobile phase compositions until a satisfactory
separation is achieved.
Fig 2: A HPLC chromatogram
The parameters that are affected by the changes in chromatographic conditions
are:
1. Resolution (RS).
2. Capacity factor (k‟).
3. Selectivity (α).
4. Plate number (N).
5. Asymmetry factor (T).

Introduction
RVS College of Pharmaceutical Sciences Page 10
Quantitative Analysis in HPLC14
Two methods are generally used for quantitative analysis. They are the
external standard method, the internal standard method and the standard
addition method.
1. External standard method
The external standard method involves the use of a single standard or up to
three standard solutions. The peak area or the height of the sample and the
standard used are compared directly or the slope of the calibration curve
based on standards that contain known concentrations of the compounds of
interest.
2. Internal standard method
A widely used technique of quantitation involves the addition of an internal
standard to compensate for various analytical errors. In this approach, a known
compound of a fixed concentration is added to the known amount of samples to
give separate peaks in the chromatograms, to compensate for the losses of the
compounds of interest during sample pretreatment steps. Any loss of the
component of interest will be accompanied by the loss of an equivalent fraction
of internal standard. The accuracy of this approach obviously dependents on the
structural equivalence of the compounds of interest and the internal standard.
The internal standard should be added to the sample prior to
sample preparation procedure and homogenized with it. Response factor is used
to determine the concentration of a sample component in the original sample.
The response factor (RF) is the ratio of peak areas of sample component (Ax)
and the internal standard (AISTD) obtained by injecting the same quantity.
1.6. HIGH PERFORMANCE THIN LAYER CHROMATOGRAPHY15-19
The basic principle of Thin Layer Chromatography is adsorption. The major
components of TLC are a stationary phase and a mobile phase. The stationary
phase is a sheet of glass, plastic, or aluminium foil, which is coated with a thin
layer of adsorbent usually silica gel, aluminium oxide, or cellulose. After the
Introduction
RVS College of Pharmaceutical Sciences Page 11
application of the sample on the stationary phase, the mobile phase is allowed to
move through the stationary phase via capillary action. The separation of the
components in the sample takes place depended on the affinity of the
components towards the stationary phase and mobile phase. Organic solvent or
mixture of solvents are used as mobile phase to achieve a good resolution.
High performance thin layer chromatography (HPTLC) is a sophisticated
instrumental technique based on the full capabilities of thin layer
chromatography. The advantages of automation, scanning, full optimization,
selective detection principle, minimum sample preparation, hyphenation, etc.
enable it to be a powerful analytical tool for chromatographic information of
complex mixtures of inorganic, organic, and biomolecules. The term HPTLC is
used for the technique in which substances are accurately and precisely
assayed using high performance grades of silica gel. In HPTLC, the sorbent
material like silica gel G60 has finer particle size distribution than conventional
TLC material. It is a powerful, reliable and cost effective method for
qualitative and quantitative analysis. In HPTLC, the mobile phase moves
through the pre-coated stationary phase by capillary action or by gravity.
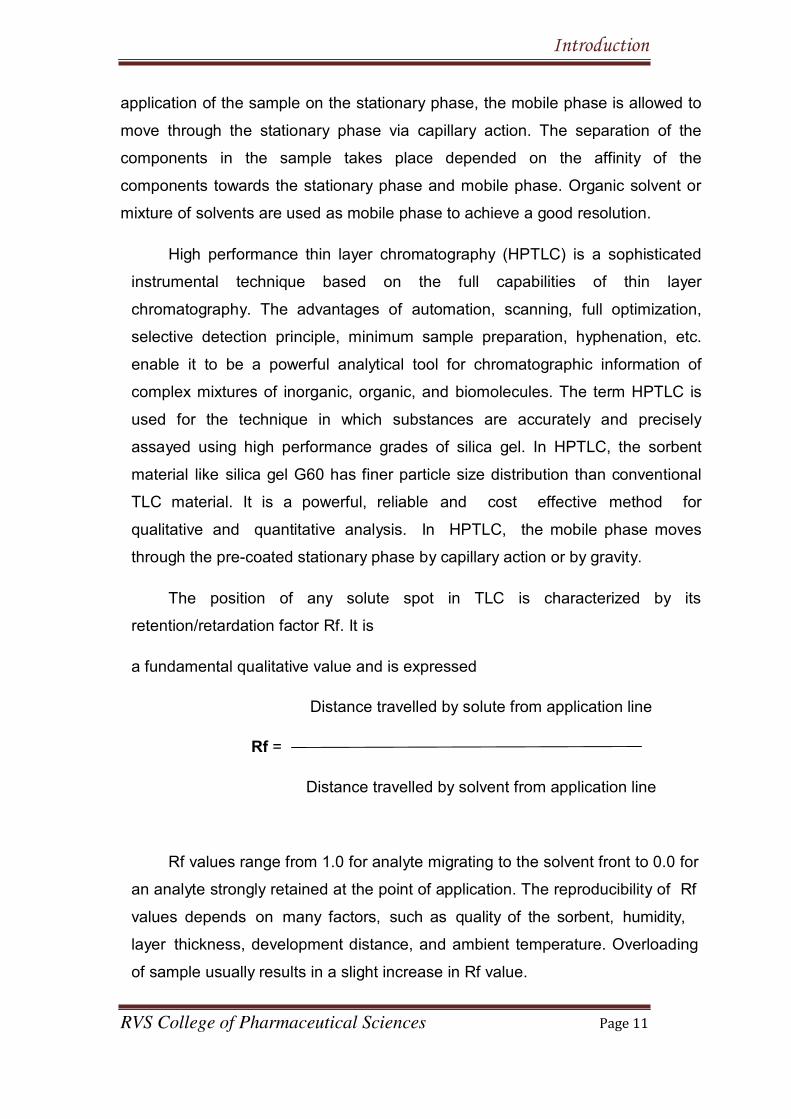
The position of any solute spot in TLC is characterized by its
retention/retardation factor Rf. It is
a fundamental qualitative value and is expressed
Distance travelled by solute from application line
Rf =
Distance travelled by solvent from application line
Rf values range from 1.0 for analyte migrating to the solvent front to 0.0 for
an analyte strongly retained at the point of application. The reproducibility of Rf
values depends on many factors, such as quality of the sorbent, humidity,
layer thickness, development distance, and ambient temperature. Overloading
of sample usually results in a slight increase in Rf value.
Introduction
RVS College of Pharmaceutical Sciences Page 12
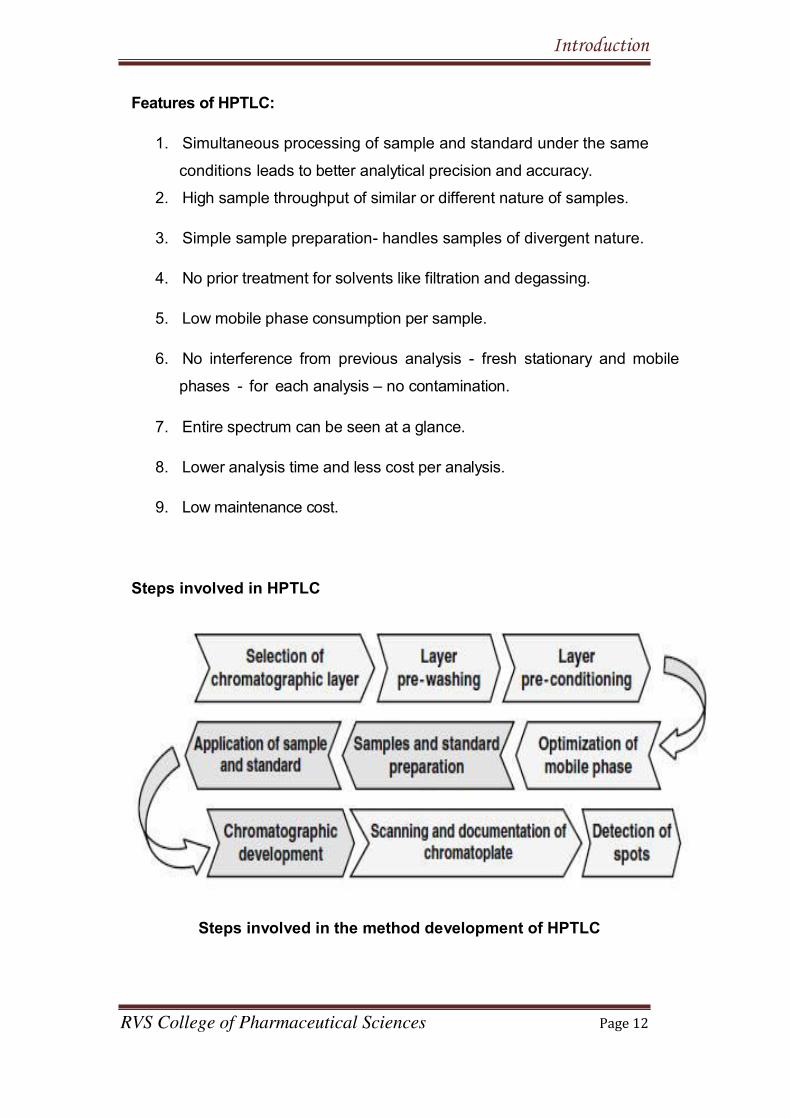
Features of HPTLC:
1. Simultaneous processing of sample and standard under the same
conditions leads to better analytical precision and accuracy.
2. High sample throughput of similar or different nature of samples.
3. Simple sample preparation- handles samples of divergent nature.
4. No prior treatment for solvents like filtration and degassing.
5. Low mobile phase consumption per sample.
6. No interference from previous analysis - fresh stationary and mobile
phases - for each analysis – no contamination.
7. Entire spectrum can be seen at a glance.
8. Lower analysis time and less cost per analysis.
9. Low maintenance cost.
Steps involved in HPTLC
Steps involved in the method development of HPTLC

Introduction
RVS College of Pharmaceutical Sciences Page 13
1. Selection of chromatographic layer:
Pre-coated plates with different support materials like glass, aluminium
and plastic and with different sorbent layers are available. Commonly
used pre-coated plates are silica gel G 60F254, aluminium oxide,
cellulose, hybrid plates etc., plates in size of 10x10cm are usually used.
80 % of analysis: Basic substances, alkaloids and steroids - Silica gel G
60F254.
Amino acids, dipeptides, sugars and alkaloids – cellulose
Non polar substances, fatty acids, carotenoids, cholesterol – RP-2, RP-
8 and RP-18.
2. Sample and standard preparation:
Proper sample and standard preparation is an important pre-requisite for
the success of HPTLC. The choice of suitable solvent for a given analysis is
very important. For normal phase mode, non polar solvent should be used
for dissolving the sample and standard. For reverse phase mode, polar
solvent should be used for dissolving sample and standard.
3. Activation of pre-coated plates:
Freshly open box of plates do not require activation, plates exposed
to high humidity or kept on hand for long time to be activated, by
placing in an oven at 110-120º C for 30 minutes prior to spotting,
Aluminum sheets should be kept in between two glass plates and
placing in oven at 110-120º C for 15 minutes.
4. Application of sample and standard:
The selection of the sample application technique and device to be used
depends on: Nature of the analytical work, sample volume, number of
samples to be applied, qualitative or quantitative work.
Sample application should be done either as spots or as bands.
For sample application as bands, mechanized spotting device called
Linomat is used.
Introduction
RVS College of Pharmaceutical Sciences Page 14
5. Selection of mobile phase:
The mobile phase should be chosen taking into consideration the
chemical properties of the analyte and adsorbent.
Trial and error.
One‟s own experience and Literature.
Composition is expressed by volume (v/v) and sum of volumes is
usually 100.
Normal phase: Mobile phase is non-polar. Non-polar compounds
eluted first because of lower affinity with stationary phase. Polar
compounds retained because of higher affinity with the stationary
phase. Stationary phase is polar.
Reverse phase: Mobile phase is polar. Polar compounds eluted first
because of lower affinity with stationary phase. Non-Polar compounds
retained because of higher affinity with the stationary phase. Stationary
phase is non polar.
6. Pre-conditioning (Chamber saturation):
Unsaturated chamber causes high Rf values.Saturated chamber by
lining with filter paper for 30 minutes prior to development- uniform
distribution of solvent vapours- less solvent for the sample to travel
lower Rf values.
7. Chromatographic development and drying:
Ascending, descending and two dimensional are the most
common methods of development. After the development, the plate
is removed from the chamber and dry. Twin trough chambers with
stainless steel lid are used for the development of chromatogram.
Introduction
RVS College of Pharmaceutical Sciences Page 15
8. Detection and visualization:
Detection under UV light is first choice as it is nondestructive,
spots of fluorescent compounds can be seen at 254 nm (short wave
length) or at 366 nm (long wave length), spots of nonfluorescent
compounds like Ethambutol, Dicylomine etc-dipping the plates in0.1 %
iodine solution. When individual component does not respond
to UV- derivatization required for detection.
9. Quantification:
Most modern HPTLC quantitative analysis are performed in situ by
measuring the zones of samples and standards using a chromatogram
spectrophotometer usually called a densitometer or scanner with a fixed
sample light beam in the form of a rectangular slit. Generally,
quantitative evaluation is performed with the TLC Scanner III using
winCATS software. It can scan the chromatogram in reflectance or in
transmittance mode by absorbance or by fluorescent mode; scanning
speed is selectable up to 100 mm/s. Spectra recording is fast.
Calibration of single and multiple levels with linear or nonlinear
regressions are possible.
10. Documentation
Each developed plate is documented using digital documentation
system under UV light at 254 nm, UV light at 366 nm, and white light. If
a type of light does not produce usable information, that fact must be
documented. If a plate is derivatized, images are taken prior and after
derivatization.
1.7. ANALYTIC METHOD DEVELOPMENT AND VALIDATION20-22
Analytic method development and validation are continuous and
interconnected activities conducted throughout the drug development
process. Analytical methods are required to characterize drug substance
and drug product composition during all phases of pharmaceutical
Introduction
RVS College of Pharmaceutical Sciences Page 16
development. Early phase methods must support changes in synthetic routes
and dosage form and elucidate the structures and levels of impurities. In
later phases, goals change to the development of rapid and robust
methods for release and stability evaluation that can be transferred to
quality units. Analytic methods are intended to establish the identity,
purity, physical characteristics and potency of the drugs that we use. Analytical
method validation is the process of demonstrating that the analytical
procedures are suitable for their intended use. According to FDA guideline,
analytic method validation is a matter of establishing documented evidence
that provides a high degree of assurance that the specified method will
consistently provide accurate test results that evaluate a product against its
defined specification and quality attributes. The validation process requires
quality method development. Whereas validation can be a time-consuming
process, methods should not enter the validation phase unless they are fully
developed. The relationship of validation and method development can be
Observed as:
When methods are properly developed, they can be readily validated.
Validation does not make a method better or more efficient.
A validated method does not necessarily imply that it meets all criteria of
a properly developed method.
Validation acceptance criteria should be based on method development
experience.
Method Validation is required for the following reasons:
1. A new method is been developed.
2. Revision of established method.
3. When established methods are used in different laboratories and
different analysts etc.
4. Comparison of methods.
5. When quality control indicates method changes.
Introduction
RVS College of Pharmaceutical Sciences Page 17
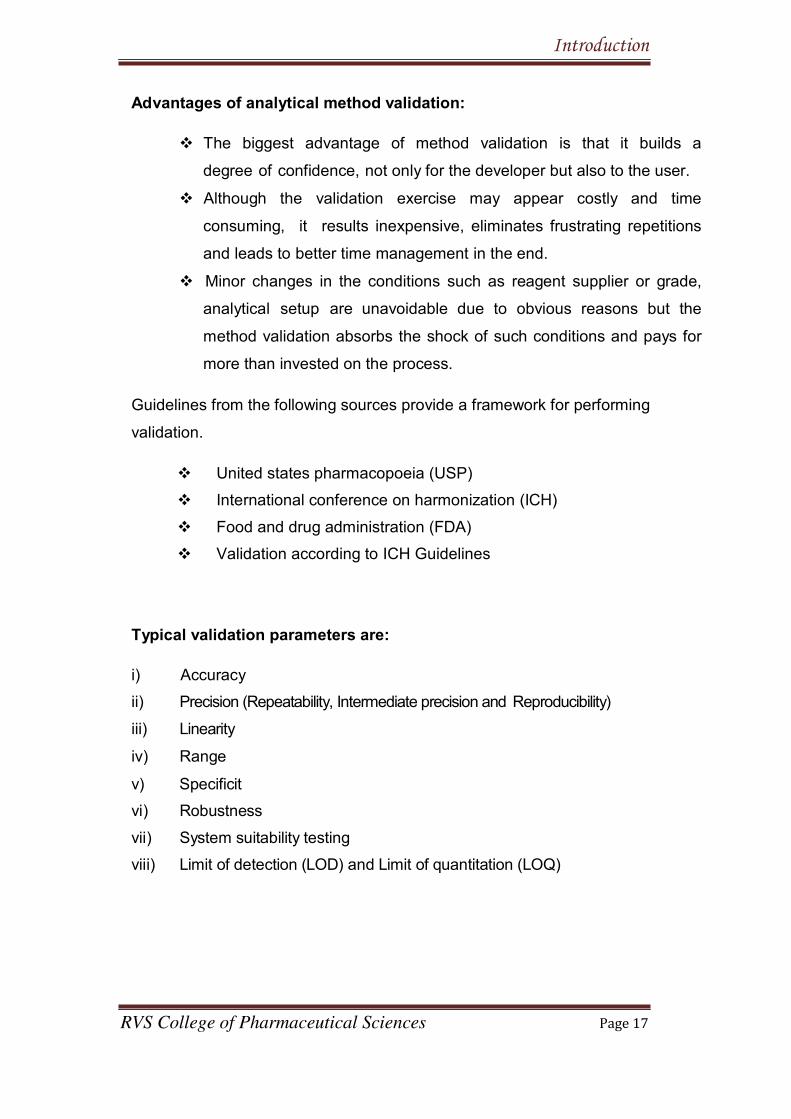
Advantages of analytical method validation:
The biggest advantage of method validation is that it builds a
degree of confidence, not only for the developer but also to the user.
Although the validation exercise may appear costly and time
consuming, it results inexpensive, eliminates frustrating repetitions
and leads to better time management in the end.
Minor changes in the conditions such as reagent supplier or grade,
analytical setup are unavoidable due to obvious reasons but the
method validation absorbs the shock of such conditions and pays for
more than invested on the process.
Guidelines from the following sources provide a framework for performing
validation.
United states pharmacopoeia (USP)
International conference on harmonization (ICH)
Food and drug administration (FDA)
Validation according to ICH Guidelines
Typical validation parameters are:
i) Accuracy
ii) Precision (Repeatability, Intermediate precision and Reproducibility)
iii) Linearity
iv) Range
v) Specificit
vi) Robustness
vii) System suitability testing
viii) Limit of detection (LOD) and Limit of quantitation (LOQ)
Introduction
RVS College of Pharmaceutical Sciences Page 18
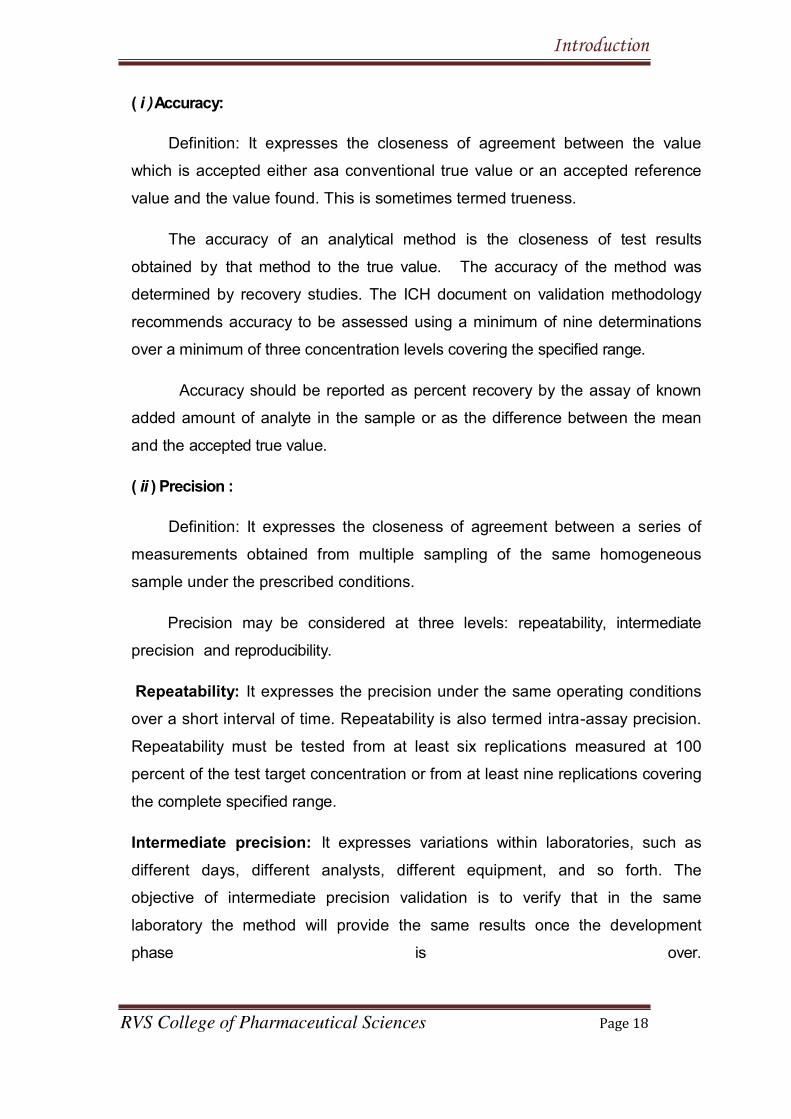
( i )Accuracy:
Definition: It expresses the closeness of agreement between the value
which is accepted either asa conventional true value or an accepted reference
value and the value found. This is sometimes termed trueness.
The accuracy of an analytical method is the closeness of test results
obtained by that method to the true value. The accuracy of the method was
determined by recovery studies. The ICH document on validation methodology
recommends accuracy to be assessed using a minimum of nine determinations
over a minimum of three concentration levels covering the specified range.
Accuracy should be reported as percent recovery by the assay of known
added amount of analyte in the sample or as the difference between the mean
and the accepted true value.
( ii ) Precision :
Definition: It expresses the closeness of agreement between a series of
measurements obtained from multiple sampling of the same homogeneous
sample under the prescribed conditions.
Precision may be considered at three levels: repeatability, intermediate
precision and reproducibility.
Repeatability: It expresses the precision under the same operating conditions
over a short interval of time. Repeatability is also termed intra-assay precision.
Repeatability must be tested from at least six replications measured at 100
percent of the test target concentration or from at least nine replications covering
the complete specified range.
Intermediate precision: It expresses variations within laboratories, such as
different days, different analysts, different equipment, and so forth. The
objective of intermediate precision validation is to verify that in the same
laboratory the method will provide the same results once the development
phase is over.

Introduction
RVS College of Pharmaceutical Sciences Page 19
Reproducibility: It expresses the precision between laboratories. The objective of
reproducibility is to verify that the method will provide the same results in different
laboratories. The reproducibility of an analytical method is determined
by analyzing aliquots from homogeneous lots in different laboratories with
different analysts.
( iii ) Linearity:
Definition: Linearity of an analytical procedure is its ability (within a given
range) to obtain test results that are directly proportional to the concentration of
analyte in the sample.
It may be demonstrated directly on the drug substance (by dilution of a
standard stock solution) and/ separate weighing of synthetic mixtures of the drug
product components, using the proposed procedure.
( iv ) Range:
Definition: Range of an analytical procedure is the interval from the upper to
the lower concentration (amounts) of analyte in the sample for which it has been
demonstrated that the analytical procedure has a suitable level of precision,
accuracy and linearity. For the assay of a drug substance or a finished (drug)
product: normally from 80 to 120 percent of the test concentration should be
tested/checked for range.
( v ) Specificity:
Definition: It is the ability to assess unequivocally the analyte in the presence of
components, which may be expected to be present. Typically, these might
include impurities, degradants, matrix, etc.
(vi) Robustness:
Definition: It is a measure of its capacity to remain unaffected by small, but
deliberate variations in method parameters and provides an indication of its
reliability during normal usage.
Introduction
RVS College of Pharmaceutical Sciences Page 20
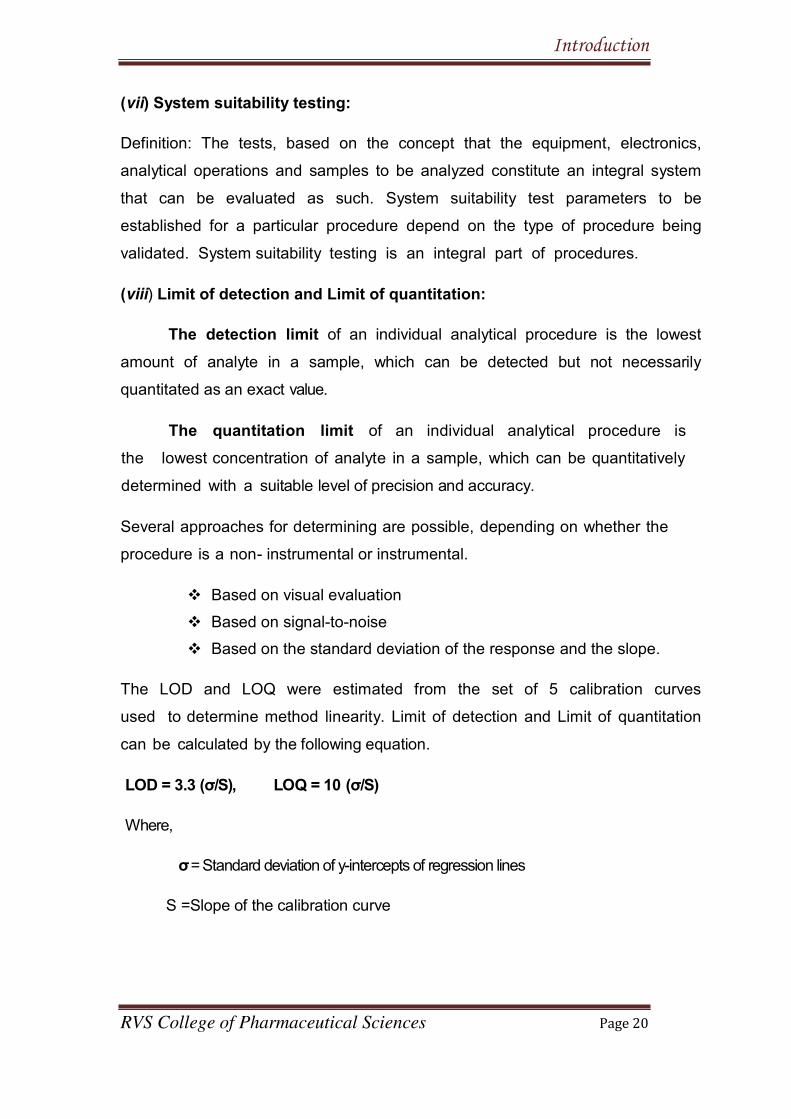
(vii) System suitability testing:
(viii) Limit of detection and Limit of quantitation:
The detection limit of an individual analytical procedure is the lowest
amount of analyte in a sample, which can be detected but not necessarily
quantitated as an exact value.
The quantitation limit of an individual analytical procedure is
the lowest concentration of analyte in a sample, which can be quantitatively
determined with a suitable level of precision and accuracy.
Several approaches for determining are possible, depending on whether the
procedure is a non- instrumental or instrumental.
Based on visual evaluation
Based on signal-to-noise
Based on the standard deviation of the response and the slope.
The LOD and LOQ were estimated from the set of 5 calibration curves
used to determine method linearity. Limit of detection and Limit of quantitation
can be calculated by the following equation.
LOD = 3.3 (σ/S), LOQ = 10 (σ/S)
Where,
σ= Standard deviation of y-intercepts of regression lines
S =Slope of the calibration curve
Definition: The tests, based on the concept that the equipment, electronics,
analytical operations and samples to be analyzed constitute an integral system
that can be evaluated as such. System suitability test parameters to be
established for a particular procedure depend on the type of procedure being
validated. System suitability testing is an integral part of procedures.
Introduction
RVS College of Pharmaceutical Sciences Page 21
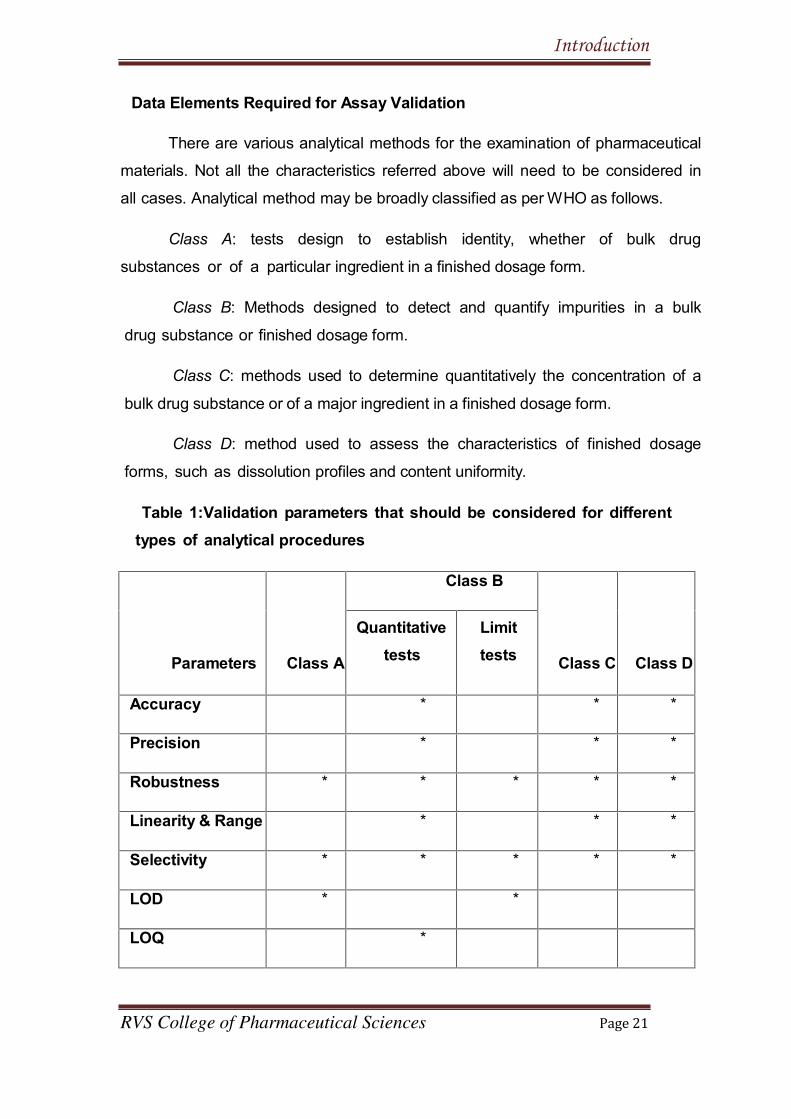
Data Elements Required for Assay Validation
There are various analytical methods for the examination of pharmaceutical
materials. Not all the characteristics referred above will need to be considered in
all cases. Analytical method may be broadly classified as per WHO as follows.
Class A: tests design to establish identity, whether of bulk drug
substances or of a particular ingredient in a finished dosage form.
Class B: Methods designed to detect and quantify impurities in a bulk
drug substance or finished dosage form.
Class C: methods used to determine quantitatively the concentration of a
bulk drug substance or of a major ingredient in a finished dosage form.
Class D: method used to assess the characteristics of finished dosage
forms, such as dissolution profiles and content uniformity.
Table 1:Validation parameters that should be considered for different
types of analytical procedures
Parameters Class A
Class B
Class C Class D
Quantitative
tests
Limit
tests
Accuracy * * *
Precision * * *
Robustness * * * * *
Linearity & Range * * *
Selectivity * * * * *
LOD * *
LOQ *
Review of Literature
RVS College of Pharmaceutical Sciences Page 22
2.1 Literature Review
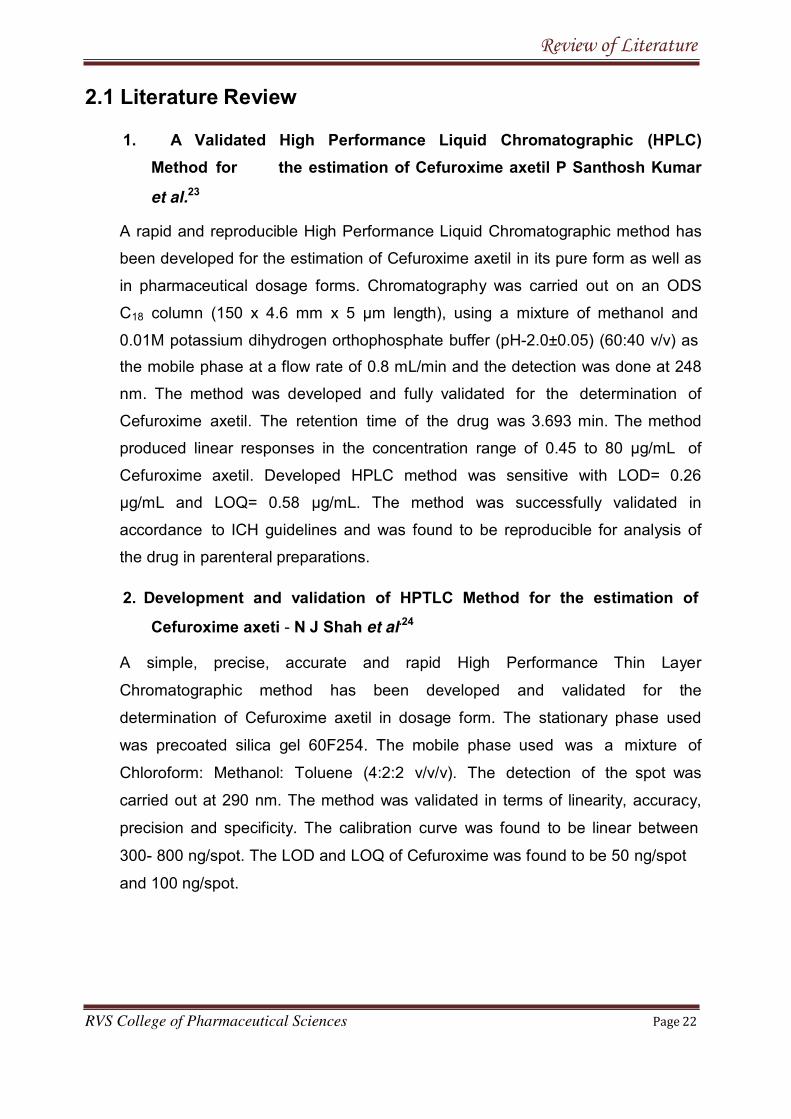
1. A Validated High Performance Liquid Chromatographic (HPLC)
Method for the estimation of Cefuroxime axetil P Santhosh Kumar
et al.23
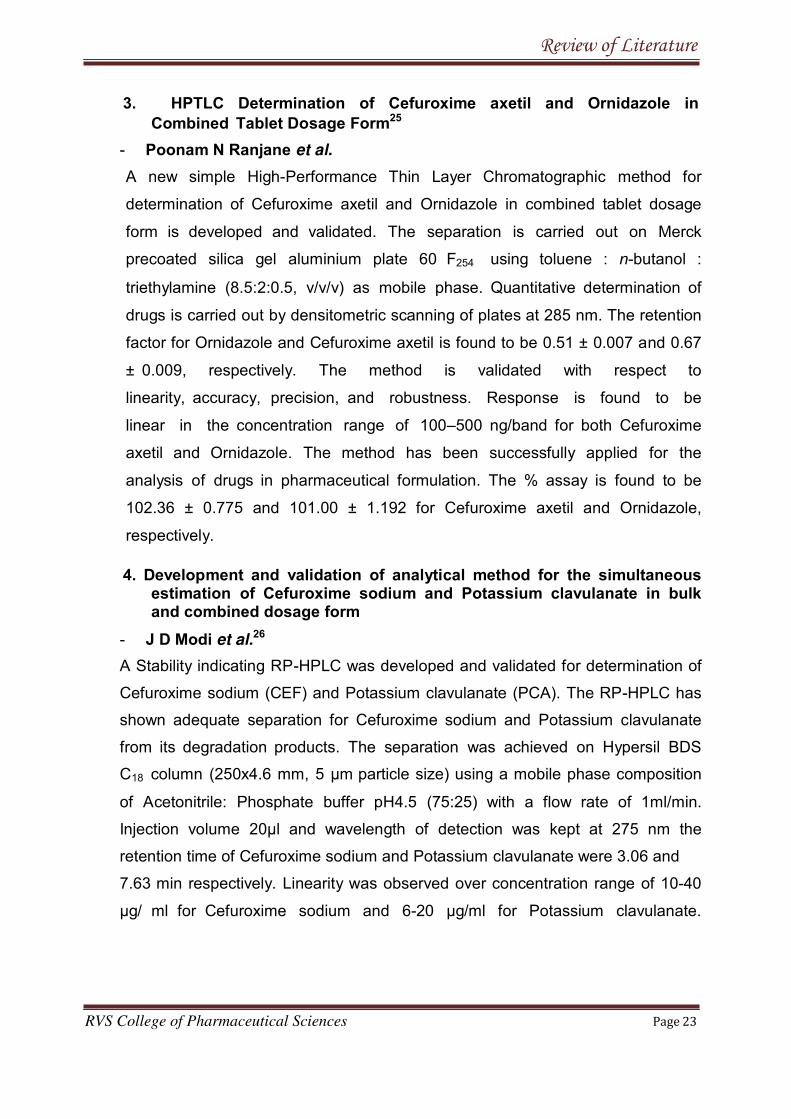
2. Development and validation of HPTLC Method for the estimation of
Cefuroxime axeti - N J Shah et al.24
A rapid and reproducible High Performance Liquid Chromatographic method has
been developed for the estimation of Cefuroxime axetil in its pure form as well as
in pharmaceutical dosage forms. Chromatography was carried out on an ODS
C18 column (150 x 4.6 mm x 5 μm length), using a mixture of methanol and
0.01M potassium dihydrogen orthophosphate buffer (pH-2.0±0.05) (60:40 v/v) as
the mobile phase at a flow rate of 0.8 mL/min and the detection was done at 248
nm. The method was developed and fully validated for the determination of
Cefuroxime axetil. The retention time of the drug was 3.693 min. The method
produced linear responses in the concentration range of 0.45 to 80 μg/mL of
Cefuroxime axetil. Developed HPLC method was sensitive with LOD= 0.26
μg/mL and LOQ= 0.58 μg/mL. The method was successfully validated in
accordance to ICH guidelines and was found to be reproducible for analysis of
the drug in parenteral preparations.
A simple, precise, accurate and rapid High Performance Thin Layer
Chromatographic method has been developed and validated for the
determination of Cefuroxime axetil in dosage form. The stationary phase used
was precoated silica gel 60F254. The mobile phase used was a mixture of
Chloroform: Methanol: Toluene (4:2:2 v/v/v). The detection of the spot was
carried out at 290 nm. The method was validated in terms of linearity, accuracy,
precision and specificity. The calibration curve was found to be linear between
300- 800 ng/spot. The LOD and LOQ of Cefuroxime was found to be 50 ng/spot
and 100 ng/spot.
Review of Literature
RVS College of Pharmaceutical Sciences Page 23
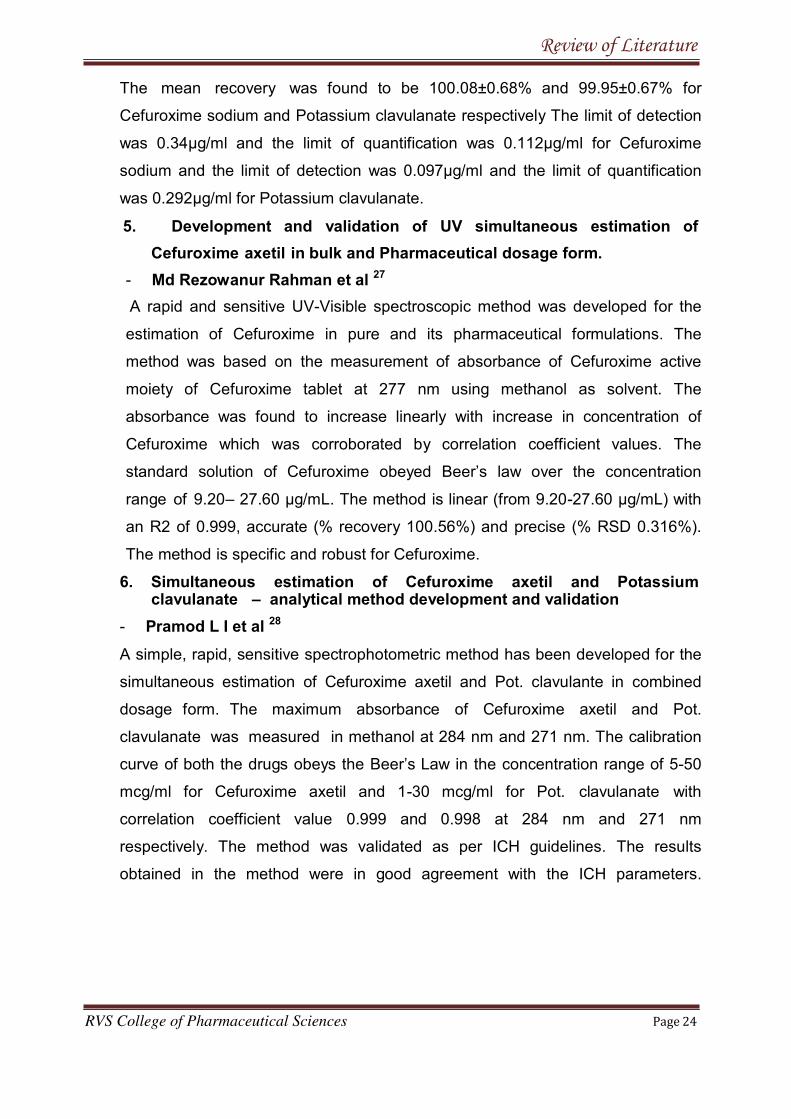
3. HPTLC Determination of Cefuroxime axetil and Ornidazole in
Combined Tablet Dosage Form25
4. Development and validation of analytical method for the simultaneousestimation of Cefuroxime sodium and Potassium clavulanate in bulkand combined dosage form
- J D Modi et al.26
- Poonam N Ranjane et al.
A new simple High-Performance Thin Layer Chromatographic method for
determination of Cefuroxime axetil and Ornidazole in combined tablet dosage
form is developed and validated. The separation is carried out on Merck
precoated silica gel aluminium plate 60 F254 using toluene : n-butanol :
triethylamine (8.5:2:0.5, v/v/v) as mobile phase. Quantitative determination of
drugs is carried out by densitometric scanning of plates at 285 nm. The retention
factor for Ornidazole and Cefuroxime axetil is found to be 0.51 ± 0.007 and 0.67
± 0.009, respectively. The method is validated with respect to
linearity, accuracy, precision, and robustness. Response is found to be
linear in the concentration range of 100–500 ng/band for both Cefuroxime
axetil and Ornidazole. The method has been successfully applied for the
analysis of drugs in pharmaceutical formulation. The % assay is found to be
102.36 ± 0.775 and 101.00 ± 1.192 for Cefuroxime axetil and Ornidazole,
respectively.
A Stability indicating RP-HPLC was developed and validated for determination of
Cefuroxime sodium (CEF) and Potassium clavulanate (PCA). The RP-HPLC has
shown adequate separation for Cefuroxime sodium and Potassium clavulanate
from its degradation products. The separation was achieved on Hypersil BDS
C18 column (250x4.6 mm, 5 µm particle size) using a mobile phase composition
of Acetonitrile: Phosphate buffer pH4.5 (75:25) with a flow rate of 1ml/min.
Injection volume 20μl and wavelength of detection was kept at 275 nm the
retention time of Cefuroxime sodium and Potassium clavulanate were 3.06 and
7.63 min respectively. Linearity was observed over concentration range of 10-40
μg/ ml for Cefuroxime sodium and 6-20 μg/ml for Potassium clavulanate.
Review of Literature
RVS College of Pharmaceutical Sciences Page 24
The mean recovery was found to be 100.08±0.68% and 99.95±0.67% for
Cefuroxime sodium and Potassium clavulanate respectively The limit of detection
was 0.34μg/ml and the limit of quantification was 0.112μg/ml for Cefuroxime
sodium and the limit of detection was 0.097μg/ml and the limit of quantification
was 0.292μg/ml for Potassium clavulanate.
5. Development and validation of UV simultaneous estimation of
Cefuroxime axetil in bulk and Pharmaceutical dosage form.
- Md Rezowanur Rahman et al 27
6. Simultaneous estimation of Cefuroxime axetil and Potassiumclavulanate – analytical method development and validation
- Pramod L I et al 28
A rapid and sensitive UV-Visible spectroscopic method was developed for the
estimation of Cefuroxime in pure and its pharmaceutical formulations. The
method was based on the measurement of absorbance of Cefuroxime active
moiety of Cefuroxime tablet at 277 nm using methanol as solvent. The
absorbance was found to increase linearly with increase in concentration of
Cefuroxime which was corroborated by correlation coefficient values. The
standard solution of Cefuroxime obeyed Beer’s law over the concentration
range of 9.20– 27.60 μg/mL. The method is linear (from 9.20-27.60 μg/mL) with
an R2 of 0.999, accurate (% recovery 100.56%) and precise (% RSD 0.316%).
The method is specific and robust for Cefuroxime.
A simple, rapid, sensitive spectrophotometric method has been developed for the
simultaneous estimation of Cefuroxime axetil and Pot. clavulante in combined
dosage form. The maximum absorbance of Cefuroxime axetil and Pot.
clavulanate was measured in methanol at 284 nm and 271 nm. The calibration
curve of both the drugs obeys the Beer’s Law in the concentration range of 5-50
mcg/ml for Cefuroxime axetil and 1-30 mcg/ml for Pot. clavulanate with
correlation coefficient value 0.999 and 0.998 at 284 nm and 271 nm
respectively. The method was validated as per ICH guidelines. The results
obtained in the method were in good agreement with the ICH parameters.
Review of Literature
RVS College of Pharmaceutical Sciences Page 25
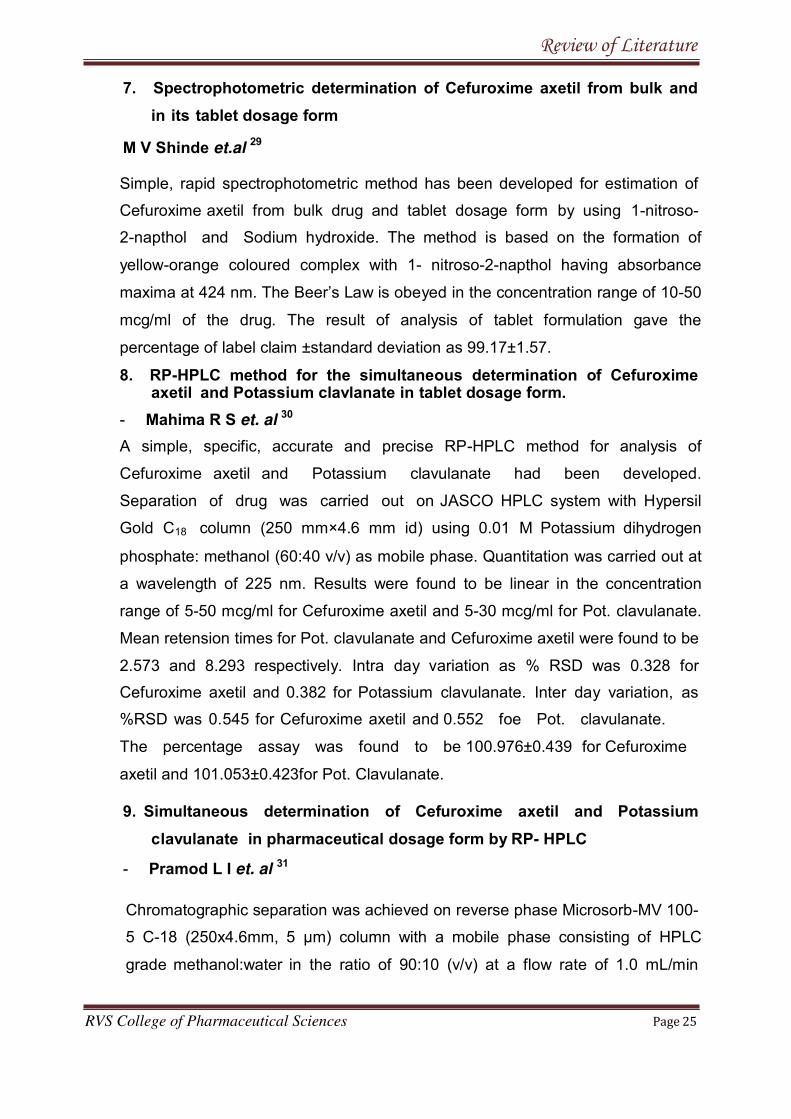
7. Spectrophotometric determination of Cefuroxime axetil from bulk and
in its tablet dosage form
M V Shinde et.al29
axetil and Potassium clavlanate in tablet dosage form.
- Mahima R S et. al30
9. Simultaneous determination of Cefuroxime axetil and Potassium
clavulanate in pharmaceutical dosage form by RP- HPLC
- Pramod L I et. al31
Simple, rapid spectrophotometric method has been developed for estimation of
Cefuroxime axetil from bulk drug and tablet dosage form by using 1-nitroso-
2-napthol and Sodium hydroxide. The method is based on the formation of
yellow-orange coloured complex with 1- nitroso-2-napthol having absorbance
maxima at 424 nm. The Beer’s Law is obeyed in the concentration range of 10-50
mcg/ml of the drug. The result of analysis of tablet formulation gave the
percentage of label claim ±standard deviation as 99.17±1.57.
8. RP-HPLC method for the simultaneous determination of Cefuroxime
A simple, specific, accurate and precise RP-HPLC method for analysis of
Cefuroxime axetil and Potassium clavulanate had been developed.
Separation of drug was carried out on JASCO HPLC system with Hypersil
Gold C18 column (250 mm×4.6 mm id) using 0.01 M Potassium dihydrogen
phosphate: methanol (60:40 v/v) as mobile phase. Quantitation was carried out at
a wavelength of 225 nm. Results were found to be linear in the concentration
range of 5-50 mcg/ml for Cefuroxime axetil and 5-30 mcg/ml for Pot. clavulanate.
Mean retension times for Pot. clavulanate and Cefuroxime axetil were found to be
2.573 and 8.293 respectively. Intra day variation as % RSD was 0.328 for
Cefuroxime axetil and 0.382 for Potassium clavulanate. Inter day variation, as
%RSD was 0.545 for Cefuroxime axetil and 0.552 foe Pot. clavulanate.
The percentage assay was found to be 100.976±0.439 for Cefuroxime
axetil and 101.053±0.423for Pot. Clavulanate.
Chromatographic separation was achieved on reverse phase Microsorb-MV 100-
5 C-18 (250x4.6mm, 5 μm) column with a mobile phase consisting of HPLC
grade methanol:water in the ratio of 90:10 (v/v) at a flow rate of 1.0 mL/min
Review of Literature
RVS College of Pharmaceutical Sciences Page 26
was validated according to the ICH guidelines with respect to specificity,
linearity, accuracy, precision and robustness. The regression value for both the
drugs was found to be 0.996 and 0.992, the SD and RSD values were
found to be well within the acceptable limit of 2.0%
10. Development and validation of UV spectrophotometric method for the
estimation of Linezolid in bulk and pharmaceutical formulation. 18
- P Prasanthi et al.32
11. Method development and validation of spectrophotometric
method for the estimation of Linezolid in pure and tablet dosage form.
- Sushama S et al.33
with UV detection at 230 nm. The retention time for Cefuroxime axetil and
Potassium clavulanate were 2.46 and 3.33 minutes respectively. The method
A simple, accurate, precise and sensitive UV spectrophotometric method was
developed for the determination of Linezolid in bulk and pharmaceutical
dosage form. The solvent used was 20% methanol and the wavelength
corresponding to maximum absorbance of the drug was found at 251nm. Beers
law was observed in the concentration range of 2-16μg/ml with correlation
coefficient 0.999. The linear regression equation obtained by least square
regression method was y=0.072X- 0.065, where y is the absorbance and x
is the concentration of the pure drug solution. The method was validated for
several parameters like accuracy, precision as per ICH guidelines.
A simple, specific and cost effective method for the estimation of Linezolid in
tablets has been developed. Maximum wavelength was found to be 251 nm
and validation was performed as per the ICH guidelines for linearity, accuracy,
precision, LOD and LOQ. The method shows high sensitivity with linearity in the
range of 1-6 µg/ml and shows a linear relationship between absorbance and
concentration with a coefficient of correlation of 0.999. Precision of the method
was good and the method was suitable for the analysis of pharmaceutical dosage
form
Review of Literature
RVS College of Pharmaceutical Sciences Page 27
12. RP-HPLC method development and validation for the analysis of
pharmaceutical drugs – Linezolid.
- V G Patel et al.34
13. A validated stability-indicating LC method for the separation of
enantiomer and potential impurities of Linezolid using polar organic
mode
- Satyanarayana Raju T et al.35
A simple, selective, linear, precise and accurate RP-HPLC method was
developed and validated for rapid assay of Linezolid. Isocratic elution at a flow
rate of 1.2 ml/min was employed on a symmetry C18 column at ambient
temperature. The mobile phase consisted of acetonitrile: 0.1 M acetic acid 50:50
(v/v). The UV detection wavelength was at 254 nm. Linearity was observed in
the concentration range if 100-140 ppm. Retension time for Linezolid was
3.3 min.
This article explains a simple, precise, accurate stability-indicating LC method. It
was developed for the determination of purity of Linezolid drug substance and
drug products in bulk samples and pharmaceutical dosage forms in the presence
of its impurities and degradation products. This method is capable of separating
all the related substances of Linezolid along with the chiral impurity. This method
can also be used for the estimation of assay of Linezolid in drug substance as
well as in drug product. The method was developed using Chiral pak IA
(250mm×4.6 mm, 5 mm) column. A mixture of acetonitrile, ethanol, n- butylamine
and trifluoroaceticacid in 96:4:0.10:0.16 (v/v/v/v) ratio was used as a mobile
phase. The eluted compounds were monitored at 254 nm. Linezolid was
subjected to the stress conditions of oxidative, acid, base, hydrolytic, thermal and
photolytic degradation. The degradation products were well resolved from main
peak and its impurities, proving the stability-indicating power of the method. The
developed method was validated as per International Conference on
Harmonization (ICH) guidelines with respect to specificity, limit of detection, limit
of quantification, precision, linearity, accuracy, robustness and system suitability.
Review of Literature
RVS College of Pharmaceutical Sciences Page 28
14. Spectrophotometric method development and validation for theestimation of Linezolid in tablet dosage Form
- Gadhiya D T, Bagada H L 36
15.Spectrophotometric method for the simultaneous estimation of
Cefixime trihydrate and Linezolid in tablet dosage form
- Patel S A et al37
The method is based on the simultaneous equations for analysis of both thedrugs using
16. Development and validation of stability indicating HPLC method for
simultaneous estimation of Cefixime and Linezolid
- Nidhi S P et al38
For RP-HPLC , the separation was achieved by Phenomenex Luna
C18(250×4.6 mm), 5 µm column using phosphate buffer(pH 7):methanol(60:40
v/v) as mobile phase with flow rate 1 ml/min. The wavelength selected for
quantitation for Cefixime and Linezolid were 276 nm. The retention time of
Cefixime and Linezolid were found to be 3.127 min and 11.986 min
respectively. During forced degradation, the drug was exposed to hydrolysis
(acid and base), H2O2, thermal and photo degradation. The percentage
degradation was found to be 10-20% for both Cefixime and Linezolid in the
given condition
The difference absorption spectra of equimolar solution of Linezolid in 0.1M
hydrochloric acid in sample cell relative to 0.1M sodium hydroxide in
reference cell were taken. Absorption maxima was found 258.27 nm. The drug
followed a linear relationship in the range of 4-20μg/ml; while the correlation
coefficient was 0.999. The recovery was 100.01% ±0.17 the relative standard
deviation for repeatability, intraday and interday was found to be less than 2%.
These methods are found suitable for day to day analysis of linezolid in tablet
dosage form.
0.05M potassium phosphate buffer pH 7.2 as solvent. Cefixime trihydrate has
absorbance maxima at 287.20 nm and Linezolid has absorbance maxima at 250
nm. The linearity was obtained in the concentration range of 2- 22 µg/ml and 2-18
µg/ml for Cefixime and Linezolid, respectively.
Review of Literature
RVS College of Pharmaceutical Sciences Page 29
17.Stability indicating RP-UPLC method development and validation for
assay and content uniformity test of Linezolid with PDA detector.
- Jebaliya H et al. 39
A method for the determination of content uniformity has been developed and
validated for reducing analysis time and maintaining good efficiency. An isocratic
separation of Linezolid was achieved on water Acquity BEH C18, 50×2.1 mm id,
1.7µm particle size column with a flow rate of 0.25 ml/min and using photodiode
array detector to monitor the elute at 245 nm. A mobile phase consisting of
methanol: water (50:50 v/v) to achieve good resolution and retention. The
detector linearity was established by concentrations range of 1.5-80 µg/ml
with a LOD and LOQ of 0.4 and 1.5 µg/ml respectively.
18. Development and validation of method for simultaneous estimation ofCefuroxime and Linezolid by
HPLC Kinjal a patel 40
For RP-HPLC , the separation was achieved by Kromasil C-8 column using
p o t a s s i u m d i h y d r o g e n o r t h o phosphate buffer(pH
4):methanol(60:40 v/v) as mobile phase with f l o w ra t e 0.9 ml/min. The
wavelength selected for quantitation for Cefuroxime and Linezolid were 268 nm.
The retention time of Cefuroxime and Linezolid were found to be 6.860 min
and 8.840 min respectively. The detector linearity of Cefuroxime and Linezolid
were found to be concentrations range of 2.5-12.5 µg/ml and 3-15 µg/ml
respectively. The recoveries of Cefuroxime and Linezolid were found to be
101.6 - 101.90 % and 98.14 -101.15%respectively.

Drug profile
RVS College of Pharmaceutical Sciences Page 30
e
2.2. DRUG PROFILE
2.2.1. CEFUROXIME AXETIL
Molecular structure:
Molecular formula
Molecular weight
CAS No.
Melting point
Boiling point
Density
Flash point
Phase
: C20H22N4O10S
: 510.475 g/mol
: 64544-07-6
: 1730C.
: 804.20C
: 1.76 g/cm3
440.20C.
: Solid (STP).
Appearance
Storage temperature
Solubility in water
: White to almost white crystallin
: -200C freezer.
: Insoluble in water
powder.
Solvent solubility
Drug category
Brand names
: Soluble in methanol, acetone,chloroform
: Anti Microbial
: oractil, Ceftum, altacef, cefuronat, ceftil, forcef
IUPAC Name: 1-acetyloxyethyl (6R,7R)-3-(carbamoyloxymethyl)-7-[[(2Z)-2-(furan-2-yl)-2-
methoxyiminoacetyl]amino]-8-oxo-5-thia-1-azabicyclo[4.2.0]oct-2-ene-2-carboxylate
Drug profile
RVS College of Pharmaceutical Page 31
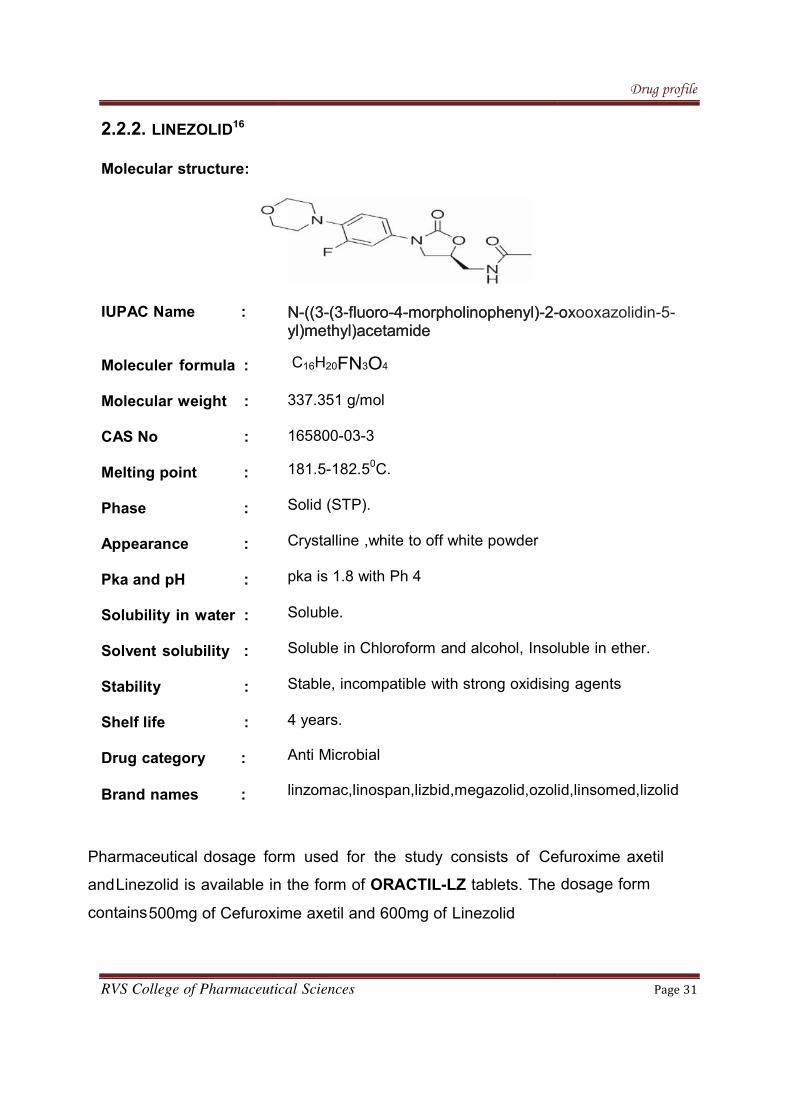
2.2.2. LINEZOLID16
Molecular structure:
IUPAC Name :
Moleculer formula :
Molecular weight :
CAS No :
Melting point :
Phase :
Appearance :
Pka and pH :
Solubility in water :
Solvent solubility :
Stability :
Shelf life :
Drug category :
Brand names :
Nyl
C
33
16
18
S
C
pka
S
S
St
4
A
lin
Drug profile
utical Sciences Page 31
N-((3-(3-fluoro-4-morpholinophenyl)-2-oxoyl)methyl)acetamide
C16H20FN3O4
337.351 g/mol
165800-03-3
181.5-182.50C.
Solid (STP).
Crystalline ,white to off white powder
pka is 1.8 with Ph 4
Soluble.
Soluble in Chloroform and alcohol, Insoluble
Stable, incompatible with strong oxidising a
4 years.
Anti Microbial
linzomac,linospan,lizbid,megazolid,ozolid,lin
Drug profile
Page 31
oluble in ether.
ing agents
olid,linsomed,lizolid
N-((3-(3-fluoro-4-morpholinophenyl)-2-oxooxazolidin-5-yl)methyl)acetamide
Pharmaceutical dosage form used for the study consists of Cefuroxime axetil
andLinezolid is available in the form of ORACTIL-LZ tablets. The dosage form
contains500mg of Cefuroxime axetil and 600mg of Linezolid
Objective of Study
3.1 AIM AND OBJECTIVE
As per the literature review, there is no analytical methods reported for the
Hence,there is a need for suitable RP-HPLC and HPTLC Method for routine
analysis of Cefuroxime axetil and Linezolid in the combined formulation.
The work was an attempts to develop simple, rapid, and sensitive analytical
methods for the simultaneous estimation of Cefuroxime axetil and Linezolid in the
combined formulation in accordance with ICH Q2B guidelines and to extend the
method for routine analysis.
method for the simultaneous estimation of Cefuroxime axetil and Linezolid in the
combined tablet dosage form by RP-HPLC and HPTLC method.
STEP-1: Study of physiochemical properties of the drug
STEP-2: Selection of chromatographic condition
RVS College of Pharmaceutical Sciences Page 32
estimation of Cefuroxime axetil and Linezolid in combined pharmaceutical dosage
form by HPTLC. Various publications are available regarding the UV simultaneous
estimation and RP-HPLC method development of Cefuroxime axetil and Linezolid,
either alone or in combination with other drugs in pharmaceutical dosage form.
3.2 PLAN OF WORK
Present work is to develop and validate a new simple, rapid, and sensitive
Wave length,mobile phase,column,flow rate )
STEP-3: Optimization of the method
STEP-4: Study of the system suitability parameters
STEP-5: Validation of the proposed method
Materials and methods- HPLC
RVS College of Pharmaceutical Sciences Page 33
4. MATERIALS AND METHODS
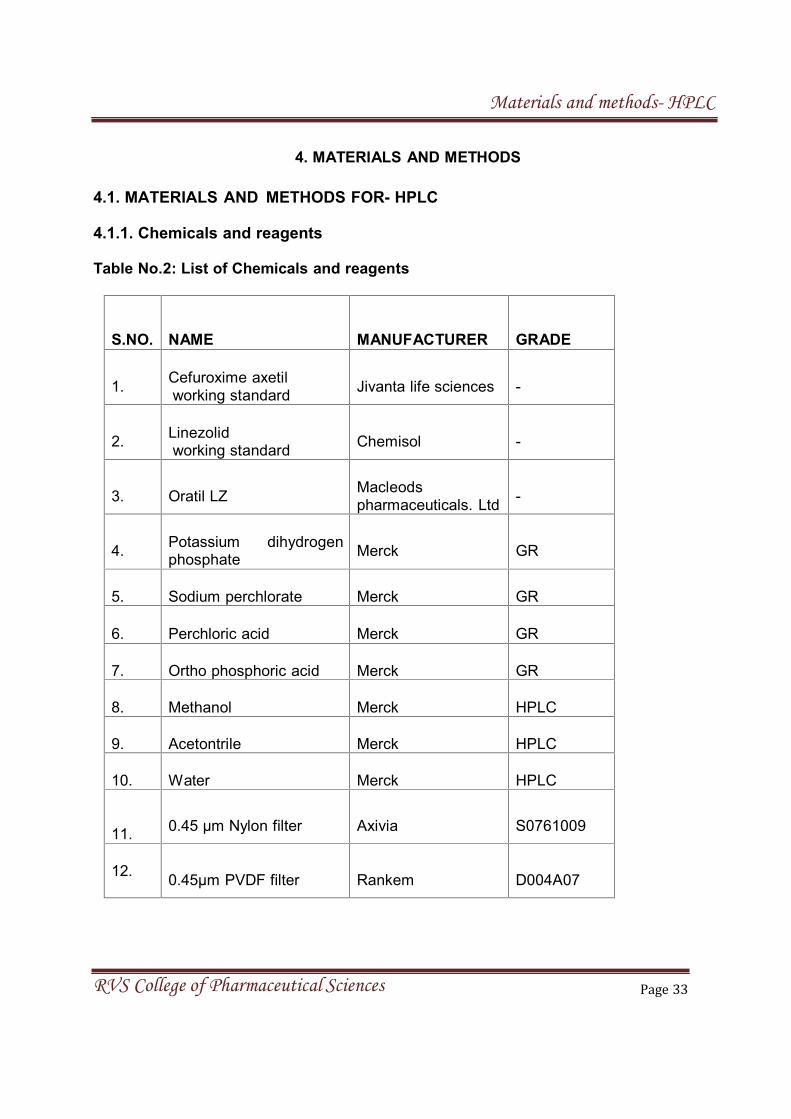
S.NO. NAME MANUFACTURER GRADE
1.Cefuroxime axetil
2.Linezolidworking standard
Chemisol -
3. Oratil LZMacleodspharmaceuticals. Ltd
-
4.Potassium dihydrogenphosphate
Merck GR
5. Sodium perchlorate Merck GR
6. Perchloric acid Merck GR
7. Ortho phosphoric acid Merck GR
8. Methanol Merck HPLC
9. Acetontrile Merck HPLC
10. Water Merck HPLC
11.0.45 µm Nylon filter Axivia S0761009
4.1. MATERIALS AND METHODS FOR- HPLC
4.1.1. Chemicals and reagents
Table No.2: List of Chemicals and reagents
Jivanta life sciences -working standard
12.0.45µm PVDF filter Rankem D004A07
Materials and methods- HPLC
RVS College of Pharmaceutical Sciences Page 34
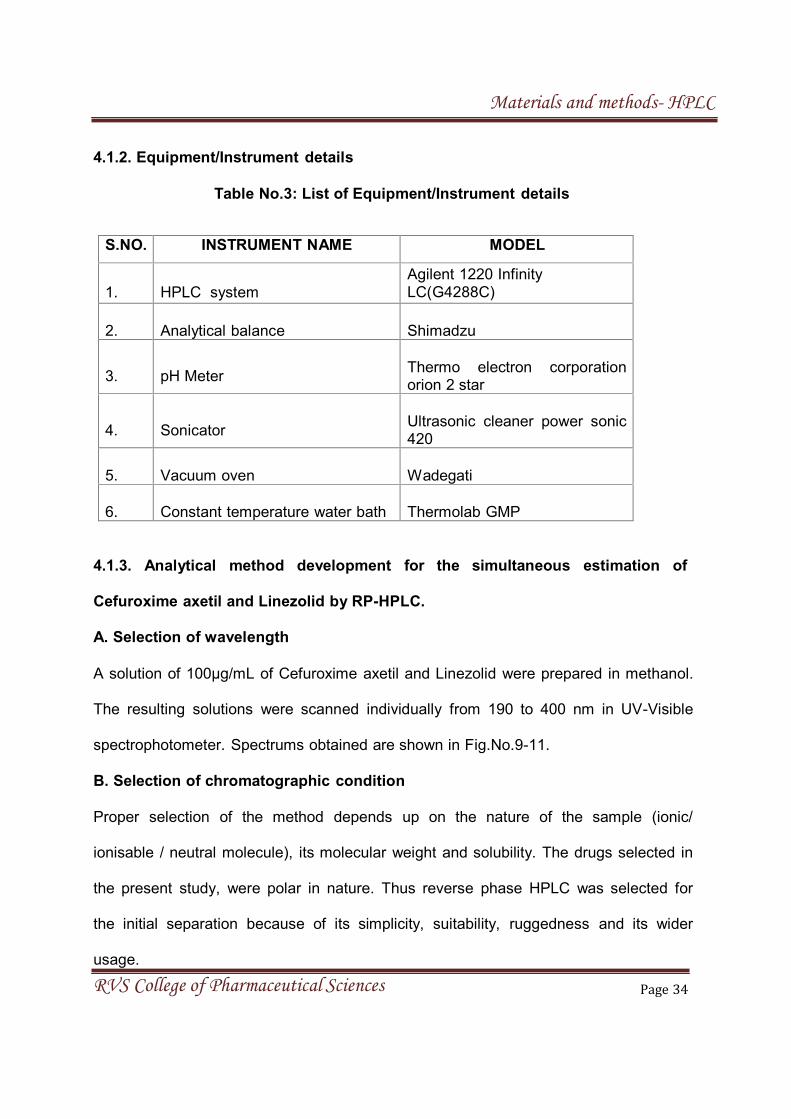
4.1.2. Equipment/Instrument details
Table No.3: List of Equipment/Instrument details
S.NO. INSTRUMENT NAME MODEL
1. HPLC system
Agilent 1220 InfinityLC(G4288C)
2. Analytical balance Shimadzu
3. pH MeterThermo electron corporationorion 2 star
4. SonicatorUltrasonic cleaner power sonic420
5. Vacuum oven Wadegati
6. Constant temperature water bath Thermolab GMP
4.1.3. Analytical method development for the simultaneous estimation of
Cefuroxime axetil and Linezolid by RP-HPLC.
A. Selection of wavelength
A solution of 100µg/mL of Cefuroxime axetil and Linezolid were prepared in methanol.
The resulting solutions were scanned individually from 190 to 400 nm in UV-Visible
spectrophotometer. Spectrums obtained are shown in Fig.No.9-11.
B. Selection of chromatographic condition
Proper selection of the method depends up on the nature of the sample (ionic/
ionisable / neutral molecule), its molecular weight and solubility. The drugs selected in
the present study, were polar in nature. Thus reverse phase HPLC was selected for
the initial separation because of its simplicity, suitability, ruggedness and its wider
usage.
Materials and methods- HPLC
RVS College of Pharmaceutical Sciences Page 35
C. Initial separation condition
The mobile phase selected to elute the drug from the stationary phase was acetonitrile
and phosphate buffer, because of its favorable UV transmittance, low viscosity and low
back pressure.
D. Effect of buffer
Potassium di-hydrogen phosphate buffer was selected because better and higher
intensity of response was obtained.
E. Effect of pH
The mobile phase pH was optimized using different pH, ranging from 2.0 to 3.0 (pH is
adjusted with Ortho phosphoric acid), at a flow rate of 0.5 mL/min and symmetry
Xterra C18 column as the stationary phase. The peak shape and resolution was
observed at different pH.
F. Effect of ionic strength
The phosphate buffer was prepared in different strengths such as 0.01M, 0.025M,
0.05M of Potassium di-hydrogen phosphate at pH 2.8. The retention time was
decreased by increasing the buffer strength. For the present study, the optimized
mobile phase composition phosphate buffer of pH 2.8: acetonitrile (35:65v/v) was
selected, because of the retention times of Cefuroxime axetil and Linezolid were
effected due to slight change of ionic strength during analysis.
G. Effect of nature of stationary phase
The following stationary phases were used and the chromatograms were recorded.
1. Agilent zorbax SB C18 (4.6 x 150mm, 5m)
2. Phenomex-kinetex-XDB C18 (4.6 x 100mm, 5m)
Materials and methods- HPLC
RVS College of Pharmaceutical Sciences Page 36
3. Symmetry C8 (4.6 x 100mm, 5m)
4. Symmetry XterraC18 column.
With Agilent zorbax SB C18 and Phenomex-kinetex-XDB-C18 the results obtained
were not satisfactory because peak tailing was observed and also the resolution
between the peaks was comparatively lesser than that with symmetry XterraC18. With
XterraC18 column the peak shape and resolution observed were good. Therefore,
Xterra C18 column was used for further studies.
Preparation of Placebo:
The amount of powdered inactive ingredient supposed to be present in 10 tablets were
accurately weighed and transferred in to 100 ml volumetric flask, 70 ml of diluent was
added and shaken by mechanical stirrer and sonicated for about 30 minutes by
shaking at intervals of five minutes and was diluted up to the mark with diluent and
allowed to stand until the residue settles before taking an aliquot for dilution. 0.6 ml of
upper clear solution was transferred to a 100 ml volumetric flask and diluted with
diluent up to the mark and the solution was filtered through 0.45 m filter before
injecting into HPLC system.
Preparation of Phosphate buffer:
7.0 grams of KH2PO4 was weighed into a 1000ml beaker, dissolved and diluted to
1000ml with HPLC water. The flask was shaken until the particles get dissolved and
volume was made up to the mark with Water. The pH was adjusted to 2.8 with ortho
phosphoric acid.
Materials and methods- HPLC
RVS College of Pharmaceutical Sciences Page 37
TRIALS
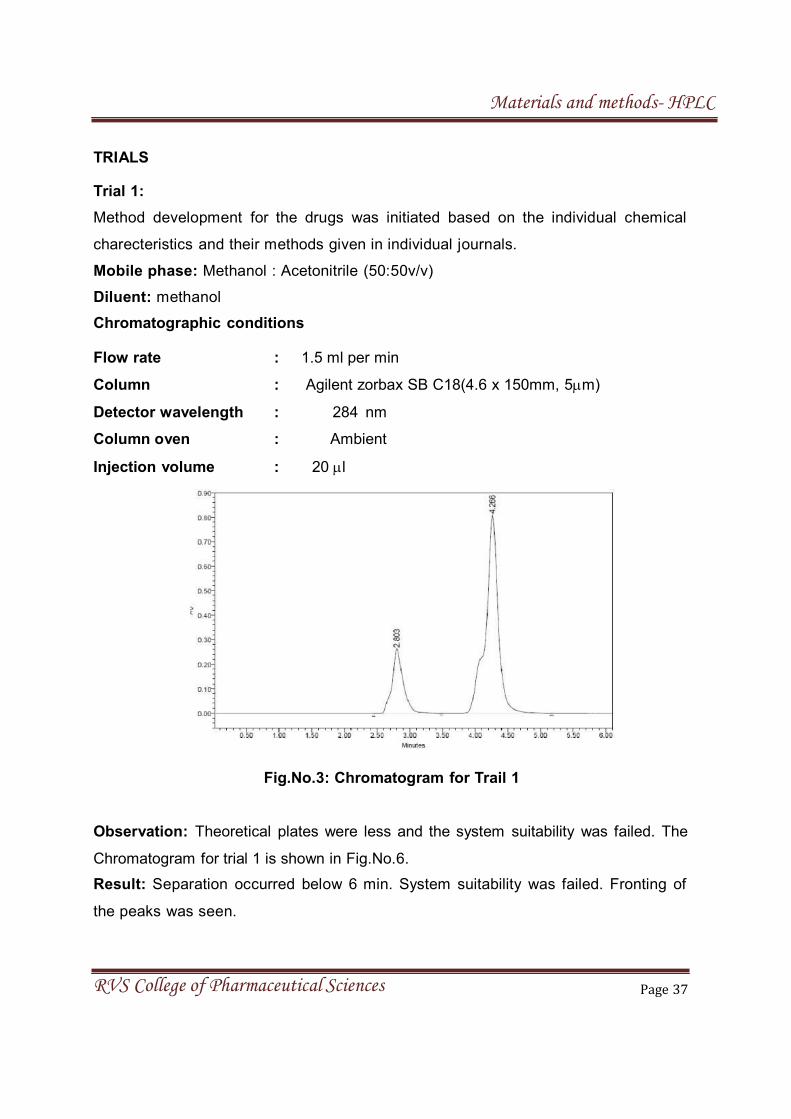
Trial 1:
Method development for the drugs was initiated based on the individual chemical
charecteristics and their methods given in individual journals.
Mobile phase: Methanol : Acetonitrile (50:50v/v)
Diluent: methanol
Chromatographic conditions
Flow rate : 1.5 ml per min
Column : Agilent zorbax SB C18(4.6 x 150mm, 5m)
Detector wavelength : 284 nm
Column oven : Ambient
Injection volume : 20 l
Fig.No.3: Chromatogram for Trail 1
Observation: Theoretical plates were less and the system suitability was failed. The
Chromatogram for trial 1 is shown in Fig.No.6.
Result: Separation occurred below 6 min. System suitability was failed. Fronting of
the peaks was seen.

Materials and methods- HPLC
RVS College of Pharmaceutical Sciences Page 38
Trail 2:
Inorder to improve resolution and remove fronting of the peak and avoid unwanted
peaks interfering, column and mobile phase was changed and again the same
experiment was performed.
Mobile phase: Phosphate buffer (pH 3.5): Methanol (50:50v/v)
Diluent: Methanol
Chromatographic conditions
Flow rate : 1.5 ml per min
Column : Phenomex-kinetex-XDB-C18 (4.6 x 100mm, 5m)
Detector wavelength : 284 nm
Column oven : Ambient
Injection volume : 20 l
Fig.No.4: Chromatogram for trial 2
Observation: Resolution was less and the system suitability was failed due to the
poor column performance. The Chromatogram for trial 2 is shown in Fig.No.7.
Result: Blunt peaks with less resolution were obtained due to the poor column
performance. Hence experiment was again repeated by changing the column.
Materials and methods- HPLC
RVS College of Pharmaceutical Sciences Page 39
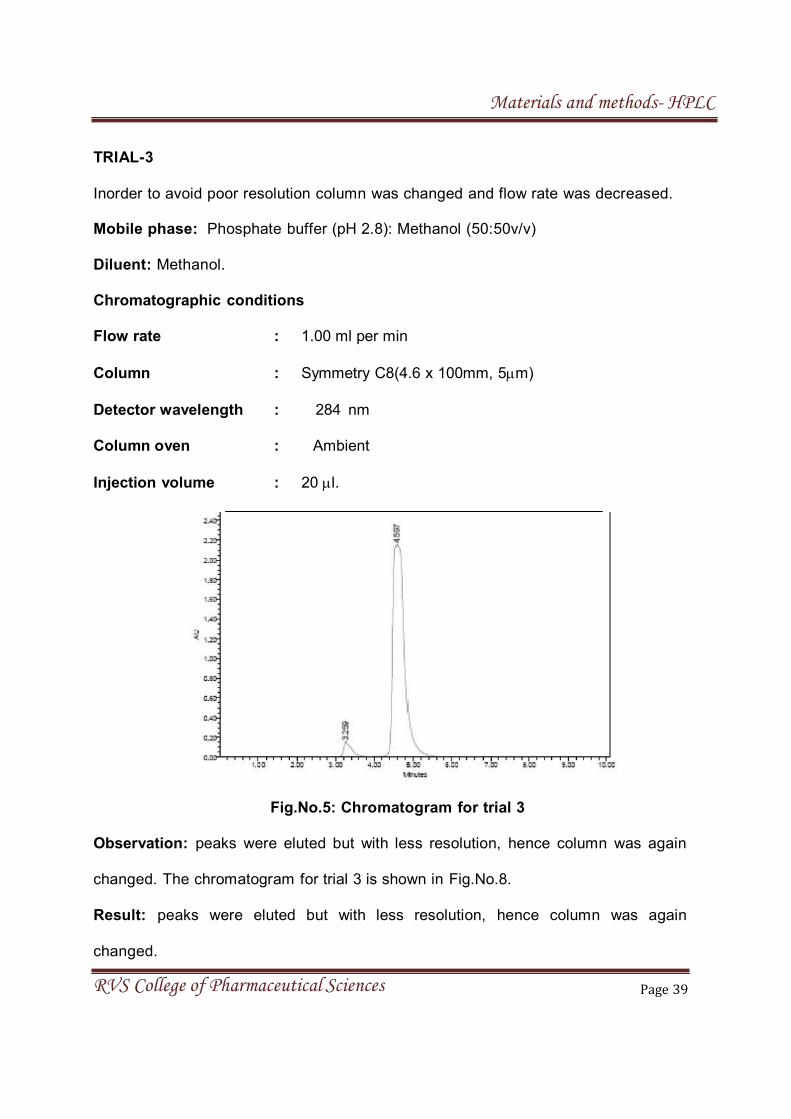
TRIAL-3
Inorder to avoid poor resolution column was changed and flow rate was decreased.
Mobile phase: Phosphate buffer (pH 2.8): Methanol (50:50v/v)
Diluent: Methanol.
Chromatographic conditions
Flow rate : 1.00 ml per min
Column : Symmetry C8(4.6 x 100mm, 5m)
Detector wavelength : 284 nm
Column oven : Ambient
Injection volume : 20 l.
Fig.No.5: Chromatogram for trial 3
Observation: peaks were eluted but with less resolution, hence column was again
changed. The chromatogram for trial 3 is shown in Fig.No.8.
Result: peaks were eluted but with less resolution, hence column was again
changed.
Materials and methods- HPLC
RVS College of Pharmaceutical Sciences Page 40
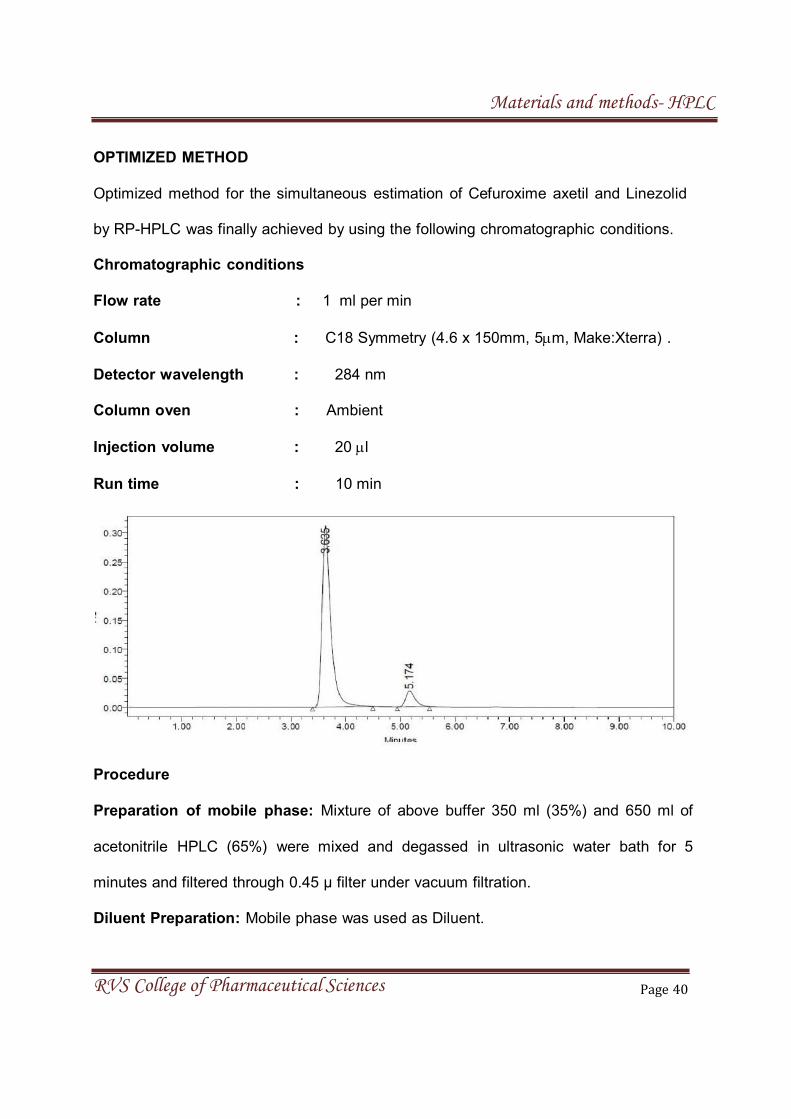
OPTIMIZED METHOD
Optimized method for the simultaneous estimation of Cefuroxime axetil and Linezolid
by RP-HPLC was finally achieved by using the following chromatographic conditions.
Chromatographic conditions
Flow rate : 1 ml per min
Column : C18 Symmetry (4.6 x 150mm, 5m, Make:Xterra) .
Detector wavelength : 284 nm
Column oven : Ambient
Injection volume : 20 l
Run time : 10 min
Procedure
Preparation of mobile phase: Mixture of above buffer 350 ml (35%) and 650 ml of
acetonitrile HPLC (65%) were mixed and degassed in ultrasonic water bath for 5
minutes and filtered through 0.45 µ filter under vacuum filtration.
Diluent Preparation: Mobile phase was used as Diluent.
Materials and methods- HPLC
RVS College of Pharmaceutical Sciences Page 41
Preparation of standard solution (Mixed standard) : 10 mg of Cefuroxime axetil
and 10mg of Linezoild working standards were accurately weighed and transferred
into a 100ml clean dry volumetric flask add about 70ml of diluent was added and
sonicated to dissolve it completely and the volume was made up to the mark with the
same solvent. (Stock solution) Further 1.2ml of Cefuroxime axetil & 3ml of Linezolid
was pippeted from the above stock solution into a 10ml volumetric flask and diluted up
to the mark with diluent.
Preparation of sample solution
10 Tablets of Cefuroxime axetil and Linezolid were weighed and powdered in glass
mortar. The powder equivalent to the amount of active ingredient present in 10 tablets
(156.8mg) was transferred into a 100 ml clean dry volumetric flask, 70 ml of diluent
was added to it and was shaken by mechanical stirrer and sonicated for about 30
minutes by shaking at intervals of five minutes each and was diluted up to the mark
with diluent and allowed to stand until the residue settles before taking an aliquot for
further dilution (stock solution). 0.6ml of upper clear solution was transferred to a 10 ml
volumetric flask and diluted with diluent up to the mark and the solution was filtered
through 0.45 m filter before injecting into HPLC system.
Test Procedure
20 µl of the standard, sample, blank and placebo preparations in duplicate were
injected separately into HPLC system and the peak responses for Cefuroxime axetil
and Linezolid were measured. The quantities in mg of Cefuroxime axetil and Linezolid
were calculated per tablet taken.The developed RP-HPLC method for the
simultaneous estimation of Cefuroxime axetil and Linezolid was carried out on
Materials and methods- HPLC
RVS College of Pharmaceutical Sciences Page 42
XterraC18, 150 mm × 4.6 mm, 5 m column in isocratic mode using mobile phase
composition of phosphate buffer (pH 2.8 with ortho phosphoric acid) : acetonitrile [35 :
65, v / v] with flow rate of 1 ml / min at 284nm. The asymmetric factor was found to be
1.58 for Cefuroxime axetil and 1.47 for Linezolid
Calculation: The amount of drug present was calculated by using the following
formula:
AT WS DT P Avg. Wt
Assay % = -------------- x ---------- x --------- x ---------- x ------------------ X 100
AS DS WT 100 Label Claim
Where
AT = average area counts of sample preparation.
As = average area counts of standard preparation.
WS = Weight of working standard taken in mg.
P = Percentage purity of working standard
LC = Label claim of drug in mg/ml.
The individual chromatograms of Cefuroxime axetil and Linezolid, standard,
sample, blank chromatograms for optimized method are shown in Fig.No.12-
16.Results are tabulated in Table .No.5.
4.3. METHOD VALIDATION
The objective of validation of an analytical procedure is to demonstrate that it is
suitable for its intended purpose. According to ICH Q2B guidelines, typical analytical
performance characteristics that should be considered in the validation of the types of
methods are:
Materials and methods- HPLC
RVS College of Pharmaceutical Sciences Page 43
1. Specificity.
2. Linearity.
3. Accuracy.
4. Precision.
5. Limit of detection.
6. Limit of quantification.
7. Robustness.
8. System suitability.
1. SPECIFICITY
A) Cefuroxime axetil and Linezolid identification
Solutions of standard and sample were prepared as per test procedure and injected
into the HPLC system. The recorded chromatograms are shown in Fig.No.17 and 18.
Acceptance criteria
Chromatogram of standard and sample should be identical with near retention time.
B) Placebo interference
A study to establish the interference of placebo was conducted. A sample of placebo
was injected into the HPLC system as per the test procedure. The chromatogram of
placebo is shown in Fig.No.19.
Acceptance criteria
Chromatogram of placebo should not show any peak at the retention time of
analyte peak.
There is no interference due to placebo at the retention time of analyte. Hence
the method is specific.
Materials and methods- HPLC
RVS College of Pharmaceutical Sciences Page 44
C) Blank interference
A study to establish the interference of blank was conducted. Diluent was injected into
HPLC system as per the test procedure. The chromatogram of blank is shown in
Fig.No.20.
Acceptance criteria
Chromatogram of blank should not show any peak at the retention time of analyte
peak. There is no interference due to blank at the retention time of analyte. Hence the
method is specific.
2. LINEARITY
Preparation of stock solution
10 mg of cefuroxime axetil and 10mg of linezolid working standards were accurately
weighed and transferred into a 100ml clean dry volumetric flask and about 70ml of
diluent was added and sonicated to dissolve it completely and the volume was made
up to the mark with the same solvent.
Preparation of Level – I (4ppm of Cefuroxime axetil and 10ppm of Linezolid)
0.4ml and 1 ml of stock solution was taken in 10ml of volumetric flask diluted up to the
mark with diluent.
Preparation of Level – II (8ppm of Cefuroxime axetil and 20ppm of Linezolid)
0.8ml and 2 ml of stock solution was taken in 10ml of volumetric flask diluted up to the
mark with diluent.
Preparation of Level – III (12ppm of Cefuroxime axetil and 30ppm of Linezolid)
1.2ml and 3 ml of stock solution was taken in 10ml of volumetric flask diluted up to the
mark with diluent.

Materials and methods- HPLC
RVS College of Pharmaceutical Sciences Page 45
Preparation of Level – IV (16ppm of Cefuroxime axetill and 40ppm of Linezolid)
1.6ml and 4 ml of stock solution was taken in 10ml of volumetric flask diluted up to the
mark with diluent.
Preparation of Level – V (20ppm of Cefuroxime axetill and 50ppm of Linezolid
2.0ml and 5 ml of stock solution were taken in 10ml of volumetric flask diluted up to the
mark with diluent.
Procedure
Each level solution was injected into the chromatographic system and the peak area
was measured. A graph of peak area versus concentration (on X-axis concentration
and on Y-axis Peak area) was plotted and the correlation coefficient was calculated.
The linearity of the method was demonstrated over the concentration range of 10-50 µg /
ml. Aliquots of10, 20, 30, 40 and 50 µg / ml were prepared from sample solution and
labeled as solution 1, 2, 3, 4 and 5 respectively. The solutions were injected in to HPLC
system as per test procedure. The Chromatograms are shown in Fig.No.21-
25.Acalibration curve was plotted for concentration v/s peak area and is shown in the
Fig.No.26 and 27.The results are tabulated in Table No. 6 and 7.
Acceptance criteria
Correlation Coefficient should be not less than 0.9990.
% RSD of peak area’s for Solution 1, 2, 3, 4 and 5 should be not more than 2.0 %.
3. ACCURACY
Assay was performed in triplicate for various concentrations of cefuroxime axetil and
linezolid equivalent to 50, 100, and 150 % of the standard amount was injected into
the HPLC system per the test procedure.
Materials and methods- HPLC
RVS College of Pharmaceutical Sciences Page 46
Preparation of Standard stock solution:
10 mg of cefuroxime axetil and 10mg of linezolid working standards were accurately
weighed and transferred into a 100ml clean dry volumetric flask about 70ml of diluent
was added and sonicated to dissolve it completely and volume was made up to the
mark with the same solvent (Stock solution).Further 1.2ml of cefuroxime axetil and 3
ml of linezolid of the above stock solutions were pipetted into a 10ml volumetric flask
and diluted up to the mark with diluent.
Preparation Sample solutions:
For preparation of 50% solution (with respect to target Assay concentration)
5.0 mg of cefuroxime axetil and 5.0mg of linezolid working standards were accurately
weighed and transferred into a 10ml clean dry volumetric flask about 7ml of diluent
was added and sonicated to dissolve it completely and volume was made up to the
mark with the same solvent (Stock Solution).Further 1.2ml of cefuroxime axetil and 3
ml of linezolid of the above stock solution was pipetted into a 10ml volumetric flask and
diluted up to the mark with diluent.
For preparation of 100% solution (with respect to target Assay concentration)
10 mg of cefuroxime axetil and 10 mg of linezolid working standards were
accurately weighed and transferred into a 10ml clean dry volumetric flask about 7ml
of diluent was added and sonicated to dissolve it completely and volume was made
up to the mark with the same solvent (Stock solution).Further 1.2ml of cefuroxime
axetil and 3ml of linezolid of the above stock solutions were pipetted into a 10ml
volumetric flask and diluted up to the mark with diluent.
Materials and methods- HPLC
RVS College of Pharmaceutical Sciences Page 47
For preparation of 150% solution (With respect to target Assay concentration)
15.3mg of cefuroxime axetil and 14.8 mg of of linezolid working standards were
accurately weighed and transferred into a 10ml clean dry volumetric flask , about 7ml
of diluent was added and sonicated to dissolve it completely and volume was made
up to the mark with the same solvent (Stock solution).Further 1.2ml of cefuroxime
axetil l and 3ml of of linezolid of the above stock solution was pipetted in to a 10ml
volumetric flask and dilute up to the mark with diluent.
Procedure
Standard solution, Accuracy -50%, Accuracy -100% and Accuracy -150% solutions
were injected in to HPLC system. Amount found and amount added for cefuroxime
axetil and of linezolid, individual recovery and mean recovery values were also
calculated. The average % recovery of cefuroxime axetil and linezolid,was calculated
and the Chromatograms are shown inFig.No.28-31.Results are tabulated inTable No.8
and 9.
Acceptance criteria
The mean % recovery of the cefuroxime axetil and linezolid, at each spike level should
be not less than 98.0 % and not more than 102.0 %.
4. PRECISION
a) REPEATABILITY
Preparation of stock solution (solution A)
10 mg of cefuroxime axetil and 10mg of linezolid, working standards were accurately
weighed and transferred into a 100ml clean dry volumetric flask about 70ml of diluent
was added and sonicated to dissolve it completely and volume was made up to the
Materials and methods- HPLC
RVS College of Pharmaceutical Sciences Page 48
mark with the same solvent. Further 1.2ml of cefuroxime axetil and 3ml of linezolid, of
the solution A was pipetted into a 10ml volumetric flask and diluted up to the mark with
diluent.
Procedure
The standard solution was injected for five times and the area was measured for all five
injections in HPLC. The %RSD for the area of five replicate injections was found to be
within the specified limits.The chromatograms are shown in Fig.No.32.The results are
tabulated in Table No.10 and 11.
Acceptance criteria
All individual assays of cefuroxime axetil and linezolid, tablets should be within
98 % - 102 %.
Relative standard deviation of % Assay results should not be more than 2.0.
b) INTERMEDIATE PRECISION (analyst to analyst variability): To evaluate the
intermediate precision (also known as the ruggedness) of the method precision was
performed on different days by using different columns of same dimensions.
Preparation of stock solution (solution A)
10 mg of cefuroxime axetil and 10mg of linezolid, working standards were accurately
weighed and transferred into a 100ml clean dry volumetric flask about 70ml of diluent
was added and sonicated to dissolve it completely and volume was made up to the
mark with the same solvent. Further 1.2ml of cefuroxime axetil and 3ml of linezolid of
the solution A was pipetted out in to a into a 10ml volumetric flask and diluted up to the
mark with diluent.
Materials and methods- HPLC
RVS College of Pharmaceutical Sciences Page 49
Procedure
The standard solution was injected for five times and the areas for all five injections were
measured in HPLC. The %RSD for the area of five replicate injections was found to be
within the specified limits.Two analysts as per test method conducted the study.
Chromatograms are shown in Fig.No.33. For analyst-1 refer precision (repeatability)
results and the results for analyst-2 are tabulated inTable No.12-15.
Acceptance criteria
All the individual assays of cefuroxime axetil and linezolid tablets should be within
98 % - 102 %.
Relative standard deviation of % assay results should not more than 2.0 % by both
the analysts.
5. LIMIT OF DETECTION (LOD)
Cefuroxime axetil
Preparation of 12µg/ml solution:10mg of cefuroxime axetil working standard was
accurately weighed and transferred to100ml clean dry volumetric flask, about 70ml of
diluent was added and sonicated to dissolve it completely and volume was made up to
the mark with the same solvent (Stock solution).Further 1.2ml of the above stock
solution was pipetted into a 10mlvolumetric flask and diluted up to the mark with
diluent.
Preparation of 0.25% solution at specification level (0.003µg/ml solution)
Further 1ml of the above stock solution was pipetted into a 10ml volumetric flask
anddiluted up to the mark with diluent. Further 1ml of the above stock solution
waspipetted into a 10ml volumetric flask and diluted up to the mark with diluent.
Materials and methods- HPLC
RVS College of Pharmaceutical Sciences Page 50
0.25mlof 1µg/ml solution was pipetted into a 10 ml of volumetric flask and diluted up to
themark with diluent.
Linezolid
Preparation of 30µg/ml solution
10mg of linezolid working standard was accurately weighed and transferred into
a100ml clean dry volumetric flask, about 70ml of diluent was added and sonicated to
dissolve it completely and volume was made up to the mark with the same solvent
(Stock solution). Further 3ml of the above stock solution was pipetted into a 10ml
volumetric flask and diluted up to the mark with diluent.
Preparation of 0.3% solution at specification level (0.09 µg/ml solution)
Further1ml of the above stock solution was pipetted into a 10ml volumetric flask and
diluted up to the mark with diluents. 0.3ml of 1µg/ml solution was pipetted into a 10 ml
of volumetric flask and diluted up to the mark with diluent. Chromatograms which were
recorded are shown in Fig.No.34 and 35.
The LOD is determined by the formula
LOD =S/N
Where
N = Average Baseline Noise obtained from Blank
S = Signal Obtained from LOD solution (0.25% of target assay concentration)
Acceptance Criteria: S/N Ratio value shall be not more than 3 for LOD solution.
6. LIMIT OF QUANTIFICATION (LOQ)
Cefuroxime axetil
Preparation of 12µg/ml solution
Materials and methods- HPLC
RVS College of Pharmaceutical Sciences Page 51
10mg of cefuroxime axetil working standard was accurately weighed and transferred
into a 100ml clean dry volumetric flask, about 70ml of diluent was added and
sonicated to dissolve it completely and the volume was made up to the mark with the
same solvent (Stock solution). Further 1.2ml of the above stock solution was pipetted
into a 10ml volumetric flask and diluted up to the mark with diluent.
Preparation of solution at specification level (0.012µg/ml solution)
Further 1ml of the above stock solution was pipetted into a 10ml volumetric flask and
diluted up to the mark with diluent.1ml of solution was pipetted into a 10 ml of
volumetric flask and diluted up to the mark with diluent.
Linezolid
Preparation of 30µg/ml solution
10mg of Linezolid working standard was accurately weighed and transferred into100ml
clean dry volumetric flask, about 70ml of diluents was added and sonicated to dissolve
it completely and the volume was made up to the mark with the samesolvent (Stock
solution).Further 3ml of the above stock solution was pipetted into a 10ml volumetric
flask and diluted up to the mark with diluent.
Preparation of 1.0% solution at specification level (0.3µg/ml solution):
Further 1ml of the above stock solution was pipetted into a 10ml volumetric flask and
diluted up to the mark with diluent. 1.0ml of 1µg/ml solution was pipetted into a 10 ml
of volumetric flask and diluted up to the mark with diluent. Chromatograms which were
recorded are shown in Fig.No.36 and 37.
LOQ is determined by the following formula:
LOQ =S/N
where
Materials and methods- HPLC
RVS College of Pharmaceutical Sciences Page 52
N = Average Baseline Noise obtained from Blank.
S = Signal Obtained from LOQ solution (1% of target assay concentration).
Acceptance Criteria: S/N Ratio value shall be 10 for LOQ solution.
7. ROBUSTNESS
The robustness of the proposed method was determined by analysis of aliquots from
homogenous lots by differing physical parameters like flow rate and mobile phase
composition, temperature variations which may differ but the responses were still
within the specified limits of the assay.
a) Effect of variation of flow rate
A study was conducted to determine the effect of variation in flow rate. The flow rate
was varied at 0.4ml/min to 0.6 ml/min. Standard solution 12ppm of cefuroxime axetil
and 30ppm of linezolid was prepared and analysed using the varied flow rates along
with method flow rate. The results are summarized. On evaluation of the above
results, it can be concluded that the variation in flow rate affected the method
significantly. Hence it indicates that the method is robust even by change in the flow
rate ±10%.The method is robust only in less flow condition. The effect of variation of
flow rate was evaluated. The Chromatograms are shown in Fig.No.38 and 39. The
results are tabulated in the Table No.16 and 17.
Acceptance criteria
The tailing factor for Cefuroxime axetil and Linezolid should not be more than
2.0 for Variation in flow.
The % RSD of asymmetry and retention time for Cefuroxime axetil and
Linezolid should not be more than 2.0 % for variation in flow.
Materials and methods- HPLC
RVS College of Pharmaceutical Sciences Page 53
b) Effect of variation of mobile phase composition
A study was conducted to determine the effect of variation in mobile phase ratio by
changing the ratio of mobile phase. The organic composition in the Mobile phase was
varied from 55% to 70%.
Standard solution 12 µg/ml of cefuroxime axetil and 30µg/ml of linezolid was prepared
and analysed using the varied mobile phase composition along with the actual mobile
phase composition in the method. Standard solution was prepared and injected into
the HPLC system.The chromatograms which are recorded are shown in Fig.No.40and
41. The retention time values are measured and are tabulated in Table No.18 and 19.
Acceptance criteria
Tailing Factor of cefuroxime axetil and linezolid drugs should not be more than
2.0 for Variation in composition of mobile phase.
The % RSD of tailing factor and retention times of cefuroxime axetil and
linezolid drugs should be not more than 2.0 for Variation in composition of
mobile phase.
8. SYSTEM SUITABILITY
Sample solution of cefuroxime axetil and linezolid were injected three times into HPLC
system as per test procedure. The system suitability parameters were evaluated from
standard chromatograms obtained, by calculating the % RSD of retention times, tailing
factor, theoretical plates and peak areas from three replicate injections.
Materials and methods- HPLC
RVS College of Pharmaceutical Sciences Page 54
Acceptance criteria
The % RSD for the retention times of principal peak from 3 replicate injections of
each Standard solution should be not more than 2.0 %
The number of theoretical plates (N) for the cefuroxime axetil and linezolid peaks
should be not less than 2000.
The Tailing factor (T) for the cefuroxime axetil and linezolid peaks should be not
more than 2.0.
From the system suitability studies it was observed that all the parameters were within
limit. Hence it was concluded that the instrument, reagents and column were suitable
to perform the assay. Chromatogram is shown inFig.No.42. The results are tabulated
in Table No.20 and 21.
Materials and methods- HPTLC
RVS College of Pharmaceutical Sciences Page 55
4.2. MATERIALS AND METHODS FOR HPTLC
4.2.1 MATERIALS
The reagents and chemicals used for the experimental works are as follows:
Reference Standards of Cefuroxime axetil and Linezolid.
Marketed combination product of Cefuroxime axetil and Linezolid.
(Oratil LZ containing Cefuroxime axetil 500 mg and Linezolid 600 mgmarketed by Macleods Pharma Private Limited .)
Methanol HPLC grade obtained from Merck Specialities (P) Ltd, Mumbai.
Toluene HPLC grade obtained from Merck Specialities (P) Ltd, Mumbai.
Hexane HPLC grade obtained from Merck Specialities (P) Ltd, Mumbai.
4.3.2 EQUIPMENT USED
Application mode : CAMAG Linomat IV Development mode
CAMAG Twin Trough chamber Scanner : TLC scanner with WINCATS software
Visualization : CAMAG UV Cabinet
Quantification : CAMAG Video Densitometer
Stationary phase : TLC plates (20 × 10 cm with 250 µm
thickness; E. Merck, Darmstadt, Germany
4.3.3.METHODOLOGY ADOPTED
1. Preparation of standard solutions of Cefuroxime axetil (CEF) and Linezolid (LIN)
2. Development of solvent system.
3. Development of chromatogram.
4. Determination of Rf values of CEF and LIN.
5. Preparation of calibration curves of CEF and LIN and estimation of CEF and
LIN in dosage form.
6 . Validation of the proposed method.
Materials and methods- HPTLC
RVS College of Pharmaceutical Sciences Page 56
1. Preparation of standard solutions
a) Stock solution of Cefuroxime axetil RS in methanol
Weighed accurately 50 mg Cefuroxime axetil RS and transferred to a 50
ml standard flask. It was dissolved in HPLC grade methanol and made up to
the volume. This had a concentration of 1 mg/ml.
b) Stock solution of Linezolid RS in methanol
Weighed accurately 50 mg of Linezolid RS and transferred to a 50 ml standard
flask. It was dissolved in HPLC grade methanol and made up to the volume.
This solution had a concentration of 1 mg/ml.
c) Preparation of standard drug mixture
50 mg of Cefuroxime axetil RS and 60 mg of Linezolid RS were weighed
separately and transferred into a 100 ml standard flask. The drug mixture was
allowed to dissolve in sufficient quantity of methanol by shaking for 15 min and
the volume was made up to the mark with methanol to obtain a mixture with
concentration of 500 μg/ml of Cefuroxime axetil and 600 μg/ml of Linezolid.
2. Development of solvent system
The mobile phase was selected based on the polarity of analytes (Cefuroxime
axetil and Linezolid) and adsorption properties of silica gel plates. The
solubility of drug played a significant role in the selection of suitable solvent
system.
The suitable solvent system was selected by a series of trial and error
process. Different solvent systems were used in different proportions and the
summary is listed in Table 21.
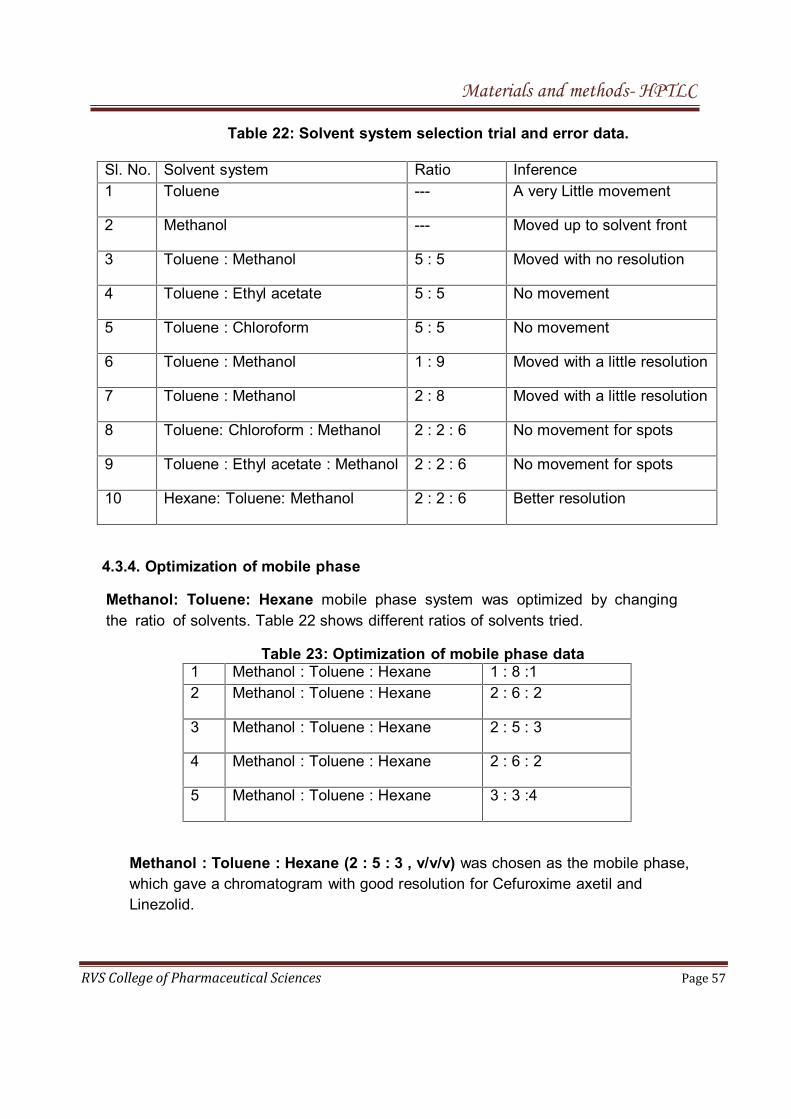
Materials and methods- HPTLC
RVS College of Pharmaceutical Sciences Page 57
Table 22: Solvent system selection trial and error data.
Sl. No. Solvent system Ratio Inference
1 Toluene --- A very Little movement
2 Methanol --- Moved up to solvent front
3 Toluene : Methanol 5 : 5 Moved with no resolution
4 Toluene : Ethyl acetate 5 : 5 No movement
5 Toluene : Chloroform 5 : 5 No movement
6 Toluene : Methanol 1 : 9 Moved with a little resolution
7 Toluene : Methanol 2 : 8 Moved with a little resolution
8 Toluene: Chloroform : Methanol 2 : 2 : 6 No movement for spots
9 Toluene : Ethyl acetate : Methanol 2 : 2 : 6 No movement for spots
10 Hexane: Toluene: Methanol 2 : 2 : 6 Better resolution
4.3.4. Optimization of mobile phase
Methanol: Toluene: Hexane mobile phase system was optimized by changing
the ratio of solvents. Table 22 shows different ratios of solvents tried.
Table 23: Optimization of mobile phase data1 Methanol : Toluene : Hexane 1 : 8 :1
2 Methanol : Toluene : Hexane 2 : 6 : 2
3 Methanol : Toluene : Hexane 2 : 5 : 3
4 Methanol : Toluene : Hexane 2 : 6 : 2
5 Methanol : Toluene : Hexane 3 : 3 :4
Methanol : Toluene : Hexane (2 : 5 : 3 , v/v/v) was chosen as the mobile phase,
which gave a chromatogram with good resolution for Cefuroxime axetil and
Linezolid.
Materials and methods- HPTLC
RVS College of Pharmaceutical Sciences Page 58
3. Development of chromatogram.
Selection of chromatographic layer
HPTLC pre-coated plates of silica gel G 60 F254 were employed for the
spotting of standard solutions.
Preparation of mobile phase and saturation of Twin trough chamber
Mobile phase (Methanol : Toluene : Hexane in the ratio, 2 : 5 : 3 v/v/v) was
freshly prepared and transferred into a clean and dried twin trough chamber.
The chamber was then allowed to saturate for 30 minute.
Activation of plate and sample application
Three tracks were selected on the activated pre coated HPTLC plate and
spotting was done by using CAMAG Linomat IV sample applicator in the form
of bands. Cefuroxime axetil standard was applied on the first track, and
Linezolid standard was on the second track. Volume of sample application was
selected according to the volatility of solvent used for preparing the sample
solution. The applied band was sharp when the volume was 2 μl. A band width
of 4 mm was selected for the entire experiment.
The following manual adjustments were done in the Linomat applicator
Plate size : 10 x 6 cm
Start position : 12 mm
Band width : 4 mm
Application volume : 2 μl
Flow rate : 2 μl/sec
Space : 12 mm
After application the plates was taken out and the position of spots were
visualized and confirmed under UV cabinet at 254 nm.
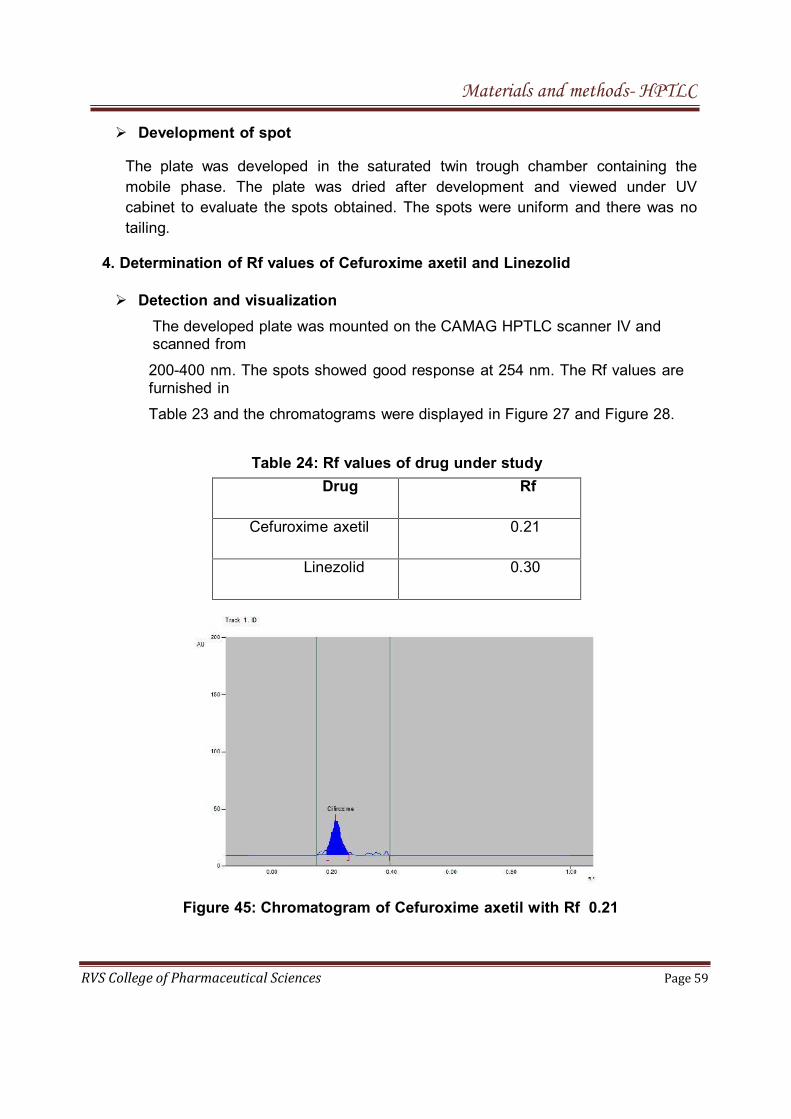
Materials and methods- HPTLC
RVS College of Pharmaceutical Sciences Page 59
Development of spot
The plate was developed in the saturated twin trough chamber containing the
mobile phase. The plate was dried after development and viewed under UV
cabinet to evaluate the spots obtained. The spots were uniform and there was no
tailing.
4. Determination of Rf values of Cefuroxime axetil and Linezolid
Detection and visualization
The developed plate was mounted on the CAMAG HPTLC scanner IV andscanned from
200-400 nm. The spots showed good response at 254 nm. The Rf values arefurnished in
Table 23 and the chromatograms were displayed in Figure 27 and Figure 28.
Table 24: Rf values of drug under study
Drug Rf
Cefuroxime axetil 0.21
Linezolid 0.30
Figure 45: Chromatogram of Cefuroxime axetil with Rf 0.21
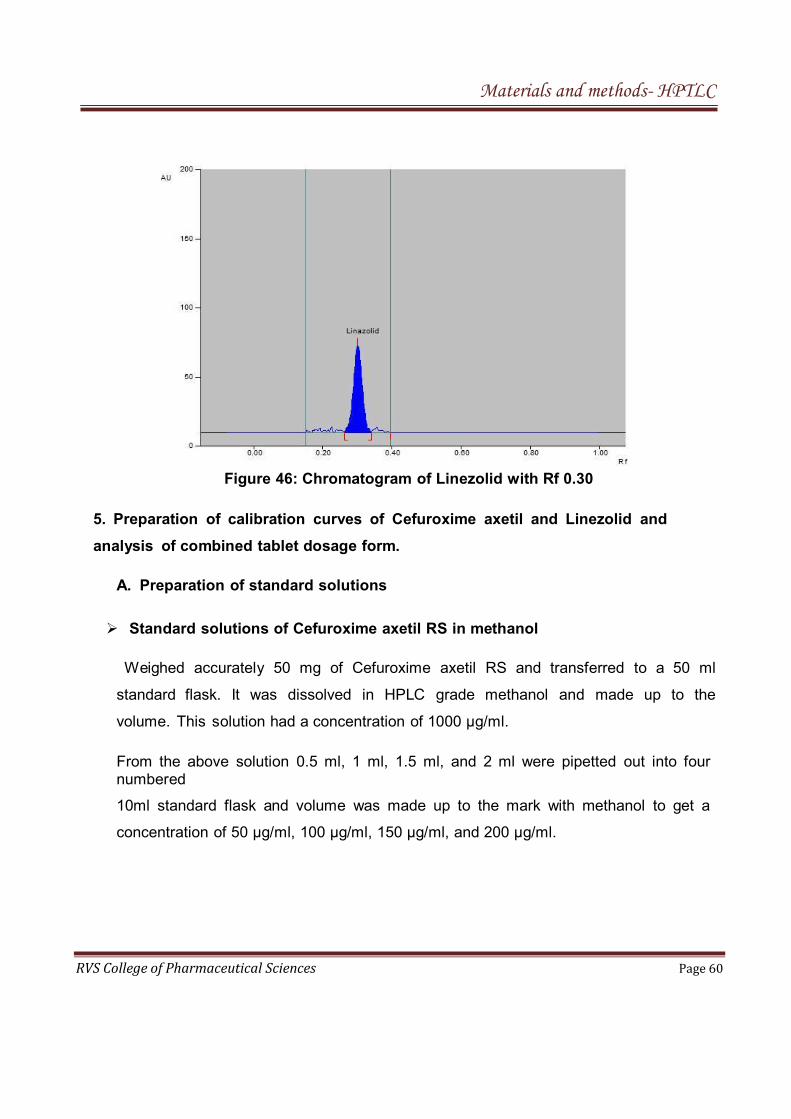
Materials and methods- HPTLC
RVS College of Pharmaceutical Sciences Page 60
Figure 46: Chromatogram of Linezolid with Rf 0.30
5. Preparation of calibration curves of Cefuroxime axetil and Linezolid and
analysis of combined tablet dosage form.
A. Preparation of standard solutions
Standard solutions of Cefuroxime axetil RS in methanol
Weighed accurately 50 mg of Cefuroxime axetil RS and transferred to a 50 ml
standard flask. It was dissolved in HPLC grade methanol and made up to the
volume. This solution had a concentration of 1000 μg/ml.
From the above solution 0.5 ml, 1 ml, 1.5 ml, and 2 ml were pipetted out into fournumbered
10ml standard flask and volume was made up to the mark with methanol to get a
concentration of 50 μg/ml, 100 μg/ml, 150 μg/ml, and 200 μg/ml.
Materials and methods- HPTLC
RVS College of Pharmaceutical Sciences Page 61
Standard solution of Linezolid in methanol
Weighed accurately 50 mg of Linezolid RS and transferred to a 50 ml standard flask.
It was dissolved in HPLC grade methanol and made up to the volume. This solution
had a concentrantion of 1000 μg/ml.
From the above solution 0.5 ml, 1 ml, 1.5 ml and 2 ml were pipetted out into fournumbered
10 ml standard flask and the volume was made up to the mark with methanol toget a concentration of 50 μg/ml,100 μg/ml,150 μg/ml and 200 μg/ml.
Preparation of standard drug mixture
50 mg of Cefuroxime axetil RS and 60 mg of Linezolid RS were weighed separately
and transferred into a 100ml standard flask. The drug mixture was allowed to
dissolve in sufficient quantity of methanol by shaking for 15 min and the volume was
made up to the mark with methanol. From the resultant solution, accurately pipetted
out 1.0 ml into a 10 ml standard flask and made up to the mark with
methanol to obtain a mixture with concentration of 50 μg/ml of Cefuroxime axetil
and 60 μg/ml of Linezolid.
B. Preparation of sample solution
Details of Analysed Dosage Form
Trade name : Oratil LZ
Label claim : Cefuroxime axetil 500 mg and Linezolid 600 mg
Mfd By : Macleods Pharma
Twenty tablets of Oratil LZ were weighed; average weight of one tablet was
determined and finely powdered with the help of mortar and pestle. A quantity of powdered
tablet equivalent to 50 mg of Cefuroxime axetil (which contains about 60 mg of Linezolid)
was accurately weighed, transferred to a stoppered flask and extracted with 20 ml of
methanol initially by shaking vigorously for 15 minutes. The solution was transferred to a
100 ml standard flask through a Whatman No. 1 filter paper. The residue was further
Materials and methods- HPTLC
RVS College of Pharmaceutical Sciences Page 62
extracted twice with 10ml of methanol and transferred to the same standard flask through
the same filter paper. The volume was finally made up to 100 ml with methanol. From the
above solution accurately pipetted out 1.0 ml and transferred to 10 ml standard flask and
then made up to the mark with methanol. The resulting solution had a concentration of 50
μg/ml of Cefuroxime axetil and 60 μg/ml of Linezolid as per label claim.
C. Development of chromatogram
Selection of chromatographic layer
HPTLC pre-coated plates of silica gel G 60 F254 were employed for the spotting
of standard solutions.
Preparation of mobile phase and saturation of twin trough chamber
Mobile phase containing Methanol : Toluene : Hexane in the ratio 2 : 5 : 3 , v/v/v
was freshly prepared and transferred into a clean and dry twin trough chamber.
The chamber was then allowed to saturate for 30 minute.
Activation of plate and sample application
Seventeen tracks were selected on the activated pre coated HPTLC plate and
spotting was done by using CAMAG Linomat IV automatic sample applicator in the
form of bands. Cefuroxime axetil standard were applied on the first four tracks, and
Linezolid were applied on the next four tracks. Standard drug mixture was applied
on track number nine and sample was applied on track number ten.
The following manual adjustments were done in the Linomat applicator
Plate size : 20x10 cm
Start position : 12 mm
Band width : 4 mm
Application volume : 2 μl
Flow rate : 2 μl/sec
Space : 9 mm
After application the plate was taken out and the position of spots were visualized
and confirmed under UV cabinet at 254.
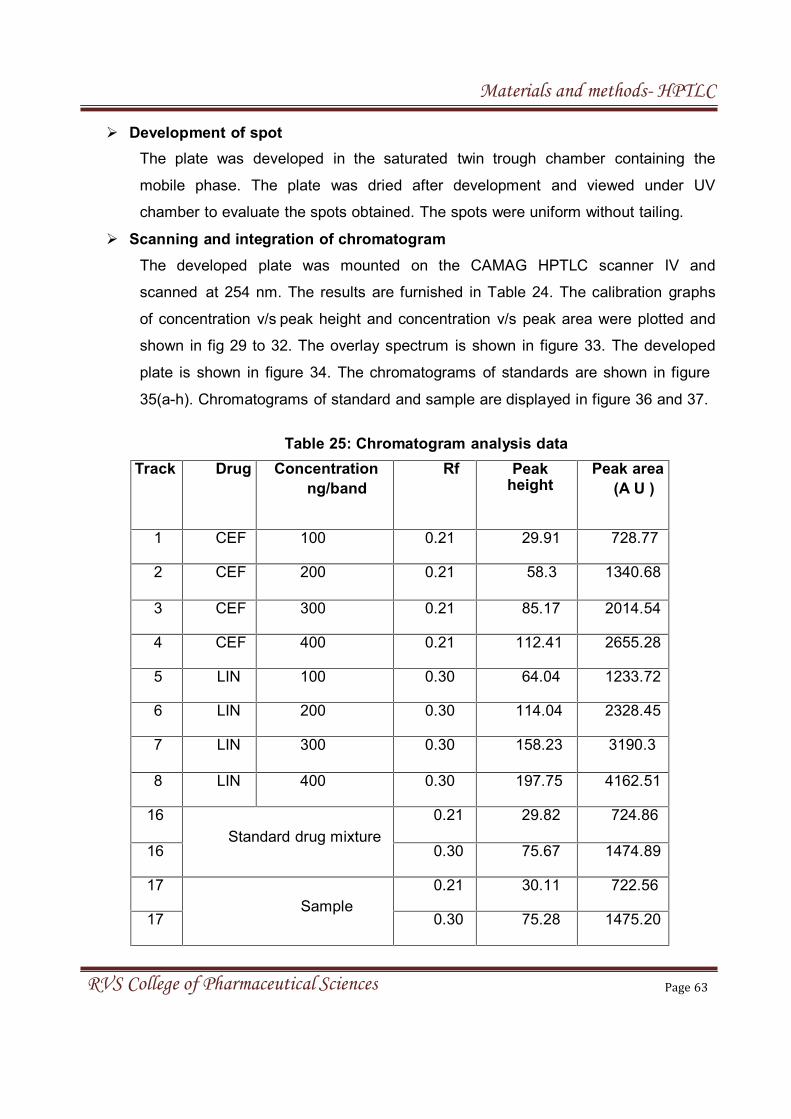
Materials and methods- HPTLC
RVS College of Pharmaceutical Sciences Page 63
Development of spot
The plate was developed in the saturated twin trough chamber containing the
mobile phase. The plate was dried after development and viewed under UV
chamber to evaluate the spots obtained. The spots were uniform without tailing.
Scanning and integration of chromatogram
The developed plate was mounted on the CAMAG HPTLC scanner IV and
scanned at 254 nm. The results are furnished in Table 24. The calibration graphs
of concentration v/s peak height and concentration v/s peak area were plotted and
shown in fig 29 to 32. The overlay spectrum is shown in figure 33. The developed
plate is shown in figure 34. The chromatograms of standards are shown in figure
35(a-h). Chromatograms of standard and sample are displayed in figure 36 and 37.
Table 25: Chromatogram analysis data
Track Drug Concentration
ng/band
Rf Peakheight
Peak area
(A U )
1 CEF 100 0.21 29.91 728.77
2 CEF 200 0.21 58.3 1340.68
3 CEF 300 0.21 85.17 2014.54
4 CEF 400 0.21 112.41 2655.28
5 LIN 100 0.30 64.04 1233.72
6 LIN 200 0.30 114.04 2328.45
7 LIN 300 0.30 158.23 3190.3
8 LIN 400 0.30 197.75 4162.51
16
Standard drug mixture
0.21 29.82 724.86
16 0.30 75.67 1474.89
17
Sample
0.21 30.11 722.56
17 0.30 75.28 1475.20

Materials and methods- HPTLC
RVS College of Pharmaceutical Sciences Page 64
Peakheight
Peakarea
Peakheight
120
100
80
60
40
20
0
Cefuroxime axetil
0 200 400 600
Concentration in ng/spot
Figure 47: Calibration graph of Cefuroxime axetil [Concentration v/s Peak height]
3000
2500
2000
1500
1000
500
Cefuroxime axetil
0
0 100 200 300 400 500
concentration in ng/µl
Figure 48: Calibration graph of Cefuroxime axetil [Concentration v/s Peak area]
Linezolid250
200
150
100
50
0
0 100 200 300 400 500
concentration in ng/µl
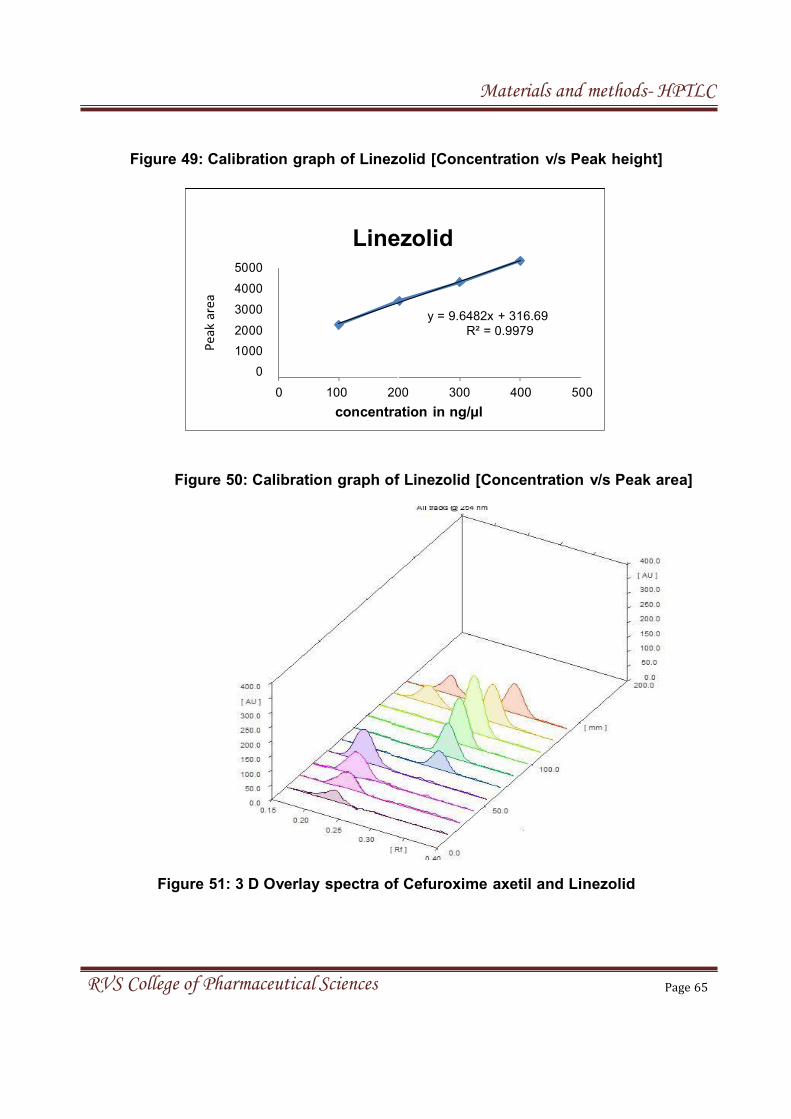
Materials and methods- HPTLC
RVS College of Pharmaceutical Sciences Page 65
Peakarea
Figure 49: Calibration graph of Linezolid [Concentration v/s Peak height]
5000
4000
3000
2000
1000
Linezolid
y = 9.6482x + 316.69
R² = 0.9979
0
0 100 200 300 400 500
concentration in ng/µl
Figure 50: Calibration graph of Linezolid [Concentration v/s Peak area]
Figure 51: 3 D Overlay spectra of Cefuroxime axetil and Linezolid
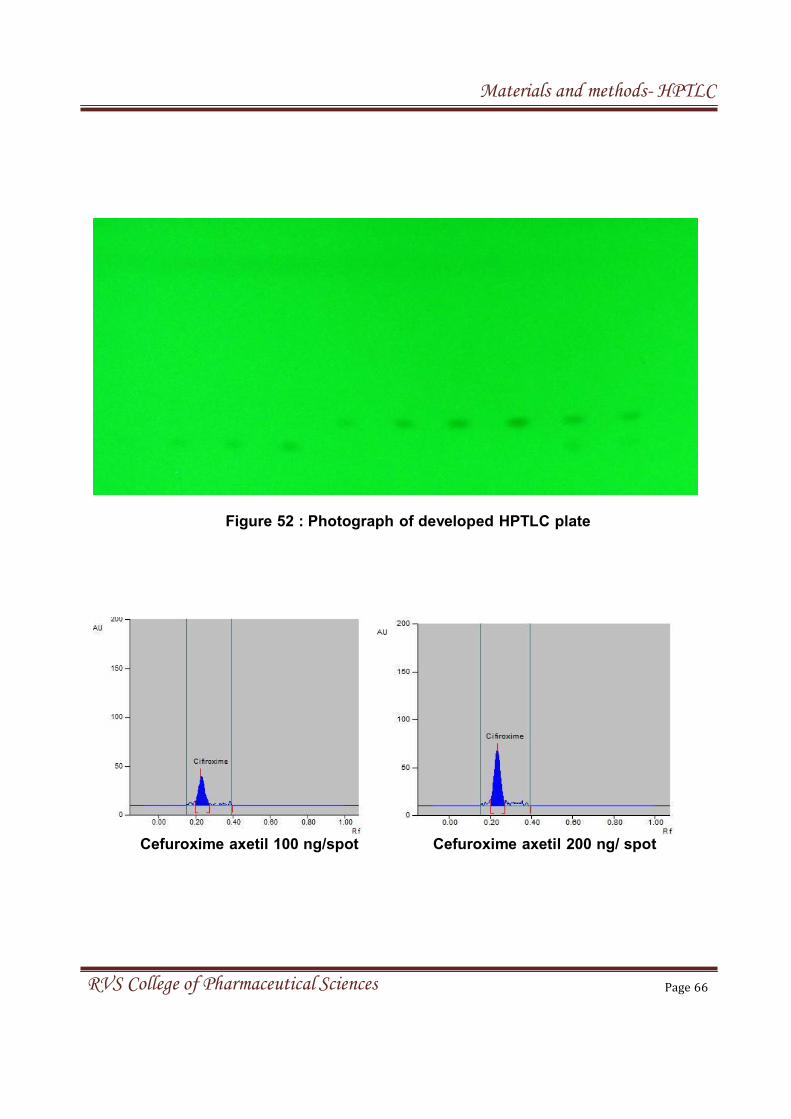
Materials and methods- HPTLC
RVS College of Pharmaceutical Sciences Page 66
Figure 52 : Photograph of developed HPTLC plate
Cefuroxime axetil 100 ng/spot Cefuroxime axetil 200 ng/ spot
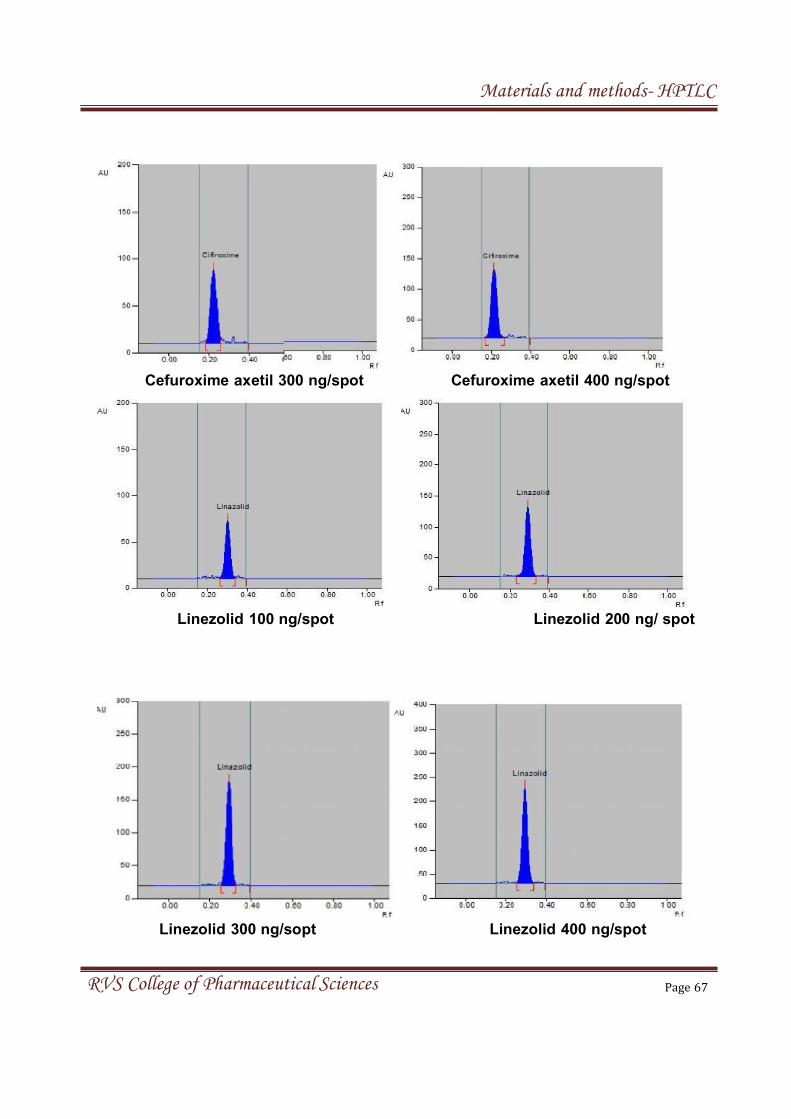
Materials and methods- HPTLC
RVS College of Pharmaceutical Sciences Page 67
Cefuroxime axetil 300 ng/spot Cefuroxime axetil 400 ng/spot
Linezolid 100 ng/spot Linezolid 200 ng/ spot
Linezolid 300 ng/sopt Linezolid 400 ng/spot
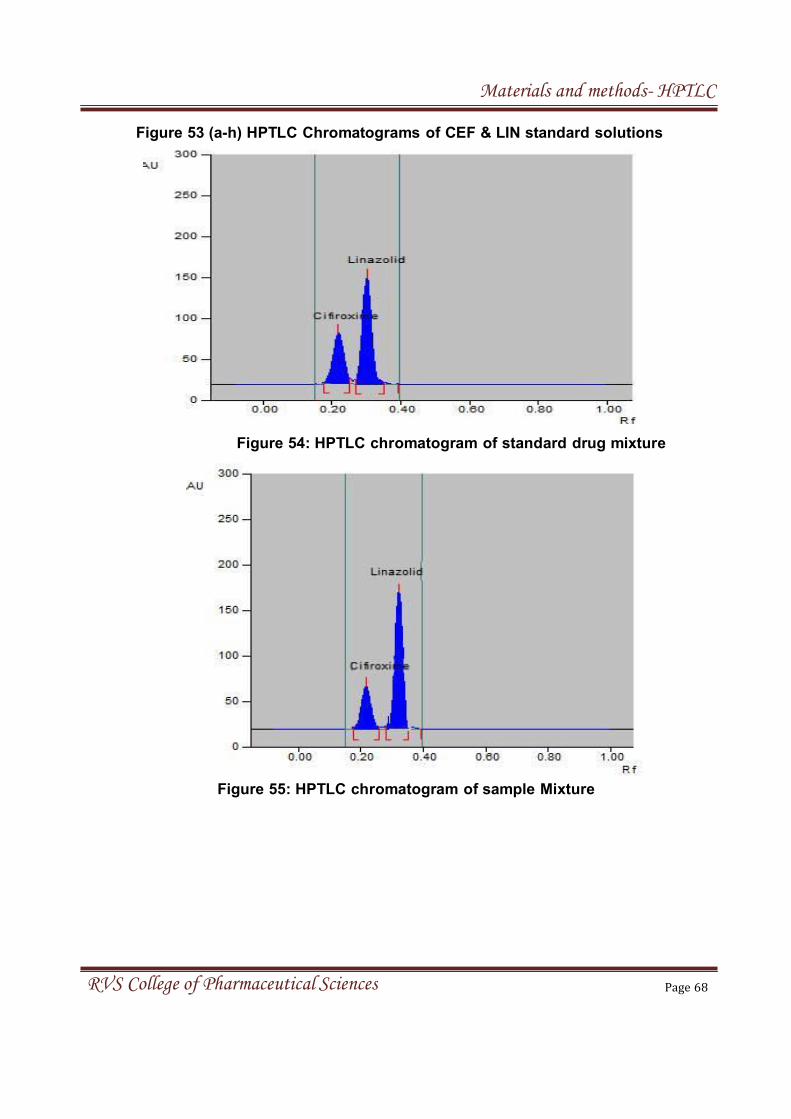
Materials and methods- HPTLC
RVS College of Pharmaceutical Sciences Page 68
Figure 53 (a-h) HPTLC Chromatograms of CEF & LIN standard solutions
Figure 54: HPTLC chromatogram of standard drug mixture
Figure 55: HPTLC chromatogram of sample Mixture
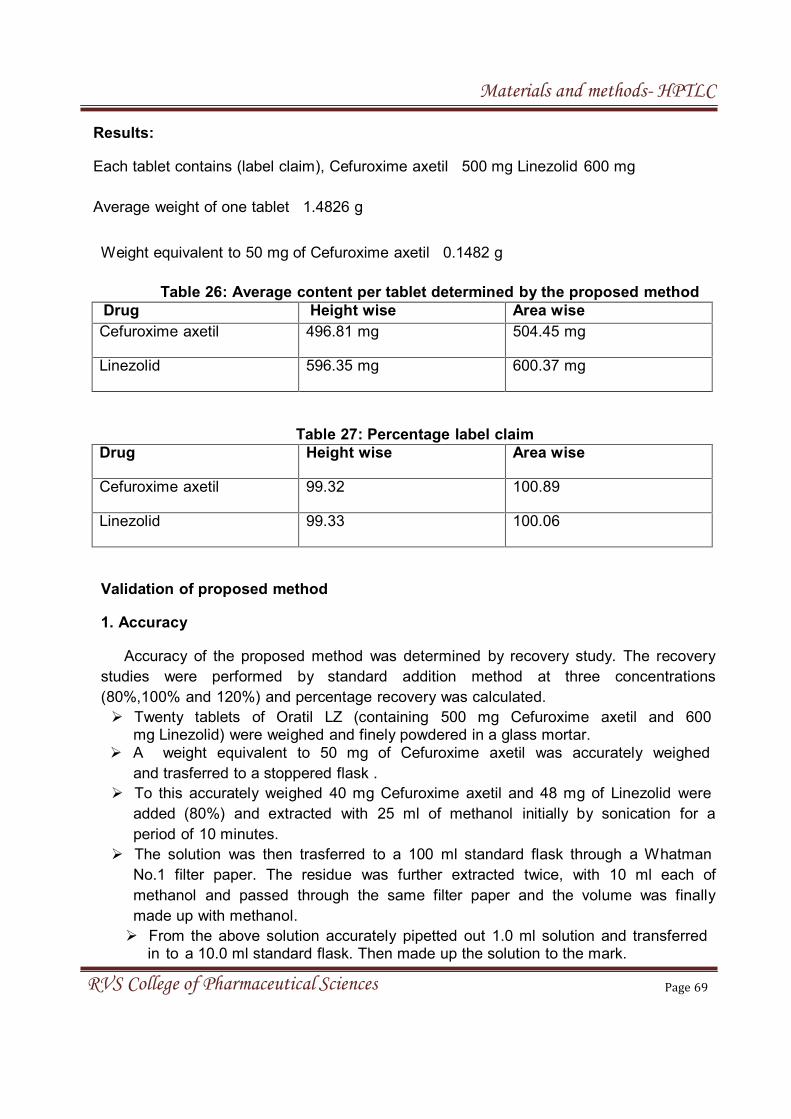
Materials and methods- HPTLC
RVS College of Pharmaceutical Sciences Page 69
Results:
Each tablet contains (label claim), Cefuroxime axetil 500 mg Linezolid 600 mg
Average weight of one tablet 1.4826 g
Weight equivalent to 50 mg of Cefuroxime axetil 0.1482 g
Table 26: Average content per tablet determined by the proposed method
Drug Height wise Area wise
Cefuroxime axetil 496.81 mg 504.45 mg
Linezolid 596.35 mg 600.37 mg
Table 27: Percentage label claim
Drug Height wise Area wise
Cefuroxime axetil 99.32 100.89
Linezolid 99.33 100.06
Validation of proposed method
1. Accuracy
Accuracy of the proposed method was determined by recovery study. The recovery
studies were performed by standard addition method at three concentrations
(80%,100% and 120%) and percentage recovery was calculated.
Twenty tablets of Oratil LZ (containing 500 mg Cefuroxime axetil and 600mg Linezolid) were weighed and finely powdered in a glass mortar.
A weight equivalent to 50 mg of Cefuroxime axetil was accurately weighed
and trasferred to a stoppered flask .
To this accurately weighed 40 mg Cefuroxime axetil and 48 mg of Linezolid were
added (80%) and extracted with 25 ml of methanol initially by sonication for a
period of 10 minutes.
The solution was then trasferred to a 100 ml standard flask through a Whatman
No.1 filter paper. The residue was further extracted twice, with 10 ml each of
methanol and passed through the same filter paper and the volume was finally
made up with methanol.
From the above solution accurately pipetted out 1.0 ml solution and transferredin to a 10.0 ml standard flask. Then made up the solution to the mark.
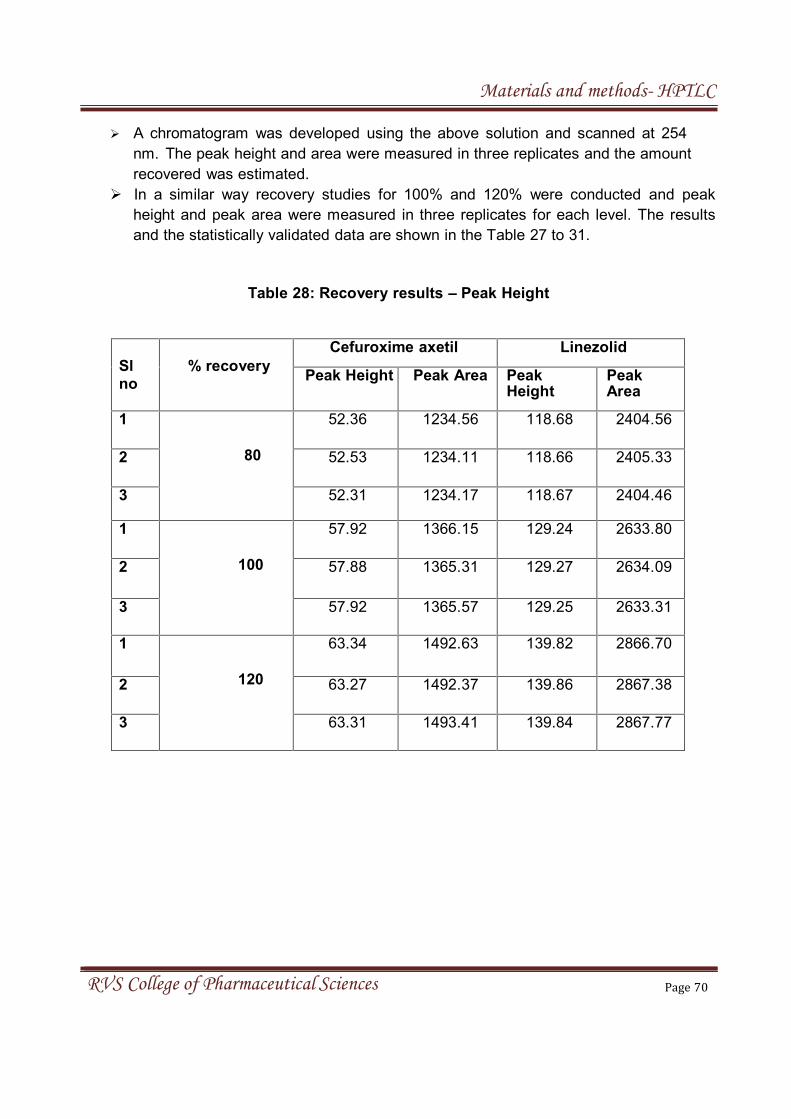
Materials and methods- HPTLC
RVS College of Pharmaceutical Sciences Page 70
A chromatogram was developed using the above solution and scanned at 254
nm. The peak height and area were measured in three replicates and the amount
recovered was estimated.
In a similar way recovery studies for 100% and 120% were conducted and peak
height and peak area were measured in three replicates for each level. The results
and the statistically validated data are shown in the Table 27 to 31.
Table 28: Recovery results – Peak Height
Slno
% recovery
Cefuroxime axetil Linezolid
Peak Height Peak Area PeakHeight
PeakArea
1
80
52.36 1234.56 118.68 2404.56
2 52.53 1234.11 118.66 2405.33
3 52.31 1234.17 118.67 2404.46
1
100
57.92 1366.15 129.24 2633.80
2 57.88 1365.31 129.27 2634.09
3 57.92 1365.57 129.25 2633.31
1
120
63.34 1492.63 139.82 2866.70
2 63.27 1492.37 139.86 2867.38
3 63.31 1493.41 139.84 2867.77
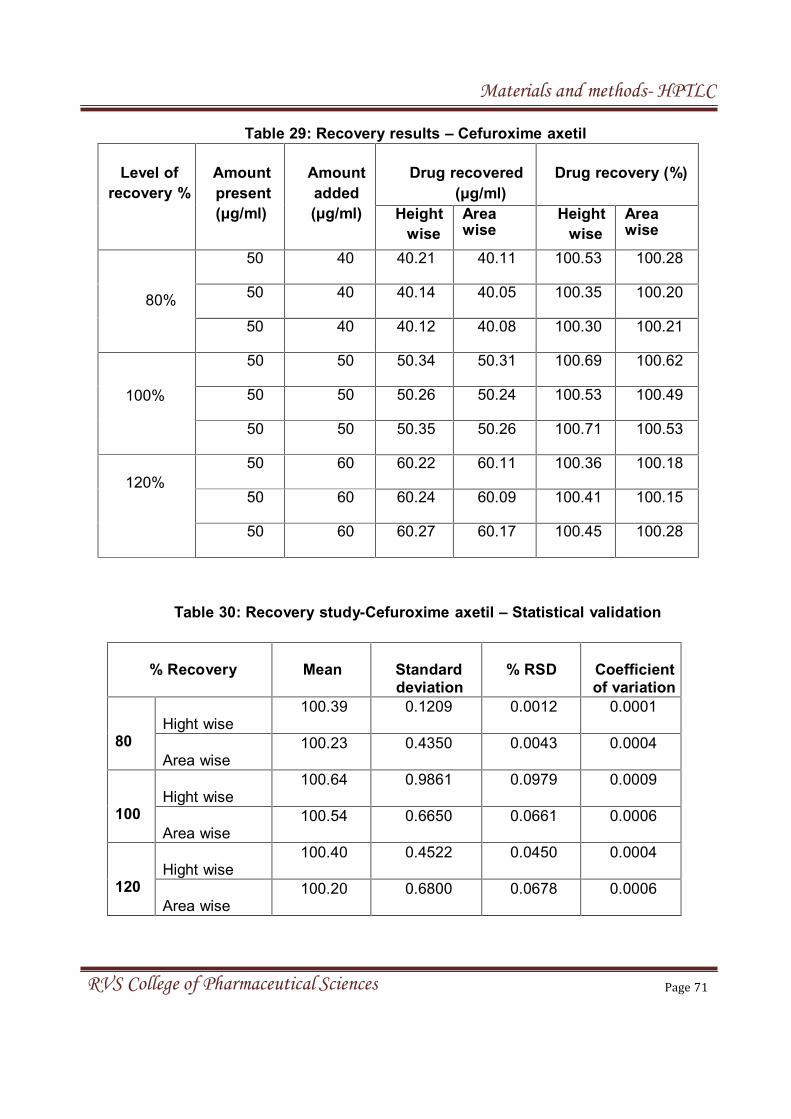
Materials and methods- HPTLC
RVS College of Pharmaceutical Sciences Page 71
Table 29: Recovery results – Cefuroxime axetil
Level of
recovery %
Amount
present
(μg/ml)
Amount
added
(μg/ml)
Drug recovered
(μg/ml)
Drug recovery (%)
Height
wise
Areawise
Height
wise
Areawise
80%
50 40 40.21 40.11 100.53 100.28
50 40 40.14 40.05 100.35 100.20
50 40 40.12 40.08 100.30 100.21
100%
50 50 50.34 50.31 100.69 100.62
50 50 50.26 50.24 100.53 100.49
50 50 50.35 50.26 100.71 100.53
120%
50 60 60.22 60.11 100.36 100.18
50 60 60.24 60.09 100.41 100.15
50 60 60.27 60.17 100.45 100.28
Table 30: Recovery study-Cefuroxime axetil – Statistical validation
% Recovery Mean Standarddeviation
% RSD Coefficientof variation
80Hight wise
100.39 0.1209 0.0012 0.0001
Area wise100.23 0.4350 0.0043 0.0004
100Hight wise
100.64 0.9861 0.0979 0.0009
Area wise100.54 0.6650 0.0661 0.0006
120Hight wise
100.40 0.4522 0.0450 0.0004
Area wise100.20 0.6800 0.0678 0.0006
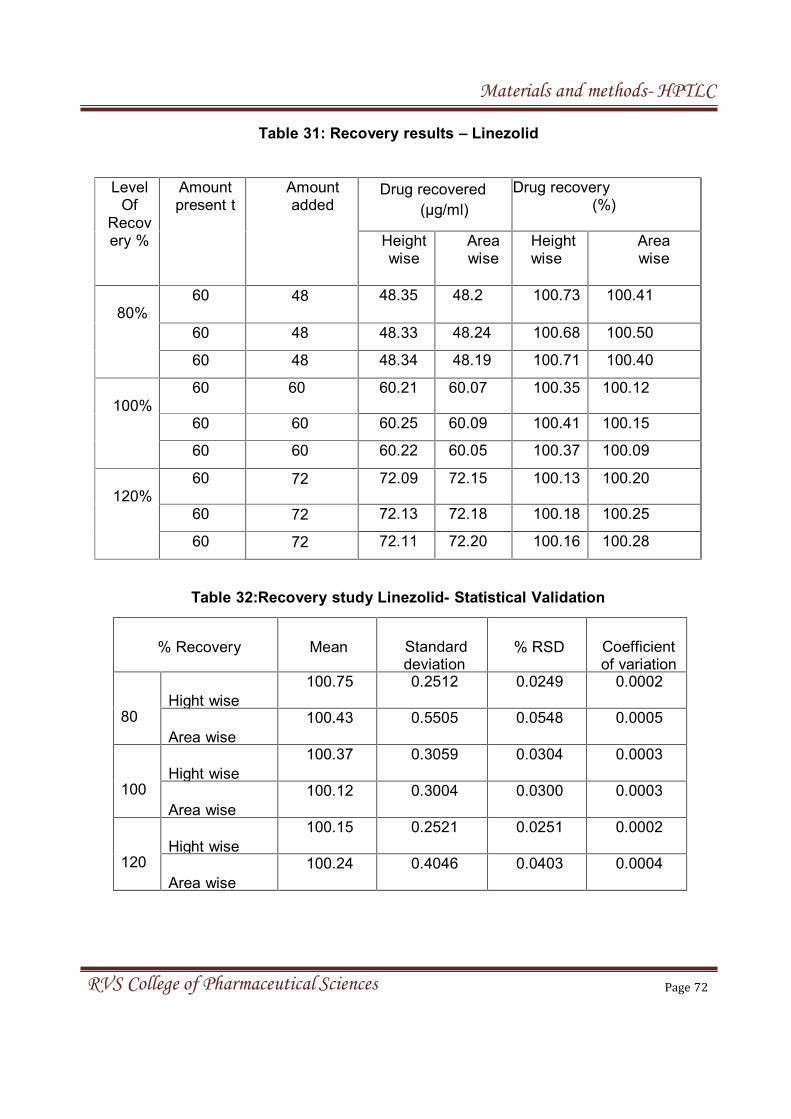
Materials and methods- HPTLC
RVS College of Pharmaceutical Sciences Page 72
Table 31: Recovery results – Linezolid
LevelOf
Recovery %
Amountpresent t
Amountadded
Drug recovered
(μg/ml)
Drug recovery(%)
Heightwise
Areawise
Heightwise
Areawise
80%60 48 48.35 48.2 100.73 100.41
60 48 48.33 48.24 100.68 100.50
60 48 48.34 48.19 100.71 100.40
100%
60 60 60.21 60.07 100.35 100.12
60 60 60.25 60.09 100.41 100.15
60 60 60.22 60.05 100.37 100.09
120%
60 72 72.09 72.15 100.13 100.20
60 72 72.13 72.18 100.18 100.25
60 72 72.11 72.20 100.16 100.28
Table 32:Recovery study Linezolid- Statistical Validation
% Recovery Mean Standarddeviation
% RSD Coefficientof variation
80Hight wise
100.75 0.2512 0.0249 0.0002
Area wise
100.43 0.5505 0.0548 0.0005
100Hight wise
100.37 0.3059 0.0304 0.0003
Area wise
100.12 0.3004 0.0300 0.0003
120Hight wise
100.15 0.2521 0.0251 0.0002
Area wise
100.24 0.4046 0.0403 0.0004
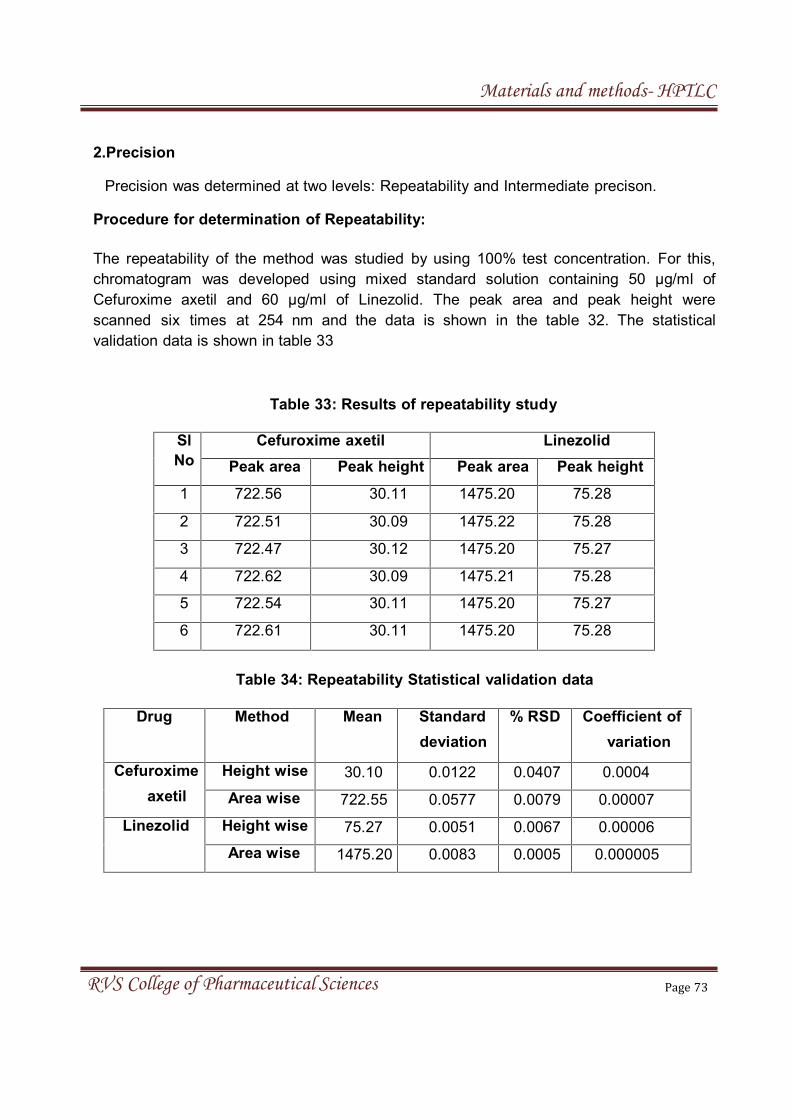
Materials and methods- HPTLC
RVS College of Pharmaceutical Sciences Page 73
2.Precision
Precision was determined at two levels: Repeatability and Intermediate precison.
Procedure for determination of Repeatability:
The repeatability of the method was studied by using 100% test concentration. For this,
chromatogram was developed using mixed standard solution containing 50 µg/ml of
Cefuroxime axetil and 60 µg/ml of Linezolid. The peak area and peak height were
scanned six times at 254 nm and the data is shown in the table 32. The statistical
validation data is shown in table 33
Table 33: Results of repeatability study
Sl
No
Cefuroxime axetil Linezolid
Peak area Peak height Peak area Peak height
1 722.56 30.11 1475.20 75.28
2 722.51 30.09 1475.22 75.28
3 722.47 30.12 1475.20 75.27
4 722.62 30.09 1475.21 75.28
5 722.54 30.11 1475.20 75.27
6 722.61 30.11 1475.20 75.28
Table 34: Repeatability Statistical validation data
Drug Method Mean Standard
deviation
% RSD Coefficient of
variation
Cefuroxime
axetil
Height wise 30.10 0.0122 0.0407 0.0004
Area wise 722.55 0.0577 0.0079 0.00007
Linezolid Height wise 75.27 0.0051 0.0067 0.00006
Area wise 1475.20 0.0083 0.0005 0.000005
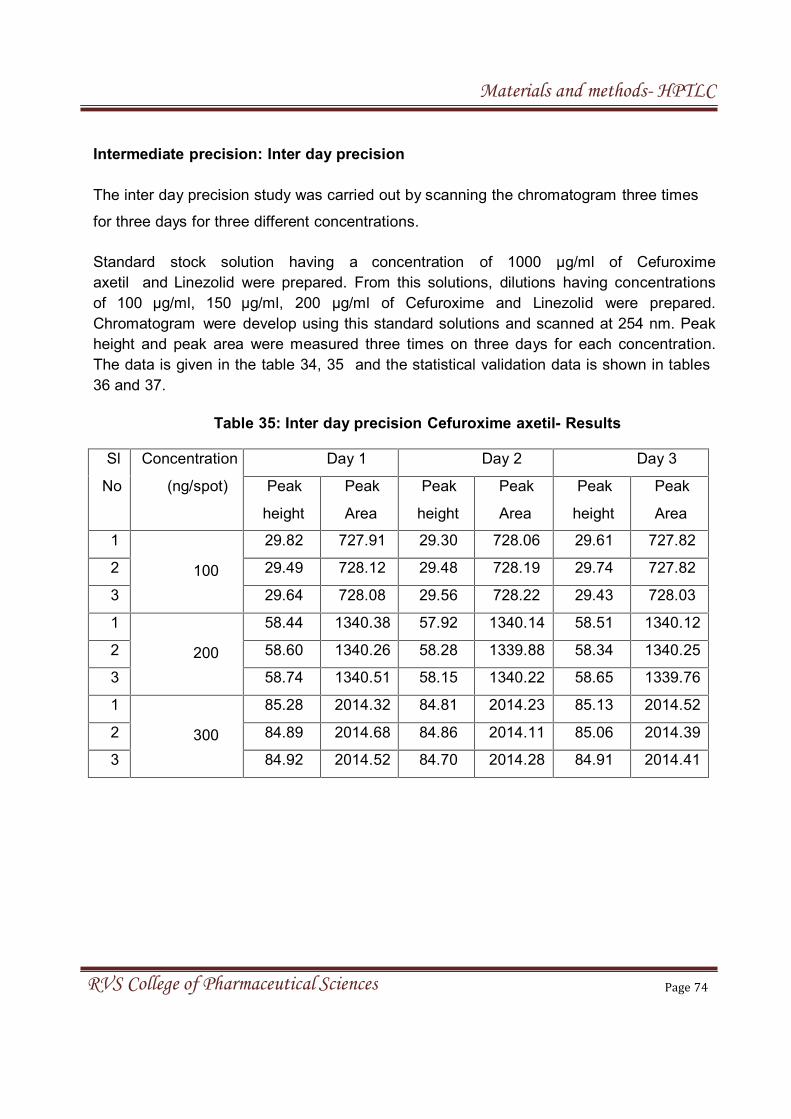
Materials and methods- HPTLC
RVS College of Pharmaceutical Sciences Page 74
Intermediate precision: Inter day precision
The inter day precision study was carried out by scanning the chromatogram three times
for three days for three different concentrations.
Standard stock solution having a concentration of 1000 µg/ml of Cefuroxime
axetil and Linezolid were prepared. From this solutions, dilutions having concentrations
of 100 µg/ml, 150 µg/ml, 200 µg/ml of Cefuroxime and Linezolid were prepared.
Chromatogram were develop using this standard solutions and scanned at 254 nm. Peak
height and peak area were measured three times on three days for each concentration.
The data is given in the table 34, 35 and the statistical validation data is shown in tables
36 and 37.
Table 35: Inter day precision Cefuroxime axetil- Results
Sl
No
Concentration
(ng/spot)
Day 1 Day 2 Day 3
Peak
height
Peak
Area
Peak
height
Peak
Area
Peak
height
Peak
Area
1
100
29.82 727.91 29.30 728.06 29.61 727.82
2 29.49 728.12 29.48 728.19 29.74 727.82
3 29.64 728.08 29.56 728.22 29.43 728.03
1
200
58.44 1340.38 57.92 1340.14 58.51 1340.12
2 58.60 1340.26 58.28 1339.88 58.34 1340.25
3 58.74 1340.51 58.15 1340.22 58.65 1339.76
1
300
85.28 2014.32 84.81 2014.23 85.13 2014.52
2 84.89 2014.68 84.86 2014.11 85.06 2014.39
3 84.92 2014.52 84.70 2014.28 84.91 2014.41
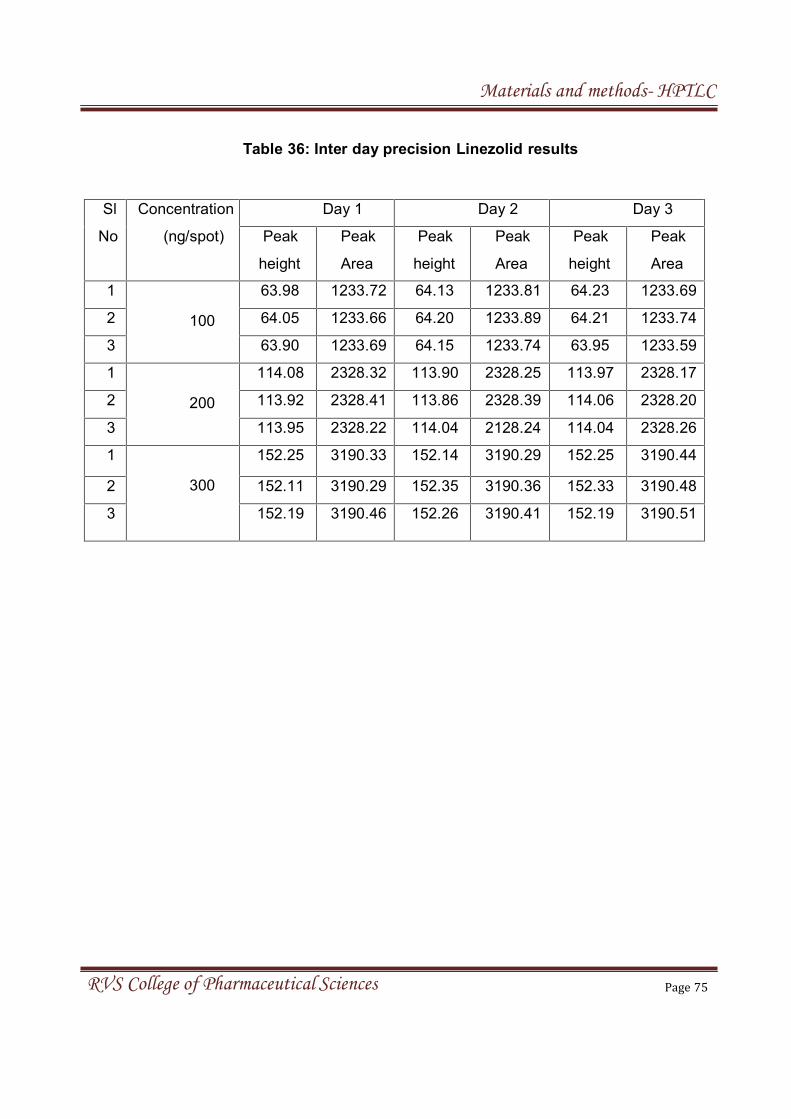
Materials and methods- HPTLC
RVS College of Pharmaceutical Sciences Page 75
Table 36: Inter day precision Linezolid results
Sl
No
Concentration
(ng/spot)
Day 1 Day 2 Day 3
Peak
height
Peak
Area
Peak
height
Peak
Area
Peak
height
Peak
Area
1
100
63.98 1233.72 64.13 1233.81 64.23 1233.69
2 64.05 1233.66 64.20 1233.89 64.21 1233.74
3 63.90 1233.69 64.15 1233.74 63.95 1233.59
1
200
114.08 2328.32 113.90 2328.25 113.97 2328.17
2 113.92 2328.41 113.86 2328.39 114.06 2328.20
3 113.95 2328.22 114.04 2128.24 114.04 2328.26
1
300
152.25 3190.33 152.14 3190.29 152.25 3190.44
2 152.11 3190.29 152.35 3190.36 152.33 3190.48
3 152.19 3190.46 152.26 3190.41 152.19 3190.51

Materials and methods- HPTLC
RVS College of Pharmaceutical Sciences Page 76
Table 37: Inter day precision Statistical validation- CEF
Concentration(ng/spot)
Day Method Mean Standard
Deviation
%RSD Coefficent
of
variation
100
1
Height 29.65 0.1652 0.0557 0.0005
Area 728.03 0.1115 0.0153 0.0001
2
Height 29.45 0.1331 0.0451 0.0004
Area 728.15 0.0850 0.0116 0.0001
3
Height 29.59 0.1556 0.0525 0.0005
Area 727.89 0.1212 0.0166 0.0001
200
1
Height 58.59 0.1501 0.2561 0.0025
Area 1340.38 0.1250 0.0932 0.0009
2
Height 58.11 0.1823 0.3137 0.0031
Area 1340.08 0.1777 0.0132 0.0001
3
Height 58.50 0.1552 0.2652 0.0026
Area 1340.04 0.2538 0.0189 0.0001
300
1
Height 85.030.2170
0.2552 0.0025
Area 2014.53 0.2803 0.0139 0.0001
2
Height 85.79 0.0818 0.0953 0.0009
Area 2014.20 0.0873 0.0004 0.00004
3
Height 85.03 0.1123 0.1307 0.0013
Area 2014.44 0.0700 0.0034 0.00003
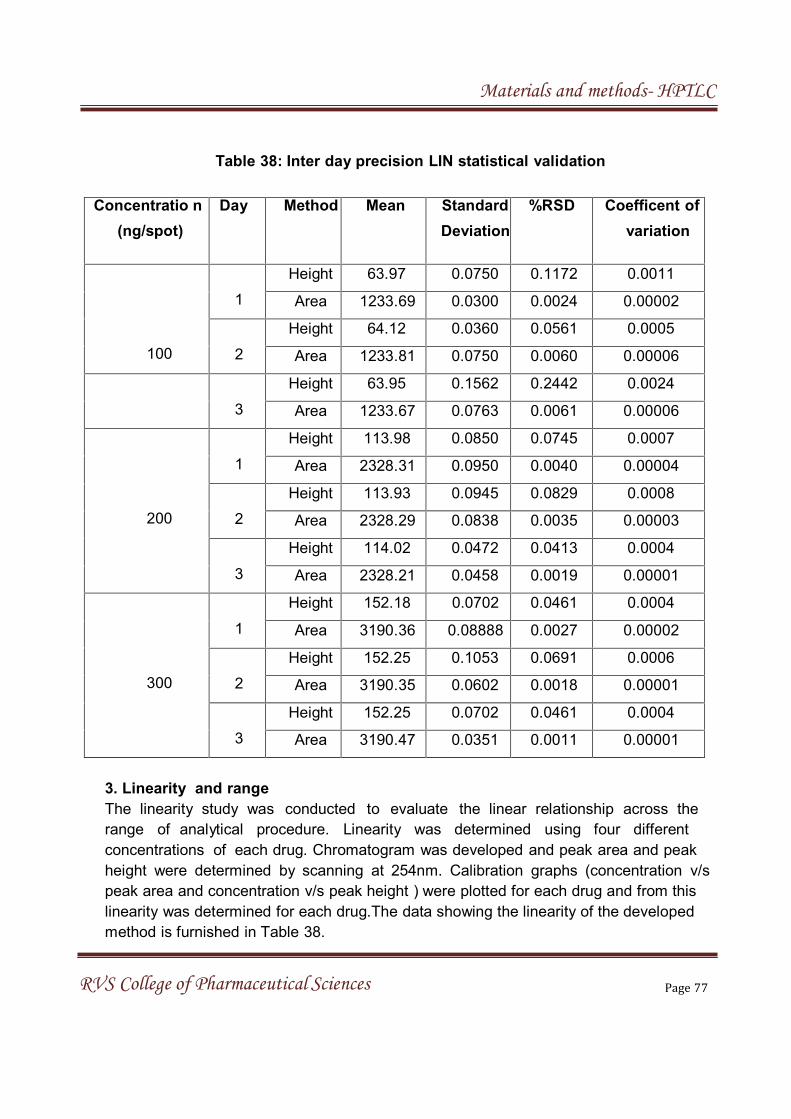
Materials and methods- HPTLC
RVS College of Pharmaceutical Sciences Page 77
Table 38: Inter day precision LIN statistical validation
Concentratio n
(ng/spot)
Day Method Mean Standard
Deviation
%RSD Coefficent of
variation
100
1
Height 63.97 0.0750 0.1172 0.0011
Area 1233.69 0.0300 0.0024 0.00002
2
Height 64.12 0.0360 0.0561 0.0005
Area 1233.81 0.0750 0.0060 0.00006
3
Height 63.95 0.1562 0.2442 0.0024
Area 1233.67 0.0763 0.0061 0.00006
200
1
Height 113.98 0.0850 0.0745 0.0007
Area 2328.31 0.0950 0.0040 0.00004
2
Height 113.93 0.0945 0.0829 0.0008
Area 2328.29 0.0838 0.0035 0.00003
3
Height 114.02 0.0472 0.0413 0.0004
Area 2328.21 0.0458 0.0019 0.00001
300
1
Height 152.18 0.0702 0.0461 0.0004
Area 3190.36 0.08888 0.0027 0.00002
2
Height 152.25 0.1053 0.0691 0.0006
Area 3190.35 0.0602 0.0018 0.00001
3
Height 152.25 0.0702 0.0461 0.0004
Area 3190.47 0.0351 0.0011 0.00001
3. Linearity and range
The linearity study was conducted to evaluate the linear relationship across the
range of analytical procedure. Linearity was determined using four different
concentrations of each drug. Chromatogram was developed and peak area and peak
height were determined by scanning at 254nm. Calibration graphs (concentration v/s
peak area and concentration v/s peak height ) were plotted for each drug and from this
linearity was determined for each drug.The data showing the linearity of the developed
method is furnished in Table 38.
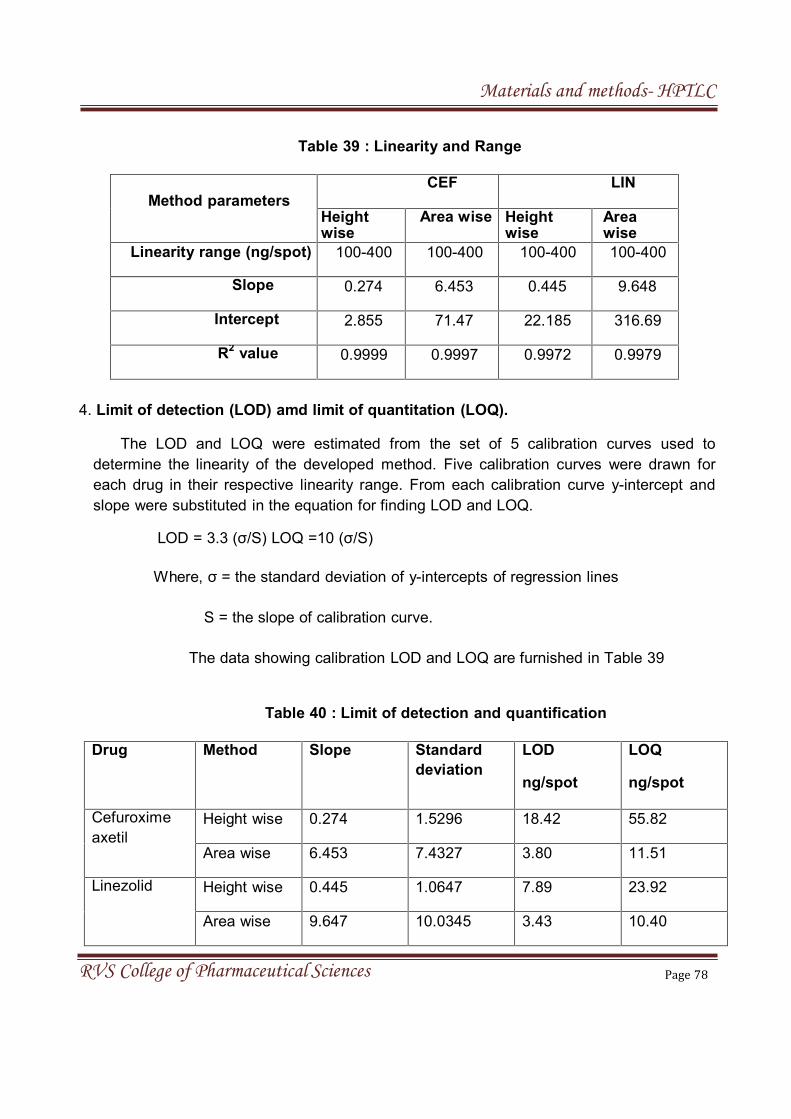
Materials and methods- HPTLC
RVS College of Pharmaceutical Sciences Page 78
Table 39 : Linearity and Range
Method parameters
CEF LIN
Heightwise
Area wise Heightwise
Areawise
Linearity range (ng/spot) 100-400 100-400 100-400 100-400
Slope 0.274 6.453 0.445 9.648
Intercept 2.855 71.47 22.185 316.69
R2
value 0.9999 0.9997 0.9972 0.9979
4. Limit of detection (LOD) amd limit of quantitation (LOQ).
The LOD and LOQ were estimated from the set of 5 calibration curves used to
determine the linearity of the developed method. Five calibration curves were drawn for
each drug in their respective linearity range. From each calibration curve y-intercept and
slope were substituted in the equation for finding LOD and LOQ.
LOD = 3.3 (σ/S) LOQ =10 (σ/S)
Where, σ = the standard deviation of y-intercepts of regression lines
S = the slope of calibration curve.
The data showing calibration LOD and LOQ are furnished in Table 39
Table 40 : Limit of detection and quantification
Drug Method Slope Standard
deviation
LOD
ng/spot
LOQ
ng/spot
Cefuroxime
axetil
Height wise 0.274 1.5296 18.42 55.82
Area wise 6.453 7.4327 3.80 11.51
Linezolid Height wise 0.445 1.0647 7.89 23.92
Area wise 9.647 10.0345 3.43 10.40
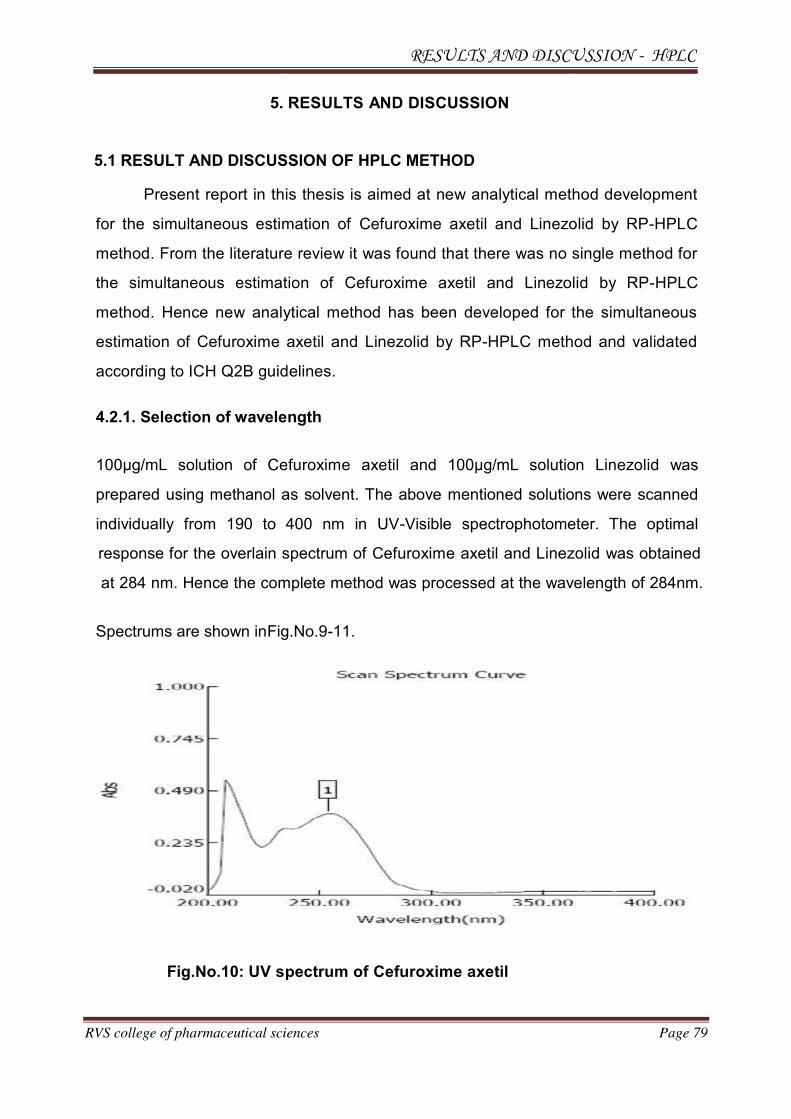
RESULTS AND DISCUSSION - HPLC
RVS college of pharmaceutical sciences Page 79
5. RESULTS AND DISCUSSION
5.1 RESULT AND DISCUSSION OF HPLC METHOD
Present report in this thesis is aimed at new analytical method development
for the simultaneous estimation of Cefuroxime axetil and Linezolid by RP-HPLC
method. From the literature review it was found that there was no single method for
the simultaneous estimation of Cefuroxime axetil and Linezolid by RP-HPLC
method. Hence new analytical method has been developed for the simultaneous
estimation of Cefuroxime axetil and Linezolid by RP-HPLC method and validated
according to ICH Q2B guidelines.
4.2.1. Selection of wavelength
100µg/mL solution of Cefuroxime axetil and 100µg/mL solution Linezolid was
prepared using methanol as solvent. The above mentioned solutions were scanned
individually from 190 to 400 nm in UV-Visible spectrophotometer. The optimal
response for the overlain spectrum of Cefuroxime axetil and Linezolid was obtained
at 284 nm. Hence the complete method was processed at the wavelength of 284nm.
Spectrums are shown inFig.No.9-11.
Fig.No.10: UV spectrum of Cefuroxime axetil

RESULTS AND DISCUSSION - HPLC
RVS college of pharmaceutical sciences Page 80
Fig.No.11: UV spectrum of Linezolid
Fig.No.12: Overlay UVspectrum of Cefuroxime axetil and Linezolid

RESULTS AND DISCUSSION - HPLC
RVS college of pharmaceutical sciences Page 81
4.2.2 ANALYTICAL METHOD DEVELOPMENT
Several trials were made to get good peak resolution, acceptable plate count and
tailing factor. Method was optimized for the simultaneous estimation of cefuroxime
axetil and linezolid pharmaceutical dosage form.
OPTIMIZED METHOD
Mobile phase : phosphate buffer (pH2.8) : acetonitrile35:65v/v)
Diluent : Mobile phase was used as diluent.
Chromatographic conditions
Flow rate : 1 ml per min
Column : Symmetry Xterra C18 (4.6 x 150mm, 5m) .
Detector wavelength : 284 nm
Column oven : Ambient
Injection volume : 20 l
Run time : 10 min
Fig.No.13: Standard chromatogram for Cefuroxime axetil
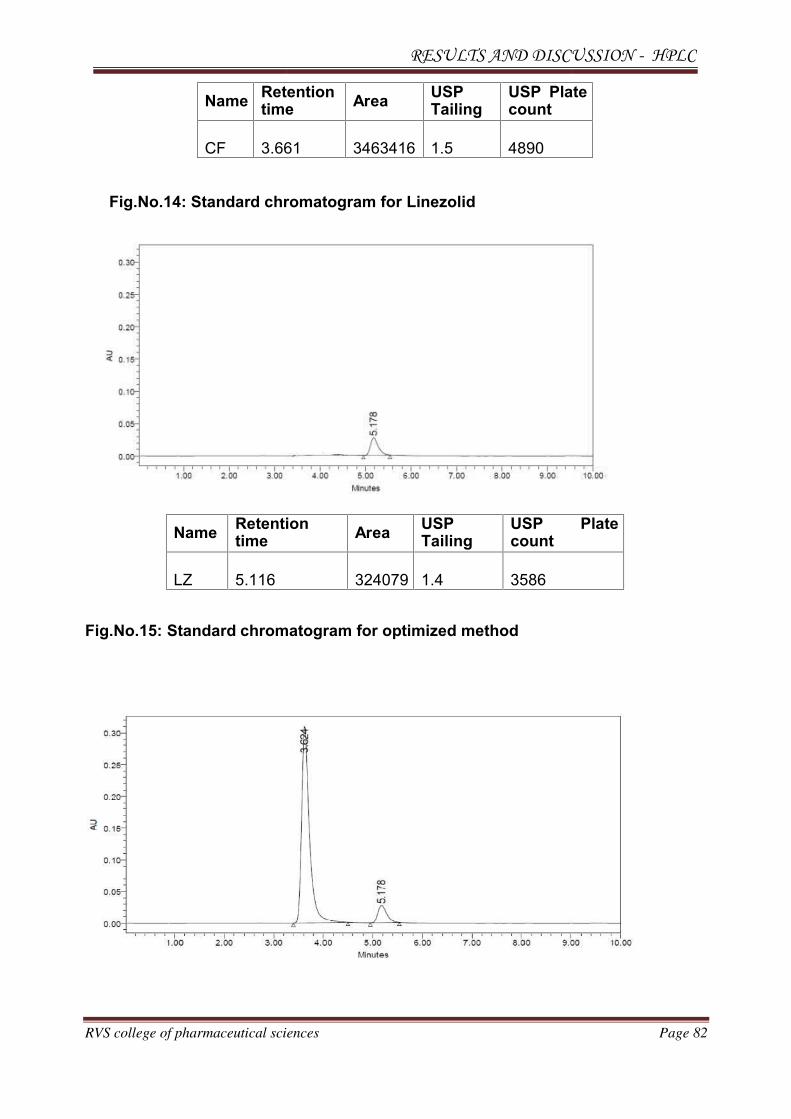
RESULTS AND DISCUSSION - HPLC
RVS college of pharmaceutical sciences Page 82
NameRetentiontime
AreaUSPTailing
USP Platecount
CF 3.661 3463416 1.5 4890
Fig.No.14: Standard chromatogram for Linezolid
Fig.No.15: Standard chromatogram for optimized method
NameRetentiontime
AreaUSPTailing
USP Platecount
LZ 5.116 324079 1.4 3586

RESULTS AND DISCUSSION - HPLC
RVS college of pharmaceutical sciences Page 83
NameRetentiontime
AreaUSPResolution
USPTailing
USP Platecount
CF 3.661 3463416 1.5 4890
LZ 5.116 324079 5.1 1.4 3586
Fig.No.16: Sample Chromatogram for optimized method
NameRetentiontime
AreaUSPResolution
USPTailing
USP Platecount
CF 3.642 3410176 1.5 4874
LZ 5.124 319570 5.1 1.4 3579
Fig.No.17: Blank chromatogram for optimized method
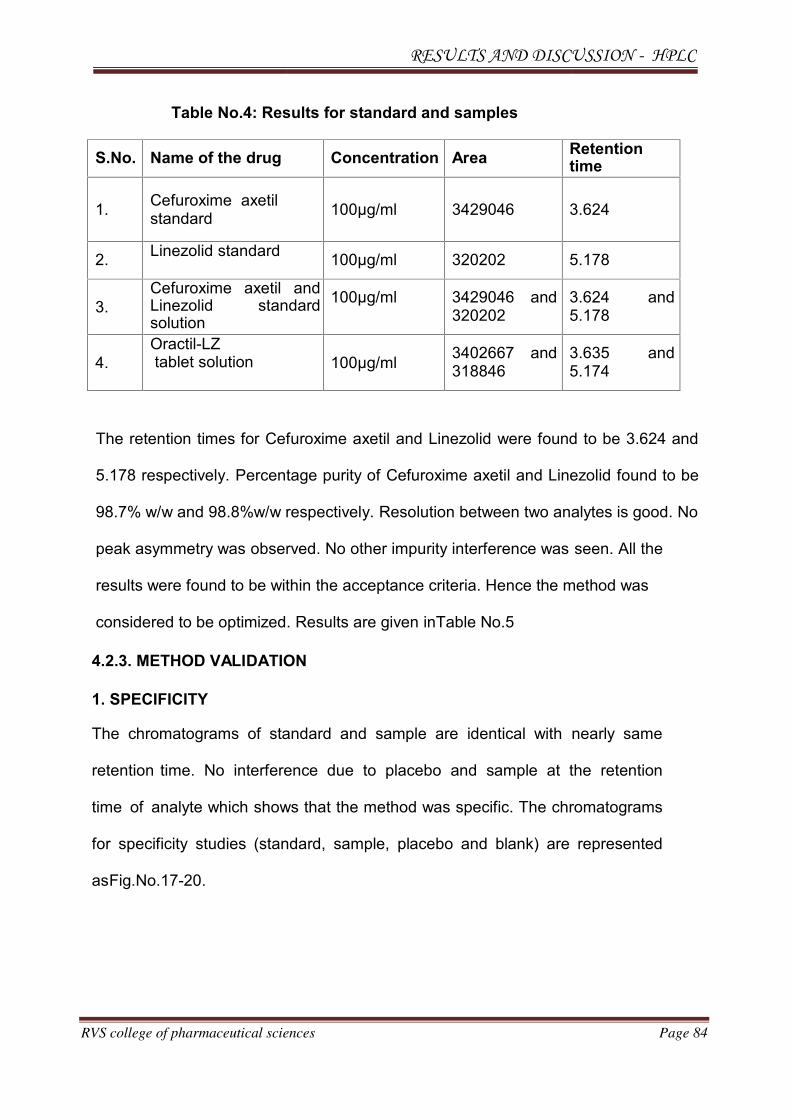
RESULTS AND DISCUSSION - HPLC
RVS college of pharmaceutical sciences Page 84
Table No.4: Results for standard and samples
S.No. Name of the drug Concentration AreaRetentiontime
1.Cefuroxime axetilstandard
100μg/ml 3429046 3.624
2.Linezolid standard
100μg/ml 320202 5.178
3.
Cefuroxime axetil andLinezolid standardsolution
100μg/ml 3429046 and320202
3.624 and5.178
4.
Oractil-LZtablet solution 100μg/ml
3402667 and318846
3.635 and5.174
The retention times for Cefuroxime axetil and Linezolid were found to be 3.624 and
5.178 respectively. Percentage purity of Cefuroxime axetil and Linezolid found to be
98.7% w/w and 98.8%w/w respectively. Resolution between two analytes is good. No
peak asymmetry was observed. No other impurity interference was seen. All the
results were found to be within the acceptance criteria. Hence the method was
considered to be optimized. Results are given inTable No.5
4.2.3. METHOD VALIDATION
1. SPECIFICITY
The chromatograms of standard and sample are identical with nearly same
retention time. No interference due to placebo and sample at the retention
time of analyte which shows that the method was specific. The chromatograms
for specificity studies (standard, sample, placebo and blank) are represented
asFig.No.17-20.
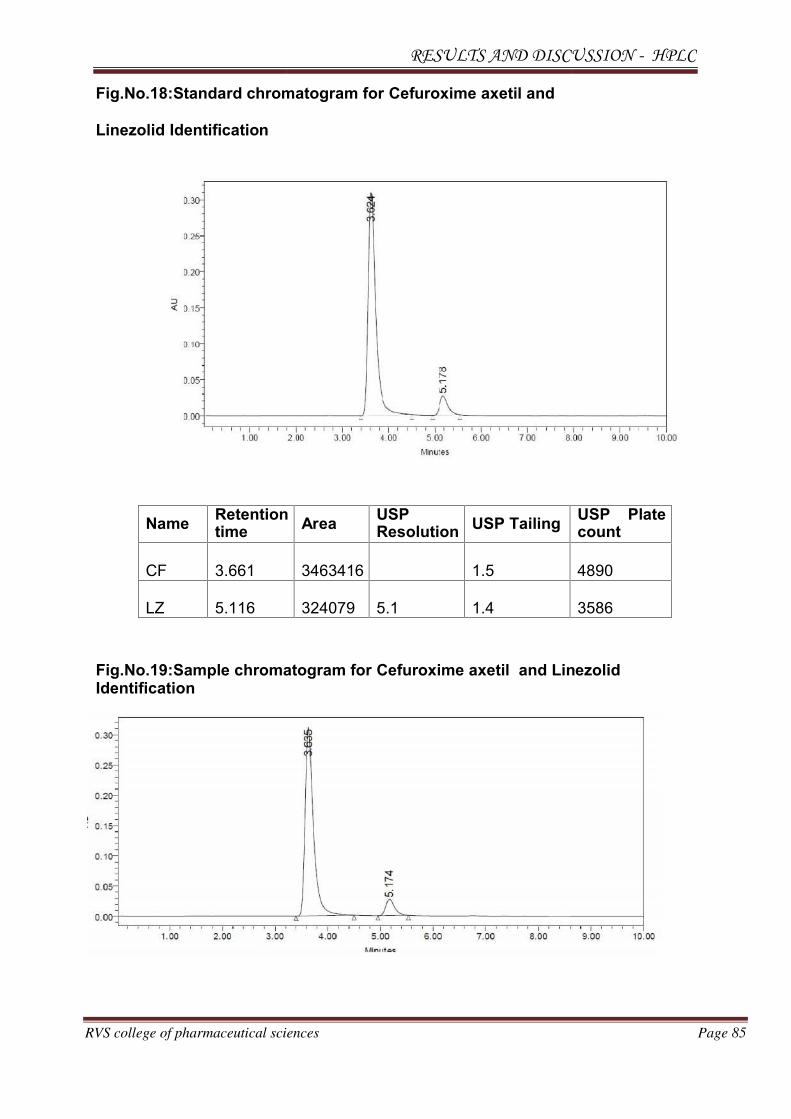
RESULTS AND DISCUSSION - HPLC
RVS college of pharmaceutical sciences Page 85
Fig.No.18:Standard chromatogram for Cefuroxime axetil and
Linezolid Identification
NameRetentiontime
AreaUSPResolution
USP TailingUSP Platecount
CF 3.661 3463416 1.5 4890
LZ 5.116 324079 5.1 1.4 3586
Fig.No.19:Sample chromatogram for Cefuroxime axetil and LinezolidIdentification
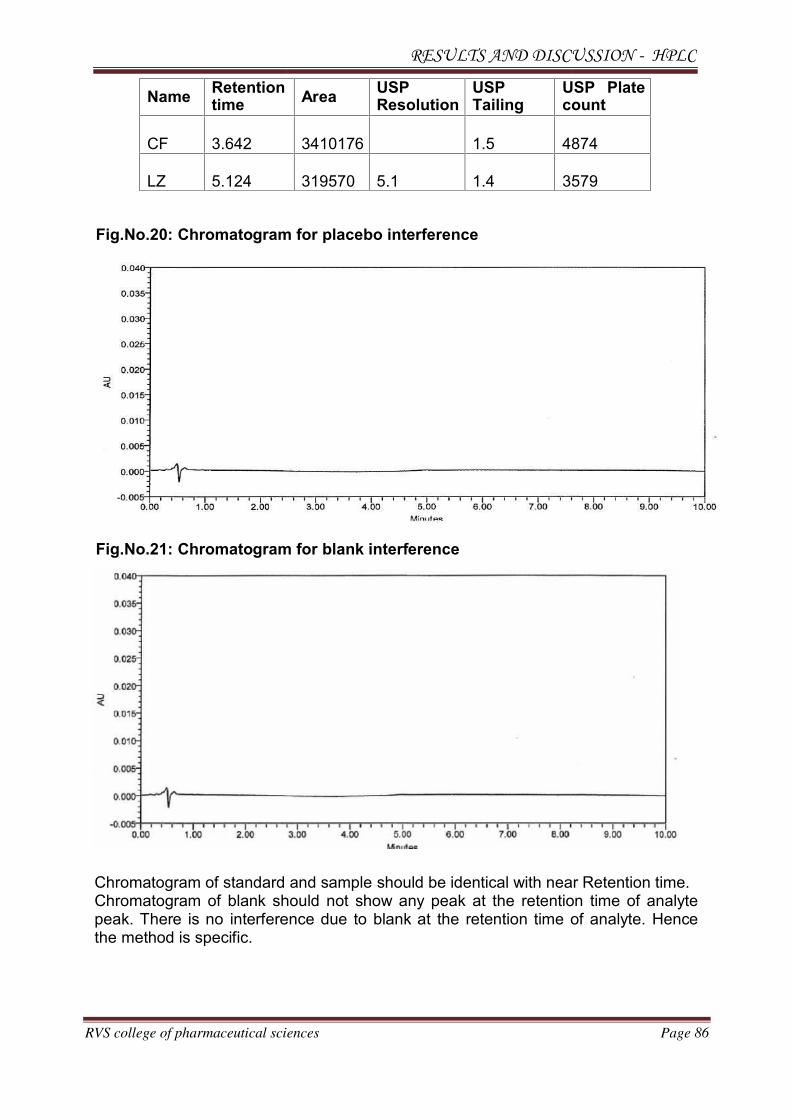
RESULTS AND DISCUSSION - HPLC
RVS college of pharmaceutical scie
NameRetentiontime
CF 3.642
LZ 5.124
Fig.No.20: Chromatogram f
Fig.No.21: Chromatogram f
Chromatogram of standard aChromatogram of blank shopeak. There is no interferenthe method is specific.
RESULTS AND DISCUSSION - HPLC
sciences
tionArea
USPResolution
USPTailing
UScount
3410176 1.5 487
319570 5.1 1.4 357
gram for placebo interference
gram for blank interference
ard and sample should be identical with near Rk should not show any peak at the retentionrference due to blank at the retention time of
RESULTS AND DISCUSSION - HPLC
Page 86
USP Platecount
4874
3579
near Retention time.ntion time of analyte
me of analyte. Hence

RESULTS AND DISCUSSION - HPLC
RVS college of pharmaceutical sciences Page 87
2. LINEARITY
Linearity study was performed in the concentration range of 10-50 µg / ml. The
Chromatograms for the linearity are shown in Fig.No.21-25. The linearity curve is
plotted and shown in Fig.No.26 and 27. The data of linearity is tabulated in Table
No.6and 7.
Fig.No.22. Chromatogram for Linearity 10 µg / ml
NameRetentiontime
AreaUSPResolution
USPTailing
USP Platecount
CF 3.649 2011574 1.5 4993
LZ 5.193 189398 5.1 1.4 3489
Fig.No.23:Chromatogram for Linearity 20 µg / ml
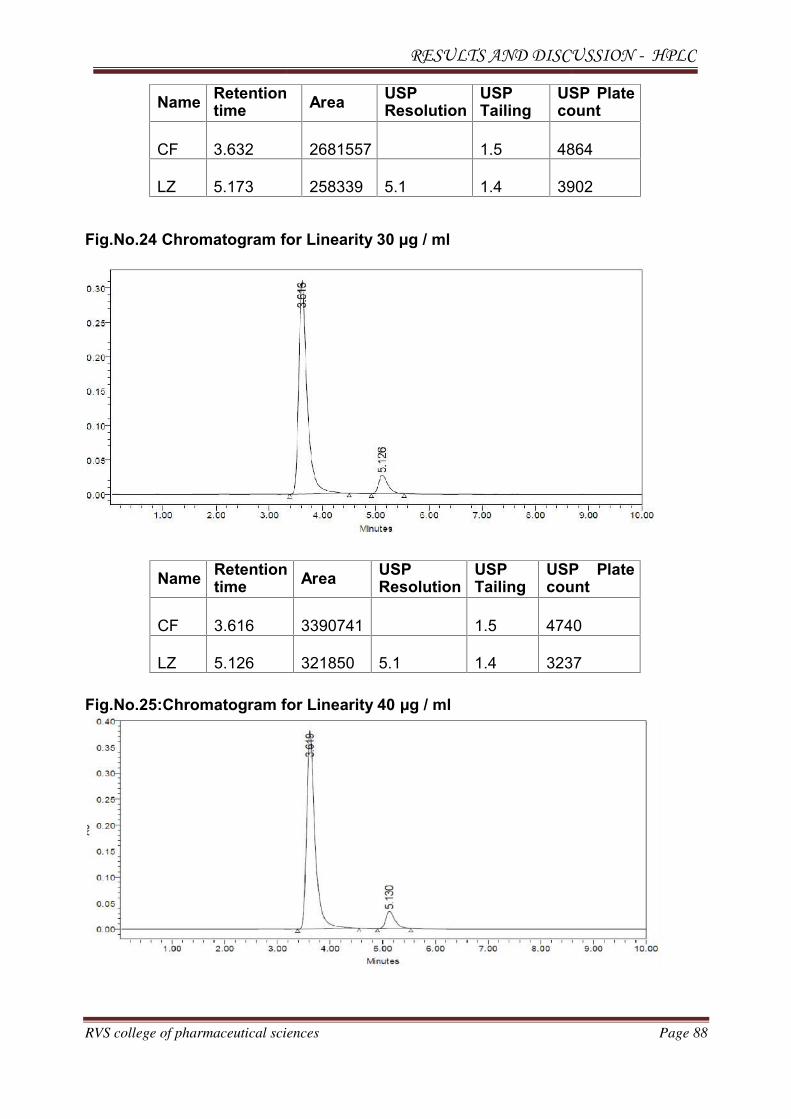
RESULTS AND DISCUSSION - HPLC
RVS college of pharmaceutical sciences Page 88
NameRetentiontime
AreaUSPResolution
USPTailing
USP Platecount
CF 3.632 2681557 1.5 4864
LZ 5.173 258339 5.1 1.4 3902
Fig.No.24 Chromatogram for Linearity 30 µg / ml
NameRetentiontime
AreaUSPResolution
USPTailing
USP Platecount
CF 3.616 3390741 1.5 4740
LZ 5.126 321850 5.1 1.4 3237
Fig.No.25:Chromatogram for Linearity 40 µg / ml

RESULTS AND DISCUSSION - HPLC
RVS college of pharmaceutical sciences Page 89
NameRetention time
Area
USPResolution
USPTailing
USP Platecount
CF 3.619 4161134 1.5 4645
LZ 5.130 394694 5.1 1.4 3320
Fig.No.26:Chromatogram for Linearity 50 µg / ml
NameRetentiontime
AreaUSPResolution
USPTailing
USP Platecount
CF 3.625 4964755 1.5 4874
LZ 5.129 459759 5.1 1.4 3579
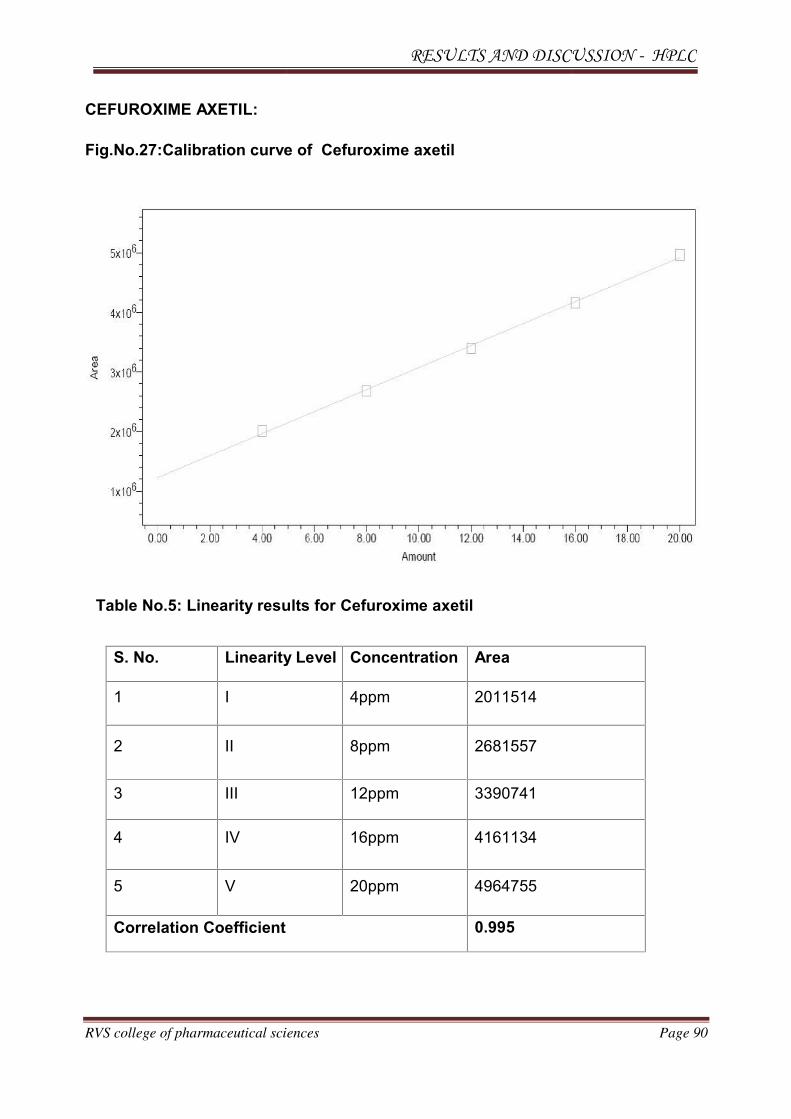
RESULTS AND DISCUSSION - HPLC
RVS college of pharmaceutical scie
CEFUROXIME AXETIL:
Fig.No.27:Calibration curve
Table No.5: Linearity result
S. No. Linearity L
1 I
2 II
3 III
4 IV
5 V
Correlation Coefficient
RESULTS AND DISCUSSION - HPLC
sciences
urve of Cefuroxime axetil
results for Cefuroxime axetil
arity Level Concentration Area
4ppm 2011514
8ppm 2681557
12ppm 3390741
16ppm 4161134
20ppm 4964755
ient 0.995
RESULTS AND DISCUSSION - HPLC
Page 90
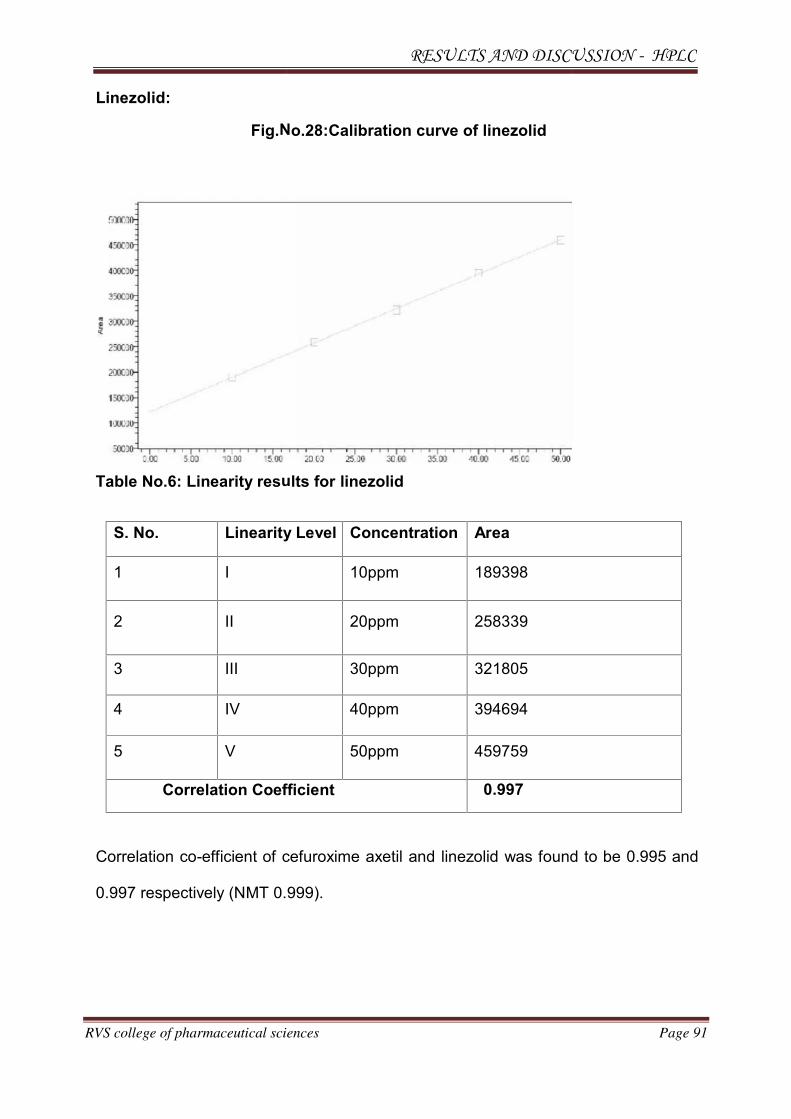
RESULTS AND DISCUSSION - HPLC
RVS college of pharmaceutical sciences Page 91
N
u
Linezolid:
Fig.
Table No.6: Linearity res
o.28:Calibration curve of linezolid
lts for linezolid
S. No. Linearity Level Concentration Area
1 I 10ppm 189398
2 II 20ppm 258339
3 III 30ppm 321805
4 IV 40ppm 394694
5 V 50ppm 459759
Correlation Coefficient 0.997
Correlation co-efficient of cefuroxime axetil and linezolid was found to be 0.995 and
0.997 respectively (NMT 0.999).
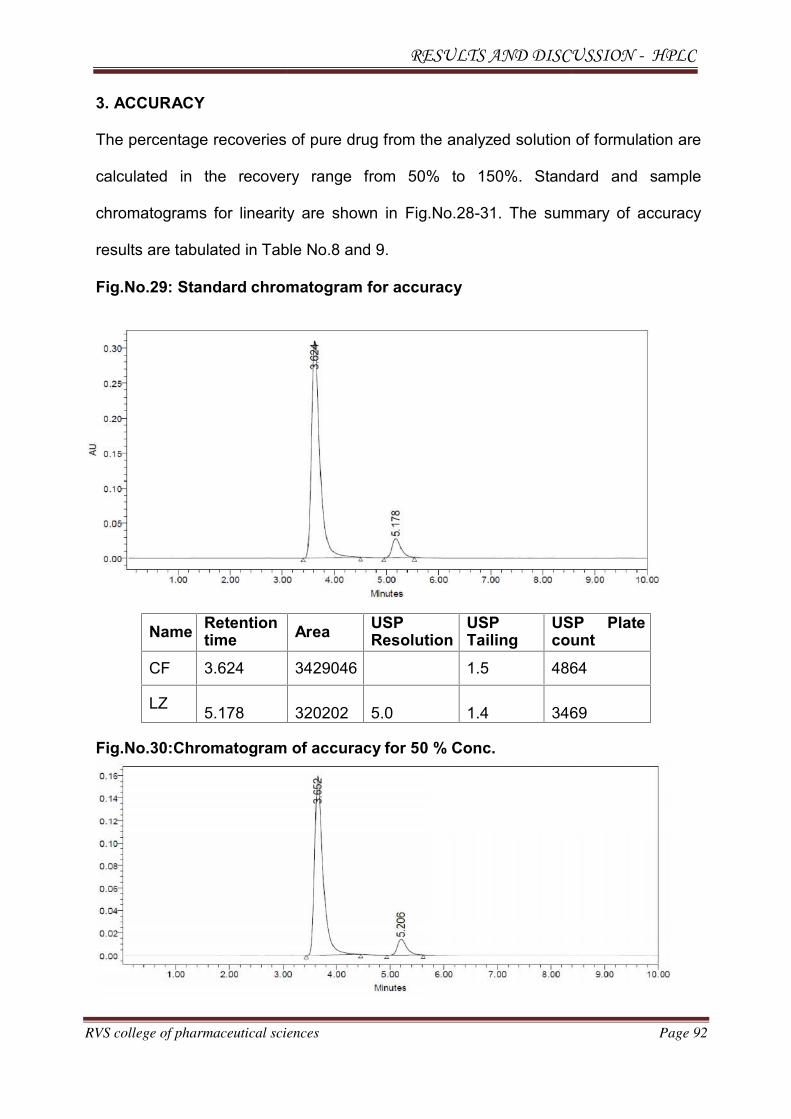
RESULTS AND DISCUSSION - HPLC
RVS college of pharmaceutical sciences Page 92
3. ACCURACY
The percentage recoveries of pure drug from the analyzed solution of formulation are
calculated in the recovery range from 50% to 150%. Standard and sample
chromatograms for linearity are shown in Fig.No.28-31. The summary of accuracy
results are tabulated in Table No.8 and 9.
Fig.No.29: Standard chromatogram for accuracy
NameRetentiontime
AreaUSPResolution
USPTailing
USP Platecount
CF 3.624 3429046 1.5 4864
LZ5.178 320202 5.0 1.4 3469
Fig.No.30:Chromatogram of accuracy for 50 % Conc.
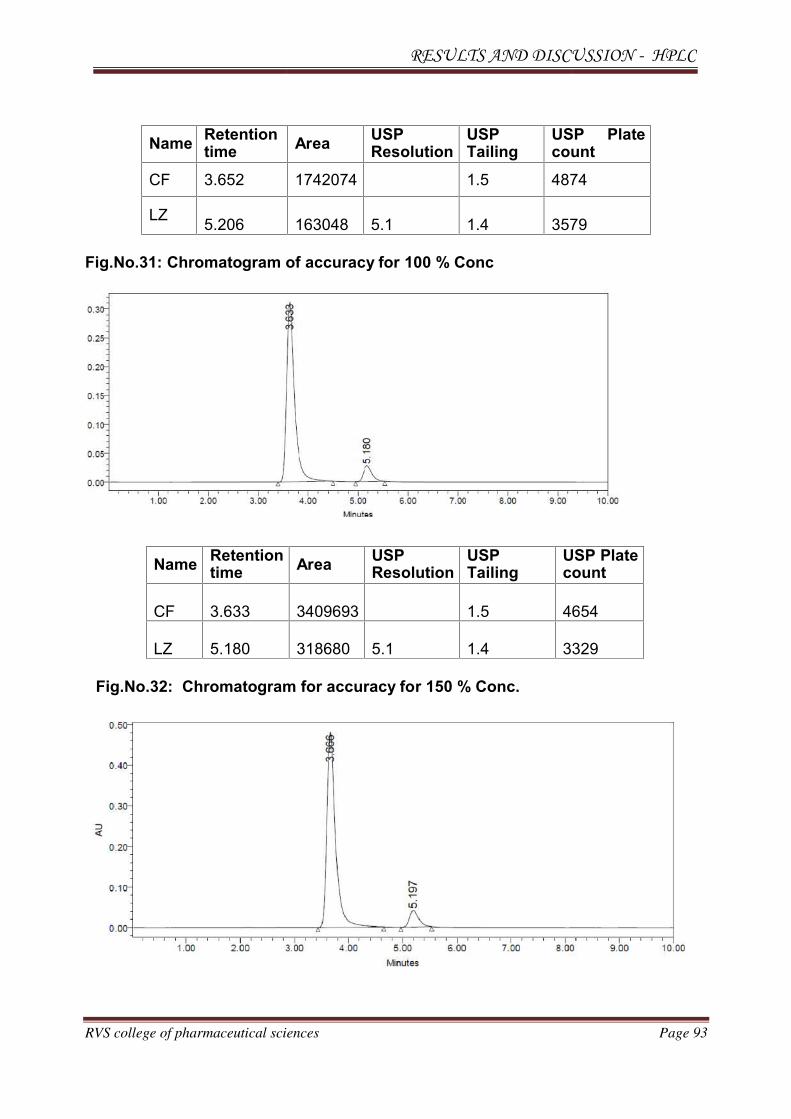
RESULTS AND DISCUSSION - HPLC
RVS college of pharmaceutical sciences Page 93
NameRetentiontime
AreaUSPResolution
USPTailing
USP Platecount
CF 3.652 1742074 1.5 4874
LZ5.206 163048 5.1 1.4 3579
Fig.No.31: Chromatogram of accuracy for 100 % Conc
NameRetentiontime
AreaUSPResolution
USPTailing
USP Platecount
CF 3.633 3409693 1.5 4654
LZ 5.180 318680 5.1 1.4 3329
Fig.No.32: Chromatogram for accuracy for 150 % Conc.
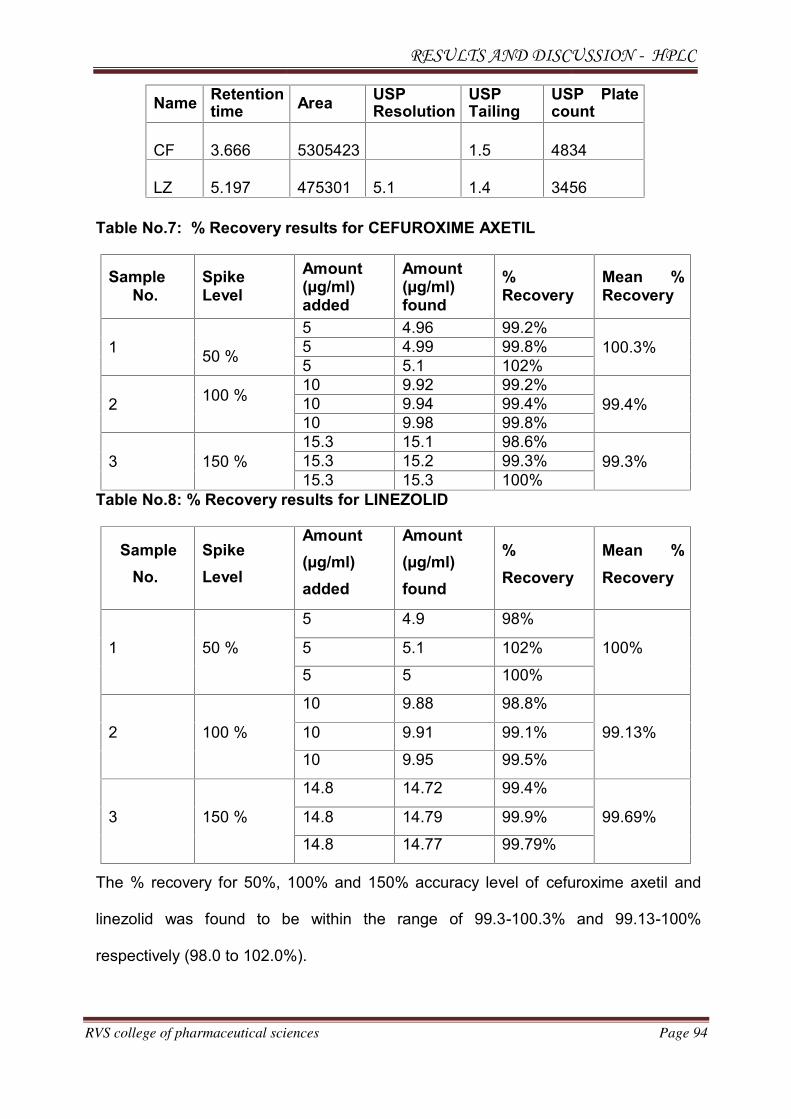
RESULTS AND DISCUSSION - HPLC
RVS college of pharmaceutical sciences Page 94
NameRetentiontime
AreaUSPResolution
USPTailing
USP Platecount
CF 3.666 5305423 1.5 4834
LZ 5.197 475301 5.1 1.4 3456
Table No.7: % Recovery results for CEFUROXIME AXETIL
SampleNo.
SpikeLevel
Amount(µg/ml)added
Amount(µg/ml)found
%Recovery
Mean %Recovery
150 %
5 4.96 99.2%
100.3%5 4.99 99.8%
5 5.1 102%
2100 %
10 9.92 99.2%
99.4%10 9.94 99.4%
10 9.98 99.8%
3 150 %
15.3 15.1 98.6%
99.3%15.3 15.2 99.3%
15.3 15.3 100%
Table No.8: % Recovery results for LINEZOLID
Sample
No.
Spike
Level
Amount
(µg/ml)
added
Amount
(µg/ml)
found
%
Recovery
Mean %
Recovery
1 50 %
5 4.9 98%
100%5 5.1 102%
5 5 100%
2 100 %
10 9.88 98.8%
99.13%10 9.91 99.1%
10 9.95 99.5%
3 150 %
14.8 14.72 99.4%
99.69%14.8 14.79 99.9%
14.8 14.77 99.79%
The % recovery for 50%, 100% and 150% accuracy level of cefuroxime axetil and
linezolid was found to be within the range of 99.3-100.3% and 99.13-100%
respectively (98.0 to 102.0%).
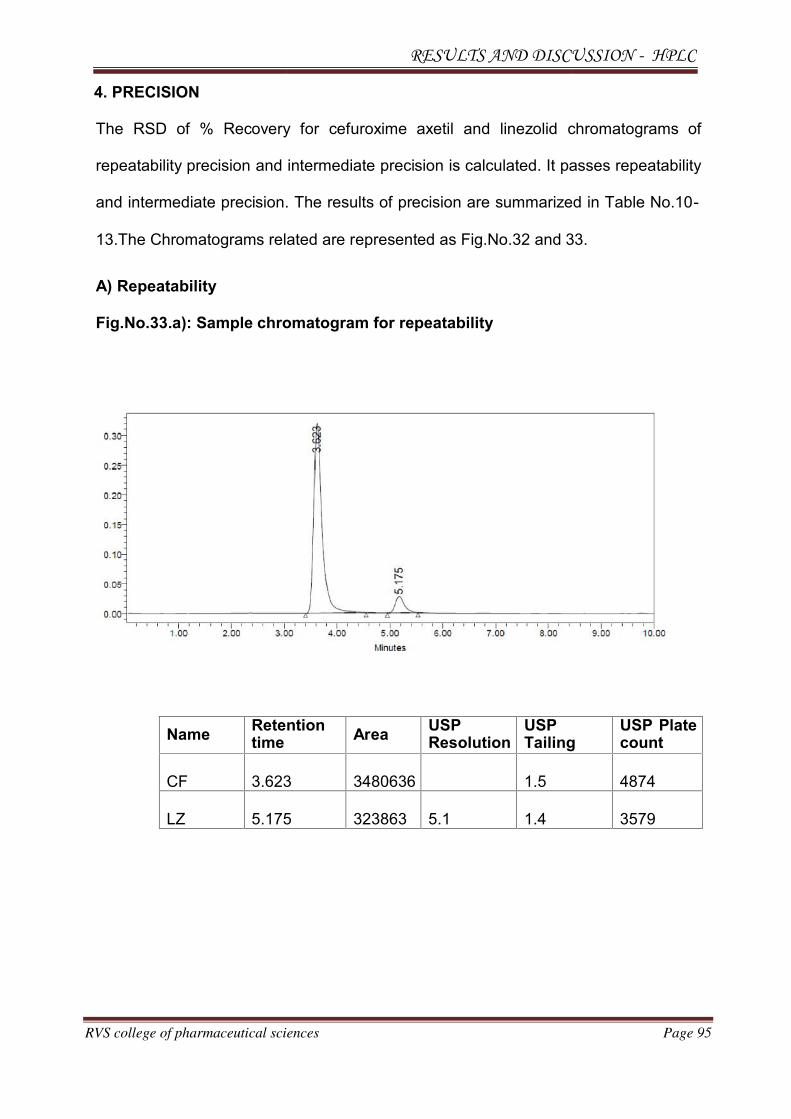
RESULTS AND DISCUSSION - HPLC
RVS college of pharmaceutical sciences Page 95
4. PRECISION
The RSD of % Recovery for cefuroxime axetil and linezolid chromatograms of
repeatability precision and intermediate precision is calculated. It passes repeatability
and intermediate precision. The results of precision are summarized in Table No.10-
13.The Chromatograms related are represented as Fig.No.32 and 33.
A) Repeatability
Fig.No.33.a): Sample chromatogram for repeatability
NameRetentiontime
AreaUSPResolution
USPTailing
USP Platecount
CF 3.623 3480636 1.5 4874
LZ 5.175 323863 5.1 1.4 3579
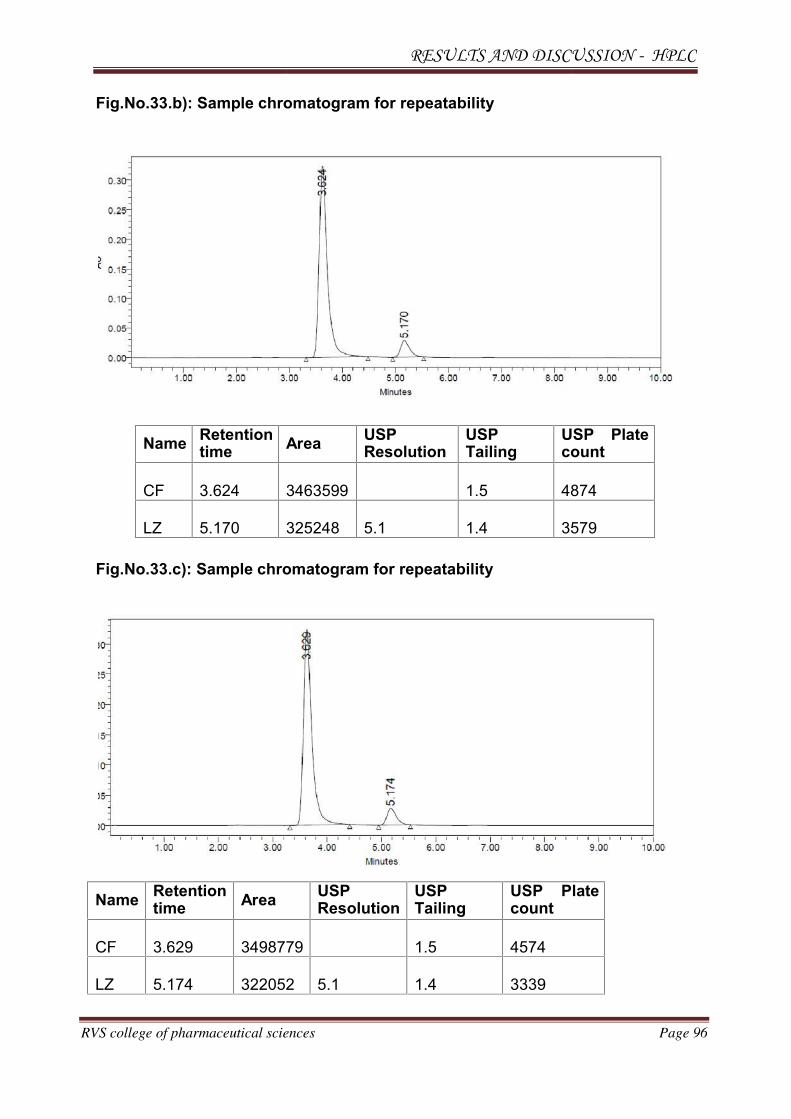
RESULTS AND DISCUSSION - HPLC
RVS college of pharmaceutical sciences Page 96
Fig.No.33.b): Sample chromatogram for repeatability
NameRetentiontime
AreaUSPResolution
USPTailing
USP Platecount
CF 3.624 3463599 1.5 4874
LZ 5.170 325248 5.1 1.4 3579
Fig.No.33.c): Sample chromatogram for repeatability
NameRetentiontime
AreaUSPResolution
USPTailing
USP Platecount
CF 3.629 3498779 1.5 4574
LZ 5.174 322052 5.1 1.4 3339
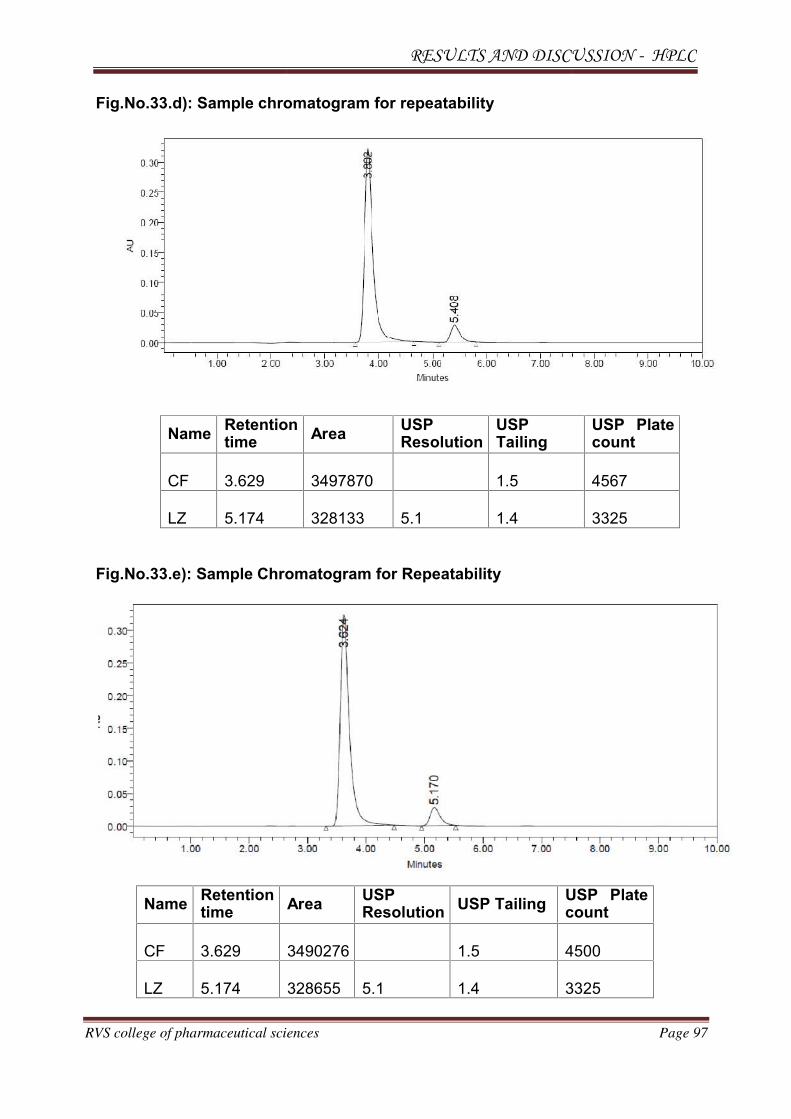
RESULTS AND DISCUSSION - HPLC
RVS college of pharmaceutical sciences Page 97
Fig.No.33.d): Sample chromatogram for repeatability
NameRetentiontime
AreaUSPResolution
USPTailing
USP Platecount
CF 3.629 3497870 1.5 4567
LZ 5.174 328133 5.1 1.4 3325
Fig.No.33.e): Sample Chromatogram for Repeatability
NameRetentiontime
AreaUSPResolution
USP TailingUSP Platecount
CF 3.629 3490276 1.5 4500
LZ 5.174 328655 5.1 1.4 3325
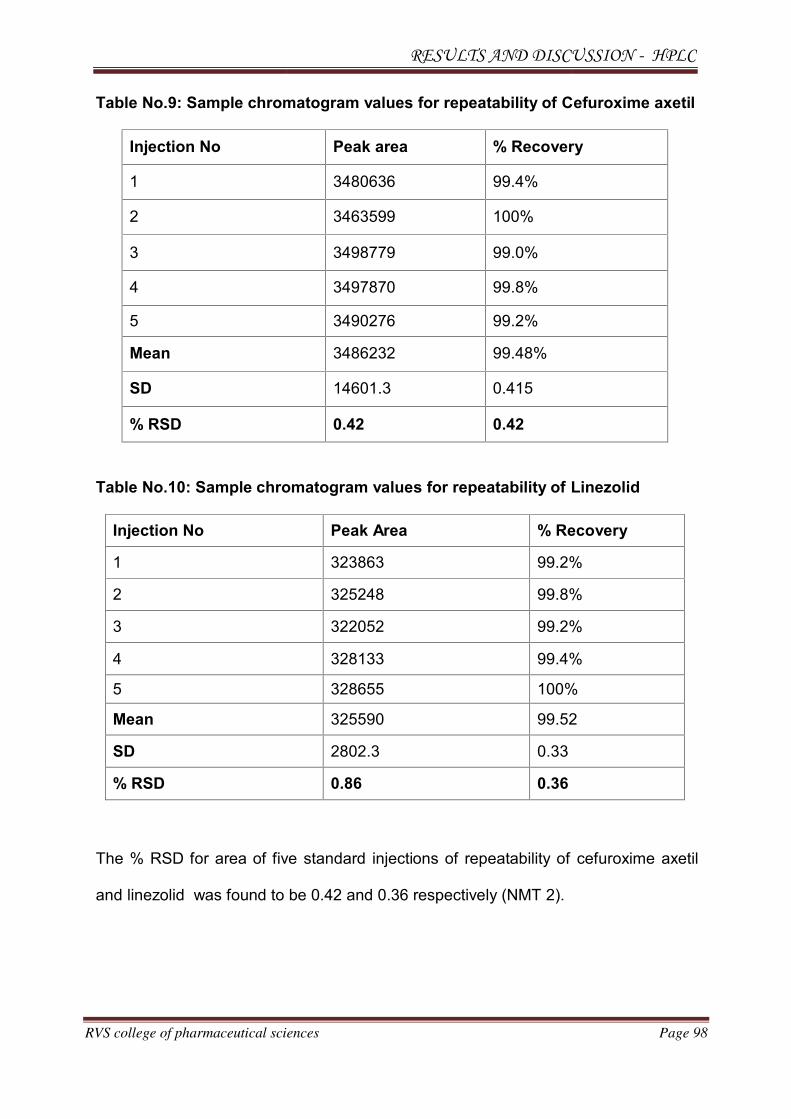
RESULTS AND DISCUSSION - HPLC
RVS college of pharmaceutical sciences Page 98
Table No.9: Sample chromatogram values for repeatability of Cefuroxime axetil
Injection No Peak area % Recovery
1 3480636 99.4%
2 3463599 100%
3 3498779 99.0%
4 3497870 99.8%
5 3490276 99.2%
Mean 3486232 99.48%
SD 14601.3 0.415
% RSD 0.42 0.42
Table No.10: Sample chromatogram values for repeatability of Linezolid
Injection No Peak Area % Recovery
1 323863 99.2%
2 325248 99.8%
3 322052 99.2%
4 328133 99.4%
5 328655 100%
Mean 325590 99.52
SD 2802.3 0.33
% RSD 0.86 0.36
The % RSD for area of five standard injections of repeatability of cefuroxime axetil
and linezolid was found to be 0.42 and 0.36 respectively (NMT 2).

RESULTS AND DISCUSSION - HPLC
RVS college of pharmaceutical sciences Page 99
B. Intermediate precision (analyst to analyst variability):
Comparison of both the results obtained for two different analysts shows that the
assay method was rugged for analyst-analyst variability. The chromatograms for
intermediate precision are shown in Fig.No.34 and 35. The results of intermediate
precision (Ruggedness) were found to be within the limits and are tabulated in Table
No.12-15.
Fig.No.34: Chromatogram for intermediate precision (Day-1, Analyst-1)
NameRetentiontime
AreaUSPResolution
USPTailing
USP Platecount
CF 3.6233490276
1.5 4600
LZ 5.174328655
5.1 1.4 3325
Table No.11: Intermediate precision results for Cefuroxime (Day-1, Analyst-1)
Parameter Peak Area % Assay
Avg* 3486743 99.10%
% RSD* 0.41 0.38
*Average of five determinations
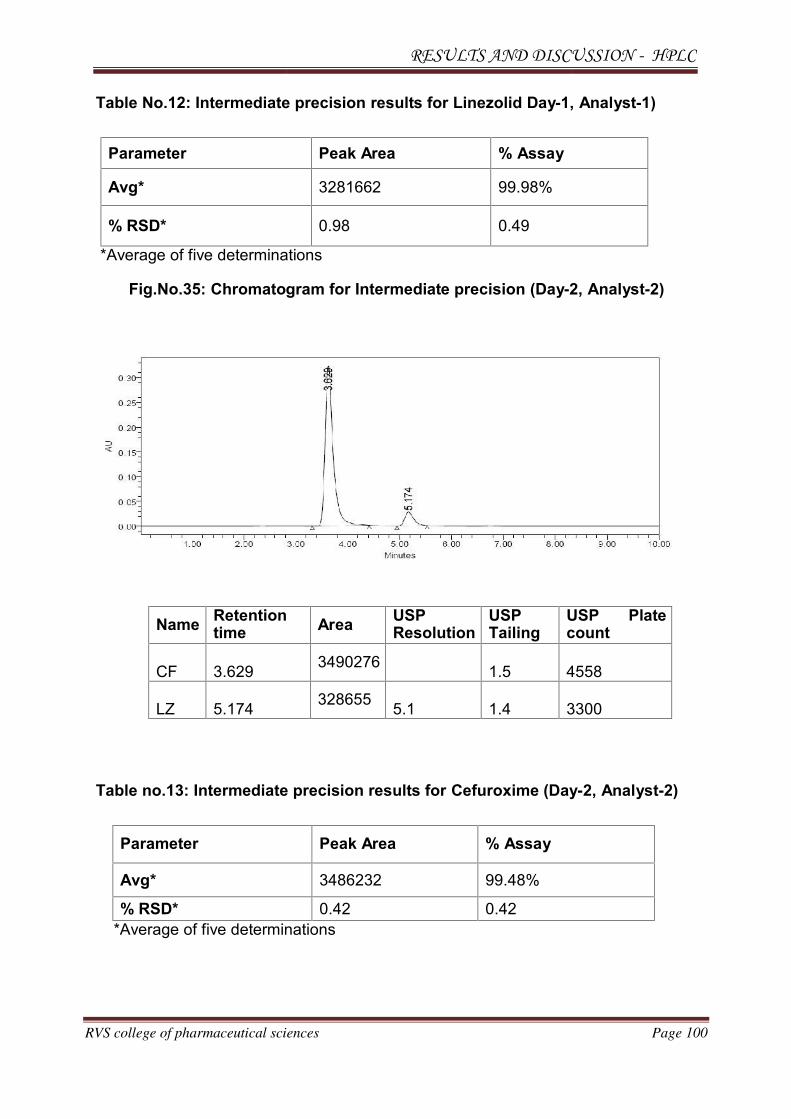
RESULTS AND DISCUSSION - HPLC
RVS college of pharmaceutical sciences Page 100
Table No.12: Intermediate precision results for Linezolid Day-1, Analyst-1)
Parameter Peak Area % Assay
Avg* 3281662 99.98%
% RSD* 0.98 0.49
*Average of five determinations
Fig.No.35: Chromatogram for Intermediate precision (Day-2, Analyst-2)
NameRetentiontime
AreaUSPResolution
USPTailing
USP Platecount
CF 3.6293490276
1.5 4558
LZ 5.174328655
5.1 1.4 3300
Table no.13: Intermediate precision results for Cefuroxime (Day-2, Analyst-2)
Parameter Peak Area % Assay
Avg* 3486232 99.48%
% RSD* 0.42 0.42
*Average of five determinations
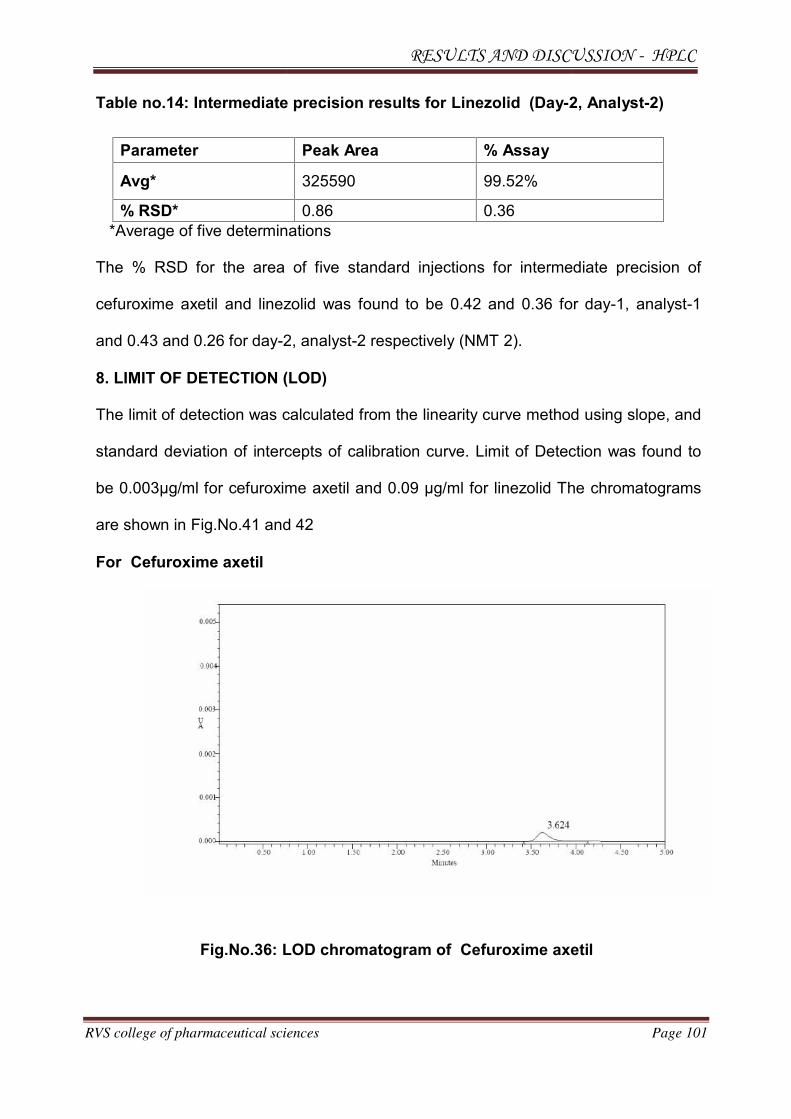
RESULTS AND DISCUSSION - HPLC
RVS college of pharmaceutical sciences Page 101
Table no.14: Intermediate precision results for Linezolid (Day-2, Analyst-2)
Parameter Peak Area % Assay
Avg* 325590 99.52%
% RSD* 0.86 0.36
*Average of five determinations
The % RSD for the area of five standard injections for intermediate precision of
cefuroxime axetil and linezolid was found to be 0.42 and 0.36 for day-1, analyst-1
and 0.43 and 0.26 for day-2, analyst-2 respectively (NMT 2).
8. LIMIT OF DETECTION (LOD)
The limit of detection was calculated from the linearity curve method using slope, and
standard deviation of intercepts of calibration curve. Limit of Detection was found to
be 0.003µg/ml for cefuroxime axetil and 0.09 µg/ml for linezolid The chromatograms
are shown in Fig.No.41 and 42
For Cefuroxime axetil
Fig.No.36: LOD chromatogram of Cefuroxime axetil
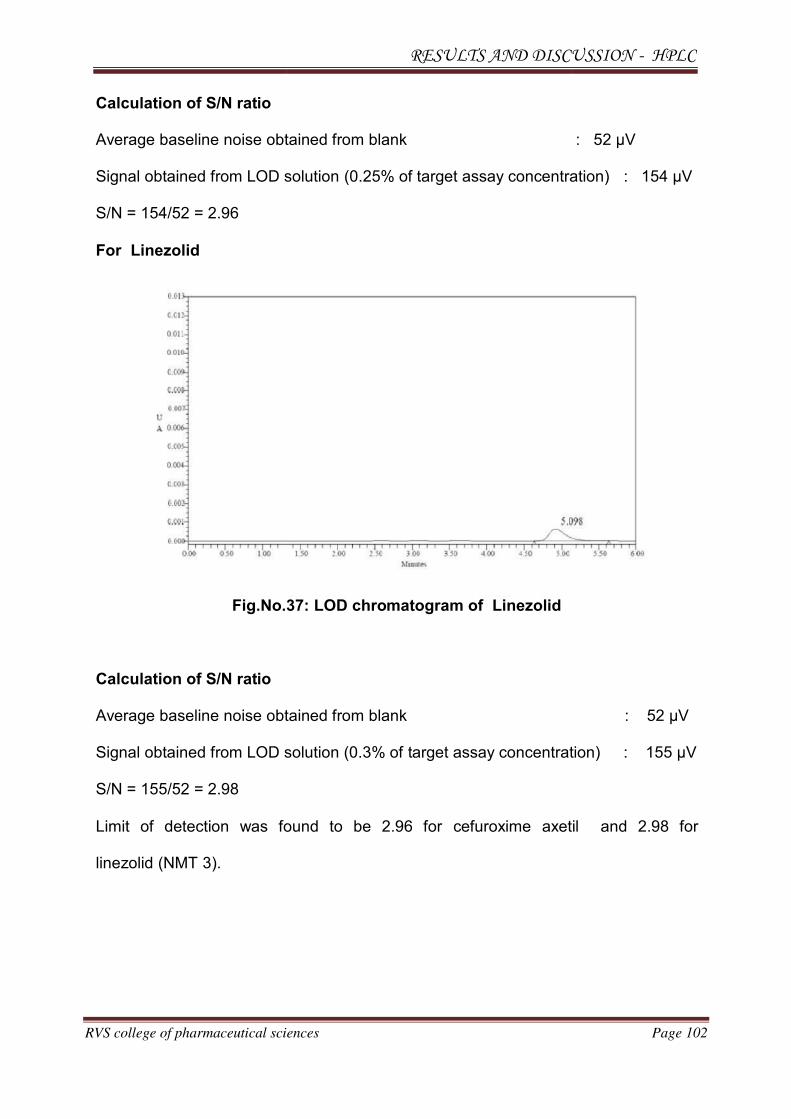
RESULTS AND DISCUSSION - HPLC
RVS college of pharmaceutical sciences Page 102
Calculation of S/N ratio
Average baseline noise obtained from blank : 52 µV
Signal obtained from LOD solution (0.25% of target assay concentration) : 154 µV
S/N = 154/52 = 2.96
For Linezolid
Fig.No.37: LOD chromatogram of Linezolid
Calculation of S/N ratio
Average baseline noise obtained from blank : 52 µV
Signal obtained from LOD solution (0.3% of target assay concentration) : 155 µV
S/N = 155/52 = 2.98
Limit of detection was found to be 2.96 for cefuroxime axetil and 2.98 for
linezolid (NMT 3).
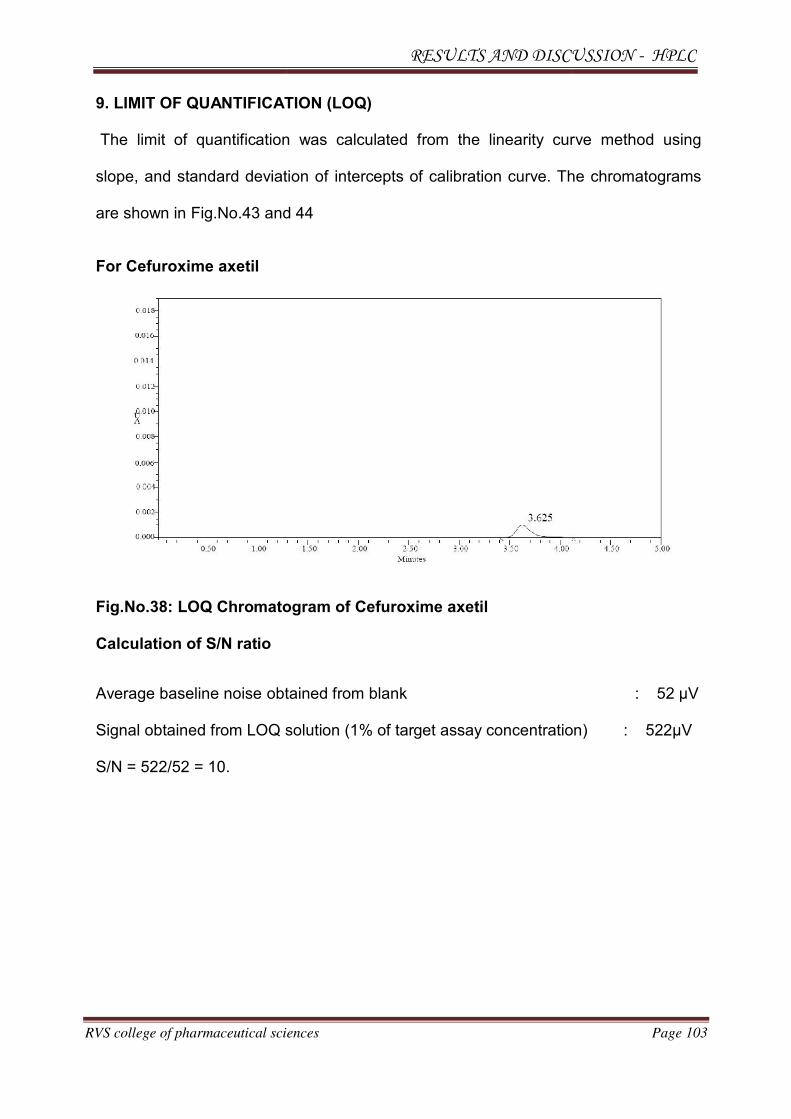
RESULTS AND DISCUSSION - HPLC
RVS college of pharmaceutical sciences Page 103
9. LIMIT OF QUANTIFICATION (LOQ)
The limit of quantification was calculated from the linearity curve method using
slope, and standard deviation of intercepts of calibration curve. The chromatograms
are shown in Fig.No.43 and 44
For Cefuroxime axetil
Fig.No.38: LOQ Chromatogram of Cefuroxime axetil
Calculation of S/N ratio
Average baseline noise obtained from blank : 52 µV
Signal obtained from LOQ solution (1% of target assay concentration) : 522µV
S/N = 522/52 = 10.
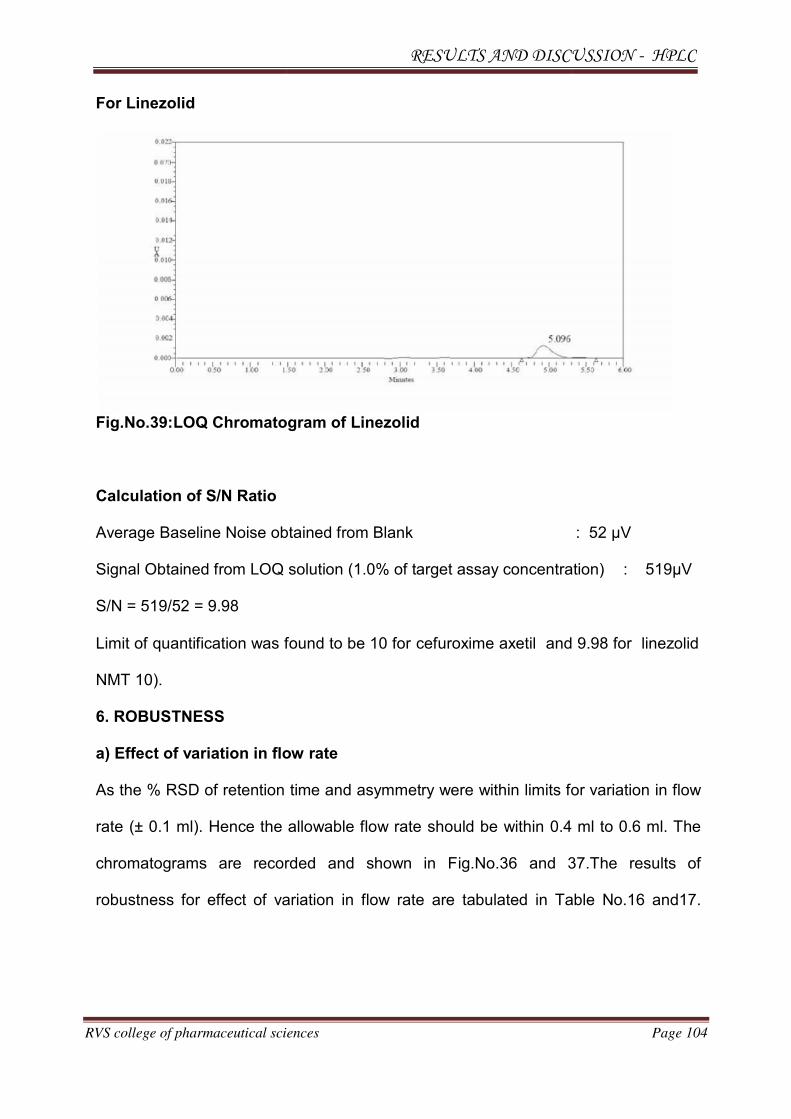
RESULTS AND DISCUSSION - HPLC
RVS college of pharmaceutical sciences Page 104
For Linezolid
Fig.No.39:LOQ Chromatogram of Linezolid
Calculation of S/N Ratio
Average Baseline Noise obtained from Blank : 52 µV
Signal Obtained from LOQ solution (1.0% of target assay concentration) : 519µV
S/N = 519/52 = 9.98
Limit of quantification was found to be 10 for cefuroxime axetil and 9.98 for linezolid
NMT 10).
6. ROBUSTNESS
a) Effect of variation in flow rate
As the % RSD of retention time and asymmetry were within limits for variation in flow
rate (± 0.1 ml). Hence the allowable flow rate should be within 0.4 ml to 0.6 ml. The
chromatograms are recorded and shown in Fig.No.36 and 37.The results of
robustness for effect of variation in flow rate are tabulated in Table No.16 and17.

RESULTS AND DISCUSSION - HPLC
RVS College of pharmaceutical sciences Page 105
Fig.No.40: Chromatogram for Robustness (flow rate-0.4 ml)
NameRetention
timeArea
USPResolution
USPTailing
USP Platecount
CF 3.623 4051994 1.5 4800
LZ 5.175 395859 5.1 1.4 3525
Fig.No.41: Chromatogram for Robustness (flow rate-0.6 ml)
NameRetentiontime
AreaUSPResolution
USPTailing
USP Platecount
CF 3.653 4964755 1.5 4235
LZ 5.204 459759 4.9 1.4 3179
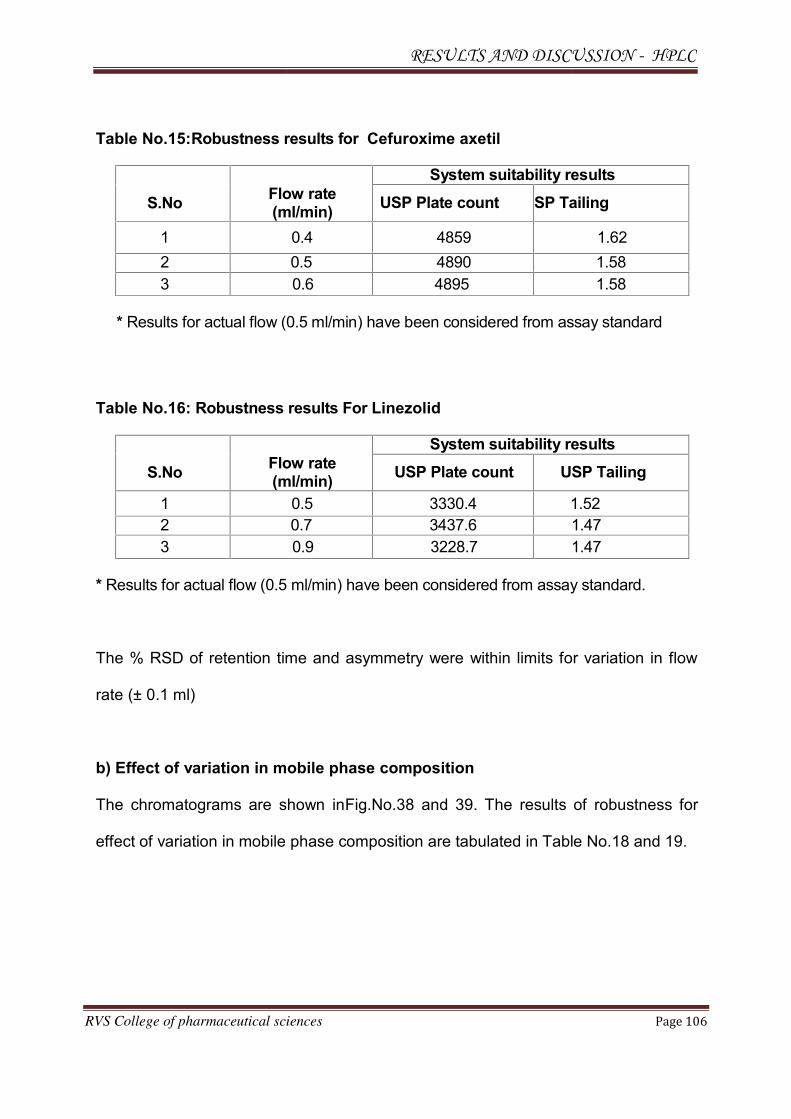
RESULTS AND DISCUSSION - HPLC
RVS College of pharmaceutical sciences Page 106
Table No.15:Robustness results for Cefuroxime axetil
S.NoFlow rate(ml/min)
System suitability results
USP Plate count SP Tailing
1 0.4 4859 1.62
2 0.5 4890 1.58
3 0.6 4895 1.58
* Results for actual flow (0.5 ml/min) have been considered from assay standard
Table No.16: Robustness results For Linezolid
S.NoFlow rate(ml/min)
System suitability results
USP Plate count USP Tailing
1 0.5 3330.4 1.52
2 0.7 3437.6 1.47
3 0.9 3228.7 1.47
* Results for actual flow (0.5 ml/min) have been considered from assay standard.
The % RSD of retention time and asymmetry were within limits for variation in flow
rate (± 0.1 ml)
b) Effect of variation in mobile phase composition
The chromatograms are shown inFig.No.38 and 39. The results of robustness for
effect of variation in mobile phase composition are tabulated in Table No.18 and 19.
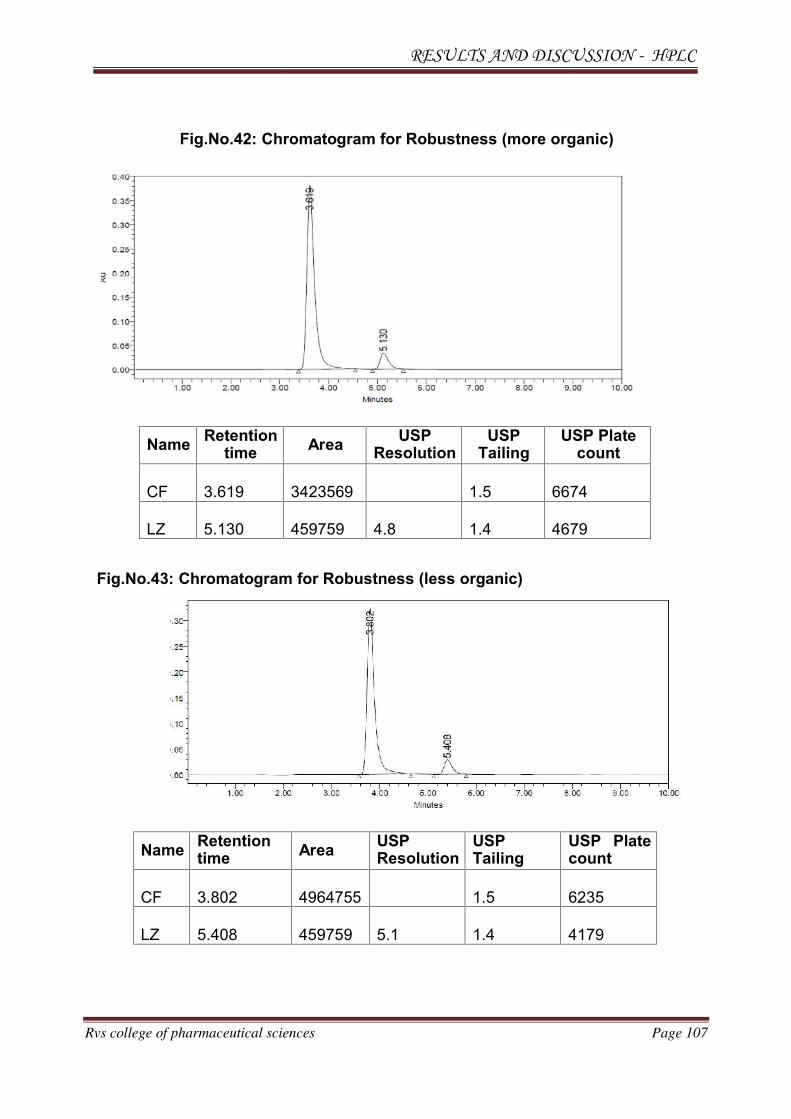
RESULTS AND DISCUSSION - HPLC
Rvs college of pharmaceutical sciences Page 107
Fig.No.42: Chromatogram for Robustness (more organic)
NameRetention
timeArea
USPResolution
USPTailing
USP Platecount
CF 3.619 3423569 1.5 6674
LZ 5.130 459759 4.8 1.4 4679
Fig.No.43: Chromatogram for Robustness (less organic)
NameRetentiontime
AreaUSPResolution
USPTailing
USP Platecount
CF 3.802 4964755 1.5 6235
LZ 5.408 459759 5.1 1.4 4179
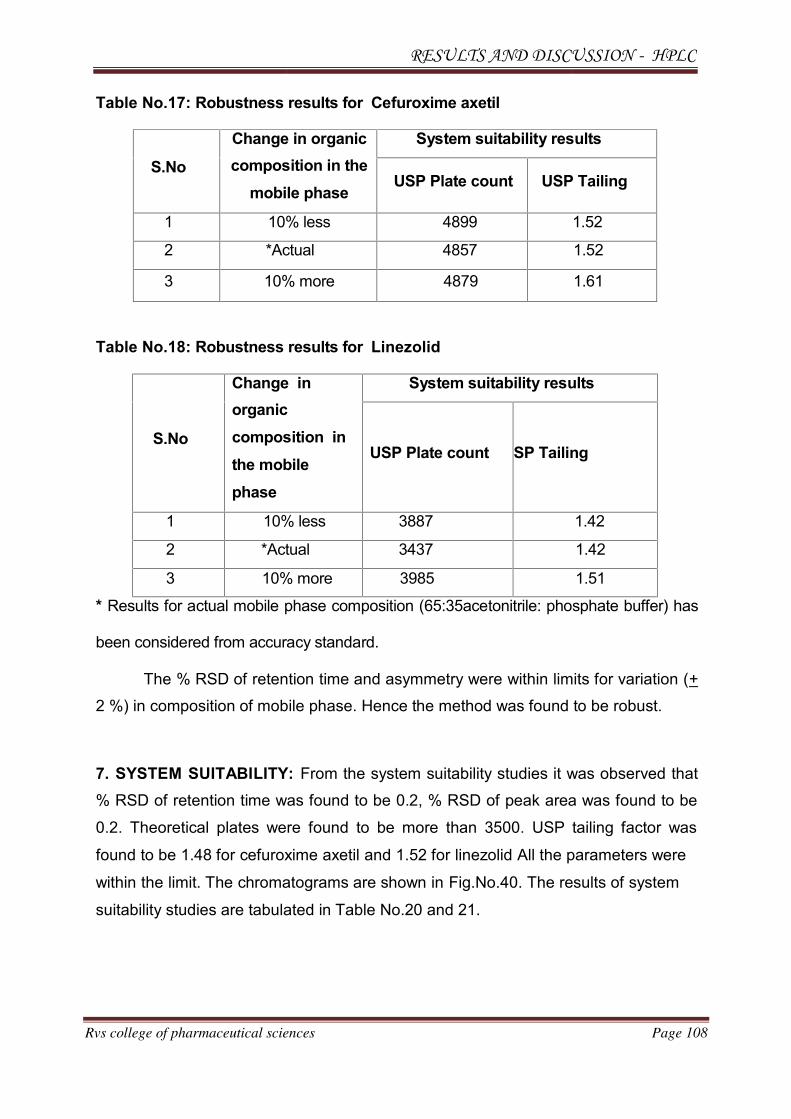
RESULTS AND DISCUSSION - HPLC
Rvs college of pharmaceutical sciences Page 108
Table No.17: Robustness results for Cefuroxime axetil
S.No
Change in organic
composition in the
mobile phase
System suitability results
USP Plate count USP Tailing
1 10% less 4899 1.52
2 *Actual 4857 1.52
3 10% more 4879 1.61
Table No.18: Robustness results for Linezolid
S.No
Change in
organic
composition in
the mobile
phase
System suitability results
USP Plate count SP Tailing
1 10% less 3887 1.42
2 *Actual 3437 1.42
3 10% more 3985 1.51
* Results for actual mobile phase composition (65:35acetonitrile: phosphate buffer) has
been considered from accuracy standard.
The % RSD of retention time and asymmetry were within limits for variation (+
2 %) in composition of mobile phase. Hence the method was found to be robust.
7. SYSTEM SUITABILITY: From the system suitability studies it was observed that
% RSD of retention time was found to be 0.2, % RSD of peak area was found to be
0.2. Theoretical plates were found to be more than 3500. USP tailing factor was
found to be 1.48 for cefuroxime axetil and 1.52 for linezolid All the parameters were
within the limit. The chromatograms are shown in Fig.No.40. The results of system
suitability studies are tabulated in Table No.20 and 21.
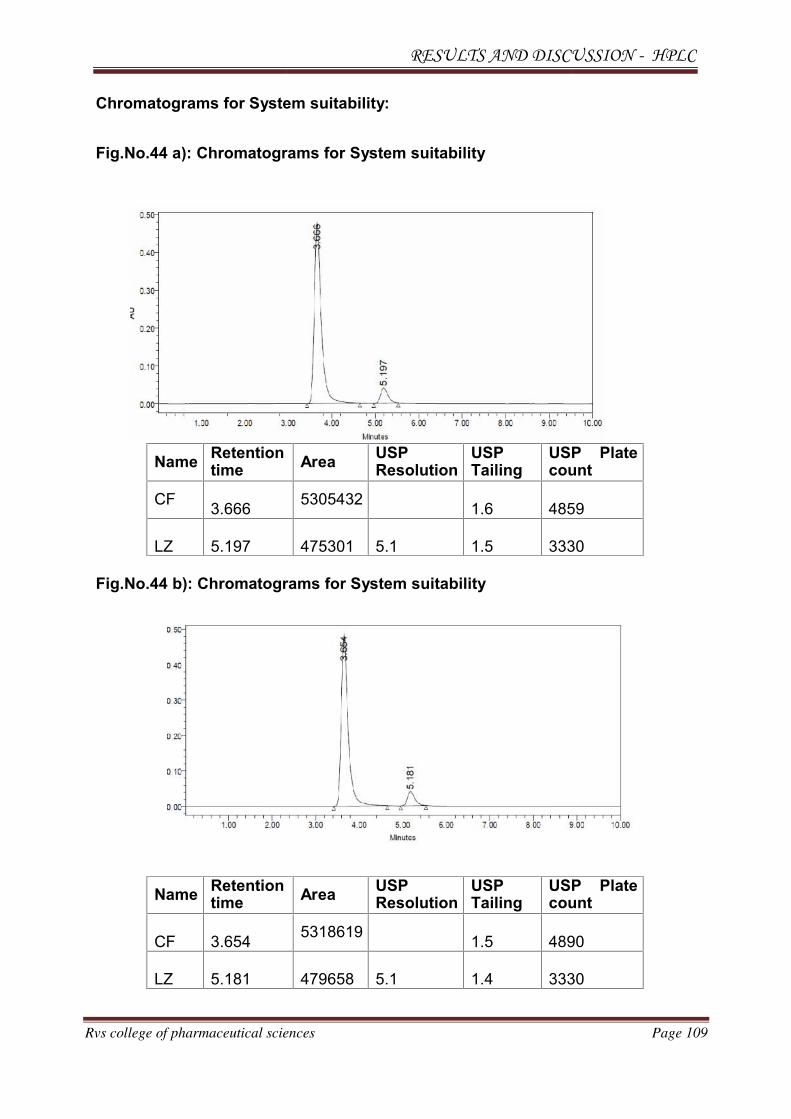
RESULTS AND DISCUSSION - HPLC
Rvs college of pharmaceutical sciences Page 109
Chromatograms for System suitability:
Fig.No.44 a): Chromatograms for System suitability
NameRetentiontime
AreaUSPResolution
USPTailing
USP Platecount
CF3.666
53054321.6 4859
LZ 5.197 475301 5.1 1.5 3330
Fig.No.44 b): Chromatograms for System suitability
NameRetentiontime
AreaUSPResolution
USPTailing
USP Platecount
CF 3.6545318619
1.5 4890
LZ 5.181 479658 5.1 1.4 3330
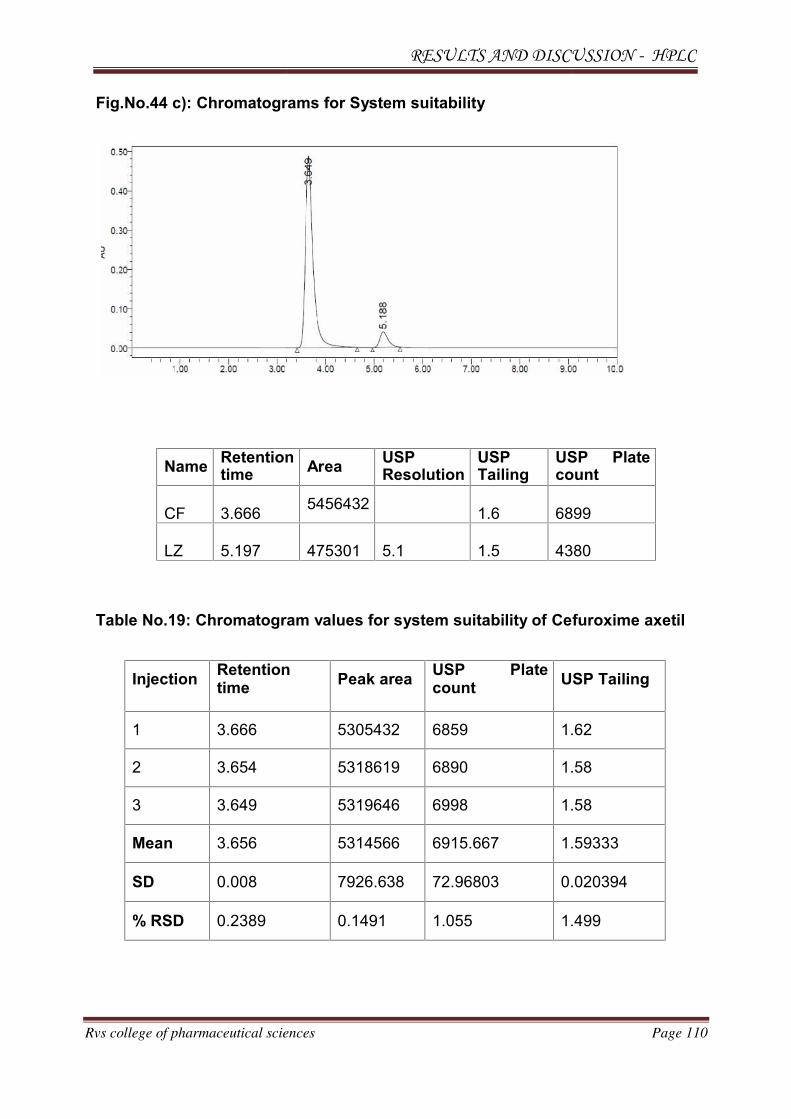
RESULTS AND DISCUSSION - HPLC
Rvs college of pharmaceutical sciences Page 110
Fig.No.44 c): Chromatograms for System suitability
NameRetentiontime
AreaUSPResolution
USPTailing
USP Platecount
CF 3.6665456432
1.6 6899
LZ 5.197 475301 5.1 1.5 4380
Table No.19: Chromatogram values for system suitability of Cefuroxime axetil
InjectionRetentiontime
Peak areaUSP Platecount
USP Tailing
1 3.666 5305432 6859 1.62
2 3.654 5318619 6890 1.58
3 3.649 5319646 6998 1.58
Mean 3.656 5314566 6915.667 1.59333
SD 0.008 7926.638 72.96803 0.020394
% RSD 0.2389 0.1491 1.055 1.499
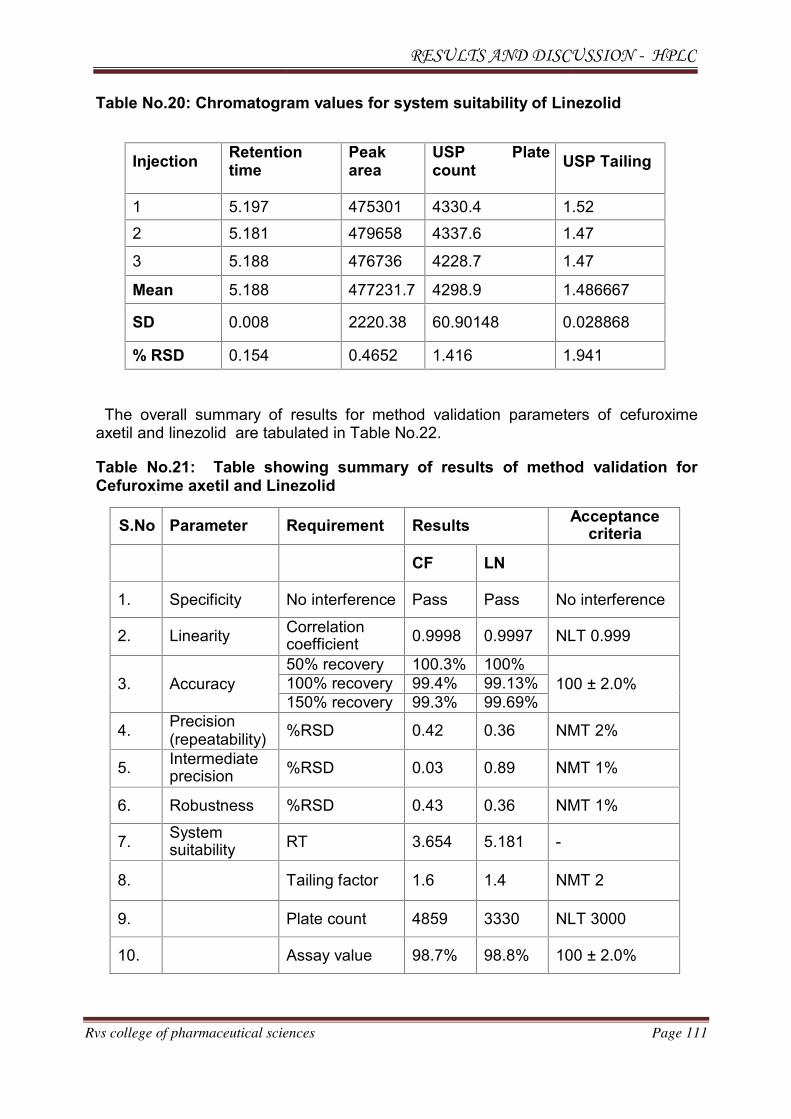
RESULTS AND DISCUSSION - HPLC
Rvs college of pharmaceutical sciences Page 111
Table No.20: Chromatogram values for system suitability of Linezolid
InjectionRetentiontime
Peakarea
USP Platecount
USP Tailing
1 5.197 475301 4330.4 1.52
2 5.181 479658 4337.6 1.47
3 5.188 476736 4228.7 1.47
Mean 5.188 477231.7 4298.9 1.486667
SD 0.008 2220.38 60.90148 0.028868
% RSD 0.154 0.4652 1.416 1.941
The overall summary of results for method validation parameters of cefuroximeaxetil and linezolid are tabulated in Table No.22.
Table No.21: Table showing summary of results of method validation forCefuroxime axetil and Linezolid
S.No Parameter Requirement ResultsAcceptance
criteria
CF LN
1. Specificity No interference Pass Pass No interference
2. LinearityCorrelationcoefficient
0.9998 0.9997 NLT 0.999
3. Accuracy
50% recovery 100.3% 100%
100 ± 2.0%100% recovery 99.4% 99.13%
150% recovery 99.3% 99.69%
4.Precision(repeatability)
%RSD 0.42 0.36 NMT 2%
5.Intermediateprecision
%RSD 0.03 0.89 NMT 1%
6. Robustness %RSD 0.43 0.36 NMT 1%
7.Systemsuitability
RT 3.654 5.181 -
8. Tailing factor 1.6 1.4 NMT 2
9. Plate count 4859 3330 NLT 3000
10. Assay value 98.7% 98.8% 100 ± 2.0%

Results & Discussion - HPTLC
RVS College of Pharmaceutical Sciences Page 112
5.2 RESULT AND DISCUSSION-HPTLC
METHOD-II: HPTLC determination of Cefuroxime axetil and Linezolid in
dosage form
• The solvent used for preparation of stock solution was methanol HPLC grade.
• The stationary phase was pre-coated plates of silica gel G 60 F60 F254 and the
mobile phase used was Methanol: Toluene: Hexane (2:5:3, v/v/v).
• The Rf value was found to be 0.21 and 0.30for CEF and LIN respectively. The
plate was scanned and quantified at 254 nm.
• Calibration curve for each drug was plotted using to parameters concentration
v/s peak height. The linearity range of Cefuroxime axetiland Linezolidwere100-
400ng/spot.
• The marketed product (Oratil LZ) containing 500 mg of Cefuroxime axetil and
600 mg of Linezolid was analyzed by the developed method and gave good
results. Amount of drugs in analyzed dosage form was found to be
Cefuroxime axetil
496.81mg by height wise
504.45 mg by area wise
Linezolid
596.35 mg by height wise
600.37mg by area wise
• The percentage label claim for Cefuroxime axetil was 99.32% (height wise)and
100.89%(area wise) and for Linezolid 99.33% (areawise)
• The validation of the developed method was performed in accordance with ICH
guidelines (Q2B Validation of Analytical Procedures: Methodology)
• The accuracy of the proposed method was studied by recovery studies at three
levels (80%, 100 and 120%)
Results & Discussion - HPTLC
RVS College of Pharmaceutical Sciences Page 113
• The precision of the proposed method was studied by repeatability and
intermediate precision. The %RSD of the proposed method was found to be < 2.
• The LOD and LOQ were determined and satisfactory results obtained.
• The proposed method was found to be accurate, precise and reliable.
Conclusion
RVS College of Pharmaceutical Sciences Page 114
6. CONCLUSION
A new method of analysis is developed for simultaneous estimation of
Cefuroxime axetil and Linezolid drugs in pharmaceutical tablet dosage form by RP-
HPLC and HPTLC method. The analytical procedure is validated as per ICH Q2B
guidelines and shown to be simple,accurate, precise and specific. For routine
analytical purpose it is desirable to establish methods capable of analyzing huge
number of samples in a short time period with good robustness, accuracy and
precision without any prior separation step. HPLC and HPTLC method generates
large amount of quality data, which serve as highly powerful and convenient
analytical tool.
Cefuroxime axetil was freely soluble in ethanol, methanol, acetonitrile and
insoluble in water. Linezolid was soluble in chloroform, alcohol and insoluble in ether.
acetonitrile. and phosphate buffer was chosen as the mobile phase. The run time of
the HPLC procedure was 10 minutes. The method was validated for system
suitability, linearity, precision, accuracy, specificity, ruggedness robustness, LOD and
LOQ. The system suitability parameters were within limit, hence it was concluded that
the system was suitable to perform the assay. The method shows linearity between
the concentration range of 10-50µg / ml. The % recovery of Cefuroxime axetil and
Linezolid was found to be in the range of 99.22 % - 100.11 %. As there was no
interference due to excipients and mobile phase, the method was found to be
specific. The method was robust and rugged as observed from insignificant variation
in the results of analysis by changes in flow rate and mobile phase composition
Conclusion
RVS College of Pharmaceutical Sciences Page 115
separately and analysis being performed by different analysts. Good agreement was
seen in the assay results of Pharmaceutical formulation by developed method.
Hence, it can be concluded that the proposed methods using HPLC and
HPTLC can be regarded as simple, fast reproducible and sensitive methods for the
simultaneous estimation of Cefuroxime axetil and Linezolid in combined dosage
form. Hence, these methods can be used for the in process evaluation in
Pharmaceutical Manufacturing Firms and routine quality control of these drugs in
Drug Testing Laboratories.
Bibiliography
RVS College of pharmaceutical sciences Page 116
7. BIBILIOGRAPHY
1. Sharma BK, Instrumental methods of chemical analysis, 7th Ed, Goel Publishing
House, Meerut, 2000, PP.1-2.
2. David CL, Pharmaceutical analysis, 6th Ed, Black well publishing, London, 1994,
PP.2-4.
3. Chatten LG, Pharmaceutical chemistry, Vol. II, Marcel Dekker Inc, New York,
1996, PP.23-25.
4. Beckett AH, Stenlake JB, Practical pharmaceutical chemistry, Vol. II, CBS
publisher and distributors, New Delhi, 1986, PP.13-17.
5. Ashish Chauhan, Bharti Mittu, Priyanka Chauhan. Analytical method development
and validation: A concise review. J Anal Bioanal Tech. 2015 February: 233-238
6. Rajani Puthuri, Ma Muthukumaran, B Krishnamoorthy. A review on analytical
method development and validation of pharmaceutical technology. Pharmatutor.
ART-1671
7. Massom Raza Siddiqui, Zei A Alothman, Nafisur Rahamn. Analytical techniques in
pharmaceutical analysis: A review. Arabian J Chem. 2013 April; 1-12
8. Michel W dong. Modern HPLC for practicing scientists. Wiley Interscience
publication, 2006, 1-35
9. Yuri Kazakevich, Rosario Lobrutto. HPLC for pharmaceutical scientists. Wiley
interescience publication. 2007. 11-20
10. Vibha Gupta, Ajay Deep K J, N S Gill, Kapil Gupta. Development and validation of
HPLC method-a review. Int Res J Pharm App Sci.2012;2(4):1725
11. www.agilent.com/chem/store

Bibiliography
RVS College of pharmaceutical sciences Page 117
12. Thompson M, Ellison SLR, Wood R. Harmonized guidelines for single laboratory
validation of method of analysis-IUPAC technical report. Pure Appl Chem.
2002.835-855
13. Shabir G A, Lough W J, Arian S A, Bradshaw T K. Evaluation and application of
best practice in analytical method validation. J Chromatogr. 2007:311-330.
14. Dr S Ravi Sankar Text book of Pharmaceutical analysis. 4th edition. Rx
Publications. 2012. 18.1-18-15
15.Srivastava M. High Performance Thin Layer Chromatography (HPTLC). New York:
Springer Heidelberg Dordrecht; 2011.18-66
16. Connors K.A A Textbook of Pharmaceutical Analysis. 3rd edition. New Delhi;
Wiley-Interscience Publication: 2002. 173-214
17. Sethi P D. HPTLC, Quantitative Analysis of Pharmaceutical Formulations. New
Delhi: CBS Publishers and Distributors; 1996. 220-237.
18. Jack Cazes. Analytical instrumentation handbook. Marcel Dekker Publishers.
2005. 996-1012.
19. Patel Rashmin, Patel Mrunali, D Nithin, D Nidhi HPTLC method development and
validation: strategy to minimize methodological failure. J Food Drug Anal. 2012
October; 20(4): 794-804
20. Quantity assurance pharmaceutical (A Compendium of guidelines and related
materials). 1997. Vol 1. WHO, Geneva, 119-124
21. Guidance for industry. Q2B validation of analytical procedure: METHODOLOGY.
1996 November. ICH.1-8
Bibiliography
RVS College of pharmaceutical sciences Page 118
22.Validation of analytical procedures: Text and Methodology. Q2 (RI). ICH
Harmonized Tripartite Guideline. 6-13
23. P Santhosh Kumar, B Jayanthi, K Abdul, UV Prasad, Y Nanda Kumar, PVGK
Sarama. A validated High Performance Liquid Chromatographic method for the
estimation of Cefuroxime axetil. RJPBCS.2012 July; 3(3):223-228
24.N J Shah, S K Shah, V F Patel, N M Patel Shri. Development and validation of a
HPTLC method for the estimation of Cefuroxime axetil. Indian J Pharm
Sci.2007;69(1):140-142
25.Poonam N. Ranjane, Santosh V Gandhi, Sayali S. Kadukar, and Kailash
G.Bothara. HPTLC determination of Cefuroxime axetil and Ornidazole in combined
tablet dosage form Chrome Analysis. 2010 January; 48(3):26-28
26. J.D. Modi, P.B. Patel, Z.N.Patel, N.N Parikh, F.U. Chaudhari. Development and
validation of analytical method for simultaneous estimation of Cefuroxime sodium
and Potassium clavulanate in bulk and combined dosage form. An Int J Pharm
Sci.2014 April; 5(2): 117-124
27. Rezowanur Rahman, Asaduzzaman, S M Ashraful Islam. Development and
validation of UV spectrophotometric method for the determination of Cefuroxime in
Pharmaceutical dosage forms. Am J Pharm Tech Res.2012; 2(4):351-358
28. Pramod L.I, Sampada D Dalvi, Deepali D, Jadav, Sachin V G. Simultaneous
estimation of Cefuroxime axetil and Postassium Clavulanate-analytical method
development and validation. Int J Pharm Pharm Sci.2013 September; 5(4): 179-
181
Bibiliography
RVS College of pharmaceutical sciences Page 119
29.M V Shined, S A Pisawikar, Spectrophotometric determination of Cefuroxime axetil
from bulk and its tablet dosage form. Indian J Pharm Sci.2008 March
April;70(2):249-251
30. Mahima R S Santhosh V G Upasana P P, Vivek S R. Reverse phase high
performance liquid chromatographic method for the simultaneous determination of
Cefuroxime axetil and Potassium clavulanate in tablet dosage form. Int J Chem
PTech Res. 2009 December; 1(4): 1105-1108
31.Pramod L.I, Sampada D-Dalvi, Deepali D, Jadav Sachin V G. Simultaneous
determination of Cefuroxime axetil and Potassium clavulanate in pharmaceutical
dosage form by RP-HPLC. Int J Pharm Pharm Sci.2013 September; 5(4) : 179-181
32.P Prasanthi, Amala Mateti, P Vanitha, Mahesh Kumar, Development and validation
of UV spectrophotometric method for the estimation of Linezolid in bulk and
pharmaceutical formulation. Int J Pharm Sci Res.2012 August; 2(3) : 57-60
33.Sushama S, Pushpa latha E. Method development and validation of
spectrophotometric method for the estimation of Linezolid in pure and tablet
dosage form. Asian J Pharm Ana J Pharm Med Chem. 2015 April; 3(2): 82-88
34. V G Patel, Bhaskarrav Makwana. R P-HPLC method and validation for the
analysis of pharmaceutical dosage form-Linezoild. Int J Sci Res.2014 February;
3(2): 49-52
35. Sathyanarayana Raju T, O Vishweshwari, P Yadagiri Swamy. A validated stability
indicating LC method for the separation of enantiomer and potential impurities of
Linezolid using polar organic mode. J Pharm Anal.2012 August; 2(4): 272-278
Bibiliography
RVS College of pharmaceutical sciences Page 120
36. Gandhiya Dolly Thulsibai, Bagada Hina L. Spectrophotometric method
development and validation for estimation of Linezolid in tablet dosage form. Int
Res J Pharm.2013; 3(3): 06-12
37. Patel Satish A, Patel Jinalben V. Spectrophotometric method for simultaneous
estimation of Cefixime trihydrate and Linezolid in tablet dosage form. Int.Re J
Pharm.2013; 4(1): 161-164
38.Nidhi S P, Falguni B, Yogitha D Patel, Karthavya B Thakkar-Development and
validation of stability indicating HPLC method for simultaneous estimation of
Cefixime and Linezolid. Ind J Pharm Sci.2014 November-December; 76(6) : 535-
540
39. Jebaliya H, Vachhani P, Sankhavara D, Bhut D, Patel M, Dhabi B. stability
indicating RP-UPLC method development and validation for assay and content
uniformity test of Linezolid with array detector. Invent impactppaqa/592/12
40.Kinjal A. Patel, Jignesh S. Shah, Dilip G. Maheshwari, Development and
Validation RP-HPLC Method For Simultaneous Estimation of Cefuroxime Axetil
and Linezolid In Combined Dosage Form, Asian Journal of Pharmaceutical
Technology & Innovation, 04 (17); 2016, 22-30