Embed Size (px)
Citation preview
Method 201A and 202
Best Practices to Reduce Blanks
Prepared for:
Dr. Raymond Merrill
U.S. Environmental Protection Agency OAQPS/AQAD/MTG
109 TW Alexander Drive
Mail Code E143-02
Research Triangle Park, NC 27711
Prepared by:
Christopher Kopp
Eastern Research Group, Inc. 601 Keystone Park Drive, Suite 700
Morrisville, NC 27560
Draft December 31, 2013
Final
October 27, 2015
EPA Contract No. EP-D-11-006
Work Assignment 3-07
ii
TABLE OF CONTENTS
1.0 EXECUTIVE SUMMARY ...............................................................................................1
1.1 Gravimetric Analysis Procedures ..................................................................................4
1.2 Quality Control .............................................................................................................6
1.3 Findings ........................................................................................................................7
2.0 METHOD 201A AND 202 BEST PRACTICES SURVEYS .............................................8
2.1 Materials .......................................................................................................................8
2.2 Procedures .................................................................................................................. 11
2.3 Conclusions ................................................................................................................ 12
3.0 METHOD 202 CONDENSABLE PARTICULATE MATTER FILTER
EVALUATION .............................................................................................................. 15
3.1 Procedures .................................................................................................................. 16
3.2 Quality Control ........................................................................................................... 20
3.3 Analytical Results ....................................................................................................... 22
3.4 Conclusions ................................................................................................................ 27
4.0 METHOD 202 REAGENT EVALUATION ................................................................... 32
4.1 Procedures .................................................................................................................. 33
4.2 Quality Control ........................................................................................................... 36
4.3 Analytical Results ....................................................................................................... 39
4.4 Conclusions ................................................................................................................ 42
5.0 METHOD 202 SAMPLING TRAIN EVALUATION ..................................................... 46
5.1 Procedures .................................................................................................................. 47
5.2 Quality Control ........................................................................................................... 53
5.3 Analytical Results ....................................................................................................... 55
5.4 Conclusions ................................................................................................................ 61
6.0 CONCLUSIONS AND BEST PRACTICES ................................................................... 67
7.0 REFERENCES ............................................................................................................... 68
8.0 APPENDIX .................................................................................................................... 69
iii
List of Figures
Figure 1. Schematic of Combined Method 201A & 202 Field Sampling Train ............................4
Figure 2. Hydrophobic Teflon Membrane Inorganic and Organic Results (Net Avg Wts) .......... 27
Figure 3. Hydrophilic Teflon Membrane Inorganic and Organic Results (Net Avg Wts) ............ 27
Figure 4. Hydrophobic Teflon Membrane CPM Filter Blank Results (Net Avg Wts) ................. 28
Figure 5. Hydrophilic Teflon Membrane CPM Filter Blank Results (Net Avg Wts) ................... 28
Figure 6. Teflon Membrane CPM Filter Blank Results (Net Avg Wts) ...................................... 29
Figure 7. CPM Filter Average Results (Net Average Weights) .................................................. 29
Figure 8. CPM Filter %RSD Comparison .................................................................................. 30
Figure 9. CPM Filter UPL Comparison (Net Average Weights) ................................................ 30
Figure 10. Water C Reagent Blank Residual Mass Results (Net Average Weights) ................... 43
Figure 11. Hexane A Reagent Blank Residual Mass Results (Net Average Weights) ................. 43
Figure 12. Average Hexane and Water Results (Net Average Weights) ..................................... 44
Figure 13. Hexane and Water %RSD Comparison ..................................................................... 44
Figure 14. Reagent Blank UPL Comparison (Net Average Weights) ......................................... 45
Figure 15. Air-Tech Environmental Mobile Lab Sample Recovery Area ................................... 49
Figure 16. Full Train Inorganic and Organic Results (Net Average Weights)............................. 61
Figure 17. Full Train Total Combined Inorganic and Organic Results (Net Average Weights) .. 62
Figure 18. Full Train C Organic Results (Net Average Weights) ............................................... 63
Figure 19. Component Inorganic and Organic Results (Net Average Weights) .......................... 64
Figure 20. Component Average Inorganic and Organic Results (Net Average Weights) ............ 64
Figure 21. Component Average Total Results (Net Average Weights)....................................... 65
Figure 22. Component %RSD Comparison ............................................................................... 65
Figure 23. Component UPL Comparison (Net Average Weights) .............................................. 66
List of Tables
Table 1. Best Practice Survey Materials ......................................................................................9
Table 2. Summary of Best Practices for Method 201A and Method 202 .................................... 13
Table 3. Task 3 Sample Summary ............................................................................................. 17
Table 4. Task 3 Sample Beaker Weights ................................................................................... 18
Table 5. Task 3 Gravimetric Analysis Daily Conditions ............................................................ 20
Table 6. Task 3 Gravimetric Analysis Daily Balance Calibrations ............................................. 22
Table 7. Task 3 Raw Sample Results ......................................................................................... 23
iv
Table 8. TF Sample Results ....................................................................................................... 24
Table 9. TL Sample Results ...................................................................................................... 25
Table 10. TM Sample Results ................................................................................................... 25
Table 11. TF Statistical Analysis ............................................................................................... 25
Table 12. TL Statistical Analysis ............................................................................................... 26
Table 13. TM Statistical Analysis .............................................................................................. 26
Table 14. Task 3 Reagent Blank and Dust Pan Results .............................................................. 26
Table 15. Task 4 Sample Summary ........................................................................................... 34
Table 16. Task 4 Gravimetric Analysis Daily Conditions .......................................................... 36
Table 17. Task 4 Gravimetric Analysis Daily Balance Calibrations ........................................... 38
Table 18. Task 4 Raw Sample Results ....................................................................................... 39
Table 19. Water Sample Results ................................................................................................ 40
Table 20. Hexane Sample Results ............................................................................................. 41
Table 21. Water Statistical Analysis .......................................................................................... 41
Table 22. Hexane Statistical Analysis ........................................................................................ 42
Table 23. Task 4 Reagent Blank and Dust Pan Results .............................................................. 42
Table 24. Task 5 Sample Summary ........................................................................................... 48
Table 25. Task 5 Sample Jar Weights ........................................................................................ 51
Table 26. Task 5 Gravimetric Analysis Daily Conditions .......................................................... 53
Table 27. Task 5 Gravimetric Analysis Daily Balance Calibrations ........................................... 55
Table 28. Task 5 Raw Sample Results ....................................................................................... 55
Table 29. Full Train Sample Results .......................................................................................... 57
Table 30. Component Sample Results ....................................................................................... 57
Table 31. Full Train Statistical Analysis .................................................................................... 58
Table 32. Full Train C Replicate Statistical Analysis ................................................................. 59
Table 33. Probe Extension Replicate Statistical Analysis ........................................................... 59
Table 34. Condenser Replicate Statistical Analysis.................................................................... 59
Table 35. Impinger Replicate Statistical Analysis ...................................................................... 60
Table 36. Filter Housing Replicate Statistical Analysis .............................................................. 60
Table 37. Task 5 Reagent Blank and Dust Pan Results .............................................................. 61
v
PM Particulate matter
EPA U.S. Environmental Protection Agency
TSP Total suspended particulate
PM2.5 Particulate matter less than or equal to 2.5 micrometers in diameter
CPM Condensable particulate matter
ERG Eastern Research Group, Inc.
%RSD Percent relative standard deviation
FTRB Field train recovery blank
g Grams
QC Quality control
DQI Data quality indicators
ND Non-detect
SD Standard deviations
UPL Upper prediction limits
PTFE Polytetrafluoroethylene
1
1.0 EXECUTIVE SUMMARY
Particulate matter (PM) is one of the six common air pollutants that the U.S.
Environmental Protection Agency (EPA) sets National Ambient Air Quality Standards for as
required under the Clean Air Act. Historically, EPA first regulated total suspended particulate
(TSP), followed by PM that is less than 10 micrometers in diameter (PM10), which is inhalable
and harmful to human health, and then particulate matter less than or equal to 2.5 micrometers in
diameter (PM2.5). The PM2.5 particulate matter consists of both filterable PM and condensable
particulate matter (CPM). Method 201A collects filterable PM using a filter and a set of cyclones
to separate the PM10 and PM2.5 from larger sized particles. Method 202 uses a condenser, dry
impingers, and a filter to collect CPM. CPM is not captured by a filter at stack conditions, but
forms solid or liquid particulate matter immediately after discharge from the stack. Method 202
is combined with Method 201A or other filterable PM methods for source testing.
In December 2010, amendments to Methods 201A and 202 were promulgated. The
updated Method 201A includes an additional cyclone to provide a measurement of PM2.5. PM2.5,
also known as fine particulate, is of interest because it is believed to pose the greatest health risk
of PM. The updated Method 202 includes revised sample collection and recovery procedures to
reduce the formation of reaction artifacts that could lead to inaccurate measurements of CPM.
The updates to Method 202 also eliminated most of the hardware and analytical options
previously available, which increased the precision of the method and improved the consistency
in the measurements obtained between source tests performed under different regulatory
authorities. Several performance-based criteria were written into the methods to provide some
flexibility to stationary source test teams. After promulgation, states, local agencies, facilities,
and source testers provided feedback indicating that clarification of the procedures in these
updated methods is necessary to ensure that they are used effectively. In addition, Method 202
field train recovery blank levels greater than the allowable 2.0 milligrams (mg) limit established
in the method have been reported. Issues of primary concern for elevated blank concentrations
are the contributions to the total field sample results from filters, reagents, and sampling trains,
the probe extensions in particular. The blank contribution to sample mass needs to be very low to
ensure that results for the CPM measurement from Method 202 source tests are attributable to
the source and not to the materials used in the sample collection, recovery, and analysis.
In order to provide direction and greater clarity, Eastern Research Group, Inc. (ERG),
under EPA Contract # EP-D-11-006, Work Assignment (WA) 3-07, identified several best
practices associated with the implementation of Methods 201A and 202. ERG identified these
best practices through a survey of source testing firms and laboratory evaluations of the filters,
reagents, and sampling train glassware used in conducting Method 201A and 202 sampling. This
document summarizes the best practices determined from the surveys and laboratory evaluations.
2
The project elements were conducted as four tasks. The tasks were as follows:
• Task 2, Method 201A and 202 Best Practices Surveys
• Task 3, Method 202 CPM Filter Evaluation
• Task 4, Method 202 Reagent Evaluation
• Task 5, Method 202 Sampling Train Glassware Evaluation.
ERG selected the source testing firms surveyed in Task 2 based on the expertise the firms
have in these methods, as well as their ability to control blank levels. ERG evaluated filters in
Task 3 to determine whether CPM filters can meet the residual mass specification in Method 202
and the potential contribution to the field sample mass concentration. Under Task 4, ERG
evaluated whether reagents used in Method 202 sample recovery could meet the residual mass
specification and determined the potential contribution of reagents to the sample mass
concentration. Task 5 was designed to evaluate the ability to clean Method 202 sampling trains
to achieve sufficiently low blank results and evaluate the potential contribution of individual
components of the sampling train to the sample mass concentration. The overall technical
objective of WA3-07 was to identify best practices for Methods 201A and 202 that minimize
residual mass contribution to field samples and reduce blank results to the allowable limit. This
effort did not evaluate the potential for contamination in the field or field recovery techniques
that contribute to elevated field train recovery blank concentration.
In Task 2, ERG surveyed three source testing firms that have the proven capability of
achieving field train recovery blanks below the Method 202 limit. The survey included questions
regarding the materials used and the procedures employed to control blank levels in Method 202
source testing. ERG used responses from the survey to determine what materials and procedures
result in low field train recovery blanks and make suggestions on the best practices for the
implementation of Methods 201A and 202.
In Task 3, ERG evaluated different types of filters used to collect CPM in Method 202
sampling to determine their residual blank levels. ERG focused on the evaluation of a single
commercial lot of filters of each type and not on the variation between lots of filters. The three
different types of filters were Teflon® membrane filters, Teflon® membrane filters backed with
hydrophobic media, and Teflon® membrane filters backed with hydrophilic media. ERG
obtained one box of each type of filter and processed the filters as received from the vendor
without any additional preparation. Ten filters of each type were processed and analyzed
according to the procedures of Method 202. ERG determined the residual mass concentrations,
the averages of the residual masses, and the percent relative standard deviations (%RSD) of the
residual mass measurements for each filter type.
In Task 4, ERG evaluated different reagent grades of hexane and water used in the
recovery and extraction of Method 202 samples to determine their residual blank levels. The
three grades of water were ASTM Type II quality ion exchange water, ultrafiltered water, and
water distilled in glass. Three grades of hexane based on the manufacturer’s stated residual upon
3
evaporation values were identified. The three grades of hexane represented one that was clearly
above the reagent blank limit specification of the method, one that did not meet the specification,
but that was close to the limit, and one that was below the limit. Reagents were processed as
received from the vendor without any additional preparation. Ten 450 milliliters (mL) aliquots of
each grade of each reagent were processed and analyzed according to the procedures of
Method 202. The residual mass concentrations, the averages of the residual masses, and the
%RSDs of the residual mass measurements were determined for all three grades of each reagent.
Reagent aliquots of 450 mL were used because that volume is three times the volume standard
150 mL required for reagent blanks in Method 202.
In Task 5, ERG investigated the capability to achieve sampling train blank results at or
below the allowable 2.0 mg field train recovery blank limit in Method 202. ERG evaluated
sampling train glassware commonly used in Method 202 source testing to determine residual
blank levels and the contribution to the blank from individual components of sampling trains.
ERG evaluated three complete Method 202 sampling trains that have been used in the field to
test source emissions. The trains were cleaned and prepared as they would be for deployment in
the field, including baking at 300°C. ERG recovered the sampling trains according to the proof
blank procedures of Method 202, the CPM filters were not included in the evaluations. One train
was then recovered two additional times for three blank samples from that train and a total of
five blank samples of full Method 202 sampling trains. A different train was separated into its
components; the probe extension, the condenser, the impingers, and the CPM filter housing.
Each component was recovered four times. ERG then processed and gravimetrically analyzed all
the blank samples generated. ERG determined the residual mass concentrations, the residual
mass averages, and the %RSDs of the residual mass measurements. The %RSD provided
precision, which is a measurement of the variability among measurements for each test.
Method 201A and 202 field sample results are determined by the gravitational analysis of
tared weigh pans containing the residual masses from the sample train recovery rinses and the
filter extracts, or in the case of Method 201A, the filters themselves. Method 201A collects
filterable PM using a filter and a set of cyclones that separate the PM10 and PM2.5 from larger
sized particles. Method 202 uses a condenser, dry impingers, and a filter to collect CPM. Method
201A samples consist of the filterable PM filter and the reagent rinses of the stainless steel
nozzle and combined cyclone and filter sampling head. Method 202 samples consist of the CPM
filter and the reagent rinses of the sample portion of the train. See Figure 1, the combined
M201A/202 sampling train configuration schematic.
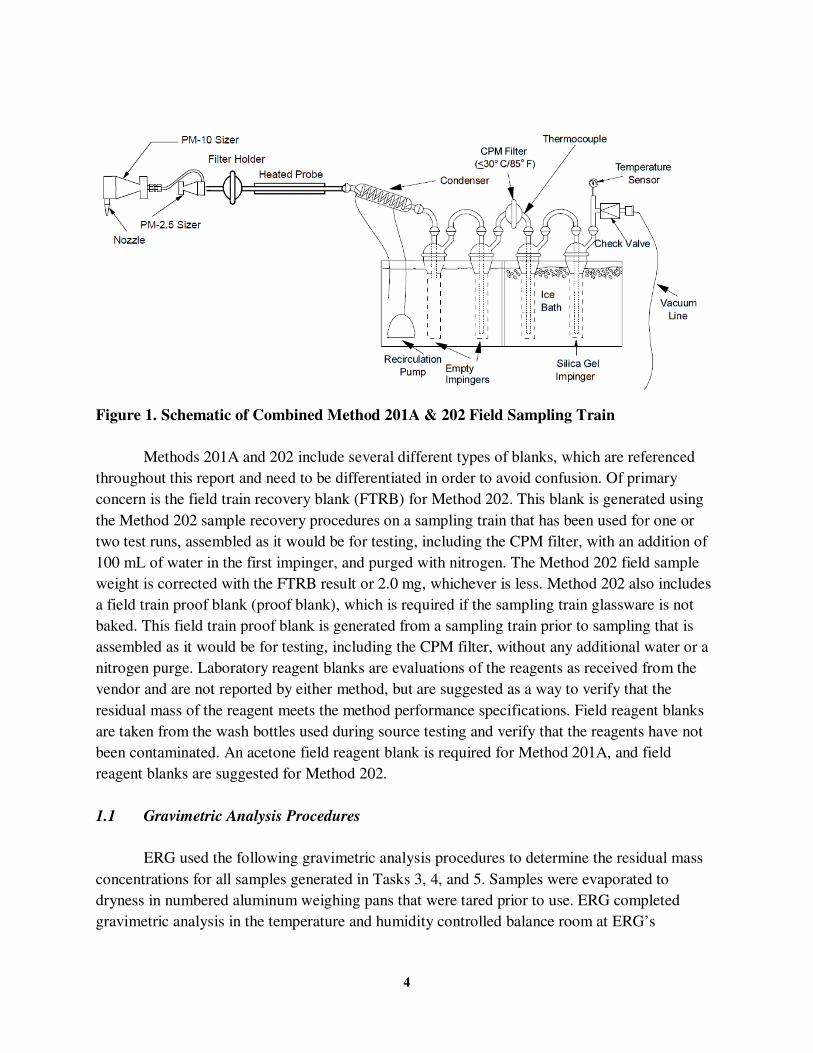
4
Figure 1. Schematic of Combined Method 201A & 202 Field Sampling Train
Methods 201A and 202 include several different types of blanks, which are referenced
throughout this report and need to be differentiated in order to avoid confusion. Of primary
concern is the field train recovery blank (FTRB) for Method 202. This blank is generated using
the Method 202 sample recovery procedures on a sampling train that has been used for one or
two test runs, assembled as it would be for testing, including the CPM filter, with an addition of
100 mL of water in the first impinger, and purged with nitrogen. The Method 202 field sample
weight is corrected with the FTRB result or 2.0 mg, whichever is less. Method 202 also includes
a field train proof blank (proof blank), which is required if the sampling train glassware is not
baked. This field train proof blank is generated from a sampling train prior to sampling that is
assembled as it would be for testing, including the CPM filter, without any additional water or a
nitrogen purge. Laboratory reagent blanks are evaluations of the reagents as received from the
vendor and are not reported by either method, but are suggested as a way to verify that the
residual mass of the reagent meets the method performance specifications. Field reagent blanks
are taken from the wash bottles used during source testing and verify that the reagents have not
been contaminated. An acetone field reagent blank is required for Method 201A, and field
reagent blanks are suggested for Method 202.
1.1 Gravimetric Analysis Procedures
ERG used the following gravimetric analysis procedures to determine the residual mass
concentrations for all samples generated in Tasks 3, 4, and 5. Samples were evaporated to
dryness in numbered aluminum weighing pans that were tared prior to use. ERG completed
gravimetric analysis in the temperature and humidity controlled balance room at ERG’s
5
laboratory using a Sartorius BP211D five place analytical balance, sensitive to 0.00001 grams
(g). The calibration was checked daily using ASTM Class S weights prior to conducting
measurements. Each day that gravimetric analysis was performed the temperature, relative
humidity, and the balance calibration check were recorded in the balance room lab notebook. All
measurements were recorded on the balance room lab notebook page for the day they were
taken. All pan tares and sample measurements were weighed to constant weight. Constant weight
is defined as a change of less than or equal to 0.1 mg, between two consecutive weighings, with
at least six hours between weighings. Nitrile gloves were worn during handling and gravimetric
analysis of all samples.
ERG numbered and tared the weighing pans before they were used for samples. Once
numbered the pans were desiccated for at least 24 hours, they were weighed to constant weight
to determine the tare weight. The pans were kept in their desiccators until they were ready to be
weighed and then placed directly on the balance. A timer was used to verify that the reading on
the balance was stable and did not change for at least 20 seconds. Once a pan was placed on the
balance, it typically took between two and five minutes to reach a stable value. After reaching a
stable value the sample pan was removed from the balance and the balance was allowed to return
to zero. If the balance did not return to zero, the sample was reweighed. Once a stable value was
reached and the balance returned to zero after the sample was removed, it was recorded in the
balance room lab notebook. All tare weights and the initial and all subsequent weighings until
constant weight was achieved were recorded in the balance room lab notebook along with the
conditions and balance calibration check information for that day.
After the sample pans evaporated to dryness, they were desiccated for at least 24 hours
prior to gravimetric analysis. The sample pans were kept in their desiccators until they were
ready to be weighed and then placed directly on the balance. A timer was used to verify that the
reading on the balance was stable for at least 20 seconds and if the balance returned to zero after
the sample was removed it was recorded in the balance room lab notebook. Sample pans were
weighed to constant weight and then received an additional weighing after constant weight was
achieved. This final weighing was taken at least 6 hours after the weighing that established
constant weight. Sample weights are reported as:
• The measurement that established constant weight (Constant Weight) and
• The average of the measurement that establishes constant weight and the additional
measurement (Average Weight).
All sample weights were recorded in the balance room lab notebook with the conditions and
balance calibration check information for that day.
6
1.2 Quality Control
The data quality objective for the laboratory evaluations conducted in Tasks 3, 4, and 5
was to generate accurate and representative data of the residual mass contributions of filters,
reagents, and sampling train glassware of Methods 202 source sampling. The overall objective
was attained by measuring the residual masses of filter blanks, solvent blanks, and glassware
blanks using the procedures in Method 202. Low blank results confirm that the residual mass
contributions of filters, reagents, and sampling train glassware result in low CPM residual mass
contributions to field samples. Sample handling was a critical component in maintaining high
quality in all tasks for this project and ERG minimized the potential for measurement bias
through elevated attention to detail while conducting associated analytical procedures. All
sample containers were labeled with the unique sample identification, date, and operator initials.
All sample recoveries, extractions, and analyses adhered to the procedures in Method 202 as
written.
ERG evaluated reagent blanks for the reagents used in the sample preparation, recovery,
and processing for each of the laboratory experiments. For reagent blanks, 200 mL of each
reagent was taken directly from their actual wash bottles and collected in sample jars. The
reagents were then quantitatively transferred into beakers by pouring the reagent and then rinsing
the sample jar into the beaker with the same reagent. The beakers were placed in the fume hood
for evaporation. Following the sample processing procedures from Method 202, the water
reagent blank (RBW) beaker was placed on a hot plate to expedite evaporation. Once the reagent
blanks had evaporated to approximately 10 mL and the water beaker was allowed to cool, they
were quantitatively transferred into tared, numbered weighing pans, desiccated, and
gravimetrically analyzed according to the same procedures used for samples.
A dust pan was used in all three tasks to verify that any dust that could have settled in the
pans during sample evaporation was not a significant source of bias in the samples. Each task
had a dedicated dust pan for that task. A tared, numbered weigh pan was set out in the hood with
sample pans every time that they were exposed. When samples were not being evaporated in
pans, a watch glass was placed over the dust pan, so that it was only exposed when samples were
exposed. After all sample and reagent blank pans associated with the dust pan were evaporated to
dryness, the dust pan was placed in a desiccator in the balance room for gravimetric analysis.
For the gravimetric analysis, ERG followed the quality control (QC) criteria and
procedures specified in ERG’s SOP for Gravimetric Determination for Particulate Emissions
Measurements (ERG-MOR-002), see Appendix. To ensure that mass measurements from
gravimetric analysis did not add excess uncertainty to the test results, gravimetric analysis was
performed at ERG’s laboratory using a Sartorius BP211D analytical balance, which is sensitive
to 0.00001 g. The balance is calibrated annually to manufacturer’s specifications with NIST
7
traceable weights. Daily balance calibration checks were measured using ASTM Class S
weights. A deviation of more than ±0.0002 grams at any weight level required that the zero be
checked or balance maintenance be performed. Acceptable deviation for a five place balance is
≤ 0.00005 g. The daily temperature, relative humidity, and balance calibration check were
recorded during gravimetric analysis. Mass measurements were performed in a temperature and
humidity controlled balance room that meets the specifications for filter weighing in Method 5,
which requires that the temperature be maintained at 20 ± 5.6 °C and the humidity be recorded.
The temperature and humidity of the room is controlled using a Data Aire, Inc. Mini Data Alarm
Processor II, which is set to maintain a temperature of 70°F (21°C) and a relative humidity of
50%. The actual temperature and humidity was monitored and documented using an Omega
OM-CP-PRHTEMP2000 data logger.
The acceptance of mass measurements for all samples was dependent on achieving a
constant weight during gravimetric analysis. The constant weight criteria used was a change of
less than or equal to 0.1 mg, between two consecutive weighings, with at least 6 hours between
weighings. Data quality indicators (DQI) included determining residue mass for 90% of each set
of samples. All negative results are reported as non-detects (ND). Averages, standard deviations
(SD), detection limits (calculated as three times the SD), %RSD, and upper prediction limits
(UPL) of mass measurements of the data sets were calculated. ERG set target of 95% of sample
results falling at or below the calculated UPL value for measurements in this project. ERG also
used the UPL calculation to evaluate to what degree the different materials contribute to the total
Method 202 field sample result. Sample weights were recorded as the measurement that
established constant weight (Constant Weight) and also as the average of the measurement that
establishes constant weight and one additional measurement (Average Weight). The precision for
both methods of sample weighing was evaluated by calculating and comparing the %RSDs.
1.3 Findings
The results were used to evaluate the mass concentration levels of reagent blanks, filter
blanks, and sampling train blanks that are achievable using commercially available materials and
to suggest media and procedures for use in these methods. The findings from these tasks
demonstrate that the method-defined blank limits for the filters, reagents, and sampling trains are
achievable, the FTRB limit is achievable, and it is possible to limit the residual mass
contributions to the field sample result from the materials used in the sample collection,
recovery, and analysis. In order to accomplish these things special attention must be paid to the
selection of materials and to the procedures used in these methods. The selections of specific
materials or materials with specific properties that limit residual mass contributions are identified
as best practices in this report. Likewise, procedures or techniques that aid in the control of
FTRB results and residual mass contributions are identified as best practices.
8
2.0 METHOD 201A AND 202 BEST PRACTICES SURVEYS
Under WA 3-07, Task 2 and with direction from the EPA work assignment manager
(WAM), ERG surveyed three source testing firms that have demonstrated acceptable
performance controlling blank levels by applying best sampling and analysis practice expertise to
Methods 201A and 202. Throughout this document they will be referred to as Firms A, B, and C.
• Firm A reported achieving Method 202 field train recovery blank results that are
usually between 0.9 and 1.4 mg, very rarely above 2.0 mg, performing Method 201A
and 202 testing primarily on gas turbines, biomass boilers, coal boilers, cement kilns,
oil refinery units, gas and diesel internal combustion engines, glass furnaces, and
various other manufacturing processes.
• Firm B reported achieving Method 202 field train recovery blank results that are
typically 1.5 mg, testing gas turbines primarily, but also some utility boilers and solid
fuel boilers.
• Firm C uses subcontractors to perform source testing for gas-fired and other very low
PM sources and has extensive knowledge applying these methods.
These firms were provided with a questionnaire to collect information on the materials and
procedures they use to control blank levels for these methods. From this information, ERG
identified several best practices for conducting accurate source testing with low field train
recovery blank results for Methods 201A and 202.
2.1 Materials
The materials used in Methods 201A and 202 can be one of the most significant
contributors to the field blank results. These materials include the components of the sampling
train itself, the filters used in the sampling train, the reagents used for sample recovery, and the
nitrogen used for the post-sampling purge in Method 202. In order to meet the field train
recovery blank criteria, the contribution from the materials needs to be as low as possible. The
sampling train consists of stainless steel and glass components that are standard for isokinetic
stack sampling hardware. The contribution to the blank from the sampling train is a combination
of the purity of the recovery reagents, train preparation, and the sample recovery. Materials are
addressed in this section and procedures are addressed in the next section. Table 1 summarizes
the materials used by the three firms that responded to the questionnaire.
One filter used in each of these test methods and each filter must meet their respective
method specifications. Method 201A specifies the use of a nonreactive, nondisintegrating glass,
quartz, or polymer filter that does not have an organic binder and has an efficiency of at least
99.95% on 0.3 micrometer (µm) doctyl phthalate particles. Method 202 specifies the use of a
nonreactive, nondisintegrating polymer filter that does not have an organic binder, does not
contribute more than 0.5 mg of residual mass to the CPM measurements, and has an efficiency of
9
at least 99.95% on 0.3 micrometer doctyl phthalate particles. In addition they must be able to
withstand the rigors of the source test and not degrade during the sample recovery. For
Method 202, that includes sonication and solvent extraction. Methods 201A and 202 include the
use of reagents for the sample recovery from the sampling hardware and require that the residues
of evaporations for all reagents used in both methods be 1.0 mg/L or less.
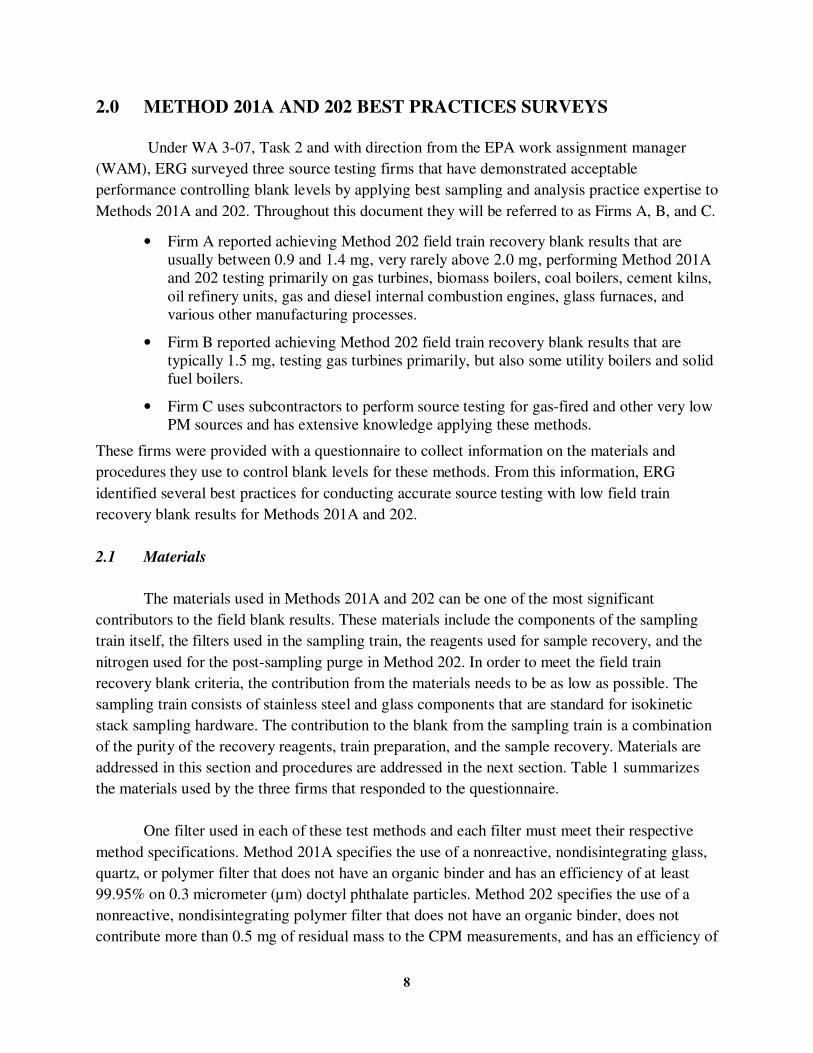
Table 1. Best Practice Survey Materials
Firm M201A
Filter M202 Filter Acetone Water Hexane
A
47 mm
Millipore
Glass Fiber
filters
90 mm
Sartorius PTFE
Membrane 1.2
µm pore size
[Blank:
< 0.5 mg/filter]
Capillary
GC/GCMS
grade
[Blank:
< 1.25 mg/L.]
ACS grade
ASTM D1193
Type 1
[Blank:
< 1.8 mg/L]
Honeywell non-
spectrophotometric
grade
[Blank:
< 1.35 mg/L]
B
45 mm
Whatman
934-AH
Glass Microfiber
47 mm Pall
Zeflour 3.0 µm
pore size PTFE
Membrane
[Blank: < 0.2 mg/filter]
GC Resolv
grade
[Blank:
0.05 mg/L]
Deionized
[Blank:
0.05 mg/L]
GC Resolv grade
[Blank:
0.05 mg/L]
C
High Purity Glass Fiber
for
gravimetric
analysis
High Purity
Quarts Fiber
for chemical
analysis
100% PTFE
Membrane 1.2
µm pore size
(90 mm
typically)
[Blank:
< 1.5 mg/filter]
Histology or
HPLC grade
[Blank: < 2.5
mg/L]
HPLC grade or
reagent grade water that is
double
deionized,
activated carbon
filtered, UV
irriated, and
membrane
filtered
[Blank:
~3.66 mg/L]
GC, pesticide non-
spectrophotometric
grade
Firm A
Firm A reported using 47 mm Millipore Glass Fiber filters for Method 201A source
testing and Sartorius 90 mm 1.2 µm pore size PTFE membrane filters with a typical blank result
of < 0.5 mg for Method 202. The Method 202 filter housing includes a PTFE frit and backup
filters are not used. These filters for are used straight out of the box with no pre-test preparation.
Firm A recovers Method 201A samples using Capillary GC/GCMS grade acetone with a reagent
blank of < 0.25 mg per 200 mL or < 1.25 mg/L. Firm A uses ACS grade ASTM D1193, Type 1
water, with a reagent blank of < 0.36 mg per 200 mL or <1.8 mg/L, and Honeywell non-
spectrophotometric grade hexane, with a reagent blank of < 0.27 mg per 200 mL or <1.35 mg/L,
as the sample recovery reagents for Method 202 (Note the Method 202 reagent blank results
were reported by Firm A without a volume, so 200 mL, which was the volume given for the
10
acetone blank, was used to calculate mass per volume concentrations). The post-sampling purge
is performed using glass fiber thimble filtered AirGas CEMS grade nitrogen. Dedicated PTFE
transfer lines are used to deliver the nitrogen for the purge. Viton O-rings are used for the
sampling train impingers and are replaced when signs of wear occur or if a pre-test leak check
does not pass.
Firm B
Firm B reported using 45 mm Whatman 934-AH glass microfiber filters in their
Method 201A sampling trains. For Method 202, Firm B uses Pall Zeflour 47 mm 3.0 µm pore
size PTFE membrane filters, which have a typical blank result of < 0.2 mg. The Method 202
filter housing includes a PTFE frit and backup filters are not used. Filters for both methods are
used straight out of the box with no pre-test preparation. GC Resolv grade acetone with a reagent
blank of 0.05 mg/L is used for Method 201A sample recovery. Deionized (DI) water and GC
Resolv grade hexane with reagent blanks of 0.05 mg/L for both are used for Method 202 sample
recoveries. The DI water is generated by passing purchased distilled water through a Barnstead
ion exchange resin column. The post-sampling purge is performed using filtered CEMS grade
5.1 nitrogen. PTFE transfer lines, which are visually inspected for cleanliness, are used to deliver
the nitrogen for the purge. Viton O-rings are used for the sampling train impingers and are
replaced when signs of wear are observed.
Firm C
Firm C specified the use of high purity glass fiber filters in Method 201A source testing
trains when only gravimetric analysis is to be performed. An acid wash is required for these
filters if the PM concentration is low and SO2 is present in the source. High purity quartz fiber
filters are specified when chemical analysis is to be performed. A backup glass or quartz filter is
sometimes used if sulfur dioxide or sulfuric acid vapor adsorption may be significant. In
Method 202 sampling trains, 100% PTFE membrane filters (which are hydrophobic) with a
1.2 µm pore size, typically of the 90 mm diameter size are used. Blank results for Method 202
filters are < 1.5 mg. Filters that are 100% PTFE and free of all non-PTFE components are
required by Firm C, which has found that polymethylpentane components are particularly
problematic due to their partial solubility in hexane. For Method 201A sample recovery of low
level sources, Firm C specifies that Histology or HPLC grade acetone with field recovery reagent
blanks ranging from -0.2 to 1.0 mg per 400 mL or < 2.5 mg/L is used (Note the Method 201A
reagent blank result was reported by Firm C without a volume, so 400 mL, which was the
volume given for the water and hexane blanks, was used to calculate mass per volume
concentrations). For Method 202, sample recoveries reagent grade water that is double
deionized, activated carbon filtered, UV irradiated, and membrane filtered or HPLC grade water
11
with a reagent blank of 0.9 mg in 246 mL (~3.66 mg/L) is used. For the hexane GC, pesticide
non-spectrophotometric grade is used.
2.2 Procedures
In addition to the materials used in Methods 201A and 202, the procedures employed also
play a major role in best practices to reduce the field blank results and accurately implement
these methods. These procedures include techniques for handling the materials, preparation of
the glassware, the recoveries of samples, and preparation of the sample collection and recovery
areas.
Firm A
Firm A minimizes the contribution to the sample weight from the filters by performing
the filter tares in a dry laboratory with operators using latex gloves and forceps. These filters are
baked to ensure complete dryness before taring. In addition after initial tare, the filters are stored
in sterile plastic Petri dishes, which are not reused, for storage and transport. Solvent purity is
maintained by keeping the solvents in their original bottle until use. The condenser and first
knockout impinger of the Method 202 sampling trains are dedicated for use in Method 202
testing only. The glassware of the sampling trains is cleaned in a multi-step process. First it is
soaked in hot water with Liquinox laboratory detergent and brushed as necessary. It is rinsed at
least three times with hot water until there are no more signs of soap. Finally, the glassware gets
three rinses with each of the following, DI water, acetone, and hexane. Sometimes an additional
baking step at 250oF is added and the ball joint o-rings are not removed. Firm A reported field
train proof blanks, which exclude the probe extension, with < 1.0 mg total, < 0.5 mg in each
fraction, aqueous and organic. Typically two trains are reused in rotation for subsequent runs
during sampling, but up to three or four trains may be used.
Firm B
Firm B takes great care in providing a clean environment for sample and blank
recoveries. Firm B cleans their mobile lab and recovery locations in order to minimize sample
contamination. Sampling train glassware is not dedicated for Methods 201A and 202, but is
cleaned according to the following procedure before use with these methods. The glassware is
soaked in tap water with Liquinox laboratory detergent. It is then rinsed with tap water, DI water,
acetone, and hexane. Finally, all components except the probe extensions are baked at 300oC for
6 hours.
In addition to cleaning the glassware, Firm A takes other steps to ensure that the
contribution to the samples and blanks from the glassware is as small as possible. The glassware
12
is cleaned in a clean laboratory environment. Operators wear gloves when handling glassware
and glassware is capped with foil after cleaning. Immediately prior to use in the field, the
glassware is rinsed with DI water, acetone, and hexane and allowed to dry. Field train proof
blanks are not required by the method in this case, because the glassware is baked. During
sampling, usually two trains are reused in rotation for subsequent runs.
Firm C
In order to prevent sample contamination, Firm C specifies that all areas where samples
are exposed, including the sample recovery area, should be enclosed and kept clean and free of
dust, dirt, and debris. Trailers or trucks can be used as recovery areas, but only side doors should
be used, not roll-up doors. Foot traffic in and out of the recovery area should be controlled at all
times and completely restricted while samples are exposed. Outside the recovery area mats and
shoe cleaning equipment should be available to avoid introducing outside dirt from shoes. To
minimize the contributions to the sample weight from the filters, Firm C suggests using plastic
Petri dishes for storage and transport and nitrile gloves for all sample and filter handling. This
includes removing filter fragments from the filter holder, which is reported to be more effective
than brushing because fewer fragments are lost or introduced.
Firm C requires an acid wash for M201A filters if the PM concentration is low and SO2 is
present in the source. For acetone, PTFE wash bottles are suggested for minimizing sample and
blank contributions. A 5-place balance with charge neutralization is specified for sample
weighing and a constant weight criterion of 0.1 mg is used. Aluminum pans are preferred over
PTFE baggies for acetone sample recovery rinses. For glassware, off-site cleaning is specified, as
is a complete recovery rinse in the field before use. Firm C requires that the glassware selected
should look brand new, and be completely free of deposits. Sample collection of acetone rinses
requires certified contaminant-free amber glass jars with PTFE lid liners. Firm C reported field
train proof blanks in the 3 to 5 mg range for the combined organic and inorganic total.
2.3 Conclusions
Many of the procedures reported by these three firms overlap with or are closely related
in their approach for reducing possible sources of contamination. Knowing and following the
method specifications for materials will limit the contribution to the sample result, especially for
the reagents, which have specifications designed to limit their contributions. Table 2 summarizes
the best practices from the survey for conducting Method 201A and 202 source testing to
generate accurate measurements and low field train recovery blank results.
13
Table 2. Summary of Best Practices for Method 201A and Method 202
Topic Best Practice Comments
Method 201A Filter High purity binder free glass or
quartz fiber
Acid washing filters reduces SO2
artifact
Method 202 Filter 100% PTFE membrane Non-PTFE filters found to contain
extractable organic mass
Filter Tare Clean, dry, environmentally
controlled lab
A balance with resolution of 0.01 mg
may be necessary
Filter Handling Gloves and forceps Minimize handling
Filter Storage and Transport Sterile Petri dish
Acetone 0.05 mg/L residue on evaporation
Solvent purity can have a significant
impact on FTRB results. Keep in
original solvent bottle until needed.
Water 0.05 mg/L residue on evaporation
In-house prepared water purity varies
greatly. Keep in original solvent bottle
until needed.
Hexane 0.05 mg/L residue on evaporation
Solvent purity varies greatly between
grades and suppliers. Keep in original
solvent bottle until needed.
Aqueous Fraction Recovery and
Transport Containers
PTFE wash bottles, polymer
sample jars
Certified low residual mass by
manufacturer when possible
Organic Fraction Recovery and
Transport Containers Glass sample jars
Certified low residual mass by
manufacturer when possible
Sampling Train Glassware
Cleaning
• Soaking in hot water and lab
detergent, brushing as
necessary
• Rinsing with hot water until
free of soap
• Rinsing 3x with DI water,
acetone, and hexane
• Bake at 300 oC for 6 hours (if
possible)
Probe extension cleaning is critical
because most are too long to be baked
at 300 oC
Sampling Train Storage and
Transport
� Seal open ends with clean
aluminum foil
� Store glassware in a clean
environment
Aluminum foil may need to be rinsed
to avoid roll lubricant contamination
Sampling Train Field Setup
• Wear synthetic gloves
• Rinse glass train components
with DI water, acetone, and
hexane immediately prior to
use
Sampling Train Recovery
Perform sample recovery in an
enclosed, controlled access area
that is kept clean and free of dust
Keeping areas clean may require a
HEPA filtered air supply for
ventilation and HEPA filter
vacuuming prior to sample recovery.
Clean area immediately prior to use.
14
Although stakeholders have reported that the 2.0 mg limit for Method 202 field train
recovery blanks is difficult to achieve, these three firms have shown that with the proper
materials and procedures it is possible to meet the limit and to accurately implement both test
methods. Because 2.0 mg is the limit for Method 202 field sample correction, any field train
recovery blank values above 2.0 mg represent source test results that may be biased high. The
field train recovery blank needs to be very low to ensure that results for the CPM measurement
from Method 202 source tests are attributable to the source and not to the materials or procedures
used in the sample collection, recovery, and analysis. Field train recovery blanks are performed
after one or two source tests have been run and the resulting samples collected, so FTRBs are an
evaluation of the sample recoveries as well as an evaluation of the contribution to the sample
result from the materials and procedures. Low FTRB results, like those reported by these three
firms, verify both aspects. Proof train blanks may be necessary to determine if high FTRB results
from poor sample recovery or contaminated supplies and glassware. In the case of these
methods, measuring particulate matter at or near the method detection limits requires
implementation of the best practices that these three firms have shared to generate precise and
accurate results often required for particulate matter regulations or standards.
15
3.0 METHOD 202 CONDENSABLE PARTICULATE MATTER FILTER
EVALUATION
ERG completed Method 202 filter evaluations from August through November of 2013 at
the ERG laboratory facility, in accordance with WA 3-07 Task 3. Method 202 measures CPM,
which is not captured by a filter at stack conditions, but forms solid or liquid particulate matter
immediately after discharge from the stack. Method 202 mimics stack conditions using a
condenser and dry impingers and collects CPM on a filter. Method 202 is combined with a
filterable PM method, such as Method 201A, and follows the filterable PM method. See
Figure 1, the combined M201A/202 sampling train configuration schematic.
The Method 202 field sample weight is corrected using the Field Train Residual Blank
(FTRB) result or 2.0 mg whichever is less, as specified by the method. Filters have the potential
for significant residual mass concentrations, which can cause the FTRB result to exceed the
2.0 mg limit and contribute mass to samples, biasing CPM measurements high. Thus, the
contribution to the residual mass field sample results from CPM filters must not exceed the limit
in the method of 0.5 mg to ensure that results for the CPM measurements from Method 202
source tests are attributable to, and representative of, the source and not to the filters used in the
sample collection.
Task 3 evaluated the ability to achieve sufficiently low residual mass blank results from
Method 202 CPM filters and evaluated the potential contribution of the CPM filter to the total
field sample mass concentration for Method 202 sampling trains. Method 202 specifies the use
of polymer filters that are nonreactive and nondisintegrating, and that have an efficiency of at
least 99.95% on 0.3 micrometer (µm) dioctyl phthalate particles. Method 202 requires that the
filters do not contribute more than 0.5 mg of residual mass to CPM measurements. This criterion
is referred to here as the “CPM filter blank limit”. The CPM filter blank is obtained by:
• Folding the filter in quarters and placing into an extraction tube
• Recovering the inorganic fraction of the filter
• Recovering the organic fraction of the filter
• Extracting the inorganic fraction three times with hexane using a separatory funnel,
combining the extracts with the organic fraction
• Evaporating the samples to approximately 10 mL in beakers
• Evaporating the samples to dryness in aluminum weigh pans
• Desiccating the samples for at least 24 hours
• Gravimetrically analyzing (weighing) the sample pans.
16
The objective of Task 3 was to generate representative data of the blank contributions of
filters used in Methods 202 source sampling. Task 3 evaluated whether Teflon® membrane filters
can pass the CPM filter blank limit for the method and the potential contribution of CPM filters
to the Method 202 field sample weight. The evaluation was accomplished by recovering and
analyzing three different types of CPM filters used for Method 202 sampling to determine their
residual blank levels. This task focused on the evaluation of a single commercial lot of filters of
each type and not on the variation between lots of filters. This effort did not evaluate the
potential for contamination in the field or poor field sample recovery techniques that contribute
to elevated field train recovery blank results. All sample processing and gravimetric analysis was
performed at ERG’s laboratory facility.
3.1 Procedures
ERG evaluated three different types of filters that are commonly used to collect CPM in
Method 202 sampling to determine their residual blank levels. Teflon® filters are typically used
as Method 202 CPM filters. Teflon® filters that include a backing or substrate to suit the
conditions of the source are also used. In order to represent different types of Teflon® filters the
three filter types selected for evaluation were:
• 100% Teflon® membrane filters (Pall Zefluor, 47 mm, 1 µm pore size, cat# P5PL047)
• Teflon® membrane filters backed with hydrophobic media (Tisch, 90 mm, 1 µm pore
size, cat# SF13867)
• Teflon® membrane filters backed with hydrophilic media (Tisch, 90 mm, 1 µm pore
size, cat# SF13852).
All these filter types meet the Method 202 efficiency requirements and the CPM filter blank
results are used to determine if the CPM filter limit of 0.5 mg was met. The Teflon® membrane
filters selected are 100% Teflon® and do not contain any other substrate or material. One box of
each type of filter was obtained and the filters were processed as received from the vendor
without any additional preparation. Additional preparation of CPM filters, such as an acid wash,
is sometimes used in source testing depending on the expected source conditions, but is not
required by the method. Ten filters of each type were processed and analyzed according to the
procedures of Method 202, generating a total of 30 CPM filter samples. All work done in this
task was performed by ERG personnel at ERG’s laboratory facility. A summary of all samples
generated in this task and associated sample identification codes is presented in Table 3.
17
Table 3. Task 3 Sample Summary
CPM Filter Type ID Code Number of
Samples
100% Teflon® Membrane (TM) TM01-10 10
Hydrophobic Teflon® Membrane (TF) TF01-10 10
Hydrophilic Teflon® Membrane (TL) TL01-10 10
The sample recovery procedures for each sample listed in Table 3 generated two
fractions, an inorganic and an organic. ERG personnel processed and gravimetrically analyzed
all the samples at ERG’s laboratory. All solvents used for all activities conducted in Task 3,
including glassware cleaning, sample recovery, and sample processing, met the specifications
required in Method 202 that manufacturer’s stated residue on evaporation not exceed 1.0 mg/L.
Glassware & Laboratory Prep
All laboratory glassware used for sample processing, including beakers, separatory
funnels, and graduated cylinders, were washed, rinsed with DI water and hexane, and baked in
an oven at 350°C for 6 hours before use. All reagents used in the preparation of the glassware
met the criteria established in Method 202 of an evaporation residue of < 1.0 mg/L. Tare weights
were taken for the beakers before sample recovery and recorded in the lab notebook.
Before sample recovery began, all areas of ERG’s laboratory where samples and the
associated recovery and processing materials were to be handled, including the laboratory fume
hood, were thoroughly cleaned to prevent any contamination. The benchtop in the fume hood
where the recoveries took place was wiped down using water and dried using paper towels.
Sample Recovery Procedures
ERG generated the Task 3 Method 202 CPM filter blanks by solvent extraction of the
filters using a sonicator according to the procedures Method 202. The filters were extracted as
received from the vendor without any additional preparation. The Method 202 CPM filter
recovery procedures generate two sample fractions, an inorganic and an organic, each of which is
ultimately evaporated to dryness in its own aluminum weighing pan for gravimetric analysis.
Before extraction sample beakers were labeled with the unique sample ID, date, and operator
initials. The filters were folded into quarters and placed into extraction tubes that came
precleaned from the vendor with certificates of analysis from the manufacturer that document the
cleanliness specifications. The inorganic fraction is generated by:
• Adding 20 mL deionized, ultra-filtered (DIUF) water, covering the filter
• Placing the extraction tube in a sonication bath for two minutes
18
• Pouring the resulting extract into the inorganic fraction beaker
• Repeating this step two times for a total of three water extractions.
(Note: the term aqueous, Aq, was used for sample identification codes for inorganic fraction
samples in this task). The organic fraction is generated by:
• Adding 20 mL of hexane, covering the filter
• Placing the extraction tube in a sonication bath for 2 minutes
• Collecting the resulting extract in the organic fraction beaker
• Repeating this step two times for a total of three hexane extractions.
High purity Fisher Optima water, with an evaporation residue of < 1.0 mg/L, was used for
inorganic fraction recoveries. Hexane, with an evaporation residue of < 0.1 mg/L, was used for
organic fraction recoveries. Three extractions of each solvent produced a total sample volume of
60 mL for each fraction. Ten filters of each of the three CPM filter types selected were recovered
for a total of 30 CPM filter blank samples.
All filters were wet but unchanged after the three water extraction sonications. The filters
appeared translucent upon adding hexane and appeared whole, not broken or dissolved after the
organic extractions. Color returned to the filters once they dried. The hexane extracts for the
hydrophobic Teflon membrane (TF) samples were slightly cloudy. Sample handling was a
critical component in maintaining high quality and preventing contamination for this task and
great care was taken to ensure sample integrity and proper identification. After recovery, ERG
operators processed the samples for gravimetric analysis and measured the final weights of the
sample beakers. Organic sample final beaker weights include the 90 mL generated from the
separatory funnel extractions of the inorganic fraction. The sample beaker initial and final
weights are presented in Table 4.
Table 4. Task 3 Sample Beaker Weights
Sample ID Tare Weight
(g)
Final Weight
(g)
Net Weight
(g) Sample ID
Tare Weight
(g)
Final Weight
(g)
Net Weight
(g)
TF01 Aq 106.8 166.4 59.6 TF01 Org 123.9 215.9 92.0
TF02 Aq 111.8 171.9 60.1 TF02 Org 108.7 201.3 92.6
TF03 Aq 115.6 175.8 60.2 TF03 Org 115.0 207.9 92.9
TF04 Aq 97.4 157.8 60.4 TF04 Org 100.0 190.8 90.8
TF05 Aq 113.6 173.7 60.1 TF05 Org 88.4 178.7 90.3
TF06 Aq 107.3 167.5 60.2 TF06 Org 110.8 201.4 90.6
TF07 Aq 115.2 175.5 60.3 TF07 Org 108.4 200.0 91.6
TF08 Aq 100.9 161.2 60.3 TF08 Org 108.9 201.0 92.1
TF09 Aq 110.3 170.9 60.6 TF09 Org 103.8 195.4 91.6
TF10 Aq 110.1 170.1 60.0 TF10 Org 114.9 205.0 90.1
Note: TF is the hydrophobic Teflon membrane, TL is the hydrophilic Teflon membrane, TM is the 100% Teflon membrane.
19
Table 4. Task 3 Sample Beaker Weights (Continued)
Sample ID Tare Weight
(g)
Final Weight
(g)
Net Weight
(g) Sample ID
Tare Weight
(g)
Final Weight
(g)
Net Weight
(g)
TL01 Aq 110.3 169.1 58.8 TL01 Org 110.7 199.5 88.8
TL02 Aq 88.4 146.5 58.1 TL02 Org 111.8 200.8 89.0
TL03 Aq 106.8 165.0 58.2 TL03 Org 112.8 206.7 93.9
TL04 Aq 95.2 153.5 58.3 TL04 Org 114.9 207.0 92.1
TL05 Aq 113.7 171.7 58.0 TL05 Org 100.9 193.3 92.4
TL06 Aq 108.9 166.8 57.9 TL06 Org 106.8 198.4 91.6
TL07 Aq 108.4 166.2 57.8 TL07 Org 115.6 205.2 89.6
TL08 Aq 110.3 168.8 58.5 TL08 Org 112.8 203.9 91.1
TL09 Aq 123.9 182.2 58.3 TL09 Org 103.8 198.3 94.5
TL10 Aq 95.2 154.2 59.0 TL10 Org 114.7 210.1 95.4
TM01 Aq 88.4 146.2 57.8 TM01 Org 104.6 194.3 89.7
TM02 Aq 110.8 167.1 56.3 TM02 Org 115.2 206.7 91.5
TM03 Aq 115.0 172.1 57.1 TM03 Org 108.8 200.0 91.2
TM04 Aq 97.4 147.2 49.8 TM04 Org 100.0 192.3 92.3
TM05 Aq 123.9 180.6 56.7 TM05 Org 113.6 198.9 85.3
TM06 Aq 108.4 165.5 57.1 TM06 Org 115.6 202.6 87.0
TM07 Aq 110.3 171.1 60.8 TM07 Org 100.9 190.5 89.6
TM08 Aq 108.9 161.4 52.5 TM08 Org 106.7 195.5 88.8
TM09 Aq 112.7 169.2 56.5 TM09 Org 114.9 206.2 91.3
TM10 Aq 103.7 160.8 57.1 TM10 Org 95.2 187.9 92.7
Note: TF is the hydrophobic Teflon membrane, TL is the hydrophilic Teflon membrane, TM is the 100% Teflon membrane.
Sample Processing Procedures
All laboratory glassware used for sample processing, including beakers, separatory
funnels, and graduated cylinders, were washed, rinsed with DI water and hexane, and baked in
an oven at 350°C for 6 hours before use. The same sample beakers used for the recoveries were
used for the sample processing. Aluminum weighing pans were numbered and tared before use.
After sample recovery, ERG processed the samples in preparation for gravimetric
analysis. The sample recovery procedures yielded an inorganic fraction and an organic fraction
for each filter: 30 inorganic fraction samples and 30 organic fractions total. The inorganic
fraction of each sample was extracted with 30 mL of hexane three times using a separatory
funnel. The resulting hexane extracts were combined with the associated organic fraction for that
sample. The organic fractions had a total sample volume of 120 mL. The inorganic sample
beakers were placed in an oven set to 105°C to expedite evaporation to approximately 10 mL.
The organic sample beakers were placed into the laboratory fume hood where they were allowed
to evaporate to approximately 10 mL. The organic samples were then quantitatively transferred
into tared weighing pans using hexane and the pan numbers were recorded in the lab notebook.
The inorganic samples were allowed to cool in the fume hood, and then quantitatively transferred
into tared weighing pans using water and the pan numbers were recorded in the lab notebook.
The sample pans were allowed to evaporate to dryness in the fume hood and placed in
20
desiccators in the balance room for gravimetric analysis. Samples were handled and processed in
a manner that ensured the integrity of samples and minimized the opportunity for contamination.
Nitrile gloves were worn during all sample handling and processing.
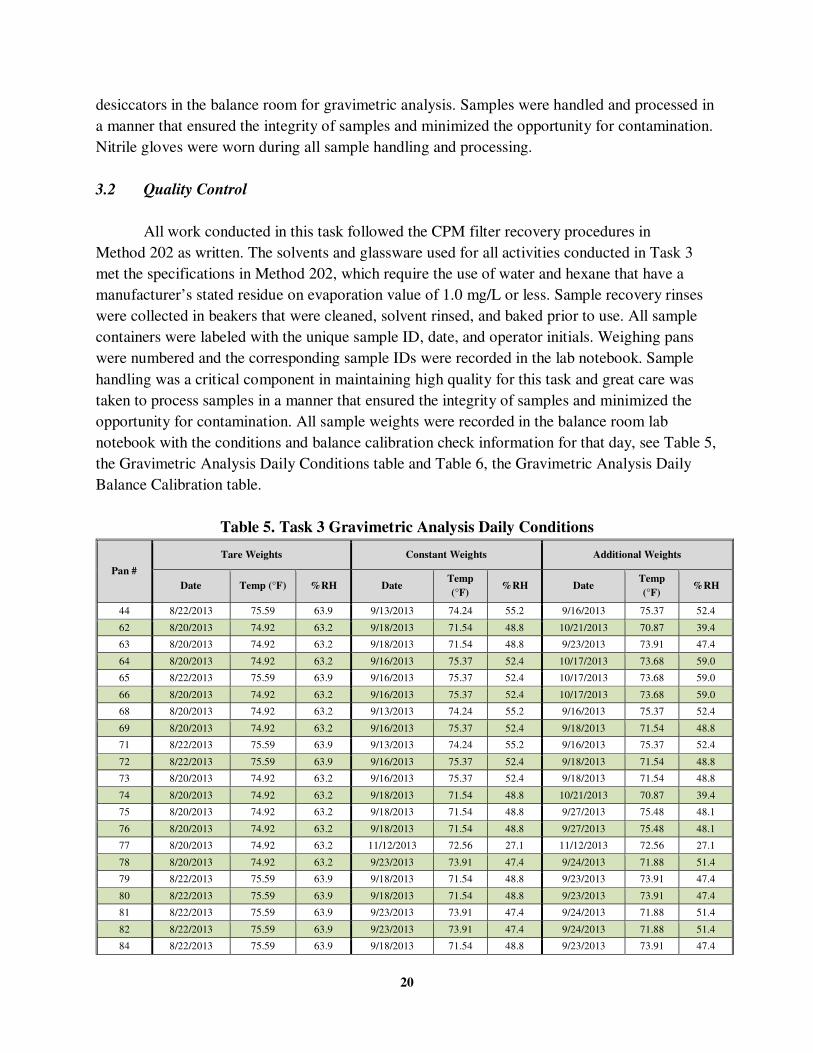
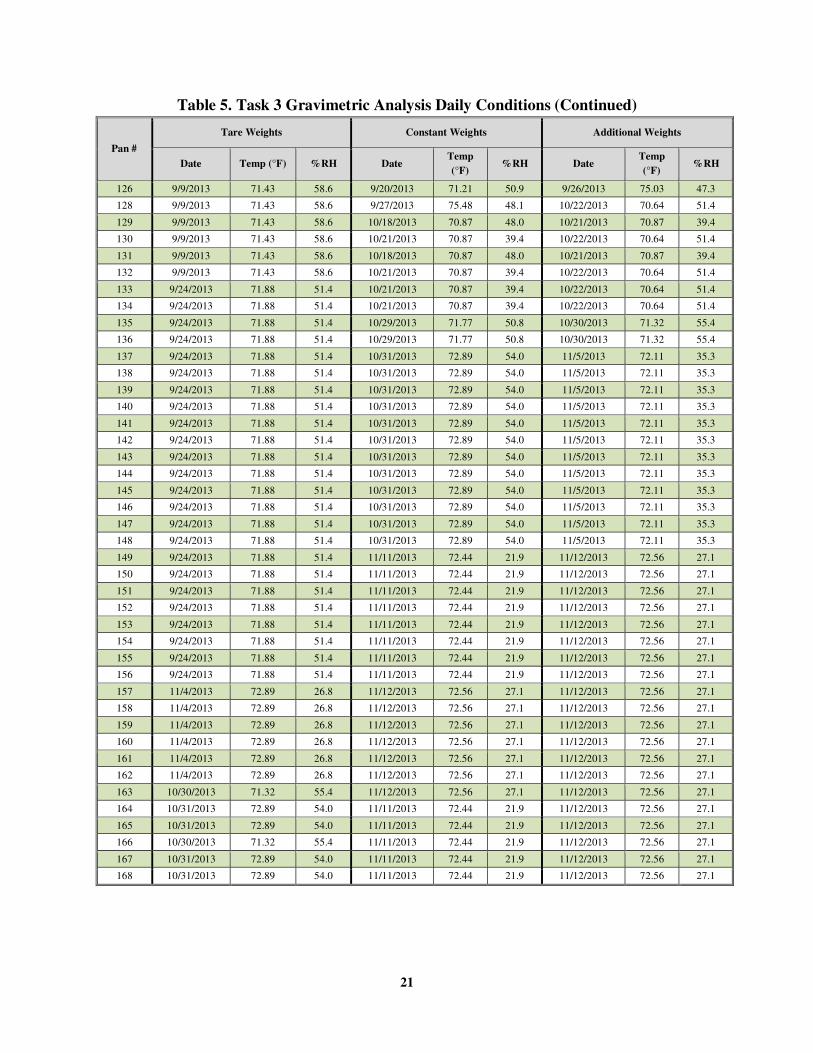
3.2 Quality Control
All work conducted in this task followed the CPM filter recovery procedures in
Method 202 as written. The solvents and glassware used for all activities conducted in Task 3
met the specifications in Method 202, which require the use of water and hexane that have a
manufacturer’s stated residue on evaporation value of 1.0 mg/L or less. Sample recovery rinses
were collected in beakers that were cleaned, solvent rinsed, and baked prior to use. All sample
containers were labeled with the unique sample ID, date, and operator initials. Weighing pans
were numbered and the corresponding sample IDs were recorded in the lab notebook. Sample
handling was a critical component in maintaining high quality for this task and great care was
taken to process samples in a manner that ensured the integrity of samples and minimized the
opportunity for contamination. All sample weights were recorded in the balance room lab
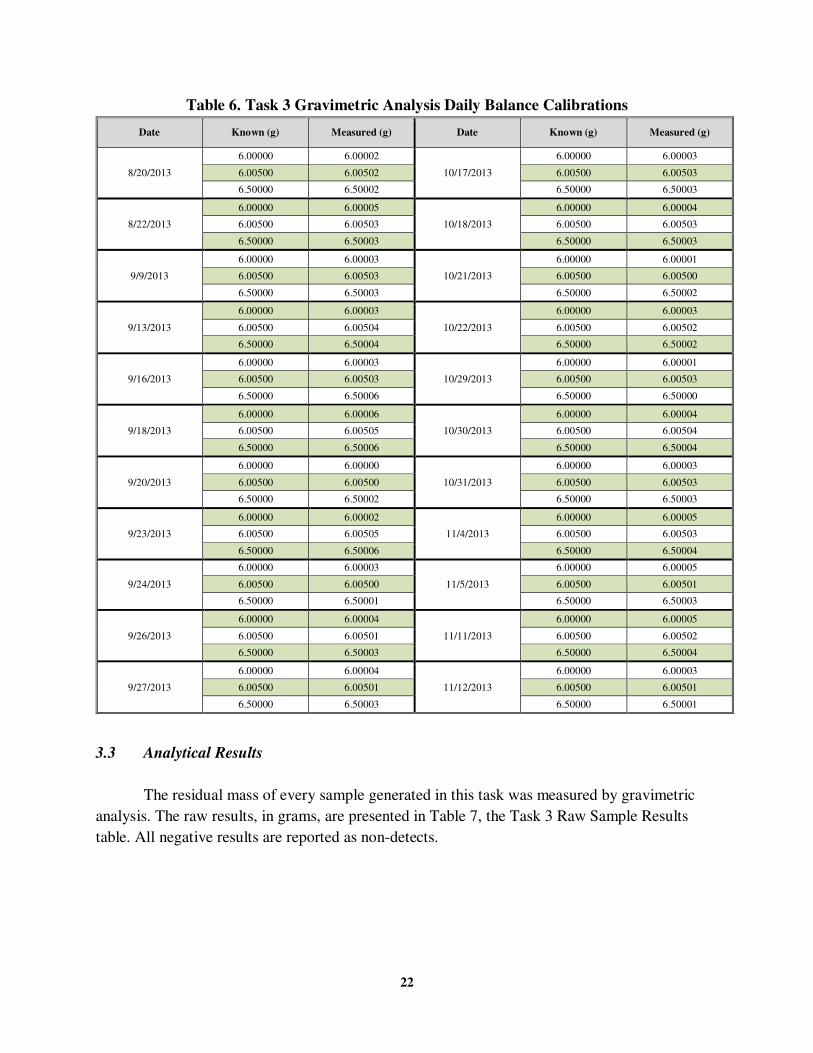
notebook with the conditions and balance calibration check information for that day, see Table 5,
the Gravimetric Analysis Daily Conditions table and Table 6, the Gravimetric Analysis Daily
Balance Calibration table.
Table 5. Task 3 Gravimetric Analysis Daily Conditions
Pan #
Tare Weights Constant Weights Additional Weights
Date Temp (°F) %RH Date Temp
(°F) %RH Date
Temp
(°F) %RH
44 8/22/2013 75.59 63.9 9/13/2013 74.24 55.2 9/16/2013 75.37 52.4
62 8/20/2013 74.92 63.2 9/18/2013 71.54 48.8 10/21/2013 70.87 39.4
63 8/20/2013 74.92 63.2 9/18/2013 71.54 48.8 9/23/2013 73.91 47.4
64 8/20/2013 74.92 63.2 9/16/2013 75.37 52.4 10/17/2013 73.68 59.0
65 8/22/2013 75.59 63.9 9/16/2013 75.37 52.4 10/17/2013 73.68 59.0
66 8/20/2013 74.92 63.2 9/16/2013 75.37 52.4 10/17/2013 73.68 59.0
68 8/20/2013 74.92 63.2 9/13/2013 74.24 55.2 9/16/2013 75.37 52.4
69 8/20/2013 74.92 63.2 9/16/2013 75.37 52.4 9/18/2013 71.54 48.8
71 8/22/2013 75.59 63.9 9/13/2013 74.24 55.2 9/16/2013 75.37 52.4
72 8/22/2013 75.59 63.9 9/16/2013 75.37 52.4 9/18/2013 71.54 48.8
73 8/20/2013 74.92 63.2 9/16/2013 75.37 52.4 9/18/2013 71.54 48.8
74 8/20/2013 74.92 63.2 9/18/2013 71.54 48.8 10/21/2013 70.87 39.4
75 8/20/2013 74.92 63.2 9/18/2013 71.54 48.8 9/27/2013 75.48 48.1
76 8/20/2013 74.92 63.2 9/18/2013 71.54 48.8 9/27/2013 75.48 48.1
77 8/20/2013 74.92 63.2 11/12/2013 72.56 27.1 11/12/2013 72.56 27.1
78 8/20/2013 74.92 63.2 9/23/2013 73.91 47.4 9/24/2013 71.88 51.4
79 8/22/2013 75.59 63.9 9/18/2013 71.54 48.8 9/23/2013 73.91 47.4
80 8/22/2013 75.59 63.9 9/18/2013 71.54 48.8 9/23/2013 73.91 47.4
81 8/22/2013 75.59 63.9 9/23/2013 73.91 47.4 9/24/2013 71.88 51.4
82 8/22/2013 75.59 63.9 9/23/2013 73.91 47.4 9/24/2013 71.88 51.4
84 8/22/2013 75.59 63.9 9/18/2013 71.54 48.8 9/23/2013 73.91 47.4
21
Table 5. Task 3 Gravimetric Analysis Daily Conditions (Continued)
Pan #
Tare Weights Constant Weights Additional Weights
Date Temp (°F) %RH Date Temp
(°F) %RH Date
Temp
(°F) %RH
126 9/9/2013 71.43 58.6 9/20/2013 71.21 50.9 9/26/2013 75.03 47.3
128 9/9/2013 71.43 58.6 9/27/2013 75.48 48.1 10/22/2013 70.64 51.4
129 9/9/2013 71.43 58.6 10/18/2013 70.87 48.0 10/21/2013 70.87 39.4
130 9/9/2013 71.43 58.6 10/21/2013 70.87 39.4 10/22/2013 70.64 51.4
131 9/9/2013 71.43 58.6 10/18/2013 70.87 48.0 10/21/2013 70.87 39.4
132 9/9/2013 71.43 58.6 10/21/2013 70.87 39.4 10/22/2013 70.64 51.4
133 9/24/2013 71.88 51.4 10/21/2013 70.87 39.4 10/22/2013 70.64 51.4
134 9/24/2013 71.88 51.4 10/21/2013 70.87 39.4 10/22/2013 70.64 51.4
135 9/24/2013 71.88 51.4 10/29/2013 71.77 50.8 10/30/2013 71.32 55.4
136 9/24/2013 71.88 51.4 10/29/2013 71.77 50.8 10/30/2013 71.32 55.4
137 9/24/2013 71.88 51.4 10/31/2013 72.89 54.0 11/5/2013 72.11 35.3
138 9/24/2013 71.88 51.4 10/31/2013 72.89 54.0 11/5/2013 72.11 35.3
139 9/24/2013 71.88 51.4 10/31/2013 72.89 54.0 11/5/2013 72.11 35.3
140 9/24/2013 71.88 51.4 10/31/2013 72.89 54.0 11/5/2013 72.11 35.3
141 9/24/2013 71.88 51.4 10/31/2013 72.89 54.0 11/5/2013 72.11 35.3
142 9/24/2013 71.88 51.4 10/31/2013 72.89 54.0 11/5/2013 72.11 35.3
143 9/24/2013 71.88 51.4 10/31/2013 72.89 54.0 11/5/2013 72.11 35.3
144 9/24/2013 71.88 51.4 10/31/2013 72.89 54.0 11/5/2013 72.11 35.3
145 9/24/2013 71.88 51.4 10/31/2013 72.89 54.0 11/5/2013 72.11 35.3
146 9/24/2013 71.88 51.4 10/31/2013 72.89 54.0 11/5/2013 72.11 35.3
147 9/24/2013 71.88 51.4 10/31/2013 72.89 54.0 11/5/2013 72.11 35.3
148 9/24/2013 71.88 51.4 10/31/2013 72.89 54.0 11/5/2013 72.11 35.3
149 9/24/2013 71.88 51.4 11/11/2013 72.44 21.9 11/12/2013 72.56 27.1
150 9/24/2013 71.88 51.4 11/11/2013 72.44 21.9 11/12/2013 72.56 27.1
151 9/24/2013 71.88 51.4 11/11/2013 72.44 21.9 11/12/2013 72.56 27.1
152 9/24/2013 71.88 51.4 11/11/2013 72.44 21.9 11/12/2013 72.56 27.1
153 9/24/2013 71.88 51.4 11/11/2013 72.44 21.9 11/12/2013 72.56 27.1
154 9/24/2013 71.88 51.4 11/11/2013 72.44 21.9 11/12/2013 72.56 27.1
155 9/24/2013 71.88 51.4 11/11/2013 72.44 21.9 11/12/2013 72.56 27.1
156 9/24/2013 71.88 51.4 11/11/2013 72.44 21.9 11/12/2013 72.56 27.1
157 11/4/2013 72.89 26.8 11/12/2013 72.56 27.1 11/12/2013 72.56 27.1
158 11/4/2013 72.89 26.8 11/12/2013 72.56 27.1 11/12/2013 72.56 27.1
159 11/4/2013 72.89 26.8 11/12/2013 72.56 27.1 11/12/2013 72.56 27.1
160 11/4/2013 72.89 26.8 11/12/2013 72.56 27.1 11/12/2013 72.56 27.1
161 11/4/2013 72.89 26.8 11/12/2013 72.56 27.1 11/12/2013 72.56 27.1
162 11/4/2013 72.89 26.8 11/12/2013 72.56 27.1 11/12/2013 72.56 27.1
163 10/30/2013 71.32 55.4 11/12/2013 72.56 27.1 11/12/2013 72.56 27.1
164 10/31/2013 72.89 54.0 11/11/2013 72.44 21.9 11/12/2013 72.56 27.1
165 10/31/2013 72.89 54.0 11/11/2013 72.44 21.9 11/12/2013 72.56 27.1
166 10/30/2013 71.32 55.4 11/11/2013 72.44 21.9 11/12/2013 72.56 27.1
167 10/31/2013 72.89 54.0 11/11/2013 72.44 21.9 11/12/2013 72.56 27.1
168 10/31/2013 72.89 54.0 11/11/2013 72.44 21.9 11/12/2013 72.56 27.1
22
Table 6. Task 3 Gravimetric Analysis Daily Balance Calibrations
Date Known (g) Measured (g) Date Known (g) Measured (g)
8/20/2013
6.00000 6.00002
10/17/2013
6.00000 6.00003
6.00500 6.00502 6.00500 6.00503
6.50000 6.50002 6.50000 6.50003
8/22/2013
6.00000 6.00005
10/18/2013
6.00000 6.00004
6.00500 6.00503 6.00500 6.00503
6.50000 6.50003 6.50000 6.50003
9/9/2013
6.00000 6.00003
10/21/2013
6.00000 6.00001
6.00500 6.00503 6.00500 6.00500
6.50000 6.50003 6.50000 6.50002
9/13/2013
6.00000 6.00003
10/22/2013
6.00000 6.00003
6.00500 6.00504 6.00500 6.00502
6.50000 6.50004 6.50000 6.50002
9/16/2013
6.00000 6.00003
10/29/2013
6.00000 6.00001
6.00500 6.00503 6.00500 6.00503
6.50000 6.50006 6.50000 6.50000
9/18/2013
6.00000 6.00006
10/30/2013
6.00000 6.00004
6.00500 6.00505 6.00500 6.00504
6.50000 6.50006 6.50000 6.50004
6.00000 6.00000 6.00000 6.00003
9/20/2013 6.00500 6.00500 10/31/2013 6.00500 6.00503
6.50000 6.50002 6.50000 6.50003
6.00000 6.00002 6.00000 6.00005
9/23/2013 6.00500 6.00505 11/4/2013 6.00500 6.00503
6.50000 6.50006 6.50000 6.50004
6.00000 6.00003 6.00000 6.00005
9/24/2013 6.00500 6.00500 11/5/2013 6.00500 6.00501
6.50000 6.50001 6.50000 6.50003
6.00000 6.00004 6.00000 6.00005
9/26/2013 6.00500 6.00501 11/11/2013 6.00500 6.00502
6.50000 6.50003 6.50000 6.50004
6.00000 6.00004 6.00000 6.00003
9/27/2013 6.00500 6.00501 11/12/2013 6.00500 6.00501
6.50000 6.50003 6.50000 6.50001
3.3 Analytical Results
The residual mass of every sample generated in this task was measured by gravimetric
analysis. The raw results, in grams, are presented in Table 7, the Task 3 Raw Sample Results
table. All negative results are reported as non-detects.
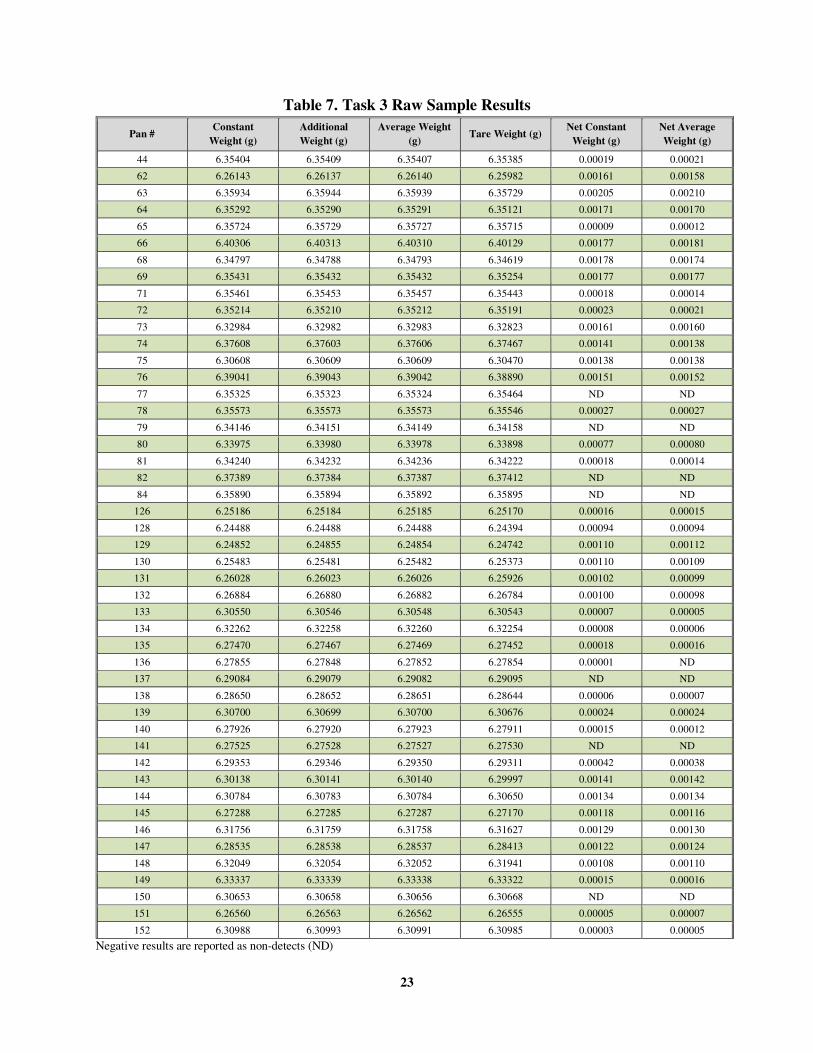
23
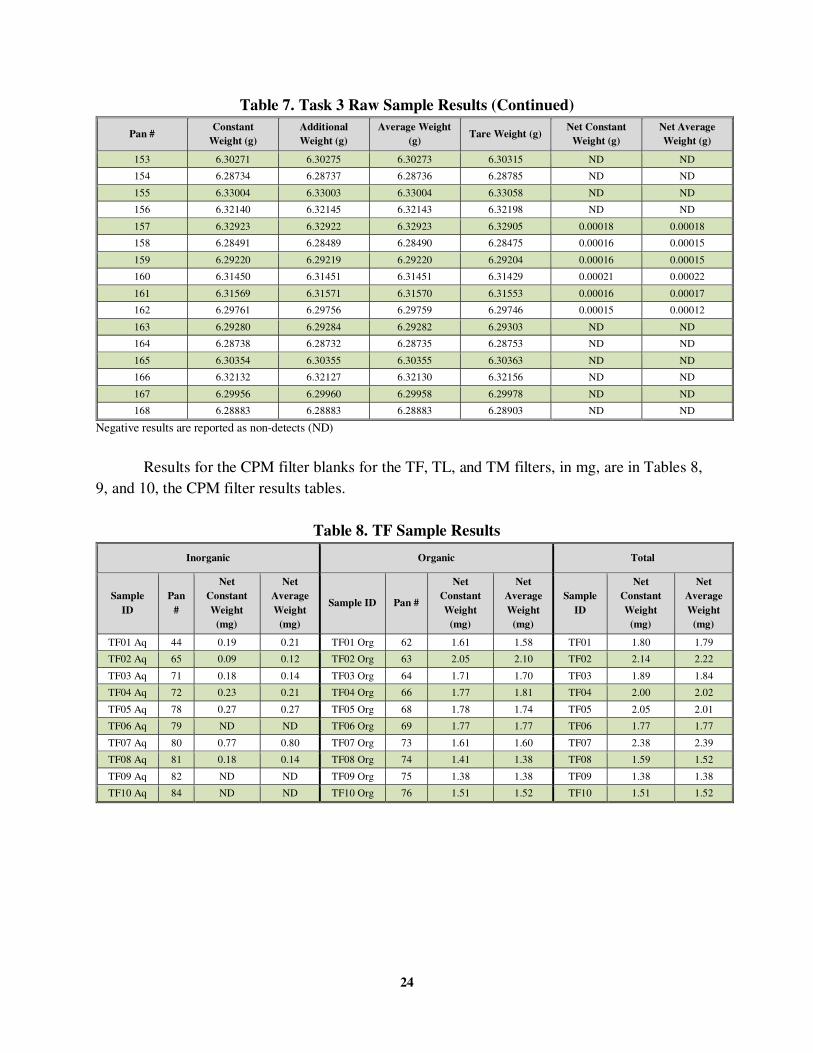
Table 7. Task 3 Raw Sample Results
Pan # Constant
Weight (g)
Additional
Weight (g)
Average Weight
(g) Tare Weight (g)
Net Constant
Weight (g)
Net Average
Weight (g)
44 6.35404 6.35409 6.35407 6.35385 0.00019 0.00021
62 6.26143 6.26137 6.26140 6.25982 0.00161 0.00158
63 6.35934 6.35944 6.35939 6.35729 0.00205 0.00210
64 6.35292 6.35290 6.35291 6.35121 0.00171 0.00170
65 6.35724 6.35729 6.35727 6.35715 0.00009 0.00012
66 6.40306 6.40313 6.40310 6.40129 0.00177 0.00181
68 6.34797 6.34788 6.34793 6.34619 0.00178 0.00174
69 6.35431 6.35432 6.35432 6.35254 0.00177 0.00177
71 6.35461 6.35453 6.35457 6.35443 0.00018 0.00014
72 6.35214 6.35210 6.35212 6.35191 0.00023 0.00021
73 6.32984 6.32982 6.32983 6.32823 0.00161 0.00160
74 6.37608 6.37603 6.37606 6.37467 0.00141 0.00138
75 6.30608 6.30609 6.30609 6.30470 0.00138 0.00138
76 6.39041 6.39043 6.39042 6.38890 0.00151 0.00152
77 6.35325 6.35323 6.35324 6.35464 ND ND
78 6.35573 6.35573 6.35573 6.35546 0.00027 0.00027
79 6.34146 6.34151 6.34149 6.34158 ND ND
80 6.33975 6.33980 6.33978 6.33898 0.00077 0.00080
81 6.34240 6.34232 6.34236 6.34222 0.00018 0.00014
82 6.37389 6.37384 6.37387 6.37412 ND ND
84 6.35890 6.35894 6.35892 6.35895 ND ND
126 6.25186 6.25184 6.25185 6.25170 0.00016 0.00015
128 6.24488 6.24488 6.24488 6.24394 0.00094 0.00094
129 6.24852 6.24855 6.24854 6.24742 0.00110 0.00112
130 6.25483 6.25481 6.25482 6.25373 0.00110 0.00109
131 6.26028 6.26023 6.26026 6.25926 0.00102 0.00099
132 6.26884 6.26880 6.26882 6.26784 0.00100 0.00098
133 6.30550 6.30546 6.30548 6.30543 0.00007 0.00005
134 6.32262 6.32258 6.32260 6.32254 0.00008 0.00006
135 6.27470 6.27467 6.27469 6.27452 0.00018 0.00016
136 6.27855 6.27848 6.27852 6.27854 0.00001 ND
137 6.29084 6.29079 6.29082 6.29095 ND ND
138 6.28650 6.28652 6.28651 6.28644 0.00006 0.00007
139 6.30700 6.30699 6.30700 6.30676 0.00024 0.00024
140 6.27926 6.27920 6.27923 6.27911 0.00015 0.00012
141 6.27525 6.27528 6.27527 6.27530 ND ND
142 6.29353 6.29346 6.29350 6.29311 0.00042 0.00038
143 6.30138 6.30141 6.30140 6.29997 0.00141 0.00142
144 6.30784 6.30783 6.30784 6.30650 0.00134 0.00134
145 6.27288 6.27285 6.27287 6.27170 0.00118 0.00116
146 6.31756 6.31759 6.31758 6.31627 0.00129 0.00130
147 6.28535 6.28538 6.28537 6.28413 0.00122 0.00124
148 6.32049 6.32054 6.32052 6.31941 0.00108 0.00110
149 6.33337 6.33339 6.33338 6.33322 0.00015 0.00016
150 6.30653 6.30658 6.30656 6.30668 ND ND
151 6.26560 6.26563 6.26562 6.26555 0.00005 0.00007
152 6.30988 6.30993 6.30991 6.30985 0.00003 0.00005
Negative results are reported as non-detects (ND)
24
Table 7. Task 3 Raw Sample Results (Continued)
Pan # Constant
Weight (g)
Additional
Weight (g)
Average Weight
(g) Tare Weight (g)
Net Constant
Weight (g)
Net Average
Weight (g)
153 6.30271 6.30275 6.30273 6.30315 ND ND
154 6.28734 6.28737 6.28736 6.28785 ND ND
155 6.33004 6.33003 6.33004 6.33058 ND ND
156 6.32140 6.32145 6.32143 6.32198 ND ND
157 6.32923 6.32922 6.32923 6.32905 0.00018 0.00018
158 6.28491 6.28489 6.28490 6.28475 0.00016 0.00015
159 6.29220 6.29219 6.29220 6.29204 0.00016 0.00015
160 6.31450 6.31451 6.31451 6.31429 0.00021 0.00022
161 6.31569 6.31571 6.31570 6.31553 0.00016 0.00017
162 6.29761 6.29756 6.29759 6.29746 0.00015 0.00012
163 6.29280 6.29284 6.29282 6.29303 ND ND
164 6.28738 6.28732 6.28735 6.28753 ND ND
165 6.30354 6.30355 6.30355 6.30363 ND ND
166 6.32132 6.32127 6.32130 6.32156 ND ND
167 6.29956 6.29960 6.29958 6.29978 ND ND
168 6.28883 6.28883 6.28883 6.28903 ND ND
Negative results are reported as non-detects (ND)
Results for the CPM filter blanks for the TF, TL, and TM filters, in mg, are in Tables 8,
9, and 10, the CPM filter results tables.
Table 8. TF Sample Results
Inorganic Organic Total
Sample
ID
Pan
#
Net
Constant
Weight
(mg)
Net
Average
Weight
(mg)
Sample ID Pan #
Net
Constant
Weight
(mg)
Net
Average
Weight
(mg)
Sample
ID
Net
Constant
Weight
(mg)
Net
Average
Weight
(mg)
TF01 Aq 44 0.19 0.21 TF01 Org 62 1.61 1.58 TF01 1.80 1.79
TF02 Aq 65 0.09 0.12 TF02 Org 63 2.05 2.10 TF02 2.14 2.22
TF03 Aq 71 0.18 0.14 TF03 Org 64 1.71 1.70 TF03 1.89 1.84
TF04 Aq 72 0.23 0.21 TF04 Org 66 1.77 1.81 TF04 2.00 2.02
TF05 Aq 78 0.27 0.27 TF05 Org 68 1.78 1.74 TF05 2.05 2.01
TF06 Aq 79 ND ND TF06 Org 69 1.77 1.77 TF06 1.77 1.77
TF07 Aq 80 0.77 0.80 TF07 Org 73 1.61 1.60 TF07 2.38 2.39
TF08 Aq 81 0.18 0.14 TF08 Org 74 1.41 1.38 TF08 1.59 1.52
TF09 Aq 82 ND ND TF09 Org 75 1.38 1.38 TF09 1.38 1.38
TF10 Aq 84 ND ND TF10 Org 76 1.51 1.52 TF10 1.51 1.52
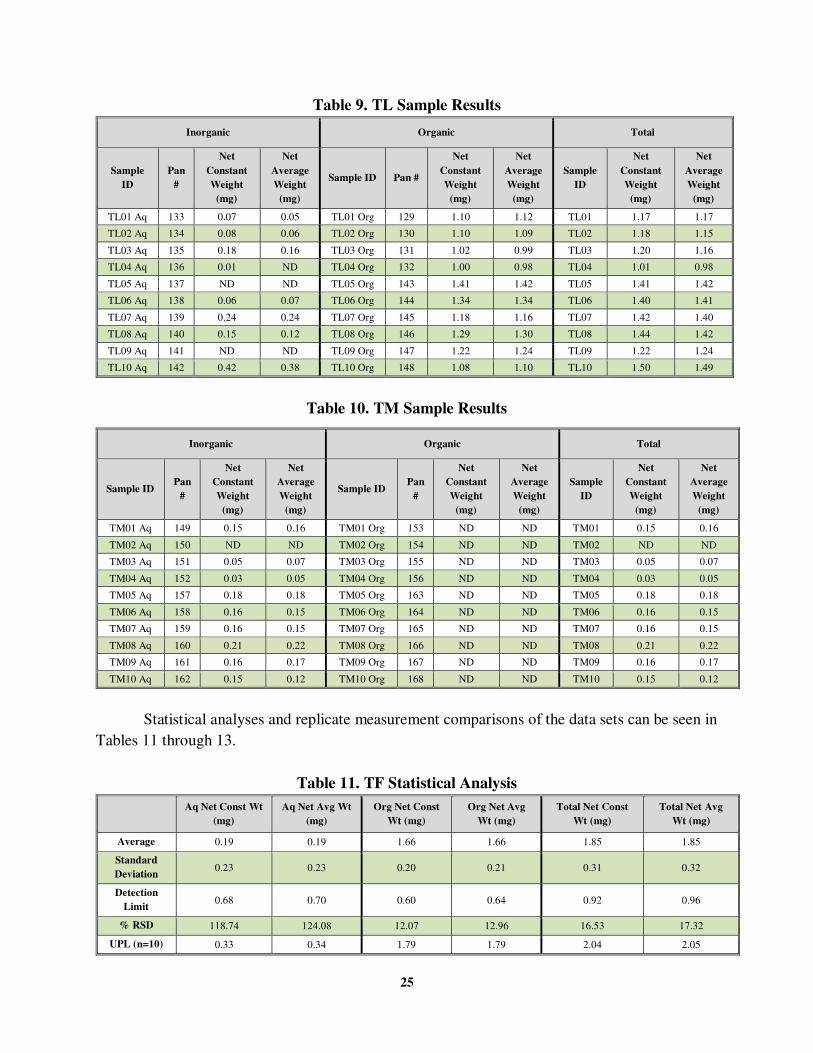
25
Table 9. TL Sample Results
Inorganic Organic Total
Sample
ID
Pan
#
Net
Constant
Weight
(mg)
Net
Average
Weight
(mg)
Sample ID Pan #
Net
Constant
Weight
(mg)
Net
Average
Weight
(mg)
Sample
ID
Net
Constant
Weight
(mg)
Net
Average
Weight
(mg)
TL01 Aq 133 0.07 0.05 TL01 Org 129 1.10 1.12 TL01 1.17 1.17
TL02 Aq 134 0.08 0.06 TL02 Org 130 1.10 1.09 TL02 1.18 1.15
TL03 Aq 135 0.18 0.16 TL03 Org 131 1.02 0.99 TL03 1.20 1.16
TL04 Aq 136 0.01 ND TL04 Org 132 1.00 0.98 TL04 1.01 0.98
TL05 Aq 137 ND ND TL05 Org 143 1.41 1.42 TL05 1.41 1.42
TL06 Aq 138 0.06 0.07 TL06 Org 144 1.34 1.34 TL06 1.40 1.41
TL07 Aq 139 0.24 0.24 TL07 Org 145 1.18 1.16 TL07 1.42 1.40
TL08 Aq 140 0.15 0.12 TL08 Org 146 1.29 1.30 TL08 1.44 1.42
TL09 Aq 141 ND ND TL09 Org 147 1.22 1.24 TL09 1.22 1.24
TL10 Aq 142 0.42 0.38 TL10 Org 148 1.08 1.10 TL10 1.50 1.49
Table 10. TM Sample Results
Inorganic Organic Total
Sample ID Pan
#
Net
Constant
Weight
(mg)
Net
Average
Weight
(mg)
Sample ID Pan
#
Net
Constant
Weight
(mg)
Net
Average
Weight
(mg)
Sample
ID
Net
Constant
Weight
(mg)
Net
Average
Weight
(mg)
TM01 Aq 149 0.15 0.16 TM01 Org 153 ND ND TM01 0.15 0.16
TM02 Aq 150 ND ND TM02 Org 154 ND ND TM02 ND ND
TM03 Aq 151 0.05 0.07 TM03 Org 155 ND ND TM03 0.05 0.07
TM04 Aq 152 0.03 0.05 TM04 Org 156 ND ND TM04 0.03 0.05
TM05 Aq 157 0.18 0.18 TM05 Org 163 ND ND TM05 0.18 0.18
TM06 Aq 158 0.16 0.15 TM06 Org 164 ND ND TM06 0.16 0.15
TM07 Aq 159 0.16 0.15 TM07 Org 165 ND ND TM07 0.16 0.15
TM08 Aq 160 0.21 0.22 TM08 Org 166 ND ND TM08 0.21 0.22
TM09 Aq 161 0.16 0.17 TM09 Org 167 ND ND TM09 0.16 0.17
TM10 Aq 162 0.15 0.12 TM10 Org 168 ND ND TM10 0.15 0.12
Statistical analyses and replicate measurement comparisons of the data sets can be seen in
Tables 11 through 13.
Table 11. TF Statistical Analysis
Aq Net Const Wt
(mg)
Aq Net Avg Wt
(mg)
Org Net Const
Wt (mg)
Org Net Avg
Wt (mg)
Total Net Const
Wt (mg)
Total Net Avg
Wt (mg)
Average 0.19 0.19 1.66 1.66 1.85 1.85
Standard
Deviation 0.23 0.23 0.20 0.21 0.31 0.32
Detection
Limit 0.68 0.70 0.60 0.64 0.92 0.96
% RSD 118.74 124.08 12.07 12.96 16.53 17.32
UPL (n=10) 0.33 0.34 1.79 1.79 2.04 2.05
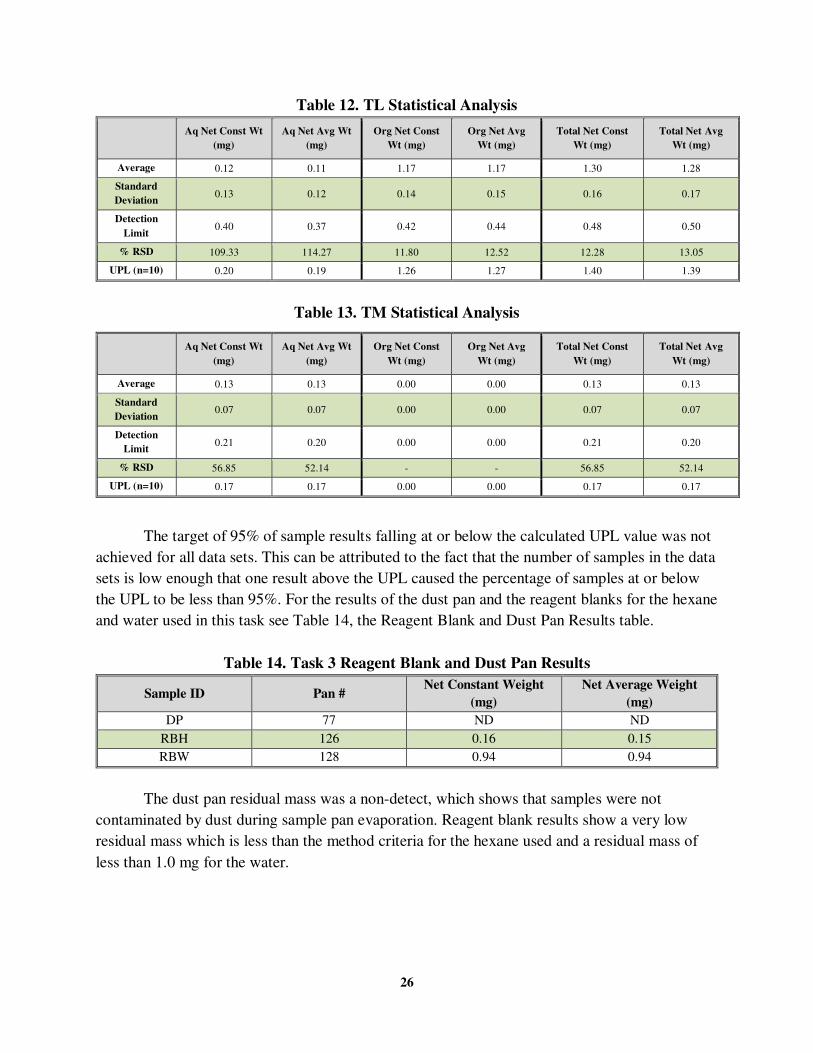
26
Table 12. TL Statistical Analysis
Aq Net Const Wt
(mg)
Aq Net Avg Wt
(mg)
Org Net Const
Wt (mg)
Org Net Avg
Wt (mg)
Total Net Const
Wt (mg)
Total Net Avg
Wt (mg)
Average 0.12 0.11 1.17 1.17 1.30 1.28
Standard
Deviation 0.13 0.12 0.14 0.15 0.16 0.17
Detection
Limit 0.40 0.37 0.42 0.44 0.48 0.50
% RSD 109.33 114.27 11.80 12.52 12.28 13.05
UPL (n=10) 0.20 0.19 1.26 1.27 1.40 1.39
Table 13. TM Statistical Analysis
Aq Net Const Wt
(mg)
Aq Net Avg Wt
(mg)
Org Net Const
Wt (mg)
Org Net Avg
Wt (mg)
Total Net Const
Wt (mg)
Total Net Avg
Wt (mg)
Average 0.13 0.13 0.00 0.00 0.13 0.13
Standard
Deviation 0.07 0.07 0.00 0.00 0.07 0.07
Detection
Limit 0.21 0.20 0.00 0.00 0.21 0.20
% RSD 56.85 52.14 - - 56.85 52.14
UPL (n=10) 0.17 0.17 0.00 0.00 0.17 0.17
The target of 95% of sample results falling at or below the calculated UPL value was not
achieved for all data sets. This can be attributed to the fact that the number of samples in the data
sets is low enough that one result above the UPL caused the percentage of samples at or below
the UPL to be less than 95%. For the results of the dust pan and the reagent blanks for the hexane
and water used in this task see Table 14, the Reagent Blank and Dust Pan Results table.
Table 14. Task 3 Reagent Blank and Dust Pan Results
Sample ID Pan # Net Constant Weight
(mg)
Net Average Weight
(mg)
DP 77 ND ND
RBH 126 0.16 0.15
RBW 128 0.94 0.94
The dust pan residual mass was a non-detect, which shows that samples were not
contaminated by dust during sample pan evaporation. Reagent blank results show a very low
residual mass which is less than the method criteria for the hexane used and a residual mass of
less than 1.0 mg for the water.
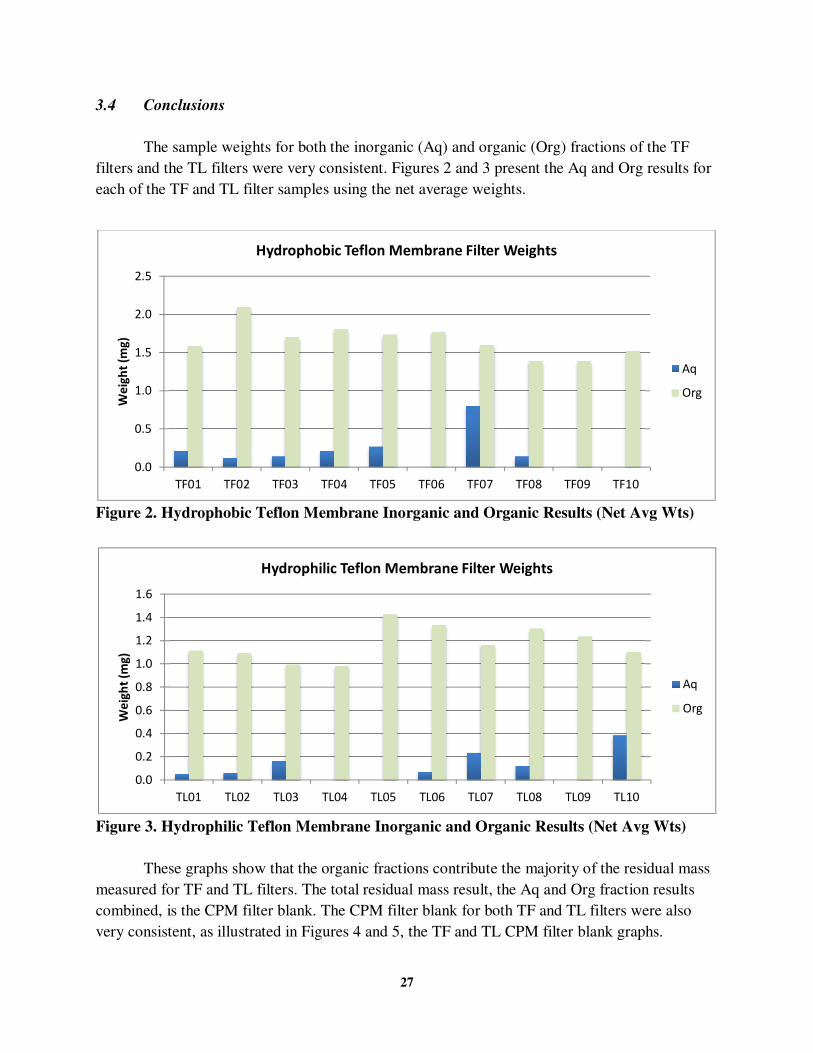
27
3.4 Conclusions
The sample weights for both the inorganic (Aq) and organic (Org) fractions of the TF
filters and the TL filters were very consistent. Figures 2 and 3 present the Aq and Org results for
each of the TF and TL filter samples using the net average weights.
Figure 2. Hydrophobic Teflon Membrane Inorganic and Organic Results (Net Avg Wts)
Figure 3. Hydrophilic Teflon Membrane Inorganic and Organic Results (Net Avg Wts)
These graphs show that the organic fractions contribute the majority of the residual mass
measured for TF and TL filters. The total residual mass result, the Aq and Org fraction results
combined, is the CPM filter blank. The CPM filter blank for both TF and TL filters were also
very consistent, as illustrated in Figures 4 and 5, the TF and TL CPM filter blank graphs.
0.0
0.5
1.0
1.5
2.0
2.5
TF01 TF02 TF03 TF04 TF05 TF06 TF07 TF08 TF09 TF10
We
igh
t (m
g)
Hydrophobic Teflon Membrane Filter Weights
Aq
Org
0.0
0.2
0.4
0.6
0.8
1.0
1.2
1.4
1.6
TL01 TL02 TL03 TL04 TL05 TL06 TL07 TL08 TL09 TL10
We
igh
t (m
g)
Hydrophilic Teflon Membrane Filter Weights
Aq
Org
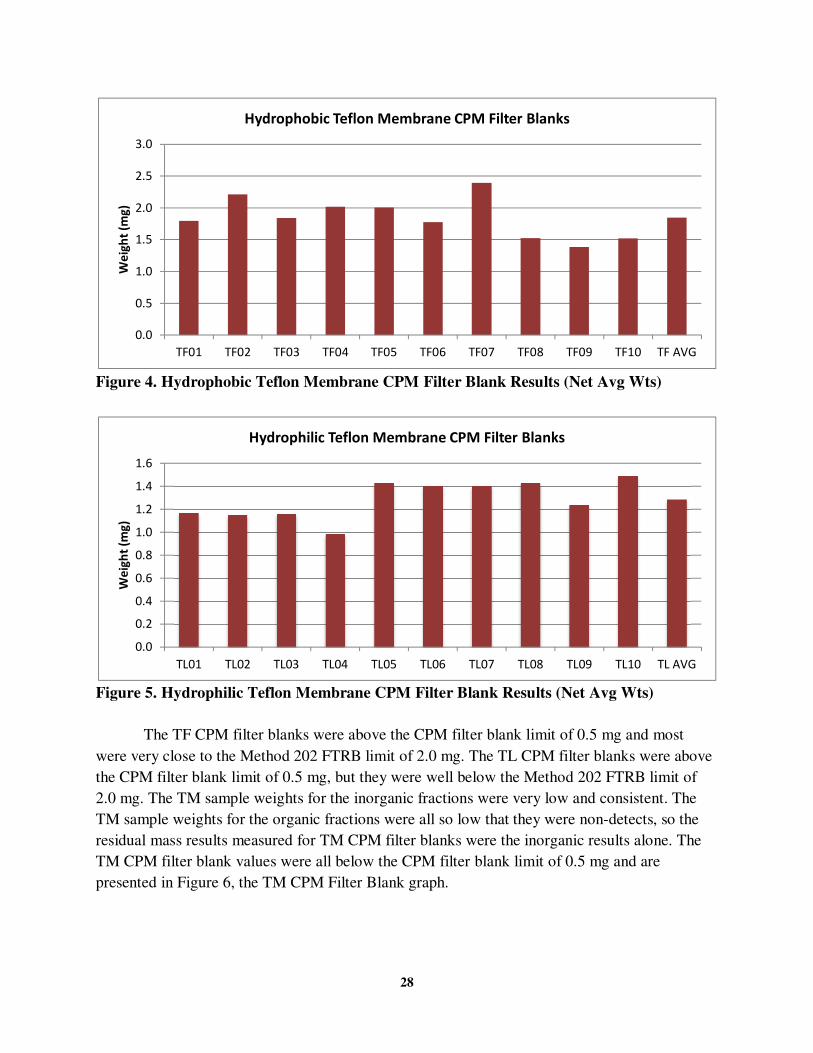
28
Figure 4. Hydrophobic Teflon Membrane CPM Filter Blank Results (Net Avg Wts)
Figure 5. Hydrophilic Teflon Membrane CPM Filter Blank Results (Net Avg Wts)
The TF CPM filter blanks were above the CPM filter blank limit of 0.5 mg and most
were very close to the Method 202 FTRB limit of 2.0 mg. The TL CPM filter blanks were above
the CPM filter blank limit of 0.5 mg, but they were well below the Method 202 FTRB limit of
2.0 mg. The TM sample weights for the inorganic fractions were very low and consistent. The
TM sample weights for the organic fractions were all so low that they were non-detects, so the
residual mass results measured for TM CPM filter blanks were the inorganic results alone. The
TM CPM filter blank values were all below the CPM filter blank limit of 0.5 mg and are
presented in Figure 6, the TM CPM Filter Blank graph.
0.0
0.5
1.0
1.5
2.0
2.5
3.0
TF01 TF02 TF03 TF04 TF05 TF06 TF07 TF08 TF09 TF10 TF AVG
We
igh
t (m
g)
Hydrophobic Teflon Membrane CPM Filter Blanks
0.0
0.2
0.4
0.6
0.8
1.0
1.2
1.4
1.6
TL01 TL02 TL03 TL04 TL05 TL06 TL07 TL08 TL09 TL10 TL AVG
We
igh
t (m
g)
Hydrophilic Teflon Membrane CPM Filter Blanks
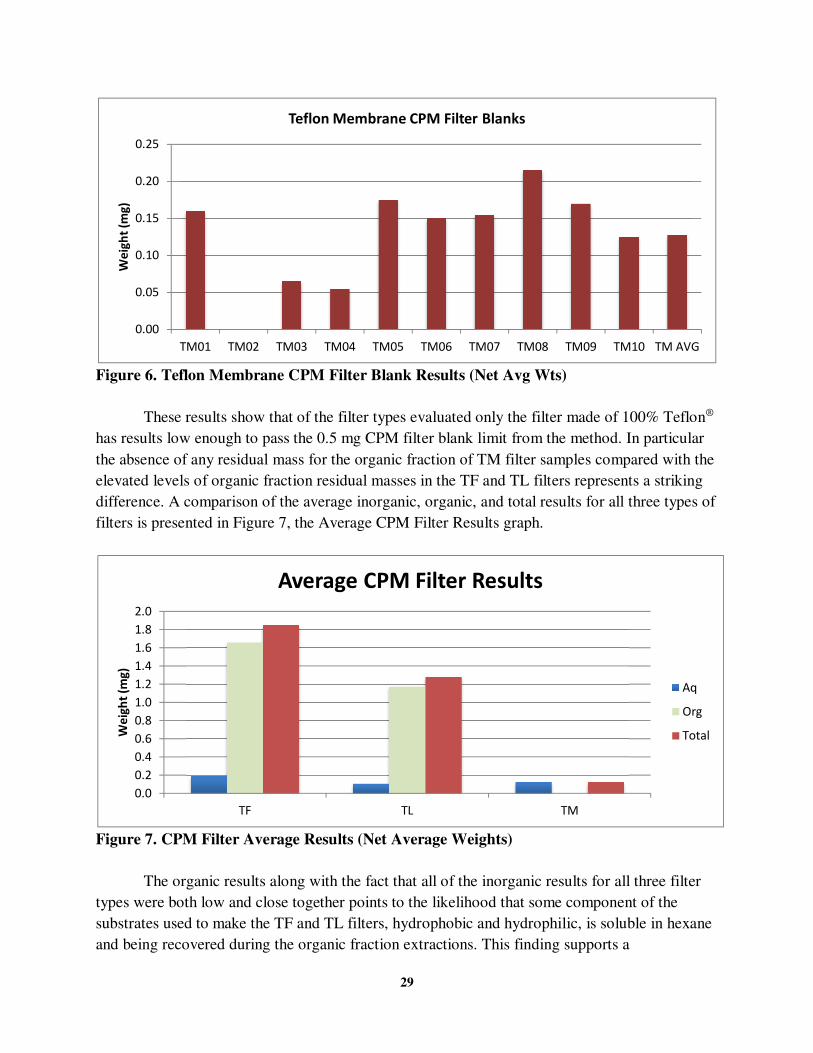
29
Figure 6. Teflon Membrane CPM Filter Blank Results (Net Avg Wts)
These results show that of the filter types evaluated only the filter made of 100% Teflon®
has results low enough to pass the 0.5 mg CPM filter blank limit from the method. In particular
the absence of any residual mass for the organic fraction of TM filter samples compared with the
elevated levels of organic fraction residual masses in the TF and TL filters represents a striking
difference. A comparison of the average inorganic, organic, and total results for all three types of
filters is presented in Figure 7, the Average CPM Filter Results graph.
Figure 7. CPM Filter Average Results (Net Average Weights)
The organic results along with the fact that all of the inorganic results for all three filter
types were both low and close together points to the likelihood that some component of the
substrates used to make the TF and TL filters, hydrophobic and hydrophilic, is soluble in hexane
and being recovered during the organic fraction extractions. This finding supports a
0.00
0.05
0.10
0.15
0.20
0.25
TM01 TM02 TM03 TM04 TM05 TM06 TM07 TM08 TM09 TM10 TM AVG
We
igh
t (m
g)
Teflon Membrane CPM Filter Blanks
0.0
0.2
0.4
0.6
0.8
1.0
1.2
1.4
1.6
1.8
2.0
TF TL TM
We
igh
t (m
g)
Average CPM Filter Results
Aq
Org
Total
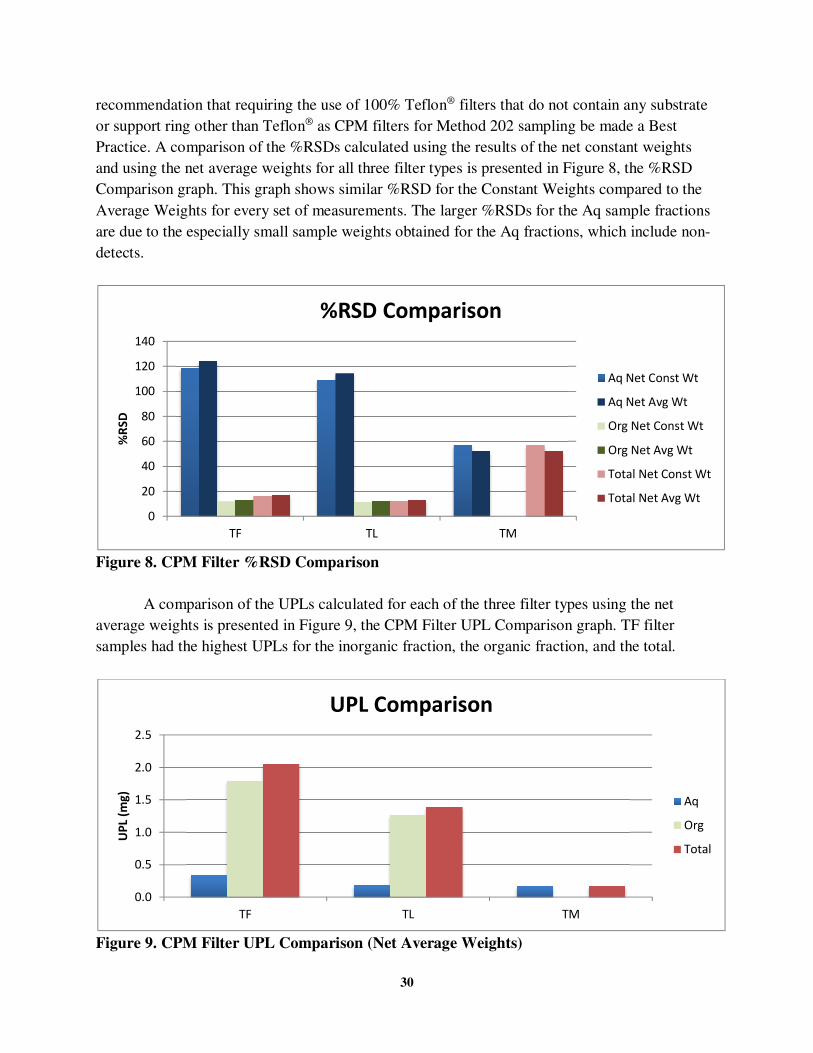
30
recommendation that requiring the use of 100% Teflon® filters that do not contain any substrate
or support ring other than Teflon® as CPM filters for Method 202 sampling be made a Best
Practice. A comparison of the %RSDs calculated using the results of the net constant weights
and using the net average weights for all three filter types is presented in Figure 8, the %RSD
Comparison graph. This graph shows similar %RSD for the Constant Weights compared to the
Average Weights for every set of measurements. The larger %RSDs for the Aq sample fractions
are due to the especially small sample weights obtained for the Aq fractions, which include non-
detects.
Figure 8. CPM Filter %RSD Comparison
A comparison of the UPLs calculated for each of the three filter types using the net
average weights is presented in Figure 9, the CPM Filter UPL Comparison graph. TF filter
samples had the highest UPLs for the inorganic fraction, the organic fraction, and the total.
Figure 9. CPM Filter UPL Comparison (Net Average Weights)
0
20
40
60
80
100
120
140
TF TL TM
%R
SD
%RSD Comparison
Aq Net Const Wt
Aq Net Avg Wt
Org Net Const Wt
Org Net Avg Wt
Total Net Const Wt
Total Net Avg Wt
0.0
0.5
1.0
1.5
2.0
2.5
TF TL TM
UP
L (m
g)
UPL Comparison
Aq
Org
Total
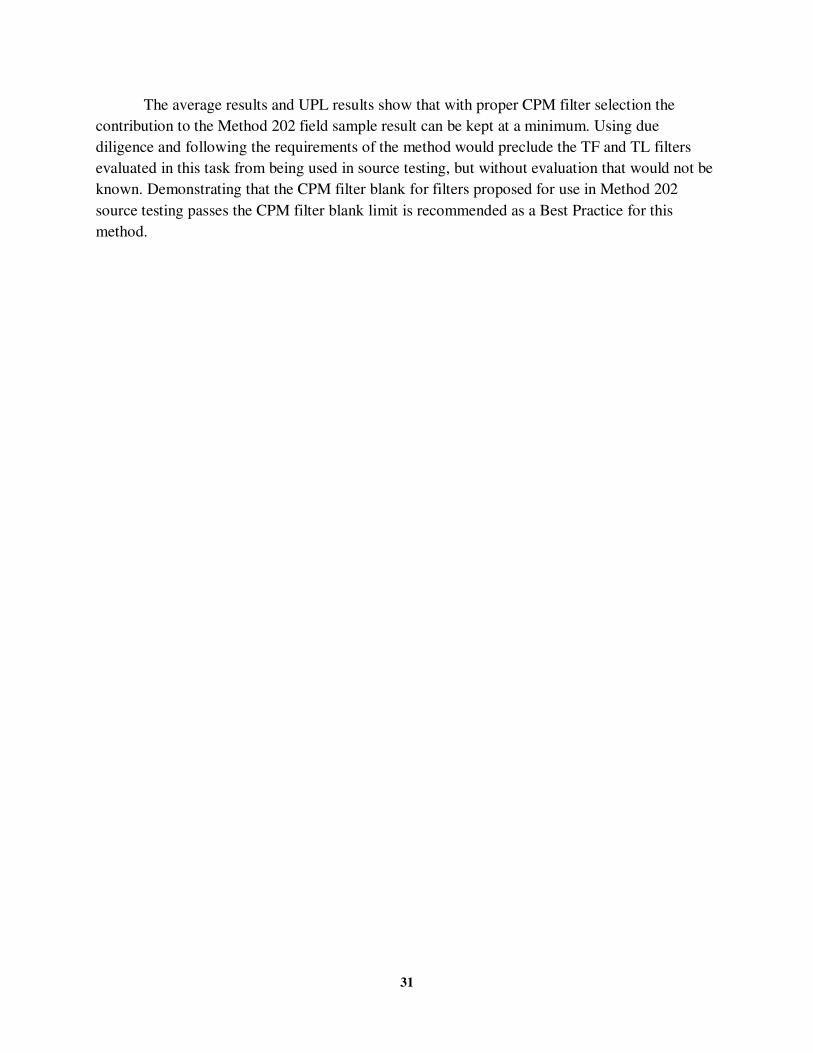
31
The average results and UPL results show that with proper CPM filter selection the
contribution to the Method 202 field sample result can be kept at a minimum. Using due
diligence and following the requirements of the method would preclude the TF and TL filters
evaluated in this task from being used in source testing, but without evaluation that would not be
known. Demonstrating that the CPM filter blank for filters proposed for use in Method 202
source testing passes the CPM filter blank limit is recommended as a Best Practice for this
method.
32
4.0 METHOD 202 REAGENT EVALUATION
Method 202 reagent evaluations were performed from July through October of 2013 at
the ERG laboratory facility, in accordance with WA 3-07 Task 4. Method 202 measures CPM
using a sampling train consisting of a probe extension, a condenser, dry impingers, and a filter.
For source testing Method 202 is combined with a filterable PM method, such as Method 201A,
which is first in line. See Figure 1, the combined Method 201A and 202 sampling train
configuration schematic. Method 202 field samples are generated from the rinsing the sampling
train components with reagents and extracting the filters with reagents in sonicators. The
contribution to the residual mass field sample results from the reagents needs to be very low to
ensure that results for the CPM measurements from Method 202 source tests are attributable to,
and representative of, the source and not to the reagents used in the sample collection. Task 4 is
designed to evaluate the ability to achieve sufficiently low residual mass blank results from
Method 202 reagents and evaluate the potential contribution of the reagents used to the total field
sample mass concentration for Method 202 sampling trains.
Task 4 was an evaluation of reagents used in Method 202 sample recoveries. Method 202
specifies the use of DIUF water, acetone, and hexane reagents that have a residue on evaporation
value of 1.0 parts per million by weight (ppmw) or less. This criterion is referred to here as the
“reagent blank limit.” Method 202 field samples are generated by:
• Recovering the inorganic fraction of the sample by rinsing the sampling train twice
with water, collecting the rinses in the inorganic sample jar
• Recovering the organic fraction of the sample by rinsing the sampling train once with
acetone and twice with hexane, collecting the rinses in the organic sample jar
• Recovering the inorganic fraction of the filter, by three successive sonications in
water, combining the extracts with the inorganic train rinses
• Recovering the organic fraction of the filter, by three successive sonications in
hexane, combining the extracts with the organic train rinses
• Extracting the inorganic fraction three times with hexane using a separatory funnel,
combining the extracts with the organic fraction
• Evaporating both sample fractions to approximately 10 mL in beakers
• Evaporating the samples to dryness in weigh pans
• Desiccating the samples for at least 24 hours
• Gravimetrically analyzing the sample pans.
The water and hexane reagents are used for two recovery rinses, for the filter extractions, and
additional hexane is used for the separatory funnel extraction of the inorganic fraction. Acetone
is used for one sampling train rinse, but water and hexane represent the majority of the volume of
33
reagent used in field sample recovery, so only those two reagents were targeted for evaluation in
this task. Because it is a reagent used in this method, acetone is a good candidate for further
evaluation in determining the best practices for Method 202, given that sufficient volume to
generate detectable residual masses is used.
The objective of Task 4 was to generate representative data of the reagent blank residual
masses of reagents used in Methods 202 source sampling. Task 4 evaluated whether three grades
of water and three grades of hexane passed the reagent blank limit for the method and the
potential contribution from water and hexane reagents to the Method 202 field sample weight,
field train recovery blank, and field train proof blank. This evaluation was accomplished by
recovering and analyzing water and hexane to determine their residual blank levels. Following
the reagent specifications from the method should result in reagent blanks that are below the
reagent blank limit and that do not contribute a significant amount of residual mass to field
samples. To demonstrate that method requirements need to be followed to generate
representative Method 202 field samples, three grades of each reagent were evaluated, some that
did not have residues on evaporation values below the limit and some that did not follow all of
the method specifications. The three grades of water did not have residue on evaporation
information from the manufacturer, but were selected based on method of purification. The three
grades of hexane evaluated in this task represented one that was above the reagent blank limit,
not meeting the specification of the method, one that did not meet the specification, but that was
close to the limit, and one that was below the limit. Reagents evaluated in this effort were
processed according to the laboratory reagent blank procedures in Method 202. This task focuses
on the evaluation of a single lot of each reagent grade and not on the variation between lots of
reagents. This effort did not evaluate the potential for contamination in the field or poor field
sample recovery techniques that contribute to elevated field train recovery blank results. All
sample processing and gravimetric analysis was performed at ERG’s laboratory facility.
4.1 Procedures
Three grades of each Method 202 sample recovery and processing reagent was evaluated
to determine their residual blank levels. The three grades of water evaluated were:
• ASTM Type II quality ion exchange water (BDH, cat# BDH1168-4LP)
• Ultrafiltered water (Fisher DIUF, cat# W2-4)
• Water distilled in glass (Teknova PCR Certified, W3350).
The residue on evaporation information was not available from the manufacturer for these three
grades of water. At least 5 L from the same lot of each grade of water was obtained and the
samples were processed as received from the vendor without any additional preparation. The
three grades of hexane evaluated were:
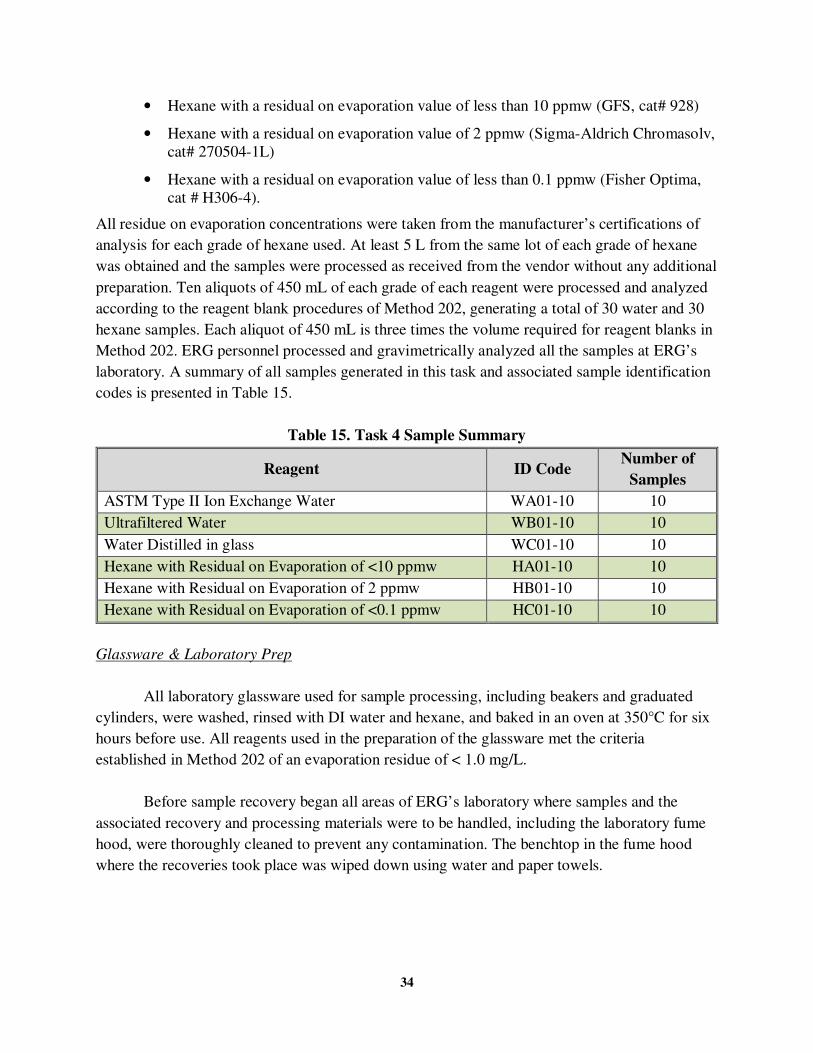
34
• Hexane with a residual on evaporation value of less than 10 ppmw (GFS, cat# 928)
• Hexane with a residual on evaporation value of 2 ppmw (Sigma-Aldrich Chromasolv,
cat# 270504-1L)
• Hexane with a residual on evaporation value of less than 0.1 ppmw (Fisher Optima,
cat # H306-4).
All residue on evaporation concentrations were taken from the manufacturer’s certifications of
analysis for each grade of hexane used. At least 5 L from the same lot of each grade of hexane
was obtained and the samples were processed as received from the vendor without any additional
preparation. Ten aliquots of 450 mL of each grade of each reagent were processed and analyzed
according to the reagent blank procedures of Method 202, generating a total of 30 water and 30
hexane samples. Each aliquot of 450 mL is three times the volume required for reagent blanks in
Method 202. ERG personnel processed and gravimetrically analyzed all the samples at ERG’s
laboratory. A summary of all samples generated in this task and associated sample identification
codes is presented in Table 15.
Table 15. Task 4 Sample Summary
Reagent ID Code Number of
Samples
ASTM Type II Ion Exchange Water WA01-10 10
Ultrafiltered Water WB01-10 10
Water Distilled in glass WC01-10 10
Hexane with Residual on Evaporation of <10 ppmw HA01-10 10
Hexane with Residual on Evaporation of 2 ppmw HB01-10 10
Hexane with Residual on Evaporation of <0.1 ppmw HC01-10 10
Glassware & Laboratory Prep
All laboratory glassware used for sample processing, including beakers and graduated
cylinders, were washed, rinsed with DI water and hexane, and baked in an oven at 350°C for six
hours before use. All reagents used in the preparation of the glassware met the criteria
established in Method 202 of an evaporation residue of < 1.0 mg/L.
Before sample recovery began all areas of ERG’s laboratory where samples and the
associated recovery and processing materials were to be handled, including the laboratory fume
hood, were thoroughly cleaned to prevent any contamination. The benchtop in the fume hood
where the recoveries took place was wiped down using water and paper towels.
35
Sample Recovery Procedures
Task 4 Method 202 reagent blanks were generated according to the procedures in
Method 202. The reagent blank samples were the aliquots of the reagents themselves. Ten
aliquots of each grade of both reagents were taken, each of which was ultimately evaporated to
dryness in its own aluminum weighing pan for gravimetric analysis. Sample beakers were
labeled with the unique sample ID, date, and operator initials. Reagent blank samples were
generated by:
• Measuring 450 mL of the reagent using a graduated cylinder
• Pouring the reagent into the sample beaker
• Repeating this step nine times for a total of ten samples of each reagent grade.
Ten samples of each of the three selected grades of each reagent were processed for a total of 60
reagent blank samples. Sample handling was a critical component in maintaining high quality
and preventing contamination for this task and great care was taken to ensure sample integrity
and proper identification. After recovery the samples were processed for gravimetric analysis by
ERG personnel.
Sample Processing Procedures
The water sample beakers were placed on a hot plate set below the boiling point of water
to expedite evaporation to approximately 50 mL. The water sample beakers were then placed in
an oven set to 105°C to evaporate to approximately 10 mL. Once evaporated, the water samples
were then allowed to cool in the fume hood and quantitatively transferred into numbered, tared
weighing pans using the appropriate grade of water and the pan numbers were recorded in the lab
notebook.
The hexane sample beakers were placed into the laboratory fume hood where they were
allowed to evaporate to approximately 10 mL. The hexane samples were then quantitatively
transferred into numbered, tared weighing pans using the appropriate grade of hexane and the
pan numbers were recorded in the lab notebook.
The sample pans were allowed to evaporate to dryness in the fume hood and placed in
desiccators in the balance room for gravimetric analysis. Samples were handled and processed in
a manner that ensured the integrity of samples and minimized the opportunity for contamination.
Nitrile gloves were worn during all sample handling and processing.
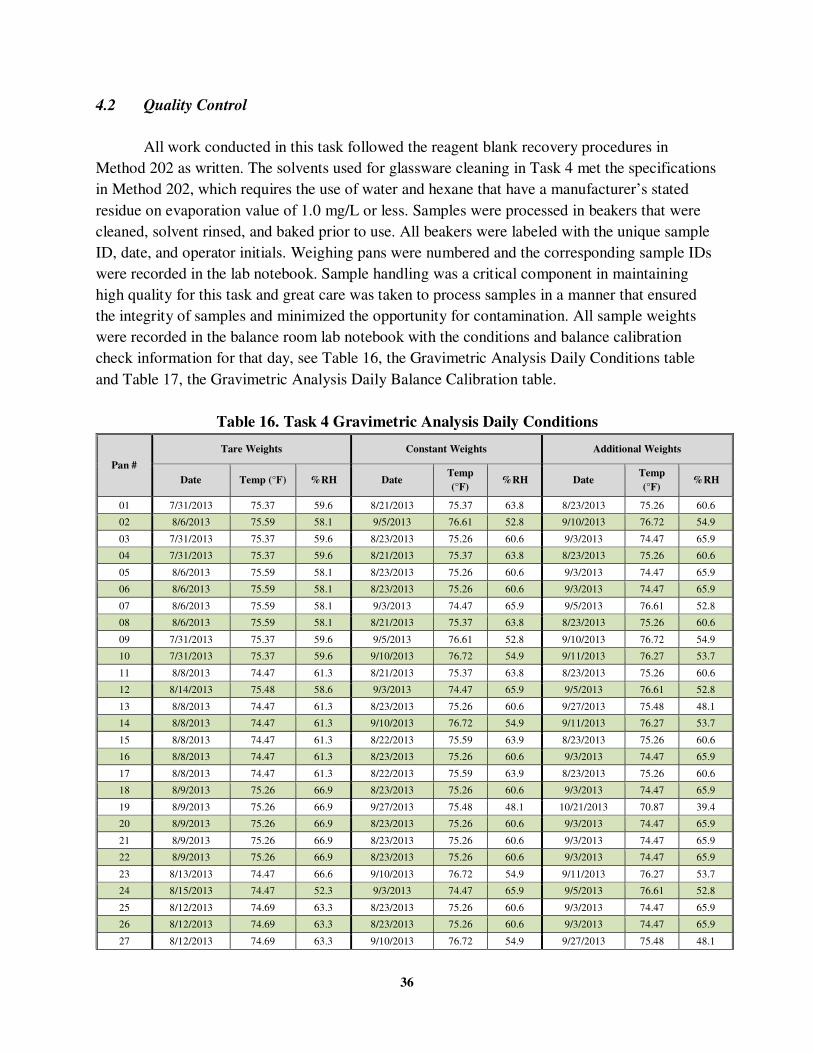
36
4.2 Quality Control
All work conducted in this task followed the reagent blank recovery procedures in
Method 202 as written. The solvents used for glassware cleaning in Task 4 met the specifications
in Method 202, which requires the use of water and hexane that have a manufacturer’s stated
residue on evaporation value of 1.0 mg/L or less. Samples were processed in beakers that were
cleaned, solvent rinsed, and baked prior to use. All beakers were labeled with the unique sample
ID, date, and operator initials. Weighing pans were numbered and the corresponding sample IDs
were recorded in the lab notebook. Sample handling was a critical component in maintaining
high quality for this task and great care was taken to process samples in a manner that ensured
the integrity of samples and minimized the opportunity for contamination. All sample weights
were recorded in the balance room lab notebook with the conditions and balance calibration
check information for that day, see Table 16, the Gravimetric Analysis Daily Conditions table
and Table 17, the Gravimetric Analysis Daily Balance Calibration table.
Table 16. Task 4 Gravimetric Analysis Daily Conditions
Pan #
Tare Weights Constant Weights Additional Weights
Date Temp (°F) %RH Date Temp
(°F) %RH Date
Temp
(°F) %RH
01 7/31/2013 75.37 59.6 8/21/2013 75.37 63.8 8/23/2013 75.26 60.6
02 8/6/2013 75.59 58.1 9/5/2013 76.61 52.8 9/10/2013 76.72 54.9
03 7/31/2013 75.37 59.6 8/23/2013 75.26 60.6 9/3/2013 74.47 65.9
04 7/31/2013 75.37 59.6 8/21/2013 75.37 63.8 8/23/2013 75.26 60.6
05 8/6/2013 75.59 58.1 8/23/2013 75.26 60.6 9/3/2013 74.47 65.9
06 8/6/2013 75.59 58.1 8/23/2013 75.26 60.6 9/3/2013 74.47 65.9
07 8/6/2013 75.59 58.1 9/3/2013 74.47 65.9 9/5/2013 76.61 52.8
08 8/6/2013 75.59 58.1 8/21/2013 75.37 63.8 8/23/2013 75.26 60.6
09 7/31/2013 75.37 59.6 9/5/2013 76.61 52.8 9/10/2013 76.72 54.9
10 7/31/2013 75.37 59.6 9/10/2013 76.72 54.9 9/11/2013 76.27 53.7
11 8/8/2013 74.47 61.3 8/21/2013 75.37 63.8 8/23/2013 75.26 60.6
12 8/14/2013 75.48 58.6 9/3/2013 74.47 65.9 9/5/2013 76.61 52.8
13 8/8/2013 74.47 61.3 8/23/2013 75.26 60.6 9/27/2013 75.48 48.1
14 8/8/2013 74.47 61.3 9/10/2013 76.72 54.9 9/11/2013 76.27 53.7
15 8/8/2013 74.47 61.3 8/22/2013 75.59 63.9 8/23/2013 75.26 60.6
16 8/8/2013 74.47 61.3 8/23/2013 75.26 60.6 9/3/2013 74.47 65.9
17 8/8/2013 74.47 61.3 8/22/2013 75.59 63.9 8/23/2013 75.26 60.6
18 8/9/2013 75.26 66.9 8/23/2013 75.26 60.6 9/3/2013 74.47 65.9
19 8/9/2013 75.26 66.9 9/27/2013 75.48 48.1 10/21/2013 70.87 39.4
20 8/9/2013 75.26 66.9 8/23/2013 75.26 60.6 9/3/2013 74.47 65.9
21 8/9/2013 75.26 66.9 8/23/2013 75.26 60.6 9/3/2013 74.47 65.9
22 8/9/2013 75.26 66.9 8/23/2013 75.26 60.6 9/3/2013 74.47 65.9
23 8/13/2013 74.47 66.6 9/10/2013 76.72 54.9 9/11/2013 76.27 53.7
24 8/15/2013 74.47 52.3 9/3/2013 74.47 65.9 9/5/2013 76.61 52.8
25 8/12/2013 74.69 63.3 8/23/2013 75.26 60.6 9/3/2013 74.47 65.9
26 8/12/2013 74.69 63.3 8/23/2013 75.26 60.6 9/3/2013 74.47 65.9
27 8/12/2013 74.69 63.3 9/10/2013 76.72 54.9 9/27/2013 75.48 48.1
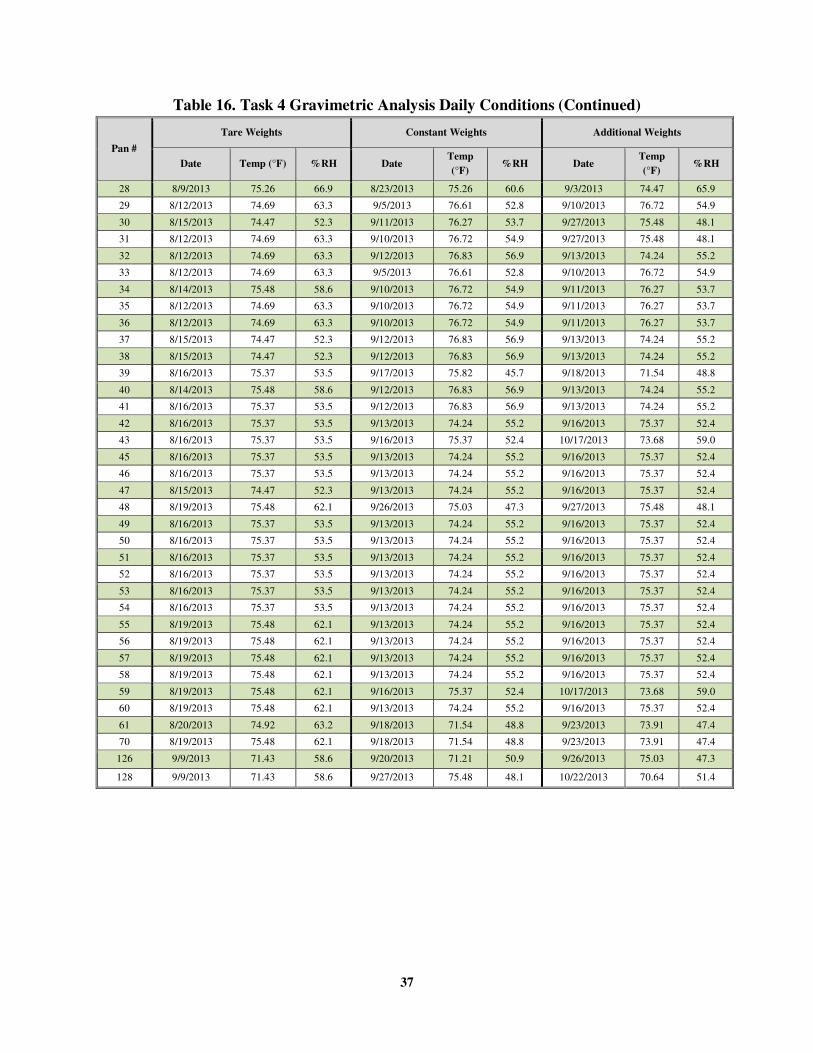
37
Table 16. Task 4 Gravimetric Analysis Daily Conditions (Continued)
Pan #
Tare Weights Constant Weights Additional Weights
Date Temp (°F) %RH Date Temp
(°F) %RH Date
Temp
(°F) %RH
28 8/9/2013 75.26 66.9 8/23/2013 75.26 60.6 9/3/2013 74.47 65.9
29 8/12/2013 74.69 63.3 9/5/2013 76.61 52.8 9/10/2013 76.72 54.9
30 8/15/2013 74.47 52.3 9/11/2013 76.27 53.7 9/27/2013 75.48 48.1
31 8/12/2013 74.69 63.3 9/10/2013 76.72 54.9 9/27/2013 75.48 48.1
32 8/12/2013 74.69 63.3 9/12/2013 76.83 56.9 9/13/2013 74.24 55.2
33 8/12/2013 74.69 63.3 9/5/2013 76.61 52.8 9/10/2013 76.72 54.9
34 8/14/2013 75.48 58.6 9/10/2013 76.72 54.9 9/11/2013 76.27 53.7
35 8/12/2013 74.69 63.3 9/10/2013 76.72 54.9 9/11/2013 76.27 53.7
36 8/12/2013 74.69 63.3 9/10/2013 76.72 54.9 9/11/2013 76.27 53.7
37 8/15/2013 74.47 52.3 9/12/2013 76.83 56.9 9/13/2013 74.24 55.2
38 8/15/2013 74.47 52.3 9/12/2013 76.83 56.9 9/13/2013 74.24 55.2
39 8/16/2013 75.37 53.5 9/17/2013 75.82 45.7 9/18/2013 71.54 48.8
40 8/14/2013 75.48 58.6 9/12/2013 76.83 56.9 9/13/2013 74.24 55.2
41 8/16/2013 75.37 53.5 9/12/2013 76.83 56.9 9/13/2013 74.24 55.2
42 8/16/2013 75.37 53.5 9/13/2013 74.24 55.2 9/16/2013 75.37 52.4
43 8/16/2013 75.37 53.5 9/16/2013 75.37 52.4 10/17/2013 73.68 59.0
45 8/16/2013 75.37 53.5 9/13/2013 74.24 55.2 9/16/2013 75.37 52.4
46 8/16/2013 75.37 53.5 9/13/2013 74.24 55.2 9/16/2013 75.37 52.4
47 8/15/2013 74.47 52.3 9/13/2013 74.24 55.2 9/16/2013 75.37 52.4
48 8/19/2013 75.48 62.1 9/26/2013 75.03 47.3 9/27/2013 75.48 48.1
49 8/16/2013 75.37 53.5 9/13/2013 74.24 55.2 9/16/2013 75.37 52.4
50 8/16/2013 75.37 53.5 9/13/2013 74.24 55.2 9/16/2013 75.37 52.4
51 8/16/2013 75.37 53.5 9/13/2013 74.24 55.2 9/16/2013 75.37 52.4
52 8/16/2013 75.37 53.5 9/13/2013 74.24 55.2 9/16/2013 75.37 52.4
53 8/16/2013 75.37 53.5 9/13/2013 74.24 55.2 9/16/2013 75.37 52.4
54 8/16/2013 75.37 53.5 9/13/2013 74.24 55.2 9/16/2013 75.37 52.4
55 8/19/2013 75.48 62.1 9/13/2013 74.24 55.2 9/16/2013 75.37 52.4
56 8/19/2013 75.48 62.1 9/13/2013 74.24 55.2 9/16/2013 75.37 52.4
57 8/19/2013 75.48 62.1 9/13/2013 74.24 55.2 9/16/2013 75.37 52.4
58 8/19/2013 75.48 62.1 9/13/2013 74.24 55.2 9/16/2013 75.37 52.4
59 8/19/2013 75.48 62.1 9/16/2013 75.37 52.4 10/17/2013 73.68 59.0
60 8/19/2013 75.48 62.1 9/13/2013 74.24 55.2 9/16/2013 75.37 52.4
61 8/20/2013 74.92 63.2 9/18/2013 71.54 48.8 9/23/2013 73.91 47.4
70 8/19/2013 75.48 62.1 9/18/2013 71.54 48.8 9/23/2013 73.91 47.4
126 9/9/2013 71.43 58.6 9/20/2013 71.21 50.9 9/26/2013 75.03 47.3
128 9/9/2013 71.43 58.6 9/27/2013 75.48 48.1 10/22/2013 70.64 51.4
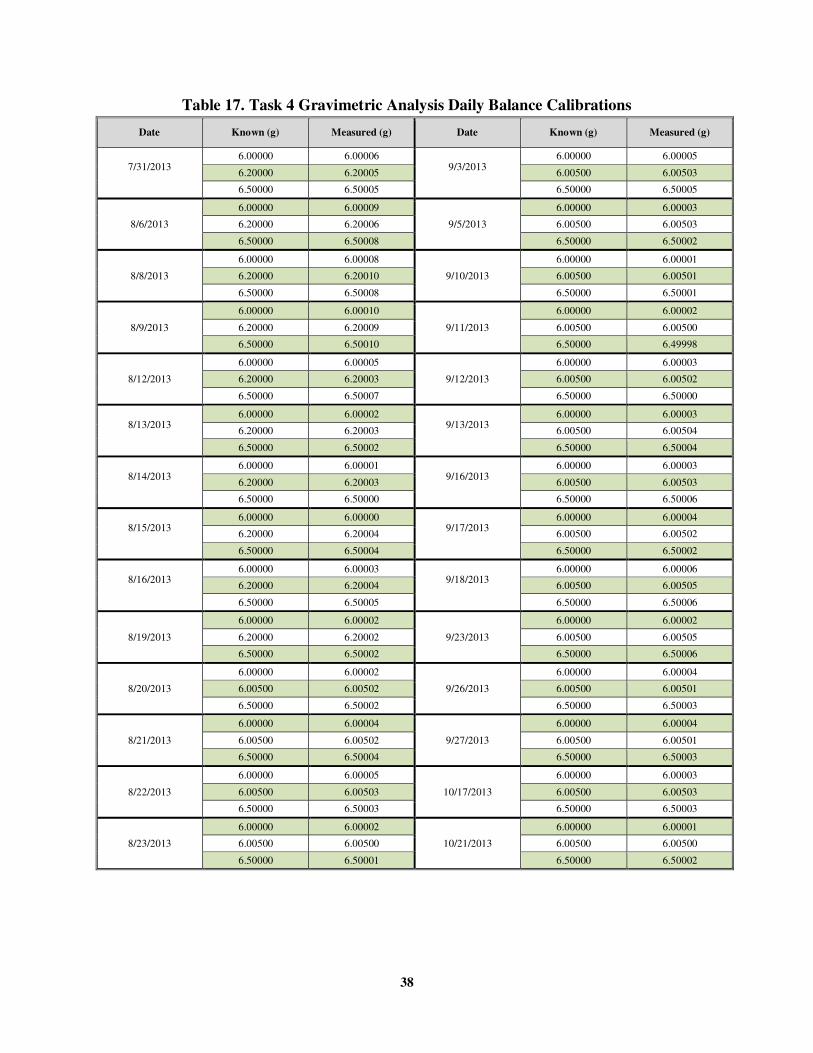
38
Table 17. Task 4 Gravimetric Analysis Daily Balance Calibrations
Date Known (g) Measured (g) Date Known (g) Measured (g)
7/31/2013
6.00000 6.00006 9/3/2013
6.00000 6.00005
6.20000 6.20005 6.00500 6.00503
6.50000 6.50005 6.50000 6.50005
8/6/2013
6.00000 6.00009
9/5/2013
6.00000 6.00003
6.20000 6.20006 6.00500 6.00503
6.50000 6.50008 6.50000 6.50002
8/8/2013
6.00000 6.00008
9/10/2013
6.00000 6.00001
6.20000 6.20010 6.00500 6.00501
6.50000 6.50008 6.50000 6.50001
8/9/2013
6.00000 6.00010
9/11/2013
6.00000 6.00002
6.20000 6.20009 6.00500 6.00500
6.50000 6.50010 6.50000 6.49998
8/12/2013
6.00000 6.00005
9/12/2013
6.00000 6.00003
6.20000 6.20003 6.00500 6.00502
6.50000 6.50007 6.50000 6.50000
8/13/2013
6.00000 6.00002 9/13/2013
6.00000 6.00003
6.20000 6.20003 6.00500 6.00504
6.50000 6.50002 6.50000 6.50004
8/14/2013
6.00000 6.00001 9/16/2013
6.00000 6.00003
6.20000 6.20003 6.00500 6.00503
6.50000 6.50000 6.50000 6.50006
8/15/2013
6.00000 6.00000 9/17/2013
6.00000 6.00004
6.20000 6.20004 6.00500 6.00502
6.50000 6.50004 6.50000 6.50002
8/16/2013
6.00000 6.00003 9/18/2013
6.00000 6.00006
6.20000 6.20004 6.00500 6.00505
6.50000 6.50005 6.50000 6.50006
8/19/2013
6.00000 6.00002
9/23/2013
6.00000 6.00002
6.20000 6.20002 6.00500 6.00505
6.50000 6.50002 6.50000 6.50006
8/20/2013
6.00000 6.00002
9/26/2013
6.00000 6.00004
6.00500 6.00502 6.00500 6.00501
6.50000 6.50002 6.50000 6.50003
8/21/2013
6.00000 6.00004
9/27/2013
6.00000 6.00004
6.00500 6.00502 6.00500 6.00501
6.50000 6.50004 6.50000 6.50003
8/22/2013
6.00000 6.00005
10/17/2013
6.00000 6.00003
6.00500 6.00503 6.00500 6.00503
6.50000 6.50003 6.50000 6.50003
8/23/2013
6.00000 6.00002
10/21/2013
6.00000 6.00001
6.00500 6.00500 6.00500 6.00500
6.50000 6.50001 6.50000 6.50002
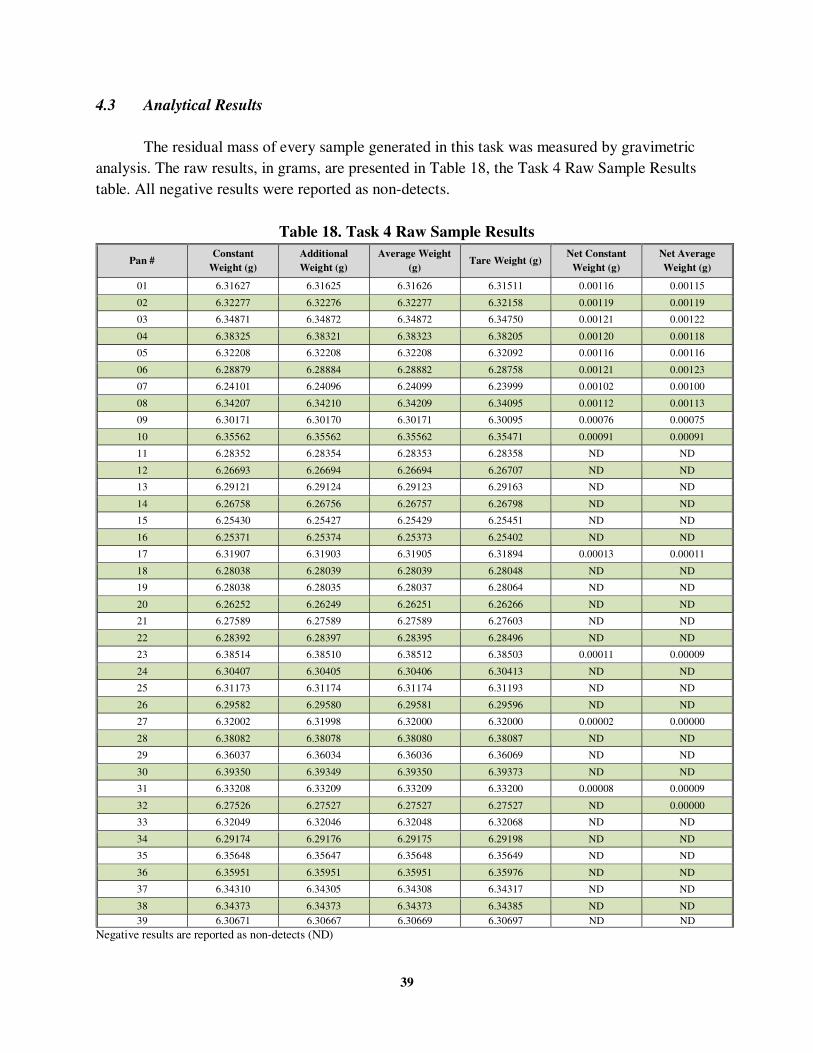
39
4.3 Analytical Results
The residual mass of every sample generated in this task was measured by gravimetric
analysis. The raw results, in grams, are presented in Table 18, the Task 4 Raw Sample Results
table. All negative results were reported as non-detects.
Table 18. Task 4 Raw Sample Results
Pan # Constant
Weight (g)
Additional
Weight (g)
Average Weight
(g) Tare Weight (g)
Net Constant
Weight (g)
Net Average
Weight (g)
01 6.31627 6.31625 6.31626 6.31511 0.00116 0.00115
02 6.32277 6.32276 6.32277 6.32158 0.00119 0.00119
03 6.34871 6.34872 6.34872 6.34750 0.00121 0.00122
04 6.38325 6.38321 6.38323 6.38205 0.00120 0.00118
05 6.32208 6.32208 6.32208 6.32092 0.00116 0.00116
06 6.28879 6.28884 6.28882 6.28758 0.00121 0.00123
07 6.24101 6.24096 6.24099 6.23999 0.00102 0.00100
08 6.34207 6.34210 6.34209 6.34095 0.00112 0.00113
09 6.30171 6.30170 6.30171 6.30095 0.00076 0.00075
10 6.35562 6.35562 6.35562 6.35471 0.00091 0.00091
11 6.28352 6.28354 6.28353 6.28358 ND ND
12 6.26693 6.26694 6.26694 6.26707 ND ND
13 6.29121 6.29124 6.29123 6.29163 ND ND
14 6.26758 6.26756 6.26757 6.26798 ND ND
15 6.25430 6.25427 6.25429 6.25451 ND ND
16 6.25371 6.25374 6.25373 6.25402 ND ND
17 6.31907 6.31903 6.31905 6.31894 0.00013 0.00011
18 6.28038 6.28039 6.28039 6.28048 ND ND
19 6.28038 6.28035 6.28037 6.28064 ND ND
20 6.26252 6.26249 6.26251 6.26266 ND ND
21 6.27589 6.27589 6.27589 6.27603 ND ND
22 6.28392 6.28397 6.28395 6.28496 ND ND
23 6.38514 6.38510 6.38512 6.38503 0.00011 0.00009
24 6.30407 6.30405 6.30406 6.30413 ND ND
25 6.31173 6.31174 6.31174 6.31193 ND ND
26 6.29582 6.29580 6.29581 6.29596 ND ND
27 6.32002 6.31998 6.32000 6.32000 0.00002 0.00000
28 6.38082 6.38078 6.38080 6.38087 ND ND
29 6.36037 6.36034 6.36036 6.36069 ND ND
30 6.39350 6.39349 6.39350 6.39373 ND ND
31 6.33208 6.33209 6.33209 6.33200 0.00008 0.00009
32 6.27526 6.27527 6.27527 6.27527 ND 0.00000
33 6.32049 6.32046 6.32048 6.32068 ND ND
34 6.29174 6.29176 6.29175 6.29198 ND ND
35 6.35648 6.35647 6.35648 6.35649 ND ND
36 6.35951 6.35951 6.35951 6.35976 ND ND
37 6.34310 6.34305 6.34308 6.34317 ND ND
38 6.34373 6.34373 6.34373 6.34385 ND ND
39 6.30671 6.30667 6.30669 6.30697 ND ND
Negative results are reported as non-detects (ND)
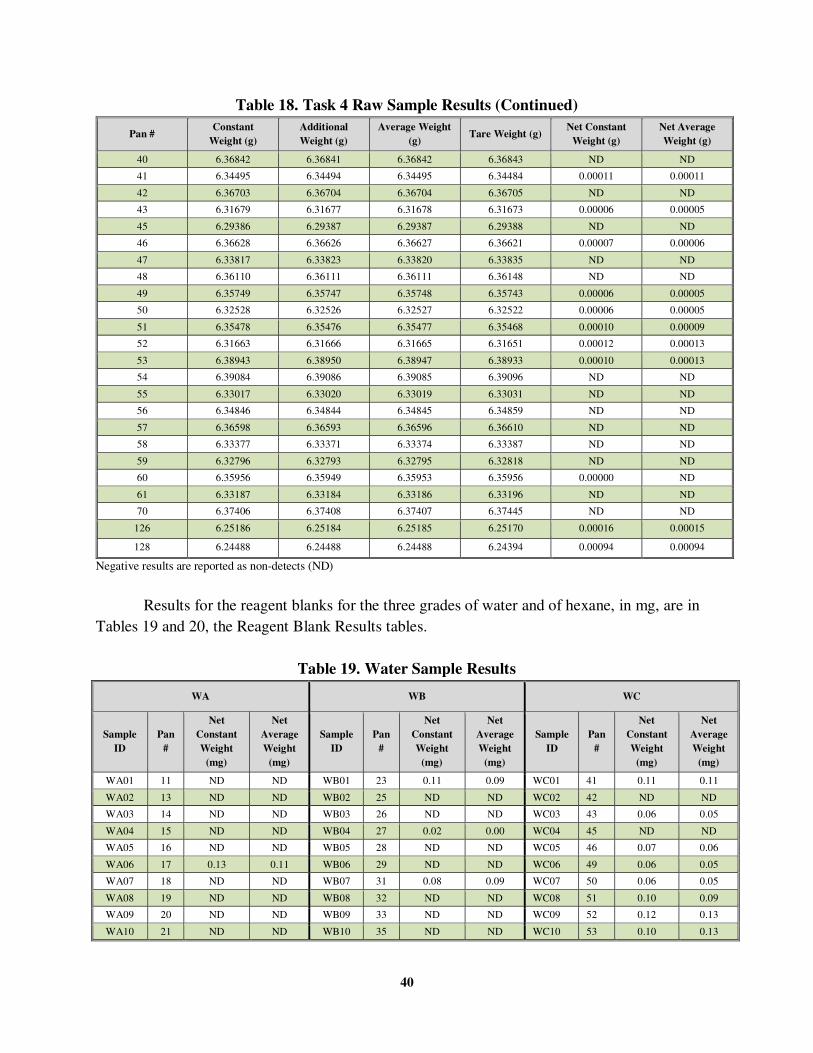
40
Table 18. Task 4 Raw Sample Results (Continued)
Pan # Constant
Weight (g)
Additional
Weight (g)
Average Weight
(g) Tare Weight (g)
Net Constant
Weight (g)
Net Average
Weight (g)
40 6.36842 6.36841 6.36842 6.36843 ND ND
41 6.34495 6.34494 6.34495 6.34484 0.00011 0.00011
42 6.36703 6.36704 6.36704 6.36705 ND ND
43 6.31679 6.31677 6.31678 6.31673 0.00006 0.00005
45 6.29386 6.29387 6.29387 6.29388 ND ND
46 6.36628 6.36626 6.36627 6.36621 0.00007 0.00006
47 6.33817 6.33823 6.33820 6.33835 ND ND
48 6.36110 6.36111 6.36111 6.36148 ND ND
49 6.35749 6.35747 6.35748 6.35743 0.00006 0.00005
50 6.32528 6.32526 6.32527 6.32522 0.00006 0.00005
51 6.35478 6.35476 6.35477 6.35468 0.00010 0.00009
52 6.31663 6.31666 6.31665 6.31651 0.00012 0.00013
53 6.38943 6.38950 6.38947 6.38933 0.00010 0.00013
54 6.39084 6.39086 6.39085 6.39096 ND ND
55 6.33017 6.33020 6.33019 6.33031 ND ND
56 6.34846 6.34844 6.34845 6.34859 ND ND
57 6.36598 6.36593 6.36596 6.36610 ND ND
58 6.33377 6.33371 6.33374 6.33387 ND ND
59 6.32796 6.32793 6.32795 6.32818 ND ND
60 6.35956 6.35949 6.35953 6.35956 0.00000 ND
61 6.33187 6.33184 6.33186 6.33196 ND ND
70 6.37406 6.37408 6.37407 6.37445 ND ND
126 6.25186 6.25184 6.25185 6.25170 0.00016 0.00015
128 6.24488 6.24488 6.24488 6.24394 0.00094 0.00094
Negative results are reported as non-detects (ND)
Results for the reagent blanks for the three grades of water and of hexane, in mg, are in
Tables 19 and 20, the Reagent Blank Results tables.
Table 19. Water Sample Results
WA WB WC
Sample
ID
Pan
#
Net
Constant
Weight
(mg)
Net
Average
Weight
(mg)
Sample
ID
Pan
#
Net
Constant
Weight
(mg)
Net
Average
Weight
(mg)
Sample
ID
Pan
#
Net
Constant
Weight
(mg)
Net
Average
Weight
(mg)
WA01 11 ND ND WB01 23 0.11 0.09 WC01 41 0.11 0.11
WA02 13 ND ND WB02 25 ND ND WC02 42 ND ND
WA03 14 ND ND WB03 26 ND ND WC03 43 0.06 0.05
WA04 15 ND ND WB04 27 0.02 0.00 WC04 45 ND ND
WA05 16 ND ND WB05 28 ND ND WC05 46 0.07 0.06
WA06 17 0.13 0.11 WB06 29 ND ND WC06 49 0.06 0.05
WA07 18 ND ND WB07 31 0.08 0.09 WC07 50 0.06 0.05
WA08 19 ND ND WB08 32 ND ND WC08 51 0.10 0.09
WA09 20 ND ND WB09 33 ND ND WC09 52 0.12 0.13
WA10 21 ND ND WB10 35 ND ND WC10 53 0.10 0.13
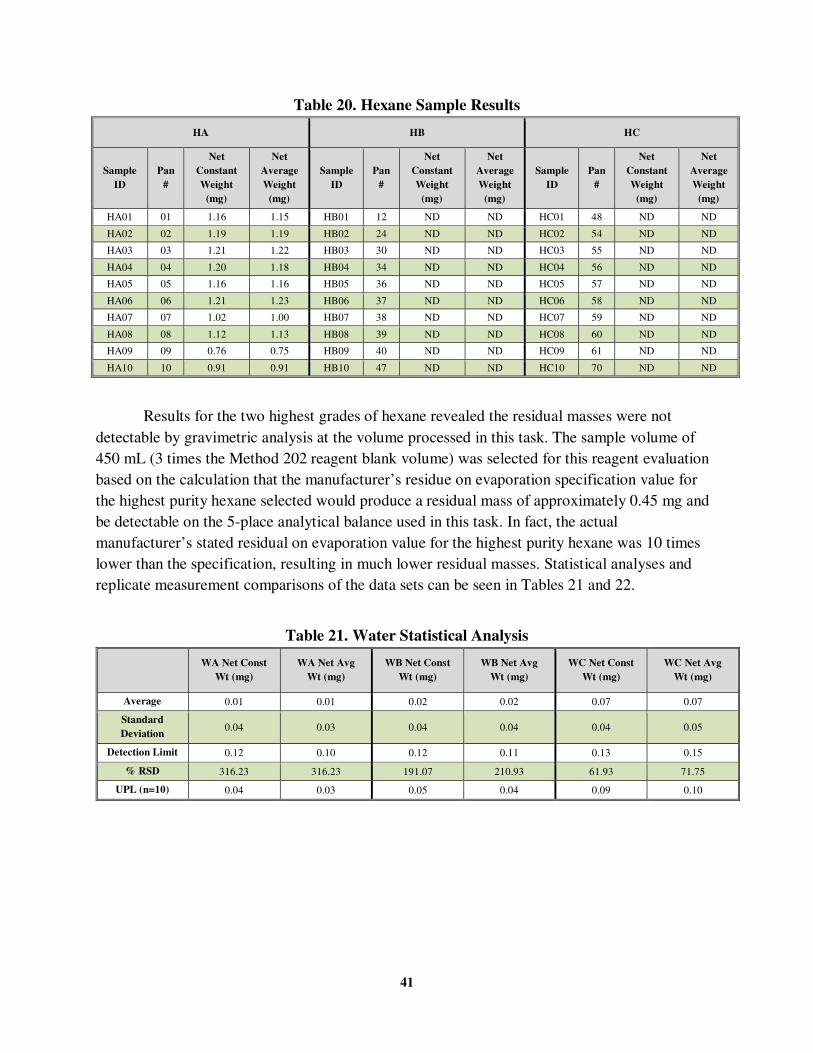
41
Table 20. Hexane Sample Results
Results for the two highest grades of hexane revealed the residual masses were not
detectable by gravimetric analysis at the volume processed in this task. The sample volume of
450 mL (3 times the Method 202 reagent blank volume) was selected for this reagent evaluation
based on the calculation that the manufacturer’s residue on evaporation specification value for
the highest purity hexane selected would produce a residual mass of approximately 0.45 mg and
be detectable on the 5-place analytical balance used in this task. In fact, the actual
manufacturer’s stated residual on evaporation value for the highest purity hexane was 10 times
lower than the specification, resulting in much lower residual masses. Statistical analyses and
replicate measurement comparisons of the data sets can be seen in Tables 21 and 22.
Table 21. Water Statistical Analysis
WA Net Const
Wt (mg)
WA Net Avg
Wt (mg)
WB Net Const
Wt (mg)
WB Net Avg
Wt (mg)
WC Net Const
Wt (mg)
WC Net Avg
Wt (mg)
Average 0.01 0.01 0.02 0.02 0.07 0.07
Standard
Deviation 0.04 0.03 0.04 0.04 0.04 0.05
Detection Limit 0.12 0.10 0.12 0.11 0.13 0.15
% RSD 316.23 316.23 191.07 210.93 61.93 71.75
UPL (n=10) 0.04 0.03 0.05 0.04 0.09 0.10
HA HB HC
Sample
ID
Pan
#
Net
Constant
Weight
(mg)
Net
Average
Weight
(mg)
Sample
ID
Pan
#
Net
Constant
Weight
(mg)
Net
Average
Weight
(mg)
Sample
ID
Pan
#
Net
Constant
Weight
(mg)
Net
Average
Weight
(mg)
HA01 01 1.16 1.15 HB01 12 ND ND HC01 48 ND ND
HA02 02 1.19 1.19 HB02 24 ND ND HC02 54 ND ND
HA03 03 1.21 1.22 HB03 30 ND ND HC03 55 ND ND
HA04 04 1.20 1.18 HB04 34 ND ND HC04 56 ND ND
HA05 05 1.16 1.16 HB05 36 ND ND HC05 57 ND ND
HA06 06 1.21 1.23 HB06 37 ND ND HC06 58 ND ND
HA07 07 1.02 1.00 HB07 38 ND ND HC07 59 ND ND
HA08 08 1.12 1.13 HB08 39 ND ND HC08 60 ND ND
HA09 09 0.76 0.75 HB09 40 ND ND HC09 61 ND ND
HA10 10 0.91 0.91 HB10 47 ND ND HC10 70 ND ND
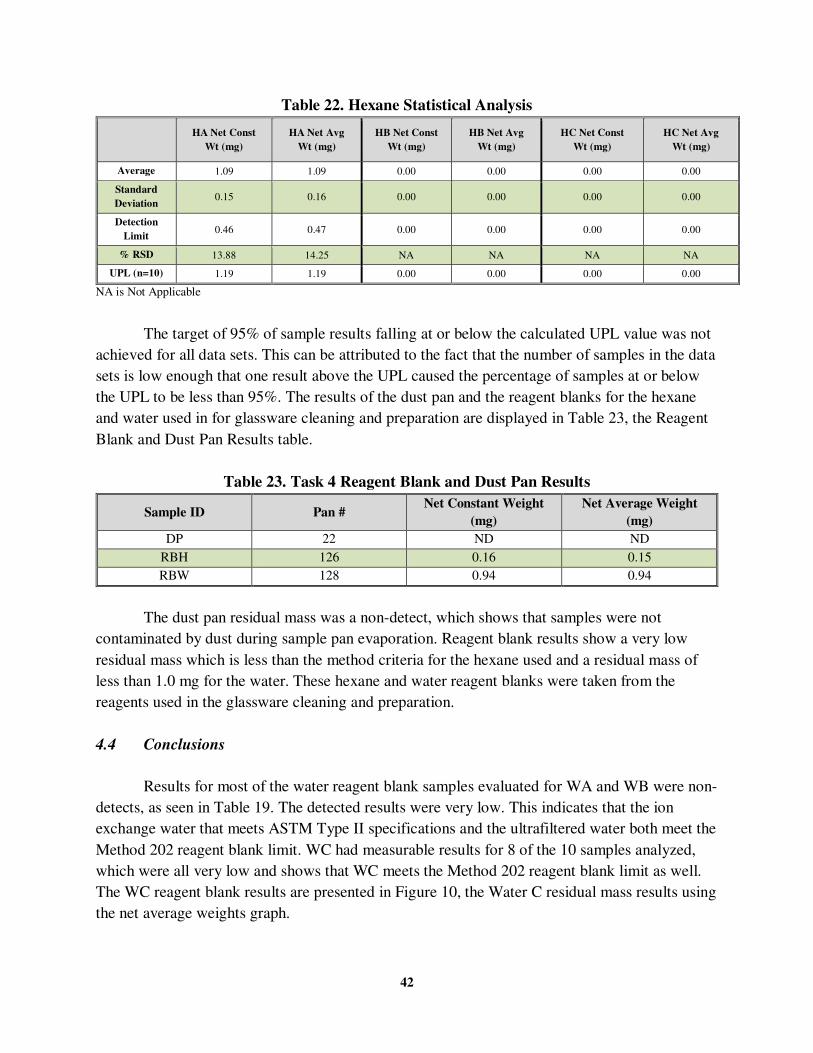
42
Table 22. Hexane Statistical Analysis
HA Net Const
Wt (mg)
HA Net Avg
Wt (mg)
HB Net Const
Wt (mg)
HB Net Avg
Wt (mg)
HC Net Const
Wt (mg)
HC Net Avg
Wt (mg)
Average 1.09 1.09 0.00 0.00 0.00 0.00
Standard
Deviation 0.15 0.16 0.00 0.00 0.00 0.00
Detection
Limit 0.46 0.47 0.00 0.00 0.00 0.00
% RSD 13.88 14.25 NA NA NA NA
UPL (n=10) 1.19 1.19 0.00 0.00 0.00 0.00
NA is Not Applicable
The target of 95% of sample results falling at or below the calculated UPL value was not
achieved for all data sets. This can be attributed to the fact that the number of samples in the data
sets is low enough that one result above the UPL caused the percentage of samples at or below
the UPL to be less than 95%. The results of the dust pan and the reagent blanks for the hexane
and water used in for glassware cleaning and preparation are displayed in Table 23, the Reagent
Blank and Dust Pan Results table.
Table 23. Task 4 Reagent Blank and Dust Pan Results
Sample ID Pan # Net Constant Weight
(mg)
Net Average Weight
(mg)
DP 22 ND ND
RBH 126 0.16 0.15
RBW 128 0.94 0.94
The dust pan residual mass was a non-detect, which shows that samples were not
contaminated by dust during sample pan evaporation. Reagent blank results show a very low
residual mass which is less than the method criteria for the hexane used and a residual mass of
less than 1.0 mg for the water. These hexane and water reagent blanks were taken from the
reagents used in the glassware cleaning and preparation.
4.4 Conclusions
Results for most of the water reagent blank samples evaluated for WA and WB were non-
detects, as seen in Table 19. The detected results were very low. This indicates that the ion
exchange water that meets ASTM Type II specifications and the ultrafiltered water both meet the
Method 202 reagent blank limit. WC had measurable results for 8 of the 10 samples analyzed,
which were all very low and shows that WC meets the Method 202 reagent blank limit as well.
The WC reagent blank results are presented in Figure 10, the Water C residual mass results using
the net average weights graph.
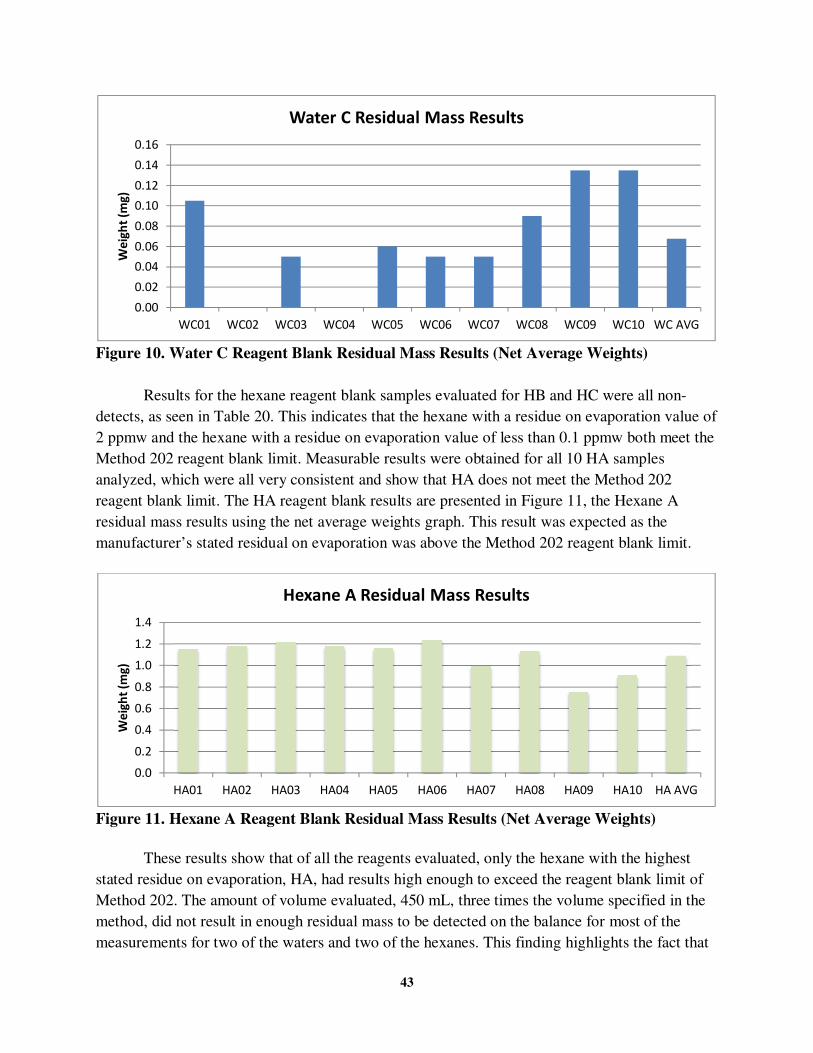
43
Figure 10. Water C Reagent Blank Residual Mass Results (Net Average Weights)
Results for the hexane reagent blank samples evaluated for HB and HC were all non-
detects, as seen in Table 20. This indicates that the hexane with a residue on evaporation value of
2 ppmw and the hexane with a residue on evaporation value of less than 0.1 ppmw both meet the
Method 202 reagent blank limit. Measurable results were obtained for all 10 HA samples
analyzed, which were all very consistent and show that HA does not meet the Method 202
reagent blank limit. The HA reagent blank results are presented in Figure 11, the Hexane A
residual mass results using the net average weights graph. This result was expected as the
manufacturer’s stated residual on evaporation was above the Method 202 reagent blank limit.
Figure 11. Hexane A Reagent Blank Residual Mass Results (Net Average Weights)
These results show that of all the reagents evaluated, only the hexane with the highest
stated residue on evaporation, HA, had results high enough to exceed the reagent blank limit of
Method 202. The amount of volume evaluated, 450 mL, three times the volume specified in the
method, did not result in enough residual mass to be detected on the balance for most of the
measurements for two of the waters and two of the hexanes. This finding highlights the fact that
0.00
0.02
0.04
0.06
0.08
0.10
0.12
0.14
0.16
WC01 WC02 WC03 WC04 WC05 WC06 WC07 WC08 WC09 WC10 WC AVG
We
igh
t (m
g)
Water C Residual Mass Results
0.0
0.2
0.4
0.6
0.8
1.0
1.2
1.4
HA01 HA02 HA03 HA04 HA05 HA06 HA07 HA08 HA09 HA10 HA AVG
We
igh
t (m
g)
Hexane A Residual Mass Results
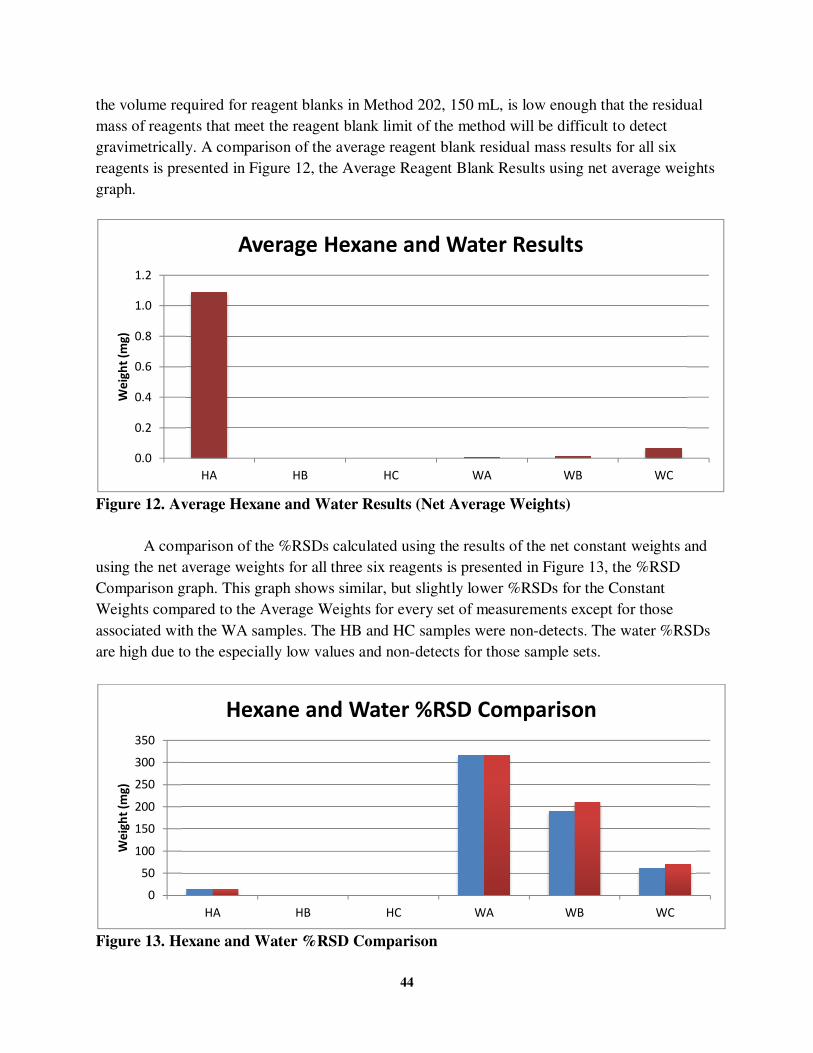
44
the volume required for reagent blanks in Method 202, 150 mL, is low enough that the residual
mass of reagents that meet the reagent blank limit of the method will be difficult to detect
gravimetrically. A comparison of the average reagent blank residual mass results for all six
reagents is presented in Figure 12, the Average Reagent Blank Results using net average weights
graph.
Figure 12. Average Hexane and Water Results (Net Average Weights)
A comparison of the %RSDs calculated using the results of the net constant weights and
using the net average weights for all three six reagents is presented in Figure 13, the %RSD
Comparison graph. This graph shows similar, but slightly lower %RSDs for the Constant
Weights compared to the Average Weights for every set of measurements except for those
associated with the WA samples. The HB and HC samples were non-detects. The water %RSDs
are high due to the especially low values and non-detects for those sample sets.
Figure 13. Hexane and Water %RSD Comparison
0.0
0.2
0.4
0.6
0.8
1.0
1.2
HA HB HC WA WB WC
We
igh
t (m
g)
Average Hexane and Water Results
0
50
100
150
200
250
300
350
HA HB HC WA WB WC
We
igh
t (m
g)
Hexane and Water %RSD Comparison
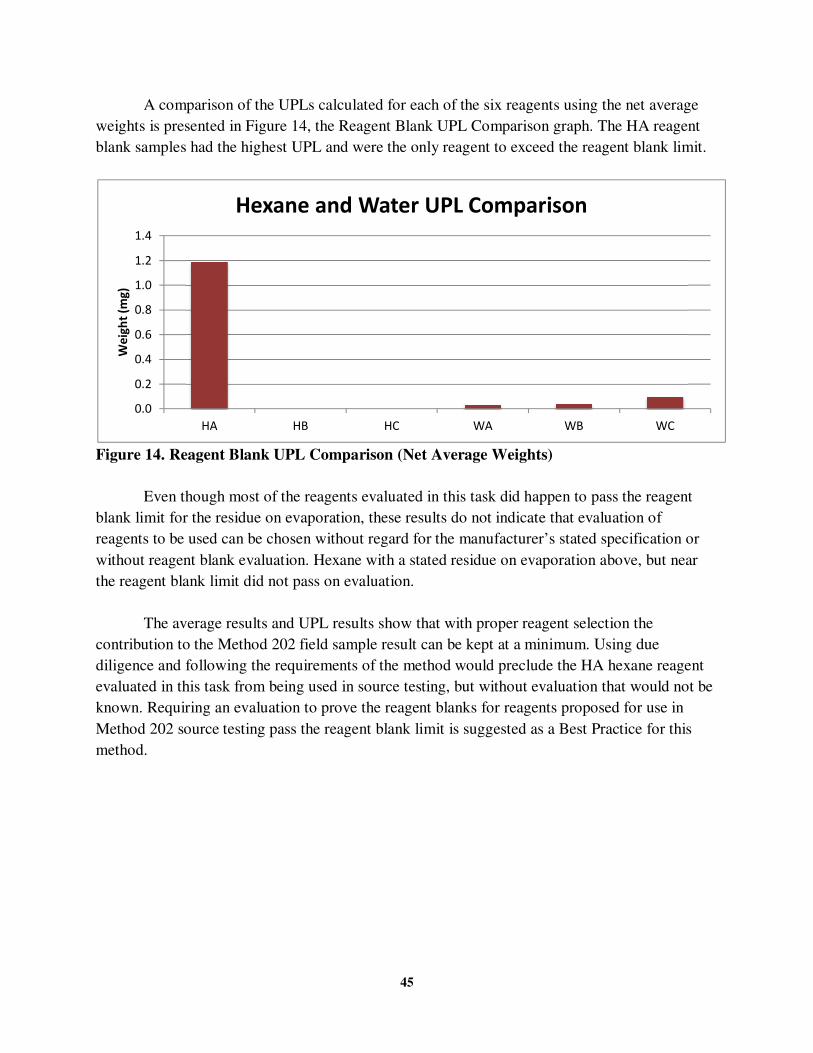
45
A comparison of the UPLs calculated for each of the six reagents using the net average
weights is presented in Figure 14, the Reagent Blank UPL Comparison graph. The HA reagent
blank samples had the highest UPL and were the only reagent to exceed the reagent blank limit.
Figure 14. Reagent Blank UPL Comparison (Net Average Weights)
Even though most of the reagents evaluated in this task did happen to pass the reagent
blank limit for the residue on evaporation, these results do not indicate that evaluation of
reagents to be used can be chosen without regard for the manufacturer’s stated specification or
without reagent blank evaluation. Hexane with a stated residue on evaporation above, but near
the reagent blank limit did not pass on evaluation.
The average results and UPL results show that with proper reagent selection the
contribution to the Method 202 field sample result can be kept at a minimum. Using due
diligence and following the requirements of the method would preclude the HA hexane reagent
evaluated in this task from being used in source testing, but without evaluation that would not be
known. Requiring an evaluation to prove the reagent blanks for reagents proposed for use in
Method 202 source testing pass the reagent blank limit is suggested as a Best Practice for this
method.
0.0
0.2
0.4
0.6
0.8
1.0
1.2
1.4
HA HB HC WA WB WC
We
igh
t (m
g)
Hexane and Water UPL Comparison
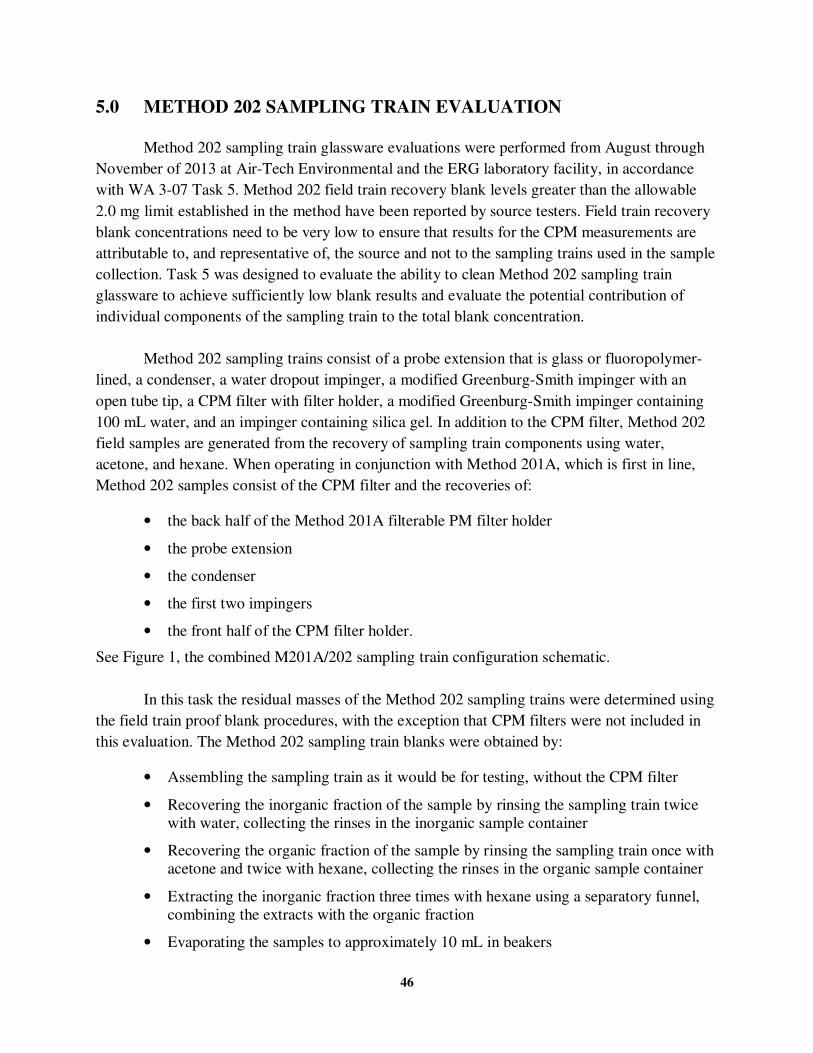
46
5.0 METHOD 202 SAMPLING TRAIN EVALUATION
Method 202 sampling train glassware evaluations were performed from August through
November of 2013 at Air-Tech Environmental and the ERG laboratory facility, in accordance
with WA 3-07 Task 5. Method 202 field train recovery blank levels greater than the allowable
2.0 mg limit established in the method have been reported by source testers. Field train recovery
blank concentrations need to be very low to ensure that results for the CPM measurements are
attributable to, and representative of, the source and not to the sampling trains used in the sample
collection. Task 5 was designed to evaluate the ability to clean Method 202 sampling train
glassware to achieve sufficiently low blank results and evaluate the potential contribution of
individual components of the sampling train to the total blank concentration.
Method 202 sampling trains consist of a probe extension that is glass or fluoropolymer-
lined, a condenser, a water dropout impinger, a modified Greenburg-Smith impinger with an
open tube tip, a CPM filter with filter holder, a modified Greenburg-Smith impinger containing
100 mL water, and an impinger containing silica gel. In addition to the CPM filter, Method 202
field samples are generated from the recovery of sampling train components using water,
acetone, and hexane. When operating in conjunction with Method 201A, which is first in line,
Method 202 samples consist of the CPM filter and the recoveries of:
• the back half of the Method 201A filterable PM filter holder
• the probe extension
• the condenser
• the first two impingers
• the front half of the CPM filter holder.
See Figure 1, the combined M201A/202 sampling train configuration schematic.
In this task the residual masses of the Method 202 sampling trains were determined using
the field train proof blank procedures, with the exception that CPM filters were not included in
this evaluation. The Method 202 sampling train blanks were obtained by:
• Assembling the sampling train as it would be for testing, without the CPM filter
• Recovering the inorganic fraction of the sample by rinsing the sampling train twice
with water, collecting the rinses in the inorganic sample container
• Recovering the organic fraction of the sample by rinsing the sampling train once with
acetone and twice with hexane, collecting the rinses in the organic sample container
• Extracting the inorganic fraction three times with hexane using a separatory funnel,
combining the extracts with the organic fraction
• Evaporating the samples to approximately 10 mL in beakers
47
• Evaporating the samples to dryness in aluminum weigh pans
• Desiccating the samples for at least 24 hours
• Gravimetrically analyzing the sample pans.
The sample recovery was conducted following the procedures in Method 202 on a sampling train
without any additional water, a nitrogen purge, or a CPM filter.
Task 5 evaluated whether blanks of Method 202 sampling trains can pass the 2.0 mg field
train recovery blank limit from the method. The evaluation was accomplished by recovering and
analyzing blanks from Method 202 sampling trains that have been thoroughly cleaned, solvent
rinsed, and baked as required by the method. In addition to the thorough DI water rinse that the
method requires prior to sampling, the sampling trains were also rinsed with acetone and hexane.
This effort did not evaluate the potential for contamination in the field or poor field sample
recovery techniques that contribute to elevated field train recovery blank results. Task 5 also
evaluated the potential contribution of individual components of the sampling train to the total
blank. This objective was accomplished by recovering and analyzing individual glassware
components from a Method 202 sampling train separately. In order to simulate some aspects of
real world Method 202 source testing all the sample recoveries were performed in a mobile
laboratory. All further sample processing and gravimetric analysis was performed at ERG’s
laboratory facility.
5.1 Procedures
Three Method 202 sampling trains that have previously been used to conduct Method 202
source emissions testing were supplied by Air-Tech Environmental. The trains, identified as A,
B, and C, were cleaned and prepared as they would be for deployment in the field, following the
Method 202 requirements and without a CPM filter. On August 27, 2013 Air-Tech
Environmental personnel, under supervision of the ERG Project Director, recovered the
sampling trains according to the proof blank procedures of Method 202. The recoveries were
conducted in the mobile lab at Air-Tech Environmental. Train C was then recovered two
additional times for a total of five full Method 202 sampling train samples as follows:
• Train A Recovery (A)
• Train B Recovery (B)
• Train C Three Recoveries (C1, C2, and C3).
Train A was separated into its components; the probe extension including the back half of the
Method 201A filterable PM filter holder, the condenser, the impingers with connecting
glassware, and the front half of the Method 202 CPM filter housing. Each individual component
was then recovered independently four times generating 16 samples:
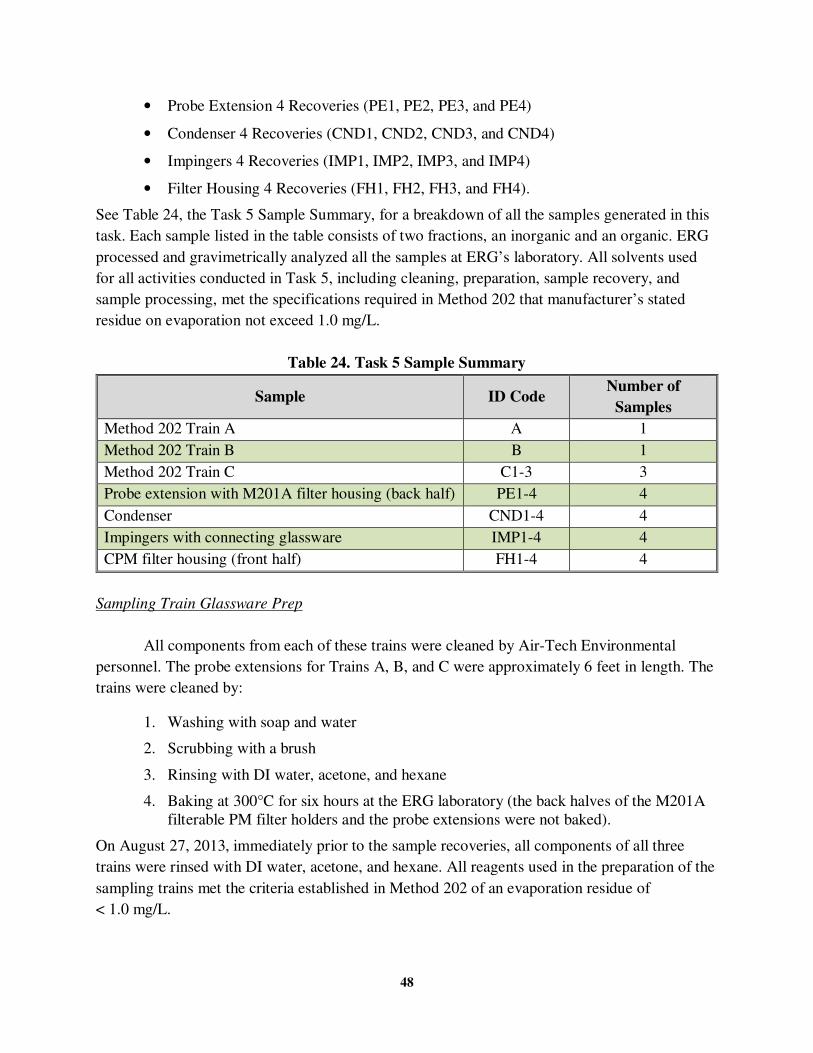
48
• Probe Extension 4 Recoveries (PE1, PE2, PE3, and PE4)
• Condenser 4 Recoveries (CND1, CND2, CND3, and CND4)
• Impingers 4 Recoveries (IMP1, IMP2, IMP3, and IMP4)
• Filter Housing 4 Recoveries (FH1, FH2, FH3, and FH4).
See Table 24, the Task 5 Sample Summary, for a breakdown of all the samples generated in this
task. Each sample listed in the table consists of two fractions, an inorganic and an organic. ERG
processed and gravimetrically analyzed all the samples at ERG’s laboratory. All solvents used
for all activities conducted in Task 5, including cleaning, preparation, sample recovery, and
sample processing, met the specifications required in Method 202 that manufacturer’s stated
residue on evaporation not exceed 1.0 mg/L.
Table 24. Task 5 Sample Summary
Sample ID Code Number of
Samples
Method 202 Train A A 1
Method 202 Train B B 1
Method 202 Train C C1-3 3
Probe extension with M201A filter housing (back half) PE1-4 4
Condenser CND1-4 4
Impingers with connecting glassware IMP1-4 4
CPM filter housing (front half) FH1-4 4
Sampling Train Glassware Prep
All components from each of these trains were cleaned by Air-Tech Environmental
personnel. The probe extensions for Trains A, B, and C were approximately 6 feet in length. The
trains were cleaned by:
1. Washing with soap and water
2. Scrubbing with a brush
3. Rinsing with DI water, acetone, and hexane
4. Baking at 300°C for six hours at the ERG laboratory (the back halves of the M201A
filterable PM filter holders and the probe extensions were not baked).
On August 27, 2013, immediately prior to the sample recoveries, all components of all three
trains were rinsed with DI water, acetone, and hexane. All reagents used in the preparation of the
sampling trains met the criteria established in Method 202 of an evaporation residue of
< 1.0 mg/L.
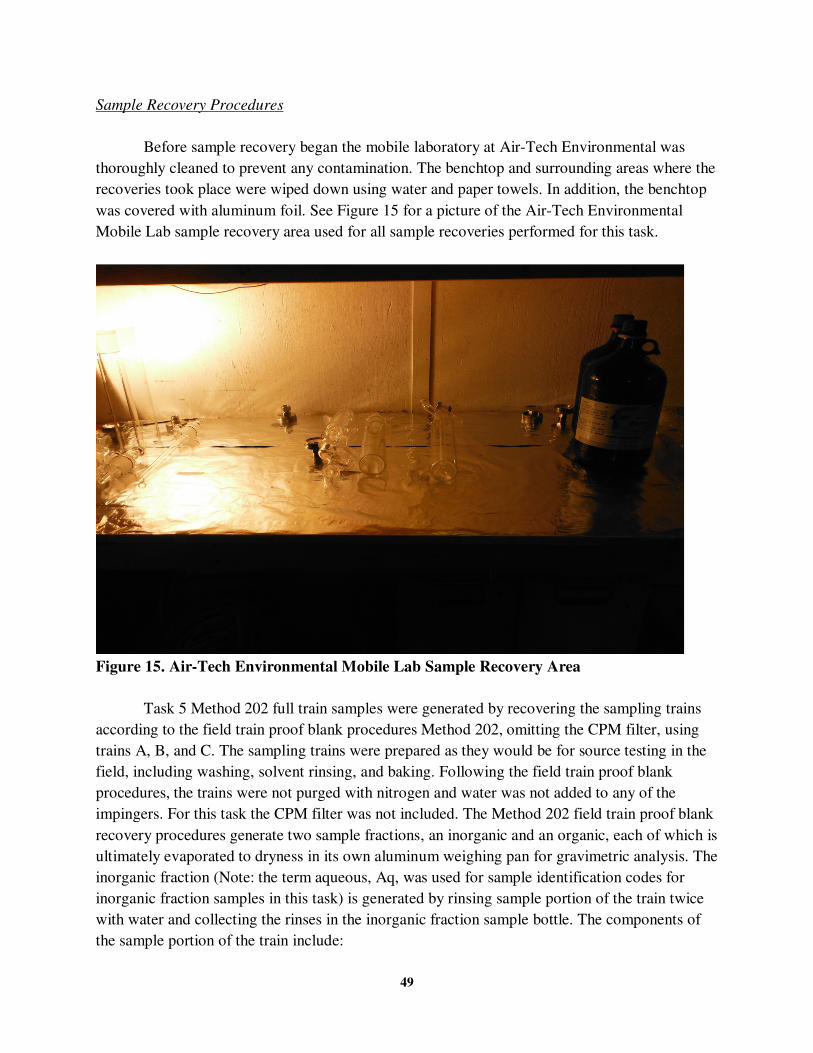
49
Sample Recovery Procedures
Before sample recovery began the mobile laboratory at Air-Tech Environmental was
thoroughly cleaned to prevent any contamination. The benchtop and surrounding areas where the
recoveries took place were wiped down using water and paper towels. In addition, the benchtop
was covered with aluminum foil. See Figure 15 for a picture of the Air-Tech Environmental
Mobile Lab sample recovery area used for all sample recoveries performed for this task.
Figure 15. Air-Tech Environmental Mobile Lab Sample Recovery Area
Task 5 Method 202 full train samples were generated by recovering the sampling trains
according to the field train proof blank procedures Method 202, omitting the CPM filter, using
trains A, B, and C. The sampling trains were prepared as they would be for source testing in the
field, including washing, solvent rinsing, and baking. Following the field train proof blank
procedures, the trains were not purged with nitrogen and water was not added to any of the
impingers. For this task the CPM filter was not included. The Method 202 field train proof blank
recovery procedures generate two sample fractions, an inorganic and an organic, each of which is
ultimately evaporated to dryness in its own aluminum weighing pan for gravimetric analysis. The
inorganic fraction (Note: the term aqueous, Aq, was used for sample identification codes for
inorganic fraction samples in this task) is generated by rinsing sample portion of the train twice
with water and collecting the rinses in the inorganic fraction sample bottle. The components of
the sample portion of the train include:
50
• the back half of the Method 201A filterable PM filter holder
• the probe extension
• the condenser
• the first two impingers with connecting glassware
• the front half of the CPM filter holder.
High purity Fisher Optima water, with an evaporation residue of < 1.0 mg/L, was used for
inorganic fraction recoveries. The organic fraction is generated by rinsing the sample portion of
the train once with acetone then twice with hexane and collecting the rinses in the organic
fraction sample bottle. Acetone, with an evaporation residue of < 0.5 mg/L, and hexane, with an
evaporation residue of < 0.1 mg/L, were used for organic fraction recoveries. Train C was
recovered two additional times after the initial sample recovery for three samples from Train C
and a total of five Method 202 full sampling train samples.
Task 5 Method 202 sampling train component samples were generated following the
same procedures as for full trains with the exception that the rinses of each component were
collected separately in their own sample jars. Train A was used for the individual component
recoveries after the full train samples were collected without any further preparation. The
sampling train was divided into four separate components as follows:
• the probe extension including the back half of the Method 201A filterable PM filter
holder (PE)
• the condenser (CND)
• the impingers with connecting glassware (IMP)
• the front half of the Method 202 CPM filter housing (FH).
Inorganic and organic fractions were recovered for each component by collecting the reagent
rinses in the appropriate sample bottle. Each of the four individual components received four
sequential recoveries for a total of 16 Method 202 sampling train component samples.
All samples, inorganic and organic fractions for both full M202 trains and individual
components, were recovered in pre-cleaned 500 mL amber glass jars labeled with the unique
sample identification (ID) and date. The sample jars have certificates of analysis from the
manufacturer that document the cleanliness specifications. The tare weights were taken for the
sample jars before sample recovery and recorded in the lab notebook. Chains of Custody (COC)
were used for all samples. Information on the COCs included:
• the unique sample ID
• the glassware train or component
• the date collected
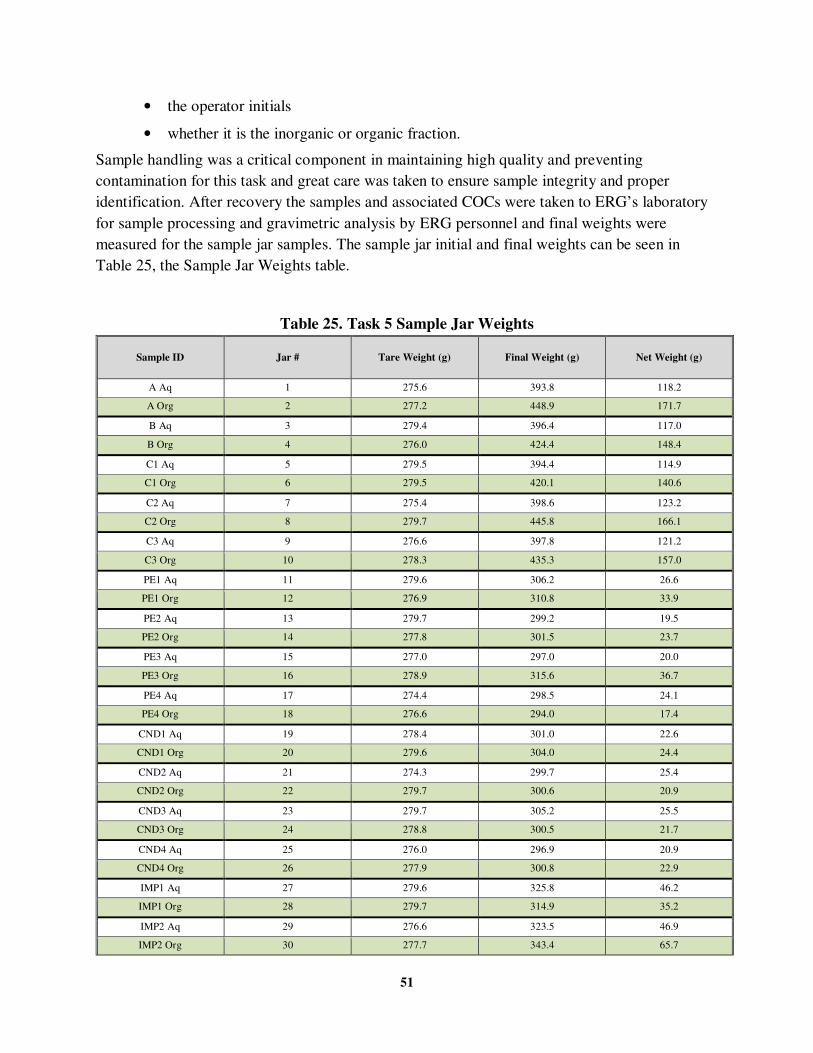
51
• the operator initials
• whether it is the inorganic or organic fraction.
Sample handling was a critical component in maintaining high quality and preventing
contamination for this task and great care was taken to ensure sample integrity and proper
identification. After recovery the samples and associated COCs were taken to ERG’s laboratory
for sample processing and gravimetric analysis by ERG personnel and final weights were
measured for the sample jar samples. The sample jar initial and final weights can be seen in
Table 25, the Sample Jar Weights table.
Table 25. Task 5 Sample Jar Weights
Sample ID Jar # Tare Weight (g) Final Weight (g) Net Weight (g)
A Aq 1 275.6 393.8 118.2
A Org 2 277.2 448.9 171.7
B Aq 3 279.4 396.4 117.0
B Org 4 276.0 424.4 148.4
C1 Aq 5 279.5 394.4 114.9
C1 Org 6 279.5 420.1 140.6
C2 Aq 7 275.4 398.6 123.2
C2 Org 8 279.7 445.8 166.1
C3 Aq 9 276.6 397.8 121.2
C3 Org 10 278.3 435.3 157.0
PE1 Aq 11 279.6 306.2 26.6
PE1 Org 12 276.9 310.8 33.9
PE2 Aq 13 279.7 299.2 19.5
PE2 Org 14 277.8 301.5 23.7
PE3 Aq 15 277.0 297.0 20.0
PE3 Org 16 278.9 315.6 36.7
PE4 Aq 17 274.4 298.5 24.1
PE4 Org 18 276.6 294.0 17.4
CND1 Aq 19 278.4 301.0 22.6
CND1 Org 20 279.6 304.0 24.4
CND2 Aq 21 274.3 299.7 25.4
CND2 Org 22 279.7 300.6 20.9
CND3 Aq 23 279.7 305.2 25.5
CND3 Org 24 278.8 300.5 21.7
CND4 Aq 25 276.0 296.9 20.9
CND4 Org 26 277.9 300.8 22.9
IMP1 Aq 27 279.6 325.8 46.2
IMP1 Org 28 279.7 314.9 35.2
IMP2 Aq 29 276.6 323.5 46.9
IMP2 Org 30 277.7 343.4 65.7
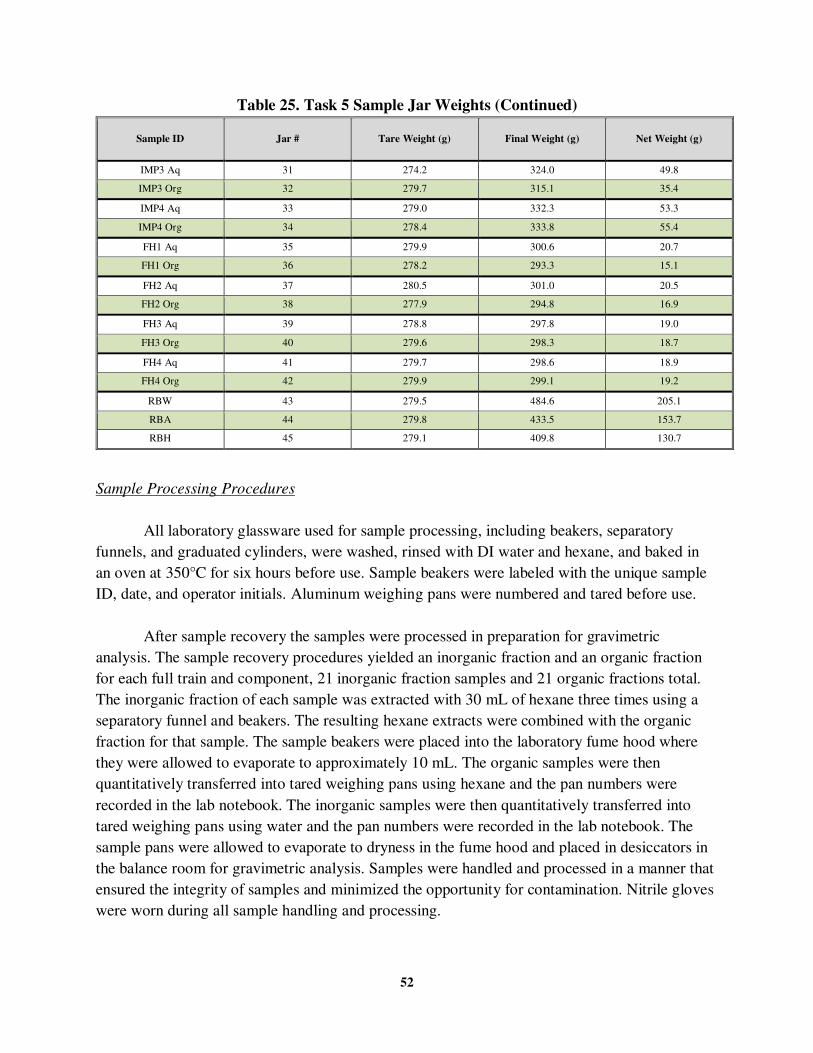
52
Table 25. Task 5 Sample Jar Weights (Continued)
Sample ID Jar # Tare Weight (g) Final Weight (g) Net Weight (g)
IMP3 Aq 31 274.2 324.0 49.8
IMP3 Org 32 279.7 315.1 35.4
IMP4 Aq 33 279.0 332.3 53.3
IMP4 Org 34 278.4 333.8 55.4
FH1 Aq 35 279.9 300.6 20.7
FH1 Org 36 278.2 293.3 15.1
FH2 Aq 37 280.5 301.0 20.5
FH2 Org 38 277.9 294.8 16.9
FH3 Aq 39 278.8 297.8 19.0
FH3 Org 40 279.6 298.3 18.7
FH4 Aq 41 279.7 298.6 18.9
FH4 Org 42 279.9 299.1 19.2
RBW 43 279.5 484.6 205.1
RBA 44 279.8 433.5 153.7
RBH 45 279.1 409.8 130.7
Sample Processing Procedures
All laboratory glassware used for sample processing, including beakers, separatory
funnels, and graduated cylinders, were washed, rinsed with DI water and hexane, and baked in
an oven at 350°C for six hours before use. Sample beakers were labeled with the unique sample
ID, date, and operator initials. Aluminum weighing pans were numbered and tared before use.
After sample recovery the samples were processed in preparation for gravimetric
analysis. The sample recovery procedures yielded an inorganic fraction and an organic fraction
for each full train and component, 21 inorganic fraction samples and 21 organic fractions total.
The inorganic fraction of each sample was extracted with 30 mL of hexane three times using a
separatory funnel and beakers. The resulting hexane extracts were combined with the organic
fraction for that sample. The sample beakers were placed into the laboratory fume hood where
they were allowed to evaporate to approximately 10 mL. The organic samples were then
quantitatively transferred into tared weighing pans using hexane and the pan numbers were
recorded in the lab notebook. The inorganic samples were then quantitatively transferred into
tared weighing pans using water and the pan numbers were recorded in the lab notebook. The
sample pans were allowed to evaporate to dryness in the fume hood and placed in desiccators in
the balance room for gravimetric analysis. Samples were handled and processed in a manner that
ensured the integrity of samples and minimized the opportunity for contamination. Nitrile gloves
were worn during all sample handling and processing.
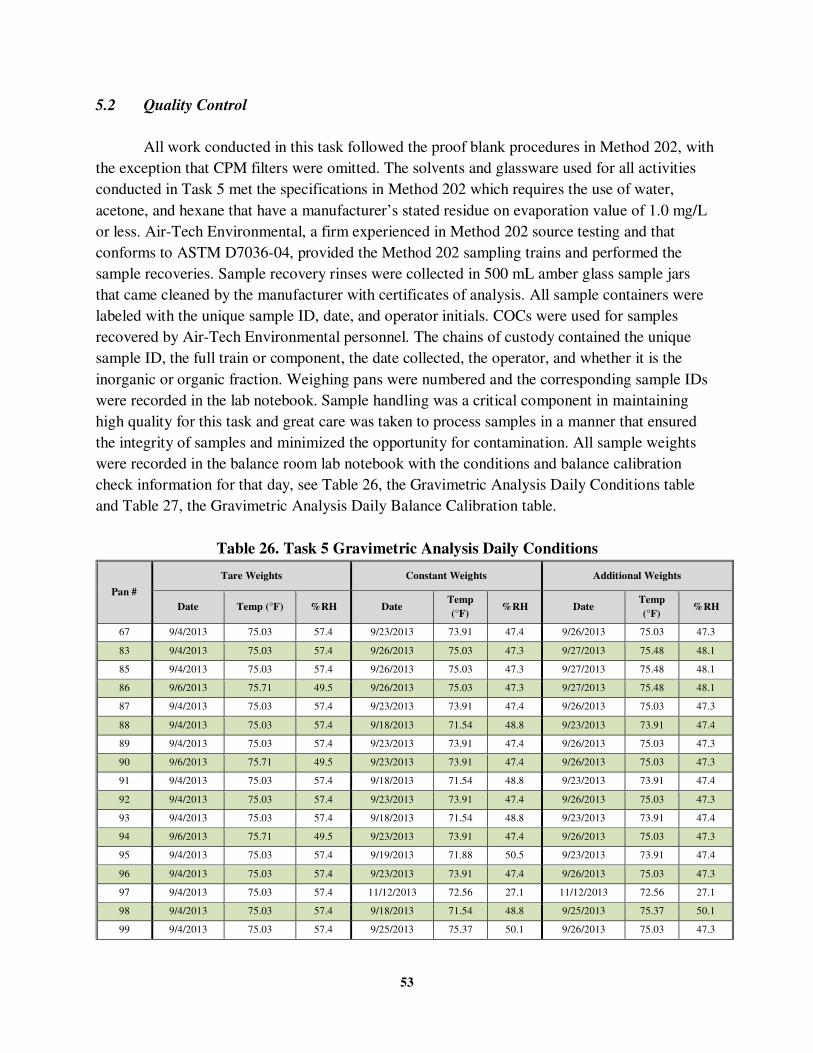
53
5.2 Quality Control
All work conducted in this task followed the proof blank procedures in Method 202, with
the exception that CPM filters were omitted. The solvents and glassware used for all activities
conducted in Task 5 met the specifications in Method 202 which requires the use of water,
acetone, and hexane that have a manufacturer’s stated residue on evaporation value of 1.0 mg/L
or less. Air-Tech Environmental, a firm experienced in Method 202 source testing and that
conforms to ASTM D7036-04, provided the Method 202 sampling trains and performed the
sample recoveries. Sample recovery rinses were collected in 500 mL amber glass sample jars
that came cleaned by the manufacturer with certificates of analysis. All sample containers were
labeled with the unique sample ID, date, and operator initials. COCs were used for samples
recovered by Air-Tech Environmental personnel. The chains of custody contained the unique
sample ID, the full train or component, the date collected, the operator, and whether it is the
inorganic or organic fraction. Weighing pans were numbered and the corresponding sample IDs
were recorded in the lab notebook. Sample handling was a critical component in maintaining
high quality for this task and great care was taken to process samples in a manner that ensured
the integrity of samples and minimized the opportunity for contamination. All sample weights
were recorded in the balance room lab notebook with the conditions and balance calibration
check information for that day, see Table 26, the Gravimetric Analysis Daily Conditions table
and Table 27, the Gravimetric Analysis Daily Balance Calibration table.
Table 26. Task 5 Gravimetric Analysis Daily Conditions
Pan #
Tare Weights Constant Weights Additional Weights
Date Temp (°F) %RH Date Temp
(°F) %RH Date
Temp
(°F) %RH
67 9/4/2013 75.03 57.4 9/23/2013 73.91 47.4 9/26/2013 75.03 47.3
83 9/4/2013 75.03 57.4 9/26/2013 75.03 47.3 9/27/2013 75.48 48.1
85 9/4/2013 75.03 57.4 9/26/2013 75.03 47.3 9/27/2013 75.48 48.1
86 9/6/2013 75.71 49.5 9/26/2013 75.03 47.3 9/27/2013 75.48 48.1
87 9/4/2013 75.03 57.4 9/23/2013 73.91 47.4 9/26/2013 75.03 47.3
88 9/4/2013 75.03 57.4 9/18/2013 71.54 48.8 9/23/2013 73.91 47.4
89 9/4/2013 75.03 57.4 9/23/2013 73.91 47.4 9/26/2013 75.03 47.3
90 9/6/2013 75.71 49.5 9/23/2013 73.91 47.4 9/26/2013 75.03 47.3
91 9/4/2013 75.03 57.4 9/18/2013 71.54 48.8 9/23/2013 73.91 47.4
92 9/4/2013 75.03 57.4 9/23/2013 73.91 47.4 9/26/2013 75.03 47.3
93 9/4/2013 75.03 57.4 9/18/2013 71.54 48.8 9/23/2013 73.91 47.4
94 9/6/2013 75.71 49.5 9/23/2013 73.91 47.4 9/26/2013 75.03 47.3
95 9/4/2013 75.03 57.4 9/19/2013 71.88 50.5 9/23/2013 73.91 47.4
96 9/4/2013 75.03 57.4 9/23/2013 73.91 47.4 9/26/2013 75.03 47.3
97 9/4/2013 75.03 57.4 11/12/2013 72.56 27.1 11/12/2013 72.56 27.1
98 9/4/2013 75.03 57.4 9/18/2013 71.54 48.8 9/25/2013 75.37 50.1
99 9/4/2013 75.03 57.4 9/25/2013 75.37 50.1 9/26/2013 75.03 47.3
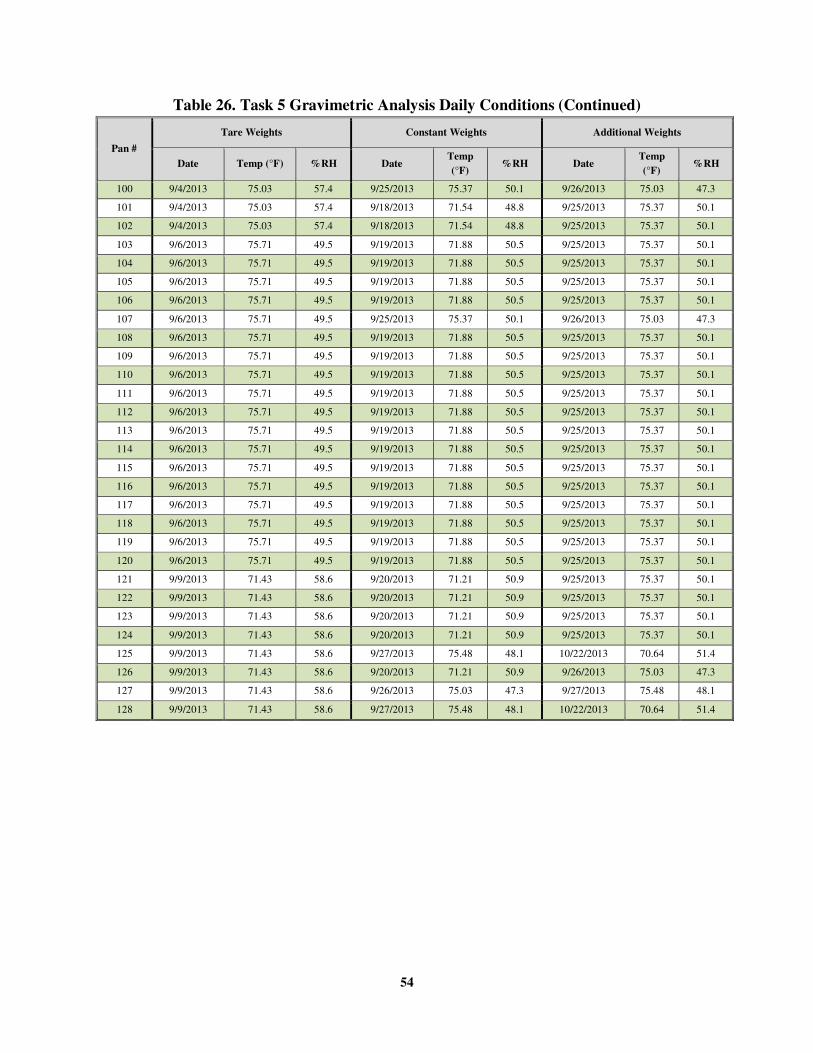
54
Table 26. Task 5 Gravimetric Analysis Daily Conditions (Continued)
Pan #
Tare Weights Constant Weights Additional Weights
Date Temp (°F) %RH Date Temp
(°F) %RH Date
Temp
(°F) %RH
100 9/4/2013 75.03 57.4 9/25/2013 75.37 50.1 9/26/2013 75.03 47.3
101 9/4/2013 75.03 57.4 9/18/2013 71.54 48.8 9/25/2013 75.37 50.1
102 9/4/2013 75.03 57.4 9/18/2013 71.54 48.8 9/25/2013 75.37 50.1
103 9/6/2013 75.71 49.5 9/19/2013 71.88 50.5 9/25/2013 75.37 50.1
104 9/6/2013 75.71 49.5 9/19/2013 71.88 50.5 9/25/2013 75.37 50.1
105 9/6/2013 75.71 49.5 9/19/2013 71.88 50.5 9/25/2013 75.37 50.1
106 9/6/2013 75.71 49.5 9/19/2013 71.88 50.5 9/25/2013 75.37 50.1
107 9/6/2013 75.71 49.5 9/25/2013 75.37 50.1 9/26/2013 75.03 47.3
108 9/6/2013 75.71 49.5 9/19/2013 71.88 50.5 9/25/2013 75.37 50.1
109 9/6/2013 75.71 49.5 9/19/2013 71.88 50.5 9/25/2013 75.37 50.1
110 9/6/2013 75.71 49.5 9/19/2013 71.88 50.5 9/25/2013 75.37 50.1
111 9/6/2013 75.71 49.5 9/19/2013 71.88 50.5 9/25/2013 75.37 50.1
112 9/6/2013 75.71 49.5 9/19/2013 71.88 50.5 9/25/2013 75.37 50.1
113 9/6/2013 75.71 49.5 9/19/2013 71.88 50.5 9/25/2013 75.37 50.1
114 9/6/2013 75.71 49.5 9/19/2013 71.88 50.5 9/25/2013 75.37 50.1
115 9/6/2013 75.71 49.5 9/19/2013 71.88 50.5 9/25/2013 75.37 50.1
116 9/6/2013 75.71 49.5 9/19/2013 71.88 50.5 9/25/2013 75.37 50.1
117 9/6/2013 75.71 49.5 9/19/2013 71.88 50.5 9/25/2013 75.37 50.1
118 9/6/2013 75.71 49.5 9/19/2013 71.88 50.5 9/25/2013 75.37 50.1
119 9/6/2013 75.71 49.5 9/19/2013 71.88 50.5 9/25/2013 75.37 50.1
120 9/6/2013 75.71 49.5 9/19/2013 71.88 50.5 9/25/2013 75.37 50.1
121 9/9/2013 71.43 58.6 9/20/2013 71.21 50.9 9/25/2013 75.37 50.1
122 9/9/2013 71.43 58.6 9/20/2013 71.21 50.9 9/25/2013 75.37 50.1
123 9/9/2013 71.43 58.6 9/20/2013 71.21 50.9 9/25/2013 75.37 50.1
124 9/9/2013 71.43 58.6 9/20/2013 71.21 50.9 9/25/2013 75.37 50.1
125 9/9/2013 71.43 58.6 9/27/2013 75.48 48.1 10/22/2013 70.64 51.4
126 9/9/2013 71.43 58.6 9/20/2013 71.21 50.9 9/26/2013 75.03 47.3
127 9/9/2013 71.43 58.6 9/26/2013 75.03 47.3 9/27/2013 75.48 48.1
128 9/9/2013 71.43 58.6 9/27/2013 75.48 48.1 10/22/2013 70.64 51.4
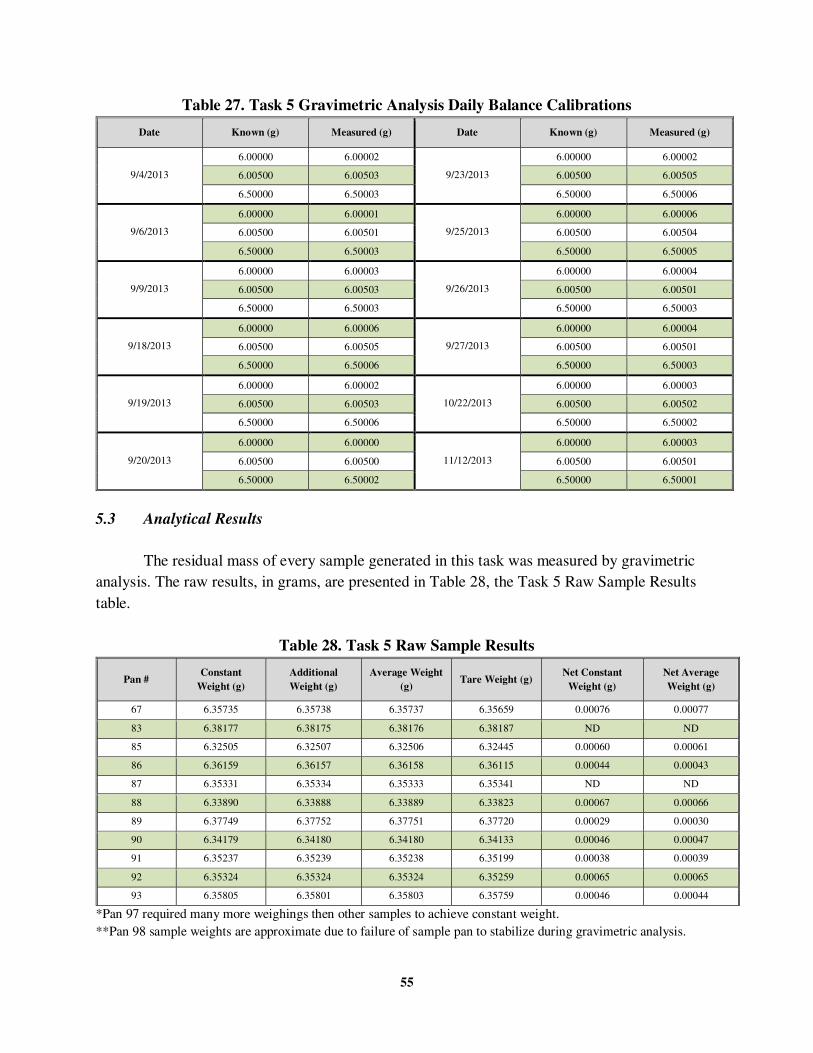
55
Table 27. Task 5 Gravimetric Analysis Daily Balance Calibrations
Date Known (g) Measured (g) Date Known (g) Measured (g)
6.00000 6.00002 6.00000 6.00002
9/4/2013 6.00500 6.00503 9/23/2013 6.00500 6.00505
6.50000 6.50003 6.50000 6.50006
6.00000 6.00001 6.00000 6.00006
9/6/2013 6.00500 6.00501 9/25/2013 6.00500 6.00504
6.50000 6.50003 6.50000 6.50005
6.00000 6.00003 6.00000 6.00004
9/9/2013 6.00500 6.00503 9/26/2013 6.00500 6.00501
6.50000 6.50003 6.50000 6.50003
6.00000 6.00006 6.00000 6.00004
9/18/2013 6.00500 6.00505 9/27/2013 6.00500 6.00501
6.50000 6.50006 6.50000 6.50003
6.00000 6.00002 6.00000 6.00003
9/19/2013 6.00500 6.00503 10/22/2013 6.00500 6.00502
6.50000 6.50006 6.50000 6.50002
6.00000 6.00000 6.00000 6.00003
9/20/2013 6.00500 6.00500 11/12/2013 6.00500 6.00501
6.50000 6.50002 6.50000 6.50001
5.3 Analytical Results
The residual mass of every sample generated in this task was measured by gravimetric
analysis. The raw results, in grams, are presented in Table 28, the Task 5 Raw Sample Results
table.
Table 28. Task 5 Raw Sample Results
Pan # Constant
Weight (g)
Additional
Weight (g)
Average Weight
(g) Tare Weight (g)
Net Constant
Weight (g)
Net Average
Weight (g)
67 6.35735 6.35738 6.35737 6.35659 0.00076 0.00077
83 6.38177 6.38175 6.38176 6.38187 ND ND
85 6.32505 6.32507 6.32506 6.32445 0.00060 0.00061
86 6.36159 6.36157 6.36158 6.36115 0.00044 0.00043
87 6.35331 6.35334 6.35333 6.35341 ND ND
88 6.33890 6.33888 6.33889 6.33823 0.00067 0.00066
89 6.37749 6.37752 6.37751 6.37720 0.00029 0.00030
90 6.34179 6.34180 6.34180 6.34133 0.00046 0.00047
91 6.35237 6.35239 6.35238 6.35199 0.00038 0.00039
92 6.35324 6.35324 6.35324 6.35259 0.00065 0.00065
93 6.35805 6.35801 6.35803 6.35759 0.00046 0.00044
*Pan 97 required many more weighings then other samples to achieve constant weight.
**Pan 98 sample weights are approximate due to failure of sample pan to stabilize during gravimetric analysis.
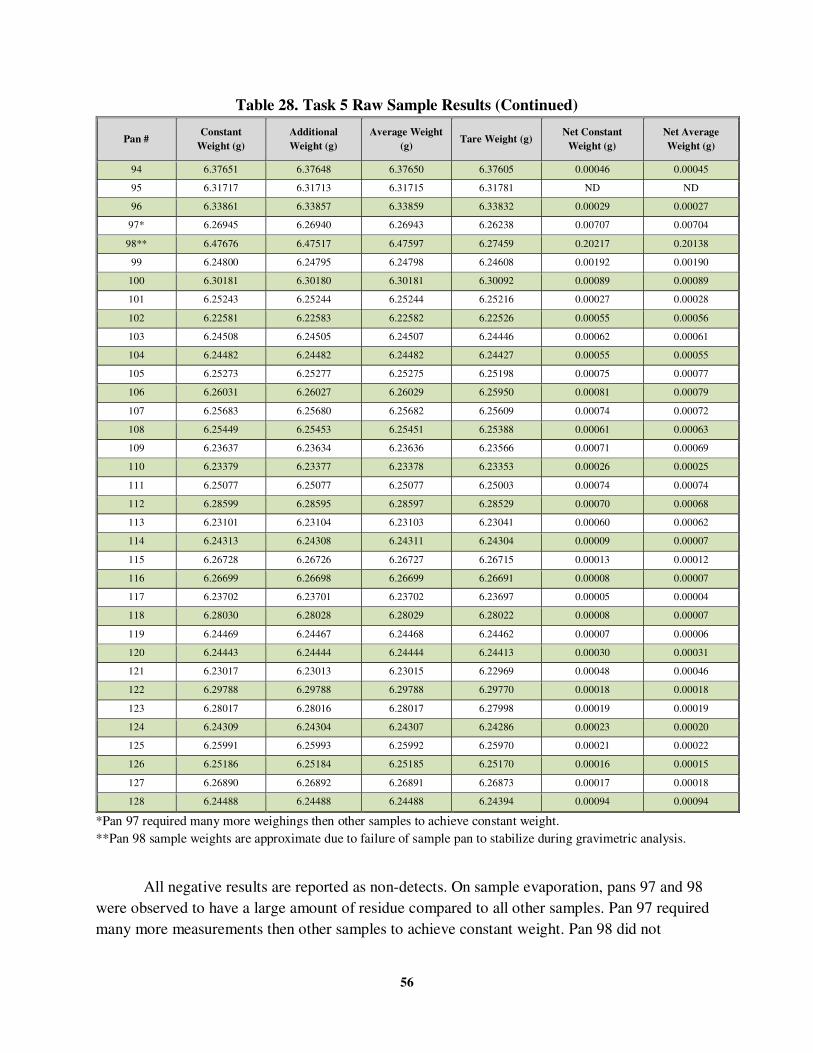
56
Table 28. Task 5 Raw Sample Results (Continued)
Pan # Constant
Weight (g)
Additional
Weight (g)
Average Weight
(g) Tare Weight (g)
Net Constant
Weight (g)
Net Average
Weight (g)
94 6.37651 6.37648 6.37650 6.37605 0.00046 0.00045
95 6.31717 6.31713 6.31715 6.31781 ND ND
96 6.33861 6.33857 6.33859 6.33832 0.00029 0.00027
97* 6.26945 6.26940 6.26943 6.26238 0.00707 0.00704
98** 6.47676 6.47517 6.47597 6.27459 0.20217 0.20138
99 6.24800 6.24795 6.24798 6.24608 0.00192 0.00190
100 6.30181 6.30180 6.30181 6.30092 0.00089 0.00089
101 6.25243 6.25244 6.25244 6.25216 0.00027 0.00028
102 6.22581 6.22583 6.22582 6.22526 0.00055 0.00056
103 6.24508 6.24505 6.24507 6.24446 0.00062 0.00061
104 6.24482 6.24482 6.24482 6.24427 0.00055 0.00055
105 6.25273 6.25277 6.25275 6.25198 0.00075 0.00077
106 6.26031 6.26027 6.26029 6.25950 0.00081 0.00079
107 6.25683 6.25680 6.25682 6.25609 0.00074 0.00072
108 6.25449 6.25453 6.25451 6.25388 0.00061 0.00063
109 6.23637 6.23634 6.23636 6.23566 0.00071 0.00069
110 6.23379 6.23377 6.23378 6.23353 0.00026 0.00025
111 6.25077 6.25077 6.25077 6.25003 0.00074 0.00074
112 6.28599 6.28595 6.28597 6.28529 0.00070 0.00068
113 6.23101 6.23104 6.23103 6.23041 0.00060 0.00062
114 6.24313 6.24308 6.24311 6.24304 0.00009 0.00007
115 6.26728 6.26726 6.26727 6.26715 0.00013 0.00012
116 6.26699 6.26698 6.26699 6.26691 0.00008 0.00007
117 6.23702 6.23701 6.23702 6.23697 0.00005 0.00004
118 6.28030 6.28028 6.28029 6.28022 0.00008 0.00007
119 6.24469 6.24467 6.24468 6.24462 0.00007 0.00006
120 6.24443 6.24444 6.24444 6.24413 0.00030 0.00031
121 6.23017 6.23013 6.23015 6.22969 0.00048 0.00046
122 6.29788 6.29788 6.29788 6.29770 0.00018 0.00018
123 6.28017 6.28016 6.28017 6.27998 0.00019 0.00019
124 6.24309 6.24304 6.24307 6.24286 0.00023 0.00020
125 6.25991 6.25993 6.25992 6.25970 0.00021 0.00022
126 6.25186 6.25184 6.25185 6.25170 0.00016 0.00015
127 6.26890 6.26892 6.26891 6.26873 0.00017 0.00018
128 6.24488 6.24488 6.24488 6.24394 0.00094 0.00094
*Pan 97 required many more weighings then other samples to achieve constant weight.
**Pan 98 sample weights are approximate due to failure of sample pan to stabilize during gravimetric analysis.
All negative results are reported as non-detects. On sample evaporation, pans 97 and 98
were observed to have a large amount of residue compared to all other samples. Pan 97 required
many more measurements then other samples to achieve constant weight. Pan 98 did not
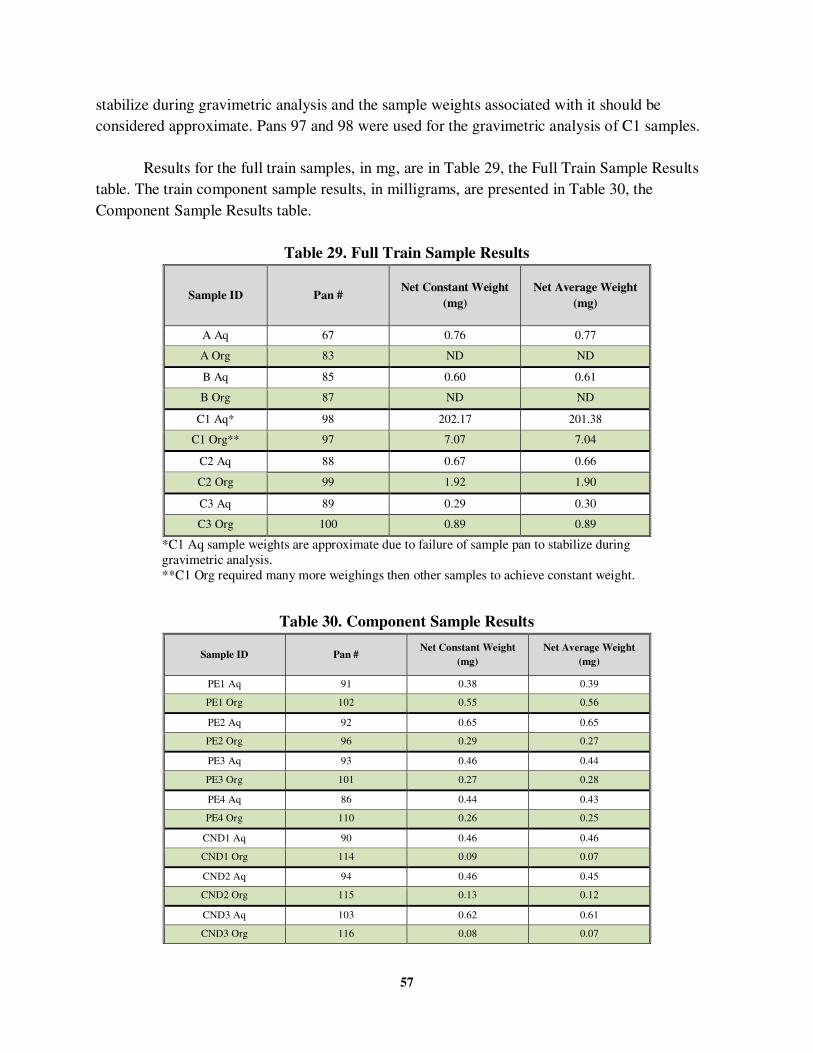
57
stabilize during gravimetric analysis and the sample weights associated with it should be
considered approximate. Pans 97 and 98 were used for the gravimetric analysis of C1 samples.
Results for the full train samples, in mg, are in Table 29, the Full Train Sample Results
table. The train component sample results, in milligrams, are presented in Table 30, the
Component Sample Results table.
Table 29. Full Train Sample Results
Sample ID Pan # Net Constant Weight
(mg)
Net Average Weight
(mg)
A Aq 67 0.76 0.77
A Org 83 ND ND
B Aq 85 0.60 0.61
B Org 87 ND ND
C1 Aq* 98 202.17 201.38
C1 Org** 97 7.07 7.04
C2 Aq 88 0.67 0.66
C2 Org 99 1.92 1.90
C3 Aq 89 0.29 0.30
C3 Org 100 0.89 0.89
*C1 Aq sample weights are approximate due to failure of sample pan to stabilize during
gravimetric analysis.
**C1 Org required many more weighings then other samples to achieve constant weight.
Table 30. Component Sample Results
Sample ID Pan # Net Constant Weight
(mg)
Net Average Weight
(mg)
PE1 Aq 91 0.38 0.39
PE1 Org 102 0.55 0.56
PE2 Aq 92 0.65 0.65
PE2 Org 96 0.29 0.27
PE3 Aq 93 0.46 0.44
PE3 Org 101 0.27 0.28
PE4 Aq 86 0.44 0.43
PE4 Org 110 0.26 0.25
CND1 Aq 90 0.46 0.46
CND1 Org 114 0.09 0.07
CND2 Aq 94 0.46 0.45
CND2 Org 115 0.13 0.12
CND3 Aq 103 0.62 0.61
CND3 Org 116 0.08 0.07
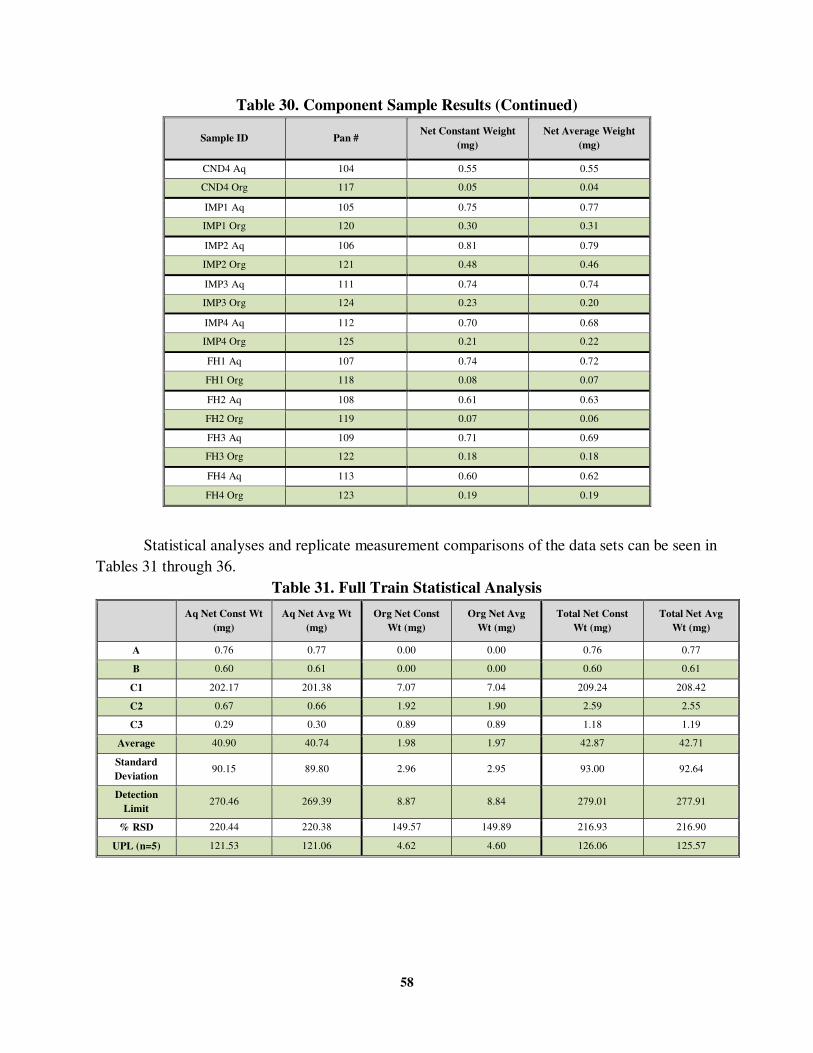
58
Table 30. Component Sample Results (Continued)
Sample ID Pan # Net Constant Weight
(mg)
Net Average Weight
(mg)
CND4 Aq 104 0.55 0.55
CND4 Org 117 0.05 0.04
IMP1 Aq 105 0.75 0.77
IMP1 Org 120 0.30 0.31
IMP2 Aq 106 0.81 0.79
IMP2 Org 121 0.48 0.46
IMP3 Aq 111 0.74 0.74
IMP3 Org 124 0.23 0.20
IMP4 Aq 112 0.70 0.68
IMP4 Org 125 0.21 0.22
FH1 Aq 107 0.74 0.72
FH1 Org 118 0.08 0.07
FH2 Aq 108 0.61 0.63
FH2 Org 119 0.07 0.06
FH3 Aq 109 0.71 0.69
FH3 Org 122 0.18 0.18
FH4 Aq 113 0.60 0.62
FH4 Org 123 0.19 0.19
Statistical analyses and replicate measurement comparisons of the data sets can be seen in
Tables 31 through 36.
Table 31. Full Train Statistical Analysis
Aq Net Const Wt
(mg)
Aq Net Avg Wt
(mg)
Org Net Const
Wt (mg)
Org Net Avg
Wt (mg)
Total Net Const
Wt (mg)
Total Net Avg
Wt (mg)
A 0.76 0.77 0.00 0.00 0.76 0.77
B 0.60 0.61 0.00 0.00 0.60 0.61
C1 202.17 201.38 7.07 7.04 209.24 208.42
C2 0.67 0.66 1.92 1.90 2.59 2.55
C3 0.29 0.30 0.89 0.89 1.18 1.19
Average 40.90 40.74 1.98 1.97 42.87 42.71
Standard
Deviation 90.15 89.80 2.96 2.95 93.00 92.64
Detection
Limit 270.46 269.39 8.87 8.84 279.01 277.91
% RSD 220.44 220.38 149.57 149.89 216.93 216.90
UPL (n=5) 121.53 121.06 4.62 4.60 126.06 125.57
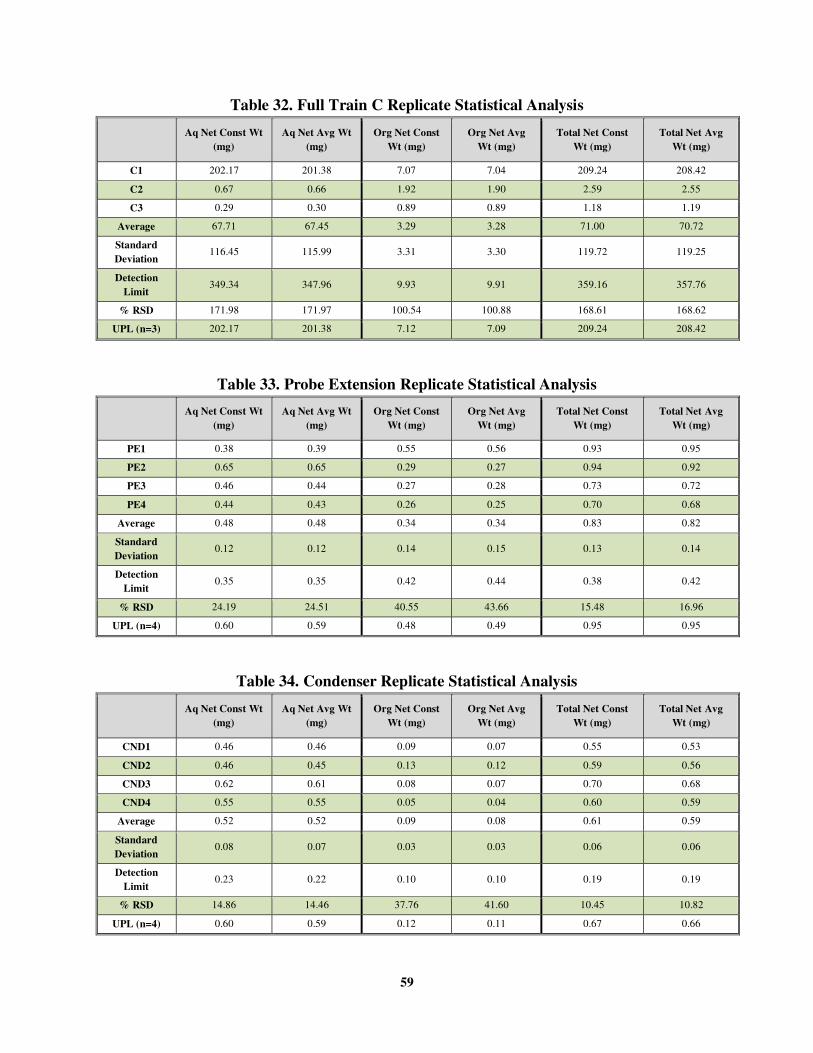
59
Table 32. Full Train C Replicate Statistical Analysis
Aq Net Const Wt
(mg)
Aq Net Avg Wt
(mg)
Org Net Const
Wt (mg)
Org Net Avg
Wt (mg)
Total Net Const
Wt (mg)
Total Net Avg
Wt (mg)
C1 202.17 201.38 7.07 7.04 209.24 208.42
C2 0.67 0.66 1.92 1.90 2.59 2.55
C3 0.29 0.30 0.89 0.89 1.18 1.19
Average 67.71 67.45 3.29 3.28 71.00 70.72
Standard
Deviation 116.45 115.99 3.31 3.30 119.72 119.25
Detection
Limit 349.34 347.96 9.93 9.91 359.16 357.76
% RSD 171.98 171.97 100.54 100.88 168.61 168.62
UPL (n=3) 202.17 201.38 7.12 7.09 209.24 208.42
Table 33. Probe Extension Replicate Statistical Analysis
Aq Net Const Wt
(mg)
Aq Net Avg Wt
(mg)
Org Net Const
Wt (mg)
Org Net Avg
Wt (mg)
Total Net Const
Wt (mg)
Total Net Avg
Wt (mg)
PE1 0.38 0.39 0.55 0.56 0.93 0.95
PE2 0.65 0.65 0.29 0.27 0.94 0.92
PE3 0.46 0.44 0.27 0.28 0.73 0.72
PE4 0.44 0.43 0.26 0.25 0.70 0.68
Average 0.48 0.48 0.34 0.34 0.83 0.82
Standard
Deviation 0.12 0.12 0.14 0.15 0.13 0.14
Detection
Limit 0.35 0.35 0.42 0.44 0.38 0.42
% RSD 24.19 24.51 40.55 43.66 15.48 16.96
UPL (n=4) 0.60 0.59 0.48 0.49 0.95 0.95
Table 34. Condenser Replicate Statistical Analysis
Aq Net Const Wt
(mg)
Aq Net Avg Wt
(mg)
Org Net Const
Wt (mg)
Org Net Avg
Wt (mg)
Total Net Const
Wt (mg)
Total Net Avg
Wt (mg)
CND1 0.46 0.46 0.09 0.07 0.55 0.53
CND2 0.46 0.45 0.13 0.12 0.59 0.56
CND3 0.62 0.61 0.08 0.07 0.70 0.68
CND4 0.55 0.55 0.05 0.04 0.60 0.59
Average 0.52 0.52 0.09 0.08 0.61 0.59
Standard
Deviation 0.08 0.07 0.03 0.03 0.06 0.06
Detection
Limit 0.23 0.22 0.10 0.10 0.19 0.19
% RSD 14.86 14.46 37.76 41.60 10.45 10.82
UPL (n=4) 0.60 0.59 0.12 0.11 0.67 0.66
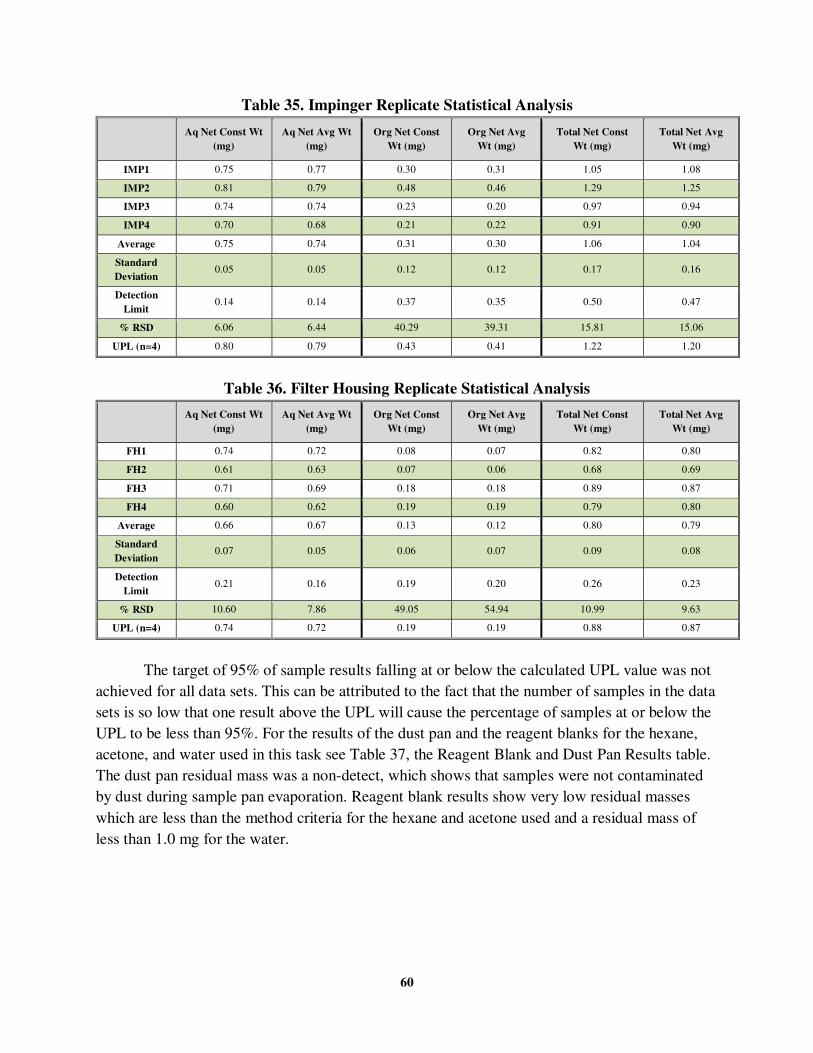
60
Table 35. Impinger Replicate Statistical Analysis
Aq Net Const Wt
(mg)
Aq Net Avg Wt
(mg)
Org Net Const
Wt (mg)
Org Net Avg
Wt (mg)
Total Net Const
Wt (mg)
Total Net Avg
Wt (mg)
IMP1 0.75 0.77 0.30 0.31 1.05 1.08
IMP2 0.81 0.79 0.48 0.46 1.29 1.25
IMP3 0.74 0.74 0.23 0.20 0.97 0.94
IMP4 0.70 0.68 0.21 0.22 0.91 0.90
Average 0.75 0.74 0.31 0.30 1.06 1.04
Standard
Deviation 0.05 0.05 0.12 0.12 0.17 0.16
Detection
Limit 0.14 0.14 0.37 0.35 0.50 0.47
% RSD 6.06 6.44 40.29 39.31 15.81 15.06
UPL (n=4) 0.80 0.79 0.43 0.41 1.22 1.20
Table 36. Filter Housing Replicate Statistical Analysis
Aq Net Const Wt
(mg)
Aq Net Avg Wt
(mg)
Org Net Const
Wt (mg)
Org Net Avg
Wt (mg)
Total Net Const
Wt (mg)
Total Net Avg
Wt (mg)
FH1 0.74 0.72 0.08 0.07 0.82 0.80
FH2 0.61 0.63 0.07 0.06 0.68 0.69
FH3 0.71 0.69 0.18 0.18 0.89 0.87
FH4 0.60 0.62 0.19 0.19 0.79 0.80
Average 0.66 0.67 0.13 0.12 0.80 0.79
Standard
Deviation 0.07 0.05 0.06 0.07 0.09 0.08
Detection
Limit 0.21 0.16 0.19 0.20 0.26 0.23
% RSD 10.60 7.86 49.05 54.94 10.99 9.63
UPL (n=4) 0.74 0.72 0.19 0.19 0.88 0.87
The target of 95% of sample results falling at or below the calculated UPL value was not
achieved for all data sets. This can be attributed to the fact that the number of samples in the data
sets is so low that one result above the UPL will cause the percentage of samples at or below the
UPL to be less than 95%. For the results of the dust pan and the reagent blanks for the hexane,
acetone, and water used in this task see Table 37, the Reagent Blank and Dust Pan Results table.
The dust pan residual mass was a non-detect, which shows that samples were not contaminated
by dust during sample pan evaporation. Reagent blank results show very low residual masses
which are less than the method criteria for the hexane and acetone used and a residual mass of
less than 1.0 mg for the water.
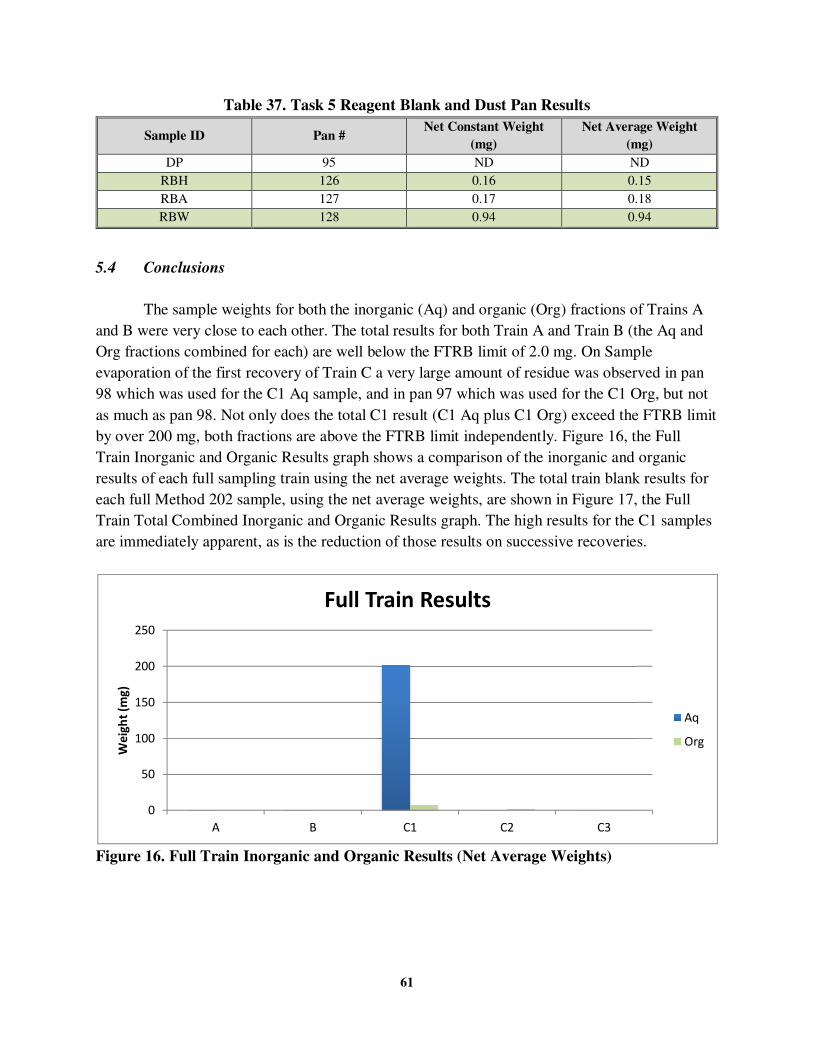
61
Table 37. Task 5 Reagent Blank and Dust Pan Results
Sample ID Pan # Net Constant Weight
(mg)
Net Average Weight
(mg)
DP 95 ND ND
RBH 126 0.16 0.15
RBA 127 0.17 0.18
RBW 128 0.94 0.94
5.4 Conclusions
The sample weights for both the inorganic (Aq) and organic (Org) fractions of Trains A
and B were very close to each other. The total results for both Train A and Train B (the Aq and
Org fractions combined for each) are well below the FTRB limit of 2.0 mg. On Sample
evaporation of the first recovery of Train C a very large amount of residue was observed in pan
98 which was used for the C1 Aq sample, and in pan 97 which was used for the C1 Org, but not
as much as pan 98. Not only does the total C1 result (C1 Aq plus C1 Org) exceed the FTRB limit
by over 200 mg, both fractions are above the FTRB limit independently. Figure 16, the Full
Train Inorganic and Organic Results graph shows a comparison of the inorganic and organic
results of each full sampling train using the net average weights. The total train blank results for
each full Method 202 sample, using the net average weights, are shown in Figure 17, the Full
Train Total Combined Inorganic and Organic Results graph. The high results for the C1 samples
are immediately apparent, as is the reduction of those results on successive recoveries.
Figure 16. Full Train Inorganic and Organic Results (Net Average Weights)
0
50
100
150
200
250
A B C1 C2 C3
We
igh
t (m
g)
Full Train Results
Aq
Org
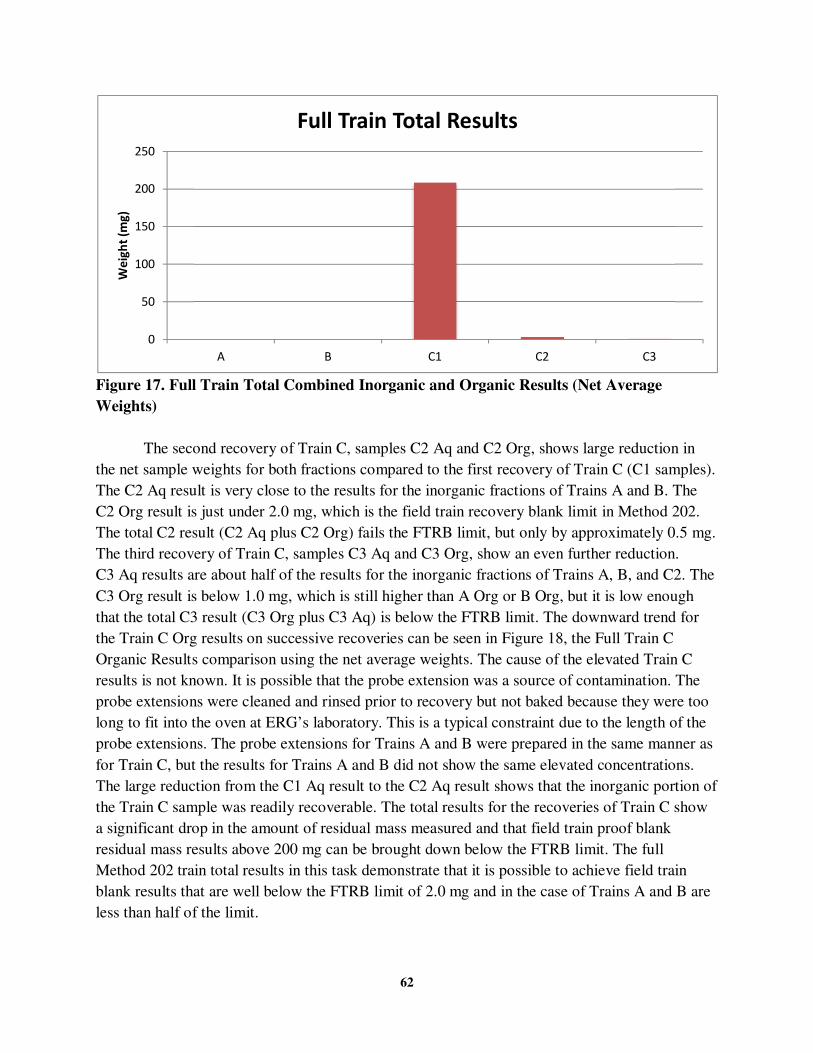
62
Figure 17. Full Train Total Combined Inorganic and Organic Results (Net Average
Weights)
The second recovery of Train C, samples C2 Aq and C2 Org, shows large reduction in
the net sample weights for both fractions compared to the first recovery of Train C (C1 samples).
The C2 Aq result is very close to the results for the inorganic fractions of Trains A and B. The
C2 Org result is just under 2.0 mg, which is the field train recovery blank limit in Method 202.
The total C2 result (C2 Aq plus C2 Org) fails the FTRB limit, but only by approximately 0.5 mg.
The third recovery of Train C, samples C3 Aq and C3 Org, show an even further reduction.
C3 Aq results are about half of the results for the inorganic fractions of Trains A, B, and C2. The
C3 Org result is below 1.0 mg, which is still higher than A Org or B Org, but it is low enough
that the total C3 result (C3 Org plus C3 Aq) is below the FTRB limit. The downward trend for
the Train C Org results on successive recoveries can be seen in Figure 18, the Full Train C
Organic Results comparison using the net average weights. The cause of the elevated Train C
results is not known. It is possible that the probe extension was a source of contamination. The
probe extensions were cleaned and rinsed prior to recovery but not baked because they were too
long to fit into the oven at ERG’s laboratory. This is a typical constraint due to the length of the
probe extensions. The probe extensions for Trains A and B were prepared in the same manner as
for Train C, but the results for Trains A and B did not show the same elevated concentrations.
The large reduction from the C1 Aq result to the C2 Aq result shows that the inorganic portion of
the Train C sample was readily recoverable. The total results for the recoveries of Train C show
a significant drop in the amount of residual mass measured and that field train proof blank
residual mass results above 200 mg can be brought down below the FTRB limit. The full
Method 202 train total results in this task demonstrate that it is possible to achieve field train
blank results that are well below the FTRB limit of 2.0 mg and in the case of Trains A and B are
less than half of the limit.
0
50
100
150
200
250
A B C1 C2 C3
We
igh
t (m
g)
Full Train Total Results
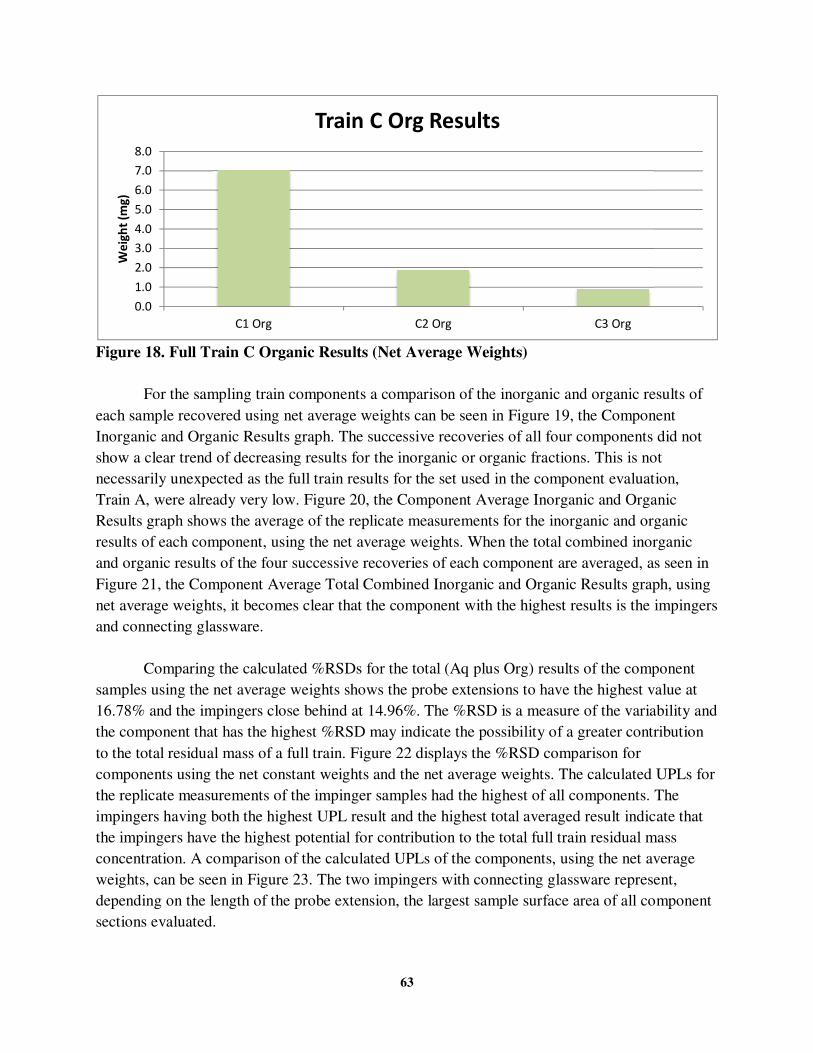
63
Figure 18. Full Train C Organic Results (Net Average Weights)
For the sampling train components a comparison of the inorganic and organic results of
each sample recovered using net average weights can be seen in Figure 19, the Component
Inorganic and Organic Results graph. The successive recoveries of all four components did not
show a clear trend of decreasing results for the inorganic or organic fractions. This is not
necessarily unexpected as the full train results for the set used in the component evaluation,
Train A, were already very low. Figure 20, the Component Average Inorganic and Organic
Results graph shows the average of the replicate measurements for the inorganic and organic
results of each component, using the net average weights. When the total combined inorganic
and organic results of the four successive recoveries of each component are averaged, as seen in
Figure 21, the Component Average Total Combined Inorganic and Organic Results graph, using
net average weights, it becomes clear that the component with the highest results is the impingers
and connecting glassware.
Comparing the calculated %RSDs for the total (Aq plus Org) results of the component
samples using the net average weights shows the probe extensions to have the highest value at
16.78% and the impingers close behind at 14.96%. The %RSD is a measure of the variability and
the component that has the highest %RSD may indicate the possibility of a greater contribution
to the total residual mass of a full train. Figure 22 displays the %RSD comparison for
components using the net constant weights and the net average weights. The calculated UPLs for
the replicate measurements of the impinger samples had the highest of all components. The
impingers having both the highest UPL result and the highest total averaged result indicate that
the impingers have the highest potential for contribution to the total full train residual mass
concentration. A comparison of the calculated UPLs of the components, using the net average
weights, can be seen in Figure 23. The two impingers with connecting glassware represent,
depending on the length of the probe extension, the largest sample surface area of all component
sections evaluated.
0.0
1.0
2.0
3.0
4.0
5.0
6.0
7.0
8.0
C1 Org C2 Org C3 Org
We
igh
t (m
g)
Train C Org Results
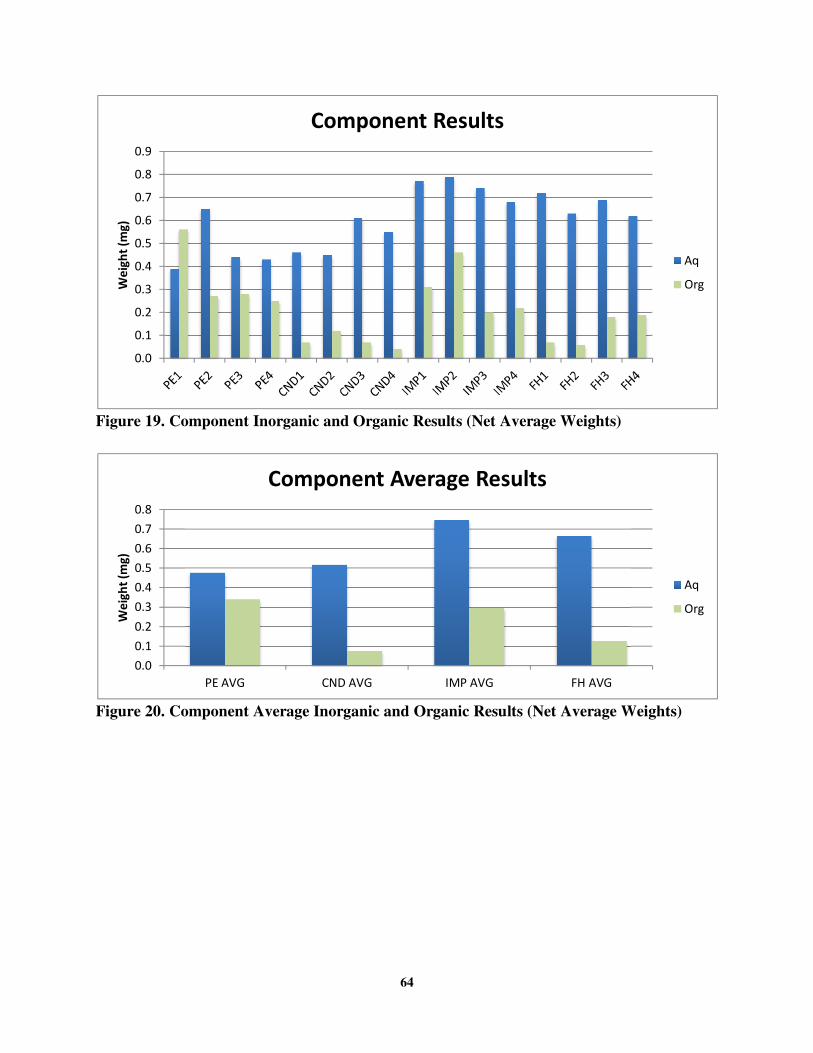
64
Figure 19. Component Inorganic and Organic Results (Net Average Weights)
Figure 20. Component Average Inorganic and Organic Results (Net Average Weights)
0.0
0.1
0.2
0.3
0.4
0.5
0.6
0.7
0.8
0.9
We
igh
t (m
g)
Component Results
Aq
Org
0.0
0.1
0.2
0.3
0.4
0.5
0.6
0.7
0.8
PE AVG CND AVG IMP AVG FH AVG
We
igh
t (m
g)
Component Average Results
Aq
Org
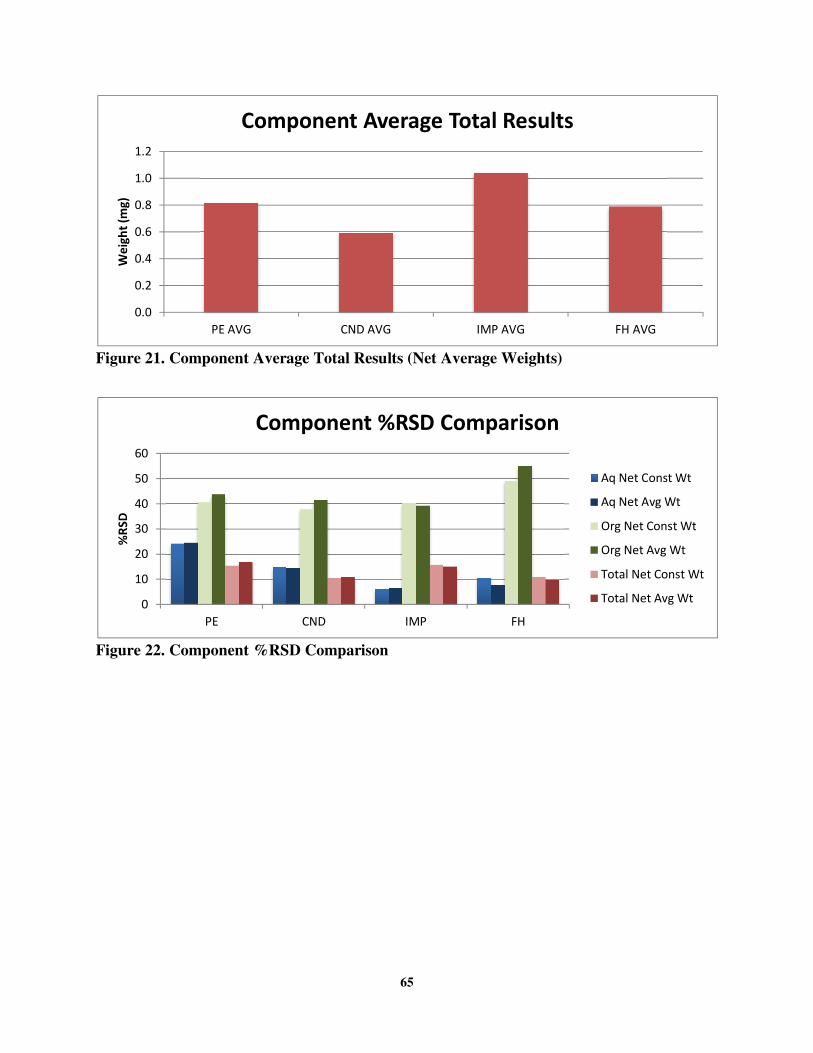
65
Figure 21. Component Average Total Results (Net Average Weights)
Figure 22. Component %RSD Comparison
0.0
0.2
0.4
0.6
0.8
1.0
1.2
PE AVG CND AVG IMP AVG FH AVG
We
igh
t (m
g)
Component Average Total Results
0
10
20
30
40
50
60
PE CND IMP FH
%R
SD
Component %RSD Comparison
Aq Net Const Wt
Aq Net Avg Wt
Org Net Const Wt
Org Net Avg Wt
Total Net Const Wt
Total Net Avg Wt
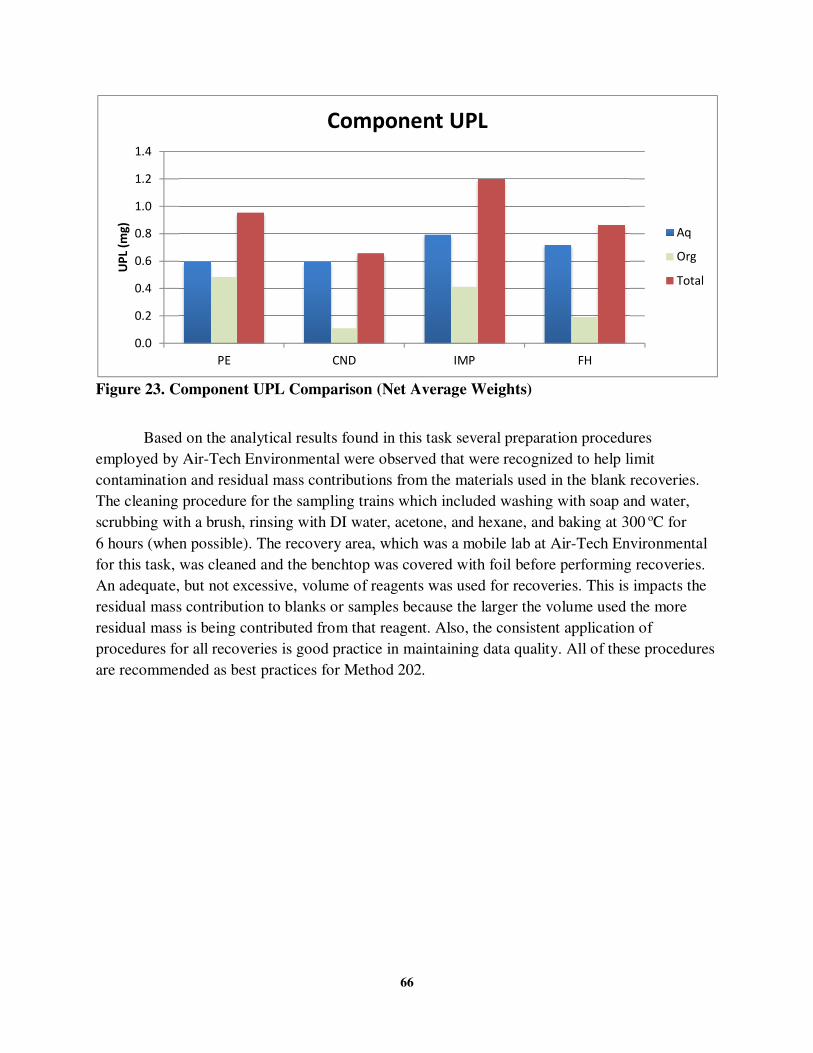
66
Figure 23. Component UPL Comparison (Net Average Weights)
Based on the analytical results found in this task several preparation procedures
employed by Air-Tech Environmental were observed that were recognized to help limit
contamination and residual mass contributions from the materials used in the blank recoveries.
The cleaning procedure for the sampling trains which included washing with soap and water,
scrubbing with a brush, rinsing with DI water, acetone, and hexane, and baking at 300 oC for
6 hours (when possible). The recovery area, which was a mobile lab at Air-Tech Environmental
for this task, was cleaned and the benchtop was covered with foil before performing recoveries.
An adequate, but not excessive, volume of reagents was used for recoveries. This is impacts the
residual mass contribution to blanks or samples because the larger the volume used the more
residual mass is being contributed from that reagent. Also, the consistent application of
procedures for all recoveries is good practice in maintaining data quality. All of these procedures
are recommended as best practices for Method 202.
0.0
0.2
0.4
0.6
0.8
1.0
1.2
1.4
PE CND IMP FH
UP
L (m
g)
Component UPL
Aq
Org
Total
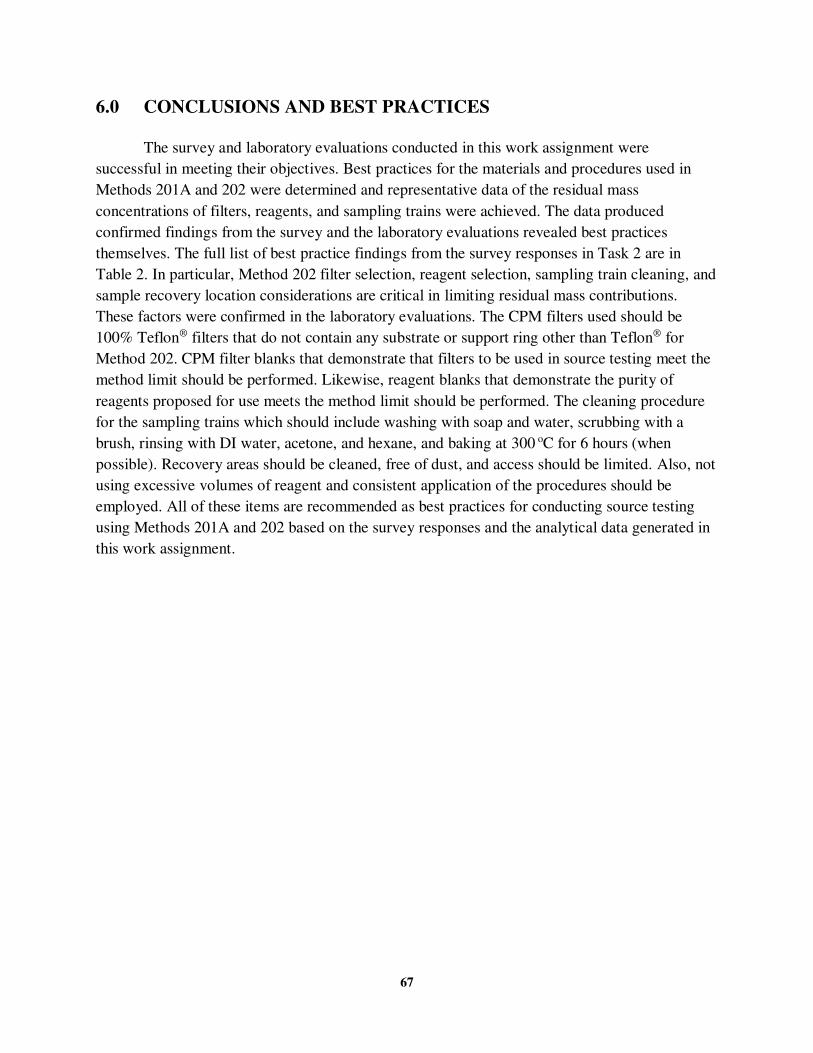
67
6.0 CONCLUSIONS AND BEST PRACTICES
The survey and laboratory evaluations conducted in this work assignment were
successful in meeting their objectives. Best practices for the materials and procedures used in
Methods 201A and 202 were determined and representative data of the residual mass
concentrations of filters, reagents, and sampling trains were achieved. The data produced
confirmed findings from the survey and the laboratory evaluations revealed best practices
themselves. The full list of best practice findings from the survey responses in Task 2 are in
Table 2. In particular, Method 202 filter selection, reagent selection, sampling train cleaning, and
sample recovery location considerations are critical in limiting residual mass contributions.
These factors were confirmed in the laboratory evaluations. The CPM filters used should be
100% Teflon® filters that do not contain any substrate or support ring other than Teflon® for
Method 202. CPM filter blanks that demonstrate that filters to be used in source testing meet the
method limit should be performed. Likewise, reagent blanks that demonstrate the purity of
reagents proposed for use meets the method limit should be performed. The cleaning procedure
for the sampling trains which should include washing with soap and water, scrubbing with a
brush, rinsing with DI water, acetone, and hexane, and baking at 300 oC for 6 hours (when
possible). Recovery areas should be cleaned, free of dust, and access should be limited. Also, not
using excessive volumes of reagent and consistent application of the procedures should be
employed. All of these items are recommended as best practices for conducting source testing
using Methods 201A and 202 based on the survey responses and the analytical data generated in
this work assignment.
68
7.0 REFERENCES
U.S. Environmental Protection Agency Work Assignment 3-07 Contract EP-D-11-006
U.S. Environmental Protection Agency, Washington, D.C., Method 5 – Determination of
Particulate Matter Emissions from Stationary Sources, 40 CFR Part 60 Appendix A, July 1,
1989.
U.S. Environmental Protection Agency, Washington, D.C., Method 202 – Dry Impinger Method
for Determining Condensable Particulate Emissions from Stationary Sources, 40 CFR Part 51
Appendix M, December 8, 2010.

69
8.0 APPENDIX
ERG Standard Operating Procedure for Gravimetric Determination for Particulate
Emissions Measurements (ERG-MOR-002)
CONFIDENTIAL Standard Operating Procedure Procedure Number: ERG-MOR-002 Revision Number: 4 Revision Date: May 14, 2013 Page: 2 of 11
2.2 Applicability
This SOP is applicable to all gravimetric procedures performed by ERG personnel requiring particulate emissions measurements.
3.0 INTERFERENCES
Impurities in the reagents may interfere with results. Refer to the specific method for more information.
4.0 SAFETY
Normal laboratory safety procedures will apply. 5.0 MATERIALS AND APPARATUS
5.1 Desiccator.
5.2 Analytical Balance. Used to measure within 0.0002 g for all weight determinations (0.00001 g for Particle Size Distribution [PSD] determinations).
5.3 Beakers. 150 mL or 250 mL. (150 mL beakers stabilize faster on an analytical
balance.
5.4 Hygrometers. Used to measure the relative humidity of the laboratory equipment room.
5.5 Temperature Gauge. Used to measure the temperature of the laboratory
equipment room.
5.6 Wash Bottles. Teflon7 bottles are recommended. Polyethylene wash bottles may be used at the option of the tester. It is recommended that acetone not be stored in polyethylene bottles for longer than a month.
5.7 Petri Dishes. For filters, glass or polyethylene, unless otherwise specified by the
Project Manager (PM).
5.8 Oven. Temperature of 105EC needs to be achieved. 5.9 Weighing Pans. Aluminum dishes for weighing samples.
CONFIDENTIAL Standard Operating Procedure Procedure Number: ERG-MOR-002 Revision Number: 4 Revision Date: May 14, 2013 Page: 3 of 11
5.10 Class “S” Weights. Used for checking the calibration of the balance.
6.0 REAGENTS
6.1 Acetone. Reagent grade. <0.001% residue, in glass bottles, is required. Acetone from metal containers generally has a high residue blank and should not be used. Sometimes suppliers transfer acetone to glass bottles from metal containers; thus, acetone blanks shall be run prior to field use and only acetone with low blank values (<0.001%) shall be used. The EPA specifies that in no case shall a blank value of greater than 0.001% of the weight of acetone used be subtracted from the sample weight (e.g., A 100 mL blank will need to weigh less than 0.001 gram).
6.2 Desiccant. Anhydrous calcium sulfate, indicating type. Alternatively, other types
of desiccants may be used, subject to the approval of the Task Leader or the PM. 7.0 DEFINITIONS
7.1 Constant Weight. The constant weight is considered as the agreement between successive readings, with no less than six hours between readings, i.e., a 0.0005 g change from previous weighing for solids and ambient air filters and a 0.00005 g change for stationary source PSD (47 mm) filters.
7.2 Final Weight. The final weight is considered the last reading taken after a
constant weight is established. Do not use the average constant weight. 8.0 PROCEDURES
Record balance room relative humidity and temperature each time gravimetric measurements are made. Check the level of the balance with the bubble meter located on the balance.
The balance calibration is checked using class AS@ calibration weights. Check calibration of the balances with weights that bracket the sample weight (e.g., a 1.5 gram sample should have a calibration range of 0.5, 1.0, and 2.0 gram weights). Record the calibration check in the appropriate logbook or notebook. When performing the calibration check, a deviation of more than "0.0002 grams at any weight level will require that the zero be checked or balance maintenance. Acceptable deviation for a 5 place balance is #0.00005g. For stationary source samples, all fractions (i.e., filters, thimbles, etc.) are initially tare weighed. After sampling, acetone fractions are evaporated and cooled. All fractions
CONFIDENTIAL Standard Operating Procedure Procedure Number: ERG-MOR-002 Revision Number: 4 Revision Date: May 14, 2013 Page: 4 of 11
used in the method are then reweighed to a constant weight to determine the final particulate matter.
Before filters or thimbles are used in sampling methods, they should be visually inspected against light for irregularities and flaws or pinhole leaks. Label the shipping containers (glass or plastic petri dishes, or the outside of the thimble). Keep the filters and thimbles in these containers at all times except during sampling and weighing.
Desiccate the filters, thimbles, beakers, or pans at 20 " 5.6EC (68 " 10EF) and ambient pressure for at least 24 hours and weigh at intervals of at least 6 hours to a constant weight, i.e., 0.0005 g change (0.00005 g change for PSD determination) from previous weighing. Record results to the nearest 0.0001 g (0.00001 g for PSD determination.) During each weighing, the filter, thimble, beaker or pan must not be exposed to the laboratory atmosphere for a period greater than 2 minutes and a relative humidity above 50 percent.
Alternatively, the filters, thimbles, or beakers may be oven dried at 105EC (220EF) for 2 to 3 hours, desiccated for 2 hours, and weighed. Procedures other than those described, which account for relative humidity effects, may be used, subject to the approval of the Task Leader and/or PM.
The oven may not be used with any other type of sample besides particulate determination (i.e., silica gel, chemical compounds, etc., are not allowed in this oven).
8.1 EPA Method 5 Analysis
Record the data required on a sheet for initial and final weights as shown in Figure 1 and 2. A final weight should be determined on the filter and an acetone probe rinse for each sampling run.
At the option of the tester, the contents of the acetone container may be
evaporated at temperatures higher than ambient. If evaporation is done at an elevated temperature, the temperature must be below the boiling point of the solvent. Also, to prevent Abumping@, the evaporation process must be closely supervised, and the contents of the beaker must be swirled occasionally to maintain an even temperature.
Use extreme care, as acetone is highly flammable and has a low flash point.
CONFIDENTIAL Standard Operating Procedure Procedure Number: ERG-MOR-002 Revision Number: 4 Revision Date: May 14, 2013 Page: 5 of 11
8.2 EPA Method 17 Analysis
Record the data required on a sheet for initial and final weights as shown in Figures 1 and 3. A final weight should be determined on the filter and the acetone probe rinse for each sampling run. The tester may combine acetone and the filter by transferring the contents of the acetone into a tared 150 mL beaker and evaporating to dryness. After the acetone is dry, the respective filter can be placed into the beaker, and the combined sample can be desiccated and weighed to a constant weight. The weight of the particulate would be determined by subtracting the sum of the initial filter and beaker weights from the final weight.
8.3 Particle Size Distribution Sampling Method Analysis
Record the data required on a sheet for initial and final weights as shown in Figures 1 and 2. A final weight should be determined on each filter in the filter set and on the acetone probe rinse for each sampling run. Acetone probe rinses can be evaporated to dryness in pre-weighed 100m to aluminum baking tins.
8.4 Air Pollution Sampling Method Analysis (High Volume (HiVol) Ambient Air
Filters)
To weigh the 8 x 10" filters, the balance needs to be equipped with a large area weighing chamber. The Satorius LA 120S in the ERG laboratory's Balance Room is equipped with this device.
Before beginning calibration, insert the filter weighing stand. Check the leveling of the balance. If necessary, adjust with leveling feet of the chamber.
Calibration is performed as explained in Section 8.0.
Ambient filters are equilibrated for 24 hours under balance room conditions prior to weighing. To weigh samples, check that the balance and filter support are tarred to zero. Open the chamber door and slide in the filter paper onto the weighing support, placing the filter behind the front support rod so that is rests on the three back support rods. Close the chamber door. Weigh the filter paper.
Record the data required on a sheet for initial and final weights as shown in Figures 1 and 4. Handle each sample as explained in 40 CFR 50, Appendix J, Section 9.16 - 9.17.
CONFIDENTIAL Standard Operating Procedure Procedure Number: ERG-MOR-002 Revision Number: 4 Revision Date: May 14, 2013 Page: 6 of 11 8.5 EPA Method 202 Analysis
Samples generated from the recovery of Method 202 sampling trains and filters using water, acetone, and hexane will be evaporated to dryness in tared aluminum weighing pans. Reagent blanks will likewise be evaporated to dryness in weighing pans. The pans will be desiccated for 24 hours and then weighed to constant weight.
9.0 QUALITY CONTROL
Data sheets should serve as a checklist for proper operating procedures. All entries should be completed in full. Any abnormalities encountered during collection, recovery, or analysis of the sample should be documented to assist in the interpretation of the data.
Each time a balance calibration is checked, the actual and determined weight must be recorded in a Calibration Logbook located beside each balance. Each entry should be initialed and dated.
Perform balance zero check to ensure the balance returns to zero between samples. Temperatures above 29EC (85EF) and relative humidities above 50% can affect the balance operation and accuracy. Therefore, the temperature and humidity should be included in the Analysis Logbook.
Balances are serviced and calibrated with NIST traceable weights annually by a service representative. A Certificate of Weight Verification is kept on file by the QA Coordinator.
10.0 DOCUMENTATION
Personnel will follow required documentation procedures and maintain complete and accurate records. All data should be recorded in a notebook.
11.0 REFERENCES
U.S. Environmental Protection Agency, Washington, D.C., Method 5 - Determination of Particulate Emissions from Stationary Sources, 40 CFR Ch. 1, July 1, 1989.
U.S. Environmental Protection Agency, Washington, D.C., Method 17 - Determination of Particulate Emissions from Stationary Sources (In-Stack Filtration Method), 40 CFR Ch. 1, July 1, 1989.
CONFIDENTIAL Standard Operating Procedure Procedure Number: ERG-MOR-002 Revision Number: 4 Revision Date: May 14, 2013 Page: 7 of 11
U.S. Environmental Protection Agency, Washington, D.C., Method 202 – Dry Impinger Method for Determining Condensable Particulate Emissions from Stationary Sources, 40 CFR Ch. 1, July 1, 1989.
Balfour, W.D., Procedures for the Determination of Particle Size Distributions using an In-Stack Cascade Impactor, Radian Corporation, Austin, Texas, August 1980.
Andersen 2000 Inc., Operating Manual for Andersen 2000 Inc., Mark II and Mark III, Particle Sizing Stack Samplers, Andersen 2000 Inc, Atlanta, Georgia, January, 1976.
EPA Methods, Code of Federal Regulations, Title 40, Part 50, Appendix J. October 16, 1992.
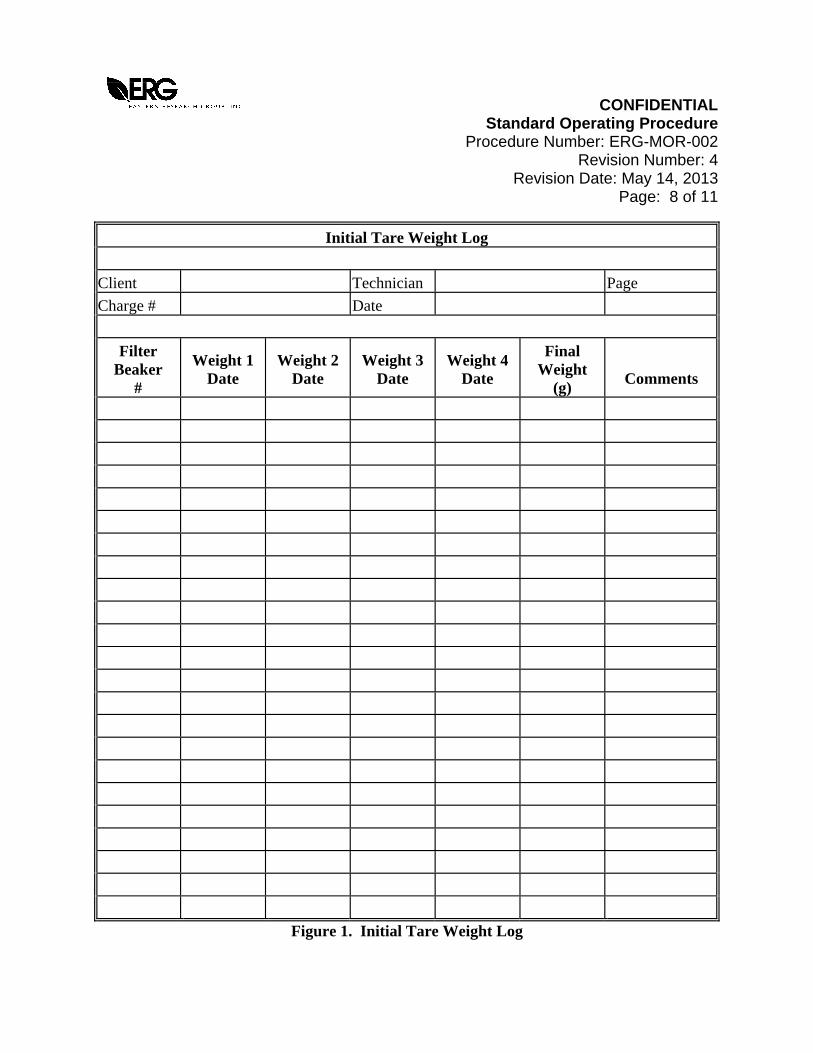
CONFIDENTIAL Standard Operating Procedure Procedure Number: ERG-MOR-002 Revision Number: 4 Revision Date: May 14, 2013 Page: 8 of 11
Initial Tare Weight Log Client
Technician
Page
Charge # Date
Filter
Beaker #
Weight 1
Date
Weight 2
Date Weight 3
Date Weight 4
Date
Final Weight
(g)
Comments
Figure 1. Initial Tare Weight Log
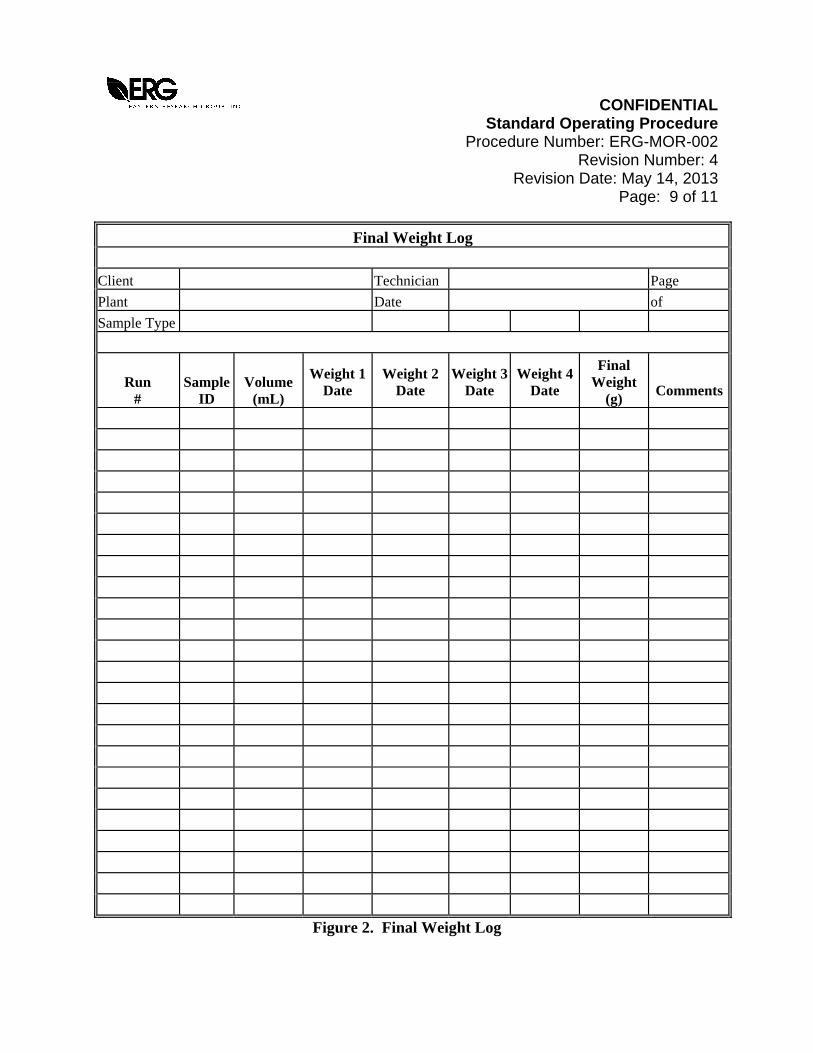
CONFIDENTIAL Standard Operating Procedure Procedure Number: ERG-MOR-002 Revision Number: 4 Revision Date: May 14, 2013 Page: 9 of 11
Final Weight Log Client
Technician
Page
Plant Date
of
Sample Type
Run #
Sample ID
Volume (mL)
Weight 1
Date Weight 2
Date Weight 3
Date Weight 4
Date
Final
Weight (g)
Comments
Figure 2. Final Weight Log
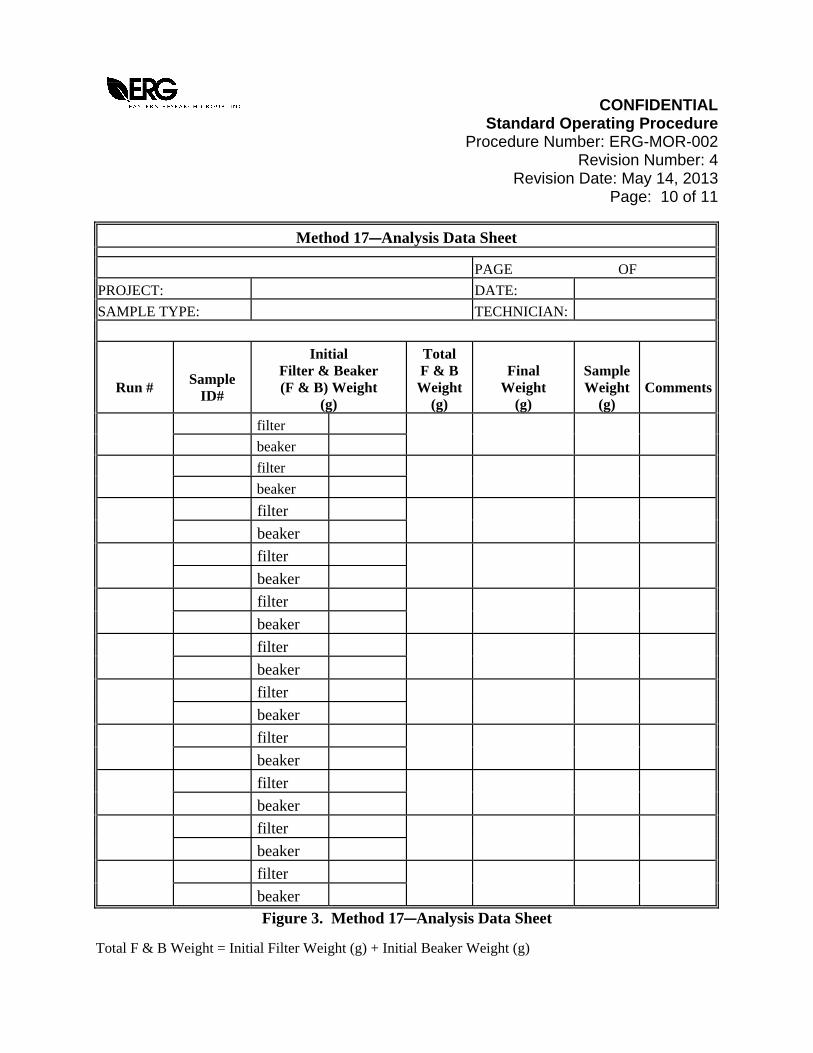
CONFIDENTIAL Standard Operating Procedure Procedure Number: ERG-MOR-002 Revision Number: 4 Revision Date: May 14, 2013 Page: 10 of 11
Method 17CAnalysis Data Sheet PAGE OF PROJECT:
DATE:
SAMPLE TYPE: TECHNICIAN:
Run #
Sample ID#
Initial
Filter & Beaker (F & B) Weight
(g)
Total F & B Weight
(g)
Final
Weight (g)
Sample Weight
(g)
Comments
filter
beaker
filter
beaker
filter
beaker
filter
beaker
filter
beaker
filter
beaker
filter
beaker
filter
beaker
filter
beaker
filter
beaker
filter
beaker
Figure 3. Method 17CAnalysis Data Sheet
Total F & B Weight = Initial Filter Weight (g) + Initial Beaker Weight (g)
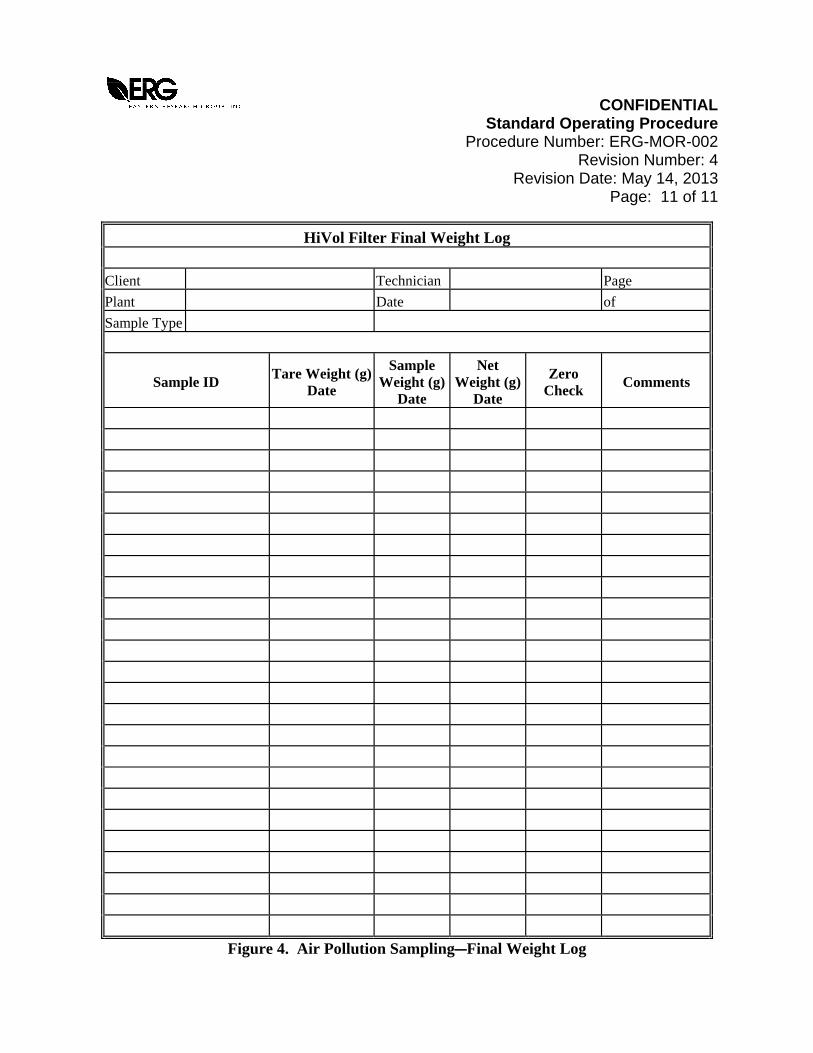
CONFIDENTIAL Standard Operating Procedure Procedure Number: ERG-MOR-002 Revision Number: 4 Revision Date: May 14, 2013 Page: 11 of 11
HiVol Filter Final Weight Log
Client
Technician
Page
Plant Date
of
Sample Type
Sample ID
Tare Weight (g)
Date
Sample Weight (g)
Date
Net Weight (g)
Date
Zero Check
Comments
Figure 4. Air Pollution SamplingCFinal Weight Log