Embed Size (px)
Citation preview
Methionine restriction effects on 11b-HSD1 activity and
lipogenic/lipolytic balance in F344 rat adipose tissue
Carmen E. Perrone,1 Dwight A. L. Mattocks, George Hristopoulos, Jason D. Plummer,Rozlyn A. Krajcik, and Norman Orentreich
Orentreich Foundation for the Advancement of Science, Inc., Cold Spring-on-Hudson, NY 10516
Abstract Methionine restriction (MR) limits age-relatedadiposity in Fischer 344 (F344) rats. To assess the mech-anism of adiposity resistance, the effect of MR on adiposetissue (AT) 11b-hydroxysteroid dehydrogenase-1 (11b-HSD1) was examined. MR induced 11b-HSD1 activity inall ATs, correlating with increased tissue corticosterone.However, an inverse relationship between 11b-HSD1 activ-ity and adipocyte size was observed. Because dietary restric-tion controls lipogenic and lipolytic rates, MR’s effects onlipogenic and lipolytic enzymes were evaluated. MRincreased adipose triglyceride lipase and acetyl-coenzymeA carboxylase (ACC) protein levels but induced ACCphosphorylation at serine residues that render the enzymeinactive, suggesting alterations of basal lipolysis andlipogenesis. In contrast, no changes in basal or phosphor-ylated hormone-sensitive lipase levels were observed. ACC-phosphorylated sites were specific for AMP-activatedprotein kinase (AMPK); therefore, AMPK activation wasevaluated. Significant differences in AMPKa protein,phosphorylation, and activity levels were observed only inretroperitoneal fat from MR rats. No differences in proteinkinase A phosphorylation and intracellular cAMP levels weredetected. In vitro studies revealed increased lipid degrada-tion and a trend toward increased lipid synthesis, suggestingthe presence of a futile cycle. In conclusion, MR disruptsthe lipogenic/lipolytic balance, contributing importantly toadiposity resistance in F344 rats.—Perrone, C. E., D. A. L.Mattocks, G. Hristopoulos, J. D. Plummer, R. A. Krajcik, andN. Orentreich. Methionine restriction effects on 11b-HSD1activity and lipogenic/lipolytic balance in F344 rat adiposetissue. J. Lipid Res. 2008. 49: 12–23.
Supplementary key words adiposity & glucocorticoid metabolism &signal transduction pathways & 11b-hydroxysteroid dehydrogenase-1
Dietary restriction of the essential amino acid methio-nine increases longevity in Fischer 344 (F344) rats andBaLB/cl3C57BL/6J F1 mice (1, 2). Like other dietaryregimens leading to increased lifespan (3, 4), methioninerestriction (MR) imposed early in life reduces body weightgain rates (5). Also, MR limits age-related increases in adi-
pose tissue (AT) mass, as indicated by reduced serum leptinand increased adiponectin levels (5), which are tightly cor-related with adiposity (6, 7). Moreover, no increase in ATweight is observed in rats fed an energy-dense MR diet (1),suggesting that MR rats are resistant to obesity.
AT mass is tightly modulated by diet, energy expendi-ture, hormones, and tissue-specific regulators (reviewed inRefs. 8–10). Among the hormones involved in adiposityare glucocorticoids, which induce the transcription of theCCAAT enhancer binding proteins a, b, and y, leading toincreased expression of the peroxisome proliferator-activated receptor g (PPARg), an important transcriptionfactor involved in adipogenesis and lipogenesis (11).
Glucocorticoid-mediated effects in target tissues de-pend on both circulating and tissue concentrations ofactive hormone (12), which are regulated by the 11b-hydroxysteroid dehydrogenase (11b-HSD) enzymes (13,14). 11b-HSD1 is a reductase involved in the conversion ofinactive glucocorticoids (cortisone and dehydrocortico-sterone in humans and rodents, respectively) to theirrespective active forms (cortisol and corticosterone); 11b-HSD2 exerts the opposite effect (13, 14). Inactivation of11b-HSD2, leading to increased active serum glucocorti-coid levels (as in Cushing’s syndrome), or overexpressionof 11-bHSD1 in AT results in obesity (13, 15–17) andimplicates glucocorticoids in the onset of central obesityand the metabolic syndrome (18, 19).
Adiposity is a complex process involving preadipocyteproliferation and differentiation as well as adipocytehypertrophy. Moreover, adipocyte hypertrophy is deter-mined by the balance between lipogenic and lipolyticenzymes. Insulin promotes the expression of lipogenicenzymes by activating sterol-regulatory element binding
Manuscript received 23 April 2007 and in revised form 27 August 2007 andin re-revised form 25 September 2007.
Published, JLR Papers in Press, October 1, 2007.DOI 10.1194/jlr.M700194-JLR200
Abbreviations: ACC, acetyl-coenzyme A carboxylase; AMPK, AMP-activated protein kinase; AT, adipose tissue; ATGL, adipose triglyceridelipase; CF, control fed; F344, Fischer 344; 11b-HSD, 11b-hydroxysteroiddehydrogenase; HSL, hormone-sensitive lipase; IGF-1, insulin-likegrowth factor-1; MR, methionine restriction; PKA, protein kinase A;PPARg, peroxisome proliferator-activated receptor g; SAMS peptide,substrate for AMPK-activated protein kinase; Ser, serine; SREBP-1c,sterol-regulatory element binding protein-1c; Thr172, threonine 172.
1 To whom correspondence should be addressed.e-mail: [email protected]
Copyright D 2008 by the American Society for Biochemistry and Molecular Biology, Inc.
This article is available online at http://www.jlr.org12 Journal of Lipid Research Volume 49, 2008
at Health S
cience Library CB
#7585, on May 18, 2011
ww
w.jlr.org
Dow
nloaded from
protein-1c (SREBP-1c), inhibits the expression of lipolyticenzymes (20), and prevents lipolysis by inhibiting adenylatecyclase (reviewed in Ref. 21). In contrast to insulin,glucagon and catecholamines activate the as subunit ofG-protein, which stimulates adenylate cyclase activity andcAMP synthesis (reviewed in Ref. 22). cAMP activatesprotein kinase A (PKA), which phosphorylates hormone-sensitive lipase (HSL) and perilipin, allowing their associa-tion to the lipid vacuole and the catalysis of triacylglyceridesinto diacylglycerides (reviewed in Ref. 23).
Although HSL has been considered the key lipolyticenzyme, HSL knockout experiments revealed the pres-ence of another lipolytic enzyme involved in the break-down of triacylglycerides, adipose triglyceride lipase(ATGL) (24). Unlike HSL, ATGL expression is alteredby nutritional regulation (20), and its inactivationincreases AT mass and renders mice incapable of coldadaptation, suggesting the importance of this enzyme inthe maintenance of energy balance (25).
Another mechanism controlling the lipogenic/lipolyticbalance involves the allosteric regulation of acetyl-coen-zyme A carboxylase (ACC). The ACC-1 isoform located inthe cytosol synthesizes malonyl-CoA, which is required forfatty acid synthesis (26, 27). Malonyl-CoA produced by theACC-2 isoform, which is located on the outer mitochondriamembrane, inhibits fatty acid oxidation through inhibitionof the mitochondrial carnitine palmitoyl transferase-1 (26,27). Thus, downregulation of ACC protein levels or activity,either by allosteric ligands or by AMP-activated proteinkinase (AMPK)-mediated phosphorylation, shifts lipogene-sis to fatty acid oxidation (26, 27).
Although glucocorticoids have been associated exten-sively with increased obesity, they can also play a role inlipolysis. Administration of glucocorticoids to adult ratswas reported to reduce FAS and ACC activity in AT (28).Exposure of AT to the synthetic glucocorticoid dexameth-asone amplifies cAMP responses (29) and induces thephosphorylation and activation of HSL (30, 31). More-over, ATGL activity can be induced by dexamethasonethrough a cAMP-independent mechanism in 3T3-L1 cells(32). Thus, glucocorticoids could potentially change ATmass by regulating signaling mechanisms that controllipogenic and lipolytic enzymes.
The objective of this study was to assess the mecha-nism(s) involved in MR-mediated adiposity resistance.Specifically, the correlation between 11b-HSD1 activity,glucocorticoid levels, and adipocyte size was evaluated.Furthermore, the effects of MR on lipogenic and lipolyticenzymes and on the activation of regulatory proteins thatcontrol the lipogenic/lipolytic balance were examined.
METHODS
All studies were reviewed and approved by the OrentreichFoundation for the Advancement of Science, Inc., InstitutionalAnimal Care and Use Committee and performed in accordancewith the National Institutes of Health guidelines for the use ofanimals in research laboratories.
Materials
Purina rat chow containing 0.17% and 0.86% methioninewas purchased from Dyets, Inc. (Bethlehem, PA). Insulin andadiponectin RIA kits were obtained from Linco Research/Millipore (Billerica, MA). TLC silica gel plates (0.25 mm thickwith fluorescent F254 indicator) were obtained from FisherScientific (Pittsburgh, PA). Corticosterone and 11-hydroxycorti-costerone were purchased from Steraloids, Inc. (Newport, RI).Radiolabeled [1,2,6,7-3H]corticosterone (86 mCi/mmol) wasfrom Amersham/GE Healthcare (Piscataway, NJ). Protease andphosphatase inhibitor cocktails were from Pierce (Milwaukee,WI). Substrate for AMPK-activated protein kinase (SAMS peptide)was purchased from Upstate (Lake Placid, NY). [g-32P]ATP wasobtained from MP Biomedicals (Solon, OH). Type I collagenasewas purchased from Worthington Biochemical Co. (Lakewood,NJ). All other chemicals were obtained from Sigma-Aldrich(St. Louis, MO), except as specified otherwise.
Animal husbandry and tissue collection
Four week old male F344 rats obtained from Taconic Farms(Germantown, NY) were maintained two rats per cage on a 12 hlight/dark cycle and fed a standard control diet for 2 weeks. At6 weeks of age, the rats were randomly assigned to control or MRdiets. Food and water were provided ad libitum. After completionof the dietary regimen, the rats were anesthetized using anEuthenex Easy Anesthesia system (Palmar, PA) and blood wascollected from the subclavian vein. ATs (inguinal, epididymal,retroperitoneal, and mesenteric) were then collected fromcontrol fed (CF) and MR rats, weighed, frozen immediately inliquid nitrogen, and stored at 270jC or fixed in 10% phosphate-buffered formalin for histological analysis. CF and MR rats werenot fasted before tissue collection. Tissues were collected at 1, 2,5, 7, 14, 21, 30, and 90 days for studies examining the effects ofMR on 11b-HSD1 activity. Because AT weight-body weight ratiosare reduced significantly by 3 months in MR, all other studieswere conducted with AT samples collected at this time point.
Serum metabolite determinations
Serum insulin, adiponectin, and corticosterone levels weremeasured using commercially available rat RIA kits (LincoResearch/Millipore and MP Biomedicals) according to themanufacturer’s instructions. Triglycerides, cholesterol, and glu-cose were determined using a Beckman Synchron CX5 clinicalsystem (La Brea, CA). Free fatty acids were measured colori-metrically using a nonesterified fatty acid kit (Zen-Bio, Inc.,Research Triangle Park, NC).
11b-HSD1 enzyme assay
AT was homogenized in 250 mM sucrose and 10 mM sodiumphosphate buffer, pH 7.0 (4 ml/g) using a Potter-Elvehjemhomogenizer. The homogenate was centrifuged at 750 g for30 min to precipitate the nuclear fraction and cellular debris, andthe infranatant was collected and stored at 270jC until assayed.Protein levels in the infranatant were determined using theLowry protein assay.
11b-HSD1 activity was measured using a modification of theprocedure reported by Lakshmi and Monder (33). Fifty micro-grams of infranatant protein was added to an assay mixtureconsisting of 100 mM Tris-HCl, pH 8.5, 250 mM NADP1, and20 mM [1,2,6,7-3H]corticosterone and preincubated at 37jC for10 min. The reaction was carried out for 60 min at 37jC andstopped with ethyl acetate. After vigorous vortexing, the organicand aqueous phases were separated by centrifugation at 1,200 gfor 5 min at 4jC. The organic layer was collected, dried under
Effect of MR F344 rat AT 13
at Health S
cience Library CB
#7585, on May 18, 2011
ww
w.jlr.org
Dow
nloaded from
nitrogen, and reconstituted in 50 ml of ethyl acetate containing20 mg each of unlabeled corticosterone and 11-dehydrocortico-sterone. The samples were spotted onto TLC plates and devel-oped in chloroform-methanol (92:8, v/v). Corticosterone and11-dehydrocorticosterone spots were visualized by ultraviolet de-tection and scraped, and their radioactivity was measured usinga Packard 1900R scintillation counter (Perkin-Elmer, Wellesley,MA). Values are expressed as means 6 SEM of four to six samplesanalyzed in duplicate for each tissue and time point.
AT corticosterone measurements
Corticosterone was extracted from AT (n 5 5) using themethod described by Iglesias et al. (34). Briefly, AT washomogenized in 1 mM NaOH (2 g/ml) and the homogenatewas extracted with an equal volume of water-saturated ethylacetate for 10 min at room temperature. After centrifugation at16,000 g for 10 min, the upper ethyl acetate-containing fractionwas collected and dried under nitrogen at 50jC. The driedmaterial was resuspended in 500 ml of acetonitrile and extractedwith 2 volumes of hexane. The acetonitrile (bottom) layer wasdried under nitrogen and stored at 220jC. Using this method,the average corticosterone recovery, determined following therecovery of [3H]corticosterone radioactivity in ethyl acetate frac-tions from AT homogenates, was 78%. Levels of corticosteronein tissue extracts were determined by RIA as specified above.
Histology
AT fixed in 10% phosphate-buffered formalin was paraffin-embedded, sectioned at 10 mm, and stained with hematoxylinand eosin. AT sections were photographed using a Panasonicwv-CL324 camera adapted to a Nikon Diaphot microscope. Cells(n 5 150) were counted from three randomly selected fields foreach fat depot per rat (n 5 3–4), and their areas were measuredusing Scion Image software (version 1.32; Frederick, MD).
Western blots
AT was homogenized in 10% sucrose, 5 mM EDTA, 6 mMMgCl2, and 50 mM Tris-HCl buffer, pH 7.2, containing phos-phatase and protease inhibitors using a Polytron-type homoge-nizer. After homogenization, the tissue was sonicated andcentrifuged at 10,000 g for 10 min at 4jC. The infranatant wascollected and stored at 270jC. Protein content was determinedusing the BCA protein assay kit (Pierce, Milwaukee, WI).
For most markers examined (except for ACC and pACC),20 mg of protein was electrophoresed on SDS-PAGE gels andthen transferred to polyvinylidene difluoride membranes (Bio-Rad, Hercules, CA). For ACC and pACC determinations, theprotein was fractionated using a 3–8% Tris-acetate gradient gel.The membranes were blocked with 5% fat-free milk in TBS-0.1%Tween and then incubated with the appropriate antibodies. Anti-ATGL (1:1,000) and anti-HSL (1:200) antibodies were purchasedfrom Cayman Chemical (Ann Arbor, MI). Antibodies againstPKA C-a (1:1,000), phospho-PKA C [threonine 197 (Thr197); 1:1000], ACC (1:1,000), phospho-ACC [serine 79 (Ser79); 1:1,000]and phospho-AMPK (pAMPKa; 1:1,000) were from Cell SignalingTechnology, Inc. (Danvers, MA). AMPKa antibody (1:1,000–1:2,000) was from Upstate. Anti-b-actin antibody (1:20,000) wasobtained from Sigma-Aldrich. Horseradish peroxidase-conjugatedanti-rabbit IgG (1:5,000–1:100,000) and anti-mouse IgG(1:20,000) (Bio-Rad) were used as secondary antibodies. Theimmunoblots were developed using the West Pico enhancedchemiluminescence kit (Pierce), except for pAMPKa immuno-blots, which were developed with the West Femto detection kit(Pierce). The density of bands on X-ray films was analyzed using theUn-Scan-it gel digitizing software (Silk Scientific, Inc., Orem, UT).
Protein levels were standardized against b-actin levels, and the dataare expressed as means 6 SEM of four to five individual samples.
AMPK assay
AMPK activity was determined using a modification of theprotocol reported by Stapleton et al. (35). AT was homogenizedat 4jC in lysis buffer consisting of 50 mM Tris-HCl, pH 7.4,250 mM sucrose, 1 mM EGTA, 1 mM EDTA, 25 mM sodium fluo-ride, 10 mM sodium pyrophosphate, 1 mM DTT, 1 mM benza-midine, 200 mM PMSF, and a protease inhibitor cocktail (Pierce).The homogenate was centrifuged at 12,000 g for 20 min at 4jCand the supernatant was collected. Considering reports by Parket al. (36) showing a lack of activity in immunopurified AMPKfrom AT, AMPK assays were conducted using precipitated pro-tein. Proteins were precipitated from the 12,000 g supernatantfor 30 min at 4jC with 35% (w/v) ammonium sulfate followedby centrifugation at 45,000 g for 30 min at 4jC in a BeckmanL8-C1 centrifuge. The protein pellet was resuspended in lysisbuffer and stored at 270jC until assayed. Protein content wasdetermined using the BCA protein assay kit.
AMPK activity was followed in an assay mixture consisting of40 mM HEPES, pH 7.0, 80 mM NaCl, 8% glycerol, 0.8 mM DTT,5 mM MgCl2, 0.2 mM AMP, 0.2 mM ATP, 0.2 mM SAMS peptide,and precipitated protein in a 20 ml final volume. For each sam-ple, reactions were conducted in duplicate and in the presenceor absence of substrate. The assay mixture was incubated at 37jCfor 10 min, and the reaction was stopped by spotting an aliquotof assay mixture onto p81 Whatman filter paper and placing thefilter paper in 1% phosphoric acid. The filters were rinsed sixtimes in 1% phosphoric acid (30 min rinses) and once in acetonefor 5 min. After the acetone rinse, the filters were air-dried andplaced in scintillation counter fluid. 32P Incorporation into theSAMS peptide was measured using a Packard 1900R scintillationcounter (Perkin-Elmer).
cAMP measurements
Frozen AT (n 5 5) was homogenized in 5 volumes (ml/gtissue) of ice-cold 5% TCA using a Polytron-type homogenizer.The homogenate was centrifuged at 1,500 g for 10 min, and thesupernatant was collected and extracted three times with water-saturated ether. The ether fraction was discarded and theresidual ether in the aqueous fraction was removed by heatingat 70jC for 10 min. cAMP in the aqueous fraction was measuredby enzyme immunoassay (Cayman Chemical) according to themanufacturer’s procedure.
Lipid synthesis and degradation studies
Lipid synthesis and degradation studies were conducted usingisolated epididymal mature adipocytes. AT (n 5 4) from CF andMR rats was rinsed with modified Krebs-Ringer bicarbonatebuffer, pH 7.4, containing 4% NEFA-free BSA and 3 mM glucose,then minced and digested in collagenase buffer consisting of50 mM HEPES, 100 mM NaCl, 5.5 mM D-glucose, 5.4 mM KCl,15 mM NaHCO3, 6 mM CaCl2, 4% NEFA-free BSA, and 400 U/mlcollagenase type I at 37jC and 5% CO2 atmosphere. The cellswere filtered through 200 mm nylon mesh, and mature adi-pocytes were separated from preadipocytes by buoyancy. Theinfranatant containing preadipocytes was discarded, and themature adipocytes were rinsed three times with modified Krebs-Ringer bicarbonate buffer and counted.
Lipolysis was determined by evaluating fatty acid and glycerolrelease into the medium (37). Mature adipocytes were incubatedat 37jC and 5% CO2 for 1 h in modified Krebs-Ringer bicarbonatebuffer containing 1 U/ml adenosine deaminase in the presence orabsence of 1025 M isoproterenol. After the incubation period, the
14 Journal of Lipid Research Volume 49, 2008
at Health S
cience Library CB
#7585, on May 18, 2011
ww
w.jlr.org
Dow
nloaded from
adipocyte suspensions were placed on ice and immediatelycentrifuged at 3,500 g for 5 min at 4jC. The infranatants werecollected and stored at 220jC until analyzed. Fatty acid releasedinto the medium was measured using a NEFA detection kit (Zen-Bio, Inc.). Glycerol content was measured enzymatically usingSigma’s free glycerol reagent. Samples were analyzed in triplicate.
Lipid synthesis was determined by assessing the incorporationof [2-14C]acetate into fatty acids (38). Adipocytes were incubatedfor 1 h at 37jC and 5% CO2 in modified Krebs-Ringer mediumcontaining 10 mM acetate and 2 mCi/ml [2-14C]acetate in thepresence or absence of 1029 M insulin in a 500 ml final volume.The reaction was stopped with 200 ml of 8 N H2SO4, and fatty acidswere extracted with 2.5 ml of Dole’s reagent (39). After incubatingthe extraction mixture for 5 min at room temperature, 1 ml ofwater and 1.5 ml of heptane were added to the Dole’s reagent toshift the mixture to a two-phase system. An aliquot of the upper
phase was collected and [2-14C]acetate incorporation into fattyacids was measured with a Packard 1900R scintillation counter(Perkin-Elmer). Samples were analyzed in triplicate.
Data analysis
The data are expressed as means 6 SEM and were analyzed byANOVA using SigmaStat software (Systat, San Jose, CA).
RESULTS
Serum chemistry profile of MR rats
Long-term MR induces hormonal and metabolite changesthat correlate with decreased adiposity and improved insulin
TABLE 1. Serum chemistry profiles in CF and MR rats
Parameter 1 Month CF 1 Month MR 3 Months CF 3 Months MR
Insulin (ng/ml) 1.48 6 0.26 0.91 6 0.18a 0.92 6 0.26 0.43 6 0.07Adiponectin (ng/ml) 5.18 6 0.26 9.92 6 0.40b 3.71 6 0.35 12.35 6 0.46b
Corticosterone (ng/ml) 367 6 110 597 6 77 252 6 64 301 6 86Glucose (mg/dl) 188 6 13 175 6 21 207 6 5 163 6 3b
Triglycerides (mg/dl) 149 6 31 47 6 16 106 6 12.7 32 6 2.9c
Free fatty acids (mEq/dl) 0.2 6 0.1 0.3 6 0.2 14 6 1 16 6 2Cholesterol (mg/dl) 47 6 4 43 6 4 46 6 1.6 40 6 0.9d
CF, control fed; MR, methionine restriction. Values are expressed as means 6 SEM of five to seven samplesand analyzed by ANOVA.
a P 5 0.041.b P , 0.001.c P 5 0.002.d P 5 0.026.
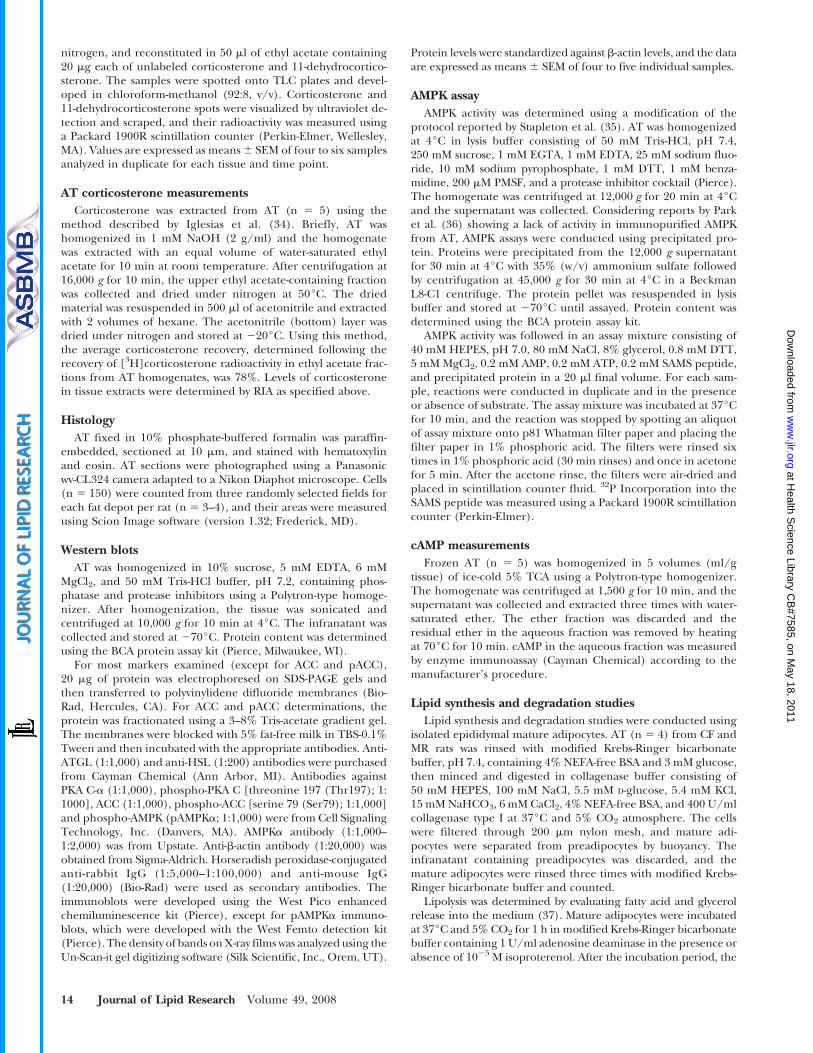
Fig. 1. 11b-Hydroxysteroid dehydrogenase-1 (11b-HSD1) activity in adipose tissue (AT) from control fed(CF) and methionine restriction (MR) Fischer 344 rats. The rats were fed ad libitum, and ATs were collectedand frozen at various time points. The tissues were homogenized, and 11b-HSD1 activity was determined asdescribed in Methods. Each bar represents the mean 6 SEM of four to six samples per time point andtreatment group tested in duplicate and analyzed by ANOVA. * P , 0.05.
Effect of MR F344 rat AT 15
at Health S
cience Library CB
#7585, on May 18, 2011
ww
w.jlr.org
Dow
nloaded from
sensitivity in F344 rats (5); therefore, we examined early MReffects on serum chemistry. Although 1 month of MRcaused no significant changes in serum metabolites, insulinlevels were decreased significantly (39%) and adiponectinlevels were increased significantly (48%) in MR ratscompared with CF rats (Table 1). By 3 months of MR,glucose and triglycerides were reduced significantly (21%and 69%, respectively) (Table 1). A marginal yet significantdecrease in cholesterol was also observed in 3 month MRrats. Insulin levels were also reduced in 3 month MR rats butwere not significantly different from insulin levels in CF rats(Table 1). Finally, MR caused no significant changes inserum corticosterone levels at 1 and 3 months (Table 1).
Effects of MR on 11b-HSD1 activity
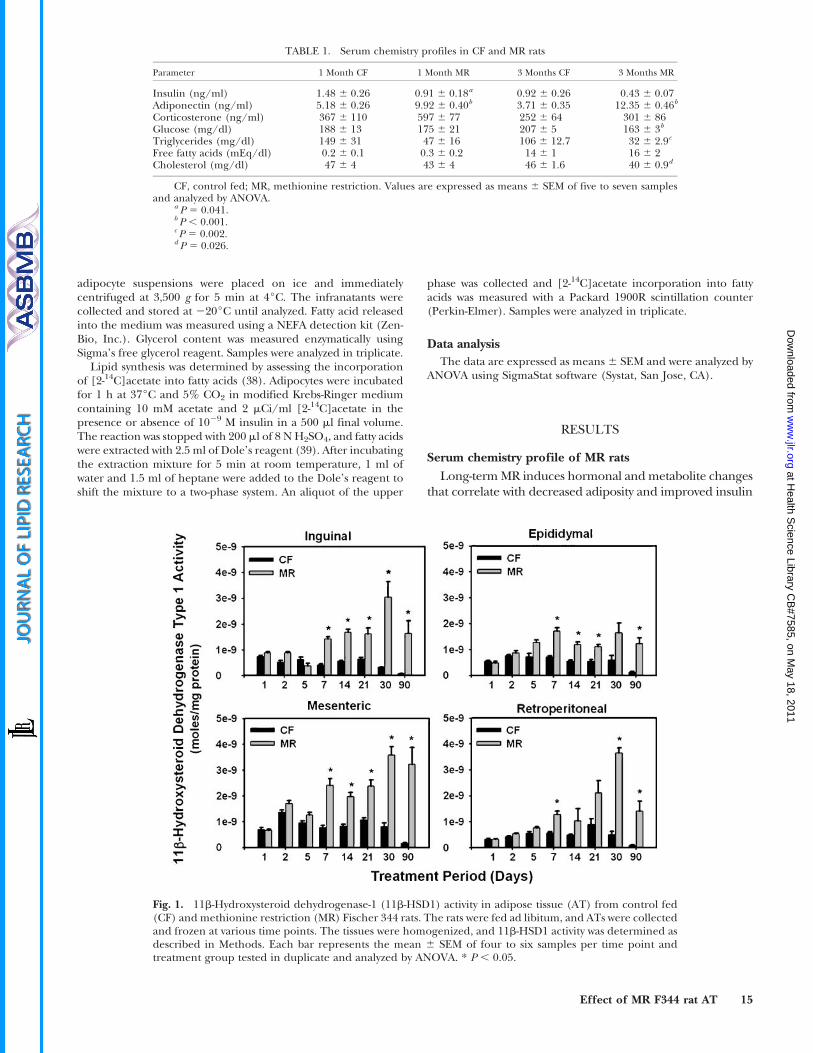
To determine whether the MR-mediated adiposityresistance correlates with changes in AT 11b-HSD1activity, enzyme assays were conducted. 11b-HSD1 activitywas increased in fat depots from MR rats as early as 7 dayson the diet and remained high at 1 and 3 months on MR(Fig. 1). To verify the MR effects on 11b-HSD1, cortico-sterone levels were measured in AT from 1 and 3 monthCF and MR rats. AT corticosterone was increased at 1 and3 months of MR, corresponding with increased 11b-HSD1activity (Fig. 2).
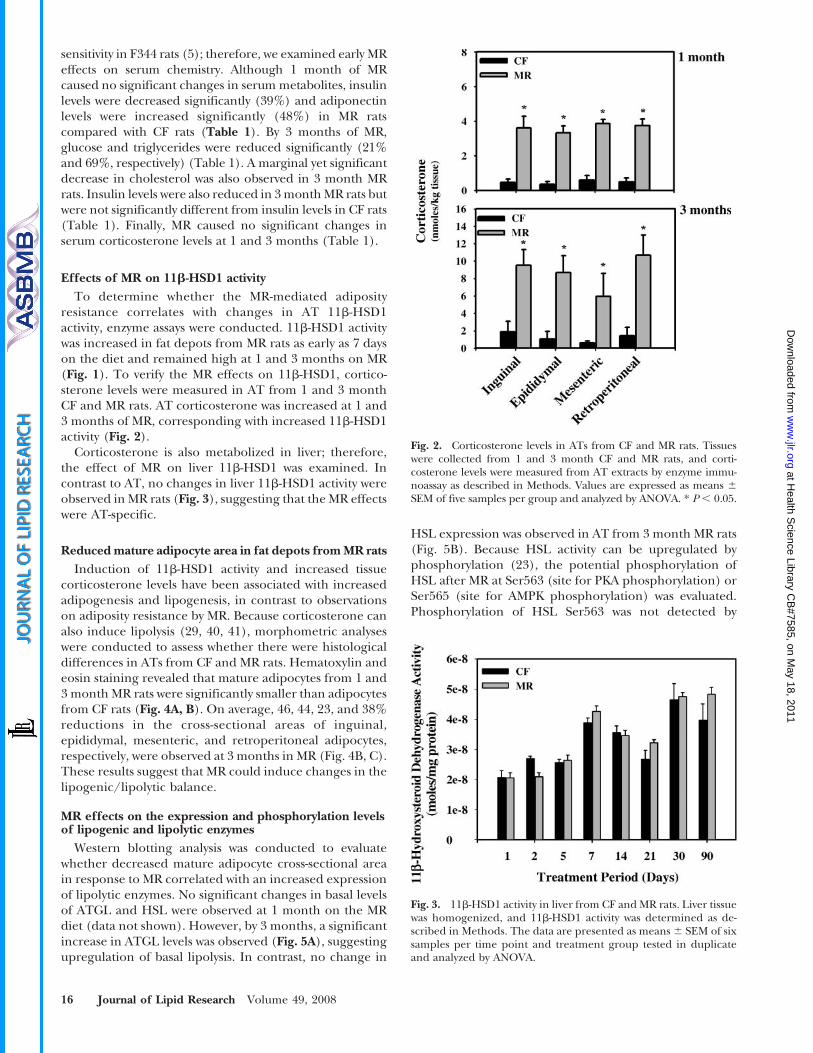
Corticosterone is also metabolized in liver; therefore,the effect of MR on liver 11b-HSD1 was examined. Incontrast to AT, no changes in liver 11b-HSD1 activity wereobserved in MR rats (Fig. 3), suggesting that the MR effectswere AT-specific.
Reduced mature adipocyte area in fat depots from MR rats
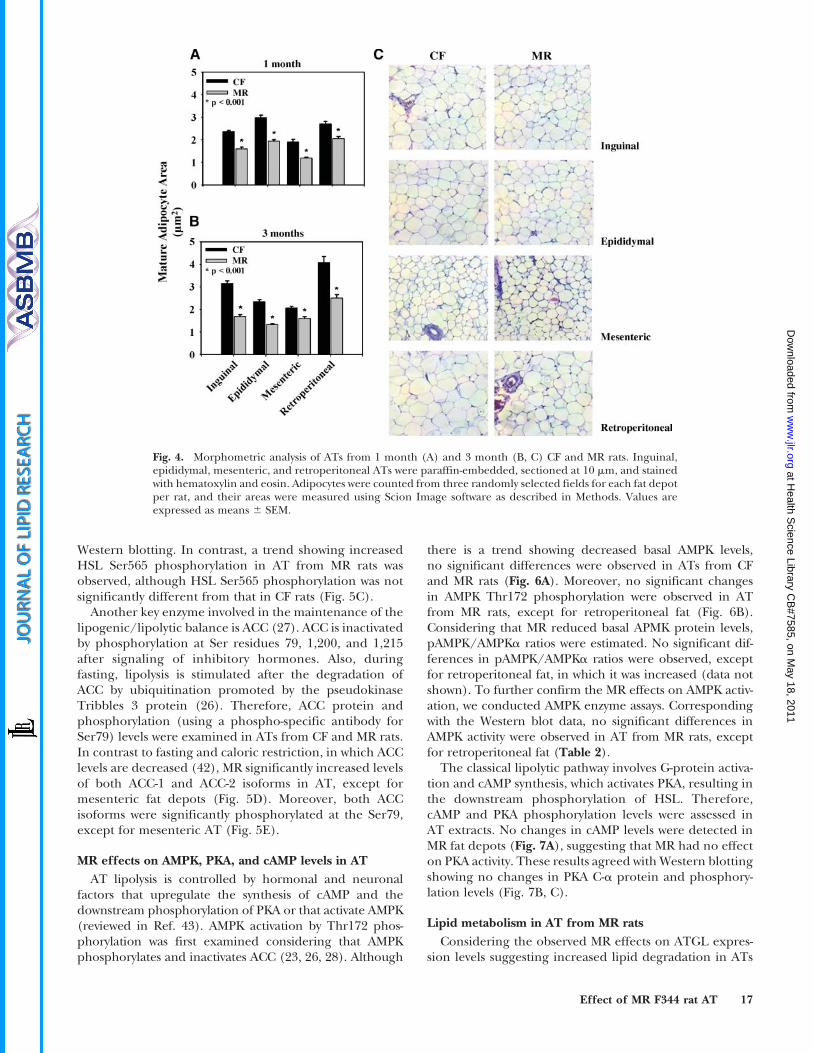
Induction of 11b-HSD1 activity and increased tissuecorticosterone levels have been associated with increasedadipogenesis and lipogenesis, in contrast to observationson adiposity resistance by MR. Because corticosterone canalso induce lipolysis (29, 40, 41), morphometric analyseswere conducted to assess whether there were histologicaldifferences in ATs from CF and MR rats. Hematoxylin andeosin staining revealed that mature adipocytes from 1 and3 month MR rats were significantly smaller than adipocytesfrom CF rats (Fig. 4A, B). On average, 46, 44, 23, and 38%reductions in the cross-sectional areas of inguinal,epididymal, mesenteric, and retroperitoneal adipocytes,respectively, were observed at 3 months in MR (Fig. 4B, C).These results suggest that MR could induce changes in thelipogenic/lipolytic balance.
MR effects on the expression and phosphorylation levelsof lipogenic and lipolytic enzymes
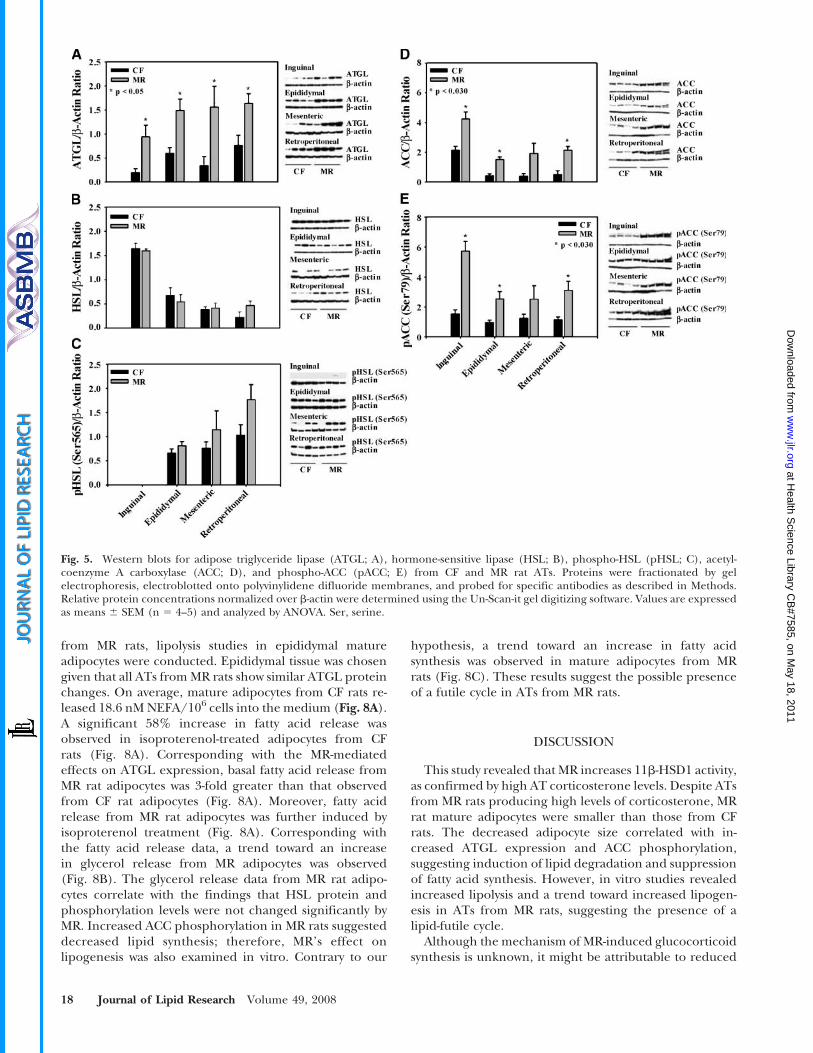
Western blotting analysis was conducted to evaluatewhether decreased mature adipocyte cross-sectional areain response to MR correlated with an increased expressionof lipolytic enzymes. No significant changes in basal levelsof ATGL and HSL were observed at 1 month on the MRdiet (data not shown). However, by 3 months, a significantincrease in ATGL levels was observed (Fig. 5A), suggestingupregulation of basal lipolysis. In contrast, no change in
HSL expression was observed in AT from 3 month MR rats(Fig. 5B). Because HSL activity can be upregulated byphosphorylation (23), the potential phosphorylation ofHSL after MR at Ser563 (site for PKA phosphorylation) orSer565 (site for AMPK phosphorylation) was evaluated.Phosphorylation of HSL Ser563 was not detected by
Fig. 2. Corticosterone levels in ATs from CF and MR rats. Tissueswere collected from 1 and 3 month CF and MR rats, and corti-costerone levels were measured from AT extracts by enzyme immu-noassay as described in Methods. Values are expressed as means 6
SEM of five samples per group and analyzed by ANOVA. * P , 0.05.
Fig. 3. 11b-HSD1 activity in liver from CF and MR rats. Liver tissuewas homogenized, and 11b-HSD1 activity was determined as de-scribed in Methods. The data are presented as means 6 SEM of sixsamples per time point and treatment group tested in duplicateand analyzed by ANOVA.
16 Journal of Lipid Research Volume 49, 2008
at Health S
cience Library CB
#7585, on May 18, 2011
ww
w.jlr.org
Dow
nloaded from
Western blotting. In contrast, a trend showing increasedHSL Ser565 phosphorylation in AT from MR rats wasobserved, although HSL Ser565 phosphorylation was notsignificantly different from that in CF rats (Fig. 5C).
Another key enzyme involved in the maintenance of thelipogenic/lipolytic balance is ACC (27). ACC is inactivatedby phosphorylation at Ser residues 79, 1,200, and 1,215after signaling of inhibitory hormones. Also, duringfasting, lipolysis is stimulated after the degradation ofACC by ubiquitination promoted by the pseudokinaseTribbles 3 protein (26). Therefore, ACC protein andphosphorylation (using a phospho-specific antibody forSer79) levels were examined in ATs from CF and MR rats.In contrast to fasting and caloric restriction, in which ACClevels are decreased (42), MR significantly increased levelsof both ACC-1 and ACC-2 isoforms in AT, except formesenteric fat depots (Fig. 5D). Moreover, both ACCisoforms were significantly phosphorylated at the Ser79,except for mesenteric AT (Fig. 5E).
MR effects on AMPK, PKA, and cAMP levels in AT
AT lipolysis is controlled by hormonal and neuronalfactors that upregulate the synthesis of cAMP and thedownstream phosphorylation of PKA or that activate AMPK(reviewed in Ref. 43). AMPK activation by Thr172 phos-phorylation was first examined considering that AMPKphosphorylates and inactivates ACC (23, 26, 28). Although
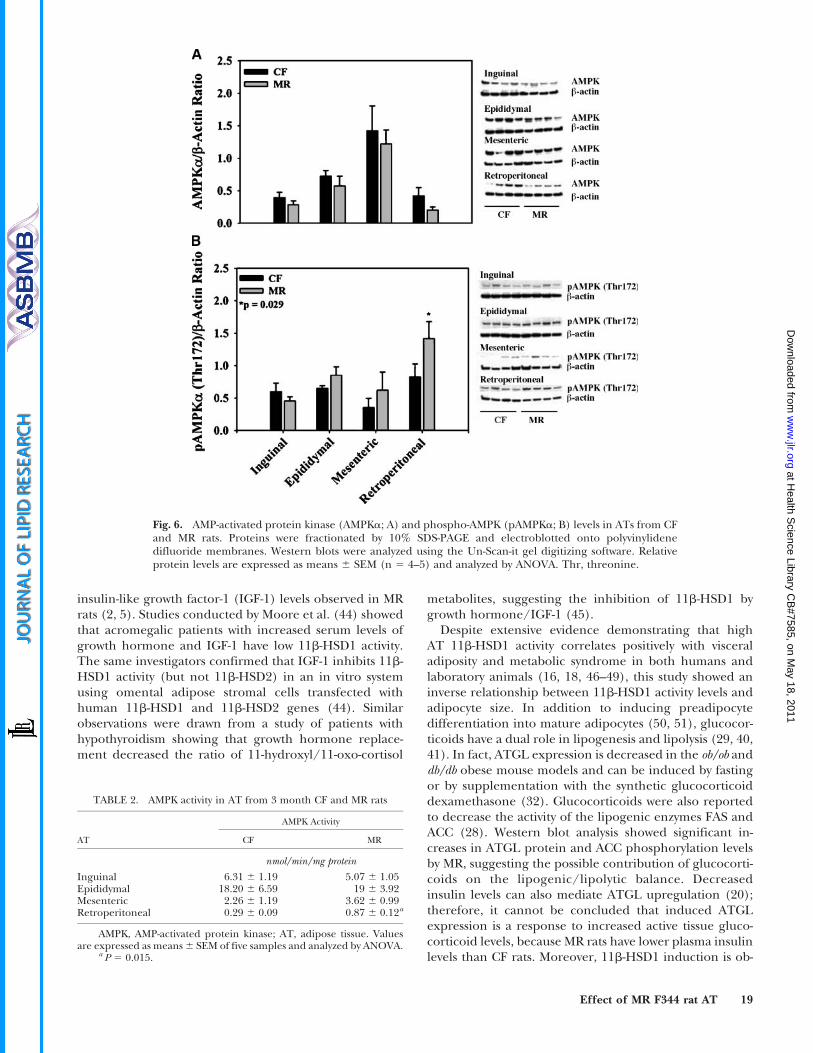
there is a trend showing decreased basal AMPK levels,no significant differences were observed in ATs from CFand MR rats (Fig. 6A). Moreover, no significant changesin AMPK Thr172 phosphorylation were observed in ATfrom MR rats, except for retroperitoneal fat (Fig. 6B).Considering that MR reduced basal APMK protein levels,pAMPK/AMPKa ratios were estimated. No significant dif-ferences in pAMPK/AMPKa ratios were observed, exceptfor retroperitoneal fat, in which it was increased (data notshown). To further confirm the MR effects on AMPK activ-ation, we conducted AMPK enzyme assays. Correspondingwith the Western blot data, no significant differences inAMPK activity were observed in AT from MR rats, exceptfor retroperitoneal fat (Table 2).
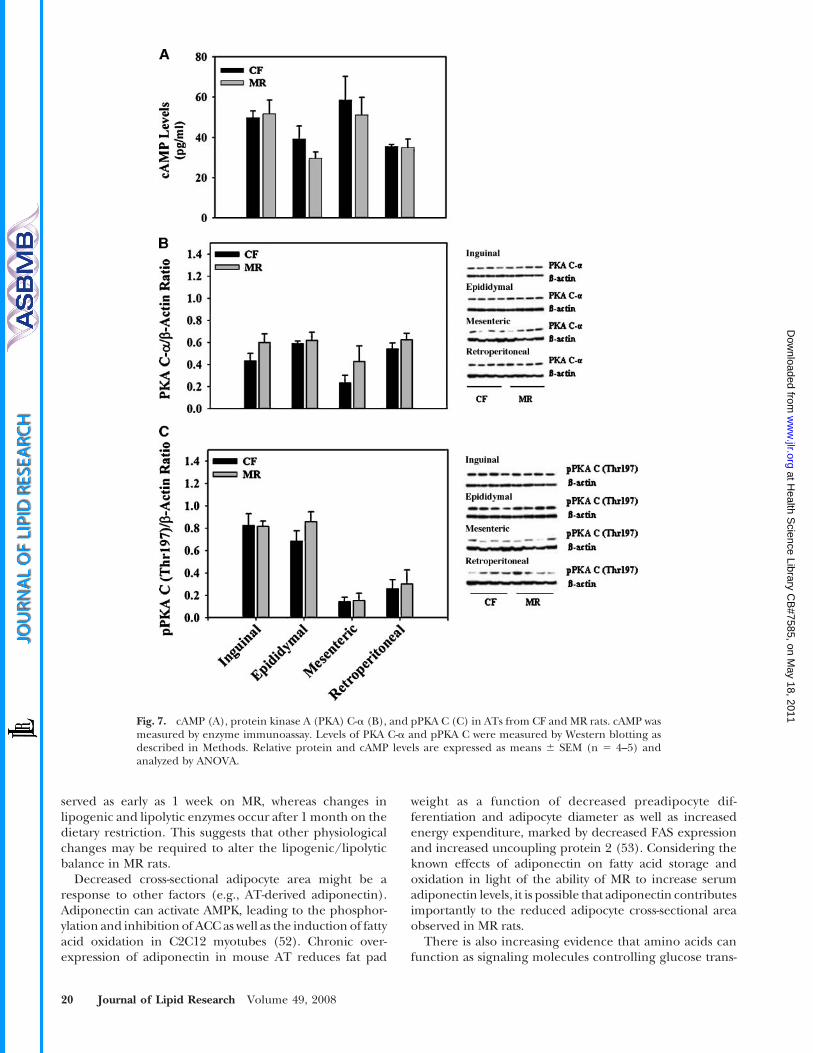
The classical lipolytic pathway involves G-protein activa-tion and cAMP synthesis, which activates PKA, resulting inthe downstream phosphorylation of HSL. Therefore,cAMP and PKA phosphorylation levels were assessed inAT extracts. No changes in cAMP levels were detected inMR fat depots (Fig. 7A), suggesting that MR had no effecton PKA activity. These results agreed with Western blottingshowing no changes in PKA C-a protein and phosphory-lation levels (Fig. 7B, C).
Lipid metabolism in AT from MR rats
Considering the observed MR effects on ATGL expres-sion levels suggesting increased lipid degradation in ATs
Fig. 4. Morphometric analysis of ATs from 1 month (A) and 3 month (B, C) CF and MR rats. Inguinal,epididymal, mesenteric, and retroperitoneal ATs were paraffin-embedded, sectioned at 10 mm, and stainedwith hematoxylin and eosin. Adipocytes were counted from three randomly selected fields for each fat depotper rat, and their areas were measured using Scion Image software as described in Methods. Values areexpressed as means 6 SEM.
Effect of MR F344 rat AT 17
at Health S
cience Library CB
#7585, on May 18, 2011
ww
w.jlr.org
Dow
nloaded from
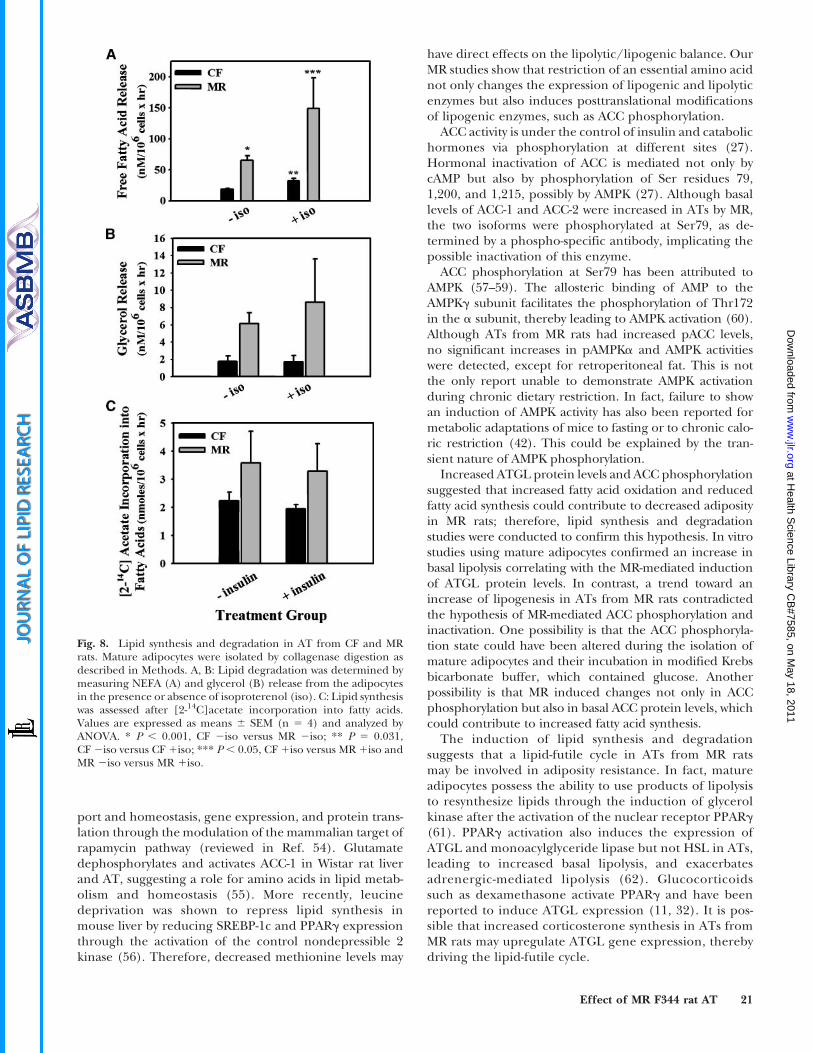
from MR rats, lipolysis studies in epididymal matureadipocytes were conducted. Epididymal tissue was chosengiven that all ATs from MR rats show similar ATGL proteinchanges. On average, mature adipocytes from CF rats re-leased 18.6 nM NEFA/106 cells into the medium (Fig. 8A).A significant 58% increase in fatty acid release wasobserved in isoproterenol-treated adipocytes from CFrats (Fig. 8A). Corresponding with the MR-mediatedeffects on ATGL expression, basal fatty acid release fromMR rat adipocytes was 3-fold greater than that observedfrom CF rat adipocytes (Fig. 8A). Moreover, fatty acidrelease from MR rat adipocytes was further induced byisoproterenol treatment (Fig. 8A). Corresponding withthe fatty acid release data, a trend toward an increasein glycerol release from MR adipocytes was observed(Fig. 8B). The glycerol release data from MR rat adipo-cytes correlate with the findings that HSL protein andphosphorylation levels were not changed significantly byMR. Increased ACC phosphorylation in MR rats suggesteddecreased lipid synthesis; therefore, MR’s effect onlipogenesis was also examined in vitro. Contrary to our
hypothesis, a trend toward an increase in fatty acidsynthesis was observed in mature adipocytes from MRrats (Fig. 8C). These results suggest the possible presenceof a futile cycle in ATs from MR rats.
DISCUSSION
This study revealed that MR increases 11b-HSD1 activity,as confirmed by high AT corticosterone levels. Despite ATsfrom MR rats producing high levels of corticosterone, MRrat mature adipocytes were smaller than those from CFrats. The decreased adipocyte size correlated with in-creased ATGL expression and ACC phosphorylation,suggesting induction of lipid degradation and suppressionof fatty acid synthesis. However, in vitro studies revealedincreased lipolysis and a trend toward increased lipogen-esis in ATs from MR rats, suggesting the presence of alipid-futile cycle.
Although the mechanism of MR-induced glucocorticoidsynthesis is unknown, it might be attributable to reduced
Fig. 5. Western blots for adipose triglyceride lipase (ATGL; A), hormone-sensitive lipase (HSL; B), phospho-HSL (pHSL; C), acetyl-coenzyme A carboxylase (ACC; D), and phospho-ACC (pACC; E) from CF and MR rat ATs. Proteins were fractionated by gelelectrophoresis, electroblotted onto polyvinylidene difluoride membranes, and probed for specific antibodies as described in Methods.Relative protein concentrations normalized over b-actin were determined using the Un-Scan-it gel digitizing software. Values are expressedas means 6 SEM (n 5 4–5) and analyzed by ANOVA. Ser, serine.
18 Journal of Lipid Research Volume 49, 2008
at Health S
cience Library CB
#7585, on May 18, 2011
ww
w.jlr.org
Dow
nloaded from
insulin-like growth factor-1 (IGF-1) levels observed in MRrats (2, 5). Studies conducted by Moore et al. (44) showedthat acromegalic patients with increased serum levels ofgrowth hormone and IGF-1 have low 11b-HSD1 activity.The same investigators confirmed that IGF-1 inhibits 11b-HSD1 activity (but not 11b-HSD2) in an in vitro systemusing omental adipose stromal cells transfected withhuman 11b-HSD1 and 11b-HSD2 genes (44). Similarobservations were drawn from a study of patients withhypothyroidism showing that growth hormone replace-ment decreased the ratio of 11-hydroxyl/11-oxo-cortisol
metabolites, suggesting the inhibition of 11b-HSD1 bygrowth hormone/IGF-1 (45).
Despite extensive evidence demonstrating that highAT 11b-HSD1 activity correlates positively with visceraladiposity and metabolic syndrome in both humans andlaboratory animals (16, 18, 46–49), this study showed aninverse relationship between 11b-HSD1 activity levels andadipocyte size. In addition to inducing preadipocytedifferentiation into mature adipocytes (50, 51), glucocor-ticoids have a dual role in lipogenesis and lipolysis (29, 40,41). In fact, ATGL expression is decreased in the ob/ob anddb/db obese mouse models and can be induced by fastingor by supplementation with the synthetic glucocorticoiddexamethasone (32). Glucocorticoids were also reportedto decrease the activity of the lipogenic enzymes FAS andACC (28). Western blot analysis showed significant in-creases in ATGL protein and ACC phosphorylation levelsby MR, suggesting the possible contribution of glucocorti-coids on the lipogenic/lipolytic balance. Decreasedinsulin levels can also mediate ATGL upregulation (20);therefore, it cannot be concluded that induced ATGLexpression is a response to increased active tissue gluco-corticoid levels, because MR rats have lower plasma insulinlevels than CF rats. Moreover, 11b-HSD1 induction is ob-
Fig. 6. AMP-activated protein kinase (AMPKa; A) and phospho-AMPK (pAMPKa; B) levels in ATs from CFand MR rats. Proteins were fractionated by 10% SDS-PAGE and electroblotted onto polyvinylidenedifluoride membranes. Western blots were analyzed using the Un-Scan-it gel digitizing software. Relativeprotein levels are expressed as means 6 SEM (n 5 4–5) and analyzed by ANOVA. Thr, threonine.
TABLE 2. AMPK activity in AT from 3 month CF and MR rats
AMPK Activity
AT CF MR
nmol/min/mg protein
Inguinal 6.31 6 1.19 5.07 6 1.05Epididymal 18.20 6 6.59 19 6 3.92Mesenteric 2.26 6 1.19 3.62 6 0.99Retroperitoneal 0.29 6 0.09 0.87 6 0.12a
AMPK, AMP-activated protein kinase; AT, adipose tissue. Valuesare expressed as means 6 SEM of five samples and analyzed by ANOVA.
a P 5 0.015.
Effect of MR F344 rat AT 19
at Health S
cience Library CB
#7585, on May 18, 2011
ww
w.jlr.org
Dow
nloaded from
served as early as 1 week on MR, whereas changes inlipogenic and lipolytic enzymes occur after 1 month on thedietary restriction. This suggests that other physiologicalchanges may be required to alter the lipogenic/lipolyticbalance in MR rats.
Decreased cross-sectional adipocyte area might be aresponse to other factors (e.g., AT-derived adiponectin).Adiponectin can activate AMPK, leading to the phosphor-ylation and inhibition of ACC as well as the induction of fattyacid oxidation in C2C12 myotubes (52). Chronic over-expression of adiponectin in mouse AT reduces fat pad
weight as a function of decreased preadipocyte dif-ferentiation and adipocyte diameter as well as increasedenergy expenditure, marked by decreased FAS expressionand increased uncoupling protein 2 (53). Considering theknown effects of adiponectin on fatty acid storage andoxidation in light of the ability of MR to increase serumadiponectin levels, it is possible that adiponectin contributesimportantly to the reduced adipocyte cross-sectional areaobserved in MR rats.
There is also increasing evidence that amino acids canfunction as signaling molecules controlling glucose trans-
Fig. 7. cAMP (A), protein kinase A (PKA) C-a (B), and pPKA C (C) in ATs from CF and MR rats. cAMP wasmeasured by enzyme immunoassay. Levels of PKA C-a and pPKA C were measured by Western blotting asdescribed in Methods. Relative protein and cAMP levels are expressed as means 6 SEM (n 5 4–5) andanalyzed by ANOVA.
20 Journal of Lipid Research Volume 49, 2008
at Health S
cience Library CB
#7585, on May 18, 2011
ww
w.jlr.org
Dow
nloaded from
port and homeostasis, gene expression, and protein trans-lation through the modulation of the mammalian target ofrapamycin pathway (reviewed in Ref. 54). Glutamatedephosphorylates and activates ACC-1 in Wistar rat liverand AT, suggesting a role for amino acids in lipid metab-olism and homeostasis (55). More recently, leucinedeprivation was shown to repress lipid synthesis inmouse liver by reducing SREBP-1c and PPARg expressionthrough the activation of the control nondepressible 2kinase (56). Therefore, decreased methionine levels may
have direct effects on the lipolytic/lipogenic balance. OurMR studies show that restriction of an essential amino acidnot only changes the expression of lipogenic and lipolyticenzymes but also induces posttranslational modificationsof lipogenic enzymes, such as ACC phosphorylation.
ACC activity is under the control of insulin and catabolichormones via phosphorylation at different sites (27).Hormonal inactivation of ACC is mediated not only bycAMP but also by phosphorylation of Ser residues 79,1,200, and 1,215, possibly by AMPK (27). Although basallevels of ACC-1 and ACC-2 were increased in ATs by MR,the two isoforms were phosphorylated at Ser79, as de-termined by a phospho-specific antibody, implicating thepossible inactivation of this enzyme.
ACC phosphorylation at Ser79 has been attributed toAMPK (57–59). The allosteric binding of AMP to theAMPKg subunit facilitates the phosphorylation of Thr172in the a subunit, thereby leading to AMPK activation (60).Although ATs from MR rats had increased pACC levels,no significant increases in pAMPKa and AMPK activitieswere detected, except for retroperitoneal fat. This is notthe only report unable to demonstrate AMPK activationduring chronic dietary restriction. In fact, failure to showan induction of AMPK activity has also been reported formetabolic adaptations of mice to fasting or to chronic calo-ric restriction (42). This could be explained by the tran-sient nature of AMPK phosphorylation.
Increased ATGL protein levels and ACC phosphorylationsuggested that increased fatty acid oxidation and reducedfatty acid synthesis could contribute to decreased adiposityin MR rats; therefore, lipid synthesis and degradationstudies were conducted to confirm this hypothesis. In vitrostudies using mature adipocytes confirmed an increase inbasal lipolysis correlating with the MR-mediated inductionof ATGL protein levels. In contrast, a trend toward anincrease of lipogenesis in ATs from MR rats contradictedthe hypothesis of MR-mediated ACC phosphorylation andinactivation. One possibility is that the ACC phosphoryla-tion state could have been altered during the isolation ofmature adipocytes and their incubation in modified Krebsbicarbonate buffer, which contained glucose. Anotherpossibility is that MR induced changes not only in ACCphosphorylation but also in basal ACC protein levels, whichcould contribute to increased fatty acid synthesis.
The induction of lipid synthesis and degradationsuggests that a lipid-futile cycle in ATs from MR ratsmay be involved in adiposity resistance. In fact, matureadipocytes possess the ability to use products of lipolysisto resynthesize lipids through the induction of glycerolkinase after the activation of the nuclear receptor PPARg(61). PPARg activation also induces the expression ofATGL and monoacylglyceride lipase but not HSL in ATs,leading to increased basal lipolysis, and exacerbatesadrenergic-mediated lipolysis (62). Glucocorticoidssuch as dexamethasone activate PPARg and have beenreported to induce ATGL expression (11, 32). It is pos-sible that increased corticosterone synthesis in ATs fromMR rats may upregulate ATGL gene expression, therebydriving the lipid-futile cycle.
Fig. 8. Lipid synthesis and degradation in AT from CF and MRrats. Mature adipocytes were isolated by collagenase digestion asdescribed in Methods. A, B: Lipid degradation was determined bymeasuring NEFA (A) and glycerol (B) release from the adipocytesin the presence or absence of isoproterenol (iso). C: Lipid synthesiswas assessed after [2-14C]acetate incorporation into fatty acids.Values are expressed as means 6 SEM (n 5 4) and analyzed byANOVA. * P , 0.001, CF 2iso versus MR 2iso; ** P 5 0.031,CF 2iso versus CF 1iso; *** P , 0.05, CF 1iso versus MR 1iso andMR 2iso versus MR 1iso.
Effect of MR F344 rat AT 21
at Health S
cience Library CB
#7585, on May 18, 2011
ww
w.jlr.org
Dow
nloaded from
In conclusion, changes in the lipogenic/lipolytic bal-ance leading to a lipid-futile cycle appear to play importantroles in MR-mediated adiposity resistance. MR-mediatedchanges in the lipogenic/lipolytic balance might resultfrom increased AT corticosterone and adiponectin levelsas well as decreased insulin signaling, IGF-1, or methio-nine itself. This study provides insight into the intracellularresponses of AT to MR, but further investigation is requiredto establish how the physiological changes induced by MRintegrate, resulting in adiposity resistance.
The authors thank Nancy Borofsky and Joyce Schmidt for con-ducting corticosterone immunoassays, Virginia Malloy forcoordinating the rat studies, and Steve Bailey for assistingwith tissue dissections. The authors also thank Dr. Ahmed ElTamer for suggesting and directing initial 11b-HSD1 studiesand Nancy Durr for her editorial comments.
REFERENCES
1. Orentreich, N., J. R. Matias, A. DeFelice, and J. A. Zimmerman.1993. Low methionine ingestion by rats extends life span. J. Nutr.123: 269–274.
2. Miller, R. A., G. Buehner, Y. Chang, J. M. Harper, R. Sigler, and M.Smith-Wheelock. 2005. Methionine-deficient diet extends mouselifespan, slows immune and lens aging, alters glucose, T4, IGF-1and insulin levels, and increases hepatocyte MIF levels and stressresistance. Aging Cell. 4: 119–125.
3. Duffy, P. H., R. J. Feuers, J. A. Leakey, K. Nakamura, A. Turturro,and R. W. Hart. 1989. Effect of chronic caloric restriction onphysiological variables related to energy metabolism in the maleFisher 344 rat. Mech. Ageing Dev. 48: 117–133.
4. Hausman, D. B., J. B. Fine, K. Tagra, S. S. Fleming, R. J. Martin, andM. DiGirolamo. 2003. Regional fat pad growth and cellularity inobese Zucker rats: modulation by caloric restriction. Obes. Res. 11:674–682.
5. Malloy, V., R. Krajcik, S. Bailey, G. Hristopoulos, J. Plummer, andN. Orentreich. 2006. Methionine restriction decreases visceral fatmass and preserves insulin action in aging male Fischer 344 ratsindependent of energy restriction. Aging Cell. 5: 305–314.
6. Frederich, R. C., A. Hamann, S. Anderson, B. Lollmann, B. B.Lowell, and J. S. Flier. 1995. Leptin levels reflect body lipid contentin mice: evidence for diet-induced resistance to leptin action. Nat.Med. 1: 1311–1314.
7. Arita, T., S. Kihara, N. Ouchi, M. Takahashi, K. Maeda, J. Miyagawa,K. Hotta, I. Shimomura, T. Nakamura, K. Miyaoka, et al. 1999.Paradoxical decrease of an adipose-specific protein, adiponectin,in obesity. Biochem. Biophys. Res. Commun. 257: 79–83.
8. Gregoire, F. M. 2001. Adipocyte differentiation: from fibroblast toendocrine cell. Exp. Biol. Med. 226: 997–1002.
9. Hausman, D. B., M. DiGirolamo, T. J. Bartness, G. J. Huasman, andR. J. Martin. 2001. The biology of white adipocyte proliferation.Obes. Rev. 2: 239–254.
10. Otto, T. C., and M. D. Lane. 2005. Adipose development: from stemcell to adipocyte. Crit. Rev. Biochem. Mol. Biol. 40: 229–242.
11. Tomlinsin, J. J., A. Bourdreau, D. Wu, E. Atlas, and J. G. Hache.2006. Modulation of early human preadipocyte differentiation byglucocorticoids. Endocrinology. 147: 5284–5293.
12. Seckl, J. R., and B. R. Walker. 2001. Minireview. 11Beta-hydroxy-steroid dehydrogenase type 1—a tissue-specific amplifier of gluco-corticoid action. Endocrinology. 142: 1371–1376.
13. Walker, E. A., and P. M. Stewart. 2003. 11b-Hydroxysteroid de-hydrogenase: unexpected connections. Trends Endocrinol. Metab.14: 334–339.
14. Stewart, P. M., and N. Draper. 2005. 11Beta-hydroxysteroid dehy-drogenase and the pre-receptor regulation of corticosteroid hor-mone action. J. Endocrinol. 186: 251–271.
15. Rask, E., T. Olsson, S. Soderberg, R. Andrew, D. E. W. Livingstone,O. Johnson, and B. R. Walker. 2001. Tissue-specific dysregulation
of cortisol metabolism in human obesity. J. Clin. Endocrinol. Metab.86: 1418–1421.
16. Masuzaki, H., J. Paterson, H. Shinyama, N. M. Morton, J. J. Mullins,J. R. Seckl, and J. S. Flier. 2001. A transgenic model of visceralobesity and the metabolic syndrome. Science. 294: 2166–2170.
17. Stewart, P. M., and J. W. Tomlinson. 2002. Cortisol, 11b-hydroxysteroid dehydrogenase type I and central obesity. TrendsEndocrinol. Metab. 13: 94–96.
18. Kannisto, K., K. H. Pietilainen, E. Ehrenborg, A. Rissanen, J. Kaprio,A. Hamsten, and H. Yki-Jarvinen. 2004. Overexpression of 11b-hydroxysteroid dehydrogenase-1 in adipose tissue is associated withacquired obesity and features of insulin resistance: studies in youngmonozygotic twins. J. Clin. Endocrinol. Metab. 89: 4414–4421.
19. Duclos, M., P. Marquez-Pereira, P. Barat, B. Gatta, and P. Roger.2005. Increased cortisol bioavailability, abdominal obesity and themetabolic syndrome in obese women. Obes. Res. 13: 1131–1133.
20. Kershaw, E. E., J. K. Hamm, L. A. W. Verhagen, O. Peroni, M. Katic,and J. S. Flier. 2006. Adipose triglyceride lipase function, regulationby insulin, and comparison with adiponutrin. Diabetes. 55: 148–157.
21. Large, V., O. Peroni, D. Letexier, H. Ray, and M. Beylot. 2004.Metabolism of lipids in human white adipocyte. Diabetes Metab. 30:294–309.
22. Gonzalez-Yanes, C., and V. Sanchez-Margalet. 2006. Signalingmechanisms regulating lipolysis. Cell. Signal. 18: 401–408.
23. Holm, C. 2003. Molecular mechanisms regulating hormone-sensitive lipase and lipolysis. Biochem. Soc. Trans. 31: 1120–1124.
24. Zimmermann, R., J. G. Strauss, G. Haemmerle, G. Schoiswohl, R.Birner-Gruenberger, M. Reiderer, A. Lass, G. Neuberger, F. Eisenhaber,A. Hermetter, et al. 2004. Fat mobilization in adipose tissue is pro-moted by adipose triglyceride lipase. Science. 306: 1383–1386.
25. Haemmerle, G., A. Lass, R. Zimmerman, G. Gorkiewicz, C. Meyer,J. Rozman, G. Heldmaier, R. Maier, C. Theussi, S. Eder, et al. 2006.Defective lipolysis and altered energy metabolism in mice lackingadipose triglyceride lipase. Science. 312: 734–737.
26. Qi, L., J. E. Heredia, J. Y. Altajeros, R. Screaton, N. Goebel, S.Niessen, I. X. MacLeod, C. W. Liew, R. N. Kulkarni, J. Bain, et al.2006. TRB3 links the E3 ubiquitin ligase COP1 to lipid metabolism.Science. 312: 1763–1766.
27. Brownsey, R. W., A. N. Boone, J. E. Elliott, J. E. Kulpa, and W. H.Lee. 2006. Regulation of acetyl-CoA carboxylase. Biochem. Soc.Trans. 34: 223–227.
28. Volpe, J. J., and J. C. Marasa. 1975. Hormonal regulation of fatty acidsynthetase, acetyl-CoA carboxylase and fatty acid synthesis in mam-malian adipose tissue and liver. Biochim. Biophys. Acta. 380: 454–472.
29. Lacasa, D., B. Agli, and Y. Giudicelli. 1988. Permissive action ofglucocorticoids on catecholamine-induced lipolysis: direct “in vitro”effects on the fat cell b-adrenoreceptor-coupled-adenylate cyclasesystem. Biochem. Biophys. Res. Commun. 153: 489–497.
30. Stralfors, P., and P. Belfrage. 1983. Phosphorylation of hormone-sensitive lipase by cyclic AMP-dependent kinase. J. Biol. Chem. 258:15146–15152.
31. Langin, D., S. Lucas, and M. Lafontan. 2000. Millenium fat cell lipol-ysis reveals unexpected novel tracks. Horm. Metab. Res. 32: 443–452.
32. Villena, J. A., S. Roy, E. Sarkadi-Nagy, K-H. Kim, and H. S. Sul. 2004.Desnutrin, an adipocyte gene encoding a novel patatin domaincontaining protein, is induced by fasting and glucocorticoids. J.Biol. Chem. 279: 47066–47075.
33. Lakshmi, V., and C. Monder. 1988. Purification and characteriza-tion of the corticosteroid 11b-dehydrogenase component of the ratliver 11b-hydroxysteroid dehydrogenase complex. Endocrinology.123: 2390–2398.
34. Iglesias, Y., C. Fente, S. Mayo, B. Vazquez, C. Franco, and A.Cepeda. 2000. Chemiluminescence detection of nine corticoste-roids in liver. Analyst. 125: 2071–2074.
35. Stapleton, D., K. I. Mitchelhill, G. Gao, J. Widmer, B. J. Mitchell, T.Teh, C. M. House, C. Shamala Fernandez, T. Cox, L. A. Witters,et al. 1996. Mammalian AMP-activated protein kinase subfamily.J. Biol. Chem. 271: 611–614.
36. Park, H., V. K. Kaushik, S. Constant, M. Prentki, E. Przybytkowski,N. B. Ruderman, and A. K. Saha. 2002. Coordinate regulation ofmalonyl-CoA decarboxylase, sn-glycerol-3-phosphate acyltransfer-ase and acetyl-CoA carboxylase by AMP-activated protein kinase inrat tissues in response to exercise. J. Biol. Chem. 277: 32571–32577.
37. Gardan, D., F. Gondret, and I. Louveau. 2006. Lipid metabolismand secretory function of porcine intramuscular adipocytes com-pared to subcutaneous and perirenal adipocytes. Am. J. Physiol.Endocrinol. Metab. 291: E372–E380.
22 Journal of Lipid Research Volume 49, 2008
at Health S
cience Library CB
#7585, on May 18, 2011
ww
w.jlr.org
Dow
nloaded from
38. Borges-Silva, C. N., M. H. Fonseca-Alaniz, M. I. C. Alonso-Vale,J. Takada, S. Andreotti, S. B. Peres, J. Cipolla-Neto, T. C. Pithon-Curi,and F. B. Lima. 2005. Reduced lipolysis and increased lipogenesisin adipose tissue from pinealectomized rats adapted to training. J.Pineal Res. 39: 178–184.
39. Dole, V. P., and H. Meinertz. 1960. Microdetermination oflong-chain fatty acids in plasma and tissues. J. Biol. Chem. 235:2595–2599.
40. Devenport, L., A. Knehans, A. Sundstrom, and T. Thomas. 1989.Corticosterone’s dual metabolic action. Life Sci. 45: 1389–1396.
41. Guk-Chor Yip, R., and H. M. Goodman. 1999. Growth hormoneand dexamethasone stimulate lipolysis and activate adenyl cyclasein rat adipocytes by selectively shifting Gia2 to lower density mem-brane fractions. Endocrinology. 140: 1219–1227.
42. Gonzalez, A. A., R. Kumar, J. D. Mulligan, A. J. David, R.Weindruch, and K. W. Saupe. 2004. Metabolic adaptations tofasting and chronic caloric restriction in heart, muscle, and liver donot include changes in AMPK activity. Am. J. Physiol. Endocrinol.Metab. 287: E1032–E1037.
43. Langin, D. 2006. Adipose tissue lipolysis as a metabolic pathway todefine pharmacological strategies against obesity and the meta-bolic syndrome. Pharm. Res. 53: 482–491.
44. Moore, J. S., J. P. Monson, G. Katlas, P. Putigano, P. J. Wood, M. C.Sheppard, G. M. Besser, N. F. Taylor, and P. M. Stewart. 1999.Modulation of 11b-hydroxysteroid dehydrogenase isozymes bygrowth hormone and insulin-like growth factor: in vivo and in vitrostudies. J. Clin. Endocrinol. Metab. 84: 4172–4177.
45. Swords, F. M., P. V. Carroll, J. Kisalu, P. J. Wood, N. F. Taylor, andJ. P. Monson. 2003. The effects of growth hormone deficiency andreplacement on glucocorticoid exposure in hypopituitary patientson cortisone acetate and hydrocortisone replacement. Clin.Endocrinol. (Oxf.). 59: 613–620.
46. Rask, E., B. R. Walker, S. Soderberg, D. E. W. Livingstone, M.Eliasson, O. Johnson, R. Andrew, and T. Olsson. 2002. Tissue-specific changes in peripheral cortisol metabolism in obesewomen: increased adipose 11b-hydroxysteroid dehydrogenasetype I activity. J. Clin. Endocrinol. Metab. 87: 3330–3336.
47. Dawn, E. W., G. C. Livingstone, J. K. Smith, P. M. Jamieson,R. Andrew, C. J. Kenyon, and B. R. Walker. 2000. Understandingthe role of glucocorticoids in obesity: tissue-specific alterationsof corticosterone metabolism in obese Zucker rats. Endocrinology.141: 560–563.
48. Goedecke, J. H., D. J. Wake, N. S. Levitt, E. V. Lambert, M. R.Collins, N. M. Morton, R. Andrew, J. R. Seckl, and B. R. Walker.2006. Glucocorticoid metabolism within superficial subcutaneousrather than visceral adipose tissue is associated with features of themetabolic syndrome in South African women. Clin. Endocrinol.(Oxf.). 65: 81–87.
49. Kershaw, E. E., N. M. Morton, H. Dhillon, L. Ramage, J. R. Seckl,
and J. S. Flier. 2005. Adipocyte-specific glucocorticoid inactivationprotects against diet-induced obesity. Diabetes. 54: 1023–1031.
50. Sanchez, I., L. Goya, A. K. Vallerga, and G. L. Firestone. 1993.Glucocorticoids reversibly arrest rat hepatoma cell growth by in-ducing an early G1 block in the cell cycle progression. Cell GrowthDiffer. 4: 215–225.
51. Smas, C. M., L. Chen, L. Zhao, M. J. Latasa, and H. S. Sul. 1999.Transcriptional repression of pref-1 by glucocorticoids promotes3T3-L1 adipocyte differentiation. J. Biol. Chem. 274: 12632–12641.
52. Mao, X., C. K. Kikani, R. A. Riojas, P. Langlais, L. Wang, F. J. Ramos,Q. Fang, C. Y. Christ-Roberts, J. Y. Hong, R-Y. Kim, et al. 2006.APPL1 binds to adiponectin receptors and mediates adiponectinsignaling and function. Nat. Cell Biol. 8: 516–523.
53. Bauche, I. B., S. A. El Mkadem, A-M. Pottier, M. Senou, M-C. Many,R. Rezsohazy, L. Penicaud, N. Maeda, T. Funahashi, and S. M.Brichard. 2007. Overexpression of adiponectin targeted to adiposetissue in transgenic mice: impaired adipocyte differentiation.Endocrinology. 148: 1539–1549.
54. Hinault, C., E. Van Obberghen, and I. Mothe-Satney. 2006. Roleof amino acids in insulin signaling in adipocytes and their poten-tial to decrease insulin resistance of adipose tissue. J. Nutr. Biochem.17: 374–378.
55. Boone, A. N., A. Chan, J. E. Kulpa, and R. W. Brownsey. 2000.Bimodal activation of acetyl-CoA carboxylase by glutamate. J. Biol.Chem. 275: 10819–10825.
56. Guo, F., and D. R. Cavener. 2007. The GNC2 eIF2a kinase regulatesfatty acid homeostasis in the liver during deprivation of an essentialamino acid. Cell Metab. 5: 103–104.
57. Hardie, D. G., and D. A. Pan. 2002. Regulation of fatty acid syn-thesis and oxidation by AMP-activated protein kinase. Biochem. Soc.Trans. 30: 1064–1070.
58. Fryer, L. G. D., and D. Carling. 2005. AMP-activated protein kinaseand the metabolic syndrome. Biochem. Soc. Trans. 33: 362–366.
59. Kemp, B. E., D. Stapleton, D. J. Campbell, Z-P. Chen, S. Murthy,M. Walter, A. Gupta, J. J. Adams, F. Katsis, B. van Denderen, et al.2003. AMP-activated protein kinase, super metabolic regulator.Biochem. Soc. Trans. 31: 162–168.
60. Hawley, S. A., J. Boudeau, J. L. Reid, K. J. Mustard, L. Udd, T. P.Makela, D. R. Alessi, and D. G. Hardie. 2003. Complexes betweenthe LKB1 tumor suppressor, STRAD alpha/beta and MO5 alpha/beta are upstream kinases in the AMP-activated protein kinase cas-cade. J. Biol. 2: 28.
61. Guan, H-P., Y. Li, M. V. Jensen, C. B. Newgard, C. M. Steppan, andM. A. Lazar. 2002. A futile metabolic cycle activated in adipocytesby antidiabetic agents. Nat. Med. 8: 1122–1128.
62. Festuccia, W. T., M. Laplante, M. Berthiaume, Y. Gelinas, and Y.Deshaies. 2006. PPARg agonism increases rat adipose tissue lipol-ysis, expression of glyceride lipases, and the response of lipolysisto hormonal control. Diabetologia. 49: 2427–2436.
Effect of MR F344 rat AT 23
at Health S
cience Library CB
#7585, on May 18, 2011
ww
w.jlr.org
Dow
nloaded from


![Dietary supplementation with free methionine or methionine … · 2019. 6. 27. · with MHA or DL-methionine in heat stress-exposed broilers [23, 24]. In this study, we hypothesize](https://img.pdfslide.us/doc/110x75/60e337666b3f9a31a45a96d1/dietary-supplementation-with-free-methionine-or-methionine-2019-6-27-with-mha.jpg)