Embed Size (px)
Citation preview
Methanol Recovery Optimization Via Distillation
Chris Lyon
Marie Galante
Arthur Shih
ChE 460 G.G. Brown Industries, Inc.
October 1, 2012
ii
Methanol Recovery Optimization via Distillation for New
Biodiesel Venture for Brown industries, Inc.
Chris Lyon, Lead Engineer
Marie Galante, Process Engineer
Arthur Shih, Process Engineer
ChE 460 G.G. Brown Industries Inc.
Final Report
Plant Monday
October 1, 2012
We have neither given nor received unauthorized aid on this
report, nor have we concealed any violations of the Honor
Code.
__________
Chris Lyon
__________
Marie Galante
__________
Arthur Shih

iii
Abstract
[intro to distillation column, and fact that we’re using it to distill the waste stream so
meathanol can be reused in the biodiesel production process.
[Insert Super quick summary of major results]
iv
Table of Contents
Abstract .......................................................................................................................................... iii
1. Overview ....................................................................................................................................1
Objectives ............................................................................................................................1
Summary of Key Results .....................................................................................................2
2. Background ................................................................................................................................3
Distillation Column Apparatus ............................................................................................3
Methanol and Water Separation...........................................................................................3
GC Correlation Curve ..........................................................................................................4
Mass Transfer Parameters ....................................................................................................5
Control Run ..........................................................................................................................5
Shortcut Distillation Modeling Spreadsheet ........................................................................5
Modeling Assumptions ........................................................................................................5
Correlation of Hog and Vapor Velocity ...............................................................................6
3. Materials and Methods ...............................................................................................................8
Equipment ............................................................................................................................8
Materials ..............................................................................................................................9
Experimental Procedures ...................................................................................................10
4. Results and Analysis ................................................................................................................14
GC Correlation Curve ........................................................................................................14
Mass-Parameters ................................................................................................................20
Control Run ........................................................................................................................26
Validation of Shortcut Distillation Spread Sheet ...............................................................27
Correlation of Hog vs. Vapor Velocity ..............................................................................28
5. Discussion ................................................................................................................................30
Addressing Objectives .......................................................................................................30
Error Analysis ....................................................................................................................33
6. Conclusions and Recommendations ........................................................................................37
7. References ................................................................................................................................38
List of Appendices .........................................................................................................................40
Appendix A: Distillation Equipment
Appendix B: Example Calculations
Appendix C: Extra Figures
Appendix D: Error Analysis Example Calculations
Appendix E: Raw Experimental Data

1
1. Overview
Brown Industries, Inc. is entering the biofuel market and is interested in designing and building
a plant in Michigan to convert oil to biodiesel for commercial use. In this process, methanol will
be recovered from waste streams and purified using distillation to be reused in the
transesterification reaction and water purified enough to be reused in the POD extraction.
[talk about the 3 rotations to show we understand how our rotation fits in with the overall
scope of the project] On September 7, 2012, you requested our team to conduct a feasibility
study to determine whether building a packed column with “Pro-Pak” protruded metal packing
(Scientific Development Co.) will be more economical than an equivalent tray column.
1.1 Objectives
Below are the objectives for the first rotation:
● Characterize methanol-water distillation process from pilot scale experiments
● Identify operational limits of column
● Develop a simulation model for the packed-bed distillation that incorporates economic
analysis of the distillation process
● Investigate scale-up of the process unit to the corresponding industrial unit using ASPEN
In order to meet the above objectives, below are our goals for the first rotation:
● Determine a calibration curve for the Gas Chromatograph with methanol-water
standards.1
● Create a process flow diagram and determine mass-transfer parameters such as Nog
and Hog for various runs. These parameters will be compared to the data from
Scientific Development Co.1
● Perform a “control run” at conditions which give methanol compositions in the distillate
which are higher than 98 vol%. Assess the reproducibility of this run.
● Either validate the existing shortcut distillation modeling spreadsheet or develop a new
model which can predict the performance of the pilot-scale column. Use experimental
data to validate the accuracy of the model and to measure the characteristics of the
packing.1
● Correlate Hog vs. vapor velocity for the methanol-water system.1
The purpose of this report is to describe how our team plans to meet these objectives,
including the experimental design applied to accomplish the objectives, the results obtained,
analysis performed, and recommendations for further improved investigation. We believe our

2
work on the distillation column provides a sound foundation for further G.G. Brown Industries,
Inc. experimentation in rotations 2 and 3.
1.2 Summary of Key Results
The essential findings for each of the assignment objectives follow:
1.2.1 GC Calibration Curve
1.2.2 Mass-Transfer Parameters
1.2.3 Control Run
1.2.4 Validation Shortcut Distillation Spreadsheet
1.2.5 Correlation of Hog vs. Vapor Velocity
2. Background
Distillation is a method of separating mixtures based on differences in volatilities of
components. Separation of components depends on the commercial uses of distillation
columns currently range widely. Distillation columns are used for separating crude oil into
fractions to be used for transport, power generation and heating. Columns are used to distilling
water in order to remove impurities. Distillation columns can be used to separate air into pure
oxygen and pure nitrogen.
To improve separations the use of trays can be supplemented by the use of packings. Packings
are passive devices that are designed to increase the interfacial area for vapor-liquid contact.
Packing can be strangely shaped pieces are supposed to impart good vapor-liquid contact when
a particular type is placed together in numbers, without causing excessive pressure-drop across
a packed section. This is important because a high pressure drop would mean that more energy
is required to drive the vapor up the distillation column. Packing provides efficiency of
separation in for the same column height of a tray column. Therefore, packed columns are
usually shorter than trayed columns.
2.1 Distillation Column Apparatus
The TECHNOVATE Fractional Distillation Column can be operated in a constant recycle mode.
This features allows the column to operate for a long time with a relative small amount of feed.
In this operation, the distillate and bottom products are recombined and directed to the feed
3
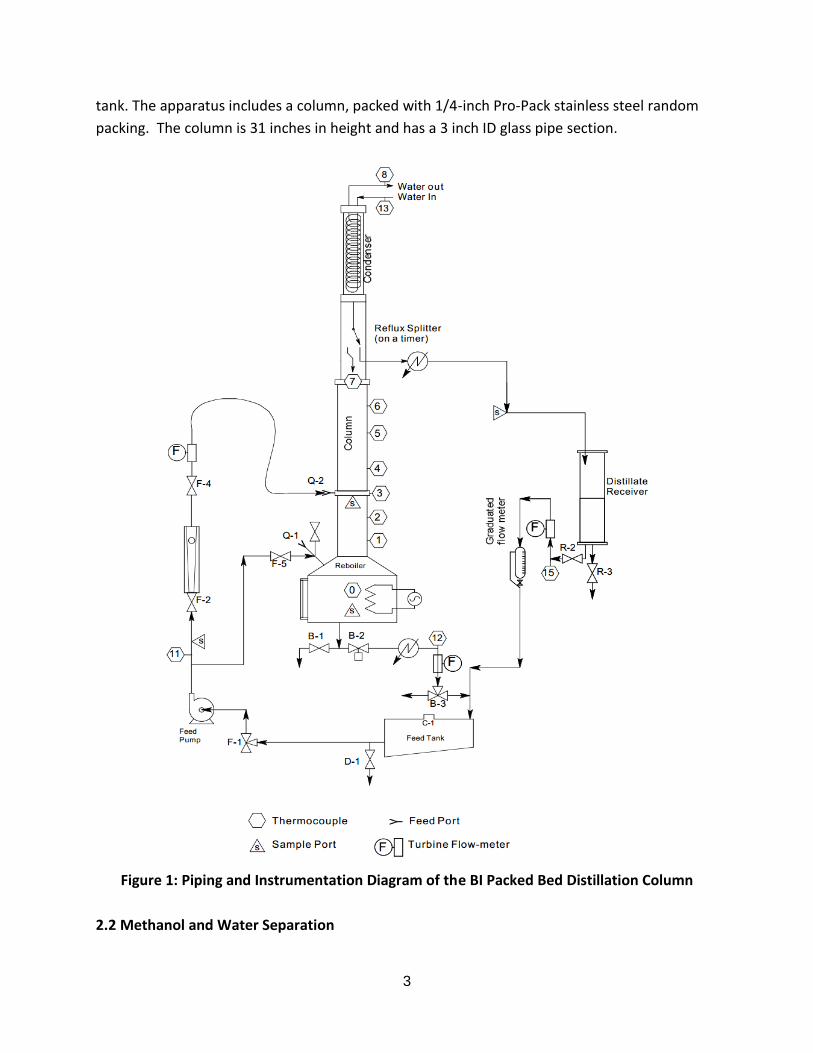
tank. The apparatus includes a column, packed with 1/4-inch Pro-Pack stainless steel random
packing. The column is 31 inches in height and has a 3 inch ID glass pipe section.
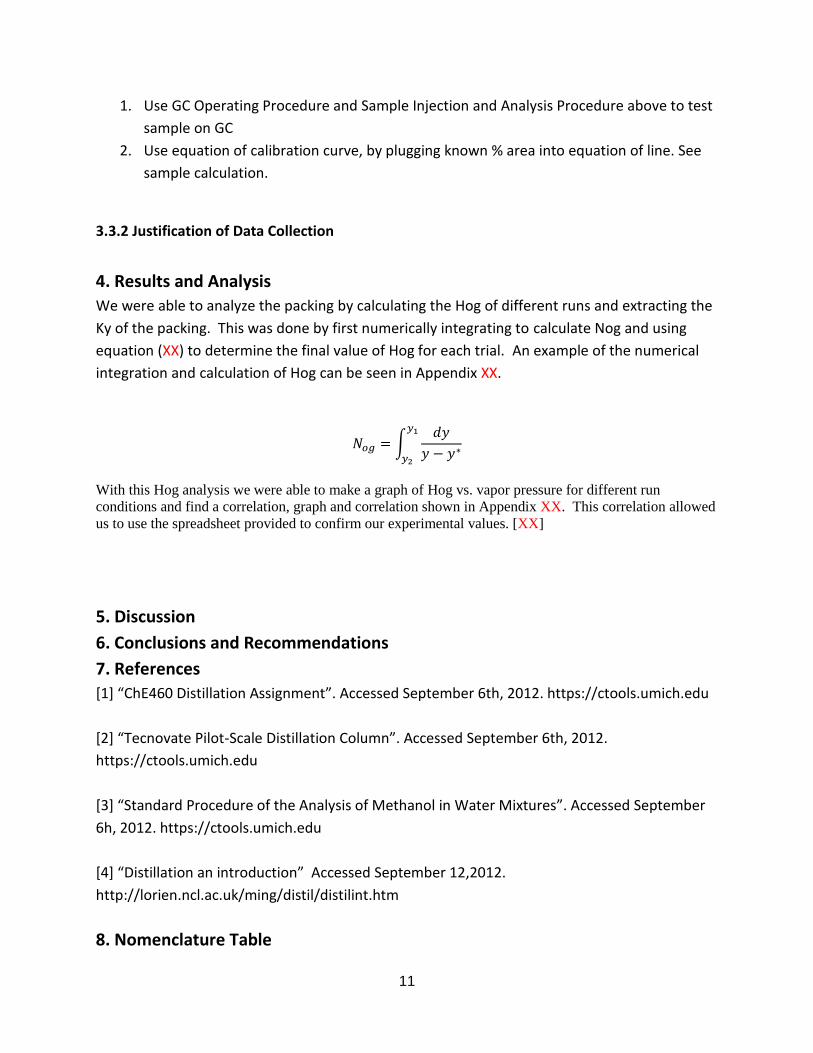
Figure 1: Piping and Instrumentation Diagram of the BI Packed Bed Distillation Column
2.2 Methanol and Water Separation

4
Distillation is possible for a methanol-water mixture because their vapor and liquid
concentrations vary with temperature, as shown in a T-x-y diagram (Figure 2). Using this
property of the methanol-water mixture, it is possible produce high purity methanol.
2.3 GC Correlation Curve
In order to determine the concentration of methanol in the distillate a Gas Chromatograph (GC)
will be used. A GC will report the area under the curve for each component (methanol and
water) which is proportional to the amount of each component in the sample. A calibration
curve will be necessary to correlate the percentage of methanol in a sample to the area under
the curve reported by the GC.
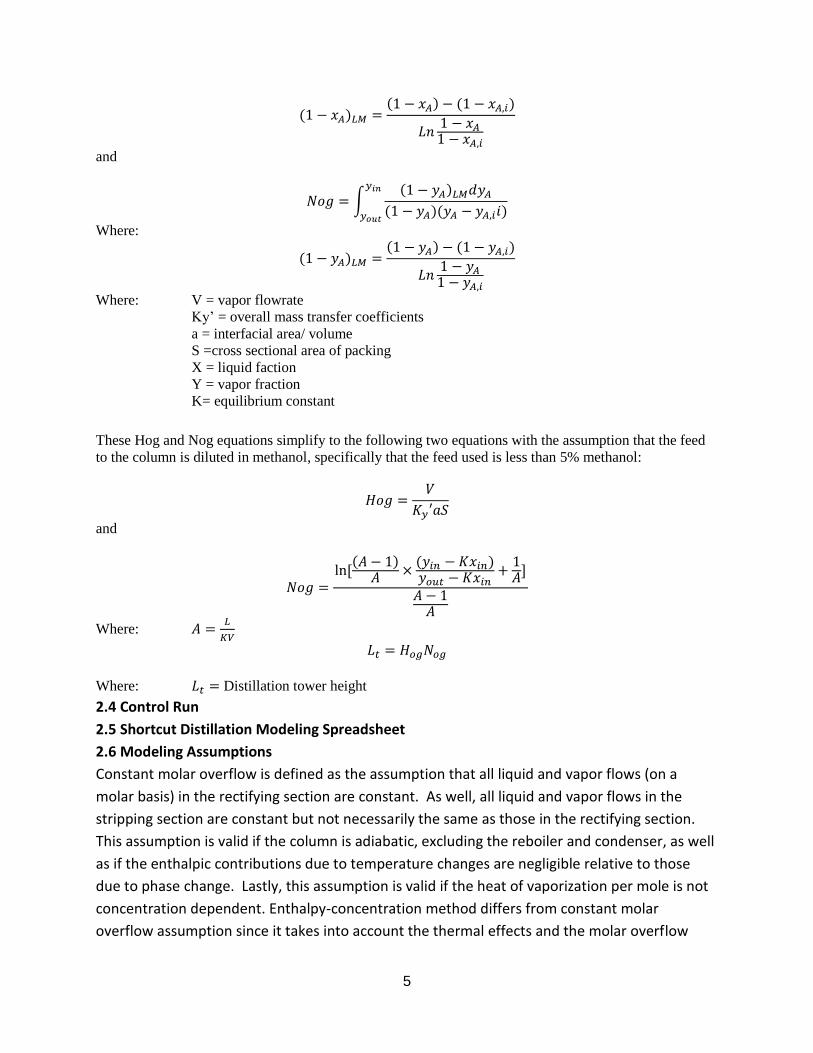
2.3 Mass-Transfer Parameters
Where:
60
65
70
75
80
85
90
95
100
105
110
0 0.1 0.2 0.3 0.4 0.5 0.6 0.7 0.8 0.9 1
Te
mp
era
ture
(°C
)
Vapor or Liquid mole fraction
5
and
∫
Where:
Where: V = vapor flowrate
Ky’ = overall mass transfer coefficients
a = interfacial area/ volume
S =cross sectional area of packing
X = liquid faction
Y = vapor fraction
K= equilibrium constant
These Hog and Nog equations simplify to the following two equations with the assumption that the feed
to the column is diluted in methanol, specifically that the feed used is less than 5% methanol:
and
Where:
Where: Distillation tower height
2.4 Control Run
2.5 Shortcut Distillation Modeling Spreadsheet
2.6 Modeling Assumptions
Constant molar overflow is defined as the assumption that all liquid and vapor flows (on a
molar basis) in the rectifying section are constant. As well, all liquid and vapor flows in the
stripping section are constant but not necessarily the same as those in the rectifying section.
This assumption is valid if the column is adiabatic, excluding the reboiler and condenser, as well
as if the enthalpic contributions due to temperature changes are negligible relative to those
due to phase change. Lastly, this assumption is valid if the heat of vaporization per mole is not
concentration dependent. Enthalpy-concentration method differs from constant molar
overflow assumption since it takes into account the thermal effects and the molar overflow
6
rates are not necessarily constant. The enthalpy–concentration method for a binary vapor–
liquid mixture takes into account latent heats, heats of mixing, and sensible heats of the
components of the mixture.
2.7 Correlation of Hog and Vapor Velocity
3. Materials and Methods
3.1 Equipment
The equipment consists of the following parts. Figure A-1 shows a schematic diagram of the
exchange column:
● Feed Tank Reservoir. An 8-gallon stainless steel tank with a sloping bottom for proper
drainage is provided to use the column in the recycle mode. This reservoir is fitted with
a liquid-level sight-glass, a drainage valve, and a safety filler cap.2
● Reboiler. A cylindrical stainless steel tank with a capacity of approximately 3.8 - 4.0 gal
at operating level. The boiler, covered with foam rubber insulating material, is encased
top and sides with stainless steel sheet metal. The tank is fitted with a quick-disconnect
coupling port for feed and a sight-glass for visual liquid level indication. The main
heating element is a stainless steel sheathed bayonet-type 3-phase electric heater with
a nominal power rating of 15 Kilowatts at 240 VAC (but operating at 208 VAC). Thermal-
overload protection is provided by a manual-reset, pilot-lighted power switch located in
an auxiliary heater and by a level switch that will not allow the heater to turn on until
the liquid level is completely covering the heaters. The auxiliary heater power rating is
200 watts at 240 VAC (but operating at 208 VAC). The total maximum power generated
by the reboiler heaters is approximately 11 kW at 208 VAC. The power to the two
heating elements is controlled by an electronic switch which operates by cycling the
heater on and off in 1 to 3 seconds intervals. The relative times the heaters are on or off
determine the amount of power supplied to the reboiler. A flow switch located in the
condenser water line assures that no power can be applied to the reboiler if the water
flow to the condenser is shut-off. Liquid level control is obtained by means of a second
level switch that actuates a solenoid-operated valve. This valve recycles excess liquid
from the still boiler to the feed reservoir. The reboiler also has a drainage stopcock. A
stainless steel flange-type fitting directly connects the distillation column to the boiler.2
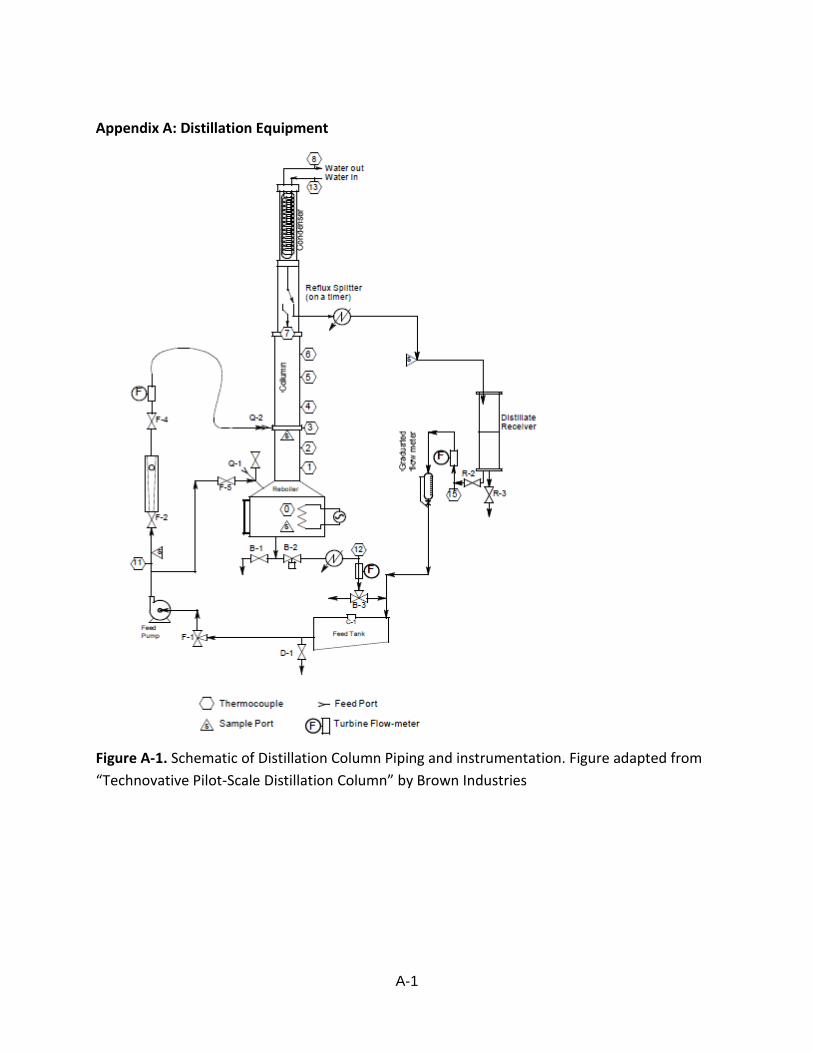
● Packed Column. Consists of 2 packed bed sections each assembled from a 3- inch ID
glass pipe section. Each section contains process fittings for feed, pressure and
temperature measurement. A sample valve is available between the packed sections to
sample the liquid leaving the rectifier (enriching) section. Fig. A-2 shows the layout of
the sample port section at the middle of the column, indicating the liquid flow path
7
through the sample port and the position of the feed distributor. The packed column,
when assembled, is approximately 31 inches in height, bolted to the top of the reboiler
at the bottom and to the reflux splitter at the upper end. The packing sections are 12
and 18 inches long for bottom and top respectively, and they are filled with 1/4-inch
Pro-Pack stainless steel random packing.2
● Reflux Splitter. Used to set the desired reflux ratio by switching the condensate flow
from the reflux position to the distillate position a predetermined amount of time each.
The default (power OFF) position for the reflux splitter is for total reflux. The timer to
change the time allocated to each position is located on the rear of the apparatus. The
green button to select the field to be changed, the red button changes the value of that
field. The field values should be:TON distillate time; TOFF reflux time.2
● Condenser. Pyrex and stainless steel shell-and tube type heat exchanger, which contains
the equivalent of 3.5 sq. ft. of spiral-tube heat exchange surface. The tube side coolant
is water from the municipal water supply. Thermocouples are placed in the tube side to
monitor the inlet and outlet temperatures of the cooling water. The top of the
condenser is vented through a flame arrestor. The shell side condensate drains directly
into a reflux splitter. The cooling water supply to the condensed is equipped with a flow-
switch that will cut the power to the reboiler if there is a loss of water flow to the unit.2
● Distillate Receiver. A 3-inch OD by 12-inch long Pyrex glass tube that is flanged top and
bottom with stainless steel caps. Condensate enters from the condenser through a 3/8-
inch stainless steel tube into the top. There are two connections at the bottom of the
receiver: a valve drain, and a valve connecting to the distillate flow flowmeter.2
● Instrumentation and Control Panel. A voltmeter and ammeter for power input
indication, a boiler liquid level control switch for automatic operation, on/off electrical
switches for main power, reboiler power, feed pump, reflux splitter, and a continuously
variable control elements for the main boiler heater. The ammeter is calibrated with a
0-100% scale which corresponds approximately to 0-100% of the maximum power of
the reboiler heater. This ammeter does not provide any information on the power used
by the pumps, or the rest of the system, only on the power used in the reboiler. On the
back side of the Distillation apparatus there is a 3-phase power meter, which is
connected directly to the power supply to the reboiler heaters. This power meter has
two digital indicators. The main power counter (non-resettable) located n top, records
cumulative power in 100 watt-hour increments (0.1 kWh). The auxiliary power counter
(user resettable) located below, records cumulative power in 1 watt-hour increments.
These Power meters are more accurate than the ammeter in the front panel to estimate
the power used by the reboiler.2
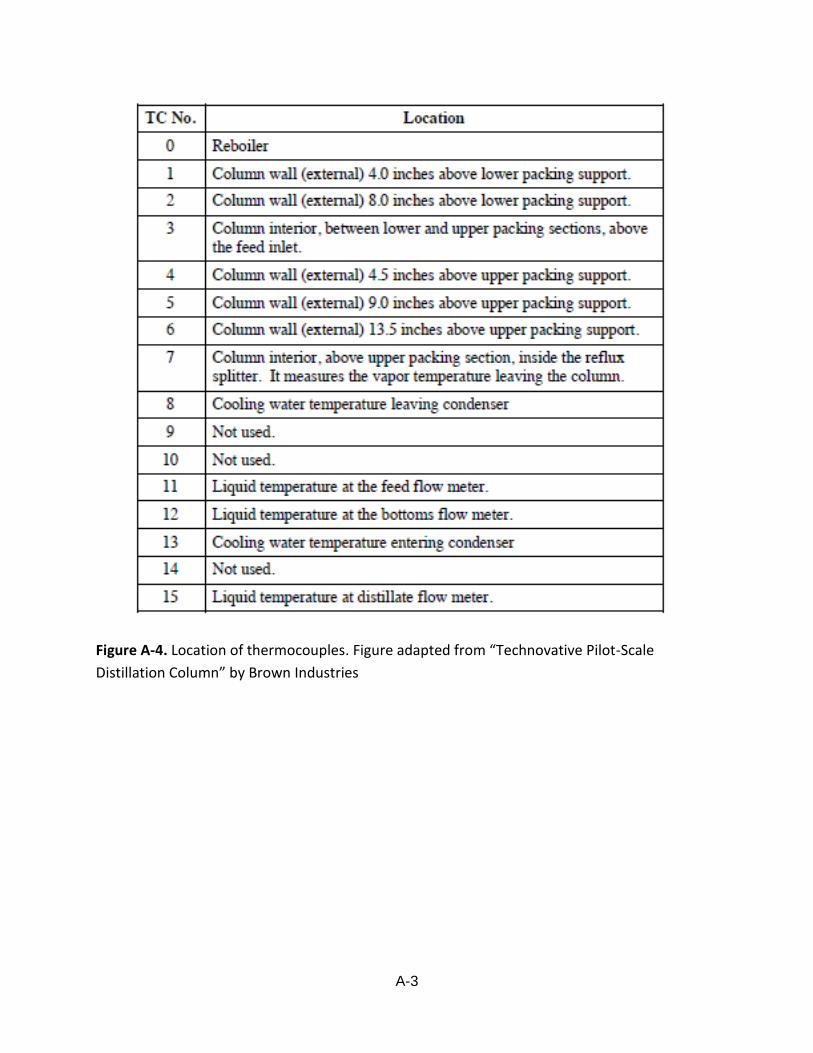
● Thermocouples. A total of 16 type K (chromel-alumel) thermocouples (TC) are installed
at various locations throughout the distillation column system. These thermocouples are

8
connected to a computer for monitoring and data logging. Thermocouples 1, 2, 4, 5, and
6 are fixed to the exterior glass surface of the packed column wall and under the
insulation. These 6 thermocouples are slow to respond to temperature changes and
record temperatures that are slightly lower than the streams inside the column. All
other thermocouples are inserted in the stream being measured. All temperature values
are displayed and saved to file in degrees Celsius.2 See Figure A-4 in appendix A for
location of thermocouples.
● Rotameters. Mounted on the main panel, used to measure the feed and coolant flows.
The feed rotameter is nominally rated at 700 cc/min for a liquid with a specific gravity of
1.0 at standard conditions. The scale reads from 10 to 100. Distillation Manual – 6 The
floats inside the glass tubes are glass and tungsten carbide (carballoy) with a diameter
of 0.25 inches and densities of 2.53 and 14.98 g/ml respectively. Flow rate data for a
generalized calibration of this rotameter is available in the Calibration of Distillation
Column Rotameters memo in the appendix to this section. The condenser cooling water
rotameter has a nominal rating of 0 to 1.6 GPM. for water.2
● Turbine Flow Meters. There are three volumetric turbine flow meters to measure the
feed, distillate and bottoms flows. Two of these flowmeters (Cole-Parmer models E-
32250-00) and their associated instrumentation have a range of approximately 50 to
1600 ml/min for the feed and 50 to 800 ml/min for the distillate. The expected accuracy
of these flow meters is ± 20 ml/min. The bottoms flow meter (Cole-Parmer model E-
32250-30) has a range of approximately 500 to 20,000 ml/min, with an accuracy of ±
200 ml/min. These flow meters exhibit a non-linear behavior below the stated range.
The signals from these flow meters are sent to a computer for monitoring and data
logging. All units of flow in the monitor and data files are in ml/min. For more accurate
readings of the distillate flow at very low flow rates a graduated cylinder with a stopcock
at the bottom is provided at the outlet of the distillate flow meter (on the back side of
the apparatus) so the flow can be measured manually with the collected volume and a
timer.2
● Piping and Valving. All piping is either 1/4-inch or 3/8-inch stainless steeltubing. All tube
connections are made with standard stainless steel tube type compression fittings.
Process valves are stainless steel 1/4-inch or 3/8-inch needle or bar stock valves. Quick-
disconnect couplings are used on the flexible hose feed line, packed column, and
reboiler. These couplings, of the double ended, shut- off variety, are constructed of
stainless steel with high temperature, solvent-resistant, synthetic gaskets and seals.2
● Differential Pressure Gauge. The high-pressure tap is connected to the vapor space
above the reboiler (below the stripping section) and the low-pressure side is connected
to the vapor space above the enriching section of the column. This gauge is useful to
9
predict flooding conditions in the packed column. Values of differential pressure
displayed and stored are in inches of water column.2
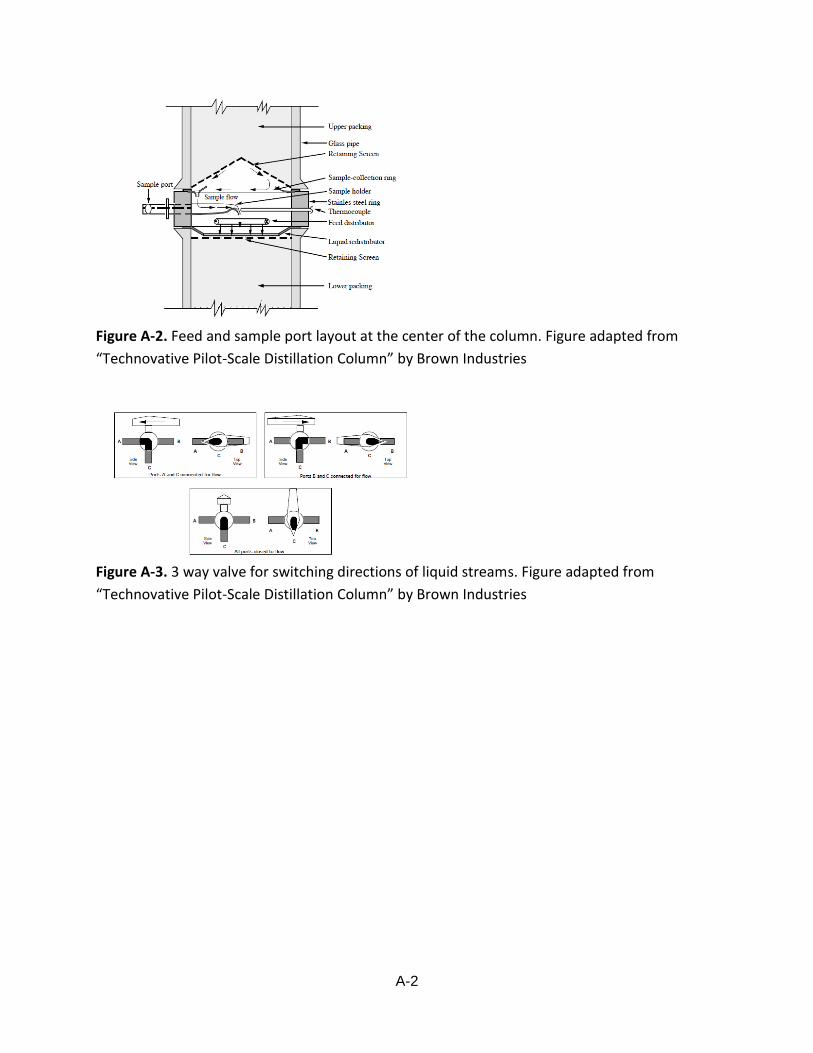
● Three-way Ball valves for switching service. These valves are generally used either to
switch a particular flow into 2 possible directions or to direct either one of 2 different
flows into a desired destination. Fig, A-2 shows a schematic representation of these
valves and how they operate. Valves F-1 and B-3 are used to select either the
Production mode or the Feed-recycle mode of operation.2
● Carle 100 Gas Chromatograph. Located in room 3000 GG. Brown.3
● PeakSimple1 Software. Capable of data acquisition.3
● 2-mL sample vials. For GC analysis of distillation column samples.3
● 1-mL capacity syringe. Syringe has type 5 needle for sample collection from the still.3
● 1-microliter capacity syringe. Syringe is set to deliver 0.2 microliter sample for sample
injection into GC.3
● LabVIEW. Capable of data acquisition.3
● Aspen software. Capable of process flow diagrams.3
3.2 Materials
The following materials are necessary to perform the requested experimentation on the
distillation column:
● Methanol-water standards. Various methanol in water compositions.
● Cooling water. Enough cooling water for condenser to operate for full laboratory time
period.
● Methanol-water feed solution. Enough feed solution to run distillation column for full
laboratory period.
3.3 Experimental Procedure
The follow sections will explain the procedures necessary to obtain the desired objectives.
3.3.1 Collection of Data
Use Personal Protection Equipment
Safety glasses, safety gloves and lab coats will be worn at all times.
Gas Chromatograph Operating Procedure
1. Make sure the GC was on for at least 1 hour prior to use.
2. Make sure that ouput pressure from the helium cylinder is 40psig.
3. Check that helium flows to the columns are set at 20 for both rotameters (this roughly
12ml/min).
10
4. Make sure that the GC control panel switches are in the following positions.
a. Min Powers On
b. Inlet delta T On
c. Column Temperature 90o C
d. Reaout: Right Column
e. Bridge Setting: Thermistor
f. Output: 1
5. . Make sure the Dell computer is attached to the GC and is turned on.
6. . The PeakSimple software must be turned on
a. Username: chelab; password; DataAnalyssis1
b. Double-click on icon named: Peak33-32bit-Shortcut.
c. From the file menu open the file named H20-MEOH.ASC
d. The software is now ready to use
Sample Injection to GC
1. Inject 0.2-microliters of the sample into Column B, located on the right of the GC by
using a 1-microliter syringe.
2. Press the “Spacebar” on the computer key board immediately after injection.
3. When the run is finished, select from the Edit menu the “Smoothing” option. Then click
the “Apply” button.
4. To see the results, select “Results” option under the “View” menu.
5. To print, click “Print” icon on toolbar.
3.3.2 Method for Data Analysis
Develop Calibration Curve Procedure
1. Test the seven standard methanol-water samples provided using the sample inject and
Analysis section.
2. Mix additional trial methanol-water samples with large a percent of methanol to
improve accuracy of the curve for samples with high concentrations of methanol.
3. Convert the given wt.% provided into mol %. See sample calculation #
4. Calculate the % of area under each peak from the results provide by the GC. See sample
calculation #
5. In excel, make a scatter plot with mol. % on the y axis and % area of peak 1 on the x axis.
On the same graph, plot mol. % on the y axis and and % area of peak 2 on the x axis.
6. Add a trendline and equation of the line to the plot.
7. Use trendline to calculate the mol.% methanol in any sample taken from
Determine mol% Methanol in Sample
11
1. Use GC Operating Procedure and Sample Injection and Analysis Procedure above to test
sample on GC
2. Use equation of calibration curve, by plugging known % area into equation of line. See
sample calculation.
3.3.2 Justification of Data Collection
4. Results and Analysis
We were able to analyze the packing by calculating the Hog of different runs and extracting the
Ky of the packing. This was done by first numerically integrating to calculate Nog and using
equation (XX) to determine the final value of Hog for each trial. An example of the numerical
integration and calculation of Hog can be seen in Appendix XX.
∫
With this Hog analysis we were able to make a graph of Hog vs. vapor pressure for different run
conditions and find a correlation, graph and correlation shown in Appendix XX. This correlation allowed
us to use the spreadsheet provided to confirm our experimental values. [XX]
5. Discussion
6. Conclusions and Recommendations
7. References
[1] “ChE460 Distillation Assignment”. Accessed September 6th, 2012. https://ctools.umich.edu
[2] “Tecnovate Pilot-Scale Distillation Column”. Accessed September 6th, 2012.
https://ctools.umich.edu
[3] “Standard Procedure of the Analysis of Methanol in Water Mixtures”. Accessed September
6h, 2012. https://ctools.umich.edu
[4] “Distillation an introduction” Accessed September 12,2012.
http://lorien.ncl.ac.uk/ming/distil/distilint.htm
8. Nomenclature Table
12
List of Appendices
Appendix A: Distillation Equipment
Appendix B: Example Calculations
Appendix C: Extra Figures
Appendix D: Error Analysis Example Calculations
Appendix E: Raw Experimental Data
Appendix XX: Sample Numerical Integration
Appendix XX: Hog vs. Vapor Pressure
A-1
Appendix A: Distillation Equipment
Figure A-1. Schematic of Distillation Column Piping and instrumentation. Figure adapted from
“Technovative Pilot-Scale Distillation Column” by Brown Industries
A-2
Figure A-2. Feed and sample port layout at the center of the column. Figure adapted from
“Technovative Pilot-Scale Distillation Column” by Brown Industries
Figure A-3. 3 way valve for switching directions of liquid streams. Figure adapted from
“Technovative Pilot-Scale Distillation Column” by Brown Industries
A-3
Figure A-4. Location of thermocouples. Figure adapted from “Technovative Pilot-Scale
Distillation Column” by Brown Industries

B-1
Appendix B: Example Calculations
Create Calibration Curve Procedure
1. Convert the given wt. % provided into mol %.
=39.18
Similar calculation can be done to find mol. % H2O
2. Calculate the % of area under each peak from the results provide by the GC.
Similar calculation can be done to find the % Area of Peak 2
3. In excel, make a scatter plot with mol. % on the y axis and % area of peak 1 on the x axis. 4. On the same graph, plot mol. % on the y axis and the % area of peak 2 on the x axis. Add
a trendline and equation of the line to the plot.
5. Use trendline to calculate the mol.% methanol in any sample taken from the column
When % area of Peak 1 is 5.7089:
y = 1.0343x - 5.7266 R² = 0.9862
y = -1.0343x + 97.702 R² = 0.9862
-20
0
20
40
60
80
100
120
0 20 40 60 80 100 120
mo
l % M
eO
H
% Peak Area
Peak 1
Peak 2
B-2
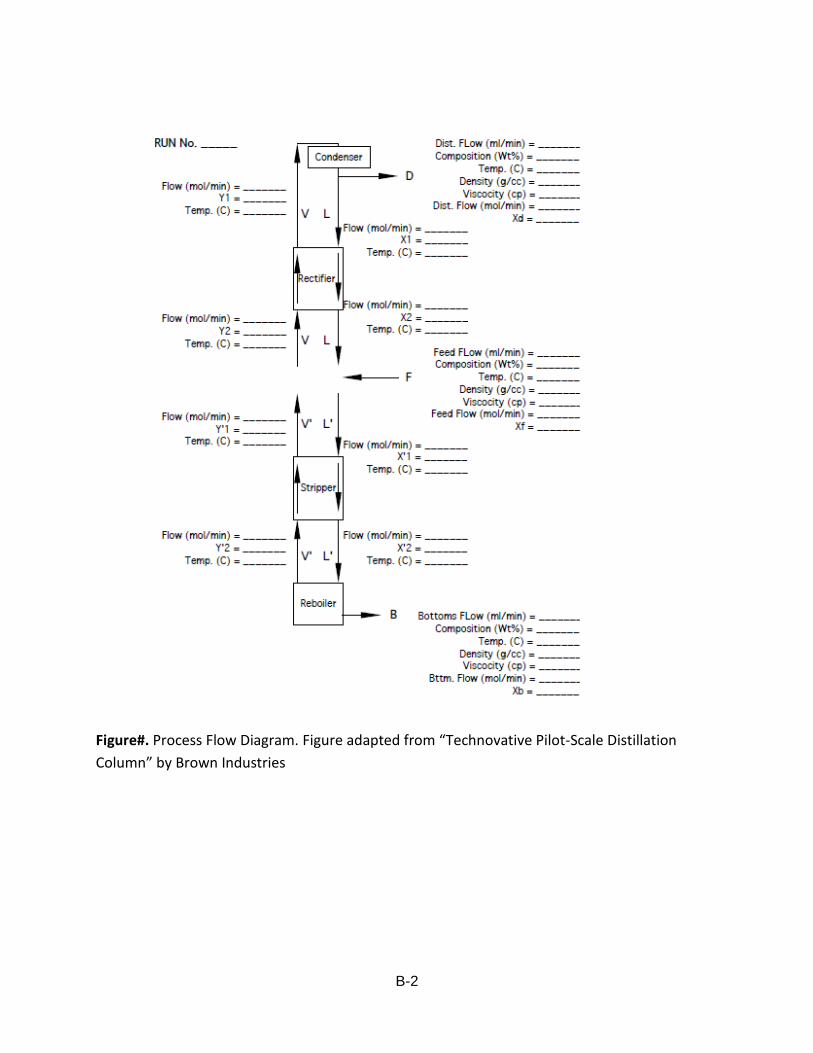
Figure#. Process Flow Diagram. Figure adapted from “Technovative Pilot-Scale Distillation
Column” by Brown Industries
B-3
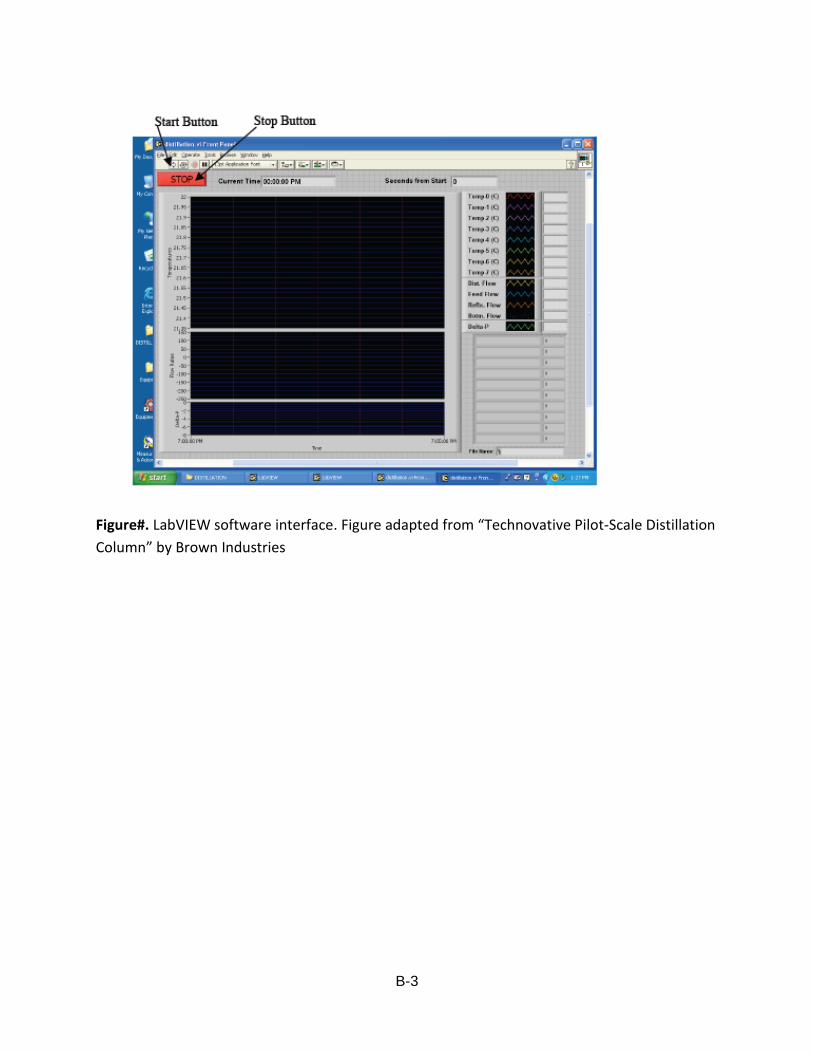
Figure#. LabVIEW software interface. Figure adapted from “Technovative Pilot-Scale Distillation
Column” by Brown Industries

B-4
Appendix XX: Sample Numerical Integration


![Data Distillation: Towards Omni-Supervised Learning · Data Distillation model A model A Figure 1. Model Distillation [18] vs. Data Distillation. In data distillation, ensembled predictions](https://img.pdfslide.us/doc/110x75/60a237adb93b13457117b793/data-distillation-towards-omni-supervised-learning-data-distillation-model-a-model.jpg)