Embed Size (px)
Citation preview
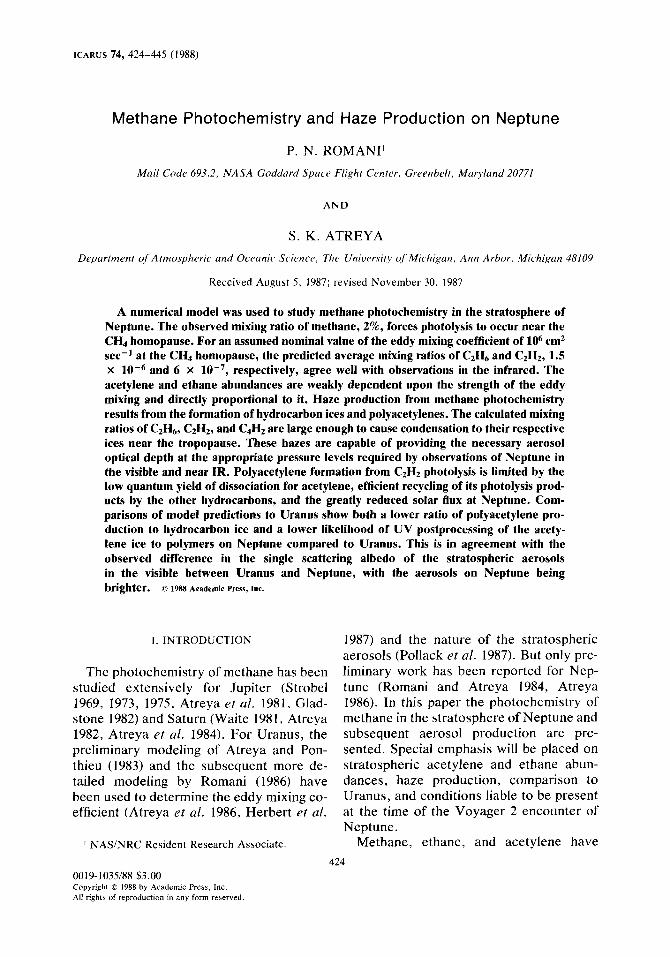
ICARUS 74, 424--445 (1988)
Methane Photochemistry and Haze Production on Neptune
P. N. R O M A N P
Mail Code 693.2, NASA Goddard Space Flight Center, Greenbelt, Map~yland 20771
AND
S. K. A T R E Y A
Department of Atmospheric and Oceanic' Science, The University of Michigan, Ann Arbor, Miehigan 48109
Received August 5, 1987; revised November 30, 1987
A numerical model was used to study methane photochemistry in the stratosphere of Neptune. The observed mixing ratio of methane, 2%, forces photolysis to occur near the CH4 homopause. For an assumed nominal value of the eddy mixing coefficient of 106 cm 2
sec -1 at the CH4 homopause, the predicted average mixing ratios of CzH6 and C2Hz, 1.5 x 10 -6 and 6 x 10 -7, respectively, agree well with observations in the infrared. The acetylene and ethane abundances are weakly dependent upon the strength of the eddy mixing and directly proportional to it. Haze production from methane photochemistry results from the formation of hydrocarbon ices and polyacetylenes. The calculated mixing ratios of C2H6, C2H2, and C4H2 are large enough to cause condensation to their respective ices near the tropopause. These hazes are capable of providing the necessary aerosol optical depth at the appropriate pressure levels required by observations of Neptune in the visible and near IR. Polyacetylene formation from C2H2 photolysis is limited by the low quantum yield of dissociation for acetylene, efficient recycling of its photolysis prod- ucts by the other hydrocarbons, and the greatly reduced solar flux at Neptune. Com- parisons of model predictions to Uranus show both a lower ratio of polyacetylene pro- duction to hydrocarbon ice and a lower likelihood of UV postprocessing of the acety- lene ice to polymers on Neptune compared to Uranus. This is in agreement with the observed difference in the single scattering aibedo of the stratospheric aerosols in the visible between Uranus and Neptune, with the aerosols on Neptune being br igh te r . © 1988 Academic Press, Inc.
I. INTRODUCTION
The photochemis t ry of methane has been studied extensively for Jupiter (Strobel 1969, 1973, 1975, At reya et al. 1981, Glad- stone 1982) and Saturn (Waite 1981, At reya 1982, At reya et al. 1984). For Uranus, the prel iminary modeling of At reya and Pon- thieu (1983) and the subsequent more de- tailed modeling by Romani (1986) have been used to determine the eddy mixing co- efficient (Atreya et al. 1986, Herber t et al.
f NAS/NRC Resident Research Associate.
0019-1035/88 $3.00 Copyright © 1988 by Academic Press, Inc. All rights of reproduction in any form reserved.
1987) and the nature of the stratospheric aerosols (Pollack et al. 1987). But only pre- liminary work has been repor ted for Nep- tune (Romani and At reya 1984, Atreya 1986). In this paper the photochemis t ry of methane in the s t ra tosphere of Neptune and subsequent aerosol product ion are pre- sented. Special emphasis will be placed on stratospheric acetylene and ethane abun- dances, haze production, compar ison to Uranus, and conditions liable to be present at the t ime of the Voyager 2 encounter of Neptune.
Methane, ethane, and acetylene have
424
NEPTUNE METHANE PHOTOCHEMISTRY 425
been detected in emission in the infrared from Neptune (Macy and Sinton 1977, Or- ton et al. 1983, 1987). The photolysis of methane in the stratosphere of Neptune produces ethane and acetylene, so numeri- cal modeling of the photochemistry should be able to reproduce the observed mixing ratios of C2H2 and C2H6. This procedure is sensitive to the amount of eddy mixing and presently allows some constraints to be placed upon the value of the eddy mixing coefficient. Numerical modeling also pro- duces more detailed profiles of the hydro- carbons than can be deduced from the IR. This is important as these gases are IR ac- tive and affect the thermal structure of the stratosphere (Courtin et al. 1979, Appleby 1986). Furthermore, height profiles of the hydrocarbons are needed to derive the strength of atmospheric vertical mixing from Voyager UVS occultation data.
On Neptune, the model-predicted abun- dances of acetylene and ethane in the lower stratosphere are much greater than their maximum allowable abundances from the equilibrium saturation vapor pressures over their respective ices. Thus, we expect ice haze formation in the lower stratosphere of Neptune. Methane photochemistry has also been proposed as a source of polyacetylene aerosols (Gladstone 1982, Allen et al. 1980). These aerosols, ices and polyacety- lenes, are capable of affecting the visibility (Bergstralh et aI. 1987), albedo (Lockwood and Thompson 1986), and thermal structure of the lower stratosphere (Appleby 1986). Other possible sources of aerosols, PH3 and/or NH3 photochemistry (West et al. 1986), will not be active because of the re- moval of the parent species in the lower troposphere by condensation (Weiden- schilling and Lewis 1973, Romani 1986). Hydrocarbon ice formation and polyacety- iene production also occur on Uranus (Romani and Atreya 1986, Pollack et al. 1987), so modeling must be able to repro- duce the observed differences of the two planets' stratospheric aerosols (Bergstralh and Baines 1984, Bergstralh et al. 1987).
The paper is organized into the following sections. The methane photochemistry model is described in Section II. The alti- tude profiles of methane, ethane, and acety- lene calculated by the photochemical model are discussed in Section III. In Section IV, the aerosols produced from methane photo- chemistry are analyzed. The results are summarized in Section V.
II. PHOTOCHEMICAL MODEL
A. N u m e r i c a l P r o c e d u r e
The numerical model solves the coupled continuity equations for methane and its photolysis products by using an iterative Newton-Raphson technique (Ames 1969). Fixed-point boundary conditions and a con- vergence criteria of 1% were used for all studies. The model assumes a steady-state condition and a horizontally averaged at- mosphere so the continuity equation for the ith species becomes
dFi/dz = P i - Li,
where z is the altitude, Fi is the flux of spe- cies i in molecules cm -2 sec -I, Pi is the chemical production rate and Li is the chemical loss rate of species i both in units of molecules cm -3 sec -1. In the model, methane (CH4), methyl radical (CH3), eth- ylene (C2H4) , acetylene (C2H2), ethane (C2H6), and atomic hydrogen (H) undergo both transport and photochemical reac- tions. The radicals, methylidyne (CH), ground-state methylene (3CH2), excited methylene 0CH2), ethynyl (C2H), vinyl (C2H3), and ethyl (C2H5), are assumed to be in photochemical equilibrium. The mixing ratio profile of diacetylene, C4H2 (the first polyacetylene produced from acetylene photolysis), was solved separately by using as input the already converged profiles of the other hydrocarbons and eddy mixing. This is justified by the weak feedback of diacetylene photolysis into the photochem- istry of the other hydrocarbons. As diacety- lene is not a radical, it also undergoes both transport and photochemical reactions in
426 ROMANI AND ATREYA
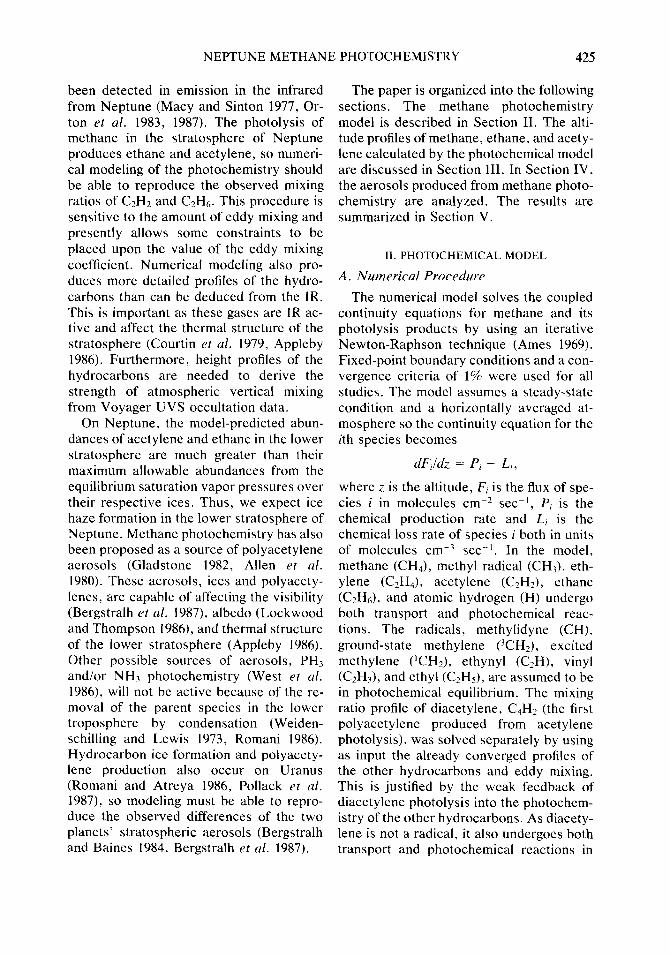
• ,, tolysis product of methane is the CH radi- ~ ,+ , cal which quickly reacts with methane to
~ ~ produce ethylene. The primary fate of the methyl radical is
to recycle to CH4, but it also self-reacts and + h k ~ ~ ~ H . y ~ produces C2H6. Ethane is chemically stable
. and is only destroyed by photolysis, pro- ducing acetylene or ethylene, or removed
J ~ ~ ~ ~ by eddy mixing. Photolysis proceeds slowly for C2H6 as it absorbs only in the
+H~N~ +H2. +C2H 6 same spectral region as methane. Thus, ~'2'\ H+M CH4 acts as an ultraviolet shield for ethane + C2H 3
FIG. 1. Reaction pathways for methane photochem- istry. A * denotes a radical assumed to be in local photochemical equilibrium. Adapted from Atreya and Romani (1985), with the exception of rightmost path- ways producing C4Hz.
the model. From comparison of results to observations of the hydrocarbons in the stratospheres of Jupiter, Saturn, and Uranus, we estimate a maximum uncer- tainty of a factor of 2 in the mixing ratios computed by the photochemical model (Atreya et al. 1981, 1986, Atreya 1982, Herbert et al. 1987).
B. P h o t o c h e m i s t r y
In this section the photochemical path- ways in methane photolysis and hydrocar- bon production are outlined. The relative importance of these pathways for Neptune will be discussed under Results. A sche- matic of the photochemistry used in our model is shown in Figs. 1 and 2. As Nep- tune is a rapid rotator, the photolysis rates used in the model are diurnal averages.
The photolysis of methane is carried out primarily at Lyman-~ due to the large solar flux at this wavelength. This produces ap- proximately equal quantities of JCH2 and 3CH2. These radicals then rapidly react with H2 and H to produce principally CH3. Direct production of CH3 from methane photolysis is quantum-mechanically forbid- den and this has been confirmed by experi- ment (Slanger 1982). The other direct pho-
allowing its relative abundance to build up before its eventual removal by eddy mixing.
The ethylene produced by the above re- actions is destroyed rapidly by reacting with H and by photolysis. Unlike ethane, ethylene has a significant cross section of absorpotion beyond the methane cutoff at 1500 A, so photolysis is not hampered by methane shielding.
The acetylene produced from both C2H6 and C2H4 photolysis is removed only by photolysis and eddy mixing. (C2H3 formed by the three-body reaction of H with C2H 2 primarily recycles to acetylene by reacting with H.) Even though acetylene, like ethyl- ene, has a significant cross section in the UV beyond the methane cutoff, photolysis
+ hv
+CH 4, +C2H 6
H 2
H 2
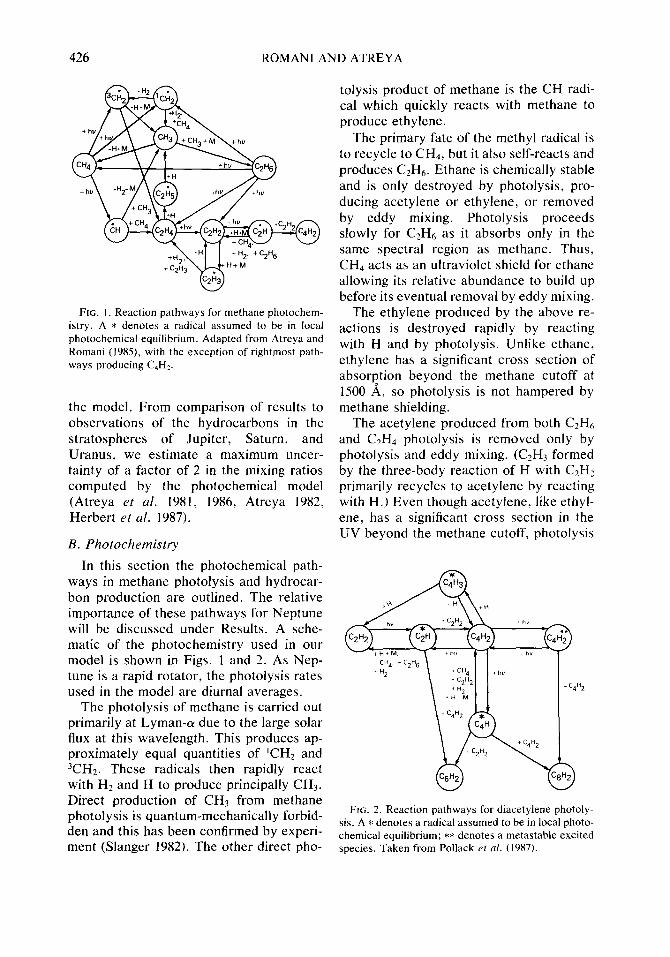
FIG. 2. Reaction pathways for diacetylene photoly- sis. A * denotes a radical assumed to be in local photo- chemical equilibrium; ** denotes a metastable excited species. Taken from Pollack et al. (1987).
NEPTUNE METHANE PHOTOCHEMISTRY 427
is not an efficient sink for C2H2. The quan- tum yield for dissociation for acetylene is small and its photolysis products are rap- idly recycled back to acetylene by the other hydrocarbons and H2.
The photochemistry of diacetylene has also been included (Fig. 2). The reaction scheme is similar to the one of Yung et al. (1984), but we have made use of the recent laboratory measurements of Glicker and Okabe (1987) for the cross section of ab- sorption and quantum yields of C4H2 pho- tolysis. After undergoing photolysis, di- acetylene either gives back acetylene, recy- cles, or reacts to produce higher order polyacetylenes. Unfortunately there are no laboratory measurements of the reactions involving the C4H radical or of CzH with C4H2. These reaction rates have been esti- mated in the manner of Yung et al. The reaction of ground-state C4H2 with its meta- stable excited state has been assumed to be the collisional rate. The lifetime of the metastable excited state of C4H 2 against ra- diative relaxation has been assumed to be 1 msec. The data of Glicker and Okabe yield only a lower limit, and our value represents an upper limit. In our studies for Neptune the excited metastable pathway for poly- acetylene formation was never important.
C. F lux Equa t ion
The flux term in the continuity equation used in the numerical model includes con- tributions from both eddy mixing and mo- lecular diffusion. This is because the region of interest for methane photochemistry ex- tends from the tropopause, where the atmo- sphere is well mixed, to the methane homo- pause. This expression for the flux of the ith species, F/, is
Fi = - ( K + Di) * [dni/dz + (hilT) * dT/dz
+ ni * ( I / H + 1/Hi)I,
where K is the eddy mixing coefficient, T the atmospheric temperature, H the mixed atmosphere scale height, and Di, ni, and Hi are, respectively, the molecular diffusion coefficient, number density, and scale
height of the ith species. The homopause for the ith species is defined to be where Di = K.
The molecular diffusion coefficients for the hydrocarbons and atomic hydrogen in H2 and He used in the model are from Mar- rero and Mason (1972) and the references contained therein. These background-gas- dependent diffusion coefficients are then combined to produce effective diffusion co- efficients for each species in the model at- mosphere.
The eddy mixing coefficient was chosen to vary with the reciprocal of the square root of the atmospheric number density. This is in agreement with theoretical calcu- lations of the variation of K in a tempera- ture inversion region (Lindzen 1971). Pre- vious analyses of K in the stratospheres of Jupiter, Saturn, and Uranus are also com- patible with this variation of K (Atreya et al. 1981, 1986, Atreya 1982, Herbert et al. 1987). The values of K quoted in this paper hereafter will be their values at the CH4 ho- mopause in cm 2 see -j.
D. M o d e l A t m o s p h e r e
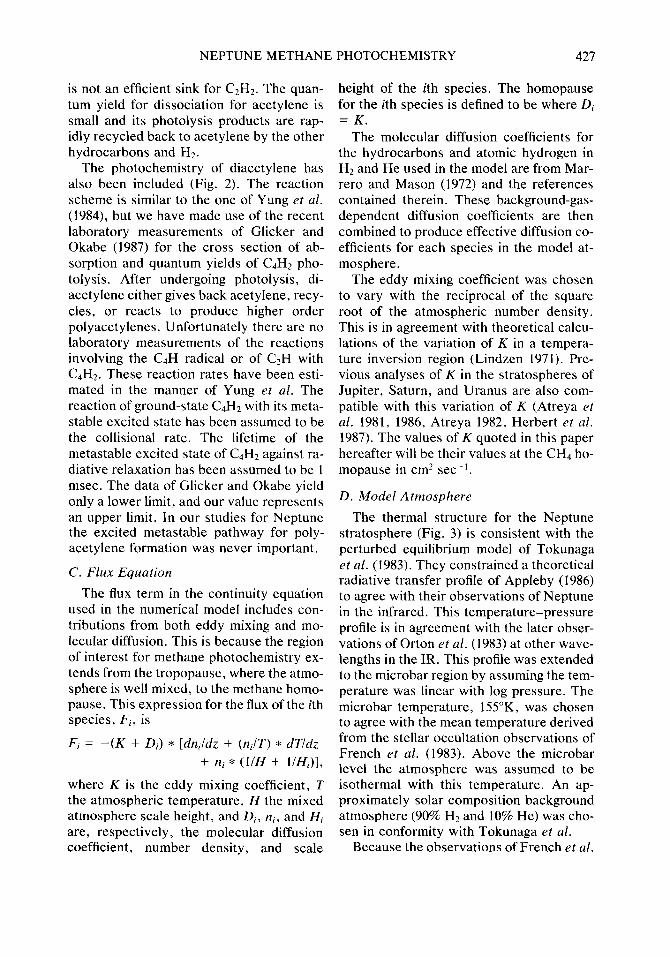
The thermal structure for the Neptune stratosphere (Fig. 3) is consistent with the perturbed equilibrium model of Tokunaga et al. (1983). They constrained a theoretical radiative transfer profile of Appleby (1986) to agree with their observations of Neptune in the infrared. This temperature-pressure profile is in agreement with the later obser- vations of Orton et al. (1983) at other wave- lengths in the IR. This profile was extended to the microbar region by assuming the tem- perature was linear with log pressure. The microbar temperature, 155°K, was chosen to agree with the mean temperature derived from the stellar occultation observations of French et al. (1983). Above the microbar level the atmosphere was assumed to be isothermal with this temperature. An ap- proximately solar composition background atmosphere (90% H2 and 10% He) was cho- sen in conformity with Tokunaga et al.
Because the observations of French et al.
10-8
10-7
10-6
10-3
--~
10_5
10_4
10 2
10 -1 I I I I 50 150 200
I l i l l l r l J
I I [ I I I [ I I I
1 O O
428 ROMANI AND ATREYA
TEMPERATURE (K)
Fro. 3. Adopted thermal structure for the strato- sphere of Neptune.
(1983) indicate a range of temperatures from 130 to 160°K, the model was run with an ex t reme low microbar tempera ture of 125°K to determine what effect this would have on the hydrocarbon abundances. Dif- ferences in the mixing ratios of methane, acetylene, and ethane between the runs were less than a factor of 2 at all levels. The only noticeable effect of decreasing the tempera ture at the microbar level was to compress the a tmosphere and so lower the altitude above the t ropopause where meth- ane photolysis takes place. The greatest ef- fect of uncertainties in the t empe ra tu r e - pressure profile will be for the location of the ice hazes in the lower stratosphere. This is because the vapor pressures of the hydrocarbons are exponential ly dependent upon temperature . Small changes in tem- perature will greatly change the atmo- spheric pressure level at which they con- dense; this will be discussed more later on.
E. Solar Flux
The solar flux used in the model is f rom the measured solar fluxes at I AU of He- roux and Hinteregger (1978) and Mount and Rot tman (1981). These fluxes were then scaled to the S u n - N e p t u n e distance. Solar max imum fluxes were used in the standard model to reproduce conditions at the time of the Voyager 2 encounter in 1989. The spect rum runs f rom 1000 to 3000 A and is binned in 10-A intervals with a separate bin for Lyman-c~. The short wavelength cutoff is due to absorpt ion by H2 above the hydro- carbons, and the long wavelength cutoff is because of the decrease in the absorpt ion cross sections of the hydrocarbons . A case with solar minimum fluxes was run to in- vestigate the variation of the hydrocarbons with solar flux.
F. Solar Zenith Angle vs Latitude, and Diurnal Variation
At the time of the Voyager 2 encounter with Neptune in 1989 it will be near summer solstice for the southern hemisphere of the planet. Currently, the planned Earth and solar occultat ions will take place at both approximate ly 62°N and 26°S. The diurnal average of the cosine of the solar zenith angle as a function of latitude was calcu- lated using the following relationship from Liou (1980):
cos(~:) = l/h * [h * sin(X) * sin(a)
+ cos(X) * cos(a) * sin(h)],
where ~: is the solar zenith angle, h the half- length of the illuminated day in radians, X the planetary latitude, and 6 the solar decli- nation. The half-length of the illuminated day is given by the following relationships also from Liou:
X = - t a n ( a ) * tan(X)
h = cos--I(X), i f x -> 1, t h e n h = 0,
i f x -< - l , t h e n h = ~'.
It is the average cosine that is important for the photochemis t ry , not the average solar
NEPTUNE METHANE PHOTOCHEMISTRY 429
TABLE I
SOLAR Z E N I T H A N G L E AND D I U R N A L VARIATION OF
S U N L I G H T v s L A T I T U D E
cultation point will be in the polar night, so a model run with a solar zenith angle of 80 ° was substituted for it.)
Latitude Solar zenith Diurnal variation angle of sunlight"
80°S 60 ° No 25°S 50 ° Yes 45°N 80 ° Yes
" At southern summer solstice latitudes below 60°S are in perpetual sunshine.
zenith angle. The solar zenith angles corre- sponding to the above average of the cosine and the variation in diurnal solar illumina- tion for three representative latitudes on Neptune are given in Table I. Model runs corresponding to all three latitudes were done to investigate potential latitudinal variations of the hydrocarbon abundances due to changes in the solar illumination. In- cluded are the southern occultation point, a high southern latitude in perpetual daylight, and a northern latitude. (The northern oc-
Ili. PHOTOCHEMISTRY RESULTS
A. Variation as a Func t ion o f K
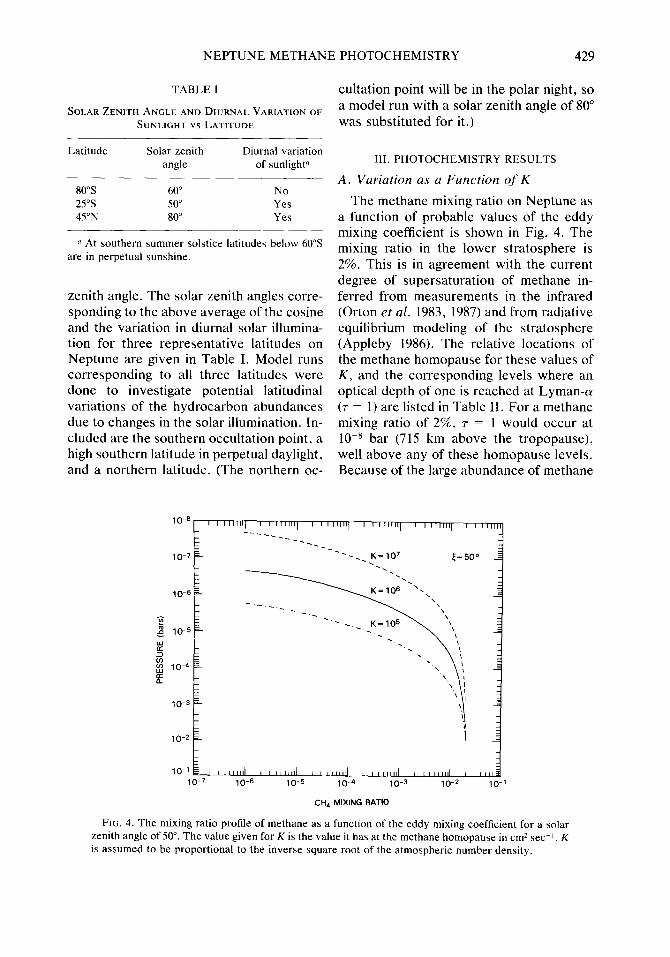
The methane mixing ratio on Neptune as a function of probable values of the eddy mixing coefficient is shown in Fig. 4. The mixing ratio in the lower stratosphere is 2%. This is in agreement with the current degree of supersaturation of methane in- ferred from measurements in the infrared (Orton et al. 1983, 1987) and from radiative equilibrium modeling of the stratosphere (Appleby 1986). The relative locations of the methane homopause for these values of K, and the corresponding levels where an optical depth of one is reached at Lyman-o~ (~- = 1) are listed in Table II. For a methane mixing ratio of 2%, r = 1 would occur at 10 -8 bar (715 km above the tropopause), well above any of these homopause levels. Because of the large abundance of methane
1 0 - 8
10 -5
O9 lO4
1 0 - 7
10 6
10 3
1 0 - 2
1 0 -1 i t ] f I n a l 1 0 - 7 1 0 - 6
I I I l l l l l ] I I I I I I 1 1 i [ I I l l l l l I I t I l l l l l ] I I I I I I 11 ] I I I I I I | 1
~ - - - - ' - - ' - - - - - - K = I O 7 ~ = 5 0 o
t i I I H I I I L L [ a l i H I I I laalll[ ~ i I t i l l d I I1 [ I 1 0 - 5 1 0 - 4 1 0 - 3 1 0 - 2 10 -1
C H 4 M I X I N G R A T I O
FIG. 4. The mixing ratio profile of methane as a function of the eddy mixing coefficient for a solar zenith angle of 50 °. The value given for K is the value it has at the methane homopause in cm 2 sec ~. K is assumed to be proportional to the inverse square root of the atmospheric number density.
430 ROMANI AND ATREYA
T A B L E I I
H O M O P A U S E LEVELS AND CORRESPONDING LEVELS
WHERE '7" = 1 AT LYMAN-O~ AS A F U N C T I O N OF THE
E D D Y M I X I N G C O E F F I C I E N T
K H o m o p a u s e level Leve l where (cm z sec -1) "r = 1 at
(km)" (bar) Lyman-c~
(km) ~ (bar)
105 430 2.6 × 10 6 375 7.4 × | 0 ~6 106 550 2.7 × 10 7 460 1.5 X 10 -6 107 675 2.5 × 10 8 535 3.6 × 10 7
Zero for al t i tude is the t ropopause taken to be at the lO0- m b a r p res su re level, which is approx imate ly 65 km above the l -bar level.
in the stratosphere of Neptune, photolysis cannot proceed efficiently until near the ho- mopause where gravitational separation de- pletes the atmosphere of methane.
From these values of the eddy mixing co- efficient a nominal value must be selected. There is no single direct observation that uniquely constrains the value of K in the stratosphere of Neptune, but we can infer limits on its value from a variety of obser- vations.
There is abundant evidence that the lower stratosphere of Neptune is dynami- cally active. The temporal change of the brightness in the visible spectrum of Nep- tune observed by Joyce et al. (1977) can be satisfactorily explained by an increase in aerosols in the lower stratosphere and their eventual removal by sedimentation (Piicher 1977). More recent observations have re- vealed spatial inhomogeneities in the aero- sols across the disk of Neptune and tempo- ral variations on the order of days (Terrile and Smith 1983, Baines et al. 1987, Berg- stralh et al. 1987). The supersaturation of methane in the stratosphere probably results from methane ice clouds, which form in the upper troposphere (at approxi- mately the 1.4-bar level, Romani 1986), convectively penetrating the tropopause and depositing methane ice in the lower stratosphere which then sublimates (Ap- pleby 1986). Simple diffusion of the CH4 ice
crystals through the tropopause is not likely to be the source of the supersaturation. The sedimentation lifetime of even 0.1-/.,m crys- tals is faster by an order of magnitude than any likely eddy mixing lifetime.
It is important to note that no such varia- tions in brightness have been observed for Uranus and that methane is saturation-lim- ited in the stratosphere. Based on this, we argue that the minimum eddy mixing coeffi- cient on Neptune is as great as it is on Uranus, 104 (Herbert et al. 1987), and prob- ably greater.
Less direct evidence for Neptune having a greater eddy mixing coefficient than Uranus is that Neptune has a strong inter- nal heat source, approximately twice that of absorbed solar radiation (OrLon and Ap- pleby 1984). Jupiter and Saturn also have internal heat sources and have eddy mixing coefficients of approximately 10 6 and 108 cm 2 sec J, respectively, at the methane ho- mopause (Atreya 1986). Uranus, which possesses little, if any, internal heat source (Pearl et al. 1987), has the lowest rate of eddy mixing in its stratosphere of all of the Jovian planets. This correlation between the strength of an internal heat source and the strength of eddy mixing probably arises through the generation of gravity waves in the lower atmosphere which break in the stratosphere and are known to be the source of the eddy mixing there (Lindzen 1971, 1981, FriLLs 1984). At this time, how- ever, the exact link is not known.
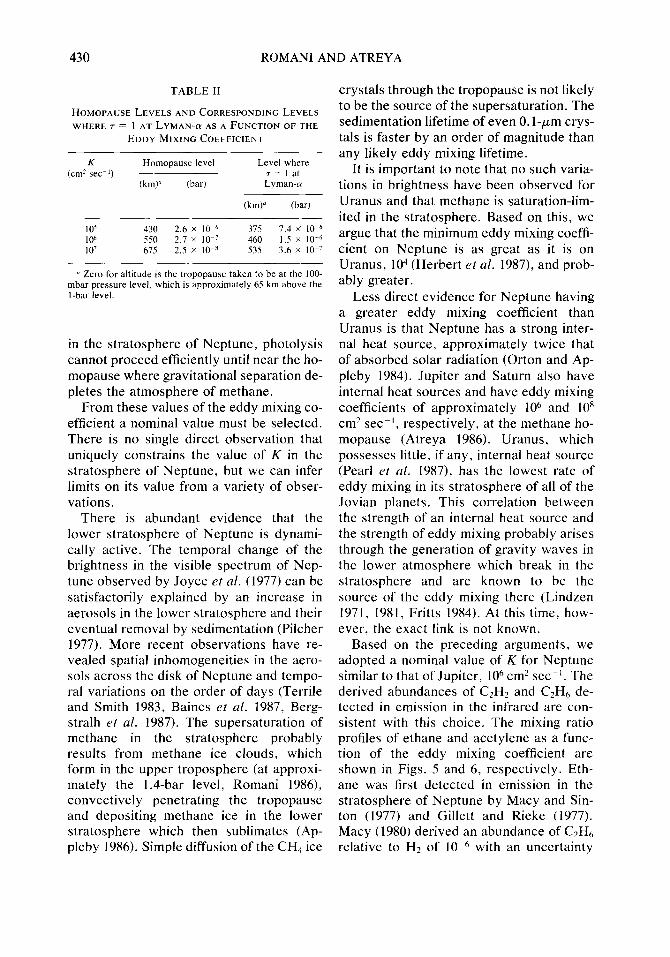
Based on the preceding arguments, we adopted a nominal value of K for Neptune similar to that of Jupiter, 10 6 cm 2 sec -1. The derived abundances of C2H2 and C2H6 de- tected in emission in the infrared are con- sistent with this choice. The mixing ratio profiles of ethane and acetylene as a func- tion of the eddy mixing coefficient are shown in Figs. 5 and 6, respectively. Eth- ane was first detected in emission in the stratosphere of Neptune by Macy and Sin- ton (1977) and Gillett and Rieke (1977). Macy (1980) derived an abundance of C2H6 relative to H2 of l0 6 with an uncertainty
NEPTUNE METHANE PHOTOCHEMISTRY 431
10-9 I I lI[lll I
1 0 7 - -
10 -6
10-3
10-1 i I i,,,,d 10-1o 10-9
10 -5
Z~ (/}
lO -4
10-2
I I t l l l t l ] I I I I I I I I I I I I l l i i l I I I I I I l I I I i I l l
. . . . . . . . ~ K=IO 7 ,~= 50o
K = 106
K=105
I
I
I
L
I
I
t I
I I I l l l l l l I I I t l i l l l I I l t t J l l l I I I l l l l l J I i l l l l
10-9 10-7 10-6 10-5 10-4
C2H 6 MIXING RATIO
FIG. 5. Same as Fig. 4, but for ethane.
factor of 5. Subsequently Orton et al. (1983) inferred an ethane mixing ratio of 3 × 10 -6, and most recently Orton et al. (1987) have inferred 6 x 10 -6 with an uncertainty factor of 3.2. These last two mixing ratios assume that the ethane abundance follows its satu- ration law in the lower stratosphere until it reaches the above maximum mixing ratios
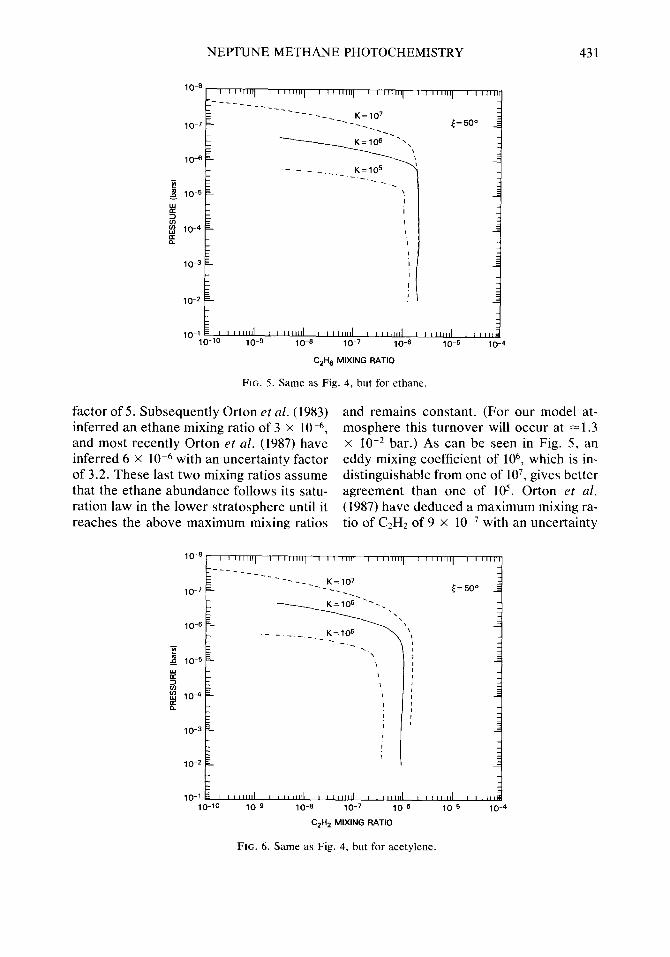
and remains constant. (For our model at- mosphere this turnover will occur at ~1 .3 x 10 -2 bar.) As can be seen in Fig. 5, an eddy mixing coefficient of 106, which is in- distinguishable from one of 107 , gives better agreement than one of 105. Orton et al. (1987) have deduced a maximum mixing ra- tio of C2H2 of 9 x 10 7 with an uncertainty
lO-S
10 -5
(/) 10 -4
E
I t 1111111
1 0 7 - - ~ _
1 0 - 6
10-3
10-2
I0-I i i ,iH.I
10-10 10-9
i I I l l i i q I I I f l i t t ] i t ==ilir I
_ K = I O 7
. . . . . . . . . .
L
I i
f
[ I I I I I I I I I I
~= 50 o
I I i L i l l l l I I L I ] l l l i I I I I I I I I I L I 1111111 I I il 10-6 10-7 10-6 10-5 10-4
C2H 2 MIXING RATIO
FIG. 6. Same as Fig. 4, but for acetylene.
432 ROMANI AND ATREYA
10-8
10 7
10-6
10 -5
10 -4 t.u
10 3
10-2
10-1 10 11
, , , , , , , , [ ~ f 'm l ' ' r ' ~ml ~ ~ ' f ' ~ " l , , , ~ m I i ~ ,~ , ,~
K = 10 6
~= 50 °
C , ~ , , , , , , I , , , , , J [ , I , ~ , , J m l , , , * , , , , I , , , , , , , , I , , J , , ,
10 -~° 10 -9 10 -8 10 7 10 6 10-s
C2H 6 MIXING RATIO
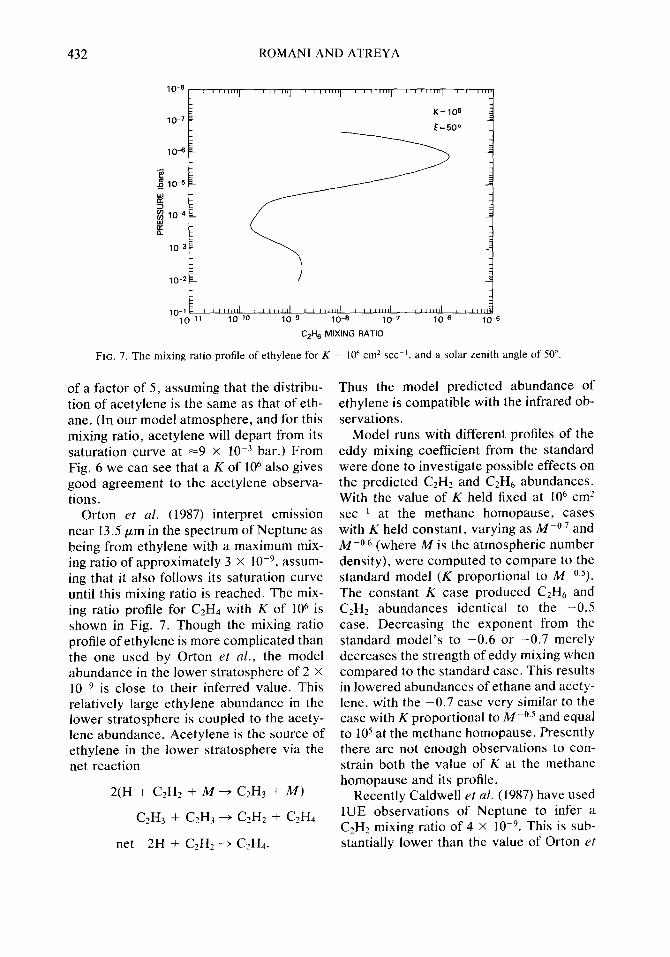
FIG. 7. The mixing ratio profile of ethylene for K = l06 cm 2 sec ], and a solar zenith angle of 50 °.
of a factor of 5, assuming that the distribu- tion of acetylene is the same as that of eth- ane. (In our model atmosphere, and for this mixing ratio, acetylene will depart from its saturation curve at ~9 x 10 3 bar.) From Fig. 6 we can see that a K of 106 also gives good agreement to the acetylene observa- tions.
Orton et al. (1987) interpret emission near 13.5/xm in the spectrum of Neptune as being from ethylene with a maximum mix- ing ratio of approximately 3 x 10 -9, assum- ing that it also follows its saturation curve until this mixing ratio is reached. The mix- ing ratio profile for C2H4 with K of 106 is shown in Fig. 7. Though the mixing ratio profile of ethylene is more complicated than the one used by Orton et al., the model abundance in the lower stratosphere of 2 × 10 9 is close to their inferred value. This relatively large ethylene abundance in the lower stratosphere is coupled to the acety- lene abundance. Acetylene is the source of ethylene in the lower stratosphere via the net reaction
2(H + C2H2 + M ~ C2H 3 + M)
C2H3 + C2H3--~C2H2 + C2H4
net 2H + C2H 2 ~ C2H4.
Thus the model predicted abundance of ethylene is compatible with the infrared ob- servations.
Model runs with different profiles of the eddy mixing coefficient from the standard were done to investigate possible effects on the predicted C2H2 and C2H6 abundances. With the value of K held fixed at l0 6 c m 2
sec -1 at the methane homopause, cases with K held constant, varying as M - ° 7 and M 0.6 (where M is the atmospheric number density), were computed to compare to the standard model (K proportional to M o5). The constant K case produced C2H6 and C2H2 abundances identical to the - 0 . 5 case. Decreasing the exponent from the standard model 's to - 0 . 6 or - 0 . 7 merely decreases the strength of eddy mixing when compared to the standard case. This results in lowered abundances of ethane and acety- lene, with the - 0 . 7 case very similar to the case with K proportional to M-°5 and equal to 105 at the methane homopause. Presently there are not enough observations to con- strain both the value of K at the methane homopause and its profile.
Recently Caldwell et al. (1987) have used IUE observations of Neptune to infer a C2H2 mixing ratio of 4 x 10 -9. This is sub- stantially lower than the value of Orton et
N E P T U N E M E T H A N E P H O T O C H E M I S T R Y 433
al. (1987), but in relative agreement with Macy (1980), who from analysis of the 11.5- to 13.5-/xm spectrum of Neptune deduced a mixing ratio of (0.2-5) x 10 -8 (note that Macy (1980) and Orton et al. (1987) agree well for ethane, and the data of Orton et al. (1987) are of higher quality). It is difficult to reconcile these two measurements of C2H2 unless there are unusual temporal/spatial variations in the stratosphere of Neptune. Another possibility is that the emission at 14/xm is not due to C2H2. However, as dis- cussed above, the inferred acetylene and ethylene abundances of Orton et al. (1987) support each other. Moreover, unless there is unexpected chemistry for acetylene that operates on Neptune, but not on the other Jovian planets, it is hard to produce photo- chemically the low amount of acetylene that Caldweli et al. call for, because of the large abundance of methane in stratosphere of Neptune.
Last, Lellouch et al. (1986), from the ob- servations of a central flash produced dur- ing a stellar occultation by Neptune, de- duced a methane abundance of 4-8 x 10 .3 at approximately the 0.3-mbar level. This
would favor an eddy mixing coefficient closer to 105 (see Fig. 4) than the nominal 10 6 adopted here. But, their upper and lower limits are respectively 4 x 10 -2 and 1 X 10 -4, which span the complete range of methane mixing ratios. An alternate inter- pretation of the data (Hubbard et al. 1987) requires no methane but a gradient in the temperature in the stratosphere from 150°K at 1 tzbar to 135°K at 0.4 mbar. These tem- peratures are in agreement with IR data (Orton et al. 1987) and radiative transfer modeling (Appleby 1986). However, the IR observations and radiative transfer model- ing require the above-mentioned supersatu- ration of methane. So this provides an un- certain constraint on the eddy mixing coefficient and methane abundance.
B. Var ia t ion with La t i t ude and P h o t o c h e m i c a l P r o c e s s e s
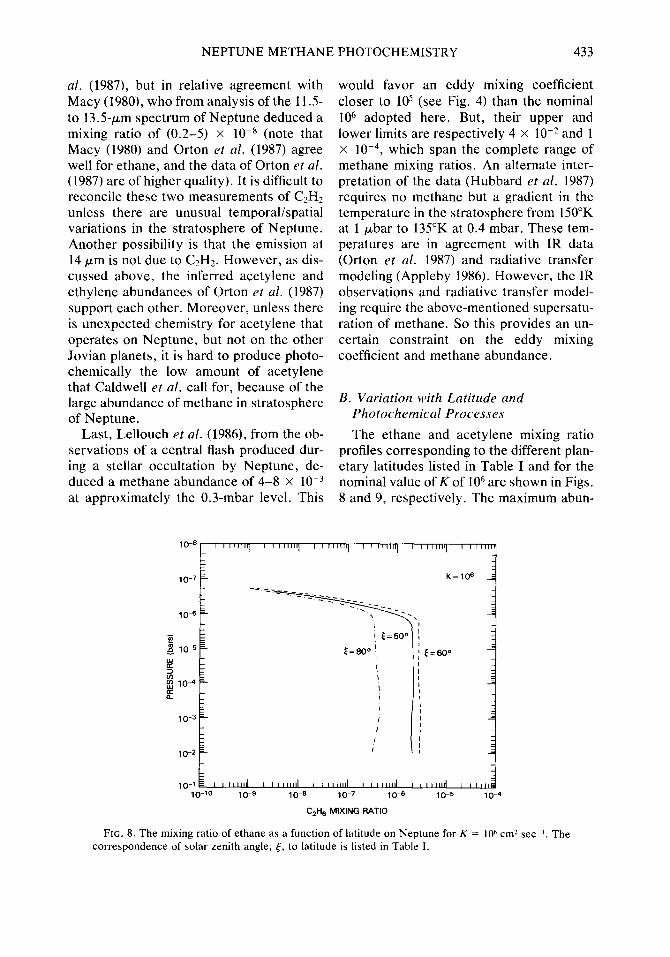
The ethane and acetylene mixing ratio profiles corresponding to the different plan- etary latitudes listed in Table I and for the nominal value of K of l0 n are shown in Figs. 8 and 9, respectively. The maximum abun-
1 0 - 8
1 0 - 7
1 0 - 6
10 -s
(/) 10 -4
1 0 - 3
i i i l u . i
1 0 - 2 I
1 0 - 1 I t I t t t i d 10-10 1 0 - 9
t t t t t t t t I t t t t n u I t t I t t t t t I t i t t t m [ t E l t l l t l
K = 10 6
~ = 5 o o ', ~=80° ~ i
i = 6 0 °
I I I l t l l l l t I I I l t l l ] I I I I I I 1 [ I I I III1~ I I l l l l i
10 -s 10 -7 10 -8 10 5 1 0 - 4
C 2 H 6 M I X I N G R A T I O
FIG. 8. The mixing ratio of ethane as a function of latitude on Neptune for K = 10 6 cm 2 sec t. The correspondence of solar zenith angle, ~:, to latitude is listed in Table I.
434 ROMANI AND ATREYA
1 0 - 8
1 0 - 7
1 0 9
1 0 . 5
~: 1 0 - 4
1 0 - 3
1 0 2
1 0 - 1 I I I I I I I I I 1 0 10 1 0 - 9
i i t l l u t I t i r l l l r I I i i i i t l l I r i I I I r r l [ I l t t l l l I I t i i i i r l
K = 1 0 9
I~=6o ° ~ = 8 0 ° / J
I J lJ l l l [ I I J l ] l l i J I I l l i J l l I J I I I I l i l I I I J l i 10-9 10-7 10-6
C2H 2 M I X I N G R A T I O
1 0 - 5 1 0 - 4
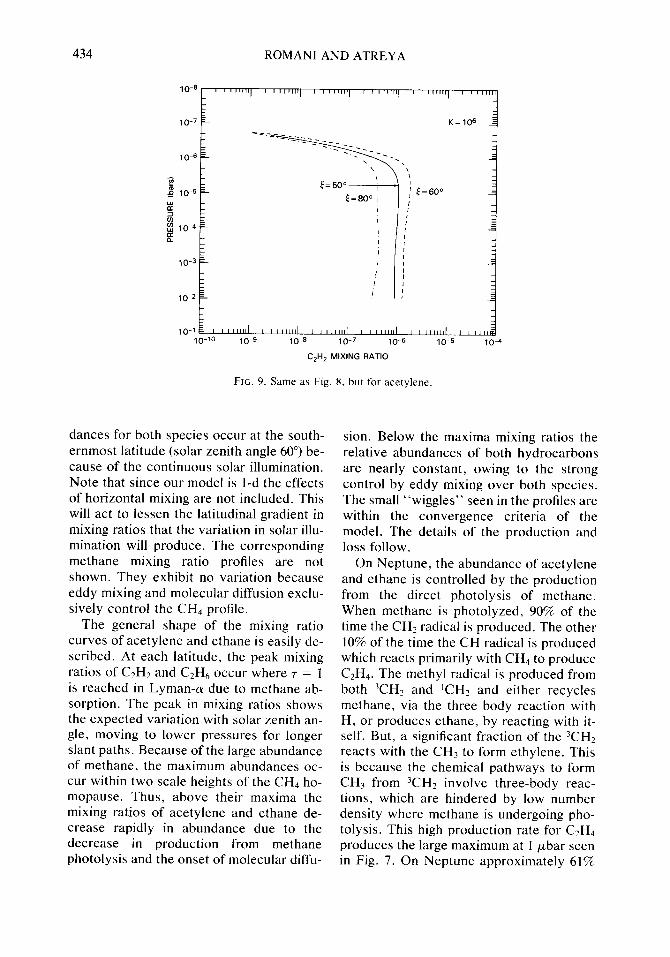
FIG. 9. Same as Fig. 8, but for acetylene.
dances for both species occur at the south- ernmost latitude (solar zenith angle 60 °) be- cause of the continuous solar illumination. Note that since our model is 1-d the effects of horizontal mixing are not included. This will act to lessen the latitudinal gradient in mixing ratios that the variation in solar illu- mination will produce. The corresponding methane mixing ratio profiles are not shown. They exhibit no variation because eddy mixing and molecular diffusion exclu- sively control the CH4 profile.
The general shape of the mixing ratio curves of acetylene and ethane is easily de- scribed. At each latitude, the peak mixing ratios of C2H2 and C2H6 occur where r = 1 is reached in Lyman-c~ due to methane ab- sorption. The peak in mixing ratios shows the expected variation with solar zenith an- gle, moving to lower pressures for longer slant paths. Because of the large abundance of methane, the maximum abundances oc- cur within two scale heights of the CH4 ho- mopause. Thus, above their maxima the mixing ratios of acetylene and ethane de- crease rapidly in abundance due to the decrease in production from methane photolysis and the onset of molecular diffu-
sion. Below the maxima mixing ratios the relative abundances of both hydrocarbons are nearly constant, owing to the strong control by eddy mixing over both species. The small "wiggles" seen in the profiles are within the convergence criteria of the model. The details of the production and loss follow.
On Neptune, the abundance of acetylene and ethane is controlled by the production from the direct photolysis of methane. When methane is photolyzed, 90% of the time the CH2 radical is produced. The other 10% of the time the CH radical is produced which reacts primarily with CH4 to produce C2H4. The methyl radical is produced from both 3CH2 and ]CH2 and either recycles methane, via the three body reaction with H, or produces ethane, by reacting with it- self. But, a significant fraction of the 3CH2 reacts with the CH3 to form ethylene. This is because the chemical pathways to form CH3 from 3CH2 involve three-body reac- tions, which are hindered by low number density where methane is undergoing pho- tolysis. This high production rate for C2H4 produces the large maximum at I/~bar seen in Fig. 7. On Neptune approximately 61%
NEPTUNE METHANE PHOTOCHEMISTRY 435
of the photons methane absorbs recycle methane, 17% produce ethylene, and 22% produce ethane. For comparison, these ra- tios for Jupiter are 70% recycle, 10% to eth- ylene, and 20% to ethane (Gladstone 1982). Acetylene is then produced from ethane and ethylene photolysis, with ethylene pho- tolysis being more important.
Below this peak produced by methane photochemistry, the chemical lifetimes be- come long and eddy mixing controls the profiles of both species. The production of ethane and acetylene declines rapidly be- low where r = 1 in Lyman-a. Ethane is lost by photolysis, but C2H6 is well shielded by the methane so its destruction is negligible. Acetylene can also be destroyed by photol- ysis, but its loss is hampered by its low quantum yield for dissociation, recycling of the C2H radical by the other hydrocarbons and H2, and the greatly reduced solar flux at Neptune. The ratio of acetylene loss to re- cycling after it undergoes photolysis is ap- proximately 25 to 1. This results in the eddy mixing time being 100 times faster than the photochemical loss.
Possible effects of the boundary condi- tions on the profiles need to be assessed. In Figs. 8 and 9 it can be seen that the upper boundary values of C2H2 and C2H6 were held constant for all three latitudes. Prop- erly, they should all be different and reflect diffusive equilibrium. But after a scale height they all have separated showing the limiting influence of an incorrect boundary value. Practically, the strong gradient in mixing ratio from molecular diffusion and the decrease in production results in very little of either of these hydrocarbons above 10 -6 bar. (Molecular diffusion alone will produce a scale height on the order of 5 kin.) The analysis of the lifetimes showed that the lower boundary for both species is controlled by eddy diffusion. This will pro- duce a mixing ratio nearly constant with height and was taken into account in setting the lower boundary values. It is also impor- tant to realize that just below the lower boundary in the photochemical model acet- ylene and ethane will freeze out to their ices
producing an abrupt decrease in the vapor phase mixing ratios. The vapor abundances from the equilibrium saturation vapor pres- sure equations will then be the controlling factors.
C. Variation with Solar Flux
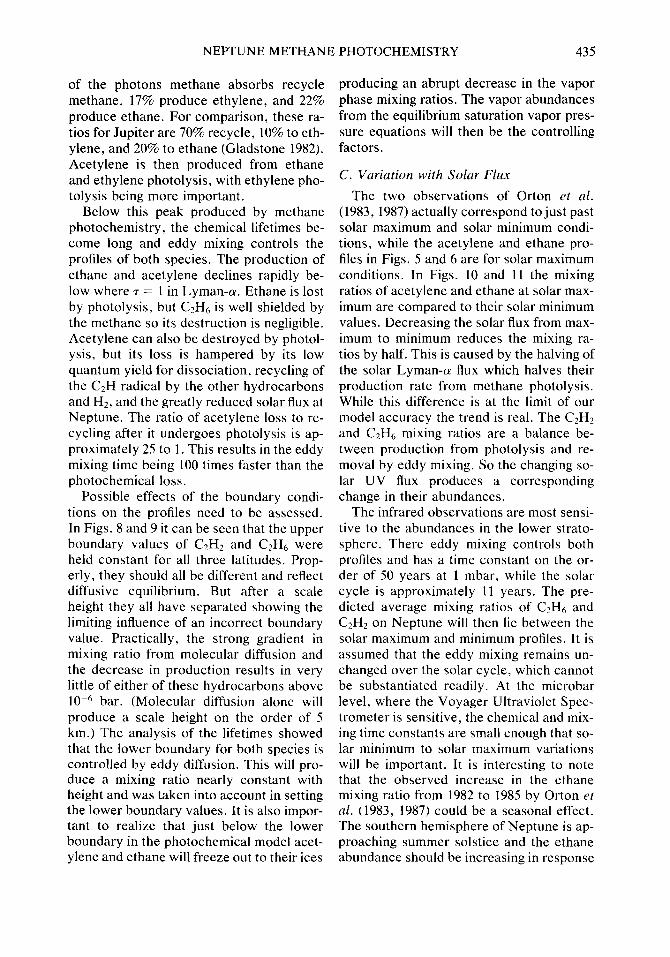
The two observations of Orton et al. (1983, 1987) actually correspond to just past solar maximum and solar minimum condi- tions, while the acetylene and ethane pro- files in Figs. 5 and 6 are for solar maximum conditions. In Figs. 10 and 11 the mixing ratios of acetylene and ethane at solar max- imum are compared to their solar minimum values. Decreasing the solar flux from max- imum to minimum reduces the mixing ra- tios by half. This is caused by the halving of the solar Lyman-~ flux which halves their production rate from methane photolysis. While this difference is at the limit of our model accuracy the trend is real. The C2H2 and C2H6 mixing ratios are a balance be- tween production from photolysis and re- moval by eddy mixing. So the changing so- lar UV flux produces a corresponding change in their abundances.
The infrared observations are most sensi- tive to the abundances in the lower strato- sphere. There eddy mixing controls both profiles and has a time constant on the or- der of 50 years at 1 mbar, while the solar cycle is approximately 11 years. The pre- dicted average mixing ratios of C2H6 and C2H2 on Neptune will then lie between the solar maximum and minimum profiles. It is assumed that the eddy mixing remains un- changed over the solar cycle, which cannot be substantiated readily. At the microbar level, where the Voyager Ultraviolet Spec- trometer is sensitive, the chemical and mix- ing time constants are small enough that so- lar minimum to solar maximum variations will be important. It is interesting to note that the observed increase in the ethane mixing ratio from 1982 to 1985 by Orton et al. (1983, 1987) could be a seasonal effect. The southern hemisphere of Neptune is ap- proaching summer solstice and the ethane abundance should be increasing in response
436 R O M A N I A N D A T R E Y A
10 8
10 7
10 -6
10 -5
o3 l O _4
==
10 3
10-2
10 1 i i i i I i i i I 10 - l o 10-9
s o l m i n II i i
i i i i i i i i I i i i i i i i i
K = 106
~= 50 °
s o l m a x
I I lllllll I J IILIIII I I IIIIIII I I lllllll I I IIII
10 -6 10 -7 10 -6 10 -5 10 4
C2H 6 MIXING RATIO
FIG. 10. The mixing ratio profile o f ethane as a function of solar activity for K = 106 cm 2 sec ] and a
solar zenith angle o f 50 ° .
to the increased solar flux, as was shown in the previous section.
IV. A E R O S O L P R O D U C T I O N
A. Acetylene and Ethane Ice Hazes
In Fig. 12 the mixing ratios of acetylene and ethane produced by the photochemical
model are compared to their relative abun- dances allowed by their equilibrium satura- tion vapor pressures over their respective ices (Ziegler 1959, Ziegler et al. 1964). The large differences in abundances between the photochemical model and the equilib- rium saturation values makes condensation
10-8
10-7
10-6
~ 1 0 5
O3 l O - 4
10 3
10 2
10-1 , , , ,,,,,I
10-1o 10-9
. . . . . . . . I . . . . . . "1 . . . . . . . . I . . . . . . . . I
s o l r n i n solmax
I I I I I I I P I I I t l l l l l
K = 10 6
~ = 5 0 °
, , , . . . . . I , , , , , , , , I , , , , , , , I , , , , , , , , I
10 .8 10 7 10-6 10-5
C2H 2 MIXING RATIO
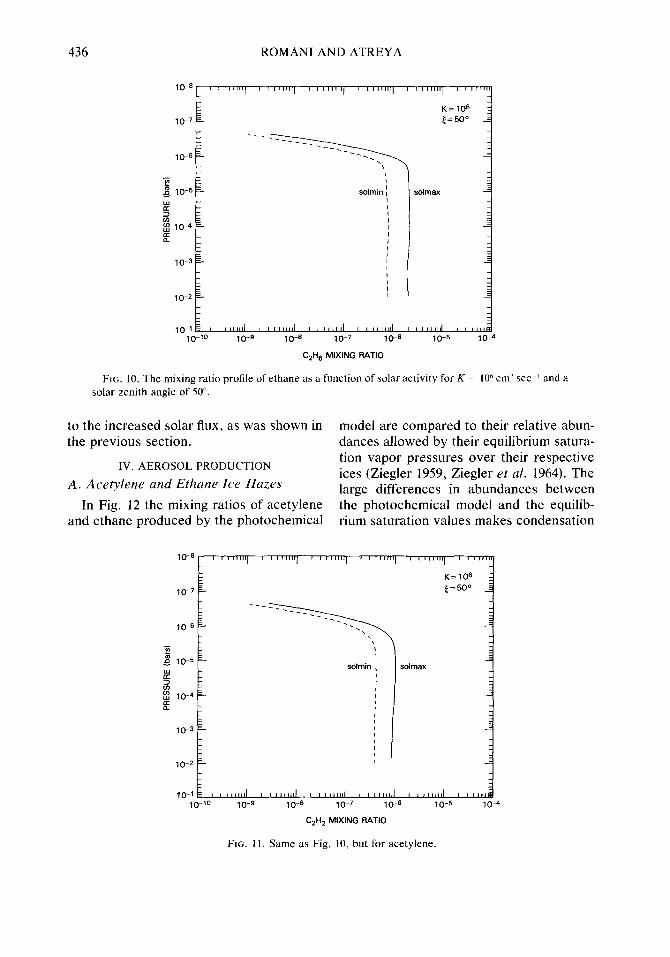
FIG. 1 1. Same as Fig . 10, but for acety lene .
i i i JH 10-4
NEPTUNE METHANE PHOTOCHEMISTRY 437
10-8
10 7
10 6
1 0 - 5
10-3
10-2
10-1 10-12
. . . . . . . . I . . . . . . . '1 ' ' " ' " ' 1 ' . . . . . . . I ' ' . . . . . . I . . . . . . . . I ' ' " ' " ' 1 . . . . . . . .
K= 10 6
,~ = 5 0 °
C2H2 C2H6
C2H 6 C2H2
-555555 . . . . . . . . . . . . . . . . . . . . . . . . I . . . . . . . . I . . . . uld I l l l I H d j l l l l m l I . . . . . . . . . , . I . . . . . .
10 -11 10 -1° 10 -9 10 -8 10 -7 10 6 10 5 10-4
MIXING RATIO
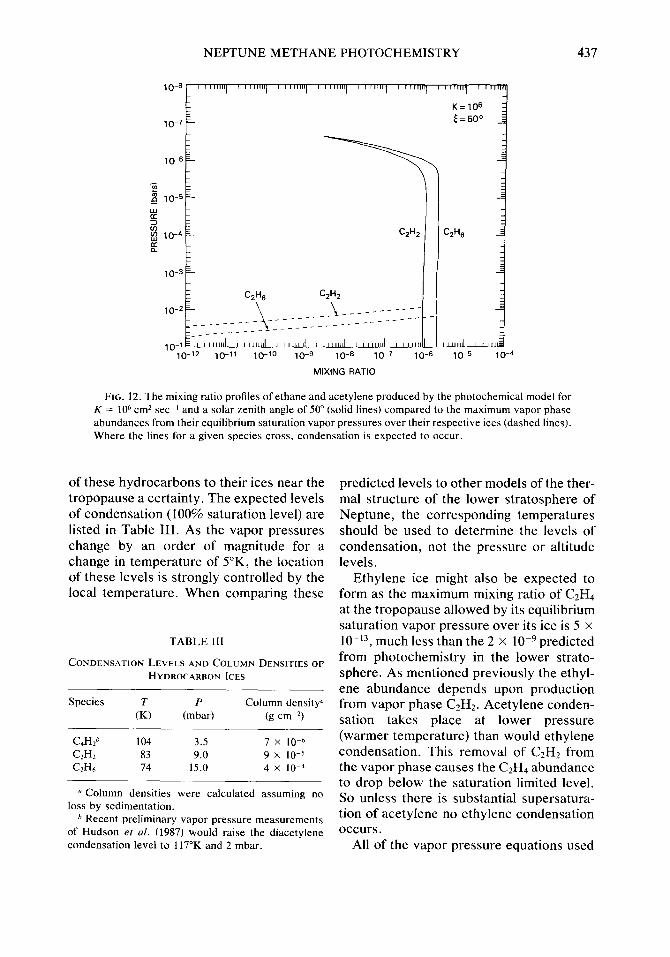
FIG. 12. The mixing ratio profiles of e thane and acetylene produced by the photochemical model for K = 106 cm 2 sec ] and a solar zeni th angle of 50 ° (solid lines) compared to the m a x i m u m vapor phase abundances f rom their equil ibrium saturat ion vapor pressures over their respective ices (dashed lines). Where the lines for a given species cross , condensa t ion is expected to occur.
of these hydrocarbons to their ices near the tropopause a certainty. The expected levels of condensation (100% saturation level) are listed in Table III. As the vapor pressures change by an order of magnitude for a change in temperature of 5°K, the location of these levels is strongly controlled by the local temperature. When comparing these
T A B L E III
CONDENSATION LEVELS AND COLUMN DENSITIES OF HYDROCARBON ICES
Species T P Column densi ty ° (K) (mbar) (g cm 2)
C4H2 b 104 3.5 7 × 10 -6 C2H2 83 9.0 9 × 10 5 C2H6 74 15.0 4 × 10 4
Column densi t ies were calculated a s suming no loss by sedimentat ion.
b Recent prel iminary vapor pressure measu remen t s of Hudson et al. (1987) would raise the diacetylene condensa t ion level to 117°K and 2 mbar.
predicted levels to other models of the ther- mal structure of the lower stratosphere of Neptune, the corresponding temperatures should be used to determine the levels of condensation, not the pressure or altitude levels.
Ethylene ice might also be expected to form as the maximum mixing ratio of C2H4 at the tropopause allowed by its equilibrium saturation vapor pressure over its ice is 5 x 10 -13, much less than the 2 x 10 -9 predicted from photochemistry in the lower strato- sphere. As mentioned previously the ethyl- ene abundance depends upon production from vapor phase C2H2. Acetylene conden- sation takes place at lower pressure (warmer temperature) than would ethylene condensation. This removal of C2H2 from the vapor phase causes the C 2 H 4 abundance to drop below the saturation limited level. So unless there is substantial supersatura- tion of acetylene no ethylene condensation occurs.
All of the vapor pressure equations used
438 ROMANI AND ATREYA
in this section are listed in Appendix A. We stress the need for better vapor pressure measurements of acetylene and diacety- lene. We are currently forced to extrapolate these vapor pressures below the tempera- tures at which they have been measured. The bias in this extrapolation is to predict larger vapor pressures than the actual ones and to move the predicted condensation levels to higher pressures.
To determine the effect these ice hazes could have on the scattering properties of the stratosphere of Neptune in the visible, we calculated the haze optical depths. The optical depth is the product of the particle column density and scattering cross sec- tion. We first calculated column densities of the ice hazes with no removal of the parti- cles by sedimentation to determine the greatest possible effect. We converted the mass densities of Table III into particle densities for 0.1-, 1.0-, and 10.0-/~m-radius spheres. This was to span the range of par- ticle sizes found for stratospheric hazes (West et al. 1986, Pollack et al. 1987). To calculate the scattering cross sections it is necessary to know the indices of refraction of these ices, but a literature search re- vealed no direct measurements. The real parts of the indices of refraction for acety- lene and ethane ice were then computed from the molar refractivity data of Vogel (1948) and densities listed in the Crystal Data De termina t i ve Tables (Donnay and Ondik 1972). We assumed that the imagi- nary index of refraction was negligible. In the gas phase C 2 H 2 and C 2 H 6 have no ab- sorption in the visible, and it is unlikely that by condensing to their ices they will de- velop significant absorption. But if scatter- ing becomes appreciable, minor absorption may become important because of the long optical paths of the scattered light. The scattering cross sections were then calcu- lated by a Mie-scattering code, and the op- tical depths resulting from this calculation are given in Table IV.
Constraints on the total stratospheric aerosol optical depth come from observa-
T A B L E IV
MAXIMUM POSSIBLE HYDROCARBON ICE HAZE OPTICAL DEPTHS AS A FUNCTION OF
WAVELENGTH AND PARTICLE SIZE
Particle radius Wavelength (tzm) (~m)
0.3 0.4 0.5
Ethane ice 0.1 70.0 29.0 15.0 1.0 9.2 8.4 13.0
10.0 0.86 0.87 0.93 Acetylene ice
0.1 8.2 3.5 1.9 1.0 1.7 2.7 1.8
10.0 0.2 0.2 0.2
tions in the UV to the near IR (Savage et al. 1980, Caldwell et al. 1981, Bergstralh and Baines 1984, Bergstralh et al. 1987, Baines et al. 1987). From the UV albedo of Nep- tune Savage et al. (1980) deduced the pres- ence of stratospheric aerosols. Caldwell et
al. (1981) argued that no aerosol opacity is possible because of the difficulties in select- ing the proper solar analog star to deter- mine the albedos. The clearest evidence for stratospheric aerosols comes from the ob- servations done in the near IR and visible wavelengths (Bergstralh et al. 1987). The 0.9-/~m methane band of Neptune has a re- sidual intensity of 1%. It would have a re- sidual intensity of 0.1% if not for the pres- ence of aerosols. Bergstralh et al. (1987) deduce an optical depth of 0.1 to 0.25 at 0.9 ktm depending on the pressure level of the hazes (1-20 mbar). A total optical depth of 0.5 in the visible (upper troposphere and stratospheric aerosols) for Neptune has been derived by Baines et al. (1987).
As can be seen from Tables III and IV the acetylene and ethane ice hazes can provide more than enough optical depth at the ap- propriate pressure levels. Another possible source of stratospheric aerosols is methane ice crystals being transported from the tro- popause into the stratosphere. However, the sublimating methane ice crystals will
NEPTUNE METHANE PHOTOCHEMISTRY 439
TABLE V
OPTICAL DEPTHS OF HYDROCARBON ICE HAZES WITH SEDIMENTATION AS A FUNCTION OF
WAVELENGTH AND PARTICLE SIZE
Particle radius Wavelength (/xm) (p~m)
0.3 0.4 0.5
Ethane ice 0.1 70.0 29.0 15.0 1.0 0.9 0.8 1.3
10.0 0.0 0.0 0.0 Acetylene ice
0.1 8.2 3.5 1.9 1.0 0.2 0.3 0.2
10.0 0.0 0.0 0.0
produce the observed 2% vapor phase mix- ing ratio at 26 mbar (~64°K, and 25 km; Kirk and Zeigler 1965), so we do not expect them to survive to much lower pressures.
That the observed optical depths are much less than the maximum optical depths calculated here is not surprising. We expect the optical depths of the C2H2 and C2H6 ice hazes to be reduced by sedimentation and other cloud microphysics effects. To incor- porate sedimentation into the model we performed the following analysis. The source of the hazes is the eddy mixing of CRHz and C2H6 in the gas phase into the condensation region, while the sink is the sedimentation of the ice particles. In steady state the two fluxes must balance each other or
K * N * d f / d z = n/ t ,
where N is the atmospheric number den- sity, f the vapor phase mixing ratio of ei- ther acetylene or ethane (constrained to fol- low the saturation curve), n the column density of either acetylene or ethane in the condensed phase, and t the sedimentation time for the aerosols to fall from the con- densation level. The above equation was solved for n and the corresponding optical depths are given in Table V.
From Table V we can see that the 0.1- /xm-radius particles fall too slowly to re-
duce their optical depths from the maximal ones. If we constrain the total optical depth to the limits set by Bergstralh et al. (1987) and Baines et al. (1987) then the ice haze particles must be on the order of 1.0 tzm in radius. This is surprising as the size of at- mospheric aerosols is usually on the order of 0.1 /zm in radius. A major uncertainty in this calculation is the strength of the eddy mixing at the condensation levels. Cur- rently this is not well constrained, and if it is lower than our assumed value then the ice haze particle radius will drop.
B. P o l y a c e t y l e n e s
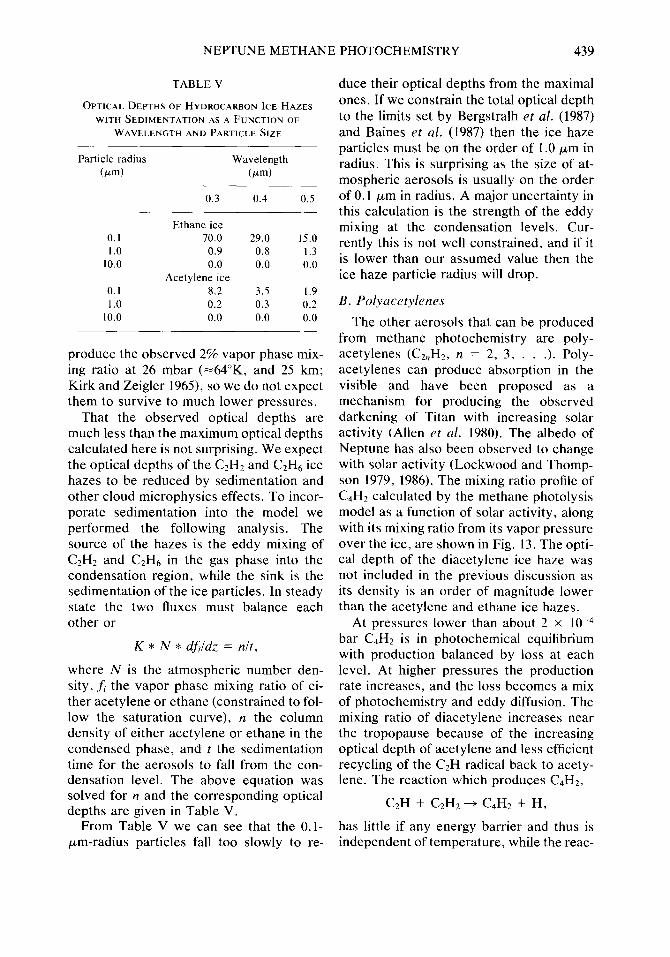
The other aerosols that can be produced from methane photochemistry are poly- acetylenes (C2,,H2, n = 2, 3 . . . . ). Poly- acetylenes can produce absorption in the visible and have been proposed as a mechanism for producing the observed darkening of Titan with increasing solar activity (Allen et al. 1980). The albedo of Neptune has also been observed to change with solar activity (Lockwood and Thomp- son 1979, 1986). The mixing ratio profile of C4H2 calculated by the methane photolysis model as a function of solar activity, along with its mixing ratio from its vapor pressure over the ice, are shown in Fig. 13. The opti- cal depth of the diacetylene ice haze was not included in the previous discussion as its density is an order of magnitude lower than the acetylene and ethane ice hazes.
At pressures lower than about 2 x 10 -4
bar C4H2 is in photochemical equilibrium with production balanced by loss at each level. At higher pressures the production rate increases, and the loss becomes a mix of photochemistry and eddy diffusion. The mixing ratio of diacetylene increases near the tropopause because of the increasing optical depth of acetylene and less efficient recycling of the C2H radical back to acety- lene. The reaction which produces C4H2,
C2H + C2H: ~ C4H2 + H,
has little if any energy barrier and thus is independent of temperature, while the reac-
440 ROMANI AND ATREYA
1 0 - 8 ' i I I111111 I I I l l l l l I I l i t l t l t I I I i i i i r l I I I l l l l l l I I I l r l l l l I f I l l l l l l
f K= 10 6 10 -7 ~ = 50°
"~ 10- 6 ~ ~ s o i r n 10_5
10_4 a x
,om,n
1 0 _ 1 I I l l l l l l l I J l l l l l l ] I I I I I I l l ] I I I J l l l l ] I I I I I I I l ] I I I l l l l l ] J I I I I I 10 14 10-13 10-12 10 11 10-10 10-9 10-8 10-7
C4H 2 MIXING RATIO
FIG. 13. The mixing ratio profile of diacetylene produced by the photochemical model for K = 106 cm 2 sec -~ and a solar zenith angle of 50 ° as a function of solar activity (solid lines) compared to the maximum vapor phase abundance from its equilibrium saturation vapor pressure over its ice (dashed lines). Where the saturation vapor abundance becomes less than a photochemical model abundance, condensation is expected to occur.
tions of C2H with H2, CH4, and C2H6 have an energy barrier (Laufer 1982). As the temperature decreases near the tropopause the recycling reactions give way to the pro- duction of the polyacetylenes, but conden- sation will also occur.
This competition between the production of higher order polyacetylenes by photo- chemistry and isolation by condensation on Neptune also takes place on Uranus (Ro- mani and Atreya 1986). Uranus strato- spheric aerosols are also most likely domi- nated by hydrocarbon ices and polyacety- lenes (Pollack et al. 1987). Comparisons between the single-scattering albedo of the stratospheric aerosols on Uranus and Neptune (Bergstralh and Baines 1984, Bergstralh et al. 1987) show the Neptune aerosols to be brighter. This is consistent with predictions from the combined photo- chemistry and condensation modeling. On Neptune, at the condensation level of diacetylene, the combined column produc- tion rate of C6H2 and C8H2 is 2 x l0 4 mole-
cules cm 2 sec-~; for Uranus the corre- sponding rate is 5 x 10⁵. The low abundance of hydrocarbons on Uranus, caused by methane in the stratosphere be- ing saturation-limited at the tropopause, limits the recycling of acetylene and di- acetylene after they undergo photolysis. For acetylene, the ratio of recycling to polyacetylene production upon undergoing photolysis is approximately 25 to 1 on Nep- tune and 3 to 1 on Uranus. For diacetylene, the same ratios are 74 to 1 for Neptune and nearly 1 to I for Uranus.
Another possible source of visible ab- sorbing aerosols for Uranus and Neptune is the irradiation of acetylene ice and subse- quent production of polymers. Stief et al.
(1964) observed hydrogen production from UV irradiation of C2H2 ice, and a waxy sub- stance was left behind after the ice was al- lowed to sublimate (L. J. Stief, personal communication 1987). On Neptune this will be reduced by the relatively large abun- dance of gaseous acetylene above the ice
NEPTUNE METHANE PHOTOCHEMISTRY 441
which will shield it from the UV, and the active dynamics observed in the lower stratosphere which will remove the ice par- ticles before radiation can postprocess them. On Uranus, irradiation processing of the ice will be more likely as the acetylene is optically thin above the ice layer, and the stratosphere appears to be very quiescent.
Irradiation of the ice by charged particles also appears more likely on Uranus than on Neptune. On Uranus, the charged particle flux arises from its magnetosphere and per- haps from electroglow electrons. The rela- tively low value of Lyman-a on Neptune (IUE measurements of -<200 R, J. T. Clarke, personal communication 1986, 1987) indicates a smaller electroglow com- ponent on Neptune than on Uranus, but it does not necessarily rule out a modest mag- netospheric environment around Neptune (Atreya 1986).
Whether the observed 4% change in the visible albedo of Neptune (Lockwood and Thompson 1986) is caused by the change in the rate of polyacetylene production is not certain. As can be seen in Fig. 13, the diacetylene mixing ratio at its condensation level approximately triples going from solar minimum to maximum. A similar increase is seen in the production rates of the poly- acetylenes C6H2 and C8H2. However, the albedo data show the nearly zero phase lag with solar UV activity. While the lifetime of diacetylene is less than the solar cycle above 0.2 mbar, the production lifetime at its peak is 32 years, longer than the solar cycle. Simple linear theory predicts a 90 ° phase lag in the peak of diacetylene produc- tion from the time of peak solar activity and a decrease in the amplitude of the change for this difference in time scales. Thus it is not evident that the polyacetylene produc- tion can supply the observed albedo change and more work is needed to test the mecha- nism. The photochemistry model can be coupled to both a cloud microphysics model and a radiative transfer model to de- termine the extent to which changes in the gas production of the polyacetylenes
change the albedo. The albedo data need to be analyzed for possible latitudinal and sea- sonal components as the long photochemi- cal production lifetime of the polyacety- lenes indicates that dynamical processes will be important for their global distribu- tion. Methane photochemistry may still provide the source for the albedo change via irradiation of the hydrocarbon ices or through another chemical pathway.
V. SUMMARY
On Neptune, the large abundance of stratospheric methane (~2%) forces pho- tolysis to occur near the homopause where gravitational separation clears the atmo- sphere. A nominal eddy mixing coefficient of 106 cm 2 sec -t at the methane homopause and proportional to the inverse square root of the atmospheric number density was se- lected based on observations of Neptune and comparisons to the other Jovian plan- ets. For methane, eddy mixing and molecu- lar diffusion lifetimes are always shorter than photochemical lifetimes. The pre- dicted global average mixing ratios of C2H6 and C2H2, 1.5 x 10 -6 and 6 x 10 -7, respec- tively, agree reasonably with the abun- dances deduced by measurements in the IR (Orton et al. 1987). The peak abundances of both acetylene and ethane occur at the level where maximum production from methane photolysis occurs, the level where an optical depth of one is reached in Ly- man-~. Above this level they rapidly de- crease with altitude due to molecular diffu- sion and the fall off of production from methane photolysis. Below, their mixing ratios are nearly constant with height due to dominance of eddy mixing. Loss of ethane and acetylene by photolysis is inefficient. For ethane, photolysis is hindered by shielding from methane; for acetylene, it is hindered by efficient recycling of its pho- tolysis products by the other hydrocarbons, its low quantum efficiency for dissociation, and the greatly reduced solar flux at Nep- tune. The detection of ethane on Neptune, but not on Uranus, is due to both the larger
442 ROMANI AND ATREYA
abundance of ethane and a warmer lower stratosphere on Neptune compared to Uranus. The greater ethane abundance on Neptune is a direct consequence of the larger abundance of stratospheric methane available for photolysis.
Methane photochemistry produces aero- sols in the form of hydrocarbon ices and polyacetylenes in the stratosphere of Nep- tune. Ethane, acetylene, and diacetylene are produced in large enough abundances from methane photolysis to condense to their respective ices near the tropopause. The predicted levels of these ice hazes agree well with observations of Neptune in the near IR and visible which require stratospheric aerosols in the same region (Bergstralh et al. 1987, Baines et al. 1987). These ice hazes are also capable of provid- ing the observed stratospheric aerosol opti- cal depth. Comparisons of model predic- tions were made to Uranus, the only other planet where the stratospheric aerosols are liable to be primarily from methane photo- chemistry producing hydrocarbon ices and polyacetylenes. (On Titan, the other plane- tary body where the production of aerosols from CH4 photolysis is significant, the pres- ence of nitrogen complicates the process (Sagan and Thompson 1984). Also the warmer temperatures allow for liquid clouds to form. This makes Titan not di- rectly comparable to Uranus or Neptune.) We predict a lower ratio of polyacetylene production to ice and a lower probability of UV postprocessing of the acetylene ice to polymers on Neptune compared to Uranus. The single-scattering albedo of the strato- spheric aerosols in the visible is greater on Neptune than on Uranus (Bergstralh et al. 1987, Bergstralh and Baines 1984). This is agreement with the above predictions as the hydrocarbon ices are brighter than polyacetylenes.
Future work will consist of better incor- porating condensation into the photochemi- cal model and adding more cloud micro- physical processes. This will improve the mixing ratios of the condensables in the
lower stratosphere and the calculated ice haze properties.
We look forward to the upcoming Voy- ager 2 encounter with Neptune in August 1989. The predicted abundances of C2H2 and C2H6 coupled with the warm strato- sphere may make them detectable by the IRIS. The occultation experiments per- formed by the Ultraviolet Spectrometer will determine the eddy mixing coefficient, which must still be taken as a free parame- ter in this model. Observations made by the photopolarimeter (PPS) and imaging instru- ments (ISS) will also provide further con- straints and information about the strato- spheric aerosols.
APPENDIX A
HYDROCARBON VAPOR PRESSURE EQUATIONS
Vp is the equilibrium saturation vapor pressure of hydrocarbon over its ice in mm Hg except where otherwise noted. T is tem- perature in degrees Kelvin.
M e t h a n e
Logl0(Vp)
= 4.425070 - 453 .92414/T- 4055.6016/ + 115352.19/T 3 - 1165560.7/T 4
35°K < T < 90.652°K.
Vp is vapor pressure in atmospheres, from Kirk and Ziegler (1965).
E t h a n e
LOgl0(Vp) = 10.01 - 1085.0/(T- 0.561)
40°K < T < 89.89°K,
fit to data given in Ziegler et al. (1964).
A c e t y l e n e
Logt0(Vp) = 9.130 - 1149.0/(T - 3.840)
l I5°K < T < 145°K
LOgl0(Vp) = 30.895 - 8.6252 * Logj0(T)
- 1645.9/T 98°K < T < II5°K,
fit to data given in Zeigler (1959).
N E P T U N E M E T H A N E P H O T O C H E M I S T R Y 4 4 3
Diacetylene
ln(Vp) = 22.915 - 4369.4/T
1 9 0 ° K < T < 2 3 2 ° K ,
fit to data given in Stull (1947).
ACKNOWLEDGMENTS
P. N. Romani acknowledges the National Science Foundation Graduate Fellowship Program and the NASA Planetary Atmospheres Program under Grant NSG-7404 for support during graduate school, and the NAS/NRC Resident Research program for support at NASA/GSFC. S. K. Atreya acknowledges support re- ceived from NASA Grant NSG-7404 and the Voyager project. We have benefited from discussions with V. Kunde, L. Stief, and M. Flassar and from helpful com- ments from our referees.
REFERENCES
ALLEN, M., J. P. PINTO, AND Y. L. YUNG 1980. Titan aerosol photochemistry and variations related to the sunspot cycle. Astrophys. J. 242, L125-L128.
AMES, W. F. 1969. Numerical Methods" for Partial Differential Equations. Barnes and Noble, New York.
APPLEBY, J. F. 1986. Radiative-convective equilib- rium models of Uranus and Neptune. Icarus 65, 383-405.
ATREYA, S. K. 1982. Eddy mixing coefficient on Sat- urn. Planet. Space Sci. 30, 849-854.
ATREYA, S. K. 1986. Atmospheres andlonospheres o f the Outer Planets and Their Satellites. Springer- Verlag, New York.
ATREYA, S. K., T. M. DONAHUE, AND M. C. FESTOU 1981. Jupiter: Structure and composition of the up- per atmosphere. Astrophys. J. 247, L43-L47.
ATREYA, S. K., AND J. J. PONTHIEU 1983. Photolysis of methane and the ionosphere of Uranus. Planet. Space Sci. 31, 939-944.
ATREYA, S. K., AND P. N. ROMANI 1985. Photochem- istry and clouds of Jupiter, Saturn, and Uranus. In Recent Advances in Planetary Meterology (G. E. Hint, Ed.), pp. 17-68. Cambridge University Press, Cambridge.
ATREYA, S. K., P. N. ROMANI, B. R. SANDEL, F. HERBERT, A. L. BROADFOOT, AND R. YELLE 1986. Voyager/Uranus UV occultations--Atmospheric vertical mixing and photochemistry. Bull. Amer. As- tron. Soc. 18, 758.
ATREYA, S. K., J. H. WAITE, T. M. DONAHUE, A. F. NAGY, AND J. C. MECONNELL 1984. Theory, mea- surements and models of the upper atmosphere and ionosphere of Saturn. In Saturn (T. Gehrels, Ed.), pp. 239-277. Univ. of Arizona Press, Tucson.
BAINES, K. H., J. T. BERGSTRALH, R. J. TERRILE, D. WENKERT, J. NEFF, B. A. SMITH, AND W. H. SMITH 1987. Aerosol and gas distributions in the
troposphere of Neptune: Constraints from broad- band imagery and low and high-resolution spectro- photometry. Bull. Amer. Astron. Soc. 19, 639.
BERGSTRALH, J. T., AND K. H. BAINES 1984. Proper- ties of the upper tropospheres of Uranus and Nep- tune derived from observations at "visible" to near- infrared wavelengths. In Uranus and Neptune (J. T. Bergstralh, Ed.), pp. 179-212. NASA Conference Publication 2330.
BERGSTRALH, J. T., K. H. BAINES, R. J. TERRILE, D. WENKERT, J. NEFF, AND B. A. SMITH 1987. Aero- sols in the stratosphere of Neptune: Constraints from near-Ir broadband imagery and UV, blue, and near-Ir spectrophotometry. Bull. Amer. Astron. Soc. 19, 639.
CALDWELL, J., T. OWEN, A. R. RIVOLO, V. MOORE, G. E. HUNT, AND P. S. BUTTERWORTH 1981. Ob- servations of Uranus, Neptune and Titan by the In- ternational Ultraviolet Explorer. Astron. J. 86, 298- 305.
CALDWELL, J., R. WAGENER, AND K. FRICKE 1987. The composition of the stratospheres of Uranus and Neptune. In Program and Abstracts Book o f Origin and Evolution o f Planetary Satellite Atmospheres Meeting (S. K. Atreya and J. B. Pollack, Eds.), p. 45.
COURTIN, R., D. GAUTIER, AND L. LACOMBE 1979. Indications of supersaturated stratospheric methane in Neptune from its atmospheric thermal profile. Icarus 37, 236-248.
DONNAY, J. D. H., AND H. M. ONDIK (Eds.) 1972. Crystal Data Determinative Tables. Organic Com- pounds 1972, 3rd ed., Vol. I. National Bureau of Standards, Washington, DC.
FRENCH, R. G., J. H. ELIAS, D. J. MINK, AND J. L. ELLIOT 1983. The structure of Neptune's upper at- mosphere: The stellar occultation of 24 May 1981. Icarus 55, 332-336.
FRITTS, D. C. 1984. Gravity wave saturation in the middle atmosphere: A review of theory and obser- vations. J. Geophys. Res. 22, 275-308.
G1ELETT, F. C., AND G. H. RIEKE 1977. 5--20 micron observations of Uranus and Neptune. Astrophys. J. 218, L141-LI44.
GLADSTONE, G. R. 1982. Radiative Transfer and Pho- tochemistry in the Upper Atmosphere o f Jupiter. Ph.D. thesis, California Institute of Technology.
GLICKER, S., AND H. OKABE 1987. Photochemistry of Diacetylene. J. Phys. Chem. 91, 437-440.
HERBERT, F., B. R. SANDEL, R. V. YELLE, J. B. HOLBERG, A. L. BROADFOOT, D. E. SHEMANSKY, S. K. ATREYA, AND P. N. ROMANI 1987. The upper atmosphere of Uranus: EUV occultations observed by Voyager 2. J. Geophys. Res. 92, 15093-15109.
HEROUX, L., AND H. E. HINTEREGGER 1978. Aeronomical reference spectrum for solar UV be- low 2000 A. J. Geophys. Res. 83, 5305-5308.
HUBBARD, W. B., P. D. NICHOLSON, E. LELLOUCH, B. SICARDY, A. BRAHIC, F. VILLAS, P. BOUCHET,
444 R O M A N I A N D A T R E Y A
R. A. MCLAREN, R. L. MILLIS, L. H. WASSERMAN, J. H. ELIAS, K. MATTHEWS, AND C. PERRIER 1987. Oblateness, radius, and mean stratospheric temper- ature of Neptune from the 1985 August 20 occulta- tion. Icarus 72, 635-646.
HUDSON, C. M., J. E. ALLEN, JR., M. A. PERERA- JARMER, AND R. K. KHANNA 1987. Laboratory va- por pressure measurements of hydrocarbons and ni- triles. In Proceedings o f the 2nd Annual Meeting o f Laboratory Measurements for Planetary Science, in press.
JOYCE, R. R., C. B. PILCHER, D. P. CRUIKSHANK, AND D. MORRISON 1977. Evidence for weather on Neptune I. Astrophys. J. 214, 657-662.
KIRK, B. S., AND W. T. ZIEGLER 1965. A phase-equi- librium apparatus for gas-liquid systems and the gas phase of gas-solid systems: Application to methane- hydrogen from 66.88 ° to 116.53°K and up to 125 at- mospheres. In Advances in Cryogenic' Engineering (K. D. Timmerhaus, Ed.), Vol. 10, Part 2, pp. 160- 170. Plenum, New York.
LAUFER, A. H. 1982. Kinetics and photochemistry of planetary atmospheres. In Abstracts o f the Fourth Annual Meeting o f Planetary Atmospheres Princi- pal Investigators (S. K. Atreya and D. Swartz, Eds.), pp. 137-138. University of Michigan Press.
LELLOUCH, E., W. B. HUBBARD, B. SICARDY, F. VILAS, AND P. BOUCHET 1986. Occultation determi- nation of Neptune's oblateness and methane strato- spheric mixing ratio. Nature 324, 227-231.
LINDZEN, R. S. 1971. Tides and gravity waves in the upper atmosphere. In Mesospheric Models and Re- lated Experiments (G. Fiocco, Ed.), pp. 122-130. Reidel, Dordrecht.
LINDZEN, R. S. 1981. Turbulence and stress owing to gravity wave and tidal breakdown. J. Geophys. Res. 86, 9707-9714.
LIOU, K.-N. 1980. An Introduction to Atmospheric Radiation. Academic Press, New York.
LOCKWOOD, G. W., AND D. T. THOMPSON 1979. A relationship between solar activity and planetary al- bedos. Nature 280, 43-45.
LOCKWOOD, G. W., AND D. T. THOMPSON 1986. Long-term brightness variations of Neptune and the solar cycle modulation of its albedo. Science 234, 1543-1545.
MACY, W., JR. 1980. Mixing ratios of methane, eth- ane, and acetylene in Neptune's stratosphere. Icarus 41, 153-158.
MACY, W., JR. AND W. S1NTON 1977. Detection of methane and ethane in emission on Neptune but not on Uranus. Astrophys. J. 218, L79-L81.
MARRERO, T. R., AND E. A. MASON 1972. Gaseous diffusion coefficients. J. Phys. Chem. Ref. Data 1, 3-118.
MOUNT, G. H., AND G. J. ROTTMAN 1981. The solar spectral irradiance 1200-3184 A near solar maxi- mum: July 15, 1980. J. Geophys. Res. 86, 9193- 9198.
ORTON, G. S., D. K. AITKEN, C. SMITH, P. F. ROUCHE, J. CALDWELL, AND R. SNYDER 1987. The spectra of Uranus and Neptune at 8-14 and 17-23 txm. Icarus 70, 1-12.
ORTON, G. S., AND J. F. APPLEBY 1984. Temperature structure and infrared-derived properties of the at- mospheres of Uranus and Neptune. In Uranus and Neptune (J. T. Bergstralh, Ed.), pp. 89-156. NASA Conference Publication 2330.
ORTON, G. S., A. Z. TOKUNAGA, AND J. CALDWELL 1983. Observational constraints on the atmospheres of Uranus and Neptune from new measurements near 10/xm. Icarus 56, 147-164.
PEARL, J. C., B. J. CONRATH, R. A. HANNEL, J. A. PIRRAGLIA, AND A. COUSTENIS 1987. Energy bal- ance of Uranus: Preliminary Voyager results. Bull. Amer. Astron. Soc. 19, 852.
PILCHER, C. B. 1977. Evidence for weather on Nep- tune II. Astrophys. J. 214, 663-666.
POLLACK, J. B., K. RAGES, S. POPE, M. TOMASKO, P. N. ROMANI, AND S. K. ATREYA 1987. Nature of the stratospheric haze on Uranus: evidence for con- densed hydrocabons. J. GeophYs. Res. 92, 15037- 15065.
ROMANI, P. N. 1986. Clouds and Methane Photo- chemical Hazes on the Outer Planets. Ph.D. thesis, University of Michigan.
ROMANI, P. N., AND S. K. ATREYA 1984. Photochem- istry of Methane in the Atmosphere of Neptune. Bull. Amer. Astron. Soc. 16, 660.
ROMANI, P. N., AND S. K. ATREYA 1986. Polyacety- lene Photochemistry and Condensation on Uranus. Bull. Amer. Astron. Soc. 18, 758.
SAGAN, C., AND W. R. THOMPSON 1984. Production and condensation of organic gases in the atmosphere of Titan. Icarus 59, 133-151.
SAVAGE, B. D., W. R. COCHRAN, AND P. R. WES- SELIUS 1980. Ultraviolet albedos of Uranus and Neptune. Astrophys. J. 237, 627-637.
SLANGER, T. G. 1982. 1216 A. photodissociation of H20, NH3, and CH4. In Abstracts o f the Fourth An- nual Meeting o f Planetary Atmospheres Principal Investigators (S. K. Atreya and D. Swartz, Eds.), pp. 129-131. University of Michigan Press.
STIEF, L. J., V. J. DECARLO, AND R. J. MATALONI 1964. Vacuum-ultraviolet photolysis of acetylene. J. Chem. Phys. 42, 3113-3121.
STROBEL, D. F. 1969. The photochemistry of methane in the Jovian atmosphere. J. Atmos. Sci. 26, 906- 911.
STROBEL, D. F. 1973. The photochemistry of hydro- carbons in the Jovian atmosphere. J. Atmos. Sci. 30, 489-498.
STROBEL, D. F. 1975. Aeronomy of the major planets: Photochemistry of ammonia and hydrocarbons. Rev. Geophys. Space Phys. 13, 372-382.
STULL, D. R. 1947. Vapor pressure of pure substances organic compounds. Indust. Eng. Chem. 39, 517- 540.
N E P T U N E M E T H A N E P H O T O C H E M I S T R Y 445
TERRILE, R. J., AND B. A. SMITH 1983. The rotation rate of Neptune from ground-based CCD Imaging. Bull. Amer. Astron. Soc. 15, 858.
TOKUNAGA, A. T., G. S. ORTON, AND J. CALDWELL 1983. New observational and constraints on the tem- perature inversions of Uranus and Neptune. Icarus 53, 141-146.
VOGEL, A. I. 1948. Physical properties and chemical constitution. Part XXIII. Miscellaneous com- pounds. Investigation of the so-called co-ordinate or dative link in esters of oxy-acids and in nitro- paraffins by molecular refractivity determinations. Atomic structural and group parachors and refrac- tivities. J. Chem. Soc. London, 1833-1855.
WAITE, J. H., JR. 1981. The Ionosphere o f Saturn. Ph.D. thesis, The University of Michigan.
WEIDENSCHILLING, S. J., AND J. S. LEWIS 1973. At- mospheric and cloud structures of the Jovian plan- ets. Icarus 20, 465-476.
WEST, R. A., D. F. STROBEL, AND M. G. TOMASKO 1986. Clouds, aerosols, and photochemistry in the Jovian atmosphere. Icarus 65, 161-218.
YUNG, Y. L., M. ALLEN, AND J. P. PINTO 1984. Pho- tochemistry of the atmosphere of Titan: Comparison between model and observations. Astrophys. J. Suppl. 55, 465-506.
ZIEGLER, W. T. 1959. The Vapor Pressures o f Some Hydrocarbons in the Liquid and Solid State at Low Temperatures. National Bureau of Standards Tech- nical Note 4.
ZIEGLER, W. T., B. S. KIRK, J. C. MULLINS, AND A. R. BERQUIST 1964. Calculation o f the Vapor Pres- sure and Heats o f Sublimation o f Liquids and Solids Below One Atmosphere Pressure. VII. Ethane. Technical Report No. 2 , Eng. Expt. Station, Geor- gia Institute of Technology.


![UNIVERSITY OF MUMBAI and Degree...addition and Di- π- methane rearrangement including aza-di- π -methane. [2L] 4.4 Photochemistry of arenes: 1, 2- , 1, 3- and 1, 4- additions. [1L]](https://img.pdfslide.us/doc/110x75/608946179e262778c73a0ff2/university-of-mumbai-and-degree-addition-and-di-methane-rearrangement-including.jpg)