Embed Size (px)
Citation preview
Methane line parameters from 3700 to 4136 cm- 1
Linda R. Brown
The positions and strengths of -1900 absorption lines of methane between 3700 and 4136 cm-' were measuredexperimentally to provide a reference line list for the identification of weak CH4 features in planetary spectra.The line parameters were obtained at room temperature with accuracies of 0.0002-0.003 cm' for positionsand 3-40% for strengths using spectra recorded at 0.011-cm'1 resolution (unapodized) with a Fouriertransform spectrometer at Kitt Peak National Observatory/National Solar Observatory. Individual linestrengths range from 2 X 10⁻⁵ to 1.3 X 10⁻² cm-2 atm-1 at room temperature, and the sum of the observedstrengths is 1.42 cm-2 atm-' at 297 K. All measurements are reported in natural isotopic abundance.
I. Introduction
Knowledge of the methane spectrum is importantfor the remote sensing of atmospheres. Research inthe last decade has expanded and improved the qualityof existing molecular parameters" 2 to support the in-terpretation of atmospheric and planetary spectra.Much detail is already known for the 0-300-,3,4 1000-2000-,5-7 2250-3250-,1"89 4136-4666-,1,11 and 5500-6100-cm- 1 (Ref. 12) regions of methane. However, nosystematic study has been made of the 3700-4136-cm1 region of CH4 containing transitions of the 3v4(3868-cm-1) and 24 + V2 (4125-cm-') bands. In addi-tion, many weak features in the 4136-4666-cm'1 re-gion have not been measured.
This study reports the experimental measurementof some 1900 features of methane in the 3700-4136-cm'1 region observed at 0.011-cm1 resolution withstrengths greater than 2.0 X 10⁻⁵ cm-2 atm- at297(2) K. This study represents one contribution tothe comprehensive but long-term analysis undertakento understand the 3700-4700-cm-1 region of methane.Studies8'91 have revealed the difficulty in fitting mea-surements to the precision of the available high-resolu-tion data. It is now understood that the ultimatetreatment will require a simultaneous fitting of eightstates (3v4 at 3868 cm', 2v4 + 2 at 4125 cm'1, v + V4 at4220 cm'1, V3 + V4 at 4335 cm'1, 4 + 22 at 4370 cm-', 1+ 2 at 4450 cm'1, V2 + V3 at 4545 cm'1, and 3v2 at 4600
The author is with California Institute of Technology, Jet Propul-sion Laboratory, 4800 Oak Grove Drive, Pasadena, California 91109.
Received 10 March 1988.0003-6935/88/153275-05$02.00/0.© 1988 Optical Society of America.
cm-') before a useful prediction of the region can beachieved. While much work remains, the parametersdescribed here will serve as a reference for those wish-ing to identify CH4 features in atmospheric spectra.
11. Experimental Details
For this study the methane spectra were recorded at0.011-cm-' resolution (unapodized) using the Fouriertransform spectrometer located at the McMath tele-scope at Kitt Peak National Observatory/National So-lar Observatory (KPNO/NSO). The optical arrange-ment, detectors (InSb), beam splitter (CaF2), opticalsource (quartz projection lamp), gas sample source(ultrahigh-purity grade from Matheson), and absorp-tion cells were the same as the ones used in otherstudies.610" 1,13 Table I gives the gas conditions (pres-sure in torr, path in meters, and temperature in kelvin)and bandpass in cm-' of the spectral data. Figure 1shows samples of the spectra for the Q branches of 3v4near 3865 cm'i and 24 + 2 near 4125 cm'1. Featureswere measured in several different scans so that aver-aged values of position and strength could be reportedfor each feature.
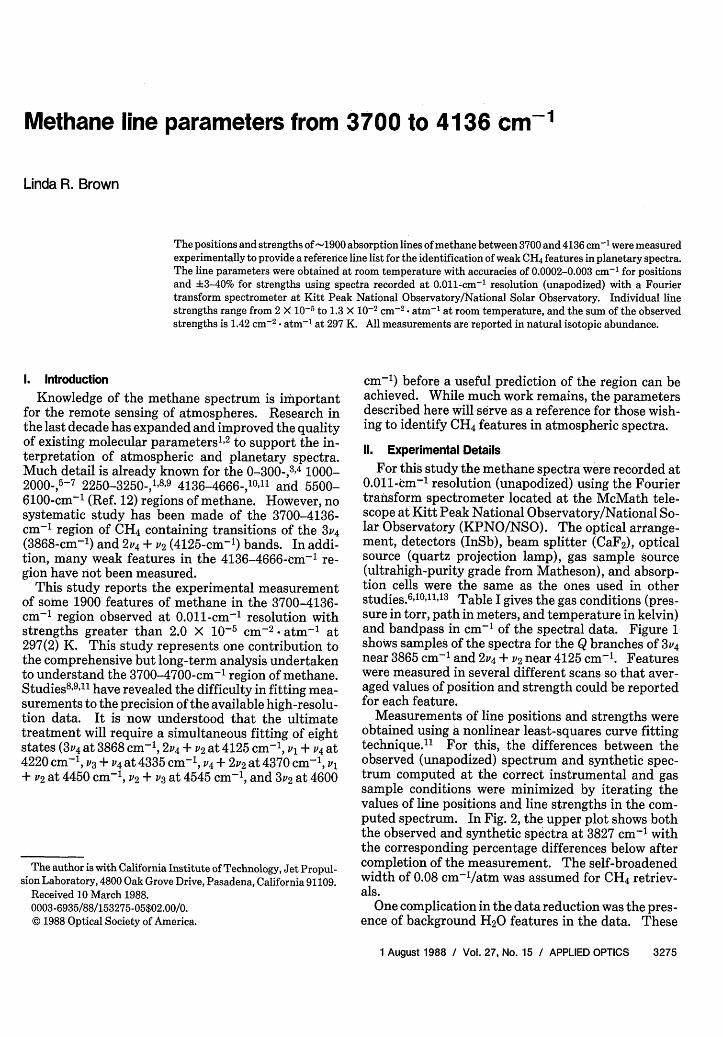
Measurements of line positions and strengths wereobtained using a nonlinear least-squares curve fittingtechnique." For this, the differences between theobserved (unapodized) spectrum and synthetic spec-trum computed at the correct instrumental and gassample conditions were minimized by iterating thevalues of line positions and line strengths in the com-puted spectrum. In Fig. 2, the upper plot shows boththe observed and synthetic spectra at 3827 cm-1 withthe corresponding percentage differences below aftercompletion of the measurement. The self-broadenedwidth of 0.08 cm'1/atm was assumed for CH4 retriev-als.
One complication in the data reduction was the pres-ence of background H20 features in the data. These
1 August 1988 / Vol. 27, No. 15 / APPLIED OPTICS 3275
arose from the outgassing of water in the FTS tank andfrom residual water in the optical path between thesource and absorption cell. Although the optical pathbetween the source and gas cells was purged with theeffluent of liquid nitrogen and the FTS tank was evac-uated to 20 Am, considerable H2 0 absorption appearedin the 3700-3960-cm' region. For example, in the toppanel of Fig. 1, the positions of strong H20 lines areindicated by tick lines above the plot. However, de-spite these strong interferences, methane featureswhich fell on the wings of H20 lines were measured byincluding the H20 parameters (positions, strengths,and widths) in the least-squares algorithm adjust-ment. This is illustrated in Fig. 2. Because the H20features generally had both a Gaussian componentfrom the low pressure residual water in the FTS tankand a Lorentzian component from the N2 purged waterin the optical path, the resulting profiles of the H20lines were modeled by assuming two transitions foreach water line which had very different line broaden-ing parameters. This approach proved very effectivein providing the satisfactory local continuum for theretrieval of the nearby CH4 features, although the ex-perimental precision of the measurement was some-times degraded. In the worst case, a few methane linescoincided with nearly saturated H20 lines, and onlyestimated positions and strengths were determined.As a final step in the data reduction, three observedspectra were compared with corresponding computedspectra based on the averaged CH4 parameters andH20 line parameters from the AFGL compilation.Each section of the spectrum from 3700 to 4136 cm-'was examined to verify that the sum of the computedCH4 and H20 absorption matched the observed data.However, some obvious errors in the line strengths ofweaker H20 line parameters introduced some addi-tional uncertainties into the strengths of adjacent CH4lines. Fortunately, above 3960 cm-', the observedspectrum is fairly free of the residual H20 absorption.
Positions and line strengths were measured from thefirst six runs shown in Table I. To check that the gasconditions were correctly recorded, previously mea-sured strengths of selected P-branch lines of V3 be-tween 2900 and 2950 cm-' cm-' (Ref. 14), and lines ofV1 + V4 at 4220 cm'1 (Ref. 11) were retrieved; these testsindicated that the optical density measurements wereconsistent to within 2% or better.
Table I. Experimental Conditions of the Spectraa
Scan Pressure Path Temperature Bandpass Species
1 2.02 1.50 297.3 1900-5200 CH42 1.90 2.40 298.4 1900-5200 CH43 17.9 0.25 296.0 3500-5500 CH44 10.0 1.50 297.3 1900-5500 CH45 8.00 2.40 298.9 1900-5200 CH46 1.01 25.0 297.0 3500-5500 CH47 3.0 2.40 298.0 1800-5500 CH4
0.1 25.0 CO0.3 25.0 N 20
a Pressure, path, and temperature are given in units of torr, meter,and kelvin, respectively. The banspass is in cm-'.
°l 1 I I t L .*4120.0 4122.0 4124.0 4126.0 4128.0 4120.0
Fig. 1. Methane laboratory spectrum near the Q branches of 3V4 at3866 cm-' (upper) and 2 4 + 2 at 4125 cm-' lower recorded atKPNO/NSO. The apodized resolution is 0.016 cm', the pressure is
10.05 Torr at 297 K, and the path is 1.5 m.
,.73826.1+1I
-1 I I I , , , , 1
Fig. 2. Retrieval of line strengths and positions by nonlinear least-squares curve fitting. The unapodized observed and synthetic spec-tra near 3827 cm-1 are overlaid with the percentage differencesplotted below. The largest feature is due to H20 absorption
(see text).
The absolute calibration of the line positions wasmade using as standards the P7 line of 3 at2947.912106 cm'1, 5 the 2-0 band of CO,16, and the 2v3band of N20 at 4400 cml.1 7 Scan 7 of Table I wasrecorded using two absorption cells in the manner of
3276 APPLIED OPTICS / Vol. 27, No. 15 / 1 August 1988
-1��aA, opAA A00A 6 a AA�'AA, 1A AAh-A AA -. -V - V.v wv� V - VYWY-VVV-VV " V - , � VV-V-VpVy4u~
+ =73 N20 Z=37 CO
4150.0 cm-1
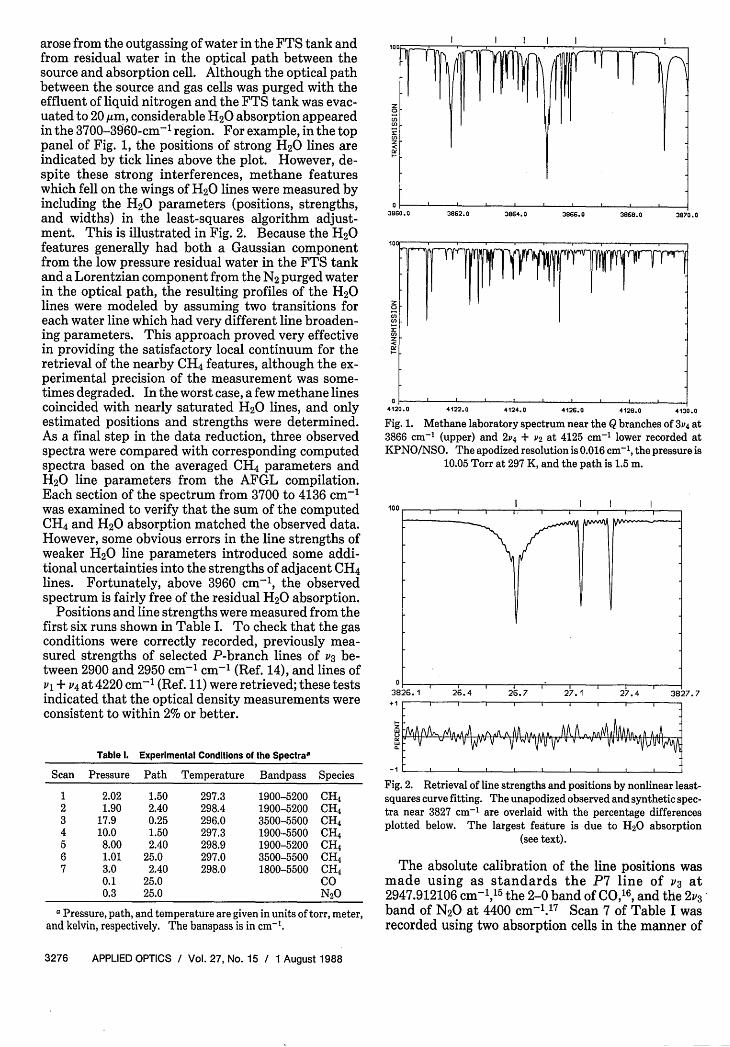
Fig. 3. Observed-calculated CO (z) and N2 0 (+) line positionsfrom spectrum 7 of Table I. The values of Pollock et al. 6 "17 from4150 to 4450 cm-1 are used as calibration standards for the CH4
positions in Table II.
Ref. 18. A 6-m base White cell set at 25 m contained amixture of N2 0 and CO, while a 2.4-m cell containedCH4 at 3 Torr. Figure 3 shows the agreement betweenthe observed and standard positions. As a check, thecalibrated positions of selected isolated CH4 lines at4100 cm'1 were compared to corresponding lines inscan 1, which were calibrated using the P7 line of P3; thetwo calibrations were within 0.000 08 cm-' of eachother. It should be noted that the methane positionsin the 4136-4666-cm-' region10 originally calibratedwith different standards were revised recently'; thepositions for the 3700-4136-cm'l-region are consis-tent with the corrected values.
Ill. Results and Discussion
In all, some 1900 CH4 lines with strengths >0.2 X10⁻⁵ cm-2 atm-' at 297 K were measured in naturalisotopic abundance. The full listing of measurementscan be obtained from the author. For brevity, only theexperimental line positions and strengths of 235 stronglines (S > 1.6 X 10⁻³ cm 2
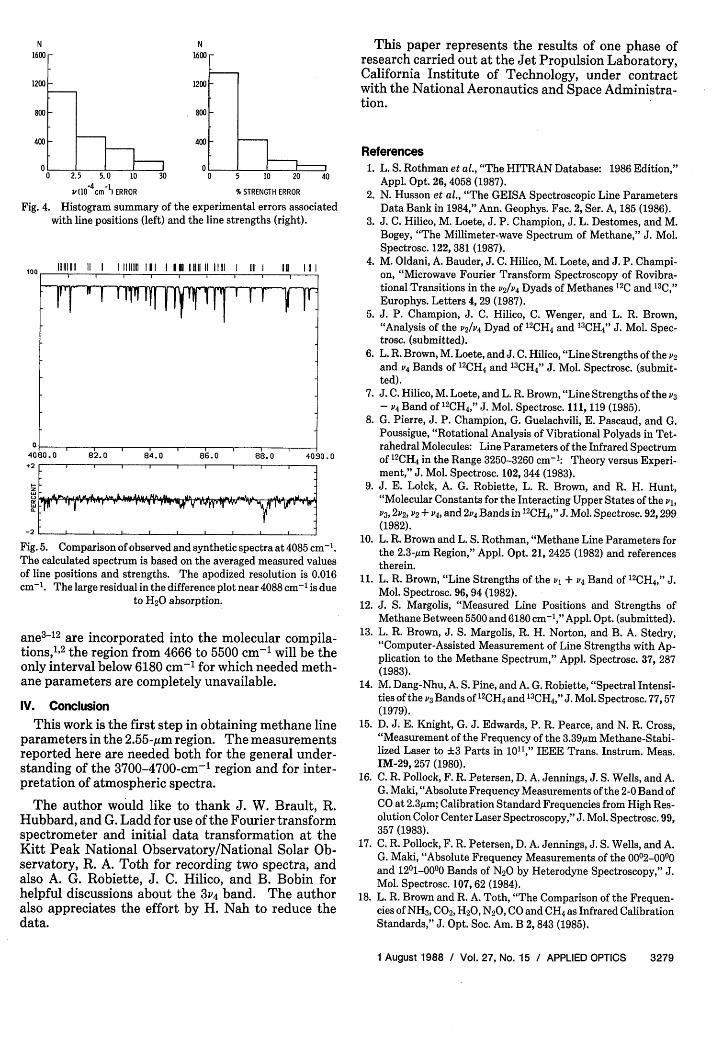
. atm-') are given in TableII. The columns there include the measured positionsand experimental precision (Err) of the last two digitsin cm-', the measured strength in 10-3 cm-2 - atm-'near 297 K and the percentage experimental error(%Er), and the number of spectra measured for eachfeature M. The percentage of experimental errors arerms differences between measurements based on %(Oi- Av)/Av using the individual measurements Oi andthe averaged value Av. In Fig. 4, the histogram sum-marizes the distribution of the experimental rms er-rors for positions (left) and strengths (right). Themajority of the unblended lines have precisions ofbetter than 0.00025 cm-' and 5%, respectively, for theline positions and lines strengths. However, theseerror estimates should not be taken too literally; com-puted errors better than 0.0001 cm-' for positions and1% for strengths are probably too optimistic.
As in Ref. 12, the precisions of the measurementsdepend on the complexity of the observed spectrum.Well-isolated lines, with no strong neighbors within
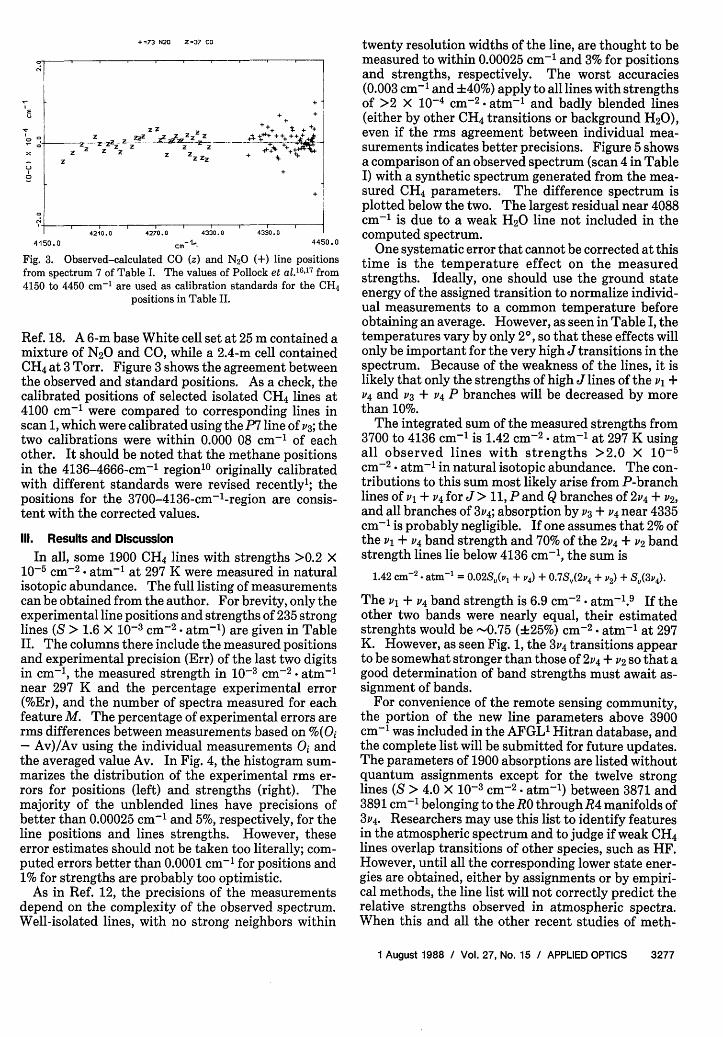
twenty resolution widths of the line, are thought to bemeasured to within 0.00025 cm-1 and 3% for positionsand strengths, respectively. The worst accuracies(0.003 cm-' and ±40%) apply to all lines with strengthsof >2 X 10⁻⁴ cm-2 -atm-' and badly blended lines(either by other CH4 transitions or background H20),even if the rms agreement between individual mea-surements indicates better precisions. Figure 5 showsa comparison of an observed spectrum (scan 4 in TableI) with a synthetic spectrum generated from the mea-sured CH4 parameters. The difference spectrum isplotted below the two. The largest residual near 4088cm-' is due to a weak H20 line not included in thecomputed spectrum.
One systematic error that cannot be corrected at thistime is the temperature effect on the measuredstrengths. Ideally, one should use the ground stateenergy of the assigned transition to normalize individ-ual measurements to a common temperature beforeobtaining an average. However, as seen in Table I, thetemperatures vary by only 2°, so that these effects willonly be important for the very high Jtransitions in thespectrum. Because of the weakness of the lines, it islikely that only the strengths of high J lines of the v +zV4 and 3 + 4 P branches will be decreased by morethan 10%.
The integrated sum of the measured strengths from3700 to 4136 cm-' is 1.42 cm- 2 - atm-' at 297 K usingall observed lines with strengths >2.0 X 10⁻⁵cm-2 -atm-' in natural isotopic abundance. The con-tributions to this sum most likely arise from P-branchlines of v + V4 for J > 11, P and Q branches of 2v4 + V2,and all branches of 3v4; absorption by V3 + V4 near 4335cm'1 is probably negligible. If one assumes that 2% ofthe v + V4 band strength and 70% of the 2v4 + 2 bandstrength lines lie below 4136 cm-', the sum is
1.42 cm2 . atm-1 = 0.02S,(P1 + 4) + 07SV(2V4 + 2) + S0(3V4)-
The vl + v4 band strength is 6.9 cm 2 .atm-'. 9 If theother two bands were nearly equal, their estimatedstrenghts would be -0.75 (25%) cm-2 atm-' at 297K. However, as seen Fig. 1, the 3v 4 transitions appearto be somewhat stronger than those of 2V4 + V2 so that agood determination of band strengths must await as-signment of bands.
For convenience of the remote sensing community,the portion of the new line parameters above 3900cm-1 was included in the AFGL1 Hitran database, andthe complete list will be submitted for future updates.The parameters of 1900 absorptions are listed withoutquantum assignments except for the twelve stronglines (S > 4.0 X 10⁻³ cm-2 . atm-') between 3871 and3891 cm-' belonging to the RO through R4 manifolds of3V4. Researchers may use this list to identify featuresin the atmospheric spectrum and to judge if weak CH4lines overlap transitions of other species, such as HF.However, until all the corresponding lower state ener-gies are obtained, either by assignments or by empiri-cal methods, the line list will not correctly predict therelative strengths observed in atmospheric spectra.When this and all the other recent studies of meth-
1 August 1988 / Vol. 27, No. 15 / APPLIED OPTICS 3277
88Z ++_ + +U + Z 8 +Lz z r zzz d +- o
4270 I I I I I 42 10.0C 4270.0 4330.0 4300.0
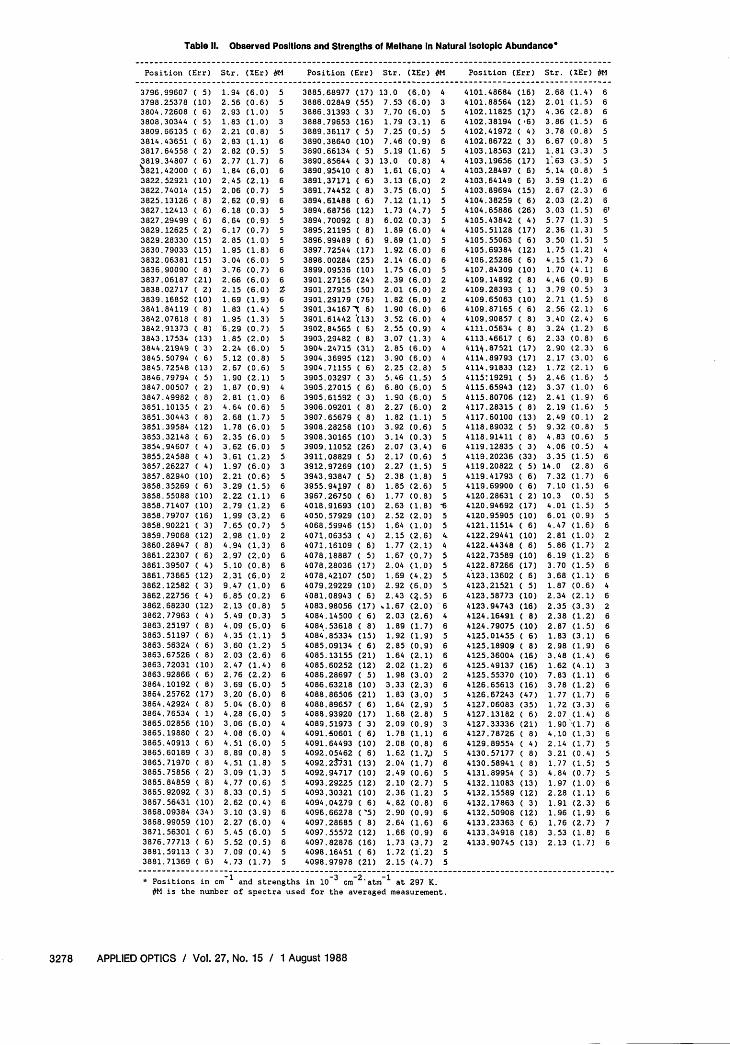
Table II. Observed Positions and Strengths of Methane In Natural Isotopic Abundance'
Position (Err) Str. (Er) M Position (Err) Str. (Er) #M Position (Err) Str. (Er) J#M_- _ - -_ - -_ - -_ - -_ - -_ - -_ - -_ - -_ - -_ - -_ - -_ - -_ - -_ - -_ - -_ - -_ -_ _ -_ _ -_ _ -_ _ -_ _ -_ _ -_ _ -_ _ -_ _ -_ _ -_ _ -_ _ -_ _ -_ _ -_ _ -_ _ -_ _ - -_ - -_ - -_ - -_ _ - -_ - -_ - -_ - -_ - -_ - -_ - -_ - -_ - -_- -_ -
3796.99607 ( 5)3798.25378 (10)3804.72608 ( 6)3808.30344 ( 5)3809.66135 ( 6)3814.43651 ( 6)3817.64558 ( 2)3819.34807 ( 6)3821.42000 ( 6)3822.52921 (10)3822.74014 (15)3825.13126 ( 8)3827.12413 ( 6)3827.29499 ( 6)3829.12625 ( 2)3829.28330 (15)3830.79033 (15)3832.06381 (15)3836.90090 ( 8)3837.06187 (21)3838.02717 ( 2)3839.16852 (10)3841.84119 ( 8)3842.07818 ( 8)3842.91373 ( 8)3843.17534 (13)3844.21949 ( 3)3845.50794 ( 6)3845.72548 (13)3846.79794 ( 5)3847.00507 ( 2)3847.49982 ( 8)3851.10135 ( 2)3851.30443 ( 8)3851.39584 (12)3853.32148 ( 6)3854.94607 ( 4)3855.24588 ( 4)3857.26227 ( 4)3857.82940 (10)3858.35269 ( 6)3858.55088 (10)3858.71407 (10)3858.79707 (16)3858.90221 ( 3)3859.79068 (12)3860.28947 ( 8)3861.22307 ( 6)3861.39507 ( 4)3861.73665 (12)3862.12582 ( 3)3862.22756 ( 4)3862.68230 (12)3862.77963 ( 4)3863.25197 ( 8)3863.51197 ( 6)3863.56324 ( 6)3863.67526 ( 8)3863.72031 (10)3863.92866 ( 6)3864.10192 ( 8)3864.25762 (17)3864.42924 ( 8)3864.76534 ( 1)3865.02856 (10)3865.19880 ( 2)3865.40913 ( 6)3865.60189 ( 3)3865.71970 ( 8)3865.75856 ( 2)3865.84859 ( 8)3865.92092 ( 3)3867.56431 (10)3868.09384 (34)3868.99059 (10)3871.56301 ( 6)3876.77713 ( 6)3881.59113 ( 3)3881.71369 ( 6)
1.94 (6.0)2.56 (0.6)2.93 (1.0)1.83 (1.0)2.21 (0.8)2.83 (1.1)2.82 (0.5)2.77 (1.7)1.84 (6.0)2.45 (2.1)2.06 (0.7)2.62 (0.9)6.18 (0.3)6.64 (0.9)6.17 (0.7)2.85 (1.0)1.95 (1.8)3.04 (6.0)3.76 (0.7)2.66 (6.0)2.15 (6.0)1.69 (1.9)1.83 (1.4)1.95 (1.3)'6.29 (0.7)1.85 (2.0)2.24 (6.0)5.12 (0.8)2.67 (0.6)1.90 (2.1)1.87 (0.9)2.81 (1.0)4.64 (0.6)2.68 (1.7)1.78 (6.0)2.35 (6.0)3.62 (6.0)3.61 (1.2)1.97 (6.0)2.21 (0.6)3.29 (1.5)2.22 (1.1)2.79 (1.2)1.99 (3.2)7.65 (0.7)2.98 (1.0)4.94 (1.3)2.97 (2.0)5.10 (0.8)2.31 (6.0)9.47 (1.0)6.85 (0.2)2.13 (0.8)5.49 (0.3)4.09 (6.0)4.35 (1.1)3.60 (1.2)2.03 (2.6)2.47 (1.4)2.76 (2.2)3.69 (6.0)3.20 (6.0)5.04 (6.0)4.28 (6.0)3.06 (6.0)4.08 (6.0)4.51 (6.0)8.89 (0.8)4.51 (1.8)3.09 (1.3)4.77 (0. 6)8.33 (0.5)2.62 (0.4)3.10 (3.9)2.27 (6.0)5.45 (6.0)5.52 (0.5)7.09 (0.4)4.73 (1.7)
3885.68977 (17)3886.02849 (55)3886.31393 ( 3)3888.79653 (16)3889.36117 ( 5)3890.38640 (10)3890.66134 ( 5)3890.85644 ( 3)3890.95410 ( 8)3891.37171 ( 6)3891.74452 ( 8)3894.61488 ( 6)3894.68756 (12)3894.70092 ( 8)3895.21195 ( 8)3896.99489 C 6)3897.72544 (17)3898.00284 (25)3899.09536 (10)3901.27156 (24)3901.27915 (50)3901.29179 (76)3901.34167'5 6)3901.61442 (13)3902.84565 ( 6)3903.29482 ( 8)3904.24715 (31)3904.36995 (12)3904.71155 ( 6)3905.03297 ( 3)3905.27015 ( 6)3905.61592 ( 3)3906.09201 ( 8)3907.65679 ( 8)3908.28258 (10)3908.30165 (10)3909.11052 (26)3911.08829 ( 5)3912.97269 (10)3943.93847 ( 5)3955.94$97 ( 8)3967.26750 C 6)4018.91693 (10)4050.57929 (10)4068.59946 (15)4071.06353 ( 4)4071.16109 C 6)4078.18887 C 5)4078.28036 (17)4078.42107 (50)4079.29229 (10)4081.08943 ( 6)4083.98056 (17)4084.14500 C 6)4084.53618 C 8)4084.85334 (15)4085.09134 ( 6)4085.13155 (21)4085.60252 (12)4086.28697 ( 5)4086.63218 (10)4088.86506 (21)4088.89657 ( 6)4088.93920 (17)4089.51973 ( 3)4091.60601 ( 6)4091.64493 (10)4092.05462 ( 6)4092.23'731 (13)4092.94717 (10)4093.29225 (12)4093.30321 (10)4094.04279 ( 6)4096.66278 ('5)4097.28685 ( 8)4097.55572 (12)4097.82876 (16)4098.16451 ( 6)4098.97978 (21)
13.0 (6.0)7.53 (6.0)7.70 (6.0)1.79 (3.1)7.25 (0.5)7.46 (0.9)5.19 (1.6)
13.0 (0.8)1.61 (6.0)3.13 (6.0)3.75 (6.0)7.12 (1.1)1.73 (4.7)6.02 (0.3)1.89 (6.0)9.89 (1.0)1.92 (6.0)2.14 (6.0)1.75 (6.0)2.39 (6.0)2.01 (6.0)1.82 (6.0)1.90 (6.0)3.52 (6.0)2.55 (0.9)3.07 (1.3)2.85 (6.0)3.90 (6.0)2.25 (2.8)5.46 (1.5)6.80 (6.0)1.90 (6.0)2.27 (6.0)1.82 (1.1)3.92 (0.6)3.14 (0.3)2.07 (3.4)2.17 (0.6)2.27 (1.5)2.38 (1.8)1.85 (2.6)1.77 (0.8)2.63 (1.8)2.52 (2.0)1.64 (1.0)2.15 (2. 6)1.77 (2.1)1.67 (0.7)2.04 (1.0)1.69 (4.2)2.92 (6.0)2.43 (2.5)1.67 (2.0)2.03 (2.6)1.89 (1.7)1.92 (1.9)2.85 (0.9)1.64 (2.1)2.02 (1.2)1.98 (3.0)3.33 (2.3)1.83 (3.0)1.64 (2.9)1.68 (2.8)2.09 (0.9)1.78 (1.1)2.08 (0. 8)1.62 (1.7.)2.04 (1.7)2.49 (0.6)2.10 (2.7)2.36 (1.2)4.82 (0.8)2.90 (0.9)2.64 (1.6)1.66 (0.9)1.73 (3.7)1.72 (1.2)2.15 (4.7)
4101.48684 (16)4101.88564 (12)4102.11825 (17)4102.38194 ('6)4102.41972 ( 4)4102.86722 ( 3)4103.18563 (21)4103.19656 (17)4103.28497 ( 6)4103.64149 ( 6)4103.89694 (15)4104.38259 ( 6)4104.65886 (26)4105.43842 ( 4)4105.51128 (17)4105.55063 ( 6)4105.69384 (12)4106.25286 ( 6)4107.84309 (10)4109.14892 ( 8)4109.28393 ( 1)4109.65063 (10)4109.87165 ( 6)4109.90857 ( 8)4111.05634 ( 8)4113.46617 ( 6)4114,.87521 ( 17 )4114.89793 (17)4114.91833 (12)4115:19291 ( 5)4115.65943 (12)4115.80706 (12)4117.28315 ( 8)4117.60100 (13)4118.89032 ( 5)4118.91411 ( 8)4119.12835 ( 3)4119.20236 (33)4119.20822 ( 5)4119.41793 ( 6)4119.69900 ( 6)4120.28631 ( 2)4120.94692 (17)4120.95905 (10)4121.11514 ( 6)4122.29441 (10)4122.44348 ( 6)4122.73589 (10)4122.87266 (17)4123.13602 ( 6)4123.21521 ( 5)4123.58773 (10)4123.94743 (16)4124.16491 ( 8)4124.79075 (10)4125.01455 C 6)4125.18909 ( 8)4125.36004 (16)4125.49137 (16)4125.55370 (10)4126.65613 (16)4126.67243 (47)4127.06083 (35)4127.13182 ( 6)4127.33336 (21)4127.78726 ( 8)4129.89554 ( 4)4130.57177 ( 8)4130.58941 ( 8)4131.89954 ( 3)4132.11083 (13)4132.15589 (12)4132.17863 ( 3)4132.50908 (12)4133.23363 ( 6.)4133.34918 (18)4133.90745 (13)
2.682.014.363.863.786.671.811 635. 143.592.672.033.035.772.363.501.754. 151.704.463.792.712. 563.403.242.332.902. 171. 722.463.372.412.192.499.324.834.063.35
14.07.327. 10
10.34.016.014.472.815.866.193.703.681.872.342.352.382.871.832.983.481.627.833.781.771.722.071.904.102.143.211.774.841.972.281.911.961.763.532.13
(1.4)(1.5)(2. 8)( 1. 5)(0. 8)(0.8)(3.3)(3. 5)(0.8)(1.2)(2.3)(2. 2)(1. 5)(1.3)(1.3)(1.5)(1.2)(1.7)(4. 1)(0.9)(0. 5)(1. 5)(2. 1)(2.4)(1.2)(0. 8)(2.3)(3.0)(2. 1)(1.6)(1.0)(1.9)(1.6)(0. 1)(0.8)(0. 6)(0. 5)(1.5)(2. 8)(1.7)(1.5)(0. 5)(1.5)(0.9)(1.6)(1.0)(1.7)(1.2)(1.5)I(1.1)(0.6)(2. 1)(3.3)(1.2)(1.5)(3. 1)(1.9)(1.4)(4.1)(1. 1)(1.2)(1.7)(3.3)(1.4)( 1.7)(1.3)(1.7)(0.4)(1.5)(0.7)(1.0)(1.1)(2.3)(1.9)(2.7)(1.8)(1.7)
cm1
-3 -2' -1* Positions in cm and strengths in 10 cm 'atm at 297 K.#0M is the number of spectra used for the averaged measurement.
3278 APPLIED OPTICS / Vol. 27, No. 15 / 1 August 1988
N1600
1200
800
400
1600 rr
1200
800
40aFig. 4. 0 Hitora sumr3f0hxermna
Fig. 4. Histogram summary of the experimental with line positions (left) and the line strengt
n 11111111 11 II I I I I 1 1 11 11 11111 I III
4
0
Fig. 5. Comparison of observed and synthetic speciThe calculated spectrum is based on the averagedof line positions and strengths. The apodized reEcm-'. The large residual in the difference plot near
to H2O absorption.
ane3-12 are incorporated into the molecttions,"2 the region from 4666 to 5500 cmonly interval below 6180 cm-' for which rane parameters are completely unavaila
IV. Conclusion
This work is the first step in obtainingparameters in the 2.55-gm region. The mnreported here are needed both for the gEstanding of the 3700-4700-cm-" region apretation of atmospheric spectra.
The author would like to thank J. VHubbard, and G. Ladd for use of the Four:spectrometer and initial data transforKitt Peak National Observatory/Nationservatory, R. A. Toth for recording twoalso A. G. Robiette, J. C. Hilico, andhelpful discussions about the 3 4 band.also appreciates the effort by H. Nah tdata.
2.5 5. 0 10 30-4 -1Y 10 cm ) ERROR % STREI
This paper represents the results of one phase ofresearch carried out at the Jet Propulsion Laboratory,California Institute of Technology, under contractwith the National Aeronautics and Space Administra-tion.
References1. L. S. Rothman et al., "The HITRAN Database: 1986 Edition,"
10 20 40 Appl. Opt. 26, 4058 (1987).4GTH ERROR 2. N. Husson et al., "The GEISA Spectroscopic Line Parameterserrors associated Data Bank in 1984," Ann. Geophys. Fac. 2, Ser. A, 185 (1986).hs (right). 3. J. C. Hilico, M. Loete, J. P. Champion, J. L. Destomes, and M.
Bogey, "The Millimeter-wave Spectrum of Methane," J. Mol.Spectrosc. 122, 381 (1987).
4. M. Oldani, A. Bauder, J. C. Hilico, M. Loete, and J. P. Champi-on, "Microwave Fourier Transform Spectroscopy of Rovibra-tional Transitions in the 2/1V4 Dyads of Methanes 1
2 C and 13C,"Europhys. Letters 4, 29 (1987).
5. J. P. Champion, J. C. Hilico, C. Wenger, and L. R. Brown,"Analysis of the V2/v4 Dyad of "2CH4 and "3CH4 " J. Mol. Spec-trosc. (submitted).
6. L. R. Brown, M. Loete, and J. C. Hilico, "Line Strengths of the V2
and V4 Bands of 12CH4 and 3 CH 4 " J. Mol. Spectrosc. (submit-ted).
7. J. C. Hilico, M. Loete, and L. R. Brown, "Line Strengths of the V3
- /4 Band of 12CH 4 ," J. Mol. Spectrosc. 111, 119 (1985).8. G. Pierre, J. P. Champion, G. Guelachvili, E. Pascaud, and G.
Poussigue, "Rotational Analysis of Vibrational Polyads in Tet-rahedral Molecules: Line Parameters of the Infrared Spectrum
8.0 4090.0 of 2CH4 in the Range 3250-3260 cm"": Theory versus Experi-ment," J. Mol. Spectrosc. 102, 344 (1983).
9. J. E. Lolck, A. G. Robiette, L. R. Brown, and R. H. Hunt,"Molecular Constants for the Interacting Upper States of the 1,
)J3,21)2, P2 + Y4, and 24 Bands in 12CH 4 ," J. Mol. Spectrosc. 92,299(1982).
10. L. R. Brown and L. S. Rothman, "Methane Line Parameters fortra at 4085 cm- 1. the 2.3-gm Region," Appl. Opt. 21, 2425 (1982) and referencesmneasured values therein.;olution is 0.016 11. L. R. Brown, "Line Strengths of the + Band of 12CH 4 ," J.4088 cm" 1 is due Mol. Spectrosc. 96, 94 (1982).
12. J. S. Margolis, "Measured Line Positions and Strengths ofMethane Between 5500 and 6180 cm-'," Appl. Opt. (submitted).
flar compila- 13. L. R. Brown, J. S. Margolis, R. H. Norton, and B. A. Stedry,u ' will be the "Computer-Assisted Measurement of Line Strengths with Ap-
plication to the Methane Spectrum," Appl. Spectrosc. 37, 287ieeded meth- (1983).)le. 14. M. Dang-Nhu, A. S. Pine, and A. G. Robiette, "Spectral Intensi-
ties of the V3 Bands of12CH 4 and 13CH 4 ," J. Mol. Spectrosc. 77,57(1979).
methane line 15. D. J. E. Knight, G. J. Edwards, P. R. Pearce, and N. R. Cross,easurements "Measurement of the Frequency of the 3.39m Methane-Stabi-neral under- lized Laser to 3 Parts in 10"," IEEE Trans. Instrum. Meas.mdnfra inter- 1.IM-29, 257 (1980).nd for inter- 16. C. R. Pollock, F. R. Petersen, D. A. Jennings, J. S. Wells, and A.
G. Maki, "Absolute Frequency Measurements of the 2-0 Band of. Brault, R. CO at 2.3gm; Calibration Standard Frequencies from High Res-
ier transform olution Color Center Laser Spectroscopy," J. Mol. Spectrosc. 99,iation at the 17 357 (1983).al Solar Ob- 17. C. R. Pollock, F. R. Petersen, D. A. Jennings, J. S. Wells, and A.spectrla, and G. Maki, "Absolute Frequency Measurements of the 0002-0000spectra, and and 121-0000 Bands of N20 by Heterodyne Spectroscopy," J.B. Bobin for Mol. Spectrosc. 107, 62 (1984).The author 18. L. R. Brown and R. A. Toth, "The Comparison of the Frequen-
o reduce the cies of NH3 , C, H0, N0, CO and CH4 as Infrared CalibrationStandards," J. Opt. Soc. Am. B 2, 843 (1985).
1 August 1988 / Vol. 27, No. 15 / APPLIED OPTICS 3279
080.0 82.0 84.0 86.0 8
so1 w~~~~~~~w~V W. r wr'rwsTav