Embed Size (px)
Citation preview

s
’s), C/1999ght–his band ofnt to our
gir placebserved.
Icarus 165 (2003) 391–406www.elsevier.com/locate/icaru
Methane in Oort cloud comets
E.L. Gibb,a,∗ M.J. Mumma,b N. Dello Russo,b,c M.A. DiSanti,b and K. Magee-Sauerd
a NAS-NRC, Laboratory for Extraterrestrial Physics, NASA Goddard Space Flight Center Code 690, Greenbelt, MD 20771, USAb Laboratory for Extraterrestrial Physics, NASA Goddard Space Flight Center Code 690, Greenbelt, MD 20771, USA
c Department of Physics, The Catholic University of America, Washington, DC 20064, USAd Department of Chemistry and Physics, Rowan University, Glassboro, NJ 08028, USA
Received 17 December 2002; revised 18 June 2003
Abstract
We detected CH4 in eight Oort cloud comets using high-dispersion (λ/�λ∼ 2× 10⁴) infrared spectra acquired with CSHELL at NASAIRTF and NIRSPEC at the W.M. Keck Observatory. The observed comets were C/1995 O1 (Hale–Bopp), C/1996 B2 (HyakutakeH1 (Lee), C/1999 T1 (McNaught–Hartley), C/1999 S4 (LINEAR), C/2000 WM1 (LINEAR), C/2001 A2 (LINEAR), and 153/P Ikeya–Zhan(C/2002 C1). We detected the R0 and R1 lines of theν3 vibrational band of CH4 near 3.3 µm in each comet, with the exception of McNaugHartley where only the R0 line was measured. In order to obtain production rates, a fluorescence model has been developed for tCH4. We reportg-factors for the R0 and R1 transitions at several rotational temperatures typically found in comet comae and relevaobservations. Usingg-factors appropriate toTrot as determined from HCN, CO and/or H2O and C2H6, CH4 production rates and mixinratios are presented. Abundances of CH4/H2O are compared among our existing sample of comets, in the context of establishing theof origin. In addition, CH4 is compared to native CO, another hypervolatile species, and no correlation is found among the comets o 2003 Elsevier Inc. All rights reserved.
Keywords: Comets, composition; Infrared observations; Spectroscopy
nd
o-mis-the
mis-e inal.,
inalI)entc)
inke)R0ding
2
ion,ley)e do
aly-d
ro-eum-
ec-Cat
ion1–of
1. Introduction
Methane is an important constituent of interstellar acometary volatile composition. However, since CH4 is asymmetric hydrocarbon without a permanent dipole mment, the only observable transitions for gas phase esion in cometary comae are the ro-vibrational bands ininfrared spectral region. Attempts to detect fluorescent esion in theν3 band of methane near 3.3 µm were first madcomets C/1973 E1 (Kohoutek) and 1P/Halley (Roche et1975; Kawara et al., 1988; Drapatz et al., 1987). A margdetection of CH4 was claimed in Comet Wilson (1986(Larson et al., 1989) and an upper limit of 0.31 percrelative to water was reported for Comet C/Levy (1990(Brooke et al., 1991).
Cometary CH4 was first unambiguously detectedground-based observations of C/1996 B2 (Hyakuta(Mumma et al., 1996). Since then, firm detections of theand R1 lines have been made in several comets, inclu
* Corresponding author.E-mail address: [email protected] (E.L. Gibb).
0019-1035/$ – see front matter 2003 Elsevier Inc. All rights reserved.doi:10.1016/S0019-1035(03)00201-X
C/1995 O1 (Hale–Bopp), C/1999 S4 (LINEAR), C/2001 A(LINEAR), C/2000 WM1 (LINEAR), C/1999 H1 (Lee), andmost recently 153/P Ikeya–Zhang (C/2002 C1). In additthe R0 line was observed in C/1999 T1 (McNaught–Hartand the P2 and P3 lines were observed in Hyakutake (wnot report values for P3 since it is blended with CH3OH).
In Section 2 we discuss the observations and data ansis. We present the CH4 ν3 band fluorescence model anresultingg-factors in Section 3. In Section 4 we present pduction rates and mixing ratios for CH4, and discuss sompossible implications and scenarios in Section 5. We smarize our results in Section 6.
2. Observing approach and data reduction
Observations were performed using the long-slit sptrometers CSHELL at NASA’s 3-meter IRTF and NIRSPEat the 10-meter W.M. Keck Observatory, both locatedMauna Kea, Hawaii. Both instruments are high-disperscryogenic echelle spectrometers with sensitivity in the5.5 µm spectral region. For the CSHELL observations

392 E.L. Gibb et al. / Icarus 165 (2003) 391–406
t
Table 1Observations
Comet Date Transition (ν3) R� (AU) ∆ (AU) ∆-dot (km/s) tint (s) Slit width (arcsec) Instrumen
C/1996 B2 (Hyakutake) 24.4 March 1996 R0 1.060 0.106 −15.5 240 1 CSHELLR1 240 1 CSHELL
10.2 April 1996 P2 0.685 0.533 56.2 240 1 CSHELL12.2 April 1996 R0 0.638 0.596 56.5 240 1 CSHELL
R1 120 1 CSHELLP2 120 1 CSHELL
C/1995 O1 (Hale–Bopp) 24.2 February 1997 R0 1.114 1.568 −28.8 120 1 CSHELL30.0 April 1997 R0 1.048 1.753 29.6 240 1 CSHELL
R1 120 1 CSHELL1.0 May 1997 R0 1.056 1.770 29.6 120 1 CSHELL
C/1999 H1 (Lee) 19.6 August 1999 R0+ R1 1.049 1.381 −28.4 480 0.432 NIRSPEC21.6 August 1999 R0+ R1 1.076 1.348 −29.0 1560 0.432 NIRSPEC
C/1999 S4 13.6 July 2000 R0+ R1 0.810 0.578 −56.7 1680 0.742 NIRSPEC
C/1999 T1 (McNaught–Hartley) 4.7 March 2001 R0 1.710 1.450 18.1 3600 2 CSHELL
C/2001 A2 9.5 July 2001 R0+ R1 1.161 0.276 11.5 1680 0.432 NIRSPEC10.5 July 2001 R0+ R1 1.173 0.282 12.4 2400 0.432 NIRSPEC
C/2000 WM1 23.3 November 2001 R0+ R1 1.355 0.383 −23.7 3120 0.432 NIRSPEC
153/P 21.9 March 2002 R0 0.512 0.761 −31.8 960 1 CSHELLIkeya–Zhang(C/2002 C1)
R1 0.516 0.742 480 1 CSHELL22.9 March 2002 R1 0.733 0.490 −31.2 960 1 CSHELL
(5-sedide-ith
ith
theluxstarR-and
BAb-pledS).ap-andnal-gthisslit
tai-rac-e-data
(Dello999;
tralhichn etngthbur-
here,ericnor-
achshed
eenives
withachTheHption.
al.,
-ow
le–
Hyakutake, Hale–Bopp, and Ikeya–Zhang, a 1-arcsecpixel) wide slit was used while a 2-arcsec wide slit was ufor observations of McNaught–Hartley. These slits provspectral resolving powersλ/�λ ∼ 25000 and 15000, respectively. A 3-pixel (0.43-arcsec) wide slit was used wNIRSPEC for comets Lee, A2, and WM1 (λ/�λ∼ 25000).For S4, a 5-pixel (0.72-arcsec) wide slit was used wNIRSPEC(λ/�λ ∼ 15000). The small pixel sizes (0.2 ×0.2-arcsec for CSHELL and 0.14 × 0.19-arcsec for NIR-SPEC) provide seeing-limited angular resolution alongslit. A summary of the observations is given in Table 1. Fcalibrations were based on observations of standardthrough a wider slit (4-arcsec) using CSHELL. For NISPEC observations, the 3- and 5-pixel slits were used,a slit-loss correction was included in our analysis.
Observations were taken in an observing sequence ABnodding either on or off the chip. For nodding off-chip, A oservations placed the comet at the slit center, and B samblank sky 2-arcmin perpendicular to the slit length (N orFor nodding on-chip, A and B were taken in positionsproximately one-quarter of the distance from the topbottom of the slit, respectively. This increased the sigto-noise by as much as
√2 for an observation by doublin
the time on source per second of clock time. However,mode of observation limits the spatial coverage along thecompared with nodding off-chip.
Data were processed using algorithms specificallylored to our comet observations and include dark subttion, flat fielding, and removal of cosmic ray hits. Dtailed descriptions of our observing procedures and
s
,
processing techniques have been discussed elsewhereRusso et al., 1998, 2000, 2001; Magee-Sauer et al., 1DiSanti et al., 2001).
Atmospheric models were obtained using the SpecSynthesis Program (SSP, Kunde and Maguire, 1974), wuses the HITRAN 1992 Molecular Data Base (Rothmaal., 1998). We used these SSP models to assign wavelescales to the extracted spectra and to determine columndens for the absorbing species in the Earth’s atmospprimarily water and methane in this study. The atmosphmodel is binned to the resolution of the comet spectrum,malized, and scaled to the comet continuum level.
Figure 1 shows 5-row (1-arcsec) spectral extracts for eobservation, centered on the gas emission peak. The daline is the atmospheric model fit. The difference betwthe atmospheric fit and the observed comet spectrum gthe residual cometary emission spectrum, convolvedthe atmospheric transmittance function (shown below espectrum in Fig. 1). Methane emission lines are labeled.3-σ uncertainty level at the Doppler-shifted position for C4is indicated on each plot. The deep atmospheric absorlines are due primarily to water (2ν2 band) and methaneCometary OH* (1–0) prompt emission lines (Mumma et2001a), as well as the R1 and R0 lines of CH4, are clearlyseen in emission in NIRSPEC spectra (Fig. 1b).
Production rates (in molecules s−1) are calculated by assuming the idealized case of spherically symmetric outflat uniform velocity,vgas= 0.8R−0.5
h km s−1. The only ex-ception to this was the high production rate comet Ha

Methane
inO
ortcloudcom
ets393
(a)
Fig. 1. Spectra for each comet observed in this study. (a) shows CSHELL spectra of comets Hyakutake, Hale–Bopp, McNaught–Hartley, and Ikeya–Zhang, and (b) shows NIRSPEC (KL2 setting, order 23)spectra of comets Lee, S4, WM1, and A2. Doppler-shifted positions of the appropriate lines of methane are indicated, as well as the OH* emissions where applicable. The dashed line is the atmospheric modelfit. Underneath the spectra are the residuals determined by subtracting the atmospheric fit from the comet spectrum. The 3-σ uncertainty level at the Doppler-shifted CH4 position is indicated.

394 E.L. Gibb et al. / Icarus 165 (2003) 391–406
(b)
Fig
.1.C
ontin
ued.

Methane in Oort cloud comets 395
ke ond line is a
Fig. 2. Sample production rate growth curves (Q-curves) for CH4 in comets Lee on 21.6 August, A2 on 10.5 July, Hale–Bopp on 1.0 May, and Hyakuta12.2 April. TheQ-curve was generated by stepping 1× 1-arcsec extracts averaged east and west of the nucleus over the range in Table 3. The dashebest fit to the weighted average of these symmetric production rates (∗), resulting in the global spherical production rates reported in Table 3.
is-in
ac-
t al.
ix o
tion
ns--therichen
alueforna-
othingitivend
ol-it-tet
e onle–Wendpec-or
cksionalalsohs.e-ons
Bopp where radio observations indicatevgas = 1.1R−0.5h
km s−1 (Biver et al., 1999).A symmetricQ-curve is constructed from the mean em
sion intensity to either side of the nucleus measured1-arcsec intervals along the spatial direction of the slitcording to:
(1)Q= 4π∆2Fi
giτ (hcν)f (x),
(see Dello Russo et al., 1998, 2000, Magee-Sauer e1999; and DiSanti et al., 2001 for more details). Here∆ isthe geocentric distance in meters,hcν is the energy (J) of aphoton with wavenumberν (cm−1), f (x) is the fraction ofmolecules expected in the sampled region (see appendHoban et al., 1991), andFi is the flux (W m−2) from line iincident on the terrestrial atmosphere. The photodissocialifetime (τ ) is taken to be 1.32× 10⁵ s for CH4 (Huebner etal., 1992), andgi is the line fluorescence efficiency (photos−1 molecule−1), both of which are calculated for a heliocentric distance of 1 AU. OurQ-curves increase with distance from the nucleus due to seeing, comet drift, and oobserving factors, until a terminal value is reached, whwe take to be the “global” production rate. The ratio betwethe terminal production rate and the nucleus-centered vis typically 3–4 for CSHELL observations and 1.5–2.5NIRSPEC observations. This methodology is used to alyze all our molecular emissions, including the OH* quadru-plet discussed below. ExampleQ-curves for both NIRSPEC
,
f
and CSHELL data are shown in Fig. 2. The NIRSPECQ-curves (Lee on August 21 and A2 on 10 July) combine bthe R0 and R1 lines to improve signal-to-noise. When usthis method, the derived production rates are less sensto seeing, drift of the comet perpendicular to the slit, apotential optical depth effects.
Opacity effects were evaluated following the methodogy outlined in DiSanti et al. (2001) for calculating the crical radius (Rc) at whichτ = 1 at line-center. We find thaCH4 optical depth effects are not important for any comin this paper. The worst case scenarios are for HyakutakUT 24 March due to its close proximity to Earth and HaBopp on 24 February owing to the high production rate.calculateRc < 0.2 and 4 km (corresponding to 0.003 a0.004 arcsec) for R0 in Hyakutake and Hale–Bopp, restively. This is well within the central 0.2-arcsec pixel feach comet.
3. A fluorescence model for CH4
Methane is a symmetric tetrahedral hydrocarbon. It laa permanent dipole moment and hence has no pure rotatlines and cannot be observed at radio wavelengths. Itdoes not fluoresce efficiently at visible or UV wavelengtDetermination of CH4 production rates in comets is therfore dependent on observations of ro-vibrational transitiin the infrared. The strongest of these is theν3 band near
396 E.L. Gibb et al. / Icarus 165 (2003) 391–406
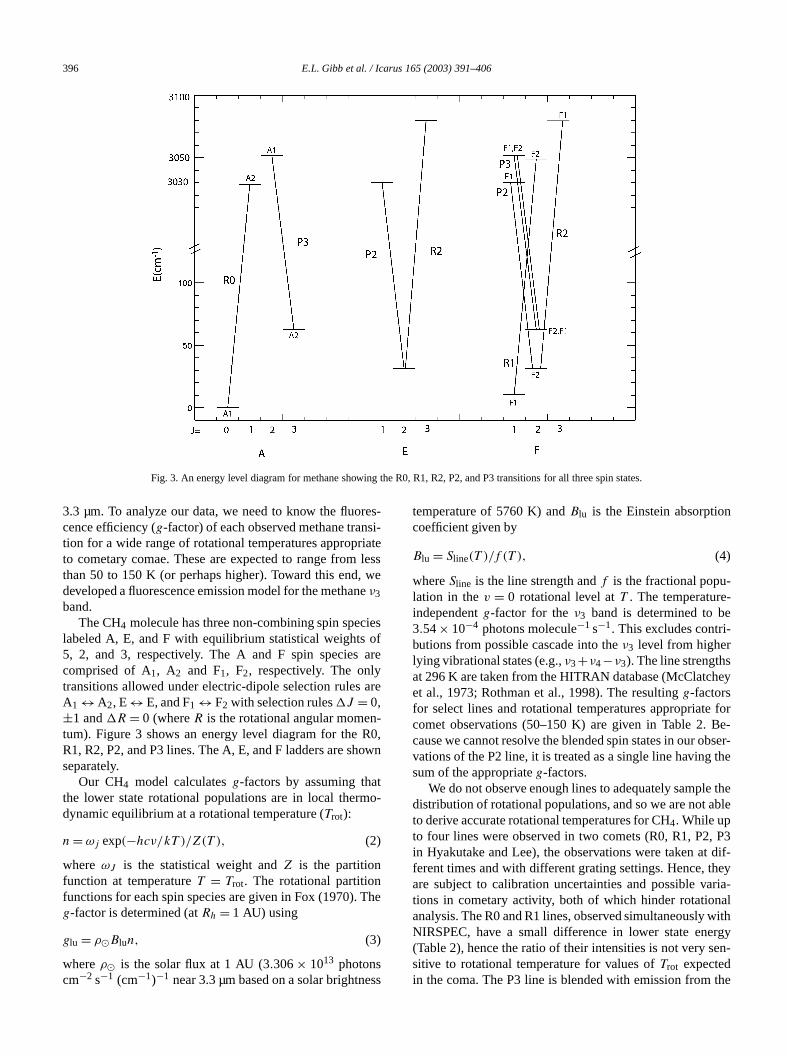
Fig. 3. An energy level diagram for methane showing the R0, R1, R2, P2, and P3 transitions for all three spin states.
res-si-iateleswe
ne
iesofare
are
n-R0,own
to-
The
ess
n
--e-
hey
forBe-bser-the
e theble
, P3dif-
heyria-alwithrgyen-
the
3.3 µm. To analyze our data, we need to know the fluocence efficiency (g-factor) of each observed methane trantion for a wide range of rotational temperatures approprto cometary comae. These are expected to range fromthan 50 to 150 K (or perhaps higher). Toward this end,developed a fluorescence emission model for the methaν3band.
The CH4 molecule has three non-combining spin speclabeled A, E, and F with equilibrium statistical weights5, 2, and 3, respectively. The A and F spin speciescomprised of A1, A2 and F1, F2, respectively. The onlytransitions allowed under electric-dipole selection rulesA1 ↔ A2, E↔ E, and F1 ↔ F2 with selection rules�J = 0,±1 and�R = 0 (whereR is the rotational angular mometum). Figure 3 shows an energy level diagram for theR1, R2, P2, and P3 lines. The A, E, and F ladders are shseparately.
Our CH4 model calculatesg-factors by assuming thathe lower state rotational populations are in local thermdynamic equilibrium at a rotational temperature (Trot):
(2)n= ωj exp(−hcν/kT )/Z(T ),whereωJ is the statistical weight andZ is the partitionfunction at temperatureT = Trot. The rotational partitionfunctions for each spin species are given in Fox (1970).g-factor is determined (atRh = 1 AU) using
(3)glu = ρ�Blun,
whereρ� is the solar flux at 1 AU (3.306× 10¹³ photonscm−2 s−1 (cm−1)−1 near 3.3 µm based on a solar brightn
s
temperature of 5760 K) andBlu is the Einstein absorptiocoefficient given by
(4)Blu = Sline(T )/f (T ),
whereSline is the line strength andf is the fractional population in thev = 0 rotational level atT . The temperatureindependentg-factor for theν3 band is determined to b3.54× 10−4 photons molecule−1 s−1. This excludes contributions from possible cascade into theν3 level from higherlying vibrational states (e.g.,ν3+ν4−ν3). The line strengthsat 296 K are taken from the HITRAN database (McClatcet al., 1973; Rothman et al., 1998). The resultingg-factorsfor select lines and rotational temperatures appropriatecomet observations (50–150 K) are given in Table 2.cause we cannot resolve the blended spin states in our ovations of the P2 line, it is treated as a single line havingsum of the appropriateg-factors.
We do not observe enough lines to adequately sampldistribution of rotational populations, and so we are not ato derive accurate rotational temperatures for CH4. While upto four lines were observed in two comets (R0, R1, P2in Hyakutake and Lee), the observations were taken atferent times and with different grating settings. Hence, tare subject to calibration uncertainties and possible vations in cometary activity, both of which hinder rotationanalysis. The R0 and R1 lines, observed simultaneouslyNIRSPEC, have a small difference in lower state ene(Table 2), hence the ratio of their intensities is not very ssitive to rotational temperature for values ofTrot expectedin the coma. The P3 line is blended with emission from

Methane in Oort cloud comets 397
Table 2CH4 ν3 g-factors
Transition ν0 (cm−1) Ela (cm−1) g-factors*
50 K 75 K 100 K 125 K 150 K
R0 (A1-A2) 3028.752 0.00 4.316 2.383 1.557 1.118 0.8525
R1 (F1-F2) 3038.499 10.48 3.153 1.925 1.322 0.9787 0.7615
R2 (F2-F1) 3048.153 31.44 2.444 1.824 1.386 1.090 0.8827(E-E) 3048.169 1.629 1.216 0.9240 0.7264 0.5884
P2 (F2-F1) 2998.994 31.44 0.9797 0.7312 0.5556 0.4367 0.3537(E-E) 2999.060 0.6524 0.4869 0.3700 0.2908 0.2356
P3 (A2-A1) 2988.795 62.88 1.080 1.090 0.9627 0.8285 0.7127(F2-F1) 2988.932 0.6518 0.6564 0.5795 0.4984 0.4287(F1-F2) 2989.033 0.6513 0.6570 0.5804 0.4995 0.4297
P4 (F2-F1) 2978.650 104.78 0.2713 0.4055 0.4366 0.4232 0.3942(E-E) 2978.848 0.1801 0.2705 0.2918 0.2831 0.2639(F1-F2) 2978.920 0.2697 0.4057 0.4377 0.4247 0.3959(A1-A2) 2979.012 0.4470 0.6742 0.7282 0.7069 0.6591
* In units of 10−5 photons molecule−1 s−1.a Lower state energy.
byatis-andaly-rom-
tionof
-lly
ta-
ra-cies
isera
s as
%R1theLLetiosib-to
ture
as a
b-eforeished
,late-e asddi-n-inceinat-tion
CH3OH ν2 band. However, the degree of contaminationCH3OH cannot be determined since there exists no sfactory low-temperature fluorescence model for this bof methanol. For this reason, P3 is not used in our ansis. We therefore adopt rotational temperatures derived fanalysis of CO, HCN, and H2O. It is unknown whether collisions will equilibrateTrot in CH4 with that found for othermolecules. However, analyses of relativeQ-branch intensi-ties for theν7 band (Dello Russo et al., 2001) of C2H6 (alsoan apolar molecule) are consistent withTrot found for thesemolecules, suggesting that this is a reasonable assumpFurther, our analysis of molecules having a wide rangedipole moments indicates thatTrot is not sensitive to the degree of molecular polarity (e.g., CO and HCN can typicabe characterized by a similarTrot even though their dipolemoments differ by a factor of nearly 30). The derived rotional temperatures range from∼ 50 to 150 K for the Oortcloud comets in our sample.
We also investigated the effect of varying spin tempeture in our model. R0 and R1 sample different spin spe(A and F, respectively), and the ratio of their intensitiesdependent on both rotational temperature and spin tempture. Figure 4 shows the ratio of the F and A spin statea function ofTspin. The uncertainty inTrot for each comet istypically about 10 K (Table 3). This results in 10 and 20uncertainties in the predicted intensity ratios for R0 andfor temperatures of 150 and 50 K, respectively. Includingstochastic noise and calibration uncertainties (for CSHEonly), our total uncertainty is typically 20–30%. When wanalyze the R0 and R1 lines separately, we find the raof line intensities to be consistent with statistical equilrium to within 1-σ . According to Fig. 4, this correspondsTspin> 40 K. However, a 1-σ uncertainty of 10% in R1/R0is consistent with a spin temperature greater than∼ 30 K,and a 20% uncertainty is consistent with a spin tempera
.
-
Fig. 4. The relative populations of F and A spin states (F/A) are shownfunction ofTspin.
greater than∼ 25 K. More methane lines need to be oserved and rotational temperatures better constrained bthe spin temperature of methane in comets can be establdefinitively.
4. Methane in comets
Our production rates for CH4 are reported in Table 3along with the rotational temperatures used to calcuthem. The 1-σ uncertainties in Q(CH4) Table 3 include stochastic error and uncertainties in rotational temperaturdiscussed above. CSHELL observations include an ational 10% uncertainty in flux calibration. Relative abudances obtained with NIRSPEC are better constrained smethane and water were observed simultaneously, eliming calibration uncertainties. In a few cases, the calibra

398 E.L. Gibb et al. / Icarus 165 (2003) 391–406
Table 3CH4 mixing ratios
Comet Date Line Trota Fluxh Aperture Q(CH4)b Q(H2O)a CO/H2Oc CH4/CO CH4/H2O
(UT) (arcsec) (× 1026) (× 1028) (%) (%)Hyakutake
24.4 March 1996
R0
60(5)
86.1 2–8 38.6(7.1)
25.4(2.5) 17.3(2.0)0.08(0.01)0.04(0.01)
1.52(0.32)(East) (2.3) 20.2(4.4) 0.80(0.19)d
R1 56.2 2–8 32.7(6.2) 1.29(0.28)(East) (3.7) 18.4(3.8) 0.72(0.16)d
10.2 April 1996 P2f 90(10) 8.86 2–8 34.5(6.7) 41.7(4.2) 13.9(2.5) 0.06(0.01)0.83(0.18)(0.81)
12.2 April 1996
R0
100(10)
10.9 2–8 29.2(5.5)
39.9(7.6) 15.7(3.2) 0.05(0.01)
0.73(0.20)(0.56)
R1 10.6 2–8 32.2(6.0) 0.81(0.22)(0.82)
P2f 13.0 2–8 47.9(9.9) 1.20(0.36)(0.84)
Hale–Bopp 24.2 February 1997 R0 90(10) 61.4 2–8 837(153) 889(89) 9.9(1.0) 0.09(0.02) 0.94(0.20)e
(1.3)
30.0 April 1997
R0
90(10)
70.1 2–8 1048(189)
676(33) 14.4(0.8) 0.10(0.01)
1.55(0.29)(0.76)
R1 50.7 2–8 879(186) 1.30(0.28)(4.8)
1.0 May 1997 R0 90(10) 76.7 2–8 1118(202) 743(41) 12.9(0.8) 0.12(0.02)1.50(0.28)(2.9)
Lee 19.6 August 1999 R0+ R1 75(10) 3.02 0.5–3.5 18.4(4.2) 11.6(1.2) 2.0(0.3) 0.8(0.2) 1.59(0.25)(0.94)
21.6 August 1999 R0+ R1 75(10) 2.66 0.5–3.5 16.2(3.2) 12.6(1.0) 1.8(0.2) 0.7(0.1) 1.29(0.27)g
(0.09) 13(1)*
S4 13.6 July 2000 R0+ R1 70 0.50 0.5–3.5 1.0(0.3) 5.53(0.6) 0.45(0.34) 0.5(0.4) 0.18(0.06)(0.09)
McNaught–Hartley 4.7 March 2001 R0 50(10) 1.3 2–5 8.1(3.0) 5.7(2.4) ∼ 17 ∼ 0.08 1.4(0.8)(0.3)
A2 9.5 July 2001 R0+ R1 85(10) 1.97 0.5–3.5 3.23(0.65) 3.11(0.24) 1.04(0.22)(0.15) 3.1(0.4)*
10.5 July 2001 R0+ R1 85(10) 2.99 0.5–3.5 5.15(0.99) 3.46(0.34) ∼ 4 1.49(0.32)(0.24) 3.2(0.4)* ∼ 0.7FUSE
WM1 23.3 November 2001 R0+ R1 50i 0.62 0.5–3.5 0.86(0.17) 2.5(0.3)* 0.34(0.08)(0.03)
Ikeya–Zhang
21.9 March 2002
R0
140(10)
8.7 2–8 36.3(5.8)
66(5) ∼ 4.7 0.12
0.55(0.10)(1.1)
R1 7.4 2–8 35.0(8.5) 0.53(0.13)(0.7)
22.9 March 2002 R1 140(10) 9.5 2–8 43.9(7.5) 95(13) 0.46(0.10)(0.8)
Note: Our production rates are determined from mean emission intensities on either side of the nucleus measured in 1-arcsec intervals over the apertureindicated above. This information can be obtained in tabular form by contacting ELG.
* From OH lines.a References forQ(H2O) andTrot: Hyakutake (Dello Russo et al., 2002); Hale–Bopp (Dello Russo et al., 2000); Lee (Mumma et al., 2001b); S4 (Mumma
et al., 2001a); Ikeya–Zhang (Dello Russo et al., 2003); WM1 water production rates are from the OH* quadruplet; A2 values are from OH* quadruplet and(Dello Russo et al., in preparation); McNaught–Hartley (Mumma et al., 2001c; DiSanti et al., in preparation).
b 15% was added to CSHELL data to compensate for emission outside the 5 column extract.c References for native CO/H2O: Hyakutake (DiSanti et al., 2003); Hale–Bopp (DiSanti et al., 2001); Lee (Mumma et al., 2001b); S4 (Mumma et al.,
2001a); McNaught–Hartley (Mumma et al., 2001c); A2 (Feldman et al., 2002) (FUSE), (DiSanti et al., in preparation); Ikeya–Zhang (DiSanti et al., 2002);WM1 is still under analysis but preliminary reductions indicate that this comet is depleted in CO (DiSanti et al., in preparation).
d Due to apparent short-term asymmetry west of the nucleus during the time of the CH4 observations, the production rate of CH4 may be artificiallyenhanced with respect to water. The lower production rate (in italics) is found by generating aQ curve only on the points east of the nucleus.
e The water production rate on 24.2 February is significantly higher than predicted by the water production evolution curve derived in Dello Russo et al.(2000). If the heliocentric fit value forQH2O is used, thenQCH4/QH2O = 1.23± 0.26%.
f The P2 line has 2 unresolved components. The atmospheric transmittance was found at the Doppler shifted position of each component to be the samewithin 2%. In this case we used an average transmittance and summed theg-factors of the two components to derive a production rate.
g This value is significantly different from the 0.8% previously reported in Mumma et al. (2001b), due primarily to an improved atmospheric model fit forthe methane lines. Also, the assumedg-factor was 13% larger than that determined by our current model.
h Total transmittance corrected line flux (10−18 W m−2) in the aperture indicated and centered on the peak of the CH4 emission.i Assumed.

Methane in Oort cloud comets 399
eingin-sesame
inedand
exngopures-we
s in01).pt
,
a-mitsionatescksldef-
ame-tionree-
ongted2.2
rwise
ar-ns,inout-lloeenro-ed toduseene),llyive-
andthea-
possi-e of
in
ityellout-s. By
-ust
in-ent.indiorchum-
star may not have been centered in the slit or the sewas poor during a stellar observation. Both effects cancrease uncertainties associated with correcting for slit losIn these cases, the calibration from another night on the sobserving run was used.
Whenever possible, water production rates were obtafrom H2O spectral lines measured directly near 5, 2.9,2 µm. These non-resonant fluorescent transitions arecited from the ground vibrational level by optical pumpiand they terminate on states that are only sparsely plated (and hence are only weakly absorbing) in the tertrial atmosphere. Their physics is well understood, androutinely use them to determine water production ratecomets (e.g., Mumma et al., 1996; Dello Russo et al., 20
We also inferred water production rates from promemission in the OH* quadruplet near 3045 cm−1 (these linesfall in the same spectral order as the CH4 R0 and R1 linessee Fig. 1). This OH* quadruplet is a set of highJ (v′ = 1,J ′ = 11.5 and 12.5) lines that result from dissociation of wter by UV photolysis. Once produced, they promptly eat infrared wavelengths. The resulting P-branch emisforms a set of quadruplets in a wide range of rotational stspanning much of the L-band. Their spatial profile trathat of the parent (H2O, see Fig. 5). Hence, they shouprovide a good proxy for the water production rate. Thefective g-factor for this multiplet of OH* was inferred incomet Lee to be 2× 10⁻⁷ molecules s−1 at Rh = 1 AU(Mumma et al., 2001b). We assume this value to be the sin other comets, independent of the H2O rotational temperature. When available, both values for the water producrate are quoted, and they are usually found to be in agment (see Table 3).
C/1996 B2 (Hyakutake)We report detections of CH4 in Hyakutake with CSHELL
on three dates in 1996. On 24.4 March and 12.2 April, stremissions due to both the R0 and R1 lines were detecAdditionally, the P2 line was observed on 10.2 and 1April. The April dates are consistent with 0.8% CH4 (allabundances are given with respect to water unless othenoted).
From Table 3, it might be inferred that Hyakutake vied significantly between the March and April observatiowith the mixing ratio in March nearly twice that foundApril. We note, however, the presence of an asymmetricflow during the earlier observations on 24.4 March (DeRusso et al., 2002; DiSanti et al., 2003). This can be sin the bottom panel of Fig. 5, which shows the spatial pfile of the CH4 R0 line (solid line) compared to that of thdust emission (dashed line). The R0 profile is extendethe west, but it matches the eastern component of theprofile. In contrast, the spatial profile of methane in L(top panel, solid line) matches that of the dust (dashed liwhich is what we typically see in comets. We also typicafind that the CH4 spatial profile matches those of other natspecies such as water and C2H6, both of which are consis
.
-
-
.
t
Fig. 5. Spatial profiles of dust (dashed line) and CH4 (solid line) emissionin comet Lee (combined R0 and R1 lines) on 21.6 August, 1999 (top)Hyakutake (R0 line only) on 24.4 March, 1996 (bottom). Also shown isOH prompt emission (∗) profile in Lee which matches the profiles for ntive gases like CH4. This is typically the case. CH4 in Hyakutake showssubstantial excess in emission west of the nucleus-centered position,bly indicating the presence of a short-term jet phenomenon at the timthe observation (see text).
tent with release solely from the nucleus for all cometsour database (Dello Russo et al., 2002).
We suspect this behavior may be related to the proximof Hyakutake to Earth (0.106 AU) in late March 1996 as was its rapid rotation. At this distance, and assuming anflow velocity of ∼ 800 m s−1, material leaving the nucleucan traverse the length of the slit in less than 25 minutesthe time water was observed (> 75 minutes after the CH4 R1line and> 35 minutes after the CH4 R0 line), the gas emission profile more closely matched that of the dust, with ja minor enhancement to the west. A short-term westwardcrease in activity could explain the apparent enhancemRotation of a jet out of the field of view could also explathe differences in the CH4 profile relative to those observelater in the day (Dello Russo et al., 2002). This behavis not inconsistent with the fast rotation period in Mar(6.23 hours) determined by Schleicher et al. (1998). Assing this rotation period, the comet will have rotated> 72

400 E.L. Gibb et al. / Icarus 165 (2003) 391–406
us ae.g.eenalso
bemix-iblyctiv-canty in4.4rchd bet onele-the
in-
0.0allru-ro-the).atioa-
-pp
andved
Hhan
3).
anyde-
ulyothuitehad
b-
tilesfor-n of
leyiont al.
nthe-
andf
w
ev-nu-01;pre-m-
f aanithin
forEx-
i-rateain
Ta-
Itrredtioless,
ort
-thison).
forn
degrees and> 34 degrees between the CH4 R1 and R0 ex-posures, respectively, and the first water exposure. Thcolumn containing an enhanced number of molecules (a jet) could have rotated out of the slit in the time betwthe methane and water exposures. DiSanti et al. (2003)discuss evidence for variations in CO on this date.
If the production rate for CH4 is determined only fromthe points east of the nucleus, the mixing ratio is found toin agreement with the April dates. Since the enhanceding ratio in March (in the east-west mean) could possbe explained by a jet or a short-term enhancement in aity that is not apparent in the later water exposures, weneither prove nor disprove the existence of heterogeneithe methane mixing ratio in Hyakutake based on the 2March observations. A detailed analysis of the 24.4 Madata set, which is beyond the scope of this paper, woulrequired to answer these questions. This illustrates thamust be cautious when interpreting mixing ratios for mocules that are not observed simultaneously, as is oftencase for CSHELL observations. Water and CH4 are observedsimultaneously with NIRSPEC, alleviating such uncertaties.
C/1995 O1 (Hale–Bopp)CH4 was observed in Hale–Bopp on 24.2 February, 3
April and 1.0 May 1997. The R0 line was observed ondates and the R1 line only on 30.0 April. The 24.2 Febary data result in a lower mixing ratio, but the water pduction rate was significantly higher than predicted byheliocentric fit toQ(H2O) in Dello Russo et al. (2000Magee-Sauer et al. (1999) also noted a lower mixing rfor HCN on this date if the observed production rate for wter was used. If the heliocentric fit value forQH2O is used,thenQCH4/QH2O = 1.23± 0.26%, consistent with that determined from the April and May observation. Hale–Bowas one of the comets most enriched in CH4, in addition tobeing very rich in CO (DiSanti et al., 2001).
C/1999 H1 (Lee)Results for R0 and R1 are reported for two dates (19.6
21.6 August 1999) in comet Lee, the first comet obserwith NIRSPEC. We determine a mixing ratio of∼ 1.45%,which makes Lee, along with Hale–Bopp, the richest C4comets (we note that this value is significantly higher tthat reported in Mumma et al. (2001b), see note to TableLee is also notable for having the highest CH4/CO ratio ob-served to date, more than double that determined forother comet in our data set, due to its combination ofpleted CO and abundant CH4.
C/1999 S4 (LINEAR)S4 was observed with NIRSPEC on one night (13.6 J
2000) prior to its complete disruption later that month. Bthe R0 and R1 lines are clearly visible (Fig. 1), though qweak when compared to the other comets. This cometthe lowest CH4/H2O ratio of any other Oort cloud comet o
,
served to date and was found to be depleted in other volaas well (Mumma et al., 2001a), consistent with a warmermation temperature, perhaps in the Jupiter/Saturn regiothe protoplanetary disk.
C/1999 T1 (McNaught–Hartley)A single line of R0 was detected in McNaught–Hart
using CSHELL on 4.7 March 2001. The water productrate for 13 January 2001 was reported by Mumma e(2001c), along with a CH4 upper limit of 1.6%. Prelimi-nary water production rates for 4/5 March (5.7(2.4)× 1028
molecules s−1, DiSanti et al., in preparation) are consistewith what is derived by assuming an insolation limitedliocentric dependence (∼ 5 × 1028 molecules s−1) based onthe 13 January water production rate. Both the directextrapolated values forQ(H2O) result in a mixing ratio o∼ 1.5(0.8)%. While the signal-to-noise (∼ 6) of the R0 lineis somewhat low, McNaught–Hartley is likely not a lomethane (< 0.5%) comet.
C/2001 A2 (LINEAR)A2, observed on 9.5 and 10.5 July 2001, exhibited s
eral outbursts associated with major disruptions of thecleus prior to our observations (Mattiazzo et al., 20Seargent et al., 2001; Hergenrother et al., 2001). Thissented an opportunity to potentially investigate the coposition of freshly exposed material from the interior ocomet nucleus. The mixing ratios, while suggestive ofincrease between these two dates, are consistent to wthe 1-σ uncertainty. A CO production rate of∼ 1.3 × 1027
molecules s−1 was reported by Feldman et al. (2002)12 July 2001 using the Far Ultraviolet Spectroscopicplorer (FUSE). Their value is consistent with our prelimnary CO production rate, though their water production(2± 1× 1029 s−1) does not agree with the values we obtfrom either the OH* quadruplet (this work) or from H2O hotband emission (Dello Russo et al., in preparation; seeble 3). They determineQ(CO)/Q(H2O) ≈ 0.7% (comparedto the∼ 4% determined from our preliminary analysis).must be pointed out that the FUSE observations occuduring an outburst, and it is possible that the mixing rafor CO changed between the two observations. NonetheCO appears to be somewhat depleted in A2 (< 4%), whileno such depletion in CH4 is observed.
C/2000 WM1 (LINEAR)WM1 was a dynamically new comet for which we rep
CH4 detections on 23.3 November 2001. We assumeTrot =50 K, consistent with preliminary data analysis. WM1 ap-pears to be somewhat depleted in CH4, though not to the extent of comet S4, and preliminary analysis indicates thatcomet is also depleted in CO (DiSanti et al., in preparati
153/P Ikeya–Zhang (C/2002 C1)Comet Ikeya–Zhang was, at its brightest, available
daytime observing with CSHELL. CH4 was measured o

Methane in Oort cloud comets 401
on-2.9a–
the02;hispec8.3ro-
n-le
rly. 6,-ple
fornternsityreeCO,
ra-s
al.,tedu-
He
es in
rage3.for
t alld us-4.4en-
usedncedwer00;
ar-ich”ribu-etsob-as aetsionshissetf in-urunde-ma
two dates in March 2002 during exceptional observing cditions. The R1 line was detected on both 21.9 and 2March. The R0 line was observed on 21 March. IkeyZhang was somewhat depleted, with about 0.5% CH4, or∼ 10% the abundance of CO. Other volatiles were inrange typically found for most comets (DiSanti et al., 20Dello Russo et al., 2002; Magee-Sauer et al., 2002). Tcomet was also observed with the Infrared Camera and Strograph (IRCS) at Subaru by Kawakita et al. (2003) on 2and 29.3 May using similar observing and reduction ptocols. While they did not measure water, their CH4/C2H6ratio is consistent with ours (∼ 0.82).
4.1. Discussion: methane in Oort cloud comets
It is immediately obvious from Table 3 that the abudance of CH4 relative to water varies among our sampof comets, with extreme mixing ratios differing by neaan order of magnitude. This is graphically evident in Figwhich shows the CH4 R1 line and two of the OH* quadruplet lines, corrected for geocentric Doppler shift, in a samof three comets: Lee (21.6 August), WM1 (23.3 Novem-ber), and S4 (13.6 July). Each spectrum was correctedatmospheric transmittance at the Doppler-shifted line-cefrequencies and was scaled to bring the integrated inteover its OH* lines to a common value. Since these thcomets exhibit comparable rotational temperatures (forHCN, H2O, and C2H6), this difference in relative CH4 lineintensities probably represents true variations in mixingtios. The weakest CH4 R1 line is in comet S4, which idepleted in all measured organic species (Mumma et2001a). WM1 and Ikeya–Zhang are also somewhat deplein CH4, though not to the extent of S4. Hale–Bopp, Hyak
-
take, A2, McNaught–Hartley and Lee all seem to have C4abundances in the range∼ 0.8–1.5% relative to water. Thesare consistent with abundances seen in icy grain mantlmassive star forming regions (Boogert et al., 1996).
One noticeable trend can be seen in the CH4/H2O mix-ing ratio among comets. Figure 7 shows a weighted aveof mixing ratios in comets based on the data in TableOn dates with unusual circumstances (24.4 March 1996Hyakutake and 24.2 February 1997 for Hale–Bopp), nodata were averaged. The Hyakutake average is calculateing the April dates and only the eastern emission on 2March since these data exhibit an unusual westwardhancement (discussed above). Only the April data werefor the Hale–Bopp average since the apparently enhawater production rate on 24.2 February resulted in lomixing ratios for many species (Dello Russo et al., 20Magee-Sauer et al., 1999).
It is apparent from Fig. 7 that our data do not show a clecut boundary between “methane-poor” and “methane-rcomets. These results suggest a fairly continuous disttion of mixing ratios for methane among Oort cloud comobserved to date. This differs from most other moleculesserved at infrared wavelengths. Ethane, for example, hmixing ratio of about 0.6–0.7% reported for most comobserved to date, with S4 and A2 being the only exceptso far (Dello Russo et al., 2001, 2002). Native CO in tsame sample of comets is found to be� 5% in some cometand> 10% in others (DiSanti et al., 2001, 2002; Mummaal., 2001a, 2001b, 2001c), with an apparent absence otermediate CO mixing ratios. HCN varies by a factor of foamong the comets observed so far, but is found to be aro0.2% relative to water for the majority of them (MageSauer et al., 2001, 2002 and references therein; Mum
e
Fig. 6. Plot showing the relative intensities of the R1 CH4 line to OH prompt emission (OH* ) in comets Lee (top), WM1 (middle), and S4 (bottom). Thspectra have been shifted to the comet’s rest frequency, corrected for atmospheric transmittance, and scaled to bring the integrated intensity overthe OH* lines(representing water, see text) to a common value. This shows that there are substantial variations in CH4/H2O ratio among our sample of comets.
402 E.L. Gibb et al. / Icarus 165 (2003) 391–406
Fig. 7. The mixing ratio of CH4/H2O in all eight Oort cloud comets. For comets observed multiple times, the values shown are a weighted average of themixing ratios in Table 3. Only the April data were used for Hale–Bopp and the western emission component was omitted in the March dates for Hyakutake,as discussed in Section 4.
Fig. 8. A plot of CH4 vs. CO mixing ratios. The figure shows that the two hypervolatiles do not appear to be correlated. While comets depleted in CH4(< 0.5%) have not been observed to be rich in CO(> 10%), comets with 0.5–1.5% CH4 comprise both the low- and high-CO comets. Of particular interestis comet Lee with nearly the same mixing ratio for both CO and CH4, whereas the CH4/CO ratio is< 0.3 for the remaining comets in our data set. A possibleexception is A2 where FUSE results give 0.7% CO (∼ 5 times lower than our preliminary reductions, hence the arrow on the plot indicating that CO mixingratio is less than∼ 4%). Clearly A2 is not among the CO-rich comets. Uncertainties in the CO mixing ratio for McNaught–Hartley have not been reported.

Methane in Oort cloud comets 403
inrate
belatile.
ex-diauldadiim-ul-es,vi-dif
stiv
olledm-
t00)le 3
H
icecific
ons.fac-tilesust
ofpre-ismsls ofRa-yedndbulad on
n-heatednceto
ost94;AU
ub-vere
eenH
evert of
atOs;ice
is-ous
heas,withis-st et-
y itsom-ons
ledH
yedarypera-s inuchtedns-ntly
t al.linecon-
-heity-icein-w, avemix-uch
et al., 2001b). Our results reveal significant variationsCH4/H2O among Oort cloud comets, and they demonstthat measurements of many more comets are requiredfore general statements concerning trends in parent voabundances among the OC population can be discerned
4.2. Heterogeneity
One unanswered question in cometary science is thetent to which a cometary nucleus is heterogeneous. Ratransport mechanisms within the protoplanetary disk cohave resulted in cometesimals that formed at different rsticking together to form a single comet, giving a body coprised of smaller units of varying composition. We have mtiple observations of many comets taken at different timbut we do not, within the uncertainty, see conclusive edence of heterogeneity in the data presented here. Theferences seen in A2 between 9.5 and 10.5 July are suggeof such heterogeneity (Gibb et al., in preparation).
5. Interstellar and nebular comparisons
It has been suggested that if temperature alone contrthe composition of pre-cometary ices, then the two coparably hypervolatile species CH4 and CO (sublimating a31 and 24 K, respectively; Crovisier and Encrenaz, 20should be correlated. It is immediately apparent from Taband Fig. 8 that the mixing ratios for native CO and CH4 showno apparent correlation. While no comets depleted in C4(< 0.5%) have yet been observed to have high CO(> 10%)mixing ratios, comets with 0.5–1.5% CH4 comprise both thelow and high CO comets. This result is surprising if themantles coating pre-cometary grains accreted at a spetemperature in the protoplanetary disk since both CH4 andCO would be expected to condense under similar conditiThis would argue against temperature as the dominanttor, at least in determining the abundances of hypervolain comets. To explain the observed composition, we mtherefore explore other options.
What does determine the hypervolatile abundancea comet? That may depend on the extent to whichcometary grains retained their icy mantles, on mechanof gas-phase production and destruction, and on detaitrapping or recondensing of gas onto grain surfaces.dial transport mechanisms within the disk may have plaan important role as well. It must also be kept in mithat the chemistry and physics of the protoplanetary newere time dependent. Cometary composition may depen“when” as well as “where” a comet formed.
Desorption may occur initially via shock heating of ifalling interstellar grains upon impact with the gas of tprotoplanetary disk. The degree to which the grain is hedepends on the density of material it is impacting and heon the radial distance from the young Sun. Accordingcurrent models, dust infalling beyond∼ 30 AU may have
-
l
-e
entered the protoplanetary disk gently enough to retain mof the polar ice mantle (Neufeld and Hollenbach, 19Chick and Cassen, 1997) while grains inward of 30would have lost their volatiles.
Once within the protoplanetary disk, grains were sject to viscous heating, which would have been more secloser to the young Sun. For grains within∼ 10 AU, the tem-peratures during the time of comet formation may have btoo warm to condense hypervolatiles such as CO and C4.On the other hand, temperatures beyond 100 AU may nhave exceeded 20 K or so (Boss, 1998), permitting mosthe interstellar volatile ice mantle to be retained.
In the interstellar medium, the C–Hν4 deformation modeof solid CH4 on icy grain mantles has been observed7.67 µm in the envelopes of young stellar objects (YSBoogert et al., 1996). The position and width of thefeature is consistent with the presence of CH4 in a polar(H2O-rich) matrix, but not in the apolar (CO-rich) ice. This consistent with formation of CH4 via hydrogen atom addition to atomic C on the surface of the grain, analogto the formation route for H2O. Further evidence for CH4being formed by H-atom addition in a polar matrix is tfact that CH4 gas in star-forming regions, unlike the CO gis not observed to have a cold component consistentits low (∼ 31 K) sublimation temperature. This is constent with evaporation at the high (� 100 K) temperaturefound in the hot cores of star forming regions (Boogeral., 1998). Thus, CH4 could have survived in grain mantles at much higher temperatures than those implied b31 K evaporation temperature. If the polar mantle was cpletely evaporated in warmer regions, retained in regiwhere the temperature never exceeded∼ 100 K, and par-tially evaporated in intermediate regions, this could haveto distance dependent variability of solid (and gaseous) C4in the young disk.
Transport mechanisms are also thought to have plaa significant role in the chemistry of the protoplanetdisk. Some grains must have been exposed to high temtures, as evidenced by the discovery of crystalline silicatecomets (Campins and Ryan, 1989; Hanner et al., 1997). Sgrains would have lost their original ice mantles and accrenew ones from the gas phase after turbulent mixing traported them to a region where temperatures were sufficielow. The analyses of Wooden et al. (1999), Colangeli e(1999), and Crovisier et al. (2000) suggest that crystalsilicates were a significant (in some cases dominant)tributor to the total silicate inventory of Hale–Bopp. This implies efficient outward turbulent mixing of material from tinner nebula (Bockelée-Morvan, 2002). Likewise, viscosdriven radial migration may have taken material rich infrom the outer disk (beyond 100 AU) and transported itward. If the temperatures of these grains remained losignificant fraction of pristine interstellar material may habeen retained. Hence, there may have been substantialing of methane-rich and methane-poor grains through mof the giant-planet region.

404 E.L. Gibb et al. / Icarus 165 (2003) 391–406
ereof
iblesch01)
AU-
pp
etary
een03)hervedbil-
t al.,un-n in
areoseCHr byinets,odin
g ofob-ave-pro-
ssed
listtionstaryse oture
sodeeor-hesate aud
ed
itiespinoint.ofture
tile
aysee
nsun-culelonede-areun-
ved,ade
tand-bula.
a-sso-ne-a.
At-285.myee-ationgrantfor-
idedhe
ner-ni-acethe
ion.n-wl-
t theousop-
ionow.
In addition to thermal and transport considerations, thare also models for methods of formation or destructionCH4 in the nebula. It has been proposed that a possformation route for methane was through Fischer–Tropcatalysis between 1 and 5 AU (Kress and Tielens, 20or by carbon dust oxidation in the inner disk near 0.5(Gail, 2002). If turbulent mixing was as efficient as implied by interpretations of crystalline silicates in Hale–Bo(Bockelée-Morvan, 2002), then any CH4 that formed in theinner nebula could also have been transported to comformation distances.
As the disk cooled, volatile constituents may have btrapped in the form of clathrate hydrates. Iro et al. (20suggest that all CH4 would be easily trapped throughout tgiant-planet region. This scenario could explain the obsevariability in CO but does not explain the observed variaity in CH4. However, while in the gas phase, CH4 could haveundergone destructive ion-molecule reactions (Aikawa e1999), and these could have significantly altered its abdance as a function of radial distance from the young Suthe re-condensed ice.
It would seem that low-methane (and low-CO) cometsconsistent with formation at warm temperatures (like thexpected near the Jupiter/Saturn region) where a small4(and CO) component may exist in a polar mantle, eitheretention of original interstellar material or by trappingclathrate hydrates. In the case of dynamically new comdepletion of methane may also be due in part to surface mification by cosmic rays during their extensive residencythe Oort cloud (Strazzulla and Baratta, 1992), assumincourse that the processed layer is not lost prior to theservation. Comets that formed in cooler regions may hretained some interstellar CH4 ice and could be further influenced by transport within the disk and any gas phaseduction/destruction routes.
The different physical and chemical processes discuabove could help explain the variations in CH4 seen amongthe comets observed to date. While not a comprehensivethis discussion serves to give a general idea of the condithat may have influenced the volatile content of comeices. Clearly, advances in modeling and a greater databaobservations are needed to fully explain the complex picof comet formation that is emerging.
6. Summary
We report abundances of CH4 in eight Oort cloud cometbased on our high-dispersion infrared spectra and our mfor fluorescent emission in theν3 band near 3.3 µm. Methanmixing ratios vary among these comets, with nearly ander of magnitude separating the most depleted and ricsources observed to date. The results of this study indicfairly continuous distribution of methane among Oort clocomets ranging from∼ 0.15–1.5%. It will be interesting tosee if this trend survives as CH4 abundances are measur
-
,
f
l
t
for more comets. We also find the R0 and R1 line intensto be consistent with statistical equilibrium, although stemperatures of 25–30 K cannot be excluded at this pCH4 clearly does not correlate with CO in our sampleOort cloud comets, which seems to indicate that temperawas not the dominant factor in controlling the hypervolacomposition of comets.
Multiple observations of a comet on different dates mbe used to test for heterogeneity within the nucleus. Weno definitive evidence of heterogeneity in CH4 based on thedata presented in this paper.
Too little is known of the actual physical conditioin protoplanetary disks to accurately predict comet abdances. However, it is clear that temperature, ion-molereactions, radial migration, or grain-surface reactions aare insufficient to explain observations and that moretailed model calculations and observations of disksneeded to understand the complex network of conditionsder which comets formed. With each new comet obsermore interesting and unusual discoveries are being mabout comet taxonomy, and we are adding to our undersing of the processes and conditions in the early solar ne
Acknowledgments
E.L. Gibb gratefully acknowledges support from the Ntional Research Council under her Resident Research Aciateship. This work was also supported by NASA Platary Astronomy RTOP 693-344-32-30-07 to M.J. MummN. Dello Russo was supported by NASA Planetarymospheres program grants NAG5-10795 and NAG5-12M.A. DiSanti was supported by NASA Planetary Astronoprogram grants NAG5-7905 and NAG5-12208. K. MagSauer was supported by the National Science FoundResearch at Undergraduates Institution program underAST-009841. We give a special thank you to H. Weavercollaborating on WM1 observations at the W.M. Keck Observatory. We also acknowledge vital assistance provby staffs of the IRTF and Keck in acquiring the data. TW.M. Keck Observatory is operated as a scientific partship among the California Institute of Technology, the Uversity of California and the National Aeronautics and SpAdministration. The Observatory was made possible bygenerous financial support of the W.M. Keck FoundatThe NASA IRTF is operated by the University of Hawaii uder contract to NASA. The authors recognize and acknoedge the very significant cultural role and reverence thasummit of Mauna Kea has always had within the indigenHawaiian community. We are most fortunate to have theportunity to conduct observations from this mountain.
References
Aikawa, Y., Umebayashi, T., Nakano, T., Miyama, S.M., 1999. Evolutof molecular abundances in proto-planetary disks with accretion flAstrophys. J. 519, 705–725.

Methane in Oort cloud comets 405
el-, D.,n-
r, H.,rom
002.lline
.,rusti,tron.
ns,nce352–
arth
91.evy
in
dust09.E.,ults243–
metsob-al. In:
ress,
tig,andale–
ak,995
ak,ale–
02.Geo-
a,hangand
ak,sions vs.
.C.,
teors574.iep,xides.omet
tro-
les.
ar-tron.
a-rd,opp
247–
met
991.-µm
plan-ients
03.11–
R.,hane,8.ec-tro-
aly-
del.
rnewith
tig,e
In-.
a,
ids,SP,
.,R).
.F.,En-
ee-antomet72,
ak,.,
R):
N.,.R.,.E.,of
Biver, N., Bockelée-Morvan, D., Colom, P., Crovisier, J., Germain, B., Llouch, E., Davies, J.K., Moreno, R., Paubert, G., Wink, J., DespoisLis, D.C., Mehringer, D., Benford, D., Gardner, M., Phillips, T.G., Gunarsson, M., Winnberg, A., Bergman, P., Johansson, L.E.B., Raue1999. Long-term evolution of the outgassing of Comet Hale–Bopp fradio observations. Earth Moon Planets 78, 5–11.
Bockelée-Morvan, D., Gautier, D., Hersant, F., Hur, J.-M., Robert, F., 2Turbulent radial mixing in the solar nebula as the source of crystasilicates in comets. Astron. Astrophys. 384, 1107–1118.
Boogert, A.C.A., Schutte, W.A., Tielens, A.G.G.M., Whittet, D.C.BHelmich, F.P., Ehrenfreund, P., Wesselius, P.R., de Graauw, Th., PT., 1996. Solid methane toward deeply embedded protostars. AsAstrophys. 315, L377–L380.
Boogert, A.C.A., Helmich, F.P., van Dishoeck, E.F., Schutte, W.A., TieleA.G.G.M., Whittet, D.C.B., 1998. The gas/solid methane abundaratio toward deeply embedded protostars. Astron. Astrophys. 336,358.
Boss, A.P., 1998. Temperatures in protoplanetary disks. Annu. Rev. EPlanet. Sci. 26, 53–80.
Brooke, T.Y., Tokunaga, A.T., Weaver, H.A., Chin, G., Geballe, T.R., 19A sensitive upper limit on the methane abundance in Comet L(1990c). Astrophys. J. 372, L113–L116.
Campins, H., Ryan, E.V., 1989. The identification of crystalline olivinecometary silicates. Astrophys. J. 341, 1059–1066.
Chick, K.M., Cassen, P., 1997. Thermal processing of interstellargrains in the primitive solar environment. Astrophys. J. 477, 398–4
Colangeli, L., Brucato, J.R., Ferrini, L., Mennella, V., Bussoletti,Palumbo, P., Rotundi, A., 1999. Analysis of cosmic materials: reson carbon and silicate laboratory analogues. Adv. Space Res. 23, 11252.
Crovisier, J., 11 colleagues, 2000. The thermal infrared spectra of CoHale–Bopp and 103P/Hartley 2 observed with the infrared spaceservatory. In: Sitko, M.L., Sprague, A.L., Lynch, D.K. (Eds.), ThermEmission Spectroscopy and Analysis of Dust Disks, and RegolithsAstron. Soc. Pac. Conf. Ser., Vol. 196, p. 109.
Crovisier, J., Encrenaz, T., 2000. Comet Science. Cambridge Univ. PCambridge, UK.
Dello Russo, N., DiSanti, M.A., Mumma, M.J., Magee-Sauer, K., RetT.W., 1998. Carbonyl sulfide in Comets C/1996 B2 (Hyakutake)C/1995 O1 (Hale–Bopp): evidence for an extended source in HBopp. Icarus 135, 377–388.
Dello Russo, N., Mumma, M.J., DiSanti, M.A., Magee-Sauer, K., NovR., Rettig, T.W., 2000. Water production and release in Comet C/1O1 Hale–Bopp. Icarus 143, 324–337.
Dello Russo, N., Mumma, M.J., DiSanti, M.A., Magee-Sauer, K., NovB., 2001. Ethane production and release in Comet C/1995 O1 HBopp. Icarus 153, 162–179.
Dello Russo, N., Mumma, M.J., DiSanti, M.A., Magee-Sauer, K., 20Production of ethane and water in Comet C/1996 B2 Hyakutake. J.phys. Res.-Planet. 107 (E11), 5095. 10.1029/2001JE001838.
Dello Russo, N., DiSanti, M.A., Magee-Sauer, K., Gibb, E.L., MummM.J., 2003. Water production and release in Comet 153P/Ikeya–Z(C/2002 C1): accurate rotational temperature retrievals from hot-blines near 2.9 µm. Icarus. Submitted.
DiSanti, M.A., Mumma, M.J., Dello Russo, N., Magee-Sauer, K., NovR., Rettig, T.W., 2001. Spatially resolved carbon monoxide emisin comet Hale–Bopp: production rates and rotational temperatureheliocentric distance. Icarus 153, 361–390.
DiSanti, M.A., Dello Russo, N., Magee-Sauer, K., Gibb, E.L., Reuter, DMumma, M.J., 2002. CO, H2CO, and CH3OH in Comet 2002 C1Ikeya–Zhang. In: The Proceedings for the Asteroids, Comets, MeConference, Berlin, Germany, 2002. In: ESA SP, Vol. 500, pp. 571–
DiSanti, M.A., Mumma, M.J., Dello Russo, N., Magee-Sauer, K., GrD.M., 2003. Evidence for a dominant native source of carbon monoin Comet C/1996 B2 (Hyakutake). J. Geophys. Res.-Planet. In pres
Drapatz, S., Larson, H.P., Davis, D.S., 1987. Search for methane in CP/Halley. Astron. Astrophys. 187, 497–501.
Feldman, P.D., Weaver, H.A., Burgh, E.B., 2002. Far ultraviolet specscopic explorer observations of CO and H2 emission in Comet C/2001A2 (LINEAR). Astrophys. J. 576, L91–L94.
Fox, K., 1970. On the rotational partition function for tetrahedral molecuJ. Quant. Spectrosc. Radiat. Transfer 10, 1335–1342.
Gail, H.-P., 2002. Radial mixing in protoplanetary accretion disks III. Cbon dust oxidation and abundance of hydrocarbons in comets. AsAstrophys. 390, 253–265.
Hanner, M.S., Gehrz, R.D., Harker, D.E., Hayward, T.L., Lynch, D.K., Mson, C.C., Russel, R.W., Williams, D.M., Wooden, D.H., WoodwaC.E., 1997. Thermal emission from the dust coma of Comet Hale–Band the composition of the silicate grains. Earth Moon Planets 79,264.
Hergenrother, C.W., Chamberlain, M., Chamberlain, Y., 2001. CoC/2001 A2 (LINEAR). IAU Circ. 7616.
Hoban, S., Mumma, M.J., Reuter, D.C., DiSanti, M., Joyce, R.R., 1A tentative identification of methanol as the progenitor of the 3.52emission feature in several comets. Icarus 93, 122–134.
Huebner, W.F., Keady, J.J., Lyon, S.P., 1992. Solar photo rates foretary atmospheres and atmospheric pollutants—photo rate coefficand excess energies. Astrophys. Space Sci. 195, 7.
Iro, N., Gautier, D., Hersant, F., Bockelee-Morvan, D., Lunine, J.I., 20An interpretation of the nitrogen deficiency in comets. Icarus 161, 5532.
Kawakita, H., Watanabe, J., Kinoshita, D., Ishiguro, M., Nakamura,2003. Saturated hydrocarbons in Comet 153P/Ikeya–Zhang: etmethane, and monodeuterio–methane. Astrophys. J. 590, 573–57
Kawara, K., Gregory, B., Yamamoto, T., Shibai, H., 1988. Infrared sptroscopic observation of methane in Comet P/Halley. Astron. Asphys. 207, 174–181.
Kress, M.E., Tielens, A.G.G.M., 2001. The role of Fischer–Tropsch catsis in solar nebula chemistry. Meteorit. Planet. Sci. 36, 75–91.
Kunde, V.G., Maguire, J.C., 1974. Direct integration transmittance moJ. Quant. Spectrosc. Radiat. Transfer 14, 803–817.
Larson, H.P., Weaver, H.A., Mumma, M.J., Drapatz, S., 1989. Airboinfrared spectroscopy of Comet Wilson (1986I) and comparisonsComet Halley. Astrophys. J. 338, 1106–1114.
Magee-Sauer, K., Mumma, M.J., DiSanti, M.A., Dello Russo, N., RetT.W., 1999. Infrared spectroscopy of theν3 band of hydrogen cyanidin C/1995 O1 Hale–Bopp. Icarus 142, 498–508.
Magee-Sauer, K., Mumma, M.J., DiSanti, M.A., Dello Russo, N., 2001.frared observations of HCN and C2H2 in five Oort-cloud comets. BullAm. Astron. Soc. 33, 2009.
Magee-Sauer, K., Dello Russo, N., DiSanti, M.A., Gibb, E.L., MummM.J., 2002. Production of HCN and C2H2 in Comet C/2002 C1 Ikeya–Zhang on UT April 13.8 2002. In: The Proceedings for the AsteroComets, Meteors Conference, Berlin, Germany, 2002. In: ESAVol. 500, pp. 549–552.
Mattiazzo, M., Bouma, R.J., Raymundo, P.M., Linnolt, M., Amorim, ANagai, Y., Ree, S.T., Cernis, K., 2001. Comet C/2001 A2 (LINEAIAU Circ. 7605.
McClatchey, R.A., Benedict, W.S., Clough, S.A., Burch, D.E., Calfee, RFox, K., Rothman, L.S., Garing, J.S., 1973. AFCRL. TR-73-0096.vironmental Research Papers, No. 434.
Mumma, M.J., DiSanti, M.A., Dello Russo, N., Fomenkova, M., MagSauer, K., Kaminski, C.D., Xie, D.X., 1996. Detection of abundethane and methane, along with carbon monoxide and water, in CC/1996 B2 Hyakutake: evidence for interstellar origin. Science 21310–1314.
Mumma, M.J., Dello Russo, N., DiSanti, M.A., Magee-Sauer, K., NovR.E., Brittain, S., Rettig, T., McLean, I.S., Reuter, D.C., Xu, L.H2001a. The startling organic composition of C/1999 S4 (LINEAa comet formed near Jupiter? Science 292, 1334–1339.
Mumma, M.J., McLean, I.S., DiSanti, M.A., Larkin, J.E., Dello Russo,Magee-Sauer, K., Becklin, E.E., Bida, T., Chaffee, F., Conrad, AFiger, D.F., Gilbert, A.M., Graham, J.R., Levenson, N.A., Novak, RReuter, D.C., Teplitz, H.I., Wilcox, M.K., Xu, L.H., 2001b. A survey

406 E.L. Gibb et al. / Icarus 165 (2003) 391–406
C at
T1
ccre-
W.,by0–
D.P.,-Y.,hino,P.,
KSec-
nd33–
met
adia-
C.,ustperi-
organic volatile species in Comet C/1999 H1 (Lee) using NIRSPEthe Keck Observatory. Astrophys. J. 546, 1183–1193.
Mumma, M.J., Dello Russo, N., DiSanti, M.A., 2001c. Comet C/1999(McNaught–Hartley). IAU Circ. 7578.
Neufeld, D.A., Hollenbach, D.J., 1994. Dense molecular shocks and ation onto protostellar disks. Astrophys. J. 428, 170–185.
Roche, A.E., Wells, W.C., Cosmovici, C.B., Drapatz, S., Michel, K.1975. An upper limit for methane production from Comet Kohoutekhigh resolution tilting-filter photometry at 3.3-micron. Icarus 24, 12127.
Rothman, L.S., Rinsland, C.P., Goldman, A., Massie, S.T., Edwards,Flaud, J.-M., Perrin, A., Camy-Peyret, C., Dana, V., Mandin, J.Schroeder, J., McCann, A., Gamache, R.R., Wattson, R.B., YosK., Chance, K., Jucks, K., Brown, L.R., Nemtchinov, V., Varanasi,
1998. The HITRAN molecular spectroscopic database and HAW(HITRAN Atmospheric Workstation). 1996 edition. J. Quant. Sptrosc. Radiat. Transfer 60, 665–710.
Schleicher, D.G., Millis, R.L., Osip, D.J., Leder, S.M., 1998. Activity athe rotation period of Comet Hyakutake (1996 B2). Icarus 131, 2244.
Seargent, D.A.J., Baransky, A., Hasubick, W., Morris, C.S., 2001. CoC/2001 A2 (LINEAR). IAU Circ. 7611.
Strazzulla, G., Baratta, G.A., 1992. Carbonaceous material by ion irrtion in space. Astron. Astrophys. 266, 434–438.
Wooden, D.H., Harker, D.E., Woodward, C.E., Butner, H.M., Koike,Witteborn, F.C., McMurtry, C.W., 1999. Silicate mineralogy of the din the inner coma of Comet C/1995 01 (Hale–Bopp) pre- and posthelion. Astrophys. J. 517, 1034–1058.