Embed Size (px)
Citation preview

CSIRO ENERGY
Methane Emissions from
CSG Well Completion
Activities Report for the Department of the Environment and Energy
Stuart Day, Paul Marvig, Stephen White, Brendan Halliburton
May 2017

Citation
Day, S., Marvig, P., White, S., Halliburton, B. (2017). Methane emissions from CSG well completion activities. CSIRO, Australia.
Copyright and disclaimer
© 2017 CSIRO To the extent permitted by law, all rights are reserved and no part of this publication covered by copyright may be reproduced or copied in any form or by any means except with the written permission of CSIRO.
Important disclaimer
CSIRO advises that the information contained in this publication comprises general statements based on scientific research. The reader is advised and needs to be aware that such information may be incomplete or unable to be used in any specific situation. No reliance or actions must therefore be made on that information without seeking prior expert professional, scientific and technical advice. To the extent permitted by law, CSIRO (including its employees and consultants) excludes all liability to any person for any consequences, including but not limited to all losses, damages, costs, expenses and any other compensation, arising directly or indirectly from using this publication (in part or in whole) and any information or material contained in it.

Methane Emissions from CSG Well Completion Activities | i
Contents
Executive Summary ...................................................................................................................................... iii
1 Introduction .................................................................................................................................... 1
2 Experimental ................................................................................................................................... 3
2.1 Well Sites............................................................................................................................... 3
2.2 Measurement of Emissions................................................................................................... 7
3 Results ........................................................................................................................................... 14
3.1 Company A .......................................................................................................................... 14
3.2 Company B .......................................................................................................................... 18
4 Discussion ...................................................................................................................................... 25
5 Conclusions ................................................................................................................................... 28
References .................................................................................................................................................. 29

ii | Methane Emissions from CSG Well Completion Activities
Acknowledgements
The authors wish to acknowledge the cooperation of the CSG industry and the two companies that provided access to their well sites during this project. We are also grateful to the many CSG company staff and the rig personnel who assisted us during the field measurements. We also appreciate the opportunity to participate in the Ginninderra controlled methane release experiment organised and conducted by Geoscience Australia.

Methane Emissions from CSG Well Completion Activities | iii
Executive Summary
At present there are no public data on methane emissions from coal seam gas well completions specific to Australian operations. Accordingly, the federal Department of the Environment and Energy provided funding to CSIRO Energy to undertake a study to determine CH4 emissions from actual well completions.
The aim of this study was to measure fugitive methane emissions from well completion and workover activities at both hydraulically fractured and non-fractured wells with the view to assisting the Department of the Environment and Energy in developing Australian-specific emission factors for these operations. Due to time limitations, emission measurements were not made from hydraulic fracturing operations, although two of the selected wells had been hydraulically fractured previously. Measurements were made opportunistically on a small number of wells that were being completed or worked over at the time instrumentation was available in the field. These wells and the completion procedures used during the measurements were typical of others in these production fields.
Between September 2015 and March 2016 during two field campaigns, methane emissions were measured at nine well completions and one well workover at two CSG company gas fields in the Surat Basin in Queensland. Two of the completions were performed on wells that had been hydraulically fractured. All the completions examined involved the installation of the production tubing, water pump and drive rods. The well head and associated valves and flanges needed to connect the well to the gas and water gathering equipment, and water pump drive head were also installed at the end of the completion process. In all cases the wells had been drilled and hydraulically fractured (if applicable) prior to these site visits and consequently, emissions from drilling and fracturing operations were not measured during this study.
During the field measurements all fugitive methane from each completion workover was released through drill rig systems specifically designed to safely handle and vent gas emissions from the well. While wells were filled with liquid, methane emissions were virtually zero; minor levels of methane were detected in a gas/liquid separator that were due to degassing of methane dissolved in drilling fluid circulated through the well during completion operations. Most emissions occurred once the well had been unloaded, especially during the air assisted flow test, which is often used to determine the water pump size necessary for the well. During this process, compressed air is flushed through the well which dewaters the well thus allowing gas to flow from the reservoir.
The maximum methane emission rate during the air assisted flow test was around 14 kg min-1; however, the duration of the test was only about one hour, so the total amount of methane released during the process was relatively small compared to some reported emissions from United States unconventional gas well completions. Once the well was killed (i.e. filled with liquid) emissions reduced to zero. No further emissions were detected on completed wells that had been fitted with the wellhead. For the two completions that did not use an air assisted flow test and remained filled with liquid during the entire completion, methane emissions were essentially zero. The total amount of methane released during the other seven completions where the air assisted test was used ranged from 25 to 373 kg CH4 with an average emission of 196 kg CH4 per completion. The bulk of this methane was released during the air assisted flow test. At all of the completions and the workover examined during this study, all of the gas released was vented since there was no provision to flare or capture the gas.
Emissions from the well workover were much higher than the completions, totalling more than 21 tonnes of methane over the duration of the workover. Most of this gas was released during the clean-out phase of the operation which in this case, involved injecting compressed air into the well during the process. This operation lasted for 24 hours resulting in a substantial release of gas, all of which was vented to the atmosphere. A smaller amount of methane (about 353 kg CH4) was released prior to the clean-out when compressed gas that had been shut in the well was vented. Not all workovers require compressed air for the clean-out; such workovers may have lower emissions than measured in this single example since the

iv | Methane Emissions from CSG Well Completion Activities
well would remain filled with liquid that should minimise gas loss. However, this is yet to be confirmed by field measurements.
While these measurements represent initial data specific to Australian CSG drilling operations, the sample size is very small and hence the results may not be representative of the industry overall. Accordingly, it is important to view the results of this study in this context. Nonetheless, the completion procedures were similar across the fields examined and the results of the measurements consistently showed that emissions from these completions were relatively minor especially when wells remain filled with liquid during the operation. However, we have only measured emissions from the completion itself; other well construction processes including drilling and hydraulic fracturing have not been examined here. Hydraulic fracturing and the subsequent liquid flowback period have been identified as one of the main emission routes from unconventional gas production in the United States. Although this technique is not common in Australian CSG production, it is still important that measurements be made to determine the full extent of methane emissions from well construction activities.

Methane Emissions from CSG Well Completion Activities | 1
1 Introduction
The Department of the Environment and Energy has an interest in developing improved emission estimation methods for the coal seam gas industry using information based on relevant Australian data. In 2013, the Department provided funding to the CSIRO to conduct field measurements of fugitive emissions from equipment leaks and well casings on well pads throughout NSW and Queensland. That project, completed in 2014, demonstrated that for the sample of 43 wells examined, emissions from well casings were insignificant and that equipment leaks, although present at most wells, were relatively minor (Day et al., 2014). The results from that study also confirmed that the current emission factor used in Method 1 of the Determination for estimating leaks (1.2 kg CO2-e t-1) yielded, on average, a reasonable estimate of the emission rates observed from the wells examined. More recently, Day et al. (2016) measured CH4 emissions from a further 24 CSG production and abandoned wells and other gas infrastructure in NSW (amongst other CH4 sources throughout the state). Well pad emissions during this study were also found to be low and consistent with the initial study of Day et al. (2014). However, it is acknowledged that these two studies combined considered only a very small proportion of the total number of Australian wells, so the results may not be representative of the entire industry.
While the results of the initial CSIRO studies provide a local data set to support emission estimation methods for well casing and equipment leaks, this is only one part of potential emissions from gas production wells. Certain processes associated with well completions, in particular, are potentially significant sources of methane from unconventional gas production. For example, O’Sullivan and Paltsev (2012) estimated that up to 50 t CH4 may be emitted from individual well completions on shale gas wells in the United States, even when using flaring or reduced emissions completions. More recent data based on field measurements and industry data, however, indicate that in many cases actual emissions from well completions are lower. Allen et al. (2013) measured emissions from 27 completion operations at between 0.1 and 17 t CH4 per completion. Recent data reported by the unconventional gas industry in the U.S. also shows generally lower emission rates. The USEPA now collects emission data from across the unconventional gas industry under its Greenhouse Gas Reporting Program (GHGRP), which are used for the purposes of compiling the U.S. national greenhouse gas inventory. In the 2014 inventory, an emission factor of 36.82 t CH4 per completion was used for hydraulic fracturing completions and workovers where the gas was vented. For completions and workovers that used flaring or reduced emissions completions, the reported industry data yielded much lower emission factors of between 3.24 and 4.91 t CH4 (https://www3.epa.gov/climatechange/Downloads/ghgemissions/US-GHG-Inventory-2016-Annex-3-Additional-Source-or-Sink-Categories-Part-A.pdf).
The Australian unconventional gas industry is much smaller than in the United States and with a much larger proportion of CSG compared to shale and tight gas. During 2013-2014, for example, over 1600 CSG wells were drilled in Queensland, and a further 877 during 2014-2015 (DNRM, 2016). At present, emissions from Australian CSG well completions are estimated for both the National Greenhouse and Energy Reporting scheme (NGERS) and the Australian National Greenhouse Gas Inventory using an emission factor from the 2009 American Petroleum Institute Compendium of Greenhouse Gas Emission Methodologies for the Oil and Natural Gas Industry (API, 2009). This approach assigns a methane emission factor for all onshore well completions of 25.9 t CH4 per day of each completion regardless of well type or stimulation method. This factor is based on data from onshore shale gas completions in the U.S. during 2000, and predates some of the reduced emissions completion methods now commonly used to reduce emissions.
Although recent studies and industry data reported under the USEPA’s GHGRP seem to point to generally lower emissions from well completions than some widely reported early estimates, there is an important difference between the U.S. and Australian unconventional gas industries; namely almost all unconventional gas production in Australia is coal seam gas whereas in the U.S., CSG represents less than 5 % of U.S. gas production (EIA, 2016). Given that there are substantial differences between CSG and other forms of unconventional gas production, it is reasonable to expect that there would be differences in

2 | Methane Emissions from CSG Well Completion Activities
methane emissions. For example, shale and tight gas almost exclusively require hydraulic fracturing for economic extraction whereas in the Australian CSG industry, at present only a small proportion of wells are hydraulically fractured. One of the potential routes for fugitive emissions from shale and tight gas is during the flowback period immediately following hydraulic fracturing when methane entrained in the fluid may be released to the atmosphere. In CSG wells, on the other hand, water must be removed from the well before significant gas flow commences so it is probable that the gas flow characteristics of CSG completions will be different to those of other unconventional gas types.
To address this lack of knowledge in relation to Australian CSG operations, the Department of the Environment and Energy provided additional funding to CSIRO to conduct further field measurements of fugitive emissions associated with gas well completions. The purpose of these measurements was to assist the Department by providing a scientific basis for reviewing existing emission factors and if appropriate, developing factors more representative of Australian conditions and practices.
The project was commenced in May 2014 and a preliminary review of recent scientific literature concerning research into fugitive emissions from unconventional gas was undertaken prior to the field measurement programme. A report on the literature review was delivered to the Department of the Environment in June 2014 (Day, 2014). While the intention was to begin field measurements soon after, the first set of measurements were not made until October 2015 due to delays in coordinating access to wells. Within the time constraints of the project, a limited number of wells were sampled for detailed emissions measurements. However, hydraulic fracturing operations were not performed at any of these sites during the field measurement campaigns and consequently, emissions from the fracturing operations were not determined.
The results of the field measurements are described in this report.

Methane Emissions from CSG Well Completion Activities | 3
2 Experimental
2.1 Well Sites
Ideally, wells for examination would have been selected on the basis of a randomised selection process with sufficient wells included to provide a representative sample of well completions throughout Australia. This approach would require a commitment from the entire industry to participate in the project at the outset and to provide a complete listing of well completions scheduled for a given period from which a representative number could be chosen. In practice, however, the choice of sample size and the wells themselves also depends on some other, non-statistical considerations, which include the availability of participants, overall budget, availability of resources to conduct the measurements, and the timeframe of the project. It was within these constraints that wells were selected for measurement in this project. Originally, it was proposed to conduct measurements at six well sites; in the end measurements were made at nine completions and one workover.
The initial timeframe of the project was 12 months; however, we were unable to secure participants for the project within this period. Some companies declined to participate, while others required time and information to consider the safety and other operational implications of CSIRO personnel working on rig sites. In addition, personnel changes within some gas companies, planned drilling schedules, and availability of CSIRO staff and equipment affected the overall timing of the project. As a result, the project was extended to allow sufficient time for field measurements to be made at some well sites.
The first offer of site access was received from Company A in June 2015 and a preliminary site visit was made to two completion rigs on 31st July 2015. During this visit, the logistics of setting up equipment, sampling methodology and general safety implications of the measurement campaign were discussed with gas company and rig personnel. It was decided during this visit that the most effective method would be to have the CSIRO team follow one rig for a week then swap to another rig for the following week. The actual field measurements were subsequently conducted over two weeks in September and October 2015.
During October 2015, an offer of well access was received from a second company (Company B) to measure emissions from a series of hydraulic fracturing and well completion operations scheduled for early 2016. However, this project was later cancelled and some of the key the staff involved with the project left the company as a result of the general downturn in the industry. A subsequent offer was received from the same company and measurements were made at well completions conducted during March 2016. However, like Company A’s wells, none of the wells available during March 2016 included hydraulic fracturing operations.
It is clear from the above that selecting wells on the basis of statistically representativeness alone was not practical within the time limitations of this project. Rather, the opportunistic selection of wells provides a preliminary snapshot of emissions from well completions undertaken by two major CSG producers and hence the results of this study must be considered within this context.
Field campaigns were made at two gas fields in the Surat Basin in Queensland during September/October 2015 (Company A) and March 2016 (Company B). The distance between the two gas fields was about 120 km.
At Company A’s sites, emission measurements were made on four well completions (including two wells that had been previously hydraulically fractured) and one workover of an existing production well while at Company B, five well completions were examined (all on non-fractured wells). All of the wells where measurements were made had been drilled and cased between about 1 to 3 months prior to the site visits (see Table 3.1 which lists the ‘spudding’ and completion dates for each well). For the nine completions, there was no surface infrastructure present on the lease, although the area, which was approximately 100
100 m square, had been cleared of vegetation in preparation for the completion operation. The well was

4 | Methane Emissions from CSG Well Completion Activities
located in approximately the centre of the cleared area. Two of the wells on Company A’s sites had been hydraulically fractured prior to the field measurements; the rest were not fractured (Table 3.1).
The workover site was an existing production well pad but with the normal surface infrastructure including the separator, pipework, valves etc. removed from the well head when the workover rig was in place.
Each completion operation lasted from a little over a day to several days and involved drilling through the concrete plug installed after the well was cased then flushing the well and installing the production tubing, water pump and drive rods. The well head and associated valves and flanges needed to connect the well to the gas and water gathering equipment, and water pump drive head were also installed at the end of the completion process.
The completion operations were broadly similar at each site although there were some differences in the specific items of equipment used by different drilling operators. From the standpoint of gas emission routes, however, the systems were very much the same. The general layout of the gas venting system used at the well sites is shown in Figure 2.1.
Figure 2.1. Schematic layout of gas venting systems used at the well completion and workover sites.
At all sites (both completions and the workover), the rig was positioned over the well and the well casing was fitted with a blowout preventer (BOP) as required by state government regulations (e.g. DNRM, 2013). The BOP is an important safety component but also has attachments to allow drilling fluid to be pumped into and out of the well. The drilling fluid, which is principally water, flushes the well and carries out any solid material within the well. There is also provision to inject compressed air into the well, which is required for some procedures. A BOP assembly attachment is shown in Figure 2.2.
In each case, all gas and liquids (and entrained solids) from the drilling operations were captured at the well head and directed through a steel pipe or ‘blooie line’. The blooie line was attached to a gas/liquid/solid handling tank usually located near the edge of the lease. This tank allows liquids and solids in the flow from the blooie line to separate while allowing any entrained gas to vent to atmosphere. The overall drilling operation and equipment is designed so that under normal operating conditions, all of the gas produced from the well during a completion or workover is captured in this system and vented through the tank away from operations on the rig.
At Company A’s sites, the gas/liquid separation was effected in a SCUF tank, a commercially available system designed for drilling rigs (http://www.arcequipment.com.au/product/scuf/). After separating the gas and liquid/solid streams, gas is vented to atmosphere through a circular vent. A photograph of a SCUF tank is shown in Figure 2.3. At Company B’s sites the gas handling system was slightly different in that gas was vented from a stack approximately 5 m above ground level (Figure 2.4). Neither of the systems used flares or other methods to mitigate CH4 emissions from venting.
Well head/BOP
Blooie Line
Excess water removal point
Gas vented to atmosphere
Gas/liquid/solids separator

Methane Emissions from CSG Well Completion Activities | 5
Figure 2.2. Blowout preventer and associated fittings that attach to the well during completion operations. The attachment to the blooie line is shown.
Blooie line attachment to SCUF tank and vent

6 | Methane Emissions from CSG Well Completion Activities
Figure 2.3. Photograph of a SCUF tank used at Company A's sites during the spring 2015 campaign. Gas samples were collected from inside the large blue cylindrical gas vent at the rear of the unit. Acetylene, where used, was
also added at this location.
Figure 2.4. Gas and liquid handling system used at Company B sites during autumn 2016. Gas was vented from the stack at the top of the unit. The acetylene line is visible in this photograph. Gas samples for laboratory analyses
were collected from inside the stack.
Gas pipe from BOP
Gas vent
Gas sample bags collected from SCUF tank

Methane Emissions from CSG Well Completion Activities | 7
2.2 Measurement of Emissions
During both field campaigns, two gas analysers were used to measure atmospheric concentrations of CH4 around the drilling sites. In addition, a gas chromatograph (GC) was used for measuring CH4 concentrations of samples collected from the gas handling systems in gas sampling bags. The GC was used exclusively in a laboratory environment whereas the two gas analysers were operated on the well sites. Details of these instruments are provided below.
Ambient CH4 concentration was measured using a Picarro Model 2301 CH4, CO2, H2O cavity ring-down spectrometer, which was fitted into a four-wheel-drive vehicle. A GPS receiver coupled with the analyser allowed concentration data to be displayed spatially in GIS software. The nominal operating range of the analyser is 0-20 ppm CH4 with a resolution of about 1 ppb although we have previously found that the actual operating range is much higher. The data acquisition rate of the Picarro instrument is typically 0.3 Hz when used to measure CH4, CO2 and H2O concentrations simultaneously.
The calibration of the analyser was regularly checked against several standard gas mixtures including a high precision reference air sample containing 1.732 ppm CH4 and 383 ppm CO2 prepared by the CSIRO Oceans and Atmosphere GASLAB (Francey et al., 2003). The CH4 concentration indicated by the Picarro instrument was always within about 0.2 % of the nominal concentration of the reference air standard. Other less precise standard gas mixtures were also used for higher concentrations. These mixtures were commercially purchased calibration standards containing 10.8 ppm CH4 and 103 ppm CH4 (BOC Australia).
During mobile surveys, the spectrometer was operated continuously while the vehicle was travelling but also for extended periods when stationary. Air was sampled via a ¼” nylon tube attached to the front of the vehicle about 1 m above ground level. In some cases where vehicle access was available, surveys were made using the Picarro instrument around the well pads but usually the amount of equipment on the pad and drilling operations made this impractical during the completion operation. Vehicle surveys were, however, made on some pads after the drilling rig had been removed and the well head installed, and also along tracks and roads within the gas fields.
In addition to the Picarro analyser, a Los Gatos Research (LGR) Ultra-Portable Methane/Acetylene Analyser was used for measuring ambient CH4 and acetylene (C2H2) on drilling sites. This instrument has an operating range of 0-1000 ppm CH4, 0-1000 ppm C2H2 and 0-7 % H2O. The resolution of the instrument is similar to that of the Picarro at about 1-2 ppb CH4. Acetylene resolution is also about 1 ppb. A GPS receiver could also be connected to the analyser to provide spatial information if required. Calibrations were periodically made using the standard gas mixtures as for the Picarro; two additional standards containing 4.1 and 20.6 ppm C2H2, respectively, were also used. The Los Gatos Research instrument is battery powered and reasonably portable so could be mounted on a wheeled trolley which allowed surveys to be made in areas around well pads not accessible to the vehicle. During each well completion or workover, ground level traverses were made around the well site to measure CH4 concentrations near the rig with either the Picarro (where possible) or LGR systems.
Methane emission rates were determined using two methods described below.
Method A
During procedures when compressed air was used to flush the well, the CH4 concentration in the outlet gas stream was measured. Using the concentration data and air flow rate (provided by the drill rig operators) the emission rate was calculated according to Equation 2.1:
𝐹𝑚𝑒𝑡ℎ𝑎𝑛𝑒 = 𝐹𝑎𝑖𝑟 (1 − 𝐶𝑚𝑒𝑡ℎ𝑎𝑛𝑒) − 𝐹𝑎𝑖𝑟⁄ (2.1)
where Fmethane is the CH4 flow rate, Fair is the air flow rate from the compressors and Cmethane is the concentration of CH4 in the outlet gas stream.
For this method, air was sampled directly from the SCUF tank or exhaust outlet stack using Flexfoil® (SKC) or Multi-Layer Foil (Restek) gas sampling bags. The bags were either 3 or 5 L in size, with stainless steel or polypropylene fittings. The outlet gas stream was sampled directly from the source using a rubber hand-

8 | Methane Emissions from CSG Well Completion Activities
pump and a length of ¼” Teflon tubing to access the inside of the exhaust systems. During the spring 2015 campaign sampling was at the vent of the SCUF tank whereas in autumn 2016, a line was installed in the stack vent on the gas handling system.
Some bags were used for multiple samples, which required flushing of the bags after analysis. Used bags were firstly emptied of any residual sample then flushed six times with nitrogen before reuse. Slight corrections were made to compensate for residual nitrogen in some samples; however, the nitrogen component was less than 5% of the total sampled volume.
The spring 2015 samples were analysed within 36 hours in a field laboratory set up within the gas field. Analyses was by gas chromatography using an Agilent 490 Micro GC containing a 10 m PoraPLOT column and a 10 m molecular sieve column. Instrument calibrations were conducted daily using a number of commercial standards with CH4 concentrations between 10 ppm and 100 % CH4 (BOC Australia). The standards used for each analysis were selected to be consistent with the concentration of the sample. Carbon dioxide was similarly calibrated and quantified.
During the autumn 2016 campaign, the Micro GC was again set up in a field laboratory, however, the instrument failed early on and hence the samples collected on site were analysed later at the CSIRO North Ryde laboratories using a different Agilent 490 Micro GC. This GC was calibrated daily against 0.5 % and 10 % CH4 standards.
Method B
The bag sampling method was only suitable for estimating CH4 emissions while compressed air was flowing through the well, which provided a carrier gas flow with a known flow rate. For other periods without this carrier flow, an alternative approach was required. During Phase 1 of the project CH4 emission rates were estimated using a method where ground level CH4 concentrations were measured downwind of the well pad then using an inverse method to determine emission flux. However, this method was not suitable during the current project because of limited access at the well sites. Specifically, although each well
completion site was roughly 100 100 m in size, much of the space within the lease was occupied by equipment thus limiting access to some parts of the site. Moreover, there were frequent vehicle movements throughout the completion operation which also limited opportunities to conduct traverses across CH4 plumes.
Instead, we used another atmospheric technique based on releasing a tracer gas at the CH4 source. In this approach, a stable gas that is unrelated to the source, is released at a known rate, FTracer, from the same location as the CH4 source. The tracer gas released into the plume undergoes the same dispersion characteristics as the target gas (i.e. CH4) plume. If the rate of release of the tracer gas is known (Ftracer,), the CH4 emission rate, FCH4, can be calculated from the ratio of the CH4 and tracer gas concentration enhancements (i.e. concentrations above background) according to Equation 2.2:
𝐹𝐶𝐻4 = 𝐹𝑇𝑟𝑎𝑐𝑒𝑟 ×(𝐶𝐶𝐻4 − 𝐵𝐶𝐻4)
(𝐶𝑇𝑟𝑎𝑐𝑒𝑟 − 𝐵𝑇𝑟𝑎𝑐𝑒𝑟)⁄ (2.2)
where CCH4 and CTracer are the measured concentrations of CH4 and the tracer gas in the plume and BCH4 and BTracer are the background concentrations of CH4 and the tracer, respectively.
A significant advantage of this technique over most other atmospheric approaches is that detailed meteorological data are not required to estimate the target gas emission rate. Moreover, it is not necessary to fully transect a plume or estimate the vertical extent of the plume as is common in other plume dispersion methods.
For this work, the tracer gas was C2H2 and concentrations of both CH4 and C2H2 were measured using the LGR portable analyser described above. The analyser was usually placed on a trolley so that it could be moved into the CH4 plume and the inlet was fixed at about 1 m above the ground (Figure 2.5).

Methane Emissions from CSG Well Completion Activities | 9
Figure 2.5. LGR analyser mounted on the trolley setup used for the tracer gas method.
The ability to move the instrument allowed the plume to be tracked during variable wind conditions. However, during conditions with relatively constant wind, it was often possible to leave the instrument downwind of the source without the need to transect plumes as is necessary with the plume traversing method used previously. A GPS receiver was also fitted to the system enabling spatial data on the plume to be collected if required. Figure 2.6 shows an example of a plot of the coincident CH4 and C2H2 concentrations as a function of time during a typical experiment.
Equation 2.2 shows that the background concentrations of both C2H2 and CH4 must be known to accurately determine the CH4 emissions rate. Background concentrations were therefore determined by periodically moving the LGR analyser upwind of the source during each measurement period.
Inlet
LGR Analyser
Battery Pack
GPS

10 | Methane Emissions from CSG Well Completion Activities
Figure 2.6. Methane and acetylene concentration enhancements measured downwind of an emission source as a function of time.
Prior to commencing field measurements on the well completion sites, we conducted a series of experiments near the CSIRO Newcastle laboratories where CH4 was released under controlled conditions to determine the accuracy of the tracer gas method. These experiments were conducted over two days in an open area under light to moderate wind conditions (1-5 m s-1). Both CH4 and C2H2 were released from 6 mm nylon tubing with the outlets about 1 m above ground level; the flow rates of both gases were measured during each experiment using a NIST traceable flow calibrator (Bios DryCal DR2).
Experiments were made with CH4 flow rates of 2.83 g min-1 and 12.6 g min-1 and concentration measurements in the plumes were made at downwind distances of between about 20 and 50 m. Background concentrations were also measured for each experiment upwind of the gas release point. The results of the six experiments are summarised in Figure 2.7 where the estimated CH4 emission rate determined from the tracer method is plotted for each experiment. The round markers in Figure 2.7 represent the actual CH4 flow rate as measured by the flow calibrator.
Time (s)
0 200 400 600 800 1000 1200 1400 1600 1800
CH
4 C
oncentr
ation
(ppm
)
0.0
0.2
0.4
0.6
0.8
1.0
1.2
1.4
1.6
1.8
C2H
2 C
oncentr
ation
(ppm
)
0.00
0.02
0.04
0.06
0.08
CH4
C2H2

Methane Emissions from CSG Well Completion Activities | 11
Figure 2.7. Summary of the CH4 emission rates estimated using the tracer gas method at Newcastle. The round markers indicate the actual CH4 release rate during each experiment.
Overall the tracer method yielded CH4 emission rates that were in very good agreement with the actual release rate. The estimated emission rates were within about 8 % of the actual rate. For comparison, flux estimates determined by a series of ground level traverses made at the same time as the higher release rate experiments yielded an average CH4 emission rate of 13.3 g min-1, which also agrees well with the
actual emission; however the individual estimates varied by about 50 %.
In addition to the in-house validation experiments made at Newcastle, we also participated in a larger scale controlled CH4 release experiment coordinated by Geoscience Australia. This experiment, which was conducted over several months at the Ginninderra field station in Canberra, involved the release of CH4 and other gases at carefully controlled rates using calibrated mass flow controllers.
Measurements using the tracer method were made over two consecutive days at distances up to 200 m from the release point. During the measurement period, the CH4 release rate was periodically varied between about 3 and 20 g min-1. Flux estimates were made over the two days under wind conditions that varied from very light (< 1 m s-1) to moderate (>5 m s-1). The results are summarised in Figure 2.8 which also shows the actual CH4 release rate (round markers).
No 1 No 2 No 3 No 4 No 5 No 6
CH
4 E
mis
sio
n R
ate
(g m
in-1
)
0
2
4
6
8
10
12
14

12 | Methane Emissions from CSG Well Completion Activities
Figure 2.8. Summary of the CH4 emission rates estimated using the tracer gas method at Ginninderra. The round markers indicate the actual CH4 release rate during each experiment.
The tracer gas method gave flux estimates that were within 6 % of the actual gas flows, which is consistent with the level of uncertainty determined in first set of measurements made at Newcastle.
During the field measurements at the well pads, the experimental conditions of C2H2 release rate and downwind distances were chosen to be similar to those used during the controlled release experiments so that the level of uncertainty would be similar. For optimum accuracy, the tracer gas method requires that the tracer emission source is co-located with the target emission source. To ensure that this was the case during the well pad field measurements, C2H2 was injected into the CH4 vent of the rig’s gas outlet (the C2H2 line is visible next to the vent stack shown in Figure 2.4), which allowed the tracer to mix with the CH4 stream before exiting the stack. To further ensure complete mixing of the C2H2 and CH4 plumes, concentration measurements were made between 50 and 200 m downwind of the vent to provide sufficient time for mixing if stratification occurred within the vent.
Acetylene for the well site measurements was released from a cylinder via a regulator and needle valve arrangement to provide a constant flow into the rig’s gas outlet at a rate typically between about 1 and 7 L min-1. The C2H2 flow rate was measured continuously throughout each experiment with a rotameter that had been calibrated against the Bios DryCal DR2 calibrator. The higher C2H2 flows were used when analyses were made at longer downwind distances to ensure that the C2H2 signal on the LGR analyser was sufficiently high. Figure 2.9 shows the gas control system used at the rig sites.
No 1 No 2 No 3 No 4 No 5 No 6 No 7
CH
4 E
mis
sio
n R
ate
(g m
in-1
)
0
2
4
6
8
10
12
14
16
18

Methane Emissions from CSG Well Completion Activities | 13
Figure 2.9. Acetylene flow control system. The laptop computer in the foreground was used to remotely control and monitor the LGR analyser located downwind of the rig.
During each experiment, downwind CH4 and C2H2 concentrations within the plume were measured simultaneously at a rate of 1 Hz using the LGR analyser. The LGR instrument was usually left in a location where the plume passed over; however, the analyser was occasionally moved as necessary due to wind shifts. Upwind measurements were also made periodically to determine the background CH4 and C2H2 concentrations, as noted previously.

14 | Methane Emissions from CSG Well Completion Activities
3 Results
3.1 Company A
The first set of field measurements were made at five well sites over a 10-day period between 28th September and 7th October 2015 at one of Company A’s gas fields, roughly 40 km southwest of Chinchilla.
Two of these wells (wells A1 and A2) were not unloaded during the operation; i.e. they remained filled with fluid for the entire completion process. Since the hydrostatic pressure provided by the drilling fluid is the primary method of controlling the well, no gas was produced during the operations. This was confirmed by numerous traverses around the perimeter of each well lease during various parts of the process; no elevated CH4 concentrations were detected at either site during any of the traverses. Several gas samples were taken from the SCUF tank vent at each well and were later analysed in the field laboratory. As expected, the CH4 concentrations of these samples were relatively low, although substantially above ambient. In the case of Well A1, the concentration in the SCUF tank was about 200 ppm CH4 while at Well A2, SCUF tank CH4 concentrations were less than 10 ppm. The slightly elevated concentrations within the tank were probably due to degassing of the drilling fluid in the tank. Because essentially no gas was produced during these two completions, CH4 emissions were negligible. It is probable that any CH4 released to atmosphere was due to degassing of well fluid as it passed into the SCUF tank.
For the other two Company A completions (A3 and A4), the wells were unloaded, then soon after an air assisted flow test was conducted to assess the water flow rate of the wells for the purpose of determining the size of the downhole pump required for each well. During the air assisted flow test, compressed air was injected into the well to remove fluids and the rate of water production was measured while the air was flowing. These tests lasted for about one hour and since the well was effectively dewatered by this process, it began to produce gas. All of the gas produced during the completions was vented to atmosphere.
During the air assisted flow tests, emissions from wells A3 and A4 were measured using the method of sampling gas from the SCUF tank then analysing in the field laboratory (i.e. Method A). An example of emissions produced during an air assisted flow test are shown in Figure 3.1 where the CH4 emission rate from Well A3 is plotted as a function of time.
Methane Emissions from CSG Well Completion Activities | 15
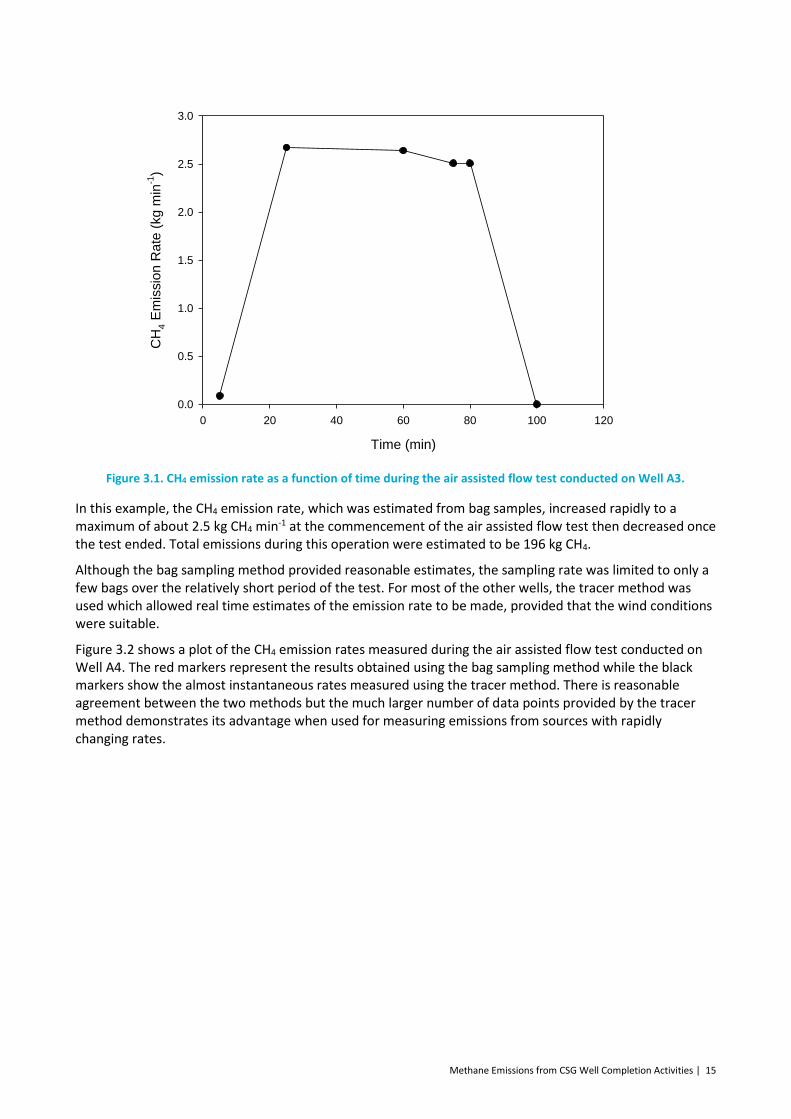
Figure 3.1. CH4 emission rate as a function of time during the air assisted flow test conducted on Well A3.
In this example, the CH4 emission rate, which was estimated from bag samples, increased rapidly to a maximum of about 2.5 kg CH4 min-1 at the commencement of the air assisted flow test then decreased once the test ended. Total emissions during this operation were estimated to be 196 kg CH4.
Although the bag sampling method provided reasonable estimates, the sampling rate was limited to only a few bags over the relatively short period of the test. For most of the other wells, the tracer method was used which allowed real time estimates of the emission rate to be made, provided that the wind conditions were suitable.
Figure 3.2 shows a plot of the CH4 emission rates measured during the air assisted flow test conducted on Well A4. The red markers represent the results obtained using the bag sampling method while the black markers show the almost instantaneous rates measured using the tracer method. There is reasonable agreement between the two methods but the much larger number of data points provided by the tracer method demonstrates its advantage when used for measuring emissions from sources with rapidly changing rates.
Time (min)
0 20 40 60 80 100 120
CH
4 E
mis
sio
n R
ate
(kg m
in-1
)
0.0
0.5
1.0
1.5
2.0
2.5
3.0

16 | Methane Emissions from CSG Well Completion Activities
Figure 3.2. CH4 emission rate as a function of time during the air assisted flow test conducted on Well A4. The black markers represent the rates measured using the tracer method; red markers represent the rates measured using
the bag sampling method.
Like Well A3, CH4 emissions from Well A4 increased sharply immediately after the commencement of the air assisted flow test, reaching a peak emission rate of about 6.5 kg min-1. After about 55 minutes on stream, emissions rapidly dropped to zero soon after the air flow was stopped and the well refilled with liquid. The total CH4 emission from this well during the test (as determined from the tracer method) was about 315 kg of CH4.
Note also that the tracer method confirmed that over a five-hour period, the air assisted flow test was the only period during which CH4 was emitted from the completion operation. Unfortunately during this campaign we did not have sufficient acetylene on hand to monitor the entire completion operation using the tracer method (the second field vehicle used during this campaign was not suited to transporting large quantities of acetylene). However, to assess whether or not CH4 was released when acetylene was not flowing, we conducted ground level traverses around the well site to detect plumes. While these traverses were only periodic and hence it is possible that transient CH4 releases would not have been detected, the generally low levels of CH4 detected around the well site outside the period of the air assisted flow test suggest that emissions outside of this test period are low.
The last well examined at Company A (Well A5) was a workover of an existing production well. The well had been shut in with a well pressure of approximately 3.6 MPa at the commencement of the workover. Although the procedure was different to the completion operations conducted on the other sites, the gas and liquid handling system was the same – the well head was fitted with a BOP and any gas and liquid from the well was passed into the SCUF tank via the blooie line.
Because the well was under pressure at the start of the workover, gas in the well was vented before starting the flushing procedure. This event was monitored using the tracer method – the sampling rate of the bag method was too slow to capture the process, which only lasted a period of minutes. The results are shown in Figure 3.3 where the CH4 emission rate is plotted as a function of time.
Time (min)
0 50 100 150 200 250 300 350
CH
4 E
mis
sio
n R
ate
(kg m
in-1
)
0
2
4
6
8
10

Methane Emissions from CSG Well Completion Activities | 17
Figure 3.3. CH4 emission rate as a function of time during venting of Well A5 prior to the workover.
Most of the gas in the well was released within a few minutes as shown in Figure 3.3, with the CH4 emission rate increasing to just over 40 kg min-1, followed by a rapid decline. Note that the emission rate did not reach zero – there was a small amount of CH4 emitted at between about 1 and 2 kg min-1 for at least two hours after the venting, presumably due to gas flowing from the well as the rods were being removed from the well. The measurements continued for approximately 155 minutes, until the acetylene supply was exhausted. The total amount of CH4 emitted from the well during this period was estimated to be 353 kg.
The main purpose of the particular workover was to flush the well to restore its production rate. However, it is understood that at this site, the well formation would not support the water column; in other words water would tend to flow into the strata. To avoid this and provide adequate cleaning, the cleanout phase involved flushing the well with compressed air at a rate of 1800 scf min-1 (~51 m3 min-1) with about 10 bbl min-1 (~1600 L min-1) of water added to carry out any debris in the well.
During this phase, which lasted for about 24 hours, a large amount of CH4 was vented via the SCUF tank. The emission rate estimated from bag sampling over the course of the cleanout is shown in Figure 3.4.
Time (min)
0 20 40 60 80 100 120 140 160
CH
4 E
mis
sio
n R
ate
(kg m
in-1
)
0
10
20
30
40
50

18 | Methane Emissions from CSG Well Completion Activities
Figure 3.4. CH4 emission rate as a function of time during the cleanout operation conducted on Well A5.
Figure 3.4 shows that the emission rate increased steadily during the cleanout, presumably as a result of the cleaning process. The maximum emission rate just prior to when the compressors were turned off was about 25 kg CH4 min-1. Once the air flow stopped and the well was ‘killed’ (filled with fluid) the gas flow stopped completely.
The total CH4 emission during the workover cleanout was estimated at 21,227 kg. Combined with the initial venting emissions from the well were approximately 21,580 kg. A summary of the CH4 emissions measured for the Company A wells is given in Table 3.1.
As noted previously, the completion rigs were designed so that all gas from the well was directed to the separation tank at the edge of the lease. For safety reasons it is undesirable to have other CH4 sources on the rig. However, to check for other sources, periodic traverses of the operation were made using the portable LGR instrument. In this way it was possible to measure CH4 concentrations downwind of the rig but upwind of the main tank vent so that any smaller sources on the rig could be detected. These traverses confirmed that on these rigs all of the CH4 produced was released from the SCUF tank vent as designed. Other sources of CH4 were not detected on the rigs.
3.2 Company B
During March 2016, a further set of measurements was made at five well completions in Company B’s gas field. This field was located about 130 km northwest of Chinchilla. Like Company A, all the well sites had been drilled and cased previously. The general layout and procedures used during the completions were similar to those used at Company A’s wells; the main difference with regard to gas handling was that the SCUF tank was not used. Rather, a tank and stack system shown in Figure 2.4 was used. The purpose of this system, however, was similar to the SCUF tank and allowed liquid and gas to be separated a safe distance from the main rig operations. Like the SCUF tank used at Company A, all of the gas produced during the completion was released to the atmosphere.
Monitoring of CH4 emissions from the wells at Company B’s sites was mainly by the acetylene tracer method since we were able to arrange for a larger gas supply to be on site during the measurements. The emissions measured for Well B1 are plotted in Figure 3.5.
Time (h)
0 5 10 15 20 25 30
CH
4 E
mis
sio
ns R
ate
(kg m
in-1
)
0
5
10
15
20
25
30
Well Killed
Compressed Air Off

Methane Emissions from CSG Well Completion Activities | 19
Figure 3.5. CH4 emissions rate from Well B1 as a function of time. The gaps in the plots are due to wind shifts when the analyser was not in the plume.
In this case, the rig had been operating for about 12 hours before the measurements were started. During the initial period of monitoring (up to about 2.5 hours in Figure 3.5) very little CH4 was emitted from the well except for a small peak at around 1.3 hours. The reason for the peak is not clear but it coincided with a liquid circulation operation designed to clear drilling mud from the well prior to unloading.
At approximately 2.5 hours the well was unloaded which resulted in a small emission spike with a maximum of about 0.5 kg min-1. Shortly after unloading, the air assisted flow test commenced with a concomitant increase in emission rate. During the flow test the CH4 emission rate was roughly about 2 kg min-1, which is consistent with the rates observed at Company A’s well. However, there was a much larger transient spike with a maximum of about 14 kg CH4 min-1.
At the conclusion of the air assisted flow test, a gas flow rate test was performed. This involved allowing the pressure in the well to build up over a 15-minute period while monitoring the rate of pressure increase. The gas was vented after the test, resulting in the sharp peak in emission rate immediately after the air assisted flow test indicated in Figure 3.5. Further gas emissions were observed at about 5.5 hours, possibly due to circulation of fluids prior to killing the well. Once the well had been killed no further emissions from the well were observed.
Total emissions from Well B1 were 373 kg CH4, of which about 70 % were due to the air assisted flow test.
For Well B2, monitoring was achieved over almost the entire operation except in the initial stages when the gas analyser was off line. The emission rates measured during the completion are plotted in Figure 3.6.
Time (h)
0 1 2 3 4 5 6 7
CH
4 E
mis
sio
n R
ate
(kg m
in-1
)
0
2
4
6
8
10
12
14
16
Well unloaded
Air assisted flow test
Gas flow rate test
Well killed

20 | Methane Emissions from CSG Well Completion Activities
Figure 3.6. CH4 emissions rate from Well B2 as a function of time.
Like the other wells, the bulk of the CH4 emissions occurred during the air assisted flow test, i.e. when compressed air was being injected into the well. The maximum emission rate was about 12 kg CH4 min-1, which is similar the maximum measured during the completion at Well B1. It is estimated that approximately 76 kg CH4 was emitted during the air assisted flow test. Smaller amounts of CH4 were observed during unloading and there was also a gradual increase in CH4 emission immediately following unloading. However, the rate increased sharply once compressed air was injected into the well during the air assisted flow test. Total emissions from this well were about 126 kg CH4, with about 60 % from the air assisted flow test operation.
Wells B3 and B4 also showed similar emission patterns with most CH4 emitted during the air assisted flow tests. However in both of these cases, the total amount of CH4 emitted during the completions was very low compared to other wells where compressed air was used. Total emission from Well B3 was about 43 kg CH4 and for Well B4, only about 25 kg CH4 was emitted over the entire operation.
Measurements at the final well at Company B’s sites, B5, were made under less favourable atmospheric conditions. The winds were very light and in some cases calm, which meant that for much of the operation we were not able to measure the emission rate. Nevertheless a reasonable number of points were collected, especially during the air assisted flow rate which was the main emission event. Total emissions from this well were estimated to be about 308 kg CH4.
A summary of the total emissions from each of the wells examined at both of the company sites is provided in Table 3.1. Note that Well A5 was a workover, not a completion as was the case for all of the others in this sample.
Time (h)
0 5 10 15 20 25
CH
4 E
mis
sio
n R
ate
(kg m
in-1
)
0
2
4
6
8
10
12
14
Well unloaded
Air assisted flow test
Gas flow rate test
Well killed

Methane Emissions from CSG Well Completion Activities | 21
Table 3.1. Summary of the well details and total CH4 emissions during each completion or workover.
Well No Spud Date Completion Date
Depth Fracced? Type of Operation
Air Assisted Test? Total CH4 Emission (kg)
A1 7/7/2015 30/9/2015 901 Yes Completion No Low
A2 11/7/2015 1/10/2015 914 Yes Completion No Low
A3 21/8/2015 2/10/2015 900 No Completion Yes 196
A4 4/9/2015 4/10/2015 871 No Completion Yes 315
A5 3/7/2013 7/10/2015 850 No Workover No but air flowed
during flushing operation
21580
B1 22/8/2009 14/3/2016 700 No Completion Yes 373
B2 21/1/2016 16/3/2016 661 No Completion Yes 126
B3 19/1/2016 18/3/2016 649 No Completion Yes 43.3
B4 18/1/2016 20/3/2016 650 No Completion Yes 25.1
B5 14/2/2016 22/10/2016 530 No Completion Yes 308
Like the Company A rigs, there did not appear to be any other CH4 sources other than the vent on the separation tank.
In addition to measuring emissions from the completion process, surveys of ambient CH4 concentrations were made around a number of recently installed well heads within Company A’s production field, including wells A1 and A2 where emission measurements during the completion operations had been made several days previously. The purpose of these surveys was to determine if any leakage was occurring from the well head or connection to the well casing after it had been installed. Also included in these close surveys were several production wells, a suspended well and one site that had been prepared for drilling (i.e. the site had been cleared of vegetation and levelled) but had yet to be drilled.
In all cases, surveys were made by driving the instrumented field vehicle to within a few metres of the well head (Figure 3.7) while the ambient CH4 concentration was measured with the Picarro CH4 analyser. Complete circuits were driven around each well head or pad, which allowed downwind and upwind (i.e. background) CH4 concentrations to be measured during each traverse.

22 | Methane Emissions from CSG Well Completion Activities
Figure 3.7. A recently completed well showing the well head, valves and water pump drive installed. Ambient CH4 concentration surveys were made on the outside of the temporary fencing.
The results of the surveys made within Company A’s field are tabulated in Table 3.2 where the mean, minimum and maximum CH4 concentrations measured at each well are shown. They are also presented graphically in Figure 3.8 where the route driven by the vehicle is shown; the green trace in the diagram represents the CH4 concentration. The recently completed well sites are marked in yellow text (wells A1, A2, A6, A7, A8 and A11), the production wells in red (wells A12, A13 and A14), the suspended well in green (well A10) and the prepared site in blue (well A9).
It should be noted that although these are concentration measurements only and by themselves do not provide a reliable guide to emission rates, this method of close-in traverses has been shown to be effective at identifying even very small emission sources on well pads (Day et al., 2014). Mobile surveys using similar cavity ringdown instruments mounted in vehicles have also been used for identifying methane sources by various other groups throughout the world (e.g. Phillips et al., 2013; Zazzeri et al., 2015).

Methane Emissions from CSG Well Completion Activities | 23
Table 3.2. Summary of ambient CH4 concentrations made in the vicinity of well pads in Company A's gas field. Wells A1, A2, A6, A7, A8 and A11 were recently completed wells; A9 was a prepared site (no well); A10 was a suspended well; A12, A13 and A14 were production wells.
Well No Spud Date Completion Date
Depth Fracced? Mean CH4 (ppm, dry)
Max CH4 (ppm, dry)
Min CH4 (ppm, dry)
A1 7/7/2015 30/9/2015 901 Yes 1.8120 1.8103 1.8139
A2 11/7/2015 1/10/2015 914 Yes 1.8123 1.8112 1.8137
A6 21/5/2015 Unknown 905 No 1.8115 1.8102 1.8124
A7 18/5/2015 Unknown 894 No 1.8172 1.8152 1.8196
A8 15/5/2015 Unknown 882 No 1.8156 1.8142 1.8170
A9 NA NA NA NA 1.8133 1.8120 1.8145
A10 15/3/2011 18/3/2011 801 No 1.8111 1.8099 1.8144
A11 20/3/2015 Unknown 779 No 1.8105 1.8093 1.8119
A12 21/1/2015 22/1/2015 772 No 1.8229 1.8094 1.9568
A13 18/10/2014 20/10/2014 767 No 1.8305 1.8049 2.1013
A14 15/10/2014 17/10/2014 725 No 1.8073 1.8045 1.8210
At all of the recent completion sites (i.e. Wells A1, A2, A6, A7 and A8) , CH4 concentrations were essentially identical to background levels in the region, which at the time of the surveys averaged about 1.812 ppm dry basis, confirming that the well heads and casings were not leaking after installation. Similarly, ambient CH4 levels near the suspended well site (A10) and the prepared pad (A9) were at background levels. The production wells (A12, A13 and A14), on the other hand, showed somewhat elevated levels of CH4 with maximum concentrations up to about 0.3 ppm above background. These slightly elevated CH4 concentrations near production wells are not unexpected and are probably due to on pad emissions from leakage, operation of gas powered pneumatic devices and exhaust from gas powered engines (Day et al., 2014).

24 | Methane Emissions from CSG Well Completion Activities
Figure 3.8. Ambient CH4 concentration survey made near recently completed wells (marked in yellow) in the Company A field. Also shown are several production wells (red), a suspended well (green) and the site of a
proposed well which had been cleared but not yet drilled (blue). The CH4 peak in the top right section of the figure was most likely due to the adjacent gas processing facility (marked in the blue circle).
A2
A6
A1
A7
A8
A9
A10
A11
A12
A13
A14
Gas processing and water treatment facilities

Methane Emissions from CSG Well Completion Activities | 25
4 Discussion
Total CH4 emissions from well completion operations ranged from virtually zero to a maximum of 373 kg CH4 for the entire operation. Monitoring emissions over each completion showed that, overall very little CH4 was emitted during most of the process. This seems to be due to the fact that for much of the time the well remains filled with liquid. Given that liquid in the well is the primary barrier against gas flow (the BOP provides a secondary barrier) it is unsurprising that gas is largely contained within the well. The two completions at Company A with the lowest emissions were conducted entirely without removing the liquid and hence virtually no CH4 was observed near the rig sites.
However, there are some operations where the well fluid must be removed (unloaded). In particular, the air assisted flow test, which is often performed on new wells to determine the size of the dewatering pump to be installed in the well. During this test, the well is flushed with compressed air for an about an hour which dewaters the well (in a manner analogous to operating the dewatering pump during production). Hence gas is free to flow from the reservoir into the well and consequently, relatively large volumes of CH4 are produced. At the well sites examined during this project, all of the gas produced was vented to the atmosphere.
The maximum rate of CH4 emission during the air assisted flow tests was between about 1 and 14 kg min-1 but since the procedure only lasts for a relatively short period compared to the entire completion operation, the absolute amount of CH4 emitted is relatively small. The results of the emissions measured during each of the completions are summarised in Table 4.1 where the mean, median, minimum and maximum CH4 emissions are shown for each company. Also shown are the combined statistics where the results from both companies have been treated as a single data set.
Table 4.1. Summary of average emissions from the well completions examined at both company locations.
Number of Wells
Mean Emission (kg
CH4)
Median Emission (kg CH4)
Minimum Emission (kg CH4)
Maximum Emission (kg CH4)
Company A 4 128 98 0 315
Company B 5 175 126 25 373
Combined 9 154 126 0 373
On average, there was little difference between the two companies with respect to the total CH4 emissions from completions (128 kg CH4 for Company A and 175 kg CH4 for Company B) although it is difficult to draw definitive conclusions based on the small sample size; there were only four wells for Company A and five for Company B. Taken together, the mean emission from the nine completions examined at both company fields is 154 kg CH4 over the entire completion operation, with a range between 0 and 373 kg CH4. However, the completions conducted at two of the Company A wells were different from the other wells examined in that they were not unloaded and had virtually no CH4 emissions. If the results of these two wells are removed from the data set, the mean emission from each completion was 196 kg CH4, (median 198 kg CH4) ranging from 25 to 373 kg CH4.
Despite the small sample size the results obtained show a consistent pattern of emissions where little or no CH4 is emitted to the atmosphere during the completion operation while the well is filled with fluid. Emissions begin to occur once the well has been unloaded and especially when compressed air is circulated through the well. Given the similarity in the completion processes used at different sites and the behaviour of the wells across two companies in geographically separated fields, and in the absence of other

26 | Methane Emissions from CSG Well Completion Activities
information it seems reasonable that the results obtained in this study could be used for emission factors for estimating emissions from similar operations. For wells with air assisted flow tests, which appears to be a common procedure in the CSG industry, the emission factor would be 196 kg CH4. Based on the two wells that were not unloaded, the emission factor would be virtually zero although with only two such wells in the samples and both within the same company’s gas field, it would be premature to adopt this as a general emission factor. Note also that these emission estimates apply only to the completion process; emissions from other operations of well construction (i.e. drilling and stimulation) have not been considered and as yet we do not have any information on the magnitude of such emissions. It is noteworthy that although the emissions from the CSG well completions examined in this study were lower than those reported by Allen et al. (2013), the bulk of emissions measured by Allen et al. were associated with liquid flowback from hydraulic fracturing.
Two of the completions examined here were on hydraulically fractured wells. Both of these were in Company A’s field but were the two wells that were not unloaded and hence had the lowest emission of the nine wells tested. However, it is probable that the low emissions from these wells were a result of the drilling fluid remaining in place rather than the stimulation procedure that had occurred prior to the completion operation. Consequently, we cannot use the results from these two wells to propose an emission factor specifically for hydraulically fractured wells. In any case the sample size of two hydraulically fractured wells is too small to be able to make a statistically significant comparison.
In contrast to the well completions examined, the single workover included in the sample (Well A5) showed high CH4 emissions, yielding more than 21 t CH4 over a 24-hour period. Some of the gas released from the well was due to venting of compressed gas initially present in the well (as a result of having been shut-in). This accounted for about 350 kg CH4, which is similar to the total amount released on some of the completions. The bulk of the workover-related emissions, however, were again linked to the use of compressed air in the well. In this case it was during the clean-out phase of the workover.
The clean-out phase of workovers may involve flushing the well with water but at this well, it is understood that the well formation would not support the water column (i.e. water would flow into the strata). Hence for this particular workover, the clean-out phase involved flushing the well with compressed air at a rate of 1800 scf min-1 (~51 m3 min-1) with about 10 bbl min-1 (~1600 L min-1) of water added to carry out any debris in the well.
Flushing the well in this manner effectively removed water from the seam in the same way as the air assisted tests used on many completions so gas was produced during the operation. This was confirmed by the high gas flow rates measured during the process that were similar to production rates for operational gas wells. One of the drilling engineers present on site suggested that it would be a simple calculation to estimate emissions for these air-assisted workovers by using the nominal production flow rate over the period that the clean out was performed. The total amount of methane emitted from Well A5 over the 24-hour period of the operation of about 21 t, is consistent with production rates for high producing wells, which supports the engineer’s suggestion. Given the low emissions observed at wells when filled with liquids, it seems probable that workovers without compressed air flushing would produce significantly lower emissions but this is yet to be confirmed by on site measurements.
During this study we only conducted measurements at one workover so it is not yet possible to propose a general emission factor for well workovers.
While all of the rigs visited had systems designed to safely vent methane away from rig operations, none had any provision to flare or otherwise mitigate emissions. For the well completion operations, methane emissions were intermittent which would make operation of a flare difficult and in any case, the amount of methane released to the atmosphere during the process was relatively minor. The workover on the other hand released a substantial amount of gas and for this one example at least, the CH4 flow rate was probably sufficient to sustain a flare for most of the operation. There would no doubt be some redesign of the equipment necessary to fit a flare with associated cost but given the amount of CH4 vented there may be some justification for considering this option for this type of workover.

Methane Emissions from CSG Well Completion Activities | 27
Uncertainty
The controlled release experiments discussed in Section 2 indicate that the measurement uncertainty on
the tracer gas method used for estimating emissions from the well completions is less than 10 %, so we estimate that the emissions estimates for each well are also within 10 % of the true emission. The emission estimate for the well workover was determined using the bag sampling method and while the uncertainty
on the analyses of the samples was low (< 1 %) other factors including the frequency of sampling and variations in the air flow rate through the well contribute to the uncertainty of the estimate. We estimate
that the uncertainty of this estimate is within about 20 %.
However, with regard to deriving emission factors for more general use such as estimating emissions for inventory determinations, the uncertainty is likely to be significantly higher. The range of emission estimates from the nine completions was between 0 and 373 kg CH4 or 25 and 373 kg CH4 if we exclude the two wells that were not unloaded. Thus, the uncertainty on the emission factor of 196 kg CH4 for completions that involved the air assisted flow test is of the order of a factor of two. However, as noted above, this factor is based on only seven completions (excluding Wells A1 and A2) on two company sites in Queensland whereas across the industry as a whole, there are hundreds of well completions performed each year. A fundamental question, therefore is how representative of Australian well completions are the results obtained in this study? This question remains to be answered.
Potential for Further Study
This study examined fugitive emissions from only a handful of CSG well completions and a single well workover. While the results of these measurements provide useful insight into the emission pathways and magnitude of emissions from these processes, it is not yet possible to drawn more general conclusions about emissions from well construction activities over the entire Australian CSG industry. Hence there are a number of areas that warrant further investigation.
Firstly, the number of wells examined was very small compared to the total number of well completions undertaken each year. It is therefore suggested that further measurements be made on a larger and representative samples of well completions. Inclusion of an appropriate number of hydraulically fractured and non-fractured wells would allow specific emission factors to be developed for each well type. Ideally, the wells included in such a programme would be selected according to statistically rigorous sampling methodology. However, it is acknowledged that the practicalities of such a process present significant challenges.
Secondly, the well completions included in this study only considered the fitting of the tubing and water pump into the well; the other main construction activities of drilling the well and stimulation (i.e. hydraulic fracturing) were not included and emissions from these procedures are not included in the emission estimates reported here. To understand the actual level of emissions from well construction, it is important that further measurements be made during all activities associated with well construction. As noted above, selection of the wells for examination should be representative of the industry.
Finally, workovers of production wells is an ongoing procedure over the lifetime of a well. The single workover included in this study yielded a large amount of fugitive CH4. Further work is required to determine whether or not this single result is typical of workovers. Again, sampling is important to ensure that representative emission factors can be developed.

28 | Methane Emissions from CSG Well Completion Activities
5 Conclusions
Fugitive CH4 emissions were measured at nine CSG well completions and one workover of a production well, all within the Surat Basin in Queensland. All of the wells examined had been drilled and in two cases, hydraulically fractured prior to the field measurement campaign and hence emissions from these operations were not measured during this study. Apart from the single workover, all of the well site measurements were made during the completion operation i.e. the installation of the production tubing, water pump and drive rods.
Total CH4 emissions from the completion operations were relatively low, ranging from virtually zero to a maximum of 373 kg CH4 for the entire completion. While the well was filled with fluid, emissions were negligible – the two wells with lowest emissions were filled during the entire completion process. Most emissions occurred once the well had been unloaded, which allows gas to flow into the well, and particularly during the air assisted flow test that is often used to determine the water pump size necessary for the well. During this procedure, compressed air is injected into the well causing significant production of gas that is vented to the atmosphere. However, since the duration of the test is typically about one hour the total amount of CH4 released from the wells examined in the study was less than a few hundred kilograms. At the conclusion of each air assisted flow test the well was killed by filling with fluid, which effectively reduced emissions to zero. No further emissions were detected on completed wells after they had been fitted with the wellhead.
The average emission from the seven well completions that were subjected to an air assisted flow test was 196 kg CH4, (median 198 kg CH4) ranging from 25 to 373 kg CH4. For the other two wells that did not involve the air assisted flow test and were not unloaded during the completion, there were essentially no CH4 emissions.
Only one workover was examined during this study. Emissions from this workover were much higher than the completions with more than 21 t CH4 emitted during the procedure. A relatively small proportion of this CH4 (about 353 kg CH4) was released to the atmosphere when compressed gas within the well was vented at the beginning of the workover. Most of the CH4 released from the workover was during the flushing operation when compressed air and a small amount of fluid was injected into the well over a 24-hour period to remove debris.
Not all workovers require compressed air for the clean-out so the results from this well are unlikely to be indicative of workover emissions more broadly. During workovers where compressed air flushing is not used and the well is kept filled with liquid, gas would probably be contained by the hydrostatic pressure of the well fluid with correspondingly lower emissions. However, this is yet to be confirmed by field measurements.
While these measurements represent the first data specific to Australian CSG drilling operations, the sample size is very small relative to the total number of completions and workovers performed each year and may not be representative of industry practice as a whole. Hence it is recommended that further measurements be conducted on a larger sample of wells, especially on workovers. In addition, we have only measured emissions on one part of the well construction process; drilling and hydraulic fracturing require investigation to determine the magnitude of emissions from these processes.

Methane Emissions from CSG Well Completion Activities | 29
References
Allen, D.T. Torres, V.M., Thomas, J., Sullivan, D.W., Harrison, M., Hendler, A., Herndon, S.C., Kolb, C.E., Fraser, M.P., A. Daniel Hill, A.D., Lamb, B.K., Miskimins, J., Sawyer, R.F., Seinfeld, J.H., 2013. Measurements of methane emissions at natural gas production sites in the United States. Proceedings of the National Academy of Science 110, 17768-17773.
API, 2009. Compendium of greenhouse gas emissions methodologies for the oil and natural gas industry. American Petroleum Institute, Washington DC.
Day, S., Dell’Amico, Fry, R., Javanmard Tousi, H., 2014. Field measurements of fugitive emissions from equipment and well casings in Australian coal seam gas production facilities. CSIRO, Australia.
Day, S., 2014. Emission factors for estimating CSG fugitive emissions – review of recent literature: Report to the Department of the Environment. CSIRO Australia.
Day, S., Tibbett, A., Sestak, S., Knight, C., Marvig, P., McGarry, S., Weir, S., White, S., Armand, S., van Holst, J., Fry, R., Dell’Amico, M., Halliburton, B., Azzi, M., 2016. Methane and volatile organic compound emissions in New South Wales. CSIRO, Australia.
DNRM, 2013. Code of practice for constructing and abandoning coal seam gas wells and associated bores in Queensland. Department of Natural Resources and Mines, Queensland Government.
DNRM, 2016. Queensland’s petroleum and coal seam gas 2014-2015. Department of Natural Resources and Mines, Queensland Government.
EIA, 2016. Coalbed methane production. (https://www.eia.gov/dnav/ng/ng_prod_coalbed_s1_a.htm accessed 4 Aug 2016).
Francey, R.J., Steele, L.P., Spencer, D.A., Langenfelds, R.L., Law, R.M., Krummel, P.B., Fraser, P.J., Etheridge, D.M., Derek, N., Coram, S.A., Cooper, L.N., Allison, C.E., Porter, L., Baly, S., 2003.The CSIRO (Australia) measurement of greenhouse gases in the global atmosphere, report of the 11th WMO/IAEA. Meeting of Experts on Carbon Dioxide Concentration and Related Tracer Measurement Techniques, Tokyo, Japan, September 2001, S.Toru and S. Kazuto (editors), World Meteorological Organization Global Atmosphere Watch 97-111.
O’Sullivan, F., Paltsev, S., 2012. Shale gas production: potential versus actual greenhouse gas emissions. Environmental Research Letters 7, 044030.
Phillips, N.G., Ackley, R., Crosson, E.R., Down, A., Hutyra, L., Brondfield, M., Karr, J.D., Zhao, K., Jackson, R.B. (2013). Mapping urban pipeline leaks: methane leaks across Boston. Environmental Pollution 173, 1-4.
Zazzeri, G., Lowry, D., Fisher, R.F., France, J.L., Lanoiselle, M., Nisbet, E.G. (2015). Plume mapping and isotopic characterisation of anthropogenic methane sources. Atmospheric Environment 110, 151-162.

30 | Methane Emissions from CSG Well Completion Activities
CONTACT US
t 1300 363 400 +61 3 9545 2176 e [email protected] w www.csiro.au
YOUR CSIRO
Australia is founding its future on science and innovation. Its national science agency, CSIRO, is a powerhouse of ideas, technologies and skills for building prosperity, growth, health and sustainability. It serves governments, industries, business and communities across the nation.
FOR FURTHER INFORMATION
CSIRO Energy Stuart Day t +61 2 4960 6052 e [email protected] w www.csiro.au


![The combustion mitigation of methane as a non-CO2 ... · significant contributor to anthropogenic methane emissions, . The main at around 30% [7] activities causing methane emissions](https://img.pdfslide.us/doc/110x75/5fb2384183d05b18f61f7684/the-combustion-mitigation-of-methane-as-a-non-co2-significant-contributor-to.jpg)