Embed Size (px)
Citation preview
Methacrylic Functionalized Hybrid CarbonNanomaterial for the Selective Adsorption andDetection of Progesterone in WastewaterXia Cui
Xi'an Jiaotong UniversityHua Shu
Xi'an Jiaotong UniversityLu Wang
Xi'an Jiaotong UniversityGuoning Chen
Xi'an Jiaotong UniversityJili Han
Xi'an Jiaotong UniversityQianqian Hu
Xi'an Jiaotong UniversityKamran Bashir
Xi'an Jiaotong UniversityZhimin Luo
Xi'an Jiaotong UniversityChun Chang
Xi'an Jiaotong UniversityJia Zhang
Shannxi Hangjiang Pharmaceutical Group Co., LtdQiang Fu ( [email protected] )
Xi'an Jiaotong University School of Medicine
Research Article
Keywords: Progesterone, Methacrylic, Hybrid carbon nanomaterial, Solid phase extraction, Endocrine-disrupting chemical, Wastewater
Posted Date: March 25th, 2021
DOI: https://doi.org/10.21203/rs.3.rs-330364/v1

License: This work is licensed under a Creative Commons Attribution 4.0 International License. Read Full License
Version of Record: A version of this preprint was published at Environmental Science and PollutionResearch on June 30th, 2021. See the published version at https://doi.org/10.1007/s11356-021-15056-1.
1
Methacrylic functionalized hybrid carbon nanomaterial for the selective adsorption and 1
detection of progesterone in wastewater 2
Xia Cui a, b, Hua Shu a, b, Lu Wang a, b, Guoning Chen a, b, Jili Han a, b, Qianqian Hu a, b, 3
Kamran Bashir a, b, Zhimin Luo a, b, Chun Chang a, b, Jia Zhang c, Qiang Fu a, b, c *. 4
a Department of Pharmaceutical Analysis, School of Pharmacy, Xi’an Jiaotong University, Xi’an 5
710061, China 6 b Institute of Drug Safety and Monitoring, Academy of Pharmaceutical Science and Technology, Xi’an 7
Jiaotong University, Xi’an 710061, China 8 c Shaanxi Hanjiang Pharmaceutical Group Co., Ltd, Hanzhong 723000, China 9
* Corresponding author at: Department of Pharmaceutical Analysis, School of Pharmacy, Xi’an 10
Jiaotong University, Xi’an 710061, China, and Institute of Drug Safety and Monitoring, Academy of 11
Pharmaceutical Science and Technology, Xi’an Jiaotong University, Xi’an 710061, China 12
E-mail address: [email protected] (Q. Fu) 13
Telephone and fax number: 029-82655382. 14
15
2
Abstract 16
Progesterone, an endocrine-disrupting chemical, has been frequently detected in wastewater for 17
decades, posing a serious threat to ecological and human health. However, it is still a challenge to achieve 18
the effective detection of progesterone in complex matrices water samples. In this study, a novel 19
adsorbent CNT@CS/P(MAA) was prepared by grafting methacrylic polymers on the surface of modified 20
carbon nanomaterials. Compared with other reported materials, the hybrid carbon nanomaterial could 21
selectively identify the progesterone in the complex industrial pharmaceutical wastewater, and its 22
adsorption performance is almost independent of pH and environmental temperature. In addition, this 23
nanomaterial could be reused with a good recovery rate. The prepared nanomaterials were characterized 24
by transmission electron microscopy, Fourier transform infrared spectroscopy, X-ray diffraction, 25
nitrogen adsorption and desorption experiments and thermo gravimetric analysis. The results confirmed 26
that the methacrylic polymers and chitosan layer were successfully grafted on the surface of carbon 27
nanotubes. Adsorption isotherms, adsorption kinetics, and selectivity tests showed that 28
CNT@CS/P(MAA) had a high adsorption capacity (44.45 mg·g-1), a fast adsorption rate and a satisfied 29
selectivity for progesterone. Then, CNT@CS/P(MAA) was used as solid phase extraction sorbent and 30
combined with HPLC to enrich progesterone from the wastewater samples. Under the optimum 31
conditions, a good linearity was obtained with the correlation coefficient was 0.9998, and the limit of 32
detection was 0.003 ng·mL-1. Therefore, this method could be used for the selective and effective 33
detection of progesterone in the industrial wastewater with complex substrates, and provided a new 34
method for the detection of progesterone in other environmental waters. 35
Keywords 36
Progesterone; Methacrylic; Hybrid carbon nanomaterial; Solid phase extraction; Endocrine-disrupting 37
chemical; Wastewater. 38
39
3
Highlights 40
1. A methacrylic functionalized hybrid carbon nanomaterial was synthesized. 41
2. The prepared nanocomposites could selectively recognize and enrich P4 in water. 42
3. The adsorption capacity of this material for P4 is 44.45 mg·g-1. 43
4. The adsorption performance of P4 is hardly affected by pH and adsorption temperature. 44
5. The SPE-HPLC method could be used to detect P4 in real industrial wastewater. 45
46
4
1. Introduction 47
The presence of endocrine-disrupting chemicals (EDCs) in the environment has attracted extensive 48
attention from the public for their ability to impair reproductive and immune functions of aquatic 49
organisms (Du et al. 2018, Zhang et al. 2017). These chemicals include natural and synthetic hormones 50
as well as their metabolites (Hashmi et al. 2020). Previous researches mostly focused on estrogen and 51
androgens(Luque-Cordoba et al. 2020, Tian et al. 2020, Zhang et al. 2020b). However, there is growing 52
awareness that other EDCs in the environment, such as progesterone (P4,), may also affect the health of 53
aquatic organisms and human (Fabbrocini et al. 2019, Hashmi et al. 2018). 54
Progesterone (Fig. 1), a C-21 structural steroid hormone, can help to modulate the menstrual cycle, 55
making the uterus ready for pregnancy, and affect the breast development and lactation (Graham 56
&Clarke 1997). It has been widely applied in breast cancer therapy, endocrine regulation, drug 57
contraception and assisted reproduction (De Lima &Spinelli 2013, Guohua et al. 2017, Kumar et al. 58
2015). However, it has become a main contaminant in the aquatic environment due to the massive 59
discharge of industrial waste and urban sewage (Hashmi et al. 2020). In China, the production and 60
application of P4 is huge, due to the front-end advantage of natural resources of diosgenin plants such 61
as Dioscorea zingiberensis (Guo et al. 2016). At the same time, P4 can be used as a synthetic precursor 62
of other steroid hormones, which also increases the production of P4. Once a large amount of P4 63
remaining in industrial production wastewater is discharged into the environment, it will pose a great 64
threat to animal and human health. (Kumar et al. 2015, Yu et al. 2019). However, it is still a challenge 65
to effectively detect and enrich the residual P4 in the industrial wastewater due to the complex substrate, 66
many interfering coexisting substances and wide range of pH values. Therefore, developing an effective 67
method to monitor P4 in the industrial waste is necessary. Considering the concentration of P4 in the 68
industrial water, such methods not only suit for the complex media, but also require high sensitivity. 69
To date, several analytical methods such as thin layer chromatography (TLC) (Chamas et al. 2017), 70
gas chromatography (GC) (Nezhadali et al. 2016), high performance liquid chromatography (HPLC) 71
(Kollofrath et al. 2020), capillary electrophoresis (Siren &El Fellah 2017), gas chromatography-mass 72
spectrometry (GC/MS) (Siren &El Fellah 2017), liquid chromatography-mass spectrometry (LC-MS) 73
(Zong et al. 2018), electrochemical sensor (Akshaya et al. 2019), and enzyme linked immunosorbent 74
assay (ELISA) tests (Zhang et al. 2020c) have been used to determine the presence of P4 in environmental 75
samples, especially in the wastewater. HPLC is the most frequently used method because of the low cost, 76
high performance, relatively good sensitivity and stability. Roya Mirzajani et al. (Mirzajani et al. 2019a) 77
reported a nanocomposite consisiting of graphene oxide, ZIF-8 metal–organic frameworks and 78
molecularly imprinted polymers, which was used as the sorbent of solid phase microextraction coupled 79
with HPLC to recognize and separate five sterol and steroid hormones in biological samples. This method 80
could detect five sterol and steroid hormones simultaneously and had a low detection limit (3-5 ng·L-1). 81
However, it is limited by the pH of the samples, and had some problems such as low adsorption capacity 82
and potential template leakage. Kasre Razmkhah et al. (Khan et al. 2019) synthesized a magnetic carbon 83
nanotube-based strontium-titanium (Fe/CNT-SrTiO3) adsorbent, which could extract 17β-estradiol, 84
ethinyl estradiol and progesterone from milk coupled with MSPE-HPLC. This method had good stability 85
but poor specificity. In order to improve the specificity of analytical methods, biological molecules such 86
5
as antibodies (Guo et al. 2019), enzymes (Xu et al. 2020) and DNA aptamers (Tao et al. 2020) were used 87
as recognition tools. Khan Muhammad et al.(Khan et al. 2019) devised an ultra-sensitive 88
electrochemical-digital sensor chip for monitoring cortisone in real time with anti-cortisol antibody as 89
recognition elements. Xu Xuan et al. (Xu et al. 2018) fabricated an electrochemical enzymatic 90
nanoreactor by immobilizing CYP3A4 inside polydopamine modified nanoporous graphene foams, 91
which was successfully applied to detect three steroid hormones. Those methods had achieved superior 92
selectivity, but often suffer from unstable, easily deactivated and high price, and cannot be applied to 93
complex industrial wastewater. Thus, it is urgent to develop a novel recognition material for industrial 94
wastewater with simple, stable, excellent adsorption performance and high specificity. 95
Nowadays, carbon nanotubes (CNTs) have received much attention due to their outstanding 96
properties, such as narrow pore distribution, large (100 to ≥ 500 m2·g−1) specific surface area, and 97
excellent thermal and mechanical resistance (Shu et al. 2020, Xu et al. 2017). However, the use of CNTs 98
is limited for their easy agglomeration, hydrophobicity and biological toxicity (Jakubus et al. 2016). 99
Studies have shown that the surface-carrying groups of CNTs can be changed by surface modification to 100
improve their properties (Chen et al. 2018, Liu et al. 2018). In our previous study, we reported a method 101
of modifying carbon nano-material with chitosan. The prepared carbon micrcoil-chitasan composites 102
showed good solubility, dispersibility and pH-controllability (Hua et al. 2018). 103
Herein, we intend to fabricate a selective sorbent by grafting the methacrylic acid polymer onto the 104
surface of carbon nanotubes modified with chitosan. The prepared material was served as the adsorbent 105
of solid phase extraction column and combined with high-performance liquid chromatography (HPLC) 106
for the selective enrichment and determination of P4. The hybrid carbon nanomaterial modified with 107
methacrylic acid polymers (CNT@CS/P(MAA) was analyzed by transmission electron microscopy 108
(TEM), Fourier transform infrared spectroscopy (FT-IR), X-ray diffraction (XRD), nitrogen adsorption 109
and desorption experiments and thermo gravimetric analysis (TGA). The adsorption isotherms and 110
kinetics were studied to elucidate the adsorption mechanism. Moreover, the pH value, temperature and 111
other parameters affecting adsorption efficiency and recovery were also investigated. Finally, the 112
established SPE-HPLC method was applied to detect P4 in the real industrial wastewater samples. 113
2. Experiment 114
2.1. Reagents and chemicals 115
Progesterone, estrone (E) and estradio (E2) were purchased from Wuhan Dong Kangyuan 116
Technology (Hubei, China). Dexamethasone (DXM), bisphenol A (BPA) and diethylstilbestrol (DES) 117
were provided by Hubei Kang Baotai Fine Chemical (Hubei, China). Methacrylic acid (MAA) was 118
provided by Tianjin Chemical Reagent Plant (Tianjin, China) and distilled under vacuum to remove 119
inhibitors before use. Ethylene glycol dimethacrylate (EGDMA) was obtained from Sigma–Aldrich 120
(New Jersey, USA) and refined by distillation. 2,2’-azobisisobutyronitrile (AIBN) was purchased from 121
Shanghai No.4 Reagent Factory (Shanghai, China) and recrystallized from methanol before use. Chitosan 122
(MW = 600000 g·mol-1) with a 90% degree of deacetylation was obtained from Sinopharm Chemical 123
Reagent Co., Ltd (Shanghai, China). Glutaraldehyde (25% aqueous solution) was purchased from Tianjin 124
Fuchen Chemical Reagents Factory (Tianjin, China). HPLC-grade methanol was purchased from Tianjin 125
Kemiou Chemical Reagent Co. (Tianjin, China). Ultrapure water was prepared using a Molement 1805b 126

6
purification system (Shanghai, China). And all other reagents were of analytical grade. Progesterone 127
standard solutions were diluted with 1.0 mg·mL-1 progesterone stock solution and prepared temporarily 128
before use. The real industrial wastewater samples were collected from a local pharmaceutical enterprise 129
in Hanzhong, Shannxi. 130
2.2. HPLC conditions 131
A Shimadzu high performance liquid chromatograph system (LC 2010A HT, Kyoto, Japan) with an 132
ultraviolet detector was employed for the determination of target. The analytical column (4.6×250 mm) 133
was a 5 μm C18 column. The 90% methanol solution was used as the mobile phase with a flow rate of 1 134
mL min-1. The detection wavelength was 254 nm and the column temperature was kept at 30 ℃. 135
2.3. Preparation of CNT@CS/P(MAA) 136
CNT@CS complex was synthesized according to our previous report (Liu et al. 2017) with slight 137
modification, which was described in supplementary material. The fabrication of CNT@CS/P(MAA) 138
was shown below: 500 mg of CNT@CS was mixed with 100 mL of methanol. Subsequently, the MAA, 139
EGDMA, and initiator AIBN were added in sequence. After 5 minutes of ultrasound, the reaction was 140
performed in a shaker at 50 ℃ for 6 hours. The obtained products were rinsed several times with purified 141
water and methanol to remove the unreacted substances and impurities, and dried at 50 ℃ overnight. The 142
resulting compounds were the CNT@CS/P(MAA). 143
2.4. Characterization of CNT@CS /P(MAA) 144
TEM images were recorded on a JEM2100 transmission electron microscopy (TEM, JEOL Co., 145
Japan). FT-IR spectra were performed on a Nicolet iS10 spectrometer (Thermo Fisher Scientific, 146
America) in the range of 400 to 4000 cm−1. The crystalline structures of the obtained materials were 147
characterized by XRD (Shimadzu, Japan). The surface area of the polymers was measured by nitrogen 148
adsorption and desorption experiments using an Autochem 2920 physical chemistry analyzer 149
(Quantachrome, USA). Brunauer–Emmett–Teller (BET) theory and the Barrett–Joyner–Halenda (BJH) 150
theory were used to calculate the specific surface area and the average pore diameter. TGA was operated 151
on an SDT Q600 thermogravimetric analyzer (New Castle, USA) with a ramp of 10 ℃·min-1 from room 152
temperature to 800 ℃. 153
2.5. Adsorption test 154
2.5.1 Optimization of adsorption conditions 155
In order to explore the optimum conditions of adsorption experiments, the water contents, pH and 156
adsorption temperature were investigated. 157
The water contents were optimized by following steps: P4 stock solution (1 mg·mL-1) was prepared 158
with methanol and diluted to 50 μg·mL-1 with various methanol-water solutions. The water content of 159
the working solutions was ranged from 10% to 80% due to the solubility of progesterone. Subsequently, 160
2 mL of P4 working solution was mixed with 5 mg of adsorbent and oscillated 90 minutes at 25 oC. After 161
filtration, the concentration of P4 in the supernatant was detected by HPLC. And the adsorption capacity 162
Q (mg·g-1) was calculated according to the following formula: 163
Q=(𝐶0 − 𝐶f) × 𝑉 ⁄ m (1) 164
7
where Q (mg·g-1) was the adsorption capacity of the sorbent for P4; C0 (mg·mL-1) and Cf (mg·mL-1) were 165
the initial and final concentration of P4 in the working solution, respectively. V (mL) was the volume of 166
the working solution, and m (g) was the weight of the sorbent. 167
The pH and adsorption temperature were optimized by the same method as above, except that the 168
pH value of the aqueous phase (adjusted to 3.0, 5.0, 7.0, 9.0, 11.0 by adding HCl or NaOH) and the 169
adsorption temperature (25 oC, 35 oC, 45 oC) were changed. 170
2.5.2. Adsorption isotherms 171
Under the optimum conditions, isothermal adsorption experiments were investigated to explore the 172
adsorption property and principle of the adsorbent to the analyte. The adsorbent was mixed with various 173
P4 standard solutions of different concentrations (5, 15, 25, 50, 75, 100, 125, 150 and 175 μg·mL-1). 174
After reacting 120 minutes at 25 oC, 35 oC and 45 oC, the supernatants were filtered and determined by 175
HPLC. The adsorption capacity of the sorbent for P4 at different concentrations was calculated by Eq. 176
(2), 177
Q𝑒= (𝐶0 − 𝐶𝑒) × 𝑉 m⁄ (2) 178
where Qe (mg·g-1) was the adsorption capacity of the sorbent for P4 at different concentrations; C0 179
(mg·mL-1) represented the initial concentration of P4 in the working solution; Ce (mg·mL-1) was the final 180
concentration of P4 in different solution; V (mL) was the volume of the working solution, and m (g) was 181
the weight of the sorbent. 182
2.5.3. Adsorption kinetics 183
To study the adsorption process and determine the equilibrium time, an adsorption kinetics 184
experiment was carried out. The specific operation was consistent with the description in the section of 185
2.5.2, except that the adsorption time was changed to 0.17, 1, 5, 10, 30, 60, 120 and 150 minutes. The 186
adsorption capacity of the sorbent for P4 at different time was calculated by Eq. (3), 187
Q𝑡= (𝐶0 − 𝐶𝑡) × 𝑉 m⁄ (3) 188
where Qt (mg·g-1) was the adsorption capacity of the sorbent for P4 at different time, C0 (mg·mL-1) 189
represented the initial concentration of P4 in the solution, Ct (mg·mL-1) was the P4 concentration in the 190
solution at time t, V (mL) was the volume of the working solution, and m (g) was the weight of the 191
sorbent. 192
2.5.4 Adsorption selectivity 193
E, E2, DXM, DES and BPA (Fig. 1) were chosen to investigate the selectivity performance of the 194
CNT@CS/P(MAA). The selectivity of the adsorbent was measured by the selection coefficient SCP4/R, 195
which was calculated by Eq. (4), 196 𝑆𝐶𝑃4/𝑅 = Q𝑃4 Q𝑅⁄ (4) 197
where QP4 (mg·g-1) was the adsorption capacity of the adsorbent for P4, and QR (mg·g-1) was the 198
adsorption capacity for other reference compounds. 199
2.6 SPE procedure 200
A total of 10 mg CNT@CS/P(MAA) was packed in an empty SPE cartridge under room temperature. 201
After being activated and rinsed by 2 mL of methanol and water successively, the sample solutions were 202
slowly loaded onto the SPE column. Subsequently, the SPE column was washed with water to remove 203
8
the water-soluble substances, then the bound targets were eluted with eluting solution. Finally, the eluents 204
were evaporated with a stream of air. The residues were redissolved in methanol and analyzed by HPLC. 205
2.7 Method validation and real samples analysis 206
According to the recommendations of the International Conference on Harmonization Q2(R1), the 207
developed SPE-HPLC system was validated with specificity, linearity, range, limit of detection (LOD), 208
limit of quantification (LOQ), accuracy and precision. 209
In order to investigate the practicability of the method system, a batch of industrial wastewater 210
samples were collected from the wastewater treatment system of a steroid hormone pharmaceutical 211
company in Hanzhong, Shaanxi Province. No. 1 samples were collected in an anaerobic bacteria 212
treatment tank closed to the industrial production, and No. 2 samples were collected at the end of the 213
sewage treatment system, which would be discharged directly into the environment. After centrifuged 5 214
minutes by 4000rpm, those samples were applied to the method system. 215
3. Results and discussion 216
3.1 Preparation of CNT@CS/P(MAA) 217
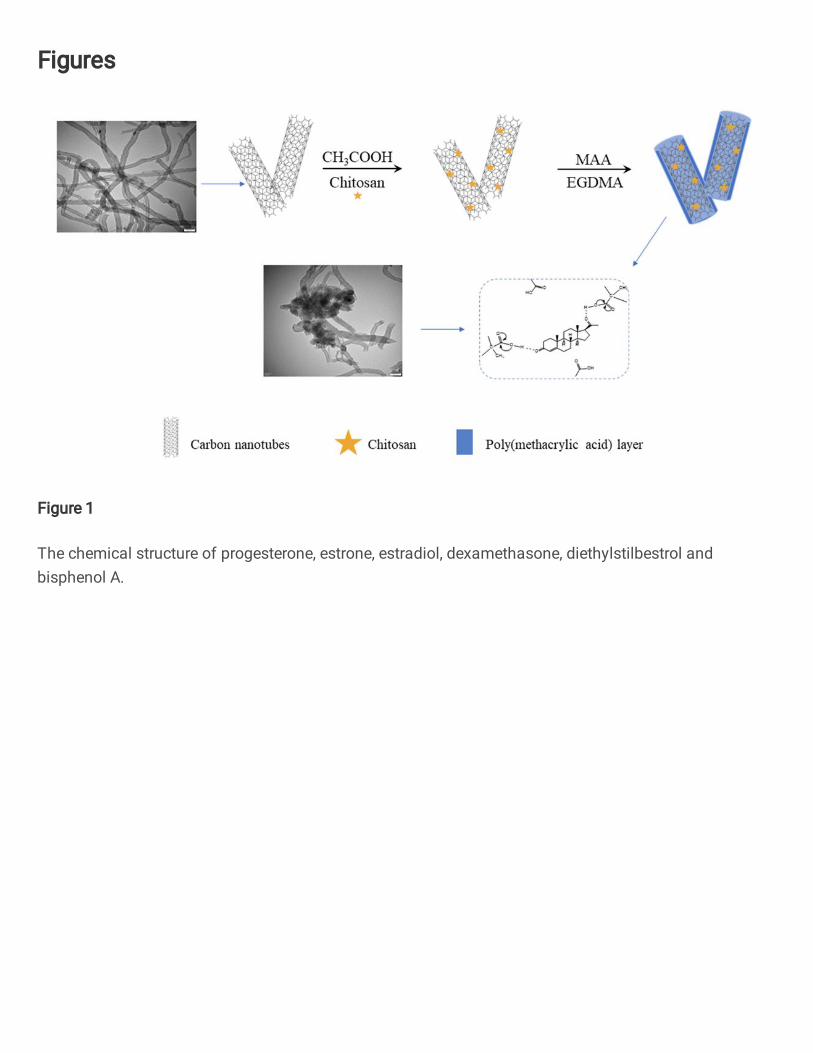
The preparation process of CNT@CS/P(MAA) is shown in Fig. 2. CNT@CS was prepared by 218
coating chitosan on the surface of CNTs through glutaraldehyde cross-linking. This method could 219
effectively improve the water-solubility and dispersity of CNTs by introducing hydroxyl and amino 220
groups on the chitosan layer. During the pre-polymerization process, the carboxyl groups of methacrylic 221
acid were attracted by the amino groups on the surface of CNT@CS, so the methacrylic acid molecules 222
were deposited on the carrier surface. Under the heat initiation, MAA polymers with porous structures 223
were grafted on the surface of CNT@CS through free radical reaction. The CNT@CS/P(MAA) 224
composites could be combined with P4 through electrostatic interaction (such as hydrogen bonds) and 225
spatial interaction force. During the polymerization, the amount of MAA and EGDMA could affect the 226
effective binding sites and the pore size of CNT@CS/P(MAA). Subsequently, the amount of MAA and 227
EGDMA were optimized. 228
3.1.1 The optimization of MAA 229
In order to explore the optimal adsorption performance of CNT@CS/P(MAA), the amount of MAA 230
was studied. As shown in Table S1, the results of CNT@CS/P(MAA) exhibit the highest adsorption 231
capacity, when the mass ratio of carrier/MAA is 4:1. This is because when the amount of MAA is 232
insufficient, sufficient binding sites cannot be provided. On the contrary, when the amount of MAA is 233
too much, the binding sites will form competitive adsorption, which will also reduce the adsorption 234
performance. 235
3.1.2 The optimization of EGDMA 236
The amount of EGDMA was important to control the pore size of the polymers, as well as the 237
performance of the functional composites. Adsorption performance of the polymers with different 238
amount of EGDMA are investigated, as shown in the Table S2. As the increases of the amount of 239
EGDMA, the adsorption capacity of the material decreases gradually, while the selectivity performance 240
shows the opposite phenomenon. When the amount of EGDMA increases, the degree of crosslinking of 241
the polymers increases. As a result, the structure of the polymers becomes more denser and the cavities 242
carried are smaller, which makes it more difficult for the analytes to enter and exit the pores freely. 243
9
Therefore, the adsorption property of the polymers to P4 is reduced. However, the functional groups and 244
three-dimensional structure of P4 analogues are different from P4. When the polymers structure becomes 245
denser, it is more difficult for P4 analogues to pass through the pores and bind to the sites of action. Thus, 246
the selectivity of the polymers increases. As shown in Table S2, when the EGDMA dosage is 50 mg, the 247
value of SCP4/E is maximum. Therefore, 50 mg of EGDMA was selected as the final amount. 248
3.2 Characterization of CNT@CS/P(MAA) 249
3.2.1 TEM analysis 250
As shown in Fig. 3, the morphology of each material is observed by TEM. Multi-walled carbon 251
nanotubes (Fig. 3A) have a smooth surface and good light transmittance. Compared with CNTs, the light 252
transmittance of CNT@CS (Fig. 3B) is decreased and the surface of CNT@CS is slightly rough, 253
demonstrating that the CS layer has been modified on the surface of the carbon nanotubes. As for 254
CNT@CS/P(MAA) (Fig. 3C), the light transmittance is further decreased, and it is observed that obvious 255
coarse-grained polymers are attached to the surface of the carbon nano-materials, suggesting that the 256
MAA polymers have been grafted onto the surface of CNT@CS. 257
3.2.2 FT-IR spectra analysis 258
FT-IR spectra of CNTs, CNT@CS and CNT@CS/P(MAA) are shown in Fig. 4. In Fig. 4A, the 259
characteristic peaks of CNTs appearing at 2115, 2016 and 1980 cm-1 are attributed to the stretching 260
vibration of carbon-carbon single and double bonds. In Fig. 4B, the absorbance peaks at 3340, 1389, 261
1034 and 875 cm–1, correspond to the stretching and bending vibration of N–H, O–H, and C–O–C, 262
respectively, indicating that the CS layer is coated on the surface of the CNTs. In Fig. 4C, the peaks at 263
2980 and 2789 cm-1 (C–H bond stretching vibration), 1465 cm-1 (C-H bond bending vibration), 1106, 264
1080 and 1030 cm–1 (C–C bond stretching vibration), 1630 and 1389 cm–1 (C=O bond stretching 265
vibration) appear, while the peaks at 2115, 2016 and 1980 cm-1 are rapidly decreased, revealing that 266
methacrylate polymers has been wrapped onto the surface of CNTs@CS, which is consistent with the 267
TEM results. 268
3.2.3 XRD analysis 269
The crystal structure of the CNTs, CNT@CS and CNT@CS/P(MAA) were characterized by XRD. 270
As shown in Fig. S1, the CNT@CS and CNT@CS/P(MAA) exhibit the same XRD signals at (002), 271
(100), (101) and (004) as with CNTs. The diffraction peaks at (002) and (004) are the characteristic 272
diffraction peaks of carbon tubes, which matched well with the database of carbon nanotubes in JCPDS 273
(JCPDS card: 02–0456). The diffraction peak at (100) and (101) was the diffraction peak of high-phase 274
graphite. The CNT, CNT@CS and CNTS@CS/P (MAA) all showed consistent X-ray diffraction peaks, 275
indicating that the crystal structure of the carbon nanotube carriers is not affected by the grafted chitosan 276
layer and methacrylic polymer. 277
3.2.4 Nitrogen adsorption-desorption of CNTs and CNT@CS/P(MAA) 278
Nitrogen sorption isotherms (Fig. S2) of CNTs and CNT@CS/P(MAA) samples showed similar II 279
isotherm, implying a fast nitrogen gas uptake at relative pressures<0.10 and multi-molecular layer 280
adsorption of nitrogen. Table 1 shows that the BET surface area of CNT@CS/P(MAA) sample (87.33 281
m2·g−1) is obviously lower than that of CNTs (121.44 m2·g−1) due to the adhesion of methacrylate 282
polymers layer. While the total pore volume and average pore diameter of the CNT@CS/P(MAA) (0.47 283
10
cm3·g-1 and 216.82 Å, respectively) are higher than these of CNTs (0.40 cm3·g-1 and 132.50 Å, 284
respectively), meaning that CNT@CS/P(MAA) has more mesoporous structures than CNTs. Therefore, 285
CNT@CS/P(MAA) could provide more accessible cavities and binding sites for target analytes, making 286
it easier for the targets to enter the identification cavities. 287
3.2.5 Thermogravimetric analysis 288
TGA analysis of the CNTs and CNT@CS/P(MAA) were also performed. As shown in Fig. S3, two 289
main weight losses are observed for the two materials. The first weight loss under 100 ℃ arise from the 290
volatilization of moisture, where the weight loss of the CNT@CS/P(MAA) is the same as the CNTs. The 291
second weight loss of CNT@CS/P(MAA) over 300 ℃ is significantly higher than that of CNTs, 292
especially at 300-500 ℃. Unlike bare CNTs, CNT@CS/P(MAA) is coated with a chitosan layer and a 293
methacrylate polymer layer, indicating that the weight loss at 300-500 ℃ was a result of chitosan and 294
polymers decomposition. At 500-800 ℃, the CNTs and CNT@CS/P(MAA) have the same rate of weight 295
loss due to the decomposition and oxidation of the carbon phase. The results are agreed with the published 296
report (Hua et al. 2018). The CNT@CS/P(MAA) is stable at temperatures up to 300 °C, which indicates 297
its suitability for routine analysis. 298
3.3 Adsorption properties 299
3.3.1. Optimization of adsorption conditions 300
Adsorption experiments were performed in a methanol-water solution with different water contents, 301
pH values and temperature. The results are shown in Fig. S4. The adsorption capacity of 302
CNTs@CS/P(MAA) for P4 was increased with the increase of water content (Fig. S4(A)). When the 303
water content increase, the hydrophobic force increase, which drives the analytes into the pores of the 304
material and interacts with the active sites. However, when the water content is too much (over 80%), 305
the progesterone crystals would precipitate out at the concentration of 50 μg·mL-1. Therefore, methanol: 306
water (2:8, V/V) solution is selected as the adsorption solvent in the subsequent experiments. 307
Moreover, the influence of the pH value and the temperature on adsorption capacity were 308
investigated as shown in Fig. S4(B) and Fig. S4(C). When the pH value changed from 3.0 to 11.0, the 309
adsorption capacity of CNT@CS/P(MAA) for P4 did not change significantly, indicating that the 310
adsorption capacity of the prepared materials for P4 was not affected by the pH value of aqueous phase. 311
At the same time, the adsorption temperatures had little effect on the adsorption property of the prepared 312
materials. The CNT@CS/P(MAA) has a very stable specific adsorption performance for P4 at 313
temperatures below 45 °C and different pH values. Therefore, it could be used for the enrichment of P4 314
in the complex industrial wastewater samples. 315
3.3.2 Adsorption isotherms 316
The adsorption isotherms of CNT@CS/P(MAA) for P4 are shown in Fig. 5. Under different 317
temperatures, the isothermal adsorption curves of CNT@CS/P(MAA) are almost the same. The 318
adsorption capacity of CNT@CS/P(MAA) is significantly increased with increasing initial concentration 319
of P4, and do not reach equilibrium even though the concentration of P4 is saturated at 175 mg·L−1. At 320
the concentration of 175 mg·L−1, the maximum adsorption capacity of CNT@CS/P(MAA) to P4 is 44.45 321
mg·g-1, which is higher than that reported in the literatures (Hao et al. 2015, Li et al. 2020, Zheng et al. 322
2018). To further verify the binding properties of CNT@CS/P(MAA), the Langmuir model and 323
11
Freundlich model were applied to fit the data, and relevant parameters were calculated. Two equations 324
are expressed by Eq. (5) and Eq. (6), respectively. 325 𝐶e 𝑄e⁄ = 𝐶e 𝑄m⁄ + 1 𝑄m × 𝐾1⁄ (5) 326 lnQ𝑒 = ln𝐶e n +⁄ ln𝐾f (6) 327
where Qe (mg·g−1) is the adsorption capacity at equilibrium; Ce (mg·L−1) is the equilibrium concentration 328
of P4; Kl and Qm are the Langmuir constant and the maximum theoretical adsorption capacity, 329
respectively; Kf and n are the Freundlich constant and heterogeneity factor, respectively. 330
As shown in Table 2, the correlation coefficients of Freundlich model were higher (R2 ≥ 0.9645) 331
than those of Langmuir model (R2 ≤ 0.9095) under different temperatures. This signified that the 332
Freundlich model could more accurately described the isotherm data of CNT@CS/P(MAA). The 333
Freundlich isotherm model assumes a multilayer adsorption occurring on a heterogeneous surface, and 334
the heat of adsorption is not uniform between the molecules adsorbed onto the surface of adsorbent. 335
Therefore, the adsorption process of CNT@CS/P(MAA) for P4 was multilayer adsorption behavior, or 336
the adsorption of P4 occurs on a heterogeneous interface between the solution and CNT@CS/P(MAA). 337
3.3.3 Adsorption kinetics 338
Fig. 6 shows the kinetic curve of CNT@CS/P(MAA) for P4 at 25 °C. It is obvious that the 339
adsorption capacity increases rapidly in the first few minutes and reaches the adsorption equilibrium 340
within 60 minutes. The saturation adsorption capacity of CNT@CS/P(MAA) is 18.98 mg·g-1 at the 341
concentration of 50 μg·mL-1. Then the pseudo-first-order rate Eq. (7) and pseudo-second-order rate Eq. 342
(8) are used to fit the kinetic data, and the results are showed in Table 3. 343 lg 𝑄e 𝑄t⁄ = lg𝑄e − 𝑘1 × t 2.303⁄ (7) 344 t 𝑄t⁄ = 1 (𝑘2 × 𝑄e2)⁄ + t 𝑄e⁄ (8) 345
where k1 and k2 are the adsorption rate constants of the pseudo-first-order equation and pseudo-second-346
order equation, respectively; Qe(mg·g−1) is the adsorption capacity at equilibrium, and Qt (mg·g−1) is the 347
adsorption capacity at time t. 348
As shown in Table 3, compared with the pseudo-first-order kinetic model, the regression correlation 349
coefficient of the pseudo-second-order kinetic model (R2 = 0.9745) is higher. The theoretical maximum 350
adsorption capacity Qe calculated by the pseudo-second-order model (18.60 mg·g−1) is closer to the 351
experimental value (18.98 mg·g−1). The results demonstrated that the adsorption of P4 onto 352
CNT@CS/P(MAA) followed the pseudo-second-order kinetic model. Hence, the adsorption rate is 353
limited by chemisorption which involved the electron sharing or transfer between CNT@CS/P(MAA) 354
and P4. 355
3.3.4 Adsorption selectivity 356
E, E2, DXM, DES and BPA (Fig. 1) were chosen to study the selectivity of the prepared polymers. 357
The selection coefficient is a quantitative parameter used to evaluate the discrimination ability of 358
different materials for the target analyte from interfering analogues. The SC was calculated by Eq. (4) 359
and the results are shown in Table 4. Compared with CNTs and CNT@CS, the selectivity of 360
CNT@CS/P(MAA) for P4 is significantly improved. The calculated SC values for E, E2, DXM, DES 361
and BPA are 2.42, 2.46, 10.03, 18.94, and 34.43, respectively, indicating the high specificity of 362
CNT@CS/P(MAA) towards P4. There are differences between P4 and the five analogues in the steroidal 363
12
ring, three-dimensional structure and functional group, which lead to their different spatial distribution 364
and different interactions with the active sites in the polymer cavities, resulting in a high selectivity for 365
P4. 366
The plentiful carboxyl in MAA polymers provided adsorption sites for binding to carbonyl and 367
hydroxyl groups. Therefore, the adsorption capacity of CNT@CS/P(MAA) mainly depends on the 368
amount of carboxyl groups and the pore size of the materials surface. P4, E, E2 and DXM contain 369
carbonyl or hydroxyl groups, which could interact more favorably with the carboxyl in MAA polymers. 370
Among them, E and E2 have a spatial structure similar to that of P4, and could more freely enter the 371
holes of the MAA polymers. Moreover, both the C3-carbonyl and C17-methyl ketones of P4 can interact 372
electrostatically with the carboxyl groups of the MAA polymers, while E and E2 only have C17-carbonyl 373
or hydroxyl that could interact with the polymers’ carboxyl. The force of E and E2 is weaker than that of 374
P4. DXM is a cortisol hormone. Although it contains two carbonyl groups and three hydroxyl groups, 375
DXM differs greatly from P4 in spatial structure and could not easily enter the MAA polymers. Therefore, 376
the selection coefficient of DXM is higher than that of E and E2. DES and BPA are similar to estrogen 377
in pharmacological action, but their spatial structures and action sites are very different from P4, so the 378
selection coefficients are higher than others. 379
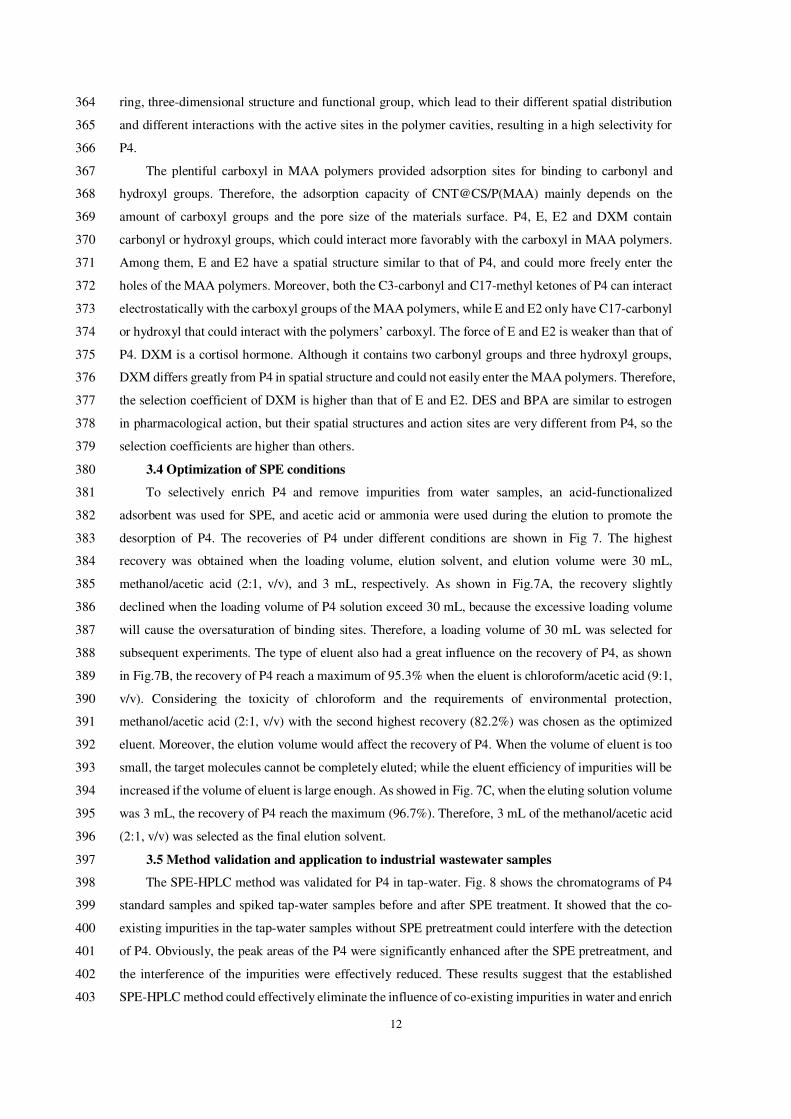
3.4 Optimization of SPE conditions 380
To selectively enrich P4 and remove impurities from water samples, an acid-functionalized 381
adsorbent was used for SPE, and acetic acid or ammonia were used during the elution to promote the 382
desorption of P4. The recoveries of P4 under different conditions are shown in Fig 7. The highest 383
recovery was obtained when the loading volume, elution solvent, and elution volume were 30 mL, 384
methanol/acetic acid (2:1, v/v), and 3 mL, respectively. As shown in Fig.7A, the recovery slightly 385
declined when the loading volume of P4 solution exceed 30 mL, because the excessive loading volume 386
will cause the oversaturation of binding sites. Therefore, a loading volume of 30 mL was selected for 387
subsequent experiments. The type of eluent also had a great influence on the recovery of P4, as shown 388
in Fig.7B, the recovery of P4 reach a maximum of 95.3% when the eluent is chloroform/acetic acid (9:1, 389
v/v). Considering the toxicity of chloroform and the requirements of environmental protection, 390
methanol/acetic acid (2:1, v/v) with the second highest recovery (82.2%) was chosen as the optimized 391
eluent. Moreover, the elution volume would affect the recovery of P4. When the volume of eluent is too 392
small, the target molecules cannot be completely eluted; while the eluent efficiency of impurities will be 393
increased if the volume of eluent is large enough. As showed in Fig. 7C, when the eluting solution volume 394
was 3 mL, the recovery of P4 reach the maximum (96.7%). Therefore, 3 mL of the methanol/acetic acid 395
(2:1, v/v) was selected as the final elution solvent. 396
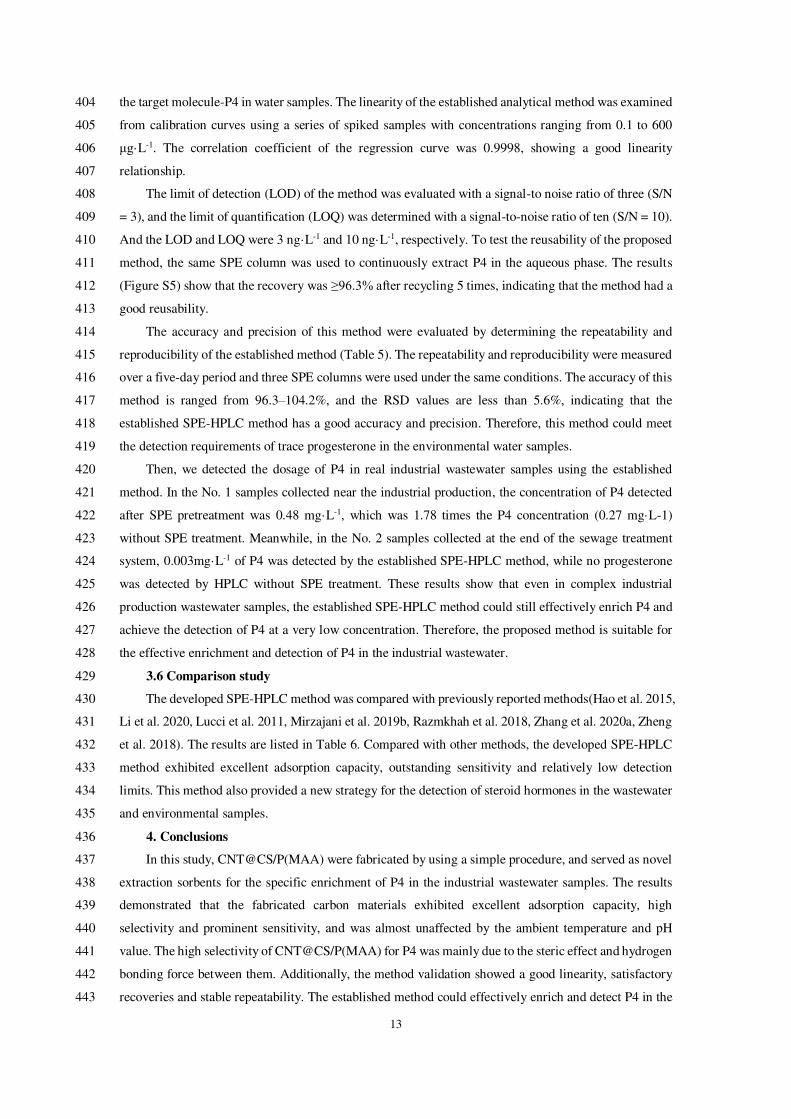
3.5 Method validation and application to industrial wastewater samples 397
The SPE-HPLC method was validated for P4 in tap-water. Fig. 8 shows the chromatograms of P4 398
standard samples and spiked tap-water samples before and after SPE treatment. It showed that the co-399
existing impurities in the tap-water samples without SPE pretreatment could interfere with the detection 400
of P4. Obviously, the peak areas of the P4 were significantly enhanced after the SPE pretreatment, and 401
the interference of the impurities were effectively reduced. These results suggest that the established 402
SPE-HPLC method could effectively eliminate the influence of co-existing impurities in water and enrich 403
13
the target molecule-P4 in water samples. The linearity of the established analytical method was examined 404
from calibration curves using a series of spiked samples with concentrations ranging from 0.1 to 600 405
μg·L-1. The correlation coefficient of the regression curve was 0.9998, showing a good linearity 406
relationship. 407
The limit of detection (LOD) of the method was evaluated with a signal-to noise ratio of three (S/N 408
= 3), and the limit of quantification (LOQ) was determined with a signal-to-noise ratio of ten (S/N = 10). 409
And the LOD and LOQ were 3 ng·L-1 and 10 ng·L-1, respectively. To test the reusability of the proposed 410
method, the same SPE column was used to continuously extract P4 in the aqueous phase. The results 411
(Figure S5) show that the recovery was ≥96.3% after recycling 5 times, indicating that the method had a 412
good reusability. 413
The accuracy and precision of this method were evaluated by determining the repeatability and 414
reproducibility of the established method (Table 5). The repeatability and reproducibility were measured 415
over a five-day period and three SPE columns were used under the same conditions. The accuracy of this 416
method is ranged from 96.3–104.2%, and the RSD values are less than 5.6%, indicating that the 417
established SPE-HPLC method has a good accuracy and precision. Therefore, this method could meet 418
the detection requirements of trace progesterone in the environmental water samples. 419
Then, we detected the dosage of P4 in real industrial wastewater samples using the established 420
method. In the No. 1 samples collected near the industrial production, the concentration of P4 detected 421
after SPE pretreatment was 0.48 mg·L-1, which was 1.78 times the P4 concentration (0.27 mg·L-1) 422
without SPE treatment. Meanwhile, in the No. 2 samples collected at the end of the sewage treatment 423
system, 0.003mg·L-1 of P4 was detected by the established SPE-HPLC method, while no progesterone 424
was detected by HPLC without SPE treatment. These results show that even in complex industrial 425
production wastewater samples, the established SPE-HPLC method could still effectively enrich P4 and 426
achieve the detection of P4 at a very low concentration. Therefore, the proposed method is suitable for 427
the effective enrichment and detection of P4 in the industrial wastewater. 428
3.6 Comparison study 429
The developed SPE-HPLC method was compared with previously reported methods(Hao et al. 2015, 430
Li et al. 2020, Lucci et al. 2011, Mirzajani et al. 2019b, Razmkhah et al. 2018, Zhang et al. 2020a, Zheng 431
et al. 2018). The results are listed in Table 6. Compared with other methods, the developed SPE-HPLC 432
method exhibited excellent adsorption capacity, outstanding sensitivity and relatively low detection 433
limits. This method also provided a new strategy for the detection of steroid hormones in the wastewater 434
and environmental samples. 435
4. Conclusions 436
In this study, CNT@CS/P(MAA) were fabricated by using a simple procedure, and served as novel 437
extraction sorbents for the specific enrichment of P4 in the industrial wastewater samples. The results 438
demonstrated that the fabricated carbon materials exhibited excellent adsorption capacity, high 439
selectivity and prominent sensitivity, and was almost unaffected by the ambient temperature and pH 440
value. The high selectivity of CNT@CS/P(MAA) for P4 was mainly due to the steric effect and hydrogen 441
bonding force between them. Additionally, the method validation showed a good linearity, satisfactory 442
recoveries and stable repeatability. The established method could effectively enrich and detect P4 in the 443
14
actual industrial wastewater samples without the interference of matrix complexity. Compared with the 444
published reports, the proposed method has the characteristics of large adsorption capacity, stable 445
adsorption performance and high sensitivity. It could be a promising alternative for P4 monitoring in the 446
industrial wastewater, and provides a new method for the detection of P4 in other environmental waters. 447
448
Declarations: 449
Ethics approval and consent to participate 450
Not applicable 451
Consent for publication 452
Not applicable 453
Availability of data and materials 454
All data generated or analysed during this study are included in this published article and its 455
supplementary information files. 456
Competing interests 457
The authors declare that they have no known competing financial interests or personal 458
relationships that could have appeared to influence the work reported in this paper. 459
Funding 460
This study was financially supported by the National Natural Science Foundation of China (No. 461
81773689). 462
Authors' contributions 463
Xia Cui ([email protected]): Conceptualization, methodology, formal analysis, investigation, 464
visualization, writing—original draft 465
Hua Shu ([email protected]): Methodology, formal analysis, writing—review and editing 466
Lu Wang ([email protected]): Writing—review and editing 467
Guoning Chen ([email protected]): Writing—review and editing 468
Jili Han ([email protected]): Writing—review and editing 469
Qianqian Hu ([email protected]): Writing—review and editing 470
Kamran Bashir ([email protected]): Writing—review and editing 471
Zhimin Luo ([email protected]): Visualization, writing—review and editing 472
Chun Chang ([email protected]): Supervision, funding acquisition 473
Jia Zhang ([email protected]): Funding acquisition 474
Qiang Fu ([email protected]): Conceptualization, visualization, supervision, funding 475
acquisition 476
Acknowledgements 477
The authors thank the National Natural Science Foundation of China for providing financial 478
support and the Instrumental Analysis Center of Xi'an Jiaotong University for providing excellent 479
characterization platform. 480
Authors' information 481
Affiliations 482
15
Department of Pharmaceutical Analysis, School of Pharmacy, Xi’an Jiaotong University, Xi’an 483
710061, China 484
Xia Cui, Hua Shu, Lu Wang, Guoning Chen, Jili Han, Qianqian Hu, Kamran Bashir, Zhimin Luo, Chun 485
Chang, Qiang Fu. 486
Institute of Drug Safety and Monitoring, Academy of Pharmaceutical Science and Technology, 487
Xi’an Jiaotong University, Xi’an 710061, China 488
Xia Cui, Hua Shu, Lu Wang, Guoning Chen, Jili Han, Qianqian Hu, Kamran Bashir, Zhimin Luo, Chun 489
Chang, Qiang Fu. 490
Shaanxi Hanjiang Pharmaceutical Group Co., Ltd, Hanzhong 723000, China 491
Jia Zhang, Qiang Fu. 492
493
Reference: 494
Akshaya KB, Bhat VS, Varghese A, George L, Hegde G (2019): Non-Enzymatic Electrochemical 495 Determination of Progesterone Using Carbon Nanospheres from Onion Peels Coated on Carbon 496 Fiber Paper. J. Electrochem. Soc. 166, B1097-B1106 497
Chamas A, Pham HTM, Jahne M, Hettwer K, Gehrmann L, Tuerk J, Uhlig S, Simon K, Baronian K, 498 Kunze G (2017): Separation and identification of hormone-active compounds using a 499 combination of chromatographic separation and yeast-based reporter assay. Sci. Total Environ. 500 605-606, 507-513 501
Chen J, Huang Y, Liang C, Wang B (2018): Preparation and electromagnetic shielding performance of 502 functionalized carbon nanotube/epoxy porous composites. Chem. Ind. & Eng. Pro.(China) 37, 503 664-672 504
De Lima CA, Spinelli A (2013): Electrochemical behavior of progesterone at an ex situ bismuth film 505 electrode. Electrochim. Acta 107, 542-548 506
Du W, Sun M, Guo P, Chang C, Fu Q (2018): Molecularly imprinted membrane extraction combined 507 with high-performance liquid chromatography for selective analysis of cloxacillin from shrimp 508 samples. Food Chem. 259, 73-80 509
Fabbrocini A, Coccia E, D'Adamo R, Faggio C, Paolucci M (2019): Mifepristone affects fertility and 510 development in the sea urchin Paracentrotus lividus. Mol. Reprod. Dev. 86, 1348-1356 511
Graham JD, Clarke CL (1997): Physiological action of progesterone in target tissues. Endocr. Rev. 18, 512 502-19 513
Guo P, Chen G, Shu H, Li P, Yu P, Chang C, Wang Y, Fu Q (2019): Monodisperse molecularly imprinted 514 microsphere cartridges coupled with HPLC for selective analysis of dexamethasone and 515 hydrocortisone in cosmetics by using matrix solid-phase dispersion. Anal. Methods 11, 3687-516 3696 517
Guo R, Li L, Wang Y, Wang L, Zhang M, Zhan W, Shi Q (2016): Historical story on natural medicinal 518 chemistry: Steroids. Chin. Tradit. Herb Drugs 47, 1251-1264 519
Guohua H, Hongyang L, Zhiming J, Danhua Z, Haifang W (2017): Study of small-cell lung cancer cell-520 based sensor and its applications in chemotherapy effects rapid evaluation for anticancer drugs. 521 Biosens. Bioelectron. 97, 184-195 522
Hao Y, Gao R, Shi L, Liu D, Tang Y, Guo Z (2015): Water-compatible magnetic imprinted nanoparticles 523 served as solid-phase extraction sorbents for selective determination of trace 17beta-estradiol in 524 environmental water samples by liquid chromatography. J. Chromatogr. A 1396, 7-16 525
Hashmi MAK, Escher BI, Krauss M, Teodorovic I, Brack W (2018): Effect-directed analysis (EDA) of 526 Danube River water sample receiving untreated municipal wastewater from Novi Sad, Serbia. 527 Sci. Total Environ. 624, 1072-1081 528
Hashmi MAK, Krauss M, Escher BI, Teodorovic I, Brack WJeoTTE (2020): Effect‐Directed Analysis 529 of Progestogens andGlucocorticoids at Trace Concentrations in River Water. Environ. Toxicol. 530 Chem. 39, 189-199 531
Hua S, Yanhui G, Xin-Ya X, Peng-Qi G, Zhi-Min L, Wei D, Chun C, Rui-Lin L, Qiang FJJoCA (2018): 532 Hybrid-type carbon microcoil-chitosan composite for selective extraction of aristolochic acid I 533 from Aristolochiaceae medicinal plants. J. Chromatogr. A 1561, 13-19 534
Jakubus A, Paszkiewicz M, Stepnowski P (2016): Carbon Nanotubes Application in the Extraction 535 Techniques of Pesticides: A Review. Anal. Chem. 47, 76-91 536
16
Khan MS, Dighe K, Wang Z, Srivastava I, Schwartz-Duval AS, Misra SK, Pan D (2019): 537 Electrochemical-digital immunosensor with enhanced sensitivity for detecting human salivary 538 glucocorticoid hormone. Analyst 144, 1448-1457 539
Kollofrath D, Geppert M, Polarz S (2020): Copolymerization of Mesoporous Styrene-Bridged 540 Organosilica Nanoparticles with Functional Monomers for the Stimuli-Responsive Remediation 541 of Water. Chemsuschem. 13, 5100-5111 542
Kumar V, Johnson AC, Trubiroha A, Tumova J, Ihara M, Grabic R, Kloas W, Tanaka H, Kroupova HK 543 (2015): The challenge presented by progestins in ecotoxicological research: a critical review. 544 Environ. Sci. Technol. 49, 2625-38 545
Li L, Chen Y, Yang Y, Yang Y, Yang L, Wang Z (2020): Rapid and sensitive analysis of progesterone 546 by solid-phase extraction with amino-functionalized metal-organic frameworks coupled to 547 direct analysis in real-time mass spectrometry. Anal. Bioanal. Chem. 412, 2939-2947 548
Liu D, Liu C, Tang Q (2018): Thermoelectric effect and mechanical properties of multi-walled carbon 549 nanotubes/ ethylene propylene diene monomer composites. New Chem. Mater. 46, 129-132 550
Liu R, Mao S, Wang Y, Wang L, Ge Y, Xu X, Fu Q (2017): A mussel-inspired hybrid copolymer adhered 551 to chitosan-coated micro-sized carbon fiber aerogels for highly efficient nanoparticle 552 scavenging. Environ. Sci.: Nano 4, 2164-2174 553
Lucci P, Nunez O, Galceran MT (2011): Solid-phase extraction using molecularly imprinted polymer for 554 selective extraction of natural and synthetic estrogens from aqueous samples. J. Chromatogr. A 555 1218, 4828-4833 556
Luque-Cordoba D, Lopez-Bascon MA, Priego-Capote F (2020): Development of a quantitative method 557 for determination of steroids in human plasma by gas chromatography-negative chemical 558 ionization-tandem mass spectrometry. Talanta 220, 121415 559
Mirzajani R, Kardani F, Ramezani Z (2019a): A nanocomposite consisting of graphene oxide, zeolite 560 imidazolate framework 8, and a molecularly imprinted polymer for (multiple) fiber solid phase 561 microextraction of sterol and steroid hormones prior to their quantitation by HPLC. Microchim. 562 Acta 186, 129-143 563
Mirzajani R, Kardani F, Ramezani Z (2019b): A nanocomposite consisting of graphene oxide, zeolite 564 imidazolate framework 8, and a molecularly imprinted polymer for (multiple) fiber solid phase 565 microextraction of sterol and steroid hormones prior to their quantitation by HPLC. Microchim. 566 Acta 186 567
Nezhadali A, Es'haghi Z, Khatibi A (2016): Selective extraction of progesterone hormones from 568 environmental and biological samples using a polypyrrole molecularly imprinted polymer and 569 determination by gas chromatography. Anal. Methods 8, 1813-1827 570
Razmkhah K, Sereshti H, Soltani S, Nodeh HR (2018): Extraction and Determination of Three Steroid 571 Molecules in Milk Using Functionalized Magnetic Carbon Nanotube-Based Solid Phase 572 Extraction Coupled with HPLC. Anal. Methods 11, 3179-3189 573
Shu H, Chen G, Wang L, Cui X, Wang Q, Li W, Chang C, Guo Q, Luo Z, Fu Q (2020): Adenine-coated 574 magnetic multiwalled carbon nanotubes for the selective extraction of aristolochic acids based 575 on multiple interactions. J. Chromatogr. A 1627, 461382 576
Siren H, El Fellah S (2017): Androgens, oestrogens, and progesterone concentrations in wastewater 577 purification processes measured with capillary electrophoresis. Environ. Sci. Pollut. Res. 24, 578 16765-16785 579
Tao X, Wang X, Liu B, Liu J (2020): Conjugation of antibodies and aptamers on nanozymes for 580 developing biosensors. Biosens. Bioelectron. 168, 112537 581
Tian X, Song H, Wang Y, Tian X, Tang Y, Gao R, Zhang C (2020): Hydrophilic magnetic molecularly 582 imprinted nanobeads for efficient enrichment and high performance liquid chromatographic 583 detection of 17beta-estradiol in environmental water samples. Talanta 220, 121367 584
Xu W, Jiao L, Ye H, Guo Z, Wu Y, Yan H, Gu W, Du D, Lin Y, Zhu C (2020): pH-responsive allochroic 585 nanoparticles for the multicolor detection of breast cancer biomarkers. Biosens. Bioelectron. 586 148, 111780 587
Xu X, Zheng QQ, Bai GM, Dai QM, Cao XD, Yao YW, Liu SQ, Yao C (2018): Polydopamine 588 functionalized nanoporous graphene foam as nanoreactor for efficient electrode-driven 589 metabolism of steroid hormones. Biosens. Bioelectron. 119, 182-190 590
Xu XY, Guo PQ, Luo ZM, Ge YH, Zhou YL, Chang RM, Du W, Chang C, Fu Q (2017): Preparation 591 and characterization of surface molecularly imprinted films coated on multiwall carbon 592 nanotubes for recognition and separation of lysozyme with high binding capacity and selectivity. 593 RSC Adv. 7, 18765-18774 594
17
Yu Q, Geng J, Zong X, Zhang Y, Xu K, Hu H, Deng Y, Zhao F, Ren H (2019): Occurrence and removal 595 of progestagens in municipal wastewater treatment plants from different regions in China. Sci. 596 Total Environ. 668, 1191-1199 597
Zhang J, Zang L, Wang T, Wang X, Jia M, Zhang D, Zhang H (2020a): A solid-phase extraction method 598 for estrogenic disrupting compounds based on the estrogen response element. Food Chem. 333, 599 127529 600
Zhang J, Zang L, Wang T, Wang X, Zhang HJFC (2020b): A solid-phase extraction method for 601 estrogenic disrupting compounds based on the estrogen response element. Food Chem. 333, 602 127529 603
Zhang K, Zhao Y, Fent K (2017): Occurrence and Ecotoxicological Effects of Free, Conjugated, and 604 Halogenated Steroids Including 17alpha-Hydroxypregnanolone and Pregnanediol in Swiss 605 Wastewater and Surface Water. Environ. Sci. Technol. 51, 6498-6506 606
Zhang Z, Kang X, Guo Y, Zhang J, Xie J, Shao S, Xiang Y, Chen G, Yu X (2020c): Association of 607 circulating galectin-3 with gestational diabetes mellitus, progesterone, and insulin resistance. J. 608 Diabetes, 1-9 609
Zheng P, Zhang B, Luo Z, Du W, Guo P, Zhou Y, Chang R, Chang C, Fu Q (2018): Facile preparation 610 of polydopamine-coated imprinted polymers on the surface of SiO2 for estrone capture in milk 611 samples. J. Sep. Sci. 41, 2585-2594 612
Zong Y, Chen J, Hou J, Deng W, Liao X, Xiao Y (2018): Hexafluoroisopropanol-alkyl carboxylic acid 613 high-density supramolecular solvent based dispersive liquid-liquid microextraction of steroid 614 sex hormones in human urine. J. Chromatogr. A 1580, 12-21 615
Figures
Figure 1
The chemical structure of progesterone, estrone, estradiol, dexamethasone, diethylstilbestrol andbisphenol A.
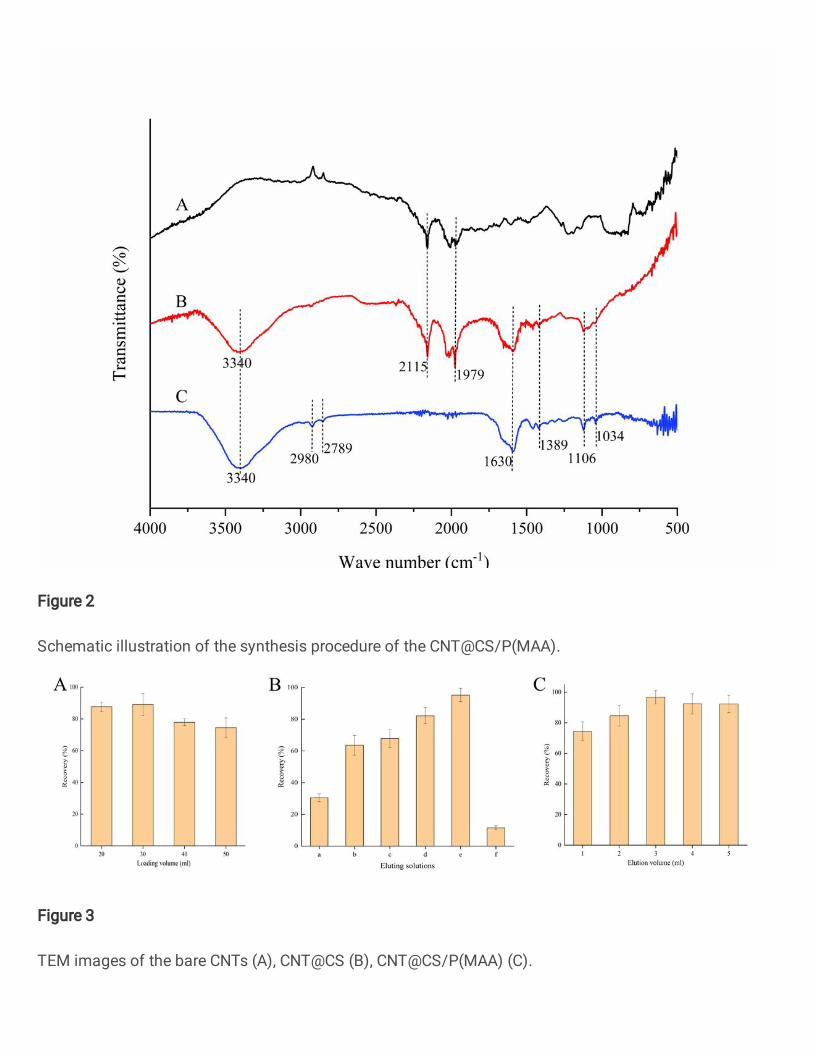
Figure 2
Schematic illustration of the synthesis procedure of the CNT@CS/P(MAA).
Figure 3
TEM images of the bare CNTs (A), CNT@CS (B), CNT@CS/P(MAA) (C).
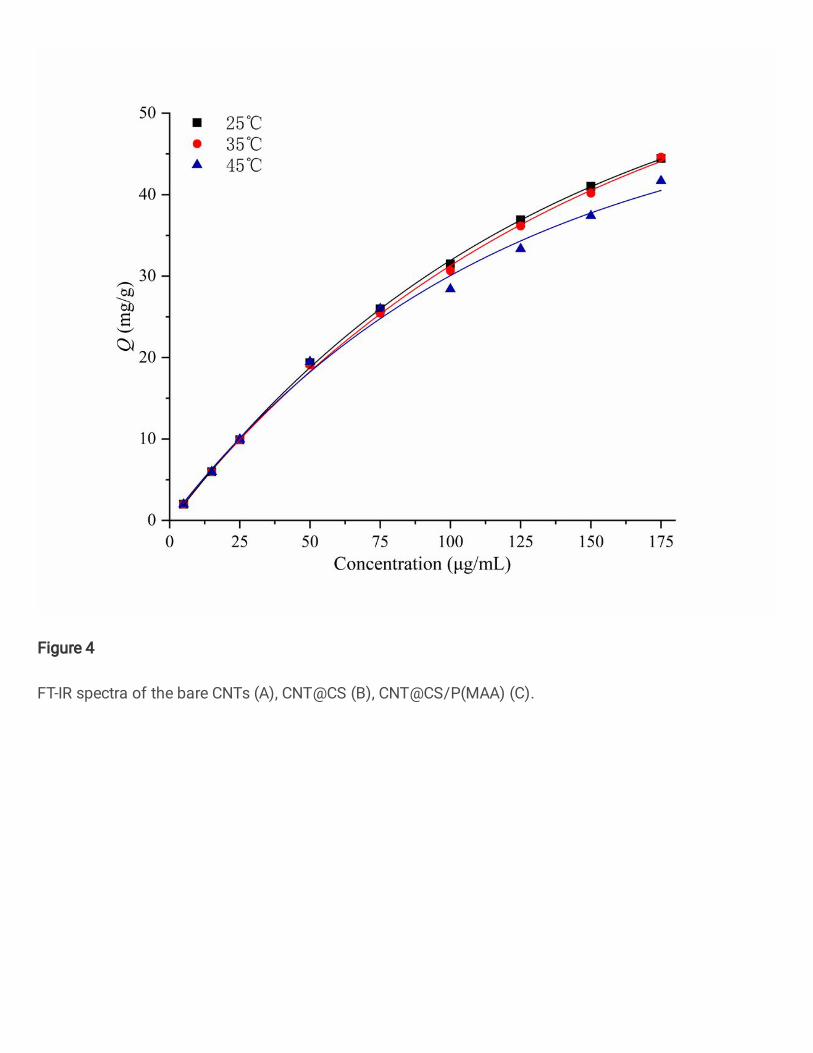
Figure 4
FT-IR spectra of the bare CNTs (A), CNT@CS (B), CNT@CS/P(MAA) (C).

Figure 5
The adsorption isotherms of CNT@CS/P(MAA) at 25, 35 and 45.
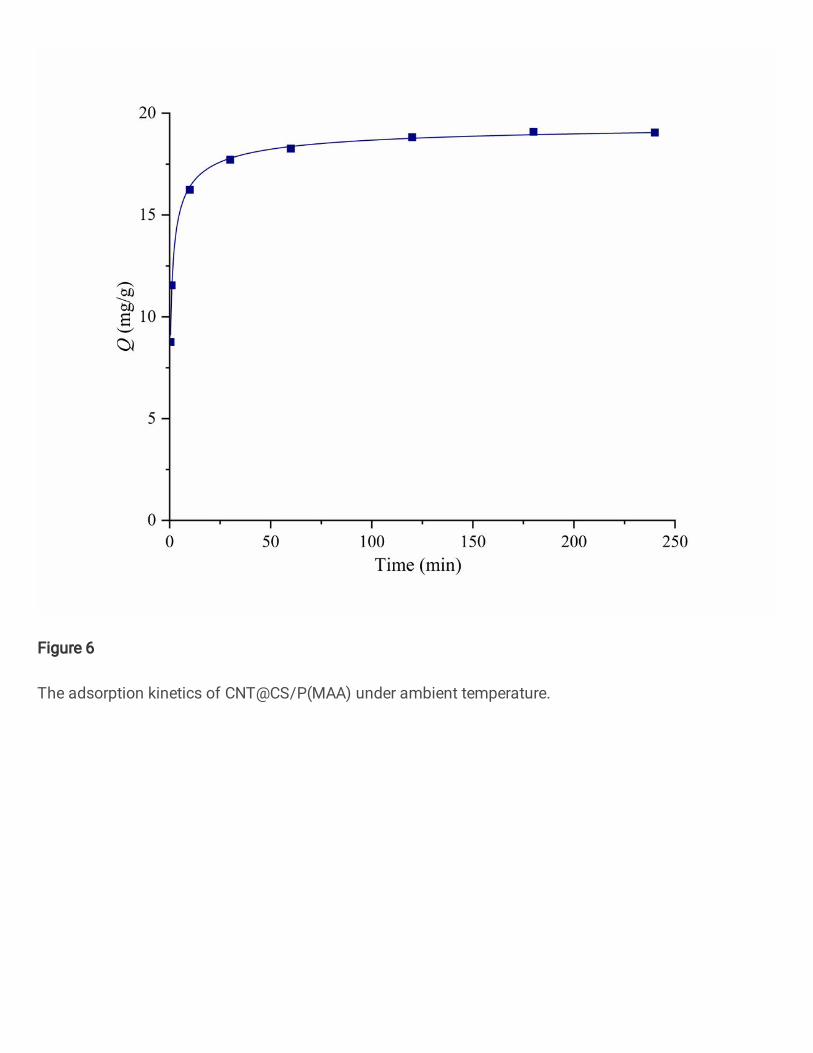
Figure 6
The adsorption kinetics of CNT@CS/P(MAA) under ambient temperature.
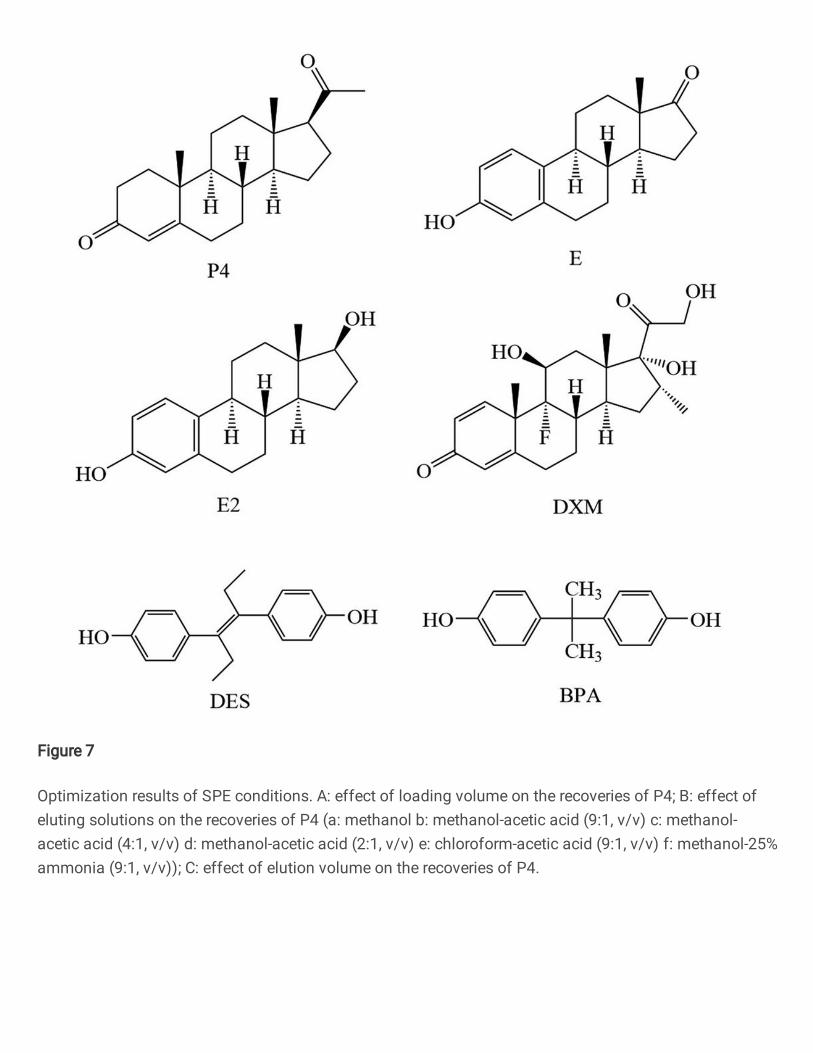
Figure 7
Optimization results of SPE conditions. A: effect of loading volume on the recoveries of P4; B: effect ofeluting solutions on the recoveries of P4 (a: methanol b: methanol-acetic acid (9:1, v/v) c: methanol-acetic acid (4:1, v/v) d: methanol-acetic acid (2:1, v/v) e: chloroform-acetic acid (9:1, v/v) f: methanol-25%ammonia (9:1, v/v)); C: effect of elution volume on the recoveries of P4.
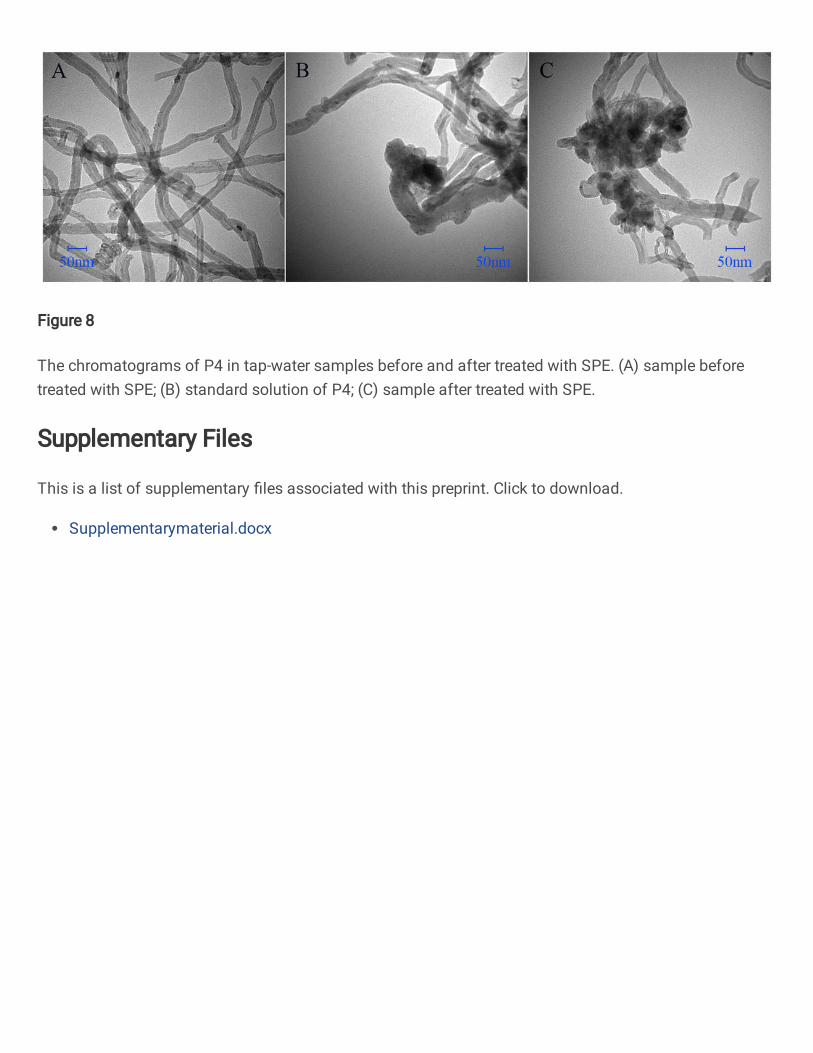
Figure 8
The chromatograms of P4 in tap-water samples before and after treated with SPE. (A) sample beforetreated with SPE; (B) standard solution of P4; (C) sample after treated with SPE.
Supplementary Files
This is a list of supplementary �les associated with this preprint. Click to download.
Supplementarymaterial.docx


![Original Article Acrylic and methacrylic hompolymers …urpjournals.com/tocjnls/1_1.pdf · Original Article Acrylic and methacrylic hompolymers based on pyramido [4, 5-d] pyrimidine](https://img.pdfslide.us/doc/110x75/5aa762187f8b9ac5648c0a41/original-article-acrylic-and-methacrylic-hompolymers-article-acrylic-and-methacrylic.jpg)