Embed Size (px)
Citation preview
Metformin IR tablets: partial in vitro dissolution profiles differences do not preclude in vivo
bioequivalence
Eva Troja Quality Control Department
Profarma SH.A. Pharmaceutical Industry Tirana, Albania
Leonard Deda, Gëzim Boçari Department of Biomedical Sciences
Faculty of Medicine, University of Medicine Tirana, Albania
[email protected]; [email protected]
Abstract— Objectives: To investigate whether Metformine Profarma 850 mg tablets (test product) are bioequivalent to Glucophage® 850 mg tablets (Merck Santè laboratories - reference product) despite partial in vitro dissolution profiles differences observed. Methods: A randomized, open-label, single-dose, two-period, one-week wash out, crossover study was performed in 20 healthy male and female volunteers at “Mother Theresa” University Hospital Centre, Tirana, Albania, after obtaining the approval by National Ethics Committee. A single 850mg dose of metformin was administrated with 200 ml of water after overnight fasting and blood samples were collected at 0, 0.5, 1, 1.5, 2, 2.5, 3, 4, 5, 6, 8, 10, 12 and 14 h after dosing. Plasma concentrations were measured by using a validated ion-pair HPLC method with UV-DAD. Non-compartmental pharmacokinetic parameters such as Cmax, AUC0-14 h, AUC0-inf, and Tmax were determined using PKSolver Version 2. Results: Administration of single Metformin Profarma 850 mg and Glucophage® 850 mg tablets resulted in comparable systemic exposures to metformin, as determined by Cmax, AUC0-14 and AUC0-inf. ANOVA analysis of the ln-transformed Cmax, AUC0-14 and AUC0-inf values indicated that none of the effects examined (formulation, period, sequence and carry over) was statistically significant. The geometric mean ratios of Cmax, AUC0-14 and AUC0-inf were 103.0%, 99.3% and 98.8%, respectively, and 90% confidence intervals of Cmax, AUC0-14 and AUC0-inf were contained within the bioequivalence acceptance limits of 80% to 125%. Conclusions: Metformin Profarma 850 mg and Glucophage® 850 mg tablets were shown to be bioequivalent despite the in vitro dissolution profiles indicate a faster dissolution rate for Metformine Profarma 850 mg tablets, at least in one dissolution medium.
Keywords— metformin; dissolution profile; pharmacokinetics; bioequivalence
I. INTRODUCTION Metformin, an oral biguanide, is actually considered the first-line drug of choice for the treatment of type 2 diabetes [1]. Although the mechanisms of action are not fully elucidated, the suppression of hepatic glucose production is clerly the major one. Also, some evidence exists, which suggests metformin may have a role in the prevention of cardiovascular events [2] and cancer [3] in diabetic patients.
In Albanian pharmaceutical market, apart the innovator Glucophage, several generics are available, of which the most prescribed are Metformin Profarma and Siofor. Generic drugs, defined as medicinal products containing identical amounts of the same active substance as the reference formulation (innovator), have become very popular in recent years. Lower medication cost is their major advantage. However, there are still concerns that substitution of an innovator medicinal product with the respective generic may lead to a different bioavailability and, for this reason, they couldn’t be used interchangeably. In practice, but also from the regulatory point of view, this problem generally is overcome by in vivo bioequivalence studies. Despite this, increasing evidence has shown that in vitro bioequivalence studies may accurately predict in vivo bioequivalence for immediate release solid oral dosage forms of highly soluble class I and III drugs. Furthermore, it appears that in vitro studies are sometimes better than in vivo studies in assessing bioequivalence of immediate release solid oral dosage forms [4]. This study was carried out to investigate, by means of dissolution profile comparison, the in vitro bioequivalence of metformin generic tablets in Albanian market and innovator product and to compare the results with those obtained from respective in vivo bioequivalence test.
II. METHODS
A. Dissolution profile comparison (in vitro bioequivalence) Product selection Three most prescribed brands of metformin tablets were used (Table I).
TABLE I. CHARACTERISTICS OF METFORMIN IMMEDIATE RELEASE TABLETS INCLUDED IN THE STUDY
Product name Dosage Content %
Batch number Producer
Glucophage 850 mg 102.2 500911 Merck Sante Siofor 850 mg 101.1 48273 Berlin Chemie
Metformine 850 mg 97.6 1310 Profarma Sh.a
International Scientific Journal Journal of Medical and Biological Sciences
http://bioscience.scientific-journal.com
Dissolution test An USP apparatus II (model TDT – 08L, Pharma Alliance Group) was employed for the dissolution testing. For each brand 12 tablets were used. Samples (10 millilitres) were taken at 0, 10, 15, 20, 30, 45 and 60 minutes. Dissolution medium was replaced after each sampling to maintain the sink conditions. Two dissolution media were used: • 900 ml of pH 6.8 phosphate buffer (0.68% w/v of
potassium dihydrogen orthophosphate adjusted to pH 6.8 by the addition of 1M sodium hydroxide) at 37oC, with 100 rpm (compendial test)..
• 900 ml of either pH 4.5 acetate buffer or pH 1.2 HCl buffer, both containing 0.01% sodium lauryl sulphate at 37oC, with 150 rpm (non-compendial test).
Each of the withdrawn samples was filtered with a 0.45µm syringe filter, further diluted, and the absorbance was measured at 233 nm. At each run a calibration curve was constructed to calculate the concentrations.
Dissolution profiles For each pharmaceutical product a dissolution profile was constructed by plotting the mean of cumulative percentage released in a specific dissolution media against the sampling time. The dissolution profiles were compared using two model independent parameters: the difference factor (f1) and the similarity factor (f2) [5]. Two dissolution profiles are considered similar if f1 is between 0 and 15 and if f2 is between 50 and 100.
B. Bioequivalence test Subjects 20 healthy male and female adult volunteers, of age between 18 to 50 years, were enrolled in the study. Pre-study baseline health status assessments for each individual included medical history, physical examinations, vital signs and clinical laboratory tests. Subjects with a positive history or any evidence of hepatic, renal, gastrointestinal, hematologic or allergic disorders, any acute or chronic diseases, drug allergy or receiving any kind of treatment were not permitted to participate. Volunteers were asked to abstain from taking alcohol or non prescription medical products at least 1 week prior to and during the study period. The study protocol was approved by National Ethics Committee. All participants signed the Informed Consent after explaining the possible risks and benefits, and the purpose of the study. The study was conducted in accordance with local regulatory requirements and with ethical standards for human clinical trials established by the Declaration of Helsinki. Study design
A randomised, open-label, single dose, two-period cross-over design was used to investigate the bioequivalence of Glucophage and Metformine 850 mg immediate release tablets. A wash-out period of at least 5 days was allowed between treatment periods. After an overnight fasting, the subjects were given single oral doses of study medication with approximately 200 ml water. Water was allowed ad libitum 2 hours after drug administration, while food after 4 hours. Volunteers were ambulatory during the study. Blood sampling Approximately, 5 ml of blood were drawn through a forearm vein indwelling cannula before and at 0.5, 1, 1.5, 2, 2.5, 3, 4, 5, 6, 8, 10, 12 and 14 hours after drug administration in heparin lithium containing tubes and were centrifuged at 3500 x rpm for 10 minutes at room temperature within 30 minutes. Plasma was collected in two aliquots and kept frozen at -20°C until analysis.
C. Bioanalytical method Plasma concentrations of metformin were determined using a validated ion-paired HPLC method described in details elsewhere [6]. Briefly, to 500 µl plasma were added acetonitrile (1:1) and the mixture was vortexed for 30 seconds and centrifuged at 10000 rpm for 10 minutes. The upper layer (about 0.75 mL) was collected into a clean glass tube and 1.5 ml dichloromethane were added. After mixing for 30 seconds, the sample was centrifuged at 5000 rpm for 10 minutes. Then 20 µL of supernatant was injected into an Agilent 1200 chromatograph. The separation was performed on an LiChroCart® 100 RP 18 (125/× 4.0 mm i.d. 5 µm, particle size) column. The mobile phase was prepared by mixing 0.01 M of sodium phosphate buffer (pH=6.0), 0.3% sodium dodecyl sulphate, and acetonitrile in a ratio of 67.5:32.5, adjusting with H3PO4 to 6.0 as necessary. The flow rate and the column temperature were 1.25 ml/minute and 50°C, respectively. The detection of metformin was carried out at 236 nm. Assay performance during the study was assessed by measurement of quality control samples and back-calculation of calibration standards. Pharmacokinetic analysis Pharmacokinetic analyses were carried out using non-compartmental analysis methods [7]. Maximum concentration (Cmax) and time to maximum concentration (Tmax) values were directly obtained from the plasma concentration profiles. Areas under the plasma concentration-time curve (AUC0-14, AUC0-inf) and other standard pharmacokinetic parameters, such as apparent clearance (CL/F), terminal half-life (t1/2) and apparent volume of distribution (Vz/F), were calculated using PKSolver add-in program for Microsoft Office. Statistical analysis
International Scientific Journal Journal of Medical and Biological Sciences
http://bioscience.scientific-journal.com
For the purpose of bioequivalence analysis, AUC0-14, AUC0-inf and Cmax were considered as primary pharmacokinetic endpoints. After log transformation (natural logarithm) of the data, the analysis of variance for crossover design was used to assess the effect of formulations, periods, sequences and subjects on these parameters. Parametric 90% confidence intervals based on the ANOVA of the mean test/reference (T/R) ratios of AUCs and Cmax were computed. Difference between two related parameters was considered statistically significant if p < 0.05.
III. RESULTS
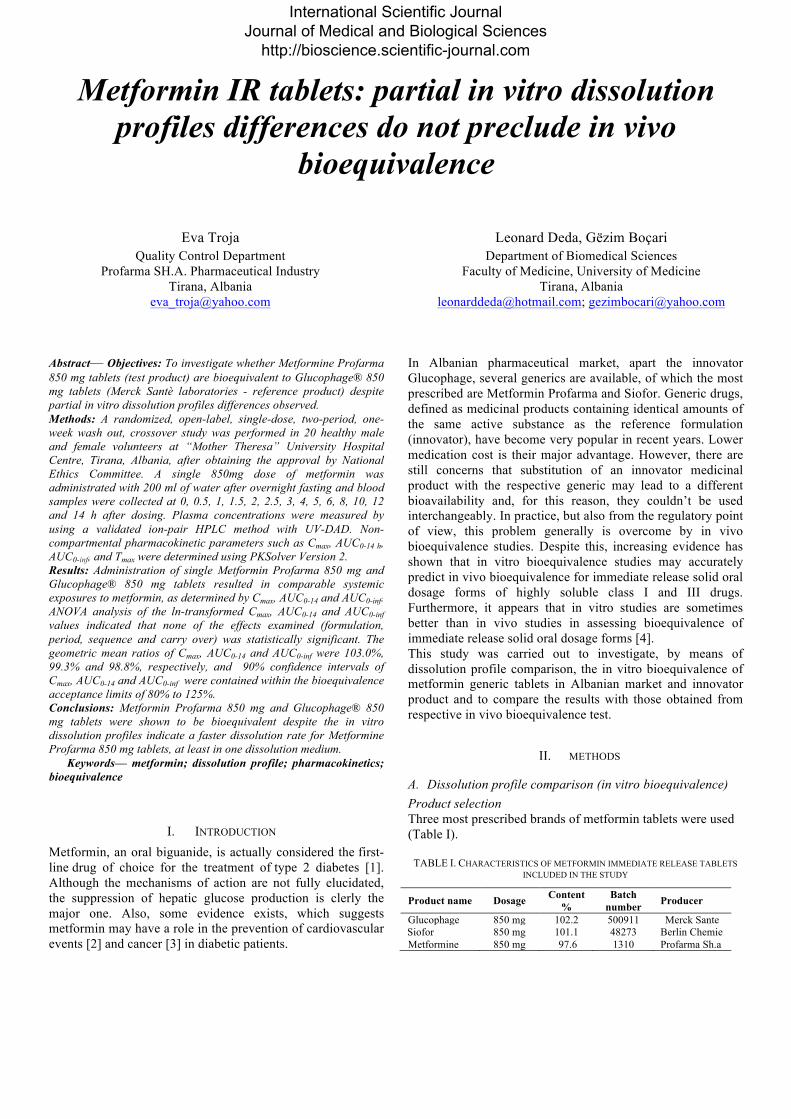
Dissolution profile comparison (in vitro bioequivalence) As shown in Table I, the content of active ingredient of three metformin tablets included in the study were within the pharmacopoeial specification (95% to 105% of stated amount). The dissolution profiles in 900 ml of pH 6.8 phosphate buffer at 37oC, with 100 rpm, for Glucophage (innovator), Siofor and Metformine (generics) are given in Fig. 1. The dissolution profiles in 900 ml of pH 1.2 HCl buffer, containing 0.01% sodium lauryl sulphate (SLS), at 37oC, with 150 rpm, for Glucophage (innovator), Siofor and Metformine (generics) are given in Fig. 2. The similarity factor f2 and the difference factor f1 method are used to compare two dissolution profiles. The results of f2 and f1 are shown in Table II and Table III comparing the dissolution curves of Metformine and Siofor with the innovator Glucophage. For Glucophage, being the reference product, f1 and f2 values are by definition 0 and 100, respectively.
0
20
40
60
80
100
120
0 15 30 45 60 75
Cum
ulat
ive p
erce
ntag
e diss
olve
d (%
)
Time (minutes)
Comparative dissolution profiles of different metformin 850 mg tabletspH 6.8 phosphate buffer
Glucophage Siofor Metformine
Fig. 1. Comparative dissolution profiles of metformin tablets (12 tablets for each product) in pH 6.8 phosphate buffer medium.
TABLE II. THE CALCULATED SIMILARITY AND DIFFERENCE FACTORS FOR TESTED PRODUCTS VS. GLUCOPHAGE AND PERCENTAGE OF ACTIVE
INGREDIENT DISSOLVED AT SPECIFIC TIMES (PH 6.8).
Product name
f1 f2 % dissolved at 15 min
% dissolved at 30 min
Glucophage 56.6% 88.6% Siofor 8 61 49.3% 89.3% Metformine 13 54 65.5% 95.9%
0
20
40
60
80
100
120
0 15 30 45 60 75
Cum
ulat
ive p
erce
ntag
e diss
olve
d %
Time (minutes)
Comparative dissolution profiles of different metformin 850 mg tabletspH 1.2 HCl buffer, 0.01% SLS, 150 rpm
Glucophage Siofor Metformine
Fig. 2. Comparative dissolution profiles of metformin tablets (12 tablets for each product) in pH 1.2 HCl buffer medium, 0.01% SLS, 150 rpm.
TABLE III. THE CALCULATED SIMILARITY AND DIFFERENCE FACTORS FOR TESTED PRODUCTS VS. GLUCOPHAGE AND PERCENTAGE OF ACTIVE
INGREDIENT DISSOLVED AT SPECIFIC TIMES (PH 1.2).
Product name
f1 f2 % dissolved at 15 min
% dissolved at 30 min
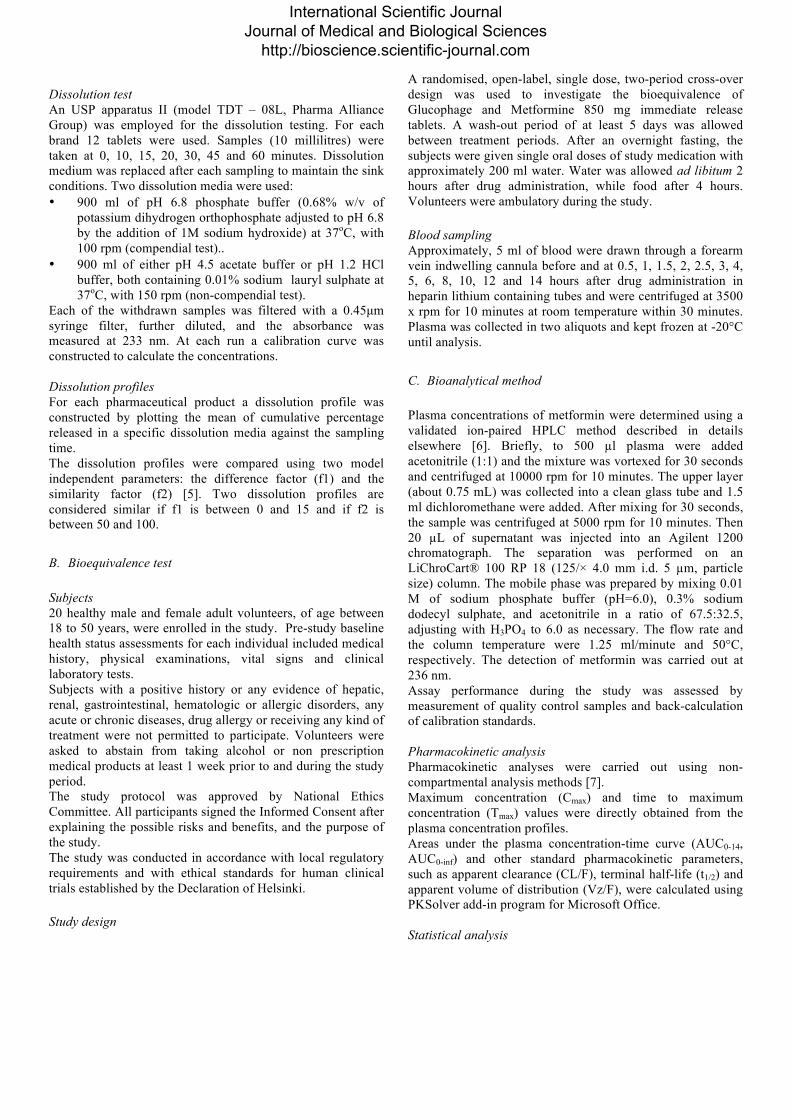
Glucophage 73.4% 100.6% Siofor 6 65 80.6% 94.4% Metformine 25 33 91.8% 93.2% Bioequivalence test All volunteers participating the clinical part of the study showed a good tolerance to both tablets of metformin. No unexpected side effects or other complications that could have influenced the outcome did occur during the study. No alterations in blood and urine biochemistry analyses were reported at the end of the study. There were no reports of deviations from the scheduled blood collection times which by protocol are considered significant (more than 5 minutes). Mean plasma concentration of metformin versus time, after single oral administration of Metformine 850 mg tablets and Glucophage 850 mg tablets, are shown in Fig. 3.
International Scientific Journal Journal of Medical and Biological Sciences
http://bioscience.scientific-journal.com
0
300
600
900
1200
1500
1800
0 2 4 6 8 10 12 14 16
Con
cent
ratio
n (n
g/m
l)
Time (h)
Metformin plasma concentrations vs. time
Metformine Glucophage
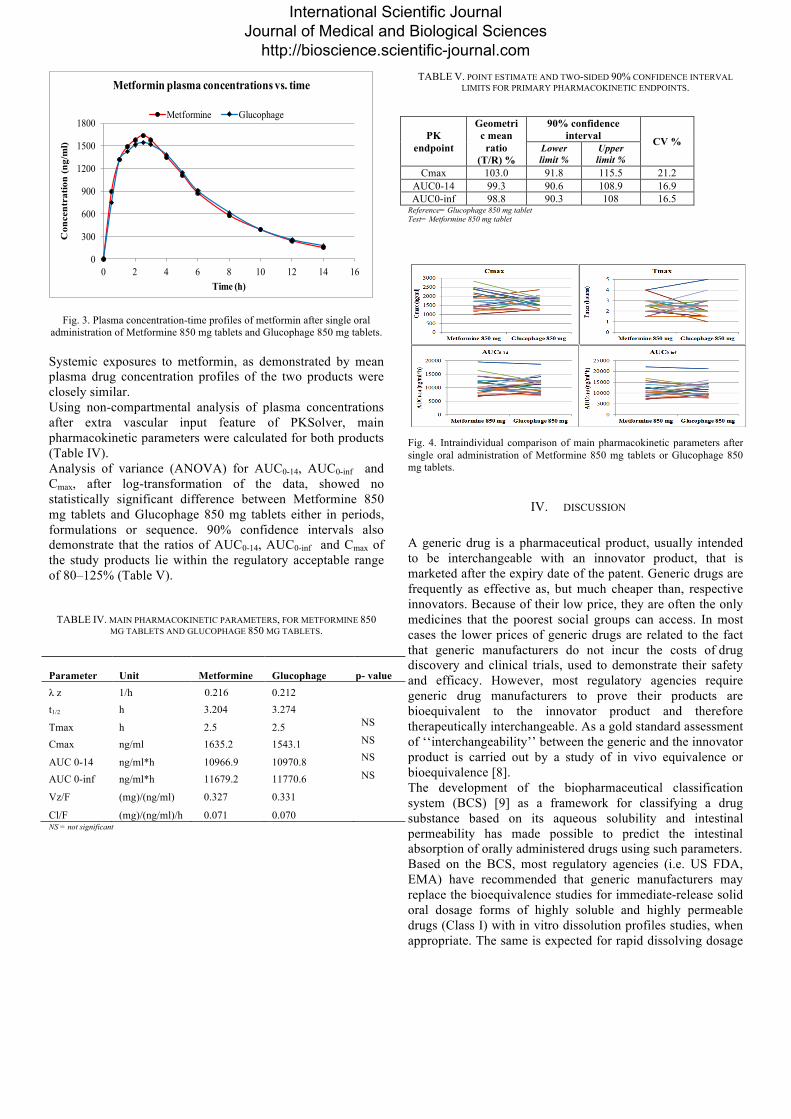
Fig. 3. Plasma concentration-time profiles of metformin after single oral administration of Metformine 850 mg tablets and Glucophage 850 mg tablets. Systemic exposures to metformin, as demonstrated by mean plasma drug concentration profiles of the two products were closely similar. Using non-compartmental analysis of plasma concentrations after extra vascular input feature of PKSolver, main pharmacokinetic parameters were calculated for both products (Table IV). Analysis of variance (ANOVA) for AUC0-14, AUC0-inf and Cmax, after log-transformation of the data, showed no statistically significant difference between Metformine 850 mg tablets and Glucophage 850 mg tablets either in periods, formulations or sequence. 90% confidence intervals also demonstrate that the ratios of AUC0-14, AUC0-inf and Cmax of the study products lie within the regulatory acceptable range of 80–125% (Table V).
TABLE IV. MAIN PHARMACOKINETIC PARAMETERS, FOR METFORMINE 850 MG TABLETS AND GLUCOPHAGE 850 MG TABLETS.
Parameter
Unit
Metformine
Glucophage
p- value
λ z 1/h 0.216 0.212
t1/2 h 3.204 3.274
Tmax h 2.5 2.5 NS
Cmax ng/ml 1635.2 1543.1 NS
AUC 0-14 ng/ml*h 10966.9 10970.8 NS
AUC 0-inf ng/ml*h 11679.2 11770.6 NS
Vz/F (mg)/(ng/ml) 0.327 0.331
Cl/F (mg)/(ng/ml)/h 0.071 0.070 NS = not significant
TABLE V. POINT ESTIMATE AND TWO-SIDED 90% CONFIDENCE INTERVAL LIMITS FOR PRIMARY PHARMACOKINETIC ENDPOINTS.
PK endpoint
Geometric mean ratio
(T/R) %
90% confidence interval CV % Lower
limit % Upper limit %
Cmax 103.0 91.8 115.5 21.2 AUC0-14 99.3 90.6 108.9 16.9 AUC0-inf 98.8 90.3 108 16.5
Reference= Glucophage 850 mg tablet Test= Metformine 850 mg tablet
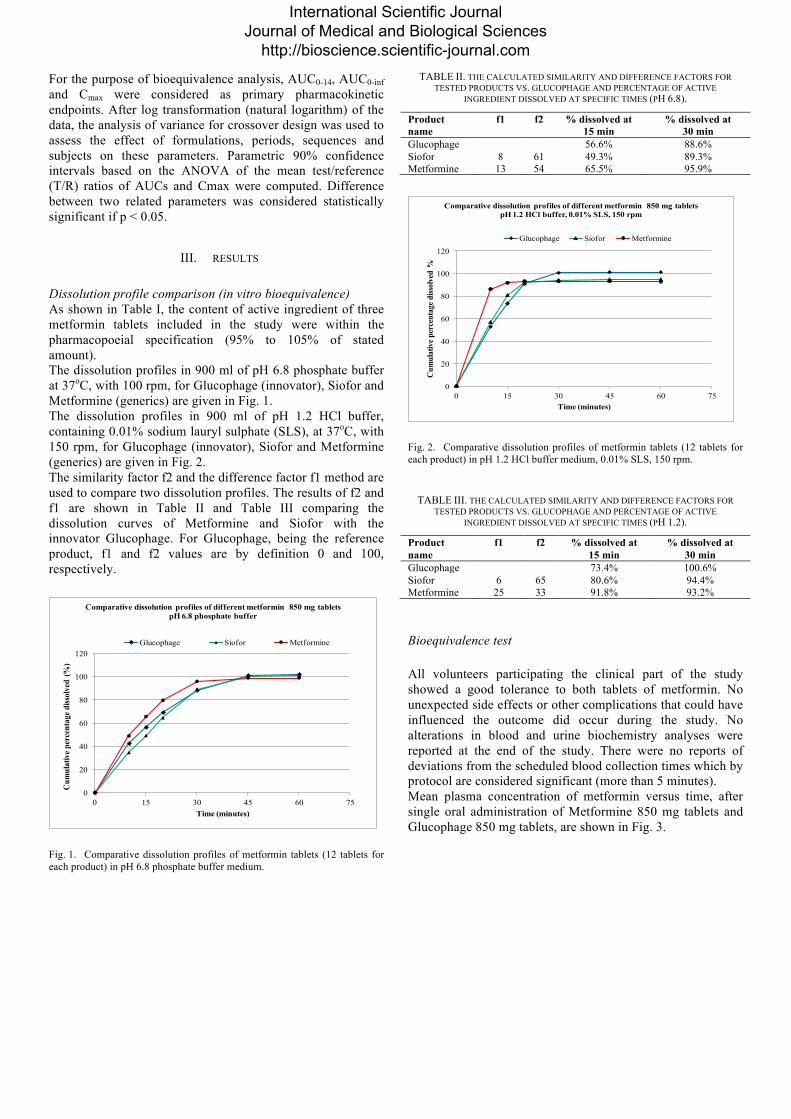
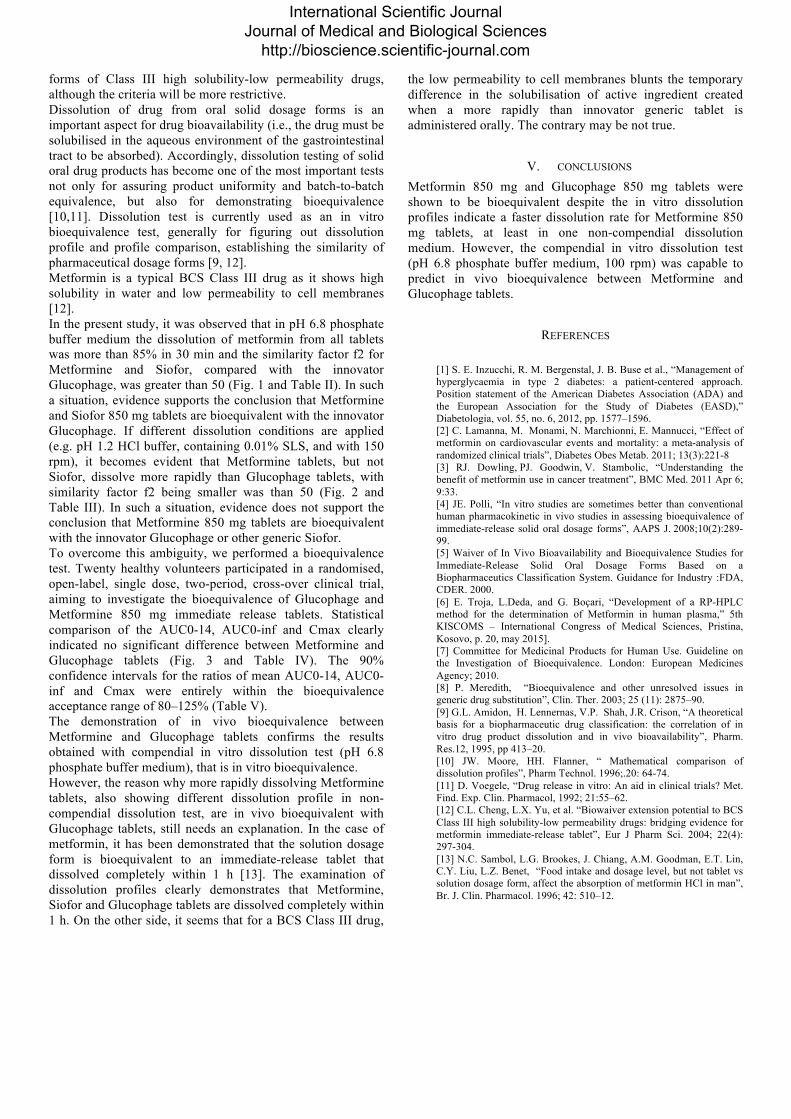
Fig. 4. Intraindividual comparison of main pharmacokinetic parameters after single oral administration of Metformine 850 mg tablets or Glucophage 850 mg tablets.
IV. DISCUSSION
A generic drug is a pharmaceutical product, usually intended to be interchangeable with an innovator product, that is marketed after the expiry date of the patent. Generic drugs are frequently as effective as, but much cheaper than, respective innovators. Because of their low price, they are often the only medicines that the poorest social groups can access. In most cases the lower prices of generic drugs are related to the fact that generic manufacturers do not incur the costs of drug discovery and clinical trials, used to demonstrate their safety and efficacy. However, most regulatory agencies require generic drug manufacturers to prove their products are bioequivalent to the innovator product and therefore therapeutically interchangeable. As a gold standard assessment of ‘‘interchangeability’’ between the generic and the innovator product is carried out by a study of in vivo equivalence or bioequivalence [8]. The development of the biopharmaceutical classification system (BCS) [9] as a framework for classifying a drug substance based on its aqueous solubility and intestinal permeability has made possible to predict the intestinal absorption of orally administered drugs using such parameters. Based on the BCS, most regulatory agencies (i.e. US FDA, EMA) have recommended that generic manufacturers may replace the bioequivalence studies for immediate-release solid oral dosage forms of highly soluble and highly permeable drugs (Class I) with in vitro dissolution profiles studies, when appropriate. The same is expected for rapid dissolving dosage
International Scientific Journal Journal of Medical and Biological Sciences
http://bioscience.scientific-journal.com
forms of Class III high solubility-low permeability drugs, although the criteria will be more restrictive. Dissolution of drug from oral solid dosage forms is an important aspect for drug bioavailability (i.e., the drug must be solubilised in the aqueous environment of the gastrointestinal tract to be absorbed). Accordingly, dissolution testing of solid oral drug products has become one of the most important tests not only for assuring product uniformity and batch-to-batch equivalence, but also for demonstrating bioequivalence [10,11]. Dissolution test is currently used as an in vitro bioequivalence test, generally for figuring out dissolution profile and profile comparison, establishing the similarity of pharmaceutical dosage forms [9, 12]. Metformin is a typical BCS Class III drug as it shows high solubility in water and low permeability to cell membranes [12]. In the present study, it was observed that in pH 6.8 phosphate buffer medium the dissolution of metformin from all tablets was more than 85% in 30 min and the similarity factor f2 for Metformine and Siofor, compared with the innovator Glucophage, was greater than 50 (Fig. 1 and Table II). In such a situation, evidence supports the conclusion that Metformine and Siofor 850 mg tablets are bioequivalent with the innovator Glucophage. If different dissolution conditions are applied (e.g. pH 1.2 HCl buffer, containing 0.01% SLS, and with 150 rpm), it becomes evident that Metformine tablets, but not Siofor, dissolve more rapidly than Glucophage tablets, with similarity factor f2 being smaller was than 50 (Fig. 2 and Table III). In such a situation, evidence does not support the conclusion that Metformine 850 mg tablets are bioequivalent with the innovator Glucophage or other generic Siofor. To overcome this ambiguity, we performed a bioequivalence test. Twenty healthy volunteers participated in a randomised, open-label, single dose, two-period, cross-over clinical trial, aiming to investigate the bioequivalence of Glucophage and Metformine 850 mg immediate release tablets. Statistical comparison of the AUC0-14, AUC0-inf and Cmax clearly indicated no significant difference between Metformine and Glucophage tablets (Fig. 3 and Table IV). The 90% confidence intervals for the ratios of mean AUC0-14, AUC0-inf and Cmax were entirely within the bioequivalence acceptance range of 80–125% (Table V). The demonstration of in vivo bioequivalence between Metformine and Glucophage tablets confirms the results obtained with compendial in vitro dissolution test (pH 6.8 phosphate buffer medium), that is in vitro bioequivalence. However, the reason why more rapidly dissolving Metformine tablets, also showing different dissolution profile in non-compendial dissolution test, are in vivo bioequivalent with Glucophage tablets, still needs an explanation. In the case of metformin, it has been demonstrated that the solution dosage form is bioequivalent to an immediate-release tablet that dissolved completely within 1 h [13]. The examination of dissolution profiles clearly demonstrates that Metformine, Siofor and Glucophage tablets are dissolved completely within 1 h. On the other side, it seems that for a BCS Class III drug,
the low permeability to cell membranes blunts the temporary difference in the solubilisation of active ingredient created when a more rapidly than innovator generic tablet is administered orally. The contrary may be not true.
V. CONCLUSIONS Metformin 850 mg and Glucophage 850 mg tablets were shown to be bioequivalent despite the in vitro dissolution profiles indicate a faster dissolution rate for Metformine 850 mg tablets, at least in one non-compendial dissolution medium. However, the compendial in vitro dissolution test (pH 6.8 phosphate buffer medium, 100 rpm) was capable to predict in vivo bioequivalence between Metformine and Glucophage tablets.
REFERENCES
[1] S. E. Inzucchi, R. M. Bergenstal, J. B. Buse et al., “Management of hyperglycaemia in type 2 diabetes: a patient-centered approach. Position statement of the American Diabetes Association (ADA) and the European Association for the Study of Diabetes (EASD),” Diabetologia, vol. 55, no. 6, 2012, pp. 1577–1596. [2] C. Lamanna, M. Monami, N. Marchionni, E. Mannucci, “Effect of metformin on cardiovascular events and mortality: a meta-analysis of randomized clinical trials”, Diabetes Obes Metab. 2011; 13(3):221-8 [3] RJ. Dowling, PJ. Goodwin, V. Stambolic, “Understanding the benefit of metformin use in cancer treatment”, BMC Med. 2011 Apr 6; 9:33. [4] JE. Polli, “In vitro studies are sometimes better than conventional human pharmacokinetic in vivo studies in assessing bioequivalence of immediate-release solid oral dosage forms”, AAPS J. 2008;10(2):289-99. [5] Waiver of In Vivo Bioavailability and Bioequivalence Studies for Immediate-Release Solid Oral Dosage Forms Based on a Biopharmaceutics Classification System. Guidance for Industry :FDA, CDER. 2000. [6] E. Troja, L.Deda, and G. Boçari, “Development of a RP-HPLC method for the determination of Metformin in human plasma,” 5th KISCOMS – International Congress of Medical Sciences, Pristina, Kosovo, p. 20, may 2015]. [7] Committee for Medicinal Products for Human Use. Guideline on the Investigation of Bioequivalence. London: European Medicines Agency; 2010. [8] P. Meredith, “Bioequivalence and other unresolved issues in generic drug substitution”, Clin. Ther. 2003; 25 (11): 2875–90. [9] G.L. Amidon, H. Lennernas, V.P. Shah, J.R. Crison, “A theoretical basis for a biopharmaceutic drug classification: the correlation of in vitro drug product dissolution and in vivo bioavailability”, Pharm. Res.12, 1995, pp 413–20. [10] JW. Moore, HH. Flanner, “ Mathematical comparison of dissolution profiles”, Pharm Technol. 1996;.20: 64-74. [11] D. Voegele, “Drug release in vitro: An aid in clinical trials? Met. Find. Exp. Clin. Pharmacol, 1992; 21:55–62. [12] C.L. Cheng, L.X. Yu, et al. “Biowaiver extension potential to BCS Class III high solubility-low permeability drugs: bridging evidence for metformin immediate-release tablet”, Eur J Pharm Sci. 2004; 22(4): 297-304. [13] N.C. Sambol, L.G. Brookes, J. Chiang, A.M. Goodman, E.T. Lin, C.Y. Liu, L.Z. Benet, “Food intake and dosage level, but not tablet vs solution dosage form, affect the absorption of metformin HCl in man”, Br. J. Clin. Pharmacol. 1996; 42: 510–12.
International Scientific Journal Journal of Medical and Biological Sciences
http://bioscience.scientific-journal.com