Embed Size (px)
Citation preview


PNNL-25587
Metering Plan Intelligent Operational Strategies Through Enhanced Metering Systems JE Pope July 2016 Prepared for the U.S. Department of Energy under Contract DE-AC05-76RL01830 Pacific Northwest National Laboratory Richland, Washington 99352
i
Summary
The Sustainability Program at Pacific Northwest National Laboratory (PNNL) has adopted a “triple-bottom-line” approach of environmental stewardship, social responsibility, and economic prosperity to its operations. Metering at PNNL works in support of all three, specifically to measure and inform building energy use and greenhouse gas emissions and minimize water use. The foundation for metering at PNNL is a core goal set, which consists of four objectives: providing accurate data without interruption, analyzing data while it is still new, providing actionable recommendations to operations management, and ensuring PNNL’s compliance with contract metering requirements. These core objectives guide the decisions that we make during annual planning and as we operate throughout the year.
This 2016 edition of the Metering Plan conveys the metering practices for and vision of the Sustainability Program. Changes in this plan from the 2015 edition include updated tables and an enhanced discussion on energy tracking systems used at PNNL. This plan also discusses updated benchmarking strategies using PNNL’s graphics and analytics tool, BuildingOS by Lucid Design Group. This plan presents our progress toward the metering goals shared by all federal agencies and highlights our successful completion of metering requirements. Currently, PNNL is fully compliant with the applicable legislative and Executive Order metering requirements. PNNL’s approach to the installation of new meters will be discussed. Perhaps most importantly, this plan details the analysis techniques utilized at PNNL that rely on the endless streams of data newly available as a result of increased meter deployment over the last several years. Previous Metering Plans have documented specific meter connection schemes as PNNL focused on deploying meters in a first step toward managing energy and water use. This plan serves not only to highlight PNNL’s successful completion of agency metering goals, but also can be used as a guideline for meter installation and data analysis.

i
Acronyms and Abbreviations
ASHRAE American Society of Heating, Refrigerating and Air-Conditioning Engineers BACnet Building Automation and Control network BOCC Building Operations Control Center BTU British thermal unit CRAC computer room air conditioner CSF Computational Sciences Facility DOE U.S. Department of Energy ECM energy conservation measures EISA Energy Independence and Security Act of 2007 EMSL Environmental Molecular Sciences Laboratory EO Executive Order EPA U.S. Environmental Protection Agency EPAct Energy Policy Act of 2005 FIMS Facilities Information Management System F&O Facilities and Operations FMCS Facilities Management Control System HPSB high performance and sustainable building Hz hertz HVAC heating, ventilation, and air conditioning ILA industrial, landscaping, and agriculture ISB Informational Sciences Building (1 and 2) IT Information Technology JCI Johnson Controls Inc. kW kilowatts LSB Laboratory Support Building mA milliampere PNNL Pacific Northwest National Laboratory PSF Physical Sciences Facility PUE power utilization effectiveness RDHx rear door heat exchanger VAV Variable Air Volume VDC volts direct current VFD Variable Frequency Drive WCM water conservation measures


iii
Contents Summary .............................................................................................................................................. i Acronyms and Abbreviations .............................................................................................................. i Contents ............................................................................................................................................ iii 1.0 Introduction ............................................................................................................................. 1.1 2.0 Advanced Metering Plan ......................................................................................................... 2.1
2.1 Vision .............................................................................................................................. 2.1 2.2 Goal Progress .................................................................................................................. 2.2 2.3 Implementation................................................................................................................ 2.6 2.4 Design and Installation .................................................................................................... 2.7
2.4.1 Meter Types ....................................................................................................... 2.7 2.4.2 Meter Communication ....................................................................................... 2.8
2.5 Data Analysis .................................................................................................................. 2.9 2.6 Energy Tracking Systems ................................................................................................ 2.9
2.6.1 BuildingOS ....................................................................................................... 2.10 2.6.2 EnergyCAP ...................................................................................................... 2.12 2.6.3 Ignition ............................................................................................................. 2.14 2.6.4 Johnson Controls Inc. Metasys ......................................................................... 2.15 2.6.5 Portfolio Manager® ......................................................................................... 2.16
2.7 Benchmarking ............................................................................................................... 2.17 2.8 Data Centers .................................................................................................................. 2.18 2.9 Case Study ..................................................................................................................... 2.20 2.10 Funding ......................................................................................................................... 2.22 2.11 Personnel ....................................................................................................................... 2.22 2.12 Green Button Data ......................................................................................................... 2.23 2.13 Meter Data Validation ................................................................................................... 2.23 2.14 Meter and Sensor Data Uses ......................................................................................... 2.24
2.14.1 Support of HPSB .............................................................................................. 2.24 2.14.2 Track Progress Toward Energy and Potable Water Use Targets ..................... 2.24 2.14.3 Support of ASHRAE Analysis ......................................................................... 2.25 2.14.4 Support of Facility Use Agreement for Temperature Compliance .................. 2.25 2.14.5 Support of Industrial, Landscaping, and Architecture Management ................ 2.26 2.14.6 Support of EISA Audit and Commissioning .................................................... 2.27
3.0 Conclusion ............................................................................................................................... 3.1 4.0 References ............................................................................................................................... 4.1

iv
Figures
Figure 2.1. BOCC ......................................................................................................................... 2.10 Figure 2.2. Campus Energy Reduction Goal Tracking Using BuildingOS .................................. 2.11 Figure 2.3. Laboratory Support Building Heat Map ..................................................................... 2.12 Figure 2.4. PNNL Campus Energy Usage Trend .......................................................................... 2.13 Figure 2.5. PNNL Campus Trend Reduction Results and Energy Use Percentages By Cost....... 2.13 Figure 2.6. Core Business Hours Tool Screen .............................................................................. 2.14 Figure 2.7. Screenshot of System Valve Verification Tool .......................................................... 2.15 Figure 2.8. Heat Pump Diagnostic Screen .................................................................................... 2.16 Figure 2.9. Portfolio Manager® .................................................................................................... 2.17 Figure 2.10. Portfolio Drift Application in BuildingOS for PSF2 Core Team ............................. 2.18 Figure 2.11. CSF/1811 Groundwater Cooling System ................................................................. 2.19 Figure 2.12. Electrical Consumption in the ISB2 Data Center ..................................................... 2.20 Figure 2.13. Building 350 Diagnostic ........................................................................................... 2.21 Figure 2.14. Trace Illustration for Building 350 ........................................................................... 2.21 Figure 2.15. Meter and Bill Validation Comparison for the Laboratory Support Building at
PNNL ........................................................................................................................ 2.23 Figure 2.16. Sample Trace Showing 1 Year of Temperature Data in LSB Room 2D01 .............. 2.25 Figure 2.17. Sigma II Office Temperature Map ........................................................................... 2.26
Tables
Table 2.1. Buildings Appropriate for Energy and Water Metering ................................................ 2.4 Table 2.2. Buildings Appropriate for Energy Metering but Not Appropriate for Water Metering
Due to De Minimis Consumption Threshold ................................................................. 2.4 Table 2.3. Buildings Not Appropriate for Metering Due to Not Meeting the De Minimis
Threshold for Size .......................................................................................................... 2.5 Table 2.4. Buildings Not Appropriate for Metering Due to Being a Partially Leased Building
Where Lessor is Not Paid Based on Actual Energy Consumption ................................ 2.5 Table 2.5. Data Center Metering ..................................................................................................... 2.6

1.1
1.0 Introduction
Pacific Northwest National Laboratory (PNNL) has an established Sustainability Management and Operations Program (Sustainability Program) that includes an annual Metering Plan submittal as one of its three program deliverables. The other deliverables are:
• the contractually required Site Sustainability Plan and associated Consolidated Energy Data Report
• the annual report on progress toward comprehensive energy and water assessments, as required in the Energy Independence and Security Act (EISA) of 2007, and Energy Star Portfolio Manager data upload.
All three program deliverables rely on data collection, analysis, and professional recommendations resulting from metering efforts performed within the Sustainability Program.
This 2016 edition of PNNL’s Metering Plan conveys the metering practices for and vision of the Sustainability Program. The current version of the Metering Plan presents our progress toward the metering goals shared by all federal agencies and highlights our successful completion of metering requirements. PNNL’s approach to the installation of new meters will be discussed. Perhaps most importantly, this plan details the analysis techniques utilized at PNNL that rely on the endless streams of data newly available as a result of increased meter deployment over the last several years. Previous Metering Plans (Pope, et al. 2011; Pope 2012; Pope 2014; Pope 2015) have documented specific meter connection schemes as PNNL focused on deploying meters in a first step toward managing energy and water use. This plan serves not only to highlight PNNL’s successful completion of agency metering goals, but also can be used as a guideline for meter installation and data analysis.
2.1
2.0 Advanced Metering Plan
2.1 Vision
The PNNL Sustainability Program has adopted the “triple-bottom-line” approach of environmental stewardship, social responsibility, and economic prosperity to its operations. Metering at PNNL works in support of all three, specifically to measure and inform building energy use and greenhouse gas emissions and minimize water use. The foundation for metering at PNNL is a core goal set consisting of four objectives:
• Provide accurate data without interruption. Data should be of sufficient quality, quantity, and timeliness to enable effective analysis and support real-time commissioning.
• Analyze data while it is still “fresh.” Data analyses and the resulting recommendations are most relevant when real-time data is used.
• Provide actionable recommendations to operations management.
• Ensure PNNL’s compliance with contractual metering requirements.
These core objectives guide the decisions that we make during annual planning and as we operate throughout the year. Additionally, metering works to enable the Intelligent Buildings initiative, PNNL’s vision to integrate the smartest facilities connected to the smartest people by the smartest systems (PNNL 2014). The near-term objectives are to deploy sensors in 100 percent of our managed facilities; use the Building Operations Control Center (BOCC) to monitor and control building performance; partner with research and development technical capabilities; and ensure optimal control, response, and efficiency across all Facilities and Operations (F&O-)managed facilities using interconnected hardware and software tools.
Sensors deployed as part of the Intelligent Building initiative are termed smart sensors, which reduce operational costs by quickly allowing staff to troubleshoot equipment and correct system operation, allowing for energy-saving strategies, enabling condition-based preventative maintenance, and generating diagnostics to enhance reliability. Its specific values are to:
• increase occupant comfort (temperature and environmental control)
• improve operations (troubleshooting and monitoring)
• allow for energy-saving strategies (advanced programming techniques)
• enable condition-based maintenance (perform maintenance as needed)
• perform diagnostics (detect system abnormal conditions).
The initiative began by defining sensors through a graded approach based on added value and cost effectiveness. Working with the Plant Operations, Sustainability and Energy Group, and Design Engineering, several sensors were identified as providing the most impact in the five value areas.
The highest value sensors are space temperature sensors, demand-based ventilation sensors (carbon dioxide or volatile organic compounds), air filter differential pressure sensors, discharge temperature sensors, British thermal unit [BTU] meters, occupancy sensors, and status sensors on fans/pumps

2.2
(current transducer). Sensor installation is combined with programmed functions and control routines to enable the capability. An example of installed smart sensors in action is detailed in the Case Study section of this report.
2.2 Goal Progress
Compliance with contractual metering requirements at PNNL is measured against three federal metering legislative and Executive Order (EO) drivers. Those documents and the appropriate metering requirement sections are:
• The Energy Policy Act of 2005 (EPAct), Section 103: Energy Use and Management Accountability, requiring that all federal buildings install electric metering systems by October 1, 2012.
• EISA of 2007, Section 434(b): Metering, requiring that all federal buildings be metered for natural gas and steam by October 1, 2016.
• EO 13693 (2015): “Planning for Federal Sustainability in the Next Decade,” Section 3(a)(ii)(B): Sustainability Goals for Agencies, requiring all data centers to have advanced energy meters installed and monitored by 2018.
• EO 13693 (2015): “Planning for Federal Sustainability in the Next Decade,” Section 3(f)(ii): Sustainability Goals for Agencies, requiring agencies to begin installing water meters in 2016.
Guidance for the installation of meters is provided in the Federal Building Metering Guidance (per 42 U.S.C. §8253(e), Metering of Energy Use (U.S. Department of Energy [DOE] 2014). Buildings are considered “appropriate” for metering unless identified for exclusion using criteria set forth in the guidance.
PNNL is currently fully compliant with the legislative and EO requirements above. The tables below detail meter installations for buildings listed in the Facilities Information Management System (FIMS). Meters are described as advanced, defined in the guidance as a meter that “records energy or water consumption data hourly or more frequently and provides for daily or more frequent transmittal of measurements over a communication network to a central collection point,” or standard, defined as “an electromechanical or solid-state meter that cumulatively measures and records aggregated usage data that are periodically retrieved for use in customer billing or energy management.”
Both EPAct and EISA require the installation of advanced meters, where practicable, and require the Secretary of Energy to define what is practicable by issuing the Metering Guidance described above. Per this guidance, existing standard meters used to calculate monthly utility bill invoices can substitute for the installation of new meters if the information is incorporated in agency or sub-agency tracking systems. The use of existing standard meters is only approved in lieu of new meters when the meter measures consumption for a single building, not a campus. Because PNNL tracks all utility invoices using EnergyCAP, a commercial energy management software, and uses that data to inform agency tracking devices (e.g., Consolidated Energy Data Report) and benchmarking tools (e.g., U.S. Environmental Protection Agency’s [EPA’s] ENERGY STAR® Portfolio Manager® [EPA 2012]), meters noted as both advanced and standard are consistent with the guidance and meet the legislated requirements above. As detailed in F&O Administrative Procedure ADM-CM-057-PG-01, Engineering Design Standards (PNNL 2013), it is the policy of PNNL to install advanced electric, natural gas, and water meters on all new facilities constructed.

2.3
In 2016, the Sustainability Program performed a metering assessment with the following scope:
1. Perform a review of PNNL buildings. Buildings included in the assessment are those identified in FIMS. Determine which buildings are appropriate for energy and water metering using the criteria outlined in the Federal Building Metering Guidance (DOE 2014). The four criteria in the guidance used to exclude buildings at PNNL are:
– The building is planned to be sold or razed within the next 5 years.
– The building is leased or owned, but the agency either does not pay the utility bill or does not pay the lessor for utilities based on actual consumption.
– The building is less than the de minimis threshold for energy metering of 25,000 square feet for warehouses and 5,000 square feet for other buildings.
– The building is less than the de minimis threshold for water metering of 5,000 square feet or consumption less than 1,000 gallons per day.
2. Document existence and type of metering for each building deemed appropriate per the guidance.
3. Verify meter maintenance is consistent with F&O Preventive Maintenance Standard ADM-008, Appendix PS-021 (PNNL 2015a).
During the 2016 assessment, 79 buildings at PNNL were evaluated, of which 40 were found to be appropriate for energy metering and 25 were found to be appropriate for water metering. Ten (10) buildings were not appropriate for energy or water metering, because they are leased buildings in which the agency does not pay the lessor based on actual consumption. Twenty-eight (28) buildings were deemed not appropriate for energy metering because they did not meet the de minimis use threshold of 25,000 square feet for warehouses or 5,000 square feet for other building types. Forty-five (45) buildings were deemed not appropriate for water metering because they did not meet the de minimis use threshold of 5,000 square feet or consumption of 1,000 gallons per day.
Buildings deemed appropriate for energy metering, water metering, or both are detailed in Table 2.1 and Table 2.2. Buildings deemed not appropriate for energy or water metering are detailed in Table 2.3 and Table 2.4. Of the 40 buildings deemed appropriate for electricity metering, all 40 are metered; of the 23 buildings deemed appropriate for natural gas metering, all 23 are metered. The core campus—consisting of the Research Operations Building, Math, Physical Sciences Laboratory, Engineering Development Laboratory, Life Science Laboratory II, and the Auditorium buildings—is served from a central plant and electrical distribution system, which is extensively metered, with approximately 70 sub-meters installed. An engineered pro rata allocation of the main service meter measurements for these facilities has been developed over several years using sub-meter data. These buildings are considered to be advanced metered due to the metering installed and the appropriate energy percentage allocation.

2.4
Table 2.1. Buildings Appropriate for Energy and Water Metering
Table 2.2. Buildings Appropriate for Energy Metering but Not Appropriate for Water Metering Due to De Minimis Consumption Threshold

2.5
Table 2.3. Buildings Not Appropriate for Metering Due to Not Meeting the De Minimis Threshold for Size
Table 2.4. Buildings Not Appropriate for Metering Due to Being a Partially Leased Building Where Lessor is Not Paid Based on Actual Energy Consumption

2.6
Some existing buildings at PNNL still use steam for heating. Steam for these facilities is generated on site, and the water and energy used to generate the steam are measured using water, electric, and natural gas meters. Additional metering of steam would be redundant and is not necessary, because no steam is purchased from an off-site utility nor is any steam sold off site.
Of the 25 buildings deemed appropriate for water metering, all 25 are metered.
PNNL has advanced metering installed on data centers in the Informational Sciences Building (ISB) 2, Environmental Molecular Sciences Laboratory (EMSL), and Computational Sciences Facility (CSF) 1811 (see Table 2.5). The advanced metering is used to calculate power utilization efficiency (PUE) and is reported in our annual Site Sustainability Plan.
Table 2.5. Data Center Metering
2.3 Implementation
PNNL’s Metering Plan uses four approaches to metering across campus. Because of our commitment to metering as a key component of the Sustainability Program, we typically focus on long-term metering. We evaluate installations on a case-by-case basis and consider costs and returned benefits from metering. As a result, we are equipped to deploy any of the four standard approaches for metering based on specific need.
• One time/spot measurement: Achieved through measurement by an electrically trained and qualified craftsman. Used to meter equipment where the current draw does not typically modulate and a single measurement is needed, typically as a consideration for a design project.
• Run-time measurement: Achieved exclusively through our facility management and control system. Run-time measurement is used as a diagnostic tool and also to alternate between motors on equipment where lead/lag settings are used in the control sequence to facilitate even wear.
• Short-term monitoring: Used to quantify savings from a specific project when a permanent meter installation is not warranted. Most short-term monitoring is for the purpose of measuring electrical consumption. We typically use battery-powered HOBO meters by Onset to meet this need. Examples include installing a temporary meter to baseline air compressor power for 30 days before a project to repair leaks in the distributed compressed air system throughout a building. At the conclusion of the project, the system is again monitored for 30 days to estimate savings as a result of the repairs. Likewise, we install a temporary meter on a lighting circuit before implementing advanced lighting control. This scenario enables us to quantify savings and assists in commissioning the system, because we can monitor how often the lights are off at night when the building is unoccupied. This monitoring has alerted us to occupancy sensors installed in less than desirable locations, such as near air discharge registers, where false occupancy can be detected.

2.7
• Long-term monitoring: Our standard approach. Long-term monitoring provides valuable information in the short-term but also allows trending over time, a primary input to our data analysis approach. PNNL collects data from long-term electric meters at the service for each building. Likewise, natural gas and water meters installed at the building entry are also long-term installations.
2.4 Design and Installation
The PNNL Metering Plan employs a variety of meter types and technologies. Along with a cursory review of existing metering, new projects should begin design by considering the existing meter types and communications as discussed below.
2.4.1 Meter Types
Existing electric meters installed across the campus take on different characteristics due to the time period in which they were installed, design preferences, and project design constraints. Electric meter types installed include Veris, E-Mon, PQube, Square D, Cutler Hammer, utility provider pulse, and others. New installations must be evaluated on a case-by-case basis given the design constraints.
On new switchboard installations, metering can be included as part of the manufactured package. The Veris product line has proven robust and affordable for applications requiring retrofitting of existing equipment with metering. To date, PNNL has installed hundreds of Veris Enercept meters, which have a compact design, no local display, and communicate directly with the Facilities Management Control System (FMCS). Recently, the new Veris E50 meter has been selected for several installations and is functioning well.
PNNL is following an industry-wide trend to move toward control equipment that communicates using the American Society of Heating, Refrigerating and Air-Conditioning Engineers (ASHRAE)-developed communications protocol standard. The primary benefit of selecting equipment that uses Building Automation and Control network (BACnet) is its open protocol, allowing freedom from proprietary systems that limit future options. The Veris E50 communicates using the BACnet protocol with a compact local display and data logging capability. Separate meter power on the E50 has made it an attractive option for installations at equipment fed from two sources of power via a three-position transfer switch.
In some applications, electric usage data for a specific piece of equipment can be obtained from a variable frequency drive or other installed component. When possible, we prefer to take advantage of existing metering or specify metering integral to a system being installed.
A common natural gas meter at PNNL is the Dattus by Itron. This solid-state meter uses fluidic oscillation technology and has data logging capabilities. Due to meter failures and the unavailability of direct replacements, PNNL began replacing Dattus by Itron gas meters with the Onicon F-5100 series insertion thermal mass meters with a pulse output. Other meters in use include the Roots by GE (formerly Dresser)—installed as a flanged or threaded meter in the gas line—and the Sage Prime, a thermal mass flow insertion meter that can be installed in an existing line. Meters for natural gas tend to be the most costly to purchase and install.

2.8
PNNL employs several technologies for water meters across campus. The most accurate (and most costly) to purchase and install is the compound meter, which combines disc and turbo meters in a single body. The Badger Compound Series is installed at several buildings and has proven to work well. Because of the ease of installation and low cost, the insertion turbine meter is an attractive, effective option. An additional benefit of the insertion meters is the ability to “hot tap” an in-service line, eliminating the need for a system outage. The Onicon 1100 and 1200 series meters offer an alternative to a full bore meter like the Badger Compound. Care must be taken during the design phase to ensure that minimum flows are met. Considerations can be taken, such as reducing the pipe diameter for a short section to increase fluid velocity across the meter. The Onicon F-3500 is an electromagnetic insertion meter used most recently at PNNL that allows accurate readings at lower flow levels than the insertion turbine meters. To meter water used for irrigating outdoor landscaping, McCrometer propeller meters are installed in the non-potable water line. This type of meter is especially suited to dirty water flows and handles solids suspended in water without clogging. It also requires no external power or batteries and is thus appropriate for installation in irrigation lines far from buildings where power is not readily available.
Guidance on meter installation is included in PNNL F&O Administrative Procedure ADM-CM-057, PG-01 (PNNL 2013).
2.4.2 Meter Communication
Many of the electric meters installed communicate to the Johnson Controls Inc. (JCI) Metasys FMCS using either BACnet standard communication protocol, the JCI Metasys N2 communication protocol, or a meter pulse output collected on an accumulator point within the Metasys system. Gateways or translators are also used to take proprietary communication protocols, like Modbus and Eaton’s INCOM, and translate them to an option that is compatible with the JCI system. Buildings that use other controlled systems like Allerton or Automated Logic for data collection and control at the building level communicate meter information to the Metasys system. Metered data is stored, trended, and can be accessed using the Metasys interface. PNNL also employs stand-alone advanced electric meters that store data and can be accessed directly either through a phone line or network connection. Data from meters not connected to the FMCS are retrieved by the BuildingOS system and, in some cases, by the Ignition system.
Most gas meters, including all those employed at PNNL, use a pulse output from the meter collected on an accumulator point within the FMCS. This is a reliable, relatively simple way to collect data from the meter. The Dattus meters also log information that can be retrieved locally with a laptop and feature a local display.
PNNL has worked with the City of Richland, which is the main water purveyor on the campus, to retrofit some existing Badger water meter recorders with a pulse output module allowing data to be accumulated by the FMCS for real-time data without installing a separate meter in some locations. Most of the insertion turbine meters also offer a pulse output, with each pulse accounting for a stated number of gallons measured at the meter. Insertion turbine meters are also available with an analog output of 4−20 milliampere (mA) or 1−10 volts direct current (VDC) and measure water velocity or flow rate.
Considerations for new installations include the availability of existing infrastructure, space constraints, and consistency with other meters within a building.

2.9
2.5 Data Analysis
The importance of data analysis within the PNNL Sustainability Program cannot be overstated. In performing data analysis, we seek to achieve the following four objectives (Hooke, et al. 2009):
• Determine energy use and cost – Determining energy costs provides an increased awareness of where energy is being used and what utilities and areas are the highest consumers. Targeting heavy users offers an opportunity for larger savings with the same percentage reduction compared to a smaller user. Graphics are the best way to illustrate the division of use and cost. In addition to being a valuable analysis tool, energy use and cost graphics are used to increase understanding and awareness among Laboratory employees.
Currently, the total energy and water use at PNNL is broken down by building for electricity, gas, and water. Sub-meters are used heavily to monitor specific systems or pieces of equipment. Metering laboratory panel boards also allows us to identify labs with high electrical intensity that may be candidates for focused energy reduction efforts.
• Calculate performance levels – To compare our buildings and processes against other buildings and processes, industry standards, or the same buildings and processes from an earlier period, we calculate performance levels. These can be simple, such as kilowatts (kW) per square foot for an entire building, or more detailed, such as coefficient of performance for a refrigeration system, boiler efficiency, or PUE of a data center. Examples of how performance levels are used at PNNL are detailed in section 2.7, Benchmarking, and section 2.8, Data Centers.
• Understand the reasons for variable energy use and performance – Energy use and performance levels can vary based on factors outside of our control, such as weather. The goal of our analysis is to understand the reasons for the variability and to identify parameters within our control that can improve performance and reduce energy use. Understanding the load profile for a building as a division of base load, weather load, and variable load can assist in this analysis. Using metered data and analysis techniques, we are working to establish optimum settings for heating, ventilation, and air conditioning (HVAC) equipment in various weather conditions. An example of high variability in performance levels is the coefficient of performance in chiller plants at different loads.
2.6 Energy Tracking Systems
PNNL remains aggressive about reducing its potable water use 36 percent by 2025, from the 2007 baseline, and energy intensity 25 percent by 2025, from the 2015 baseline. To meet these reduction goals, the BOCC monitors and reports using benchmarking, energy and water meetings, and energy and water conservation measures. As a hub for energy tracking and control systems to connect with building managers, building engineers, design engineers, and the building occupants, the BOCC is the integrator for ensuring that energy and water goals are met through continuous monitoring and reporting. Specifically, the BOCC links historical data and real-time monitoring and diagnostics with analytics to optimize energy and water, extend asset life, and enhance the reliability and efficiency of the PNNL campus. The BOCC leverages data from multiple platforms, including Lucid Design Group’s BuildingOS, EnergyCAP, Inductive Automation’s Ignition, JCI’s Metasys, and EPA’s Portfolio Manager, to perform diagnostics, trending, and analytics. These systems are the backbone of the BOCC.
The goal of the BOCC is to create an intelligent infrastructure that uses real-time data to make informed decisions resulting in reduced building operational cost (Belew 2014a). Costs can be reduced by using
2.10
information from sensored buildings to create condition-based maintenance service requests, preventing equipment failures using real-time commissioning, reducing energy cost by monitoring and reporting building operations and implementing energy and water conservation measures (ECMs and WCMs, respectively), which are used to reduce building energy consumption by identifying projects with life-cycle cost effectiveness and return on investment. ECMs can be used to substantiate upgrades on existing out-of-date equipment and systems to improve the overall operation of the building. ECMs can range from no-cost/low-cost sequence modifications to complete equipment replacements. The BOCC collaborates with Projects and Engineering, building management and building engineers, and research and development to identify, prioritize, and plan ECMs and WCMs. The BOCC, through real-time commissioning and energy meetings, maintains the Master ECM List for each core team.
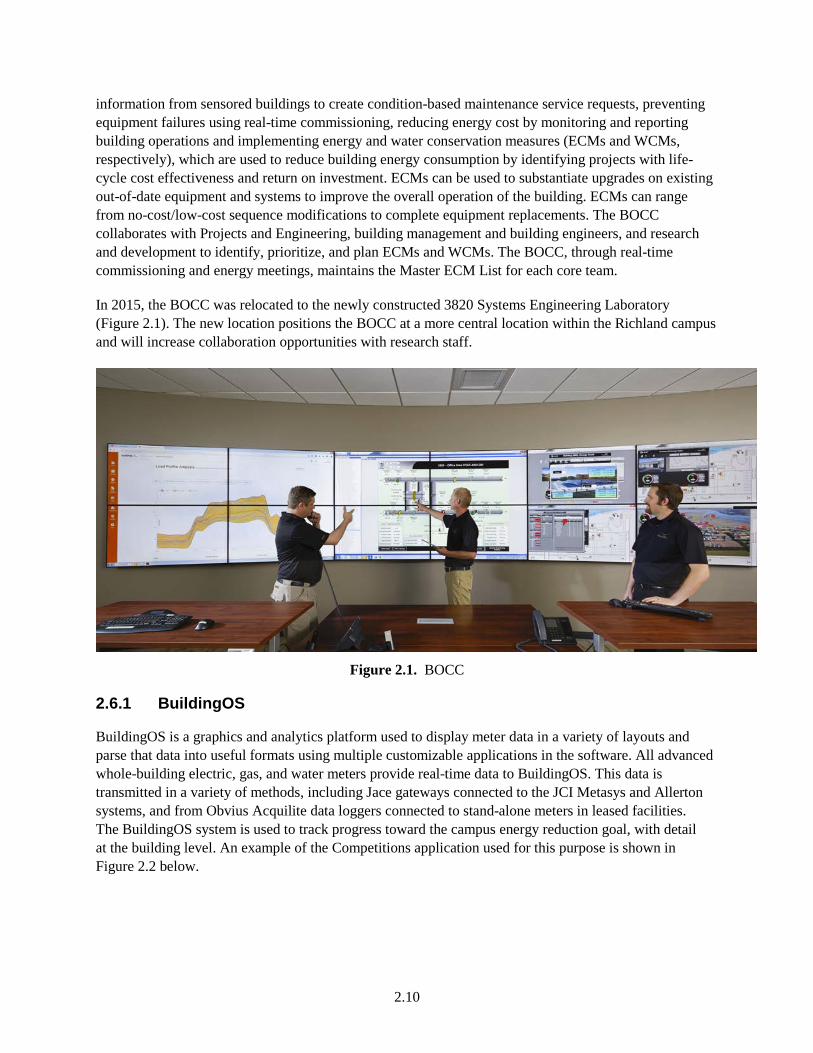
In 2015, the BOCC was relocated to the newly constructed 3820 Systems Engineering Laboratory (Figure 2.1). The new location positions the BOCC at a more central location within the Richland campus and will increase collaboration opportunities with research staff.
Figure 2.1. BOCC
2.6.1 BuildingOS
BuildingOS is a graphics and analytics platform used to display meter data in a variety of layouts and parse that data into useful formats using multiple customizable applications in the software. All advanced whole-building electric, gas, and water meters provide real-time data to BuildingOS. This data is transmitted in a variety of methods, including Jace gateways connected to the JCI Metasys and Allerton systems, and from Obvius Acquilite data loggers connected to stand-alone meters in leased facilities. The BuildingOS system is used to track progress toward the campus energy reduction goal, with detail at the building level. An example of the Competitions application used for this purpose is shown in Figure 2.2 below.

2.11
Figure 2.2. Campus Energy Reduction Goal Tracking Using BuildingOS
The BuildingOS system includes analytical applications that allow energy professionals to identify opportunities for energy savings. The Heat Map Analysis shown in Figure 2.3 below displays color-coded energy use throughout the day over a period of 6 months. You can see energy use increase during the occupied hours and reduce during the nighttime. In this example, you can see how a schedule change in the HVAC control system allowed the building to set back earlier, saving energy. This building is leased to PNNL from a private real estate investment corporation and is operated by that company. Using the graphic below, the 10 p.m. setback was easy to identify and communicate to the building owner, who made the necessary corrections.

2.12
Figure 2.3. Laboratory Support Building Heat Map
2.6.2 EnergyCAP
Commercial bill paying software EnergyCAP is the central storage location for utility bill data at PNNL. Bills are received from multiple utility providers via mail and are entered by hand into the EnergyCAP system. Bill data is then available in customized formats based on date, building name, and strategic building groupings called core teams for each utility type. Selected bill data in EnergyCAP is also pushed to the BuildingOS platform via a professional arrangement between these two companies. While EnergyCAP is the preferred application for viewing, analyzing, and collecting bill data, having it

2.13
available in BuildingOS allows energy practitioners the ability to compare bill and meter data, as well as use bill data to backfill incorrect or missing meter data in the event of a meter offline event or malfunction. Examples of analytical tools used in EnergyCAP to trend campus energy use and compare against previous years, as well as quickly view utility resource allocations, are shown below in Figure 2.4 and Figure 2.5.
Figure 2.4. PNNL Campus Energy Usage Trend
Figure 2.5. PNNL Campus Trend Reduction Results and Energy Use Percentages By Cost

2.14
2.6.3 Ignition
PNNL uses Inductive Automation’s Ignition platform to build customized diagnostics designed to highlight out-of-normal conditions and opportunities for improved operations and energy savings. Meter and sensor data is connected to Ignition software through Jace gateways, similar to the BuildingOS system. Stand-alone meter information from leased facilities is connected using analog telephone communication. Examples of customized diagnostics developed at PNNL and used to analyze its systems include the Core Business Hours tool that compares actual run time with pre-defined scheduled hours for equipment within a building. Equipment operating in excess of the scheduled hours is flagged for investigation. Causes of equipment running outside the core business hours of the facility unnecessarily include overrides, loss of schedule from programming, and incorrect unoccupied high or low temperature limits, among others. A screenshot of the Core Business Hours tool results page is shown in Figure 2.6 below.
Figure 2.6. Core Business Hours Tool Screen
Other examples of Ignition diagnostics developed and used at PNNL include:
• The Variable Air Volume (VAV) Damper Tool, used to monitor VAV damper positions over the previous 7 days to identify dampers that are fully open over an extended period of time, indicating the zone may not be meeting temperature setpoints, possibly due to incorrect VAV box sizing, increase in cooling load due to addition of people or computer equipment, or damper actuator failure found when command is 100 percent but damper is not actually opening.

2.15
• The Variable Frequency Drive Tool identifies VFDs operating at 60 hertz (Hz), an indicator that energy savings may be possible by implementing improved motor speed control below maximum frequency.
• The Valve Tool looks at heating reheat valves in VAV boxes, heating and cooling valves in air handlers, and fan coils. This tool works much like the VAV damper tool, looking for valve positions at 100 percent for an extended period of time. A screenshot of the Valve Tool results page is shown in Figure 2.7 below.
Figure 2.7. Screenshot of System Valve Verification Tool
2.6.4 Johnson Controls Inc. Metasys
Meter and sensor data is collected in the JCI Metasys system for all DOE- and Battelle-owned buildings on the PNNL campus. This is the only energy tracking system discussed that is capable of controlling equipment within the buildings it serves. Advanced diagnostics screens, like the one in Figure 2.8 below, were developed to provide detailed information about each component in a system. Algorithms written at PNNL perform diagnostics using meter and sensor data to alert operators to problems in HVAC systems before an occupant complaint is received. When a fault is detected, it is indicated on the diagnostics and an alarm is produced. Systems failing diagnostic tests are prioritized on a separate screen, with estimated costs for operation outside defined parameters using the Fault Tool.

2.16
Figure 2.8. Heat Pump Diagnostic Screen
2.6.5 Portfolio Manager®
PNNL uses EPA’s Portfolio Manager® tool to track and assess energy and water consumption for our EISA “covered facilities,” as well as to evaluate progress toward High Performance and Sustainable Building (HPSB) goals. Data collected from electricity, natural gas, and water provider meters are entered into the Portfolio Manager® database. DOE’s Sustainability Performance Office now uses Portfolio Manager® (see Figure 2.9) to report EISA “covered facility” energy and water usage. Portfolio Manager® has benchmarking tools and the ability to compare building energy performance with similar buildings away from the campus. Additional information about Portfolio Manager® is available at http://www.energystar.gov/index.cfm?c=evaluate_performance.bus_portfoliomanager.

2.17
Figure 2.9. Portfolio Manager®
2.7 Benchmarking
Monthly meetings with building management teams (known as core teams) are an important part of the benchmarking strategy at PNNL. Meetings are held in the BOCC and are attended by the respective building manager, building engineer, FMCS specialist, and power operator, as well as the campus energy manager, sustainability engineer, and BOCC operator. During the meeting, the core team’s progress toward the energy and potable water reduction goals are reviewed. Electricity and natural gas increases or reductions are presented graphically, and the buildings in the core team are ranked against every building on the campus. The sustainability engineer discusses recommended low- or no-cost energy savings strategies that can be implemented immediately, and discussion is held on additional recommendations and energy conservation measures that can be implemented over time. BuildingOS graphics assist in benchmarking facilities and are used during the monthly meetings. The Portfolio Drift application screen shows the six buildings in the Physical Sciences Facility (PSF)2 Core Team (see Figure 2.10 below). The size of the block with the building name represents the relative energy use compared to the other buildings in the core team. The color of the block indicates energy reduction or increase over the last 12 months compared to the previous 12 months to indicate the direction energy use is trending.

2.18
Figure 2.10. Portfolio Drift Application in BuildingOS for PSF2 Core Team
2.8 Data Centers
PNNL has three data centers located in CSF, ISB2, and EMSL. Each center has meters installed to measure the Information Technology (IT) equipment load and the facility support load, such as lighting and cooling. Metered data are used to calculate PUE for each center. As the primary measure of efficiency, PUE is used to benchmark one data center against another and as a means of verifying energy savings inside a single data center. EO 13693, “Planning for Federal Sustainability in the Next Decade,” requires agencies to meter data centers and establish a PUE target of 1.2 to 1.4 for new data centers and less than 1.5 for existing data centers. To reduce the weighted average of the three data centers at PNNL to the existing weighted PUE of 1.45, innovative energy conservation measures have been implemented, and installed metering has verified the results. The newest data center at PNNL in the CSF space uses well water and a plate and frame heat exchanger to supply cool water to rear door heat exchangers (RDHx) on server racks (see Figure 2.11). The water is also supplied to a chiller that serves a computer room air conditioner (CRAC) when needed. The diagram in Figure 2.11 shows the flow for this ground source system, as well as the location of meters measuring electric power, water temperature entering and leaving the RDHx and CRAC, and water flow rate in these two systems. These meters validate the excellent efficiency of this system, which yields a PUE of 1.1 with only the RDHx in operation and 1.2 when the CRAC is running.

2.19
Figure 2.11. CSF/1811 Groundwater Cooling System
In ISB2, the meters measuring IT load and facilities load are connected to APC’s StructureWare Central and SynapSense software packages. The program plots the various loads and displays PUE components graphically. Temperature sensors throughout the data center are displayed on a heat map to assist in locating hot spots. The data center manager uses the metered data to analyze the system and provide customers with a graphical representation of the efforts to reduce energy and cost (see Figure 2.12). Using virtual machine software, the total number of servers in the data center has been reduced. The dip in the kW (upper) trace below during the month of April 2014 was a result of taking several single-purpose servers out of service and transferring that capability to virtual machine servers serving multiple users. The reduction of power toward the end of the month was a result of shutting down a 3Par storage array and transferring the capability to existing machines yielding an annual savings of 126,144 kWh and $6,937.92.

2.20
Figure 2.12. Electrical Consumption in the ISB2 Data Center
2.9 Case Study
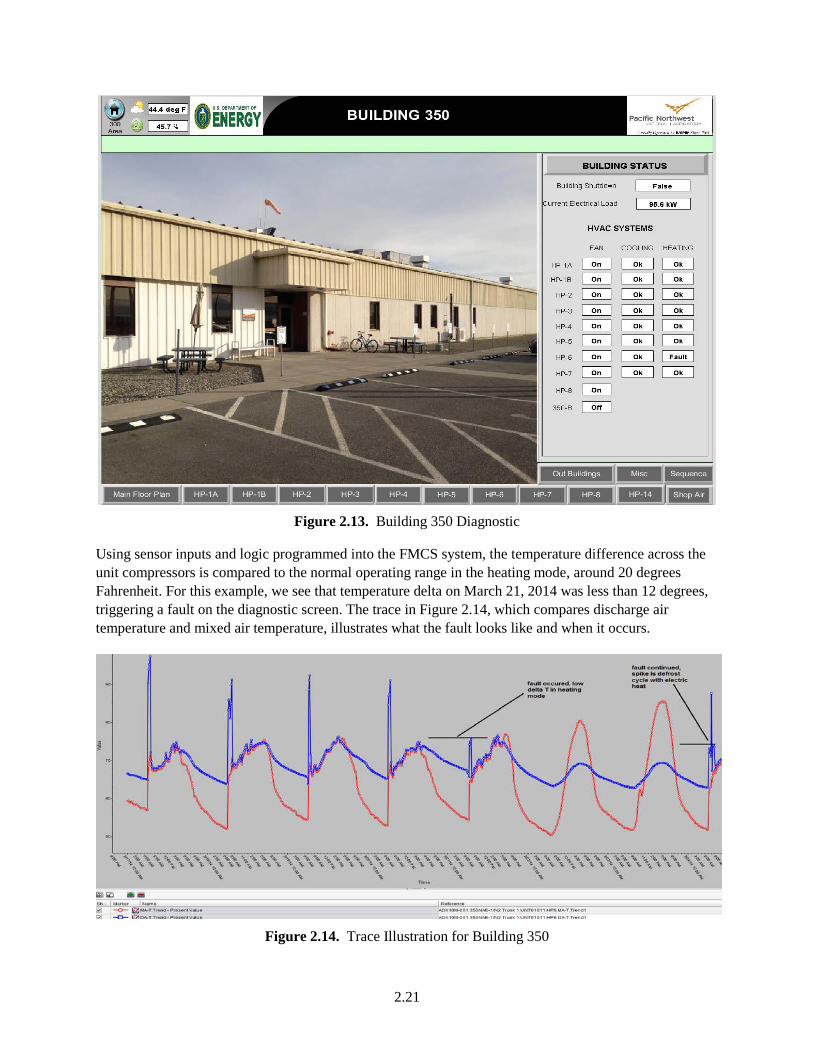
An example of analytics developed using metered data and the FMCS system is the new diagnostics summary page shown in Figure 2.13 below (Belew 2014b). Using this technique, it was discovered that one of the heat pump compressors at the 350 Building had failed and was using the more costly auxiliary strip heat. Mixed air and discharge air temperature sensors, part of the “smart sensor” suite, were utilized to diagnose this failure that would have otherwise gone unnoticed. Figure 2.13 shows a screenshot summary page developed to diagnose problems with the roof-top conditioning units at the 350 Building.
2.21
Figure 2.13. Building 350 Diagnostic
Using sensor inputs and logic programmed into the FMCS system, the temperature difference across the unit compressors is compared to the normal operating range in the heating mode, around 20 degrees Fahrenheit. For this example, we see that temperature delta on March 21, 2014 was less than 12 degrees, triggering a fault on the diagnostic screen. The trace in Figure 2.14, which compares discharge air temperature and mixed air temperature, illustrates what the fault looks like and when it occurs.
Figure 2.14. Trace Illustration for Building 350

2.22
The heating fault programming compares the two temperatures during the heating stage and generates a fault warning if the temperature difference is less than 15 degrees (Belew 2014b). This diagnostic is used to identify operational issues before impacting occupant comfort, reliability of the equipment, and before excessive energy and water costs are consumed.
2.10 Funding
Funding is necessary to maintain the equipment and staff, data collection, analysis, and reporting activities summarized in the Metering Plan. Funding for metering and associated activities is established in the annual Sustainability Program budget. Key implementations are outlined in the Sustainability Maintenance & Operations Program description and are divided into three categories—people, systems, and processes—from which the Metering Plan draws from all three. In the people category, the Metering Plan uses four key implementations: sustainability subject matter experts, sustainability engineer, facility energy manager, and utility data management specialist. Likewise, in the systems category, the Metering Plan feeds data into the FMCS in two ways: installation of strategic metering in support of goals and objectives, and maintenance, corrective actions, and upgrades for existing metering and data collection systems. Processes include PNNL’s preventative maintenance procedure outlined in ADM-008 (PNNL 2015a) and the BOCC procedure outlined in ADM-078 (PNNL 2015b).
While priorities are established and funding is set on a fiscal year basis, PNNL’s Sustainability Program maintains a nimble, agile approach. If unexpected opportunities arise during the year, the Sustainability Program remains poised to act and can adjust based on emerging needs.
2.11 Personnel
Metered energy and water data at PNNL is available to a broad audience on multiple platforms, including dashboards, as well as direct user access to energy tracking systems BuildingOS, EnergyCAP, Metasys, Portfolio Manager, and others. Researchers frequently analyze PNNL meter data as part of their research projects. Within the Sustainability and Energy Operations group at PNNL, the following key personnel analyze meter data as part of their responsibilities:
Marc Berman, Utility Program Manager. Marc has the responsibility to pay utility bills at PNNL and uses meter data to check accuracy and engineer splits to different groups served from the same system.
Shan Belew, Sustainability Engineer. Shan leads the BOCC, performing daily diagnostics on incoming data, and develops analytical tools to detect conditions outside of established acceptable parameters.
Tony Lechelt, Commissioning Engineer. Tony leads the in-house commissioning team and works with the air balance power operators to validate calibration of meters and sensors in existing buildings to ensure building automation system data is accurate and reliable.
Jason Pope, High Performance Sustainable Buildings and Metering Engineer. Jason leads the effort to install new data devices and integrate them into existing systems, as well as bring new energy tracking systems online. Jason also leads the campus HPSB effort for new and existing facilities, using meter data to verify energy consumption against modeled energy use to comply with Guiding Principles benchmarking requirements.
2.23
2.12 Green Button Data
The ability for customers to download detailed energy use using industry-led and standardized Green Button Data is not yet available to PNNL from its energy providers. Utility companies can participate in the Green Button Data program voluntarily. If this data source becomes available, PNNL will integrate the improved utility data into the EnergyCAP energy tracking system.
2.13 Meter Data Validation
Once meters are installed, it is important to validate the resulting data. Meter data should go through an initial validation and then be checked periodically as part of an ongoing validation effort.
• Initial: The initial performance validation of the meter involves comparing the meter data with billed data. Because billed data lags, the real-time metered data validation of a new whole-building meter can take several months.
– The absence of specific billed data for sub-meters (less than the whole-building level) makes validation more difficult. Expected totals as a result of engineering calculations designed to allocate a whole-building load to a more specific level are often used to compare with values yielded by sub-meters. Our experience with meter validation is that usually meters come correctly calibrated from the factory. Errors are almost exclusively attributed to an incorrect multiplier in the totalization phase, either by assuming an incorrect electric current transducer size, gas delivery pressure, or assigning an incorrect pulse value.
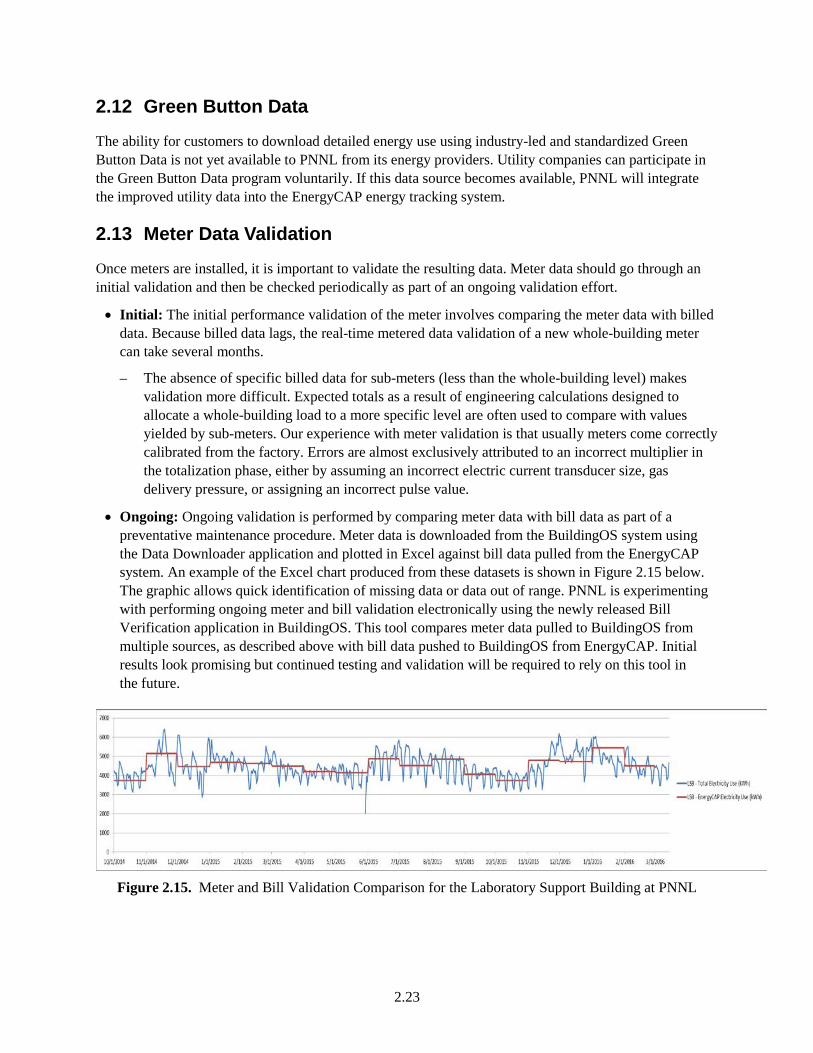
• Ongoing: Ongoing validation is performed by comparing meter data with bill data as part of a preventative maintenance procedure. Meter data is downloaded from the BuildingOS system using the Data Downloader application and plotted in Excel against bill data pulled from the EnergyCAP system. An example of the Excel chart produced from these datasets is shown in Figure 2.15 below. The graphic allows quick identification of missing data or data out of range. PNNL is experimenting with performing ongoing meter and bill validation electronically using the newly released Bill Verification application in BuildingOS. This tool compares meter data pulled to BuildingOS from multiple sources, as described above with bill data pushed to BuildingOS from EnergyCAP. Initial results look promising but continued testing and validation will be required to rely on this tool in the future.
Figure 2.15. Meter and Bill Validation Comparison for the Laboratory Support Building at PNNL

2.24
2.14 Meter and Sensor Data Uses
Meter data is collected across the campus and pulled into our primary energy tracking systems identified above. Once in the user-friendly formats these graphics and analytics platforms provide, data is available to a wide audience of scientists and engineers at PNNL and used for research projects, as well as enhanced operation of the facility. Some uses of meter data are discussed below.
2.14.1 Support of HPSB
In 2006, DOE signed the “Federal Leadership in High Performance and Sustainable Buildings Memorandum of Understanding,” along with 21 other agencies. Originally, the document committed DOE to follow the Guiding Principles for new construction and major renovations and was revised in 2008 to include transforming existing buildings into HPSBs. The Guiding Principles for sustainable existing buildings focuses on five topic areas:
• employ integrated assessment, operation, and management principles
• protect and conserve water
• enhance indoor environmental quality
• optimize energy performance
• reduce environmental impact of materials.
EO 13693 “Planning for Federal Sustainability in the Next Decade” (2015) requires that 15 percent of an agency’s existing buildings and leases meet the Guiding Principles by 2025. Additionally, EO 13693 requires agencies to make annual progress toward 100 percent of buildings meeting the Guiding Principles.
Metering at PNNL directly supports the effort to reach these goals. PNNL is exceeding this requirement, and has 36 percent of the FIMS buildings certified as HPSBs. Three of the five topic areas in the Guiding Principles require the use of meters and sensors. Requirements include meters to quantify the reduction of electricity, natural gas, and water; using meters to benchmark building performance; measuring and verifying building utility usage; and measuring the amount of renewable energy generated on site and fed back into the campus distribution system.
2.14.2 Track Progress Toward Energy and Potable Water Use Targets
As a DOE national laboratory, our energy and water use targets are clearly defined. PNNL contract clause H-43 requires reducing energy intensity by at least 25 percent by 2025 compared to a 2015 baseline. It also requires reducing potable water use by at least 36 percent by 2025 compared to a 2007 baseline. PNNL is working aggressively toward these energy and water reduction goals. The official energy and water reduction is calculated using bills tracked in the EnergyCAP system. The time lag between when energy is consumed and when the bill is received and entered into the EnergyCAP system for analysis was often too long to be useful to those making operation decisions affecting energy use. Using installed advanced meters and energy tracking system BuildingOS, the operations staff at PNNL has a real-time indication of building energy use and can see effects of operational decisions immediately.

2.25
2.14.3 Support of ASHRAE Analysis
Metering at PNNL supports ASHRAE Standard 55, Thermal Environmental Conditions for Human Occupancy analyses performed on campus buildings as part of the HPSB effort. Compliance with ASHRAE Standard 55 is a requirement to meet the Enhance Indoor Environmental Quality Guiding Principle. To perform the analysis, permanently mounted temperature sensors located throughout the building are used. Typically 10 sensors in varying locations, on the perimeter and interior, and on each floor, are chosen for examination. One year’s worth of data at each sensor measured every 15 minutes during operating hours is analyzed—about 115,000 measurements. The data points are plotted and compared to the minimum and maximum acceptable temperatures of 68 and 81 degrees Fahrenheit. As shown in Figure 2.16, 1 year of data is plotted from a sensor in the Laboratory Support Building (LSB). Data points from all 10 sensors examined in this building were in the acceptable range 99.70 percent of the time, with no individual sensor being in the acceptable range less than 98.26 percent of the time. Using this method, we determined that all of the spaces analyzed in the LSB exhibited acceptable thermal environmental conditions.
Figure 2.16. Sample Trace Showing 1 Year of Temperature Data in LSB Room 2D01
2.14.4 Support of Facility Use Agreement for Temperature Compliance
Metering at PNNL also supports the effort to verify temperature conditions are consistent with those outlined in the Facility Use Agreement, an agreement that formally captures the physical attributes of the facility and operational boundaries, among other things. This agreement is between the F&O Directorate and the directorates performing research in each building. Permanently mounted temperature sensors are used to create temperature maps that are monitored in the BOCC. As shown in Figure 2.17, temperatures in the Sigma II office building are displayed and spaces are color-coded to indicate temperatures in relation to the set point. Temperature maps indicate which conditioning zone each space is in to aid in troubleshooting hot or cold spots.

2.26
Figure 2.17. Sigma II Office Temperature Map
2.14.5 Support of Industrial, Landscaping, and Architecture Management
Metering at PNNL supports the contractual goal of a 30 percent reduction of industrial, landscaping, and agriculture (ILA) water usage by 2025 from the 2010 baseline. Installation of water sub-meters measuring ILA water use at PNNL began in 2013. Prior to the installation of ILA meters, irrigation water use was estimated by prorating based on area for facilities fed from the only existing master meter and by using standard assumptions to estimate use for facilities with no meter installed. ILA sub-meters have been installed at the PSF complex, which includes buildings 3410, 3420, 3425, 3430, and 3440; the combined grounds for ISB1 and ISB2; the combined grounds for the National Security Building and Environmental Technology Building; at the User Housing Facility; EMSL; and at Biological Sciences Facility and CSF, where two meters are summed to provide the total for these facilities. The meter chosen for these applications is the McCrometer propeller with local display. Additional meters are planned for installation along Battelle Boulevard to measure water use south of the core campus. ILA metering allows PNNL to benchmark irrigation intensity at different facilities across the campus to identify areas that may be over-irrigated. Meters are used to trend irrigation use to identify higher than normal consumption and track progress toward the campus reduction goal.

2.27
2.14.6 Support of EISA Audit and Commissioning
Section 432 of EISA (2007) requires comprehensive energy and water evaluations performed for all designated “covered facilities” at each federal agency. Covered facilities are identified as all buildings comprising at least 75 percent of the each federal sites total energy usage. Covered facilities at PNNL are EMSL, 331, 325, CSF, Biological Sciences Facility, PSF 3430, PSF 3420, PSF 3410, Physical Sciences Laboratory, 3820, and Life Science Laboratory II. Together, these 11 facilities used 75 percent of the total PNNL site energy.
EISA evaluations consist of performing energy/water audits and commissioning assessments on a 4-year cycle for each covered facility. The energy/water audits and commissioning assessments can be performed separately using qualified in-house staff members and/or contracted with private sector auditors and commissioning agencies. The PNNL Sustainability Program is responsible for the implementation, completion, and reporting for all EISA requirements.
EISA requires an energy/water audit similar to a Level 1 ASHRAE energy audit, which consists of an initial building walkthrough and identification of ECMs. Targeted systems audited include:
• Building Envelope
• Water Usage
• Electrical Usage
• Interior/Exterior Lighting.
Test procedures resulting from EISA and HPSB commissioning assessments provide the foundation for an optimized commissioning strategy using portable technology coupled with the metering capabilities monitored in the BOCC, along with an in-house staff to maintain efficient building performance as a real-time commissioning strategy to ensure optimized building performance (Lechelt 2014). Metering at PNNL supports the EISA audit process, specifically, by supplying data for the electrical and water usage analyses.

3.1
3.0 Conclusion
The Sustainability Program has been successful in meeting contractual energy and water metering goals, as well as submitting this Metering Plan as one of the three program deliverables. With the effort toward meter installations complete, we are focused on improving analytics and diagnostics using meter and sensor data in our energy tracking systems. PNNL will continue to strive to meet the energy and water reduction challenges. The Metering Plan will be updated, as needed, as the PNNL building portfolio changes.
With the program established, metering at PNNL is on solid ground, consistently delivering reliable data for benchmarking, analysis, and troubleshooting. As efforts lean toward new challenges, our goal of environmental stewardship will never cease or go out of focus. The core goals of metering at PNNL—to provide accurate data, analyze that data, and provide actionable recommendations for real-time decisions—are the mileposts along the road to reductions in building energy and water use and greenhouse gas emissions.

4.1
4.0 References
ASHRAE—American Society of Heating, Refrigerating and Air-Conditioning Engineers. 2004. Standard 55-2004, Thermal Environmental Conditions for Human Occupancy. ASHRAE, Atlanta, GA.
Belew S. 2014a. Facilities and Operations Blueprint for the Building Operations Control Center. PNNL-23989, Pacific Northwest National Laboratory, Richland, WA.
Belew S. 2014b. “Case Study – Why Diagnostics are Important to F&O.” Pacific Northwest National Laboratory, Richland, WA.
DOE—U.S. Department of Energy. 2014. Federal Building Metering Guidance (per 42 U.S.C. §8253[e], Metering of Energy Use). U.S. Department of Energy, Washington, D.C. November Update.
EISA—Energy Independence and Security Act of 2007. Public Law 110-140 as amended, Section 434(b).
EO—Executive Order 13693. 2015. “Planning for Federal Sustainability in the Next Decade.” Signed March 19.
EPA—U.S. Environmental Protection Agency. 2012. “Portfolio Manager® Overview.” ENERGY STAR® website. Accessed July 1. Available at http://www.energystar.gov/index.cfm?c=evaluate_performance.bus_portfoliomanager
EPAct—Energy Policy Act of 2005. Public Law 109-58, U.S. Department of Energy, Washington D.C.
Hooke JH, BJ Landry, and D Hart. 2009. Achieving Improved Energy Efficiency: A Handbook for Managers, Engineers and Operational Staff. Natural Resources Canada: Energy Management Information Systems. Given date modified April 22, 2009; accessed July 1, 2012. Available online at http://oee.nrcan.gc.ca/publications/industrial/EMIS/8569.
Lechelt A. 2014. “RT-Cx Proposal.” Pacific Northwest National Laboratory, Richland, WA.
PNNL—Pacific Northwest National Laboratory. 2013. F&O Administrative Procedure ADM-CM-057, PG-01, Engineering Design Standards. Rev. 1. Pacific Northwest National Laboratory, Richland, WA. September 26.
PNNL—Pacific Northwest National Laboratory. 2014. Project Management Plan for the F&O SMART3 Initiative. PNNL-Internal Only, Pacific Northwest National Laboratory, Richland, WA. February.
PNNL—Pacific Northwest National Laboratory. 2015a. F&O Preventive Maintenance Standard ADM-008, Appendix PS-021, Whole Building Meters. Rev. 0. Pacific Northwest National Laboratory, Richland, WA. March 5.
PNNL—Pacific Northwest National Laboratory. 2015b. F&O Preventive Maintenance Standard ADM-078, Building Operations Control Center (BOCC). Rev. 0. Pacific Northwest National Laboratory, Richland, WA. March 5.

4.2
Pope JE. 2012. Metering Plan: Monitoring Energy and Potable Water Use in PNNL EMS4 Buildings. PNNL-21572, Pacific Northwest National Laboratory, Richland, WA.
Pope JE. 2014. Metering Plan: Informed Decision Making Through Measuring and Monitoring of Utility Resource Consumption. PNNL-23494, Pacific Northwest National Laboratory, Richland, WA.
Pope JE. 2015. Metering Plan: Enhanced Operations Through Measuring and Monitoring of Utility Resource Consumption. PNNL-24501, Pacific Northwest National Laboratory, Richland, WA.
Pope JE. NJ Olson, MJ Berman, and DR Schielke. 2011. Advanced Metering Plan for Monitoring Energy and Potable Water Use in PNNL EMS4 Buildings. PNNL-20617, Pacific Northwest National Laboratory, Richland, WA.