Embed Size (px)
Citation preview
Important notes • These slides show some figures and videos prepared by Robert G.
Fovell (RGF) for his “Meteorology” course, published by The Great Courses (TGC). Unless otherwise identified, they were created by RGF.
• In some cases, the figures employed in the course video are different from what I present here, but these were the figures I provided to TGC at the time the course was taped.
• These figures are intended to supplement the videos, in order to facilitate understanding of the concepts discussed in the course. These slide shows cannot, and are not intended to, replace the course itself and are not expected to be understandable in isolation.
• Accordingly, these presentations do not represent a summary of each lecture, and neither do they contain each lecture’s full content.
2

3
Animations linked in the PowerPoint version of these slides may also be found here: http://people.atmos.ucla.edu/fovell/meteo/

Beach example with moisture (again)
4
At 4 km, dry parcel is colder than environment but saturated parcel is warmer

Li#ingaparceltosatura1on
5
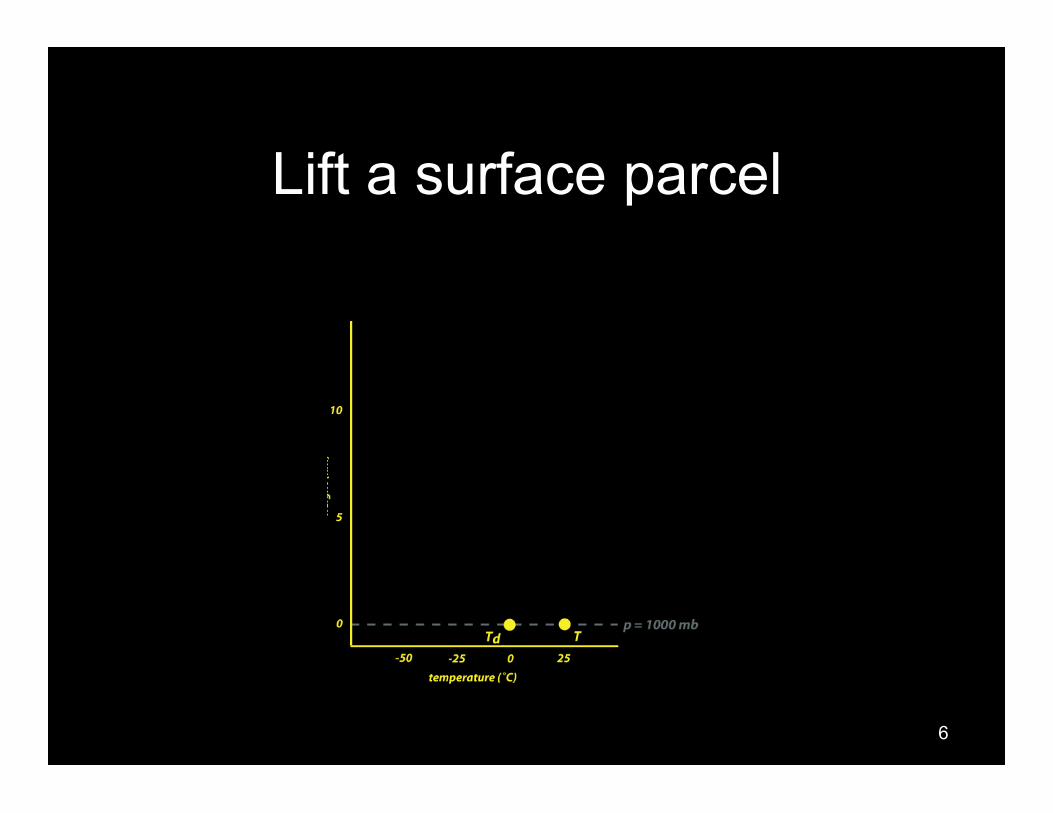
Lift a surface parcel
6

Lift a surface parcel
7
Lift a surface parcel
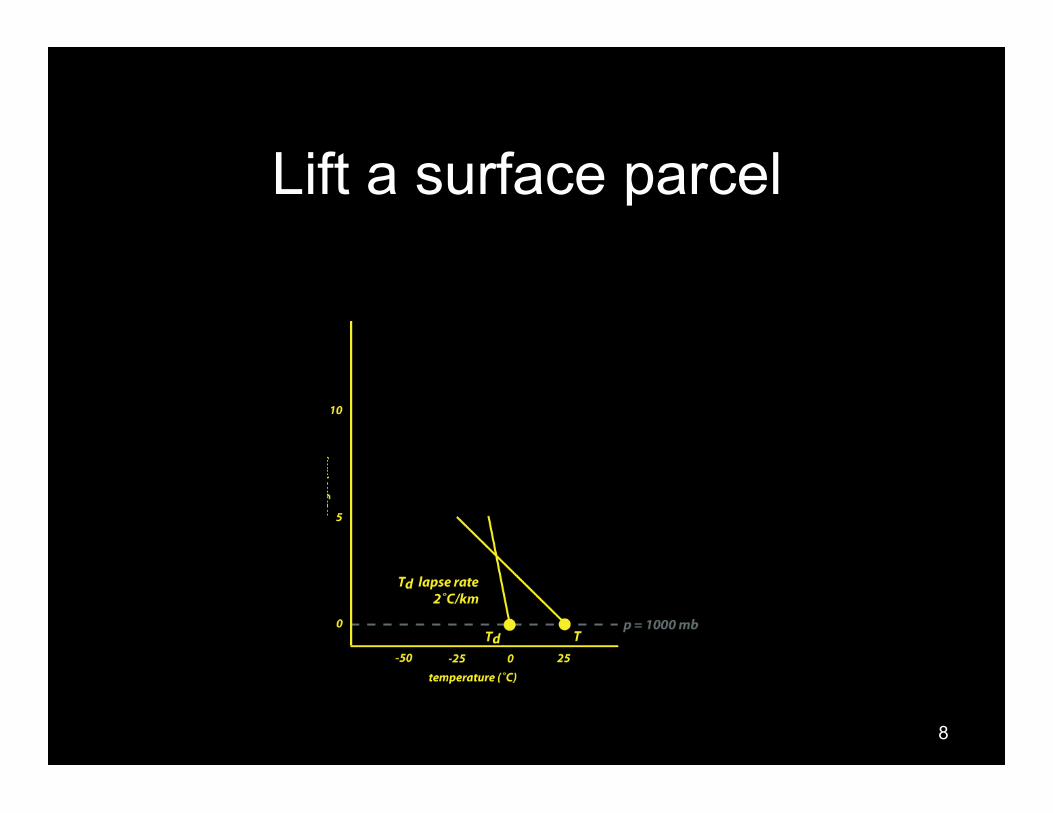
8

Lift a surface parcel
9
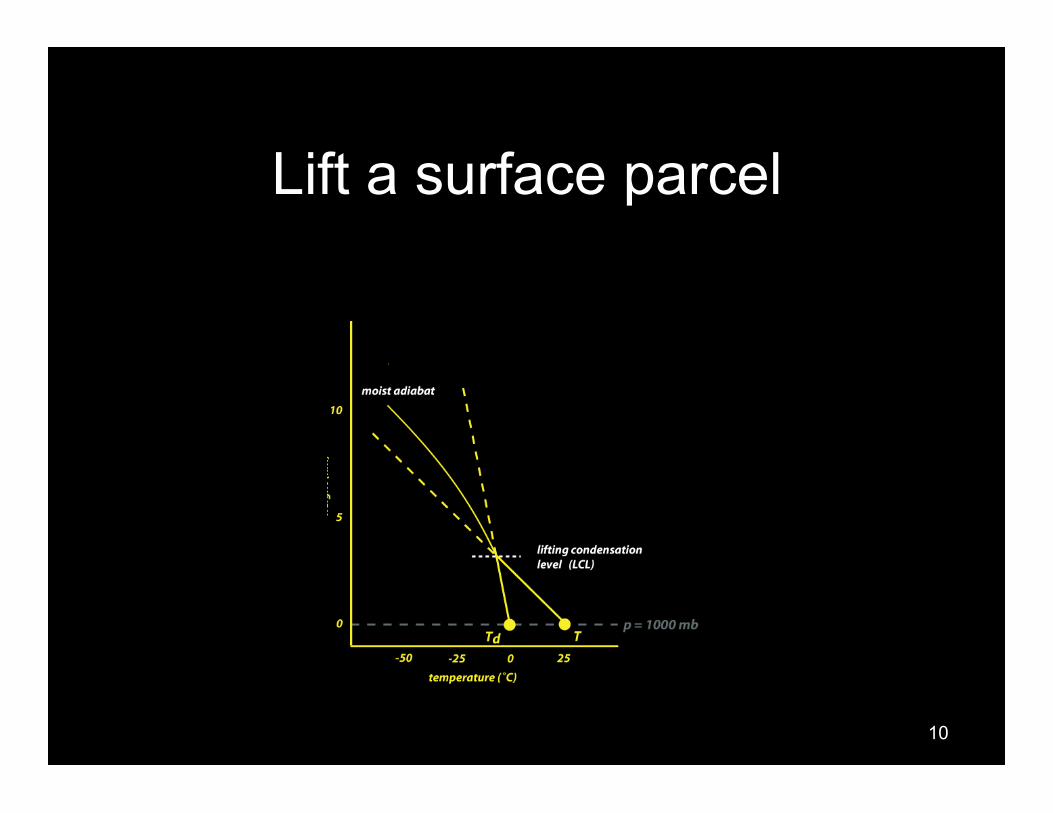
Lift a surface parcel
10
Li#ingaparceloveramountain
11

Parcel reaches mountain top
12
Say this parcel was pushed up a mountainside. It has saturated on the way up, forming a cloud.
It has reached the mountain top. Now what does it do?

Li#asubsaturatedparcel
13
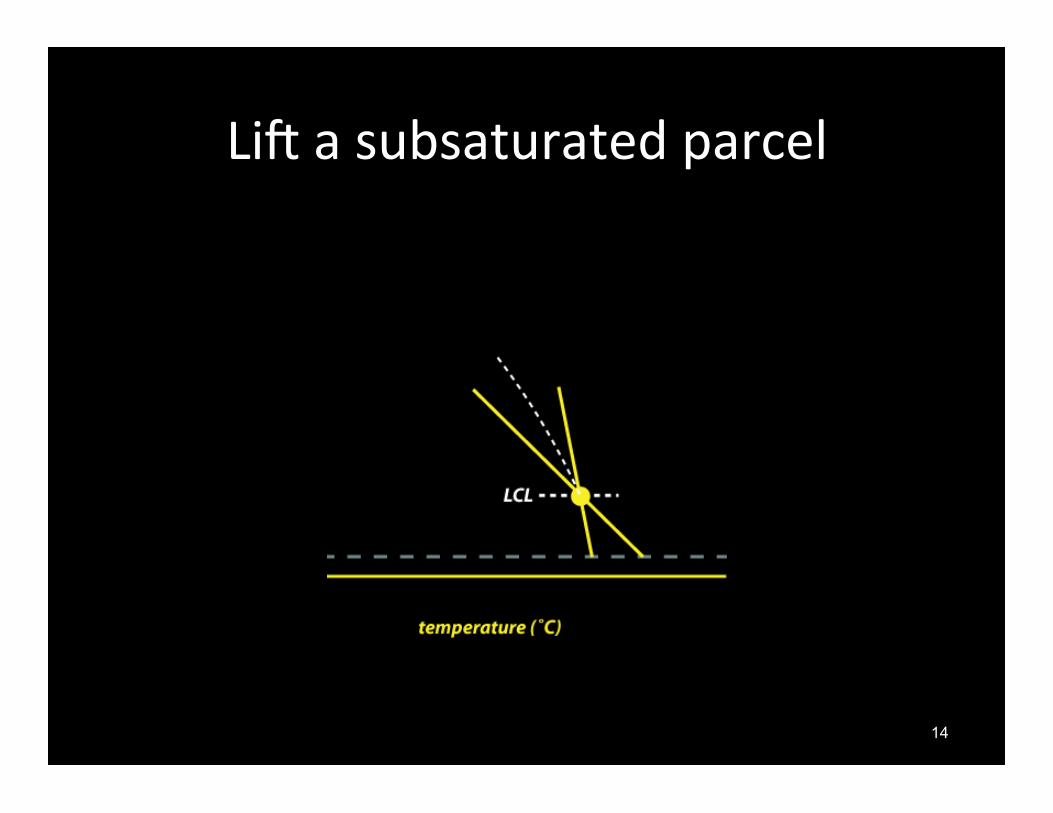
Li#asubsaturatedparcel
14

Li#asubsaturatedparcel
15

Li#asubsaturatedparcel
16
The parcel is warmer than it would have been had it remained subsaturated.

Li#asubsaturatedparcel
17

Li#asubsaturatedparcel
18
Now we compare the parcel to its surrounding environment.

Li#asubsaturatedparcel
19
The parcel is colder (more dense), so it falls back down the lee side.

Allrain,nocloud
20
What if we lost all the condensation that former? (All rain, no cloud)

Allrain,nocloud
21
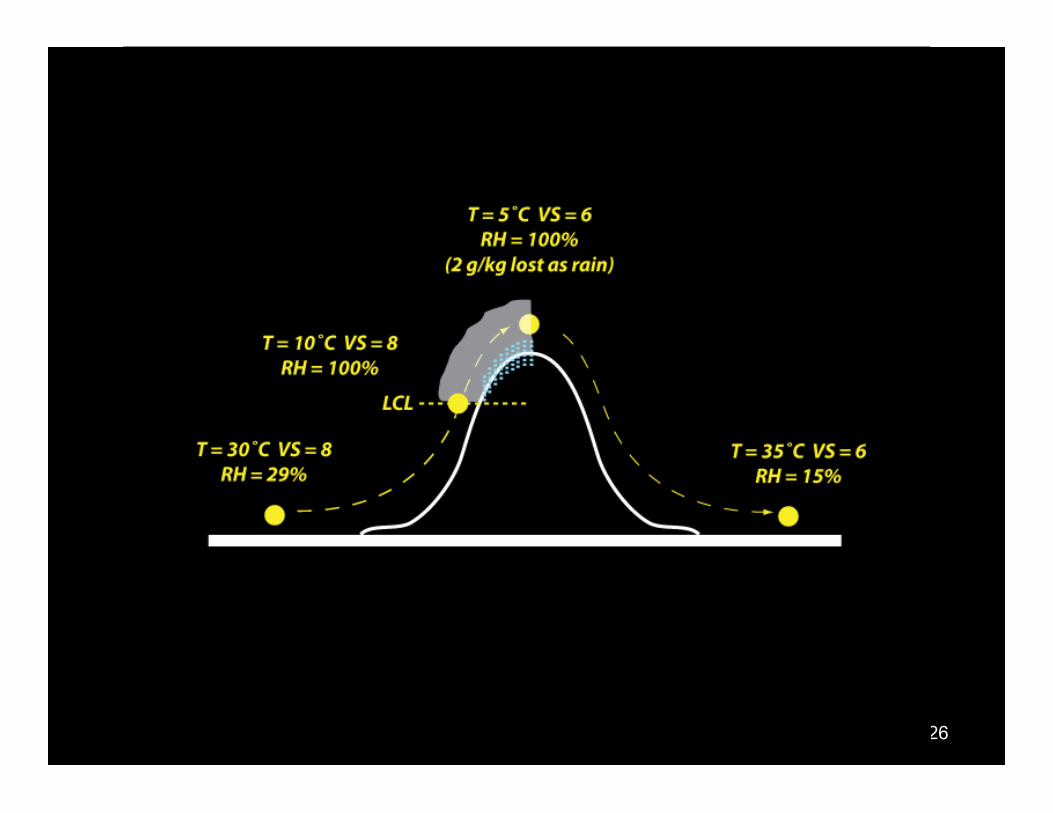
The parcel descends as subsaturated, becoming hotter and drier on the lee side

Anexampleusingnumbers
22
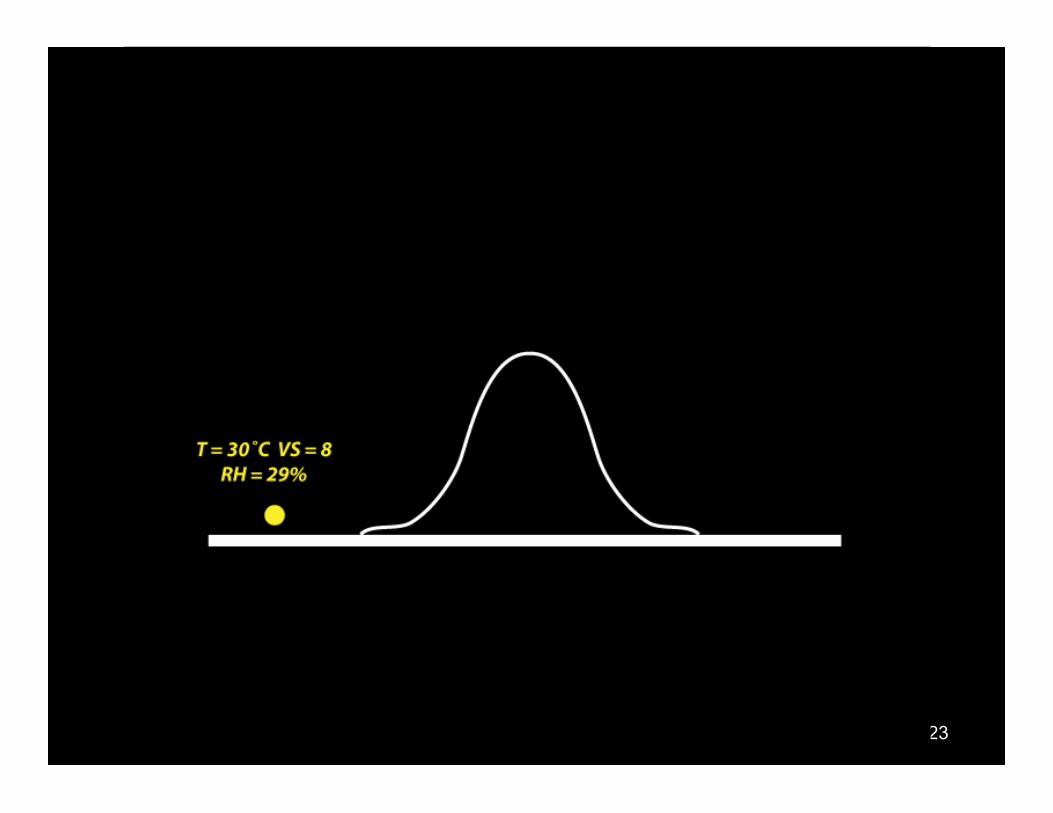
A parcel starts on the windward side of a 3 km mountain. It is subsaturated, with T 30C and 8 g/kg vapor.
VC of this air is 28 g/kg, so the RH is 29%
23
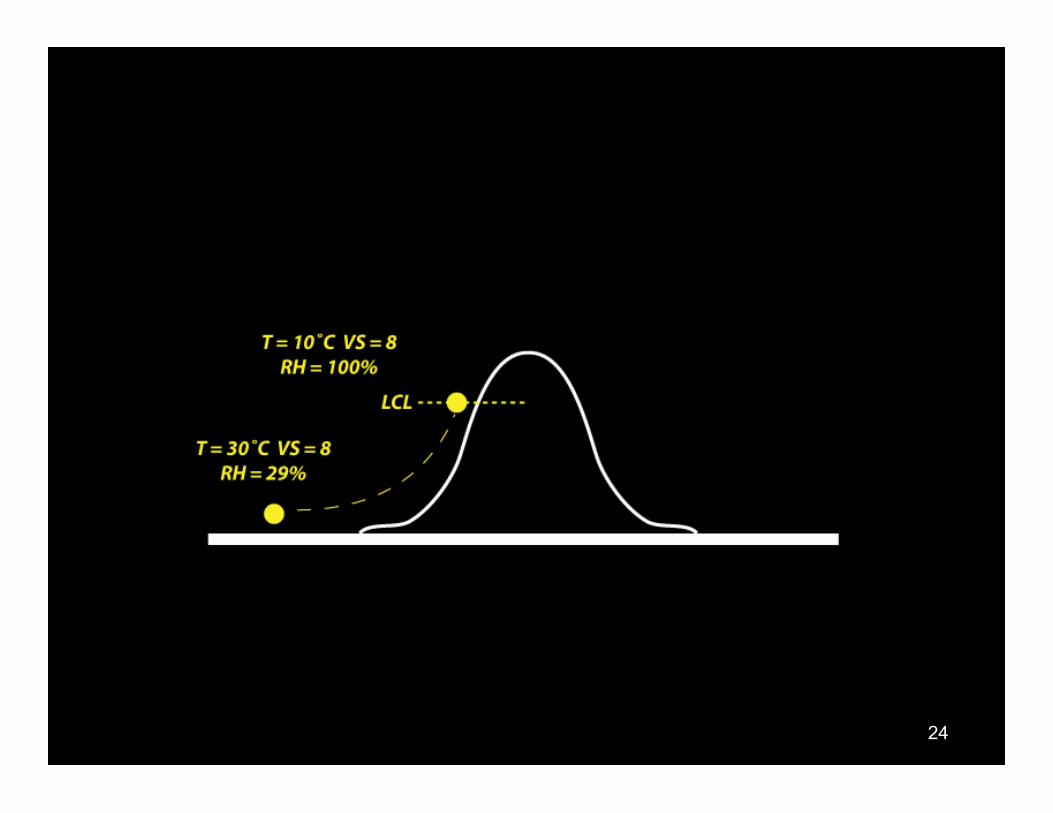
Dry adiabatic ascent saturates the parcel after 2 km of lift. During that time, the T cools to 10C and the VC decreases to 8 g/kg,
matching its VS, so the RH is 100%. We’re at cloud base
24

For the final 1 km to the summit, the parcel cools at the MALR, so the T drops to 5C. Its VC is about 6, so 2 g/kg was irretrievably
lost as rain. Note we’re 3 km above our starting and ending points
25
For the final 1 km to the summit, the parcel cools at the MALR, so the T drops to 5C. Its VC is about 6, so 2 g/kg was irretrievably
lost as rain. Note we’re 3 km above our starting and ending points
26

Instability
27

A “sounding” with potential instability
• A thunderstorm sounding (vertical profile of T, TD and other properties)
• Despite starting off subsaturated & struggling, a surface parcel can become positively buoyant given sufficient lifting…
28

A “sounding” with potential instability
• Lift a surface parcel to saturation
• It’s COLDER than its surrounding environment
• It’s negatively buoyant
29

A “sounding” with potential instability
• Once saturated,, the parcel follows the moist adiabat
• Look at its new path • It’s catching up to the
environmental temperature…
• Despite its initial disadvantage, this parcel actually manages to become WARMER than its surroundings!
30
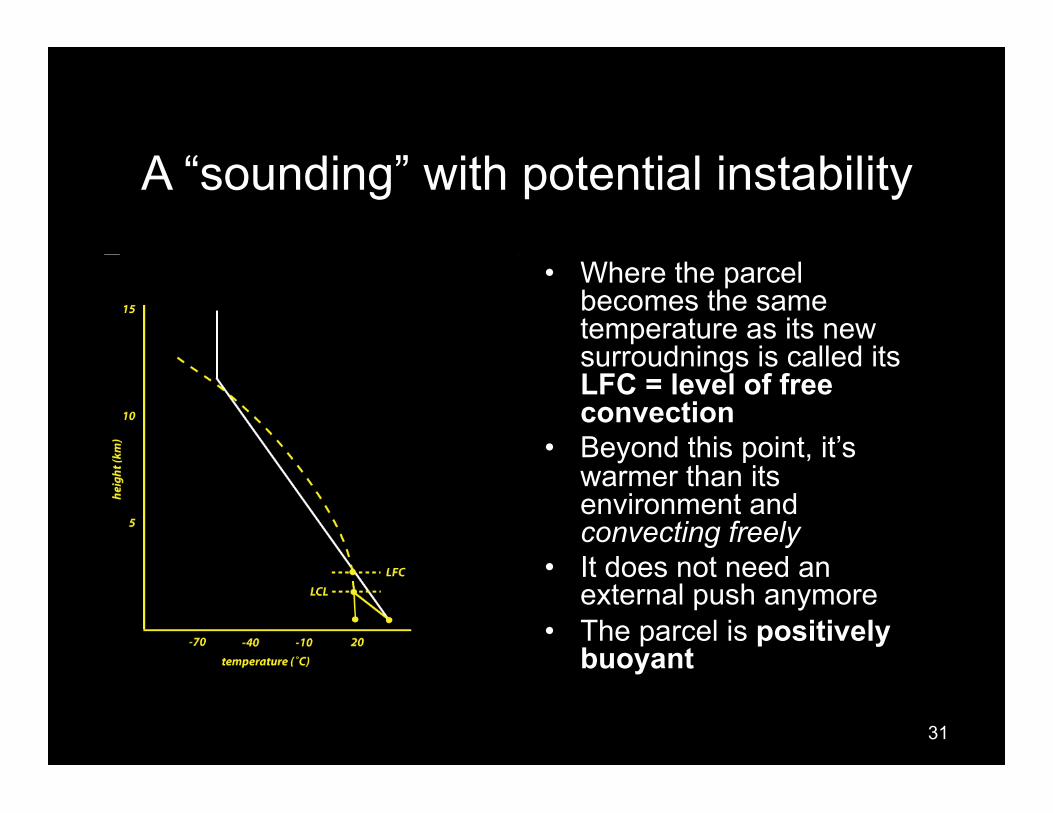
A “sounding” with potential instability
• Where the parcel becomes the same temperature as its new surroudnings is called its LFC = level of free convection
• Beyond this point, it’s warmer than its environment and convecting freely
• It does not need an external push anymore
• The parcel is positively buoyant
31

A “sounding” with potential instability
• From here, the sky’s the limit! • Or the tropopause, which
usually comes first • The rising parcel eventually
exhausts its supply of water vapor…
• It also approaches the stratosphere, a region of high stability
• Eventually it becomes the same temperature as its surroundings again, its EQL or equilibrium level
32

A “sounding” with potential instability
• Another term for EQL is cloud top
• It’s our first guess at cloud top
• I’ve drawn cloud top at a little above the EQL, since the rising parcel can overshoot it a little
33

Summaryfigure
34

CAPEandCIN
35
CAPEandCIN
36
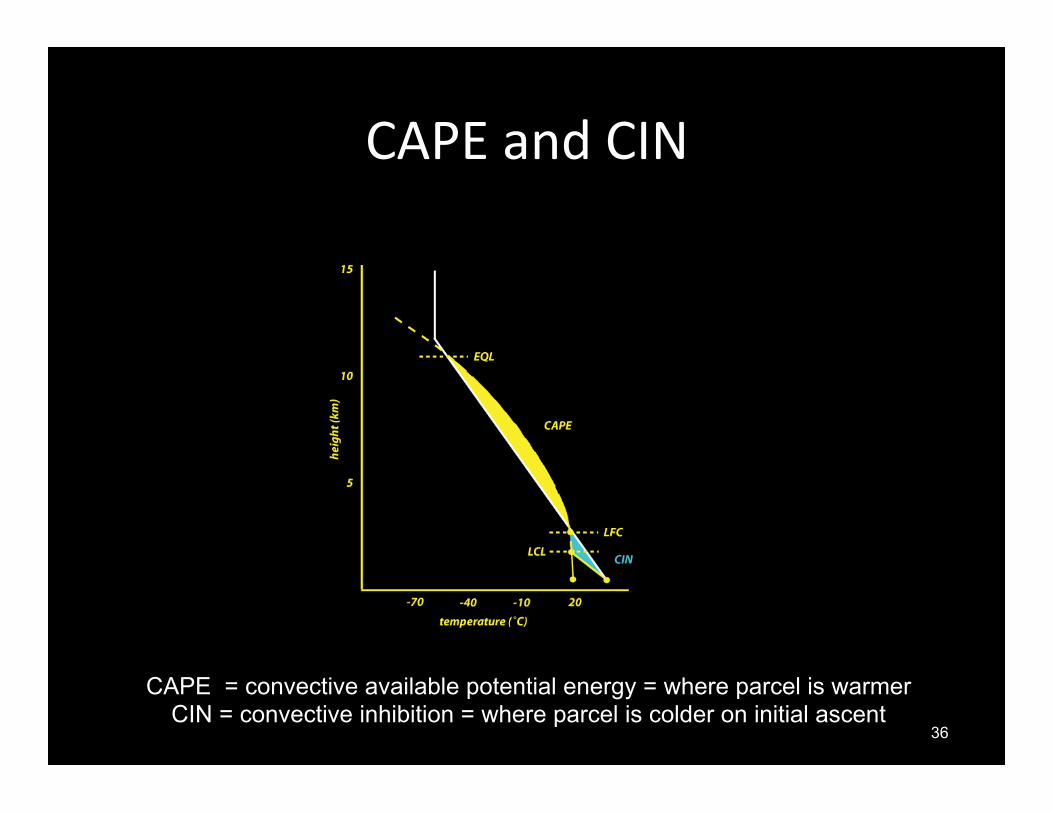
CAPE = convective available potential energy = where parcel is warmer CIN = convective inhibition = where parcel is colder on initial ascent

37
• Theamountofli#ingavailablecanmakeanenormousdifferenceintheweatherthathappensonagivenday

Sea-breezethunderstorms
38
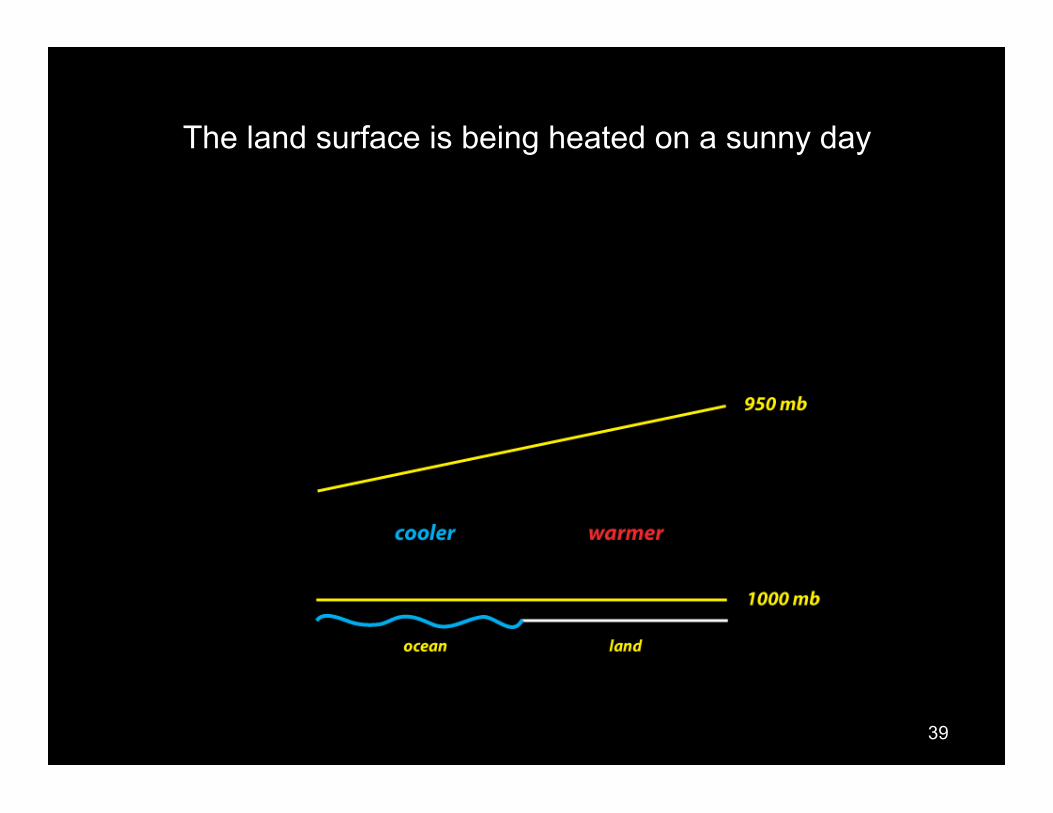
The land surface is being heated on a sunny day
39

A circulation starts, and cool marine air starts pushing inland
40

41
Air with different densities resist mixing, and may result in lifting the less dense air to saturation, perhaps creating thunderstorms
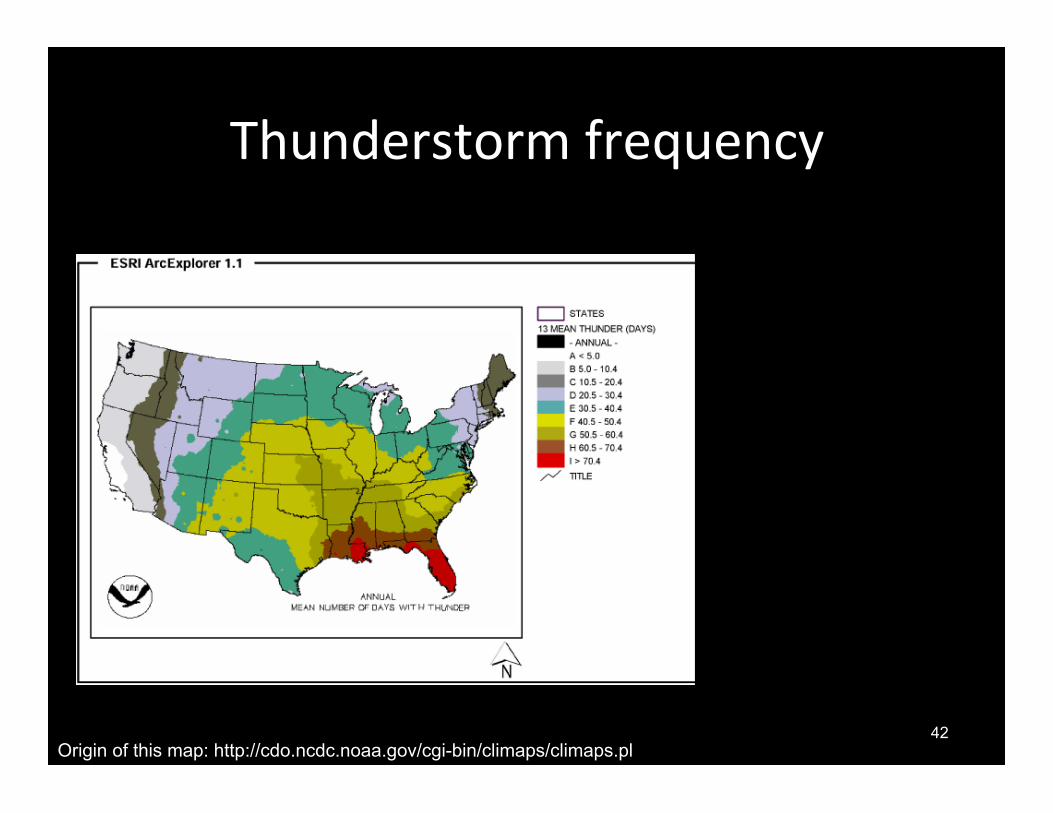
Thunderstormfrequency
42 Origin of this map: http://cdo.ncdc.noaa.gov/cgi-bin/climaps/climaps.pl
43
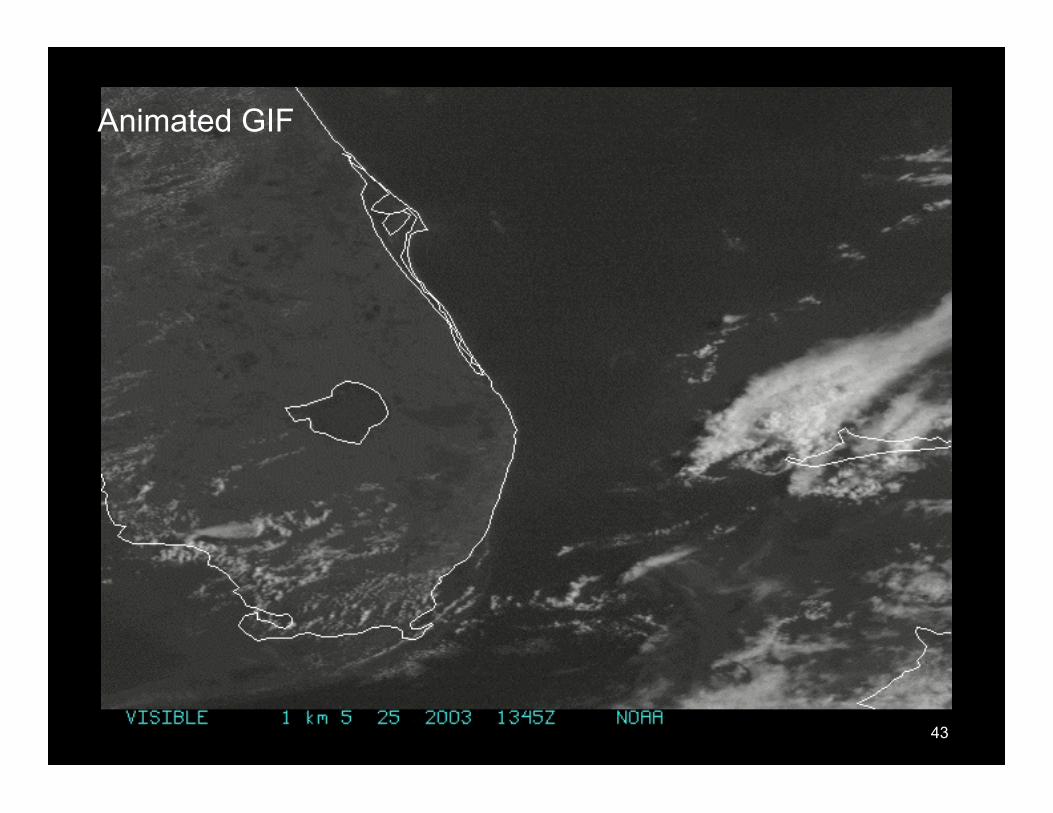
Animated GIF

This is the image for 9:45 AM Eastern Daylight Time. Remember, meteorologists use London time, that’s why the image is
Marked 1345Z. It’s 1:45 PM London Standard Time.
44
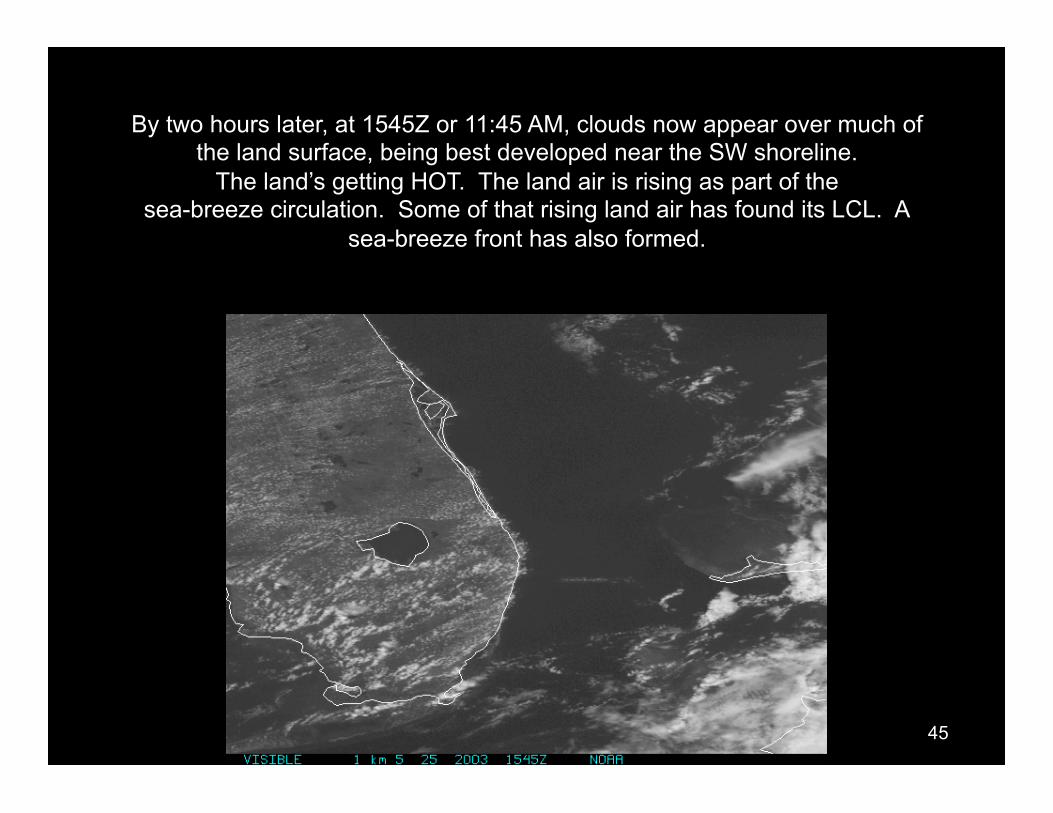
By two hours later, at 1545Z or 11:45 AM, clouds now appear over much of the land surface, being best developed near the SW shoreline.
The land’s getting HOT. The land air is rising as part of the sea-breeze circulation. Some of that rising land air has found its LCL. A
sea-breeze front has also formed.
45

Close up of the clouds over land. “Roll clouds”.
46
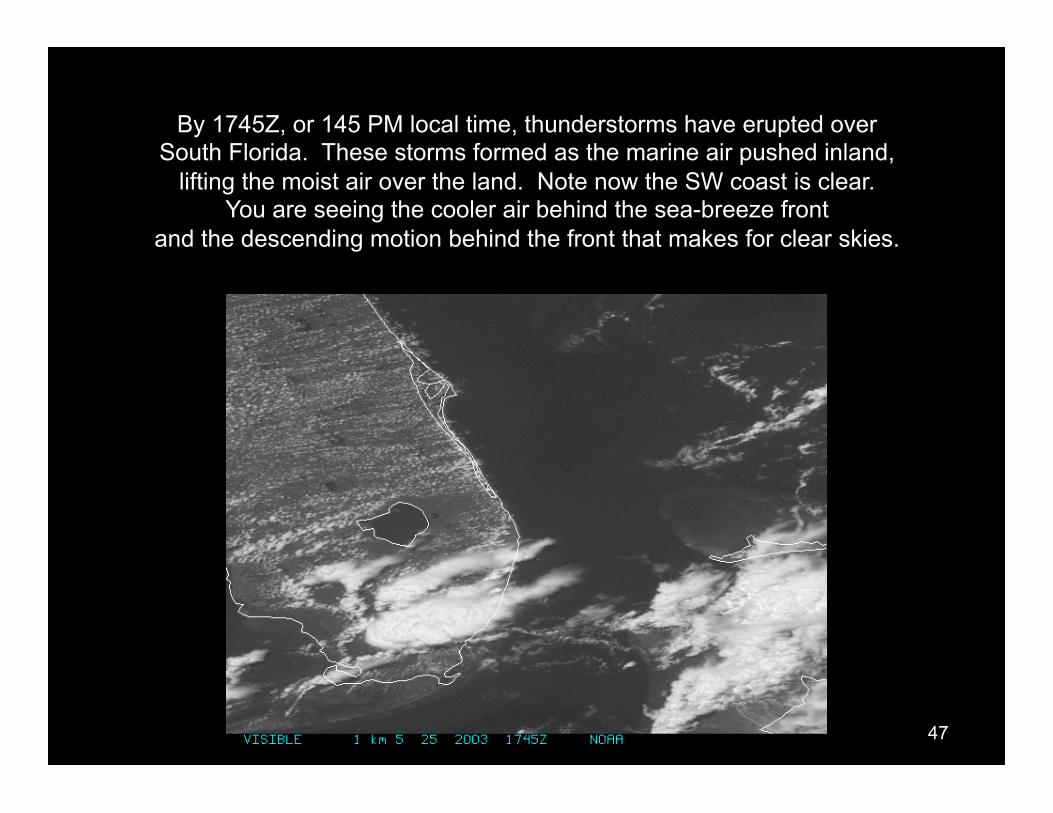
By 1745Z, or 145 PM local time, thunderstorms have erupted over South Florida. These storms formed as the marine air pushed inland,
lifting the moist air over the land. Note now the SW coast is clear. You are seeing the cooler air behind the sea-breeze front
and the descending motion behind the front that makes for clear skies.
47

Note the roll clouds over Central Florida are now better developed. Second, notice the roll clouds everywhere
except over Lake Okeechobee. The lake is not as strongly heated.
48

Rollclouds
(IncludessomematerialIdidn’tgettointhislecture)
49

Roll cloud development • Our environmental
temperature profile at some time in the morning.
• Note we’re only looking
at the lowest 1.5 km or 1 mi above the surface
• Make a subsaturated
parcel of surface air.
50
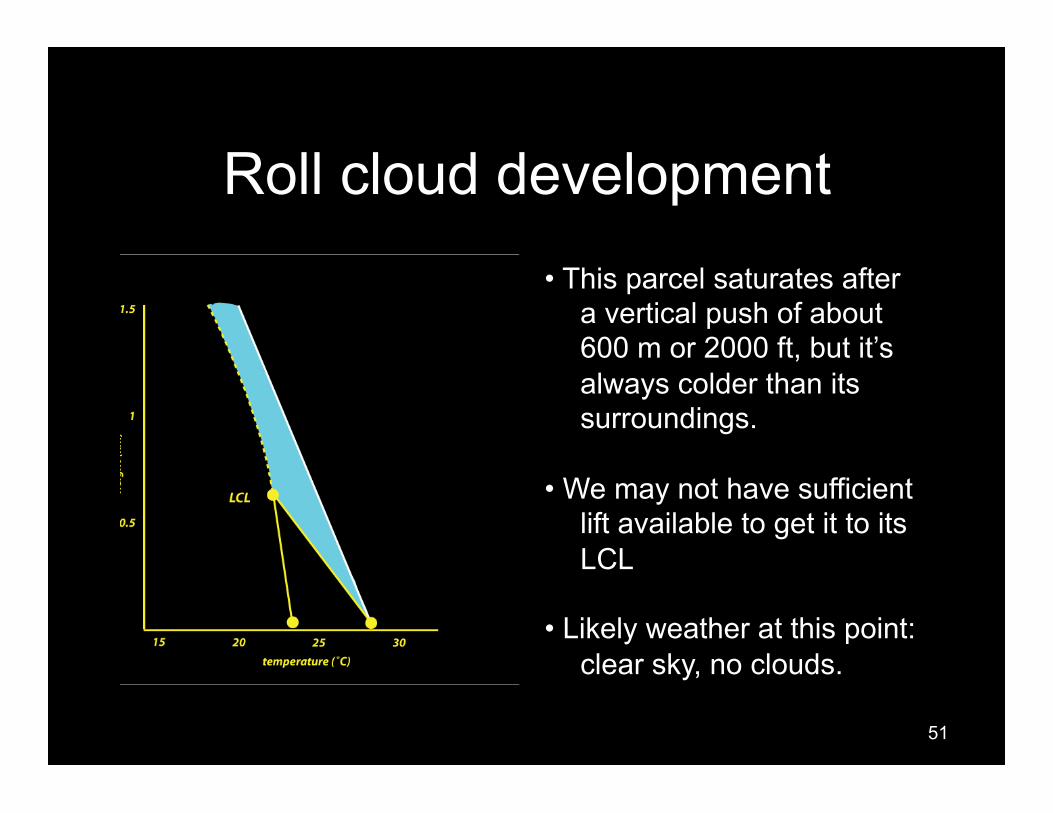
Roll cloud development • This parcel saturates after
a vertical push of about 600 m or 2000 ft, but it’s always colder than its surroundings.
• We may not have sufficient
lift available to get it to its LCL
• Likely weather at this point:
clear sky, no clouds.
51
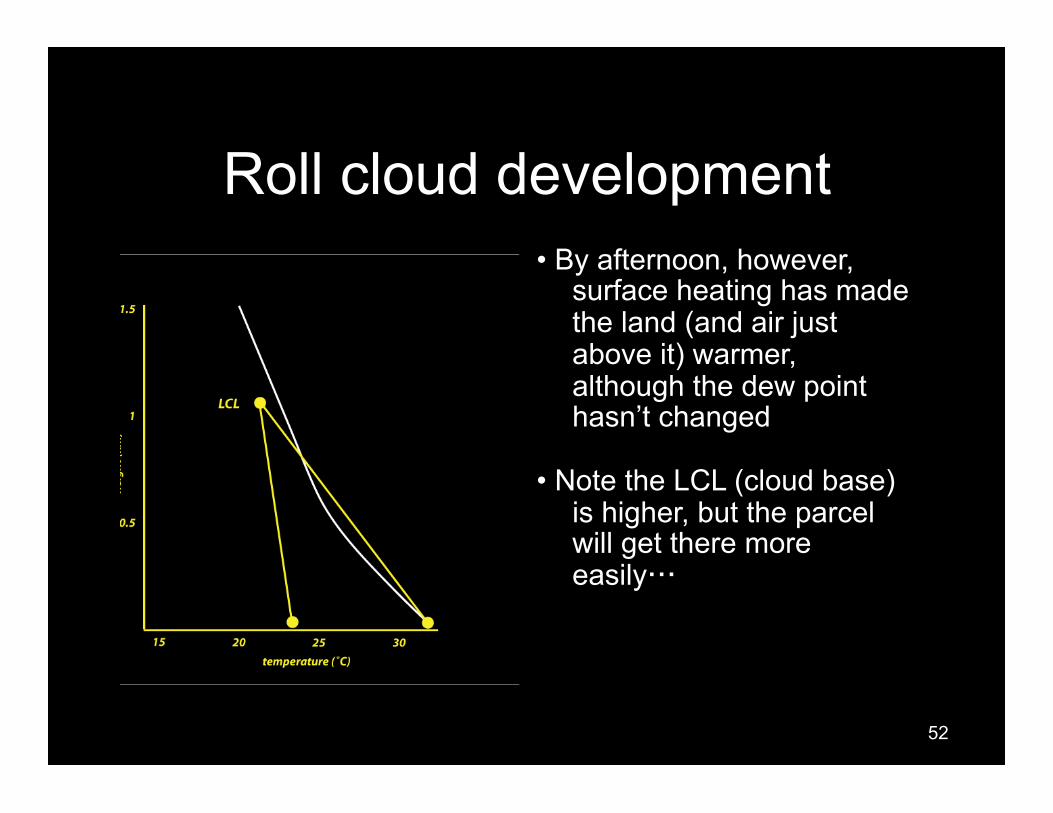
Roll cloud development • By afternoon, however,
surface heating has made the land (and air just above it) warmer, although the dew point hasn’t changed
• Note the LCL (cloud base)
is higher, but the parcel will get there more easily…
52
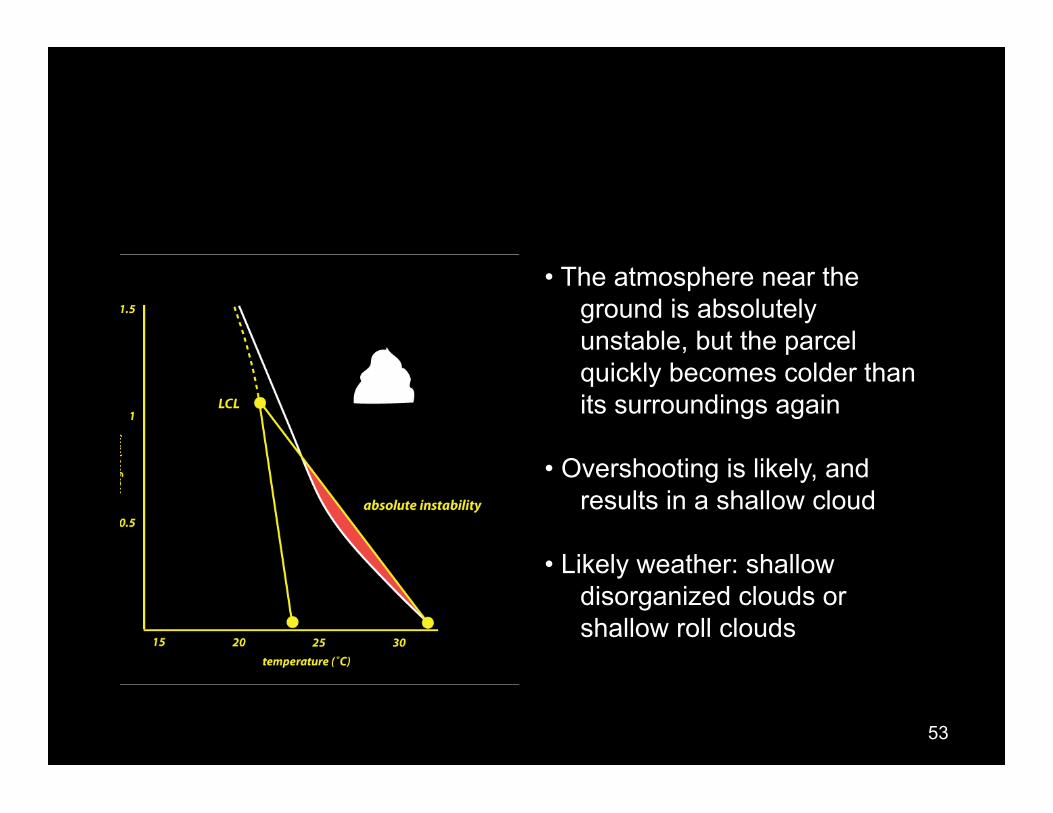
• The atmosphere near the ground is absolutely unstable, but the parcel quickly becomes colder than its surroundings again
• Overshooting is likely, and
results in a shallow cloud • Likely weather: shallow
disorganized clouds or shallow roll clouds
53

54
Roll cloud development in a numerical model.
Animated GIF
55
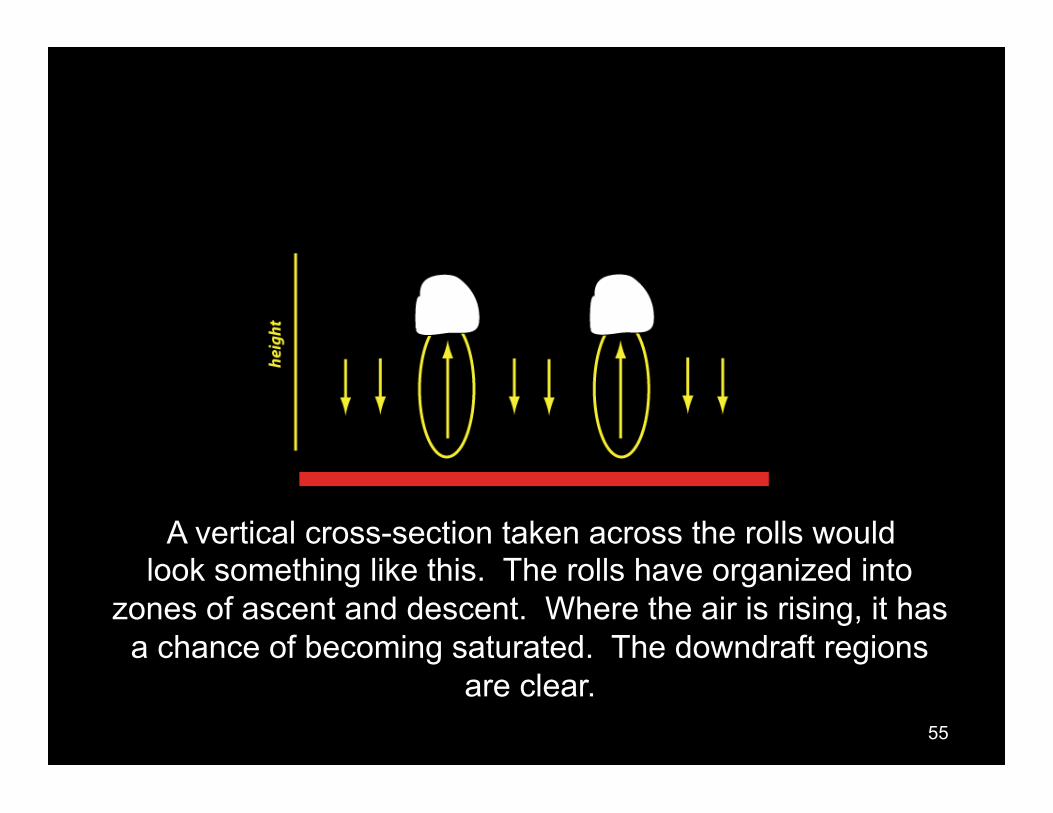
A vertical cross-section taken across the rolls would look something like this. The rolls have organized into
zones of ascent and descent. Where the air is rising, it has a chance of becoming saturated. The downdraft regions
are clear.
56
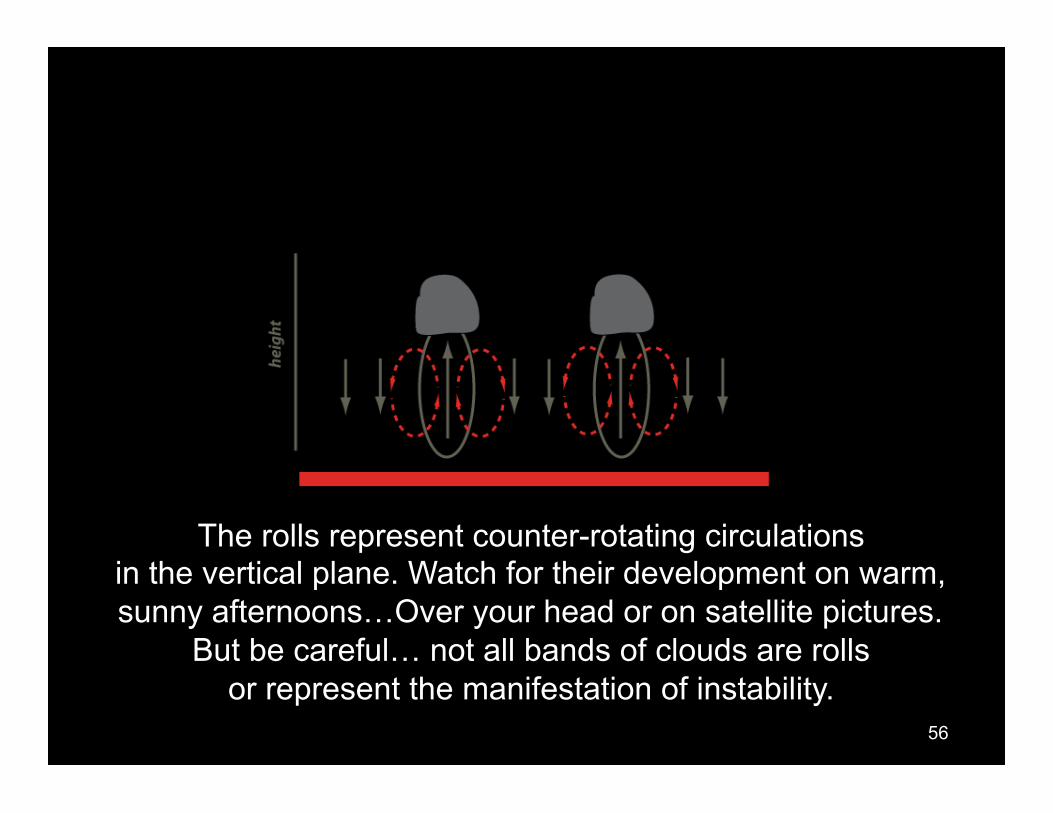
The rolls represent counter-rotating circulations in the vertical plane. Watch for their development on warm, sunny afternoons…Over your head or on satellite pictures.
But be careful… not all bands of clouds are rolls or represent the manifestation of instability.

57
[end]