Embed Size (px)
Citation preview
Meteorological Support in Scientific Ballooning
Chris Schwantes & Robert MullenaxMeteorologists
Orbital ATK / Columbia Scientific Balloon FacilityPalestine, TX
https://ntrs.nasa.gov/search.jsp?R=20170004619 2018-09-11T22:05:18+00:00Z
Overview
• The weather affects every portion of a scientific balloon mission, from payload integration to launch, float, and impact and recovery.
• Forecasting for these missions is very specialized and unique in many aspects.
• CSBF Meteorology incorporates data from NWS/NCEP, as well as several international meteorological organizations, and NCAR.
• This presentation will detail the tools used and specifics on how CSBF Meteorology produces its forecasts.
Data, Data, Data….• In meteorology, a forecaster can never have too much data.
• Due to inherent remote locations of ballooning campaigns, obtaining a sufficient amount of data can often be a challenge
• Surface observations (temperature, dewpoint, wind, pressure etc.)
• Frequent and timely satellite imagery• Radar • Upper air observations• Model data
• Lack of data can often result in uncertainty in forecasts, so it is important to collect and distribute as much data as possible – how do we do that??
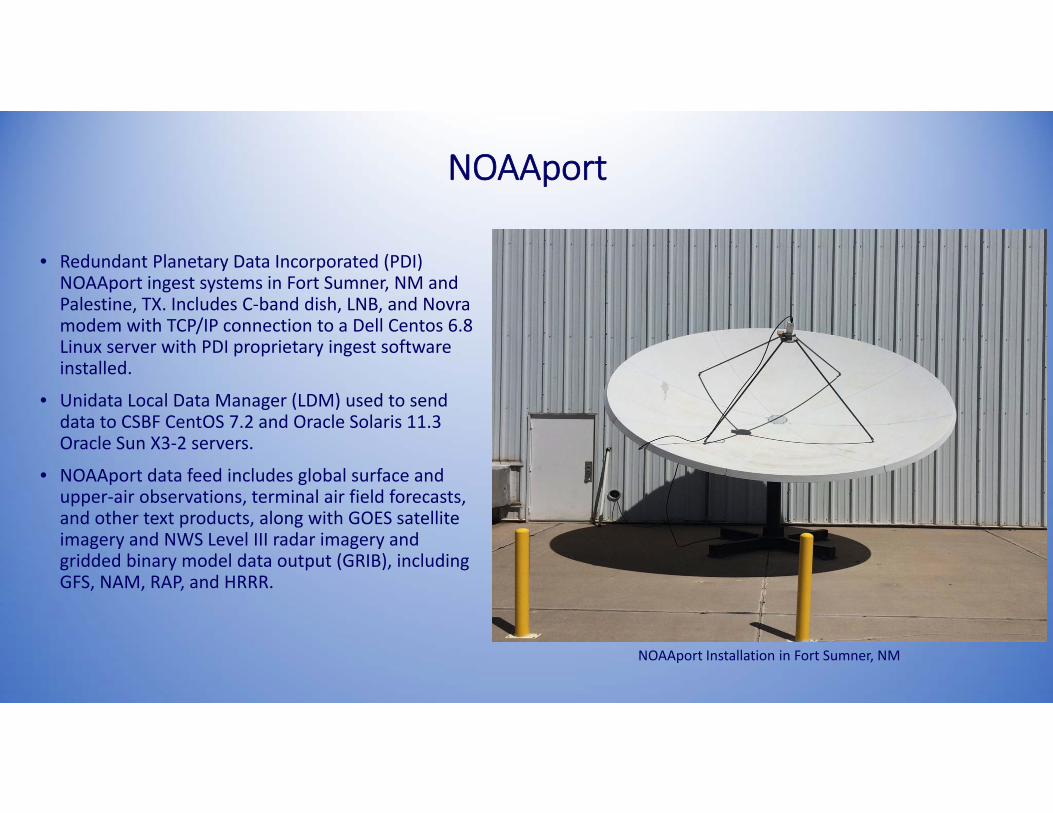
NOAAport
• Redundant Planetary Data Incorporated (PDI) NOAAport ingest systems in Fort Sumner, NM and Palestine, TX. Includes C‐band dish, LNB, and Novra modem with TCP/IP connection to a Dell Centos 6.8 Linux server with PDI proprietary ingest software installed.
• Unidata Local Data Manager (LDM) used to send data to CSBF CentOS 7.2 and Oracle Solaris 11.3 Oracle Sun X3‐2 servers.
• NOAAport data feed includes global surface and upper‐air observations, terminal air field forecasts, and other text products, along with GOES satellite imagery and NWS Level III radar imagery and gridded binary model data output (GRIB), including GFS, NAM, RAP, and HRRR.
NOAAport Installation in Fort Sumner, NM
NOAAport Display Capabilities
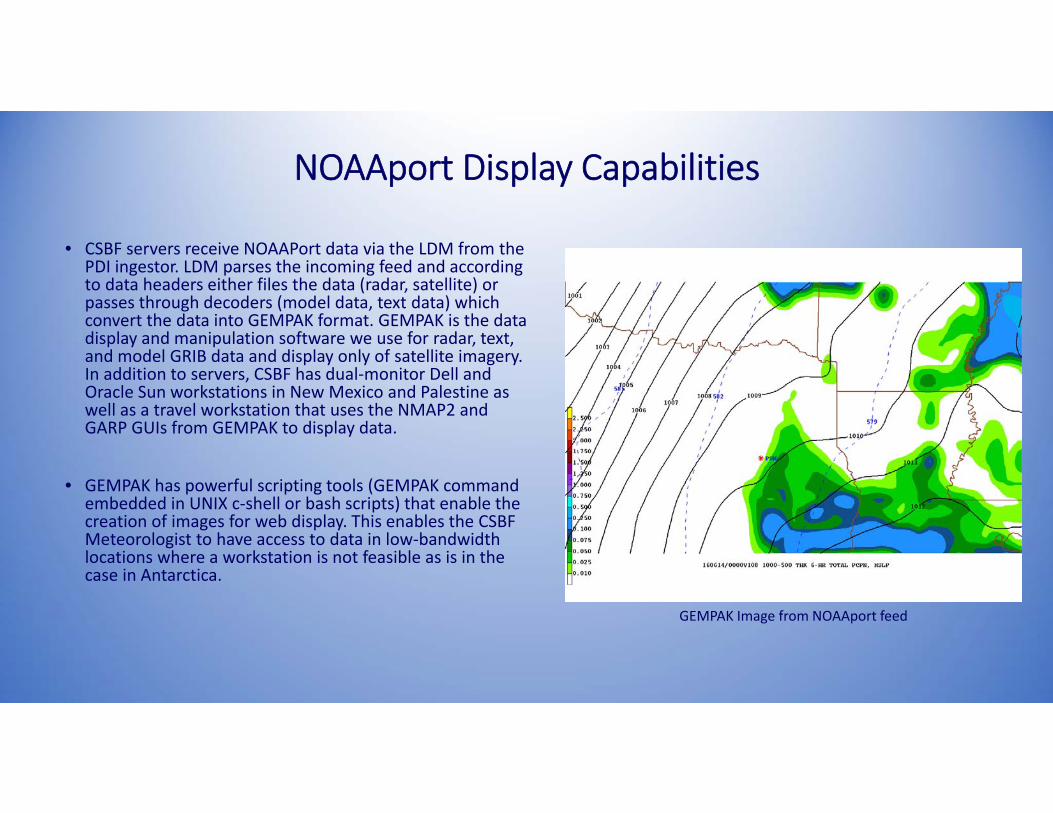
• CSBF servers receive NOAAPort data via the LDM from the PDI ingestor. LDM parses the incoming feed and according to data headers either files the data (radar, satellite) or passes through decoders (model data, text data) which convert the data into GEMPAK format. GEMPAK is the data display and manipulation software we use for radar, text, and model GRIB data and display only of satellite imagery. In addition to servers, CSBF has dual‐monitor Dell and Oracle Sun workstations in New Mexico and Palestine as well as a travel workstation that uses the NMAP2 and GARP GUIs from GEMPAK to display data.
• GEMPAK has powerful scripting tools (GEMPAK command embedded in UNIX c‐shell or bash scripts) that enable the creation of images for web display. This enables the CSBF Meteorologist to have access to data in low‐bandwidth locations where a workstation is not feasible as is in the case in Antarctica.
GEMPAK Image from NOAAport feed
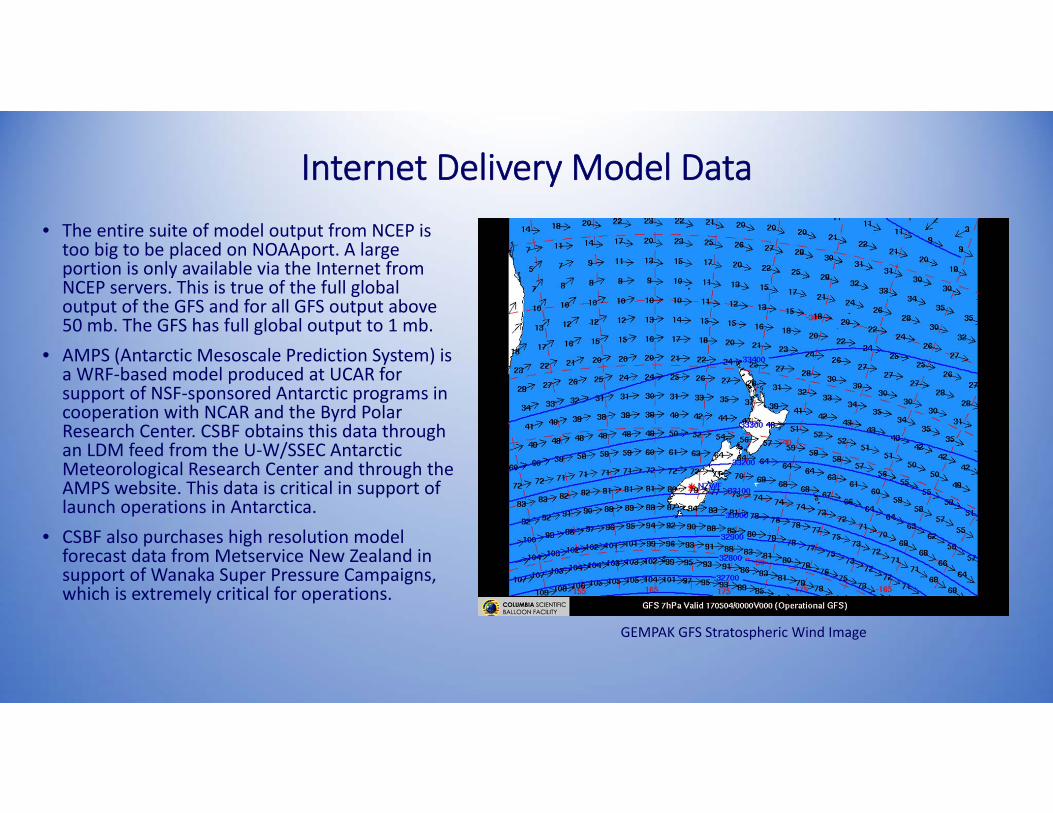
Internet Delivery Model Data• The entire suite of model output from NCEP is too big to be placed on NOAAport. A large portion is only available via the Internet from NCEP servers. This is true of the full global output of the GFS and for all GFS output above 50 mb. The GFS has full global output to 1 mb.
• AMPS (Antarctic Mesoscale Prediction System) is a WRF‐based model produced at UCAR for support of NSF‐sponsored Antarctic programs in cooperation with NCAR and the Byrd Polar Research Center. CSBF obtains this data through an LDM feed from the U‐W/SSEC Antarctic Meteorological Research Center and through the AMPS website. This data is critical in support of launch operations in Antarctica.
• CSBF also purchases high resolution model forecast data from Metservice New Zealand in support of Wanaka Super Pressure Campaigns, which is extremely critical for operations.
GEMPAK GFS Stratospheric Wind Image
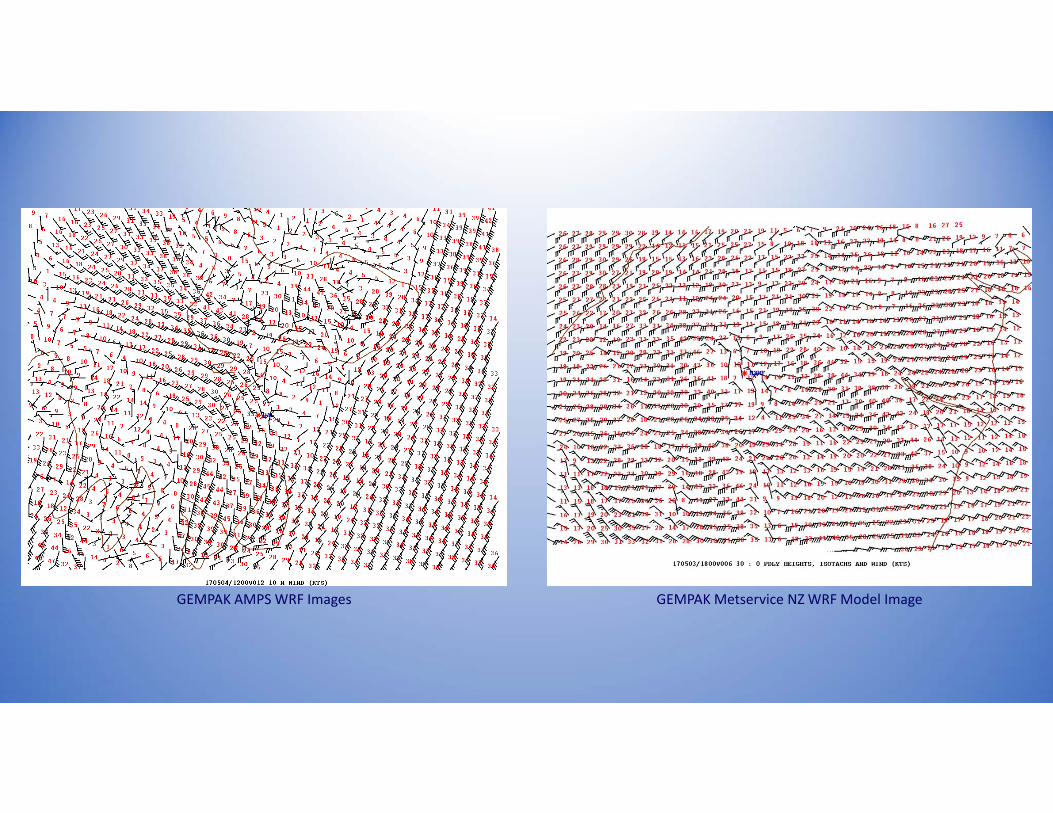
GEMPAK AMPS WRF Images GEMPAK Metservice NZ WRF Model Image
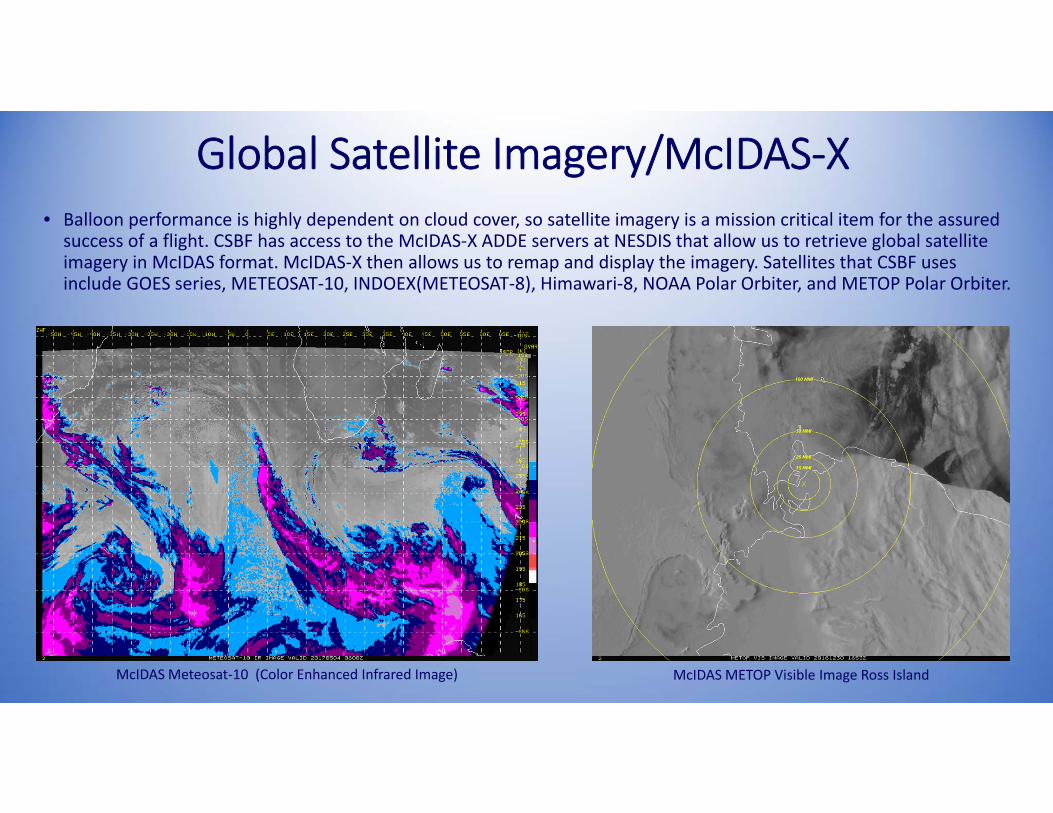
Global Satellite Imagery/McIDAS‐X• Balloon performance is highly dependent on cloud cover, so satellite imagery is a mission critical item for the assured success of a flight. CSBF has access to the McIDAS‐X ADDE servers at NESDIS that allow us to retrieve global satellite imagery in McIDAS format. McIDAS‐X then allows us to remap and display the imagery. Satellites that CSBF uses include GOES series, METEOSAT‐10, INDOEX(METEOSAT‐8), Himawari‐8, NOAA Polar Orbiter, and METOP Polar Orbiter.
McIDAS Meteosat‐10 (Color Enhanced Infrared Image) McIDAS METOP Visible Image Ross Island
Pre‐Launch Day Forecasting• Weather briefings are typically held every day once a payload is flight ready
• Meteorologist uses weather computer models to identify a launch window for the following day, and will recommend a “show” or “no show”. Campaign Manager has final decision on whether or not there will be a launch attempt the following day.
• Extended range launch weather outlook will be given typically for 3 days out.
• An ascent and float trajectory forecast will be produced and provided to Safety for a Go/No Go recommendation. Final Go/No Go comes from Safety on morning of the launch based on latest trajectory forecast.
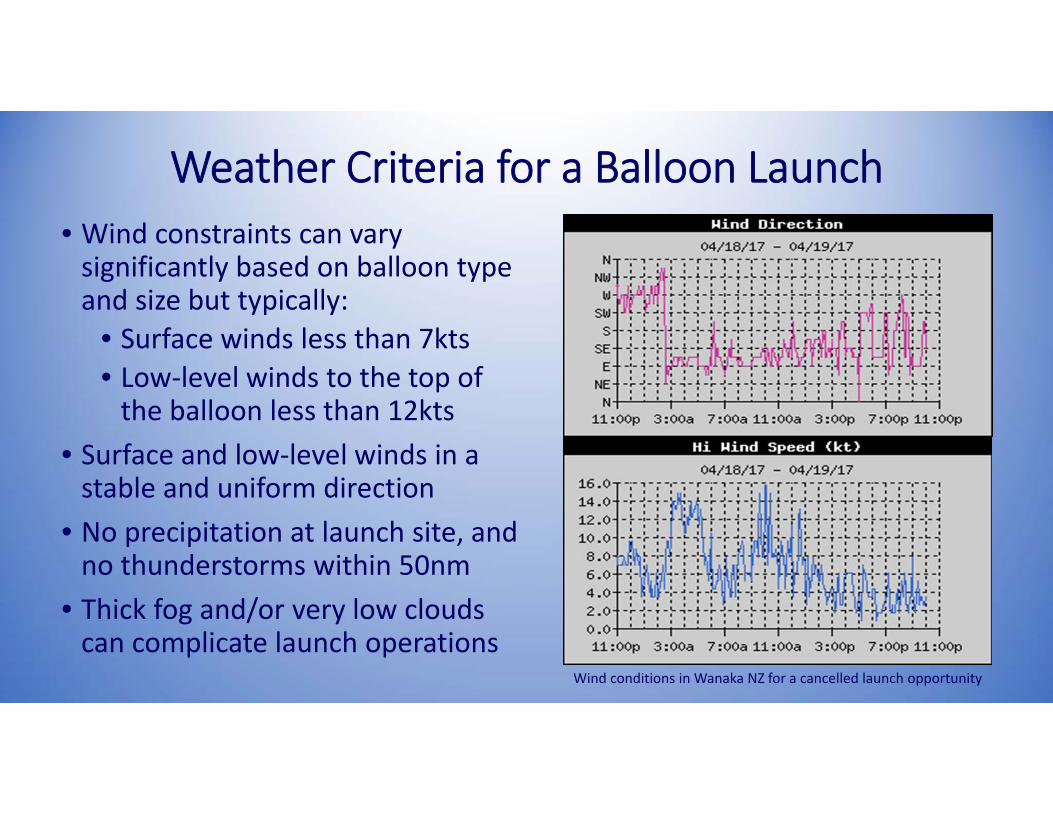
Weather Criteria for a Balloon Launch• Wind constraints can vary significantly based on balloon type and size but typically:
• Surface winds less than 7kts• Low‐level winds to the top of the balloon less than 12kts
• Surface and low‐level winds in a stable and uniform direction
• No precipitation at launch site, and no thunderstorms within 50nm
• Thick fog and/or very low clouds can complicate launch operations
Wind conditions in Wanaka NZ for a cancelled launch opportunity
Ascent & Float Trajectory Forecast
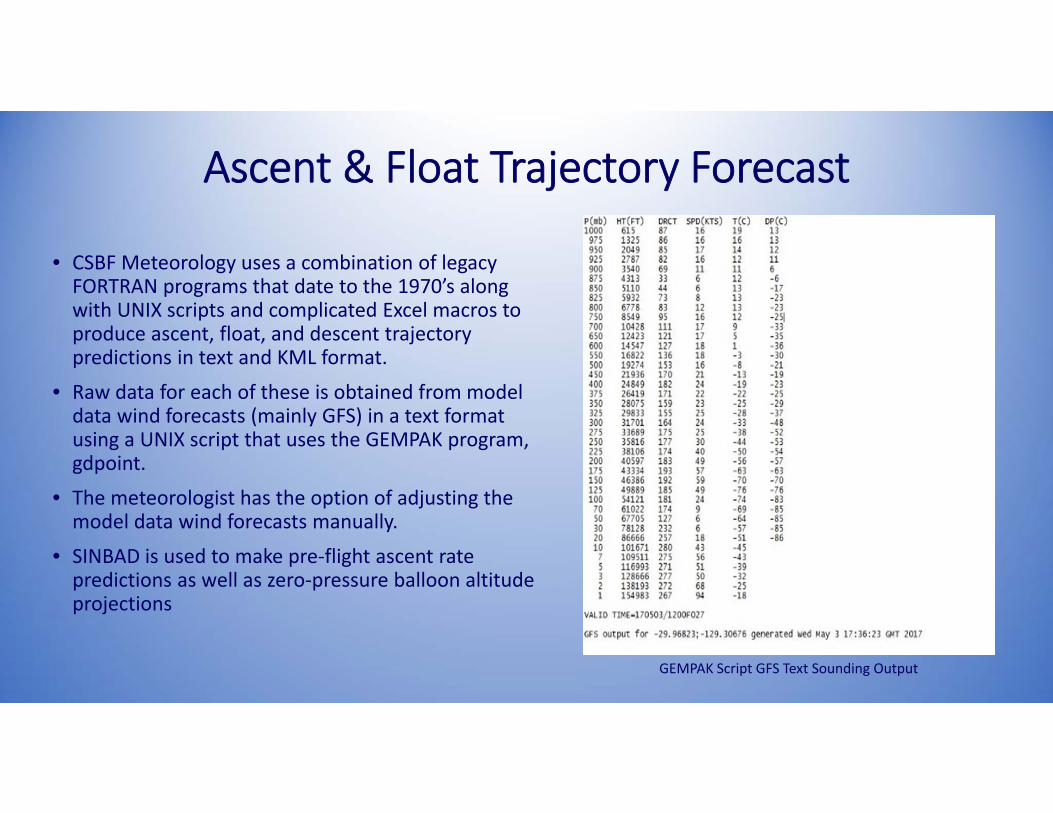
• CSBF Meteorology uses a combination of legacy FORTRAN programs that date to the 1970’s along with UNIX scripts and complicated Excel macros to produce ascent, float, and descent trajectory predictions in text and KML format.
• Raw data for each of these is obtained from model data wind forecasts (mainly GFS) in a text format using a UNIX script that uses the GEMPAK program, gdpoint.
• The meteorologist has the option of adjusting the model data wind forecasts manually.
• SINBAD is used to make pre‐flight ascent rate predictions as well as zero‐pressure balloon altitude projections
GEMPAK Script GFS Text Sounding Output
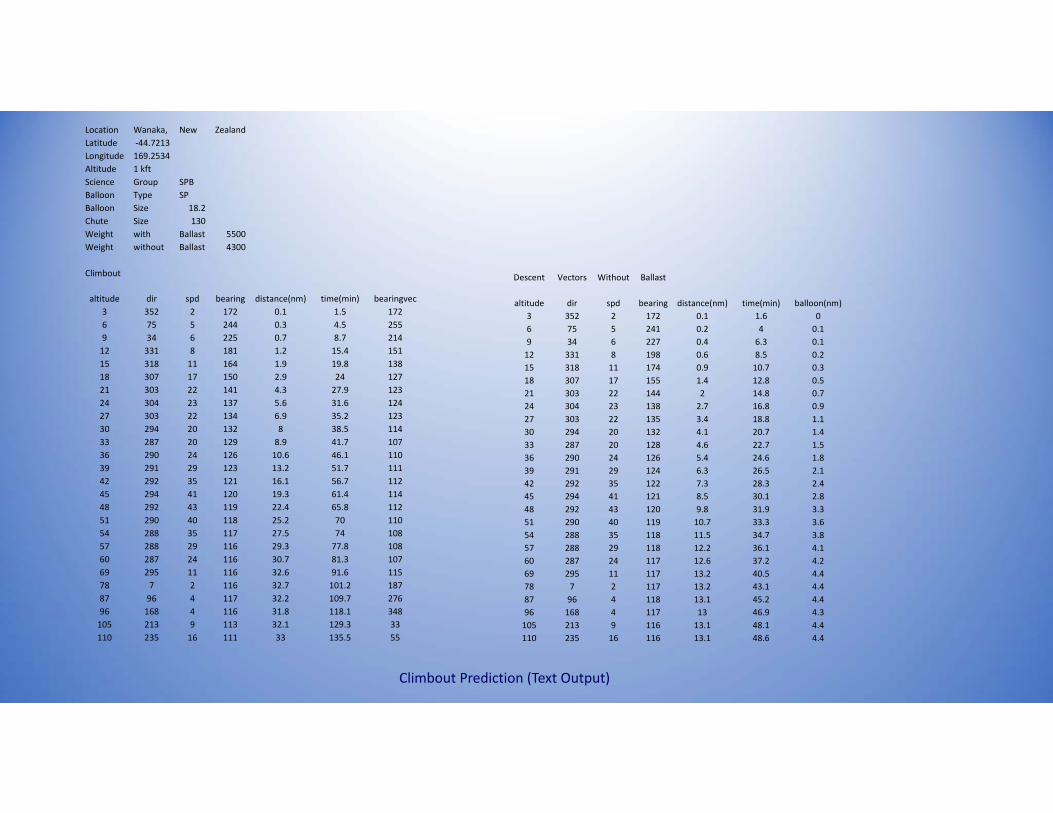
Location Wanaka, New Zealand Latitude ‐44.7213 Longitude 169.2534 Altitude 1 kft Science Group SPB Balloon Type SP Balloon Size 18.2 Chute Size 130 Weight with Ballast 5500 Weight without Ballast 4300 Climbout altitude dir spd bearing distance(nm) time(min) bearingvec
3 352 2 172 0.1 1.5 172 6 75 5 244 0.3 4.5 255 9 34 6 225 0.7 8.7 214 12 331 8 181 1.2 15.4 151 15 318 11 164 1.9 19.8 138 18 307 17 150 2.9 24 127 21 303 22 141 4.3 27.9 123 24 304 23 137 5.6 31.6 124 27 303 22 134 6.9 35.2 123 30 294 20 132 8 38.5 114 33 287 20 129 8.9 41.7 107 36 290 24 126 10.6 46.1 110 39 291 29 123 13.2 51.7 111 42 292 35 121 16.1 56.7 112 45 294 41 120 19.3 61.4 114 48 292 43 119 22.4 65.8 112 51 290 40 118 25.2 70 110 54 288 35 117 27.5 74 108 57 288 29 116 29.3 77.8 108 60 287 24 116 30.7 81.3 107 69 295 11 116 32.6 91.6 115 78 7 2 116 32.7 101.2 187 87 96 4 117 32.2 109.7 276 96 168 4 116 31.8 118.1 348 105 213 9 113 32.1 129.3 33 110 235 16 111 33 135.5 55
Descent Vectors Without Ballast
altitude dir spd bearing distance(nm) time(min) balloon(nm)3 352 2 172 0.1 1.6 0 6 75 5 241 0.2 4 0.1 9 34 6 227 0.4 6.3 0.1 12 331 8 198 0.6 8.5 0.2 15 318 11 174 0.9 10.7 0.3 18 307 17 155 1.4 12.8 0.5 21 303 22 144 2 14.8 0.7 24 304 23 138 2.7 16.8 0.9 27 303 22 135 3.4 18.8 1.1 30 294 20 132 4.1 20.7 1.4 33 287 20 128 4.6 22.7 1.5 36 290 24 126 5.4 24.6 1.8 39 291 29 124 6.3 26.5 2.1 42 292 35 122 7.3 28.3 2.4 45 294 41 121 8.5 30.1 2.8 48 292 43 120 9.8 31.9 3.3 51 290 40 119 10.7 33.3 3.6 54 288 35 118 11.5 34.7 3.8 57 288 29 118 12.2 36.1 4.1 60 287 24 117 12.6 37.2 4.2 69 295 11 117 13.2 40.5 4.4 78 7 2 117 13.2 43.1 4.4 87 96 4 118 13.1 45.2 4.4 96 168 4 117 13 46.9 4.3 105 213 9 116 13.1 48.1 4.4 110 235 16 116 13.1 48.6 4.4
Climbout Prediction (Text Output)
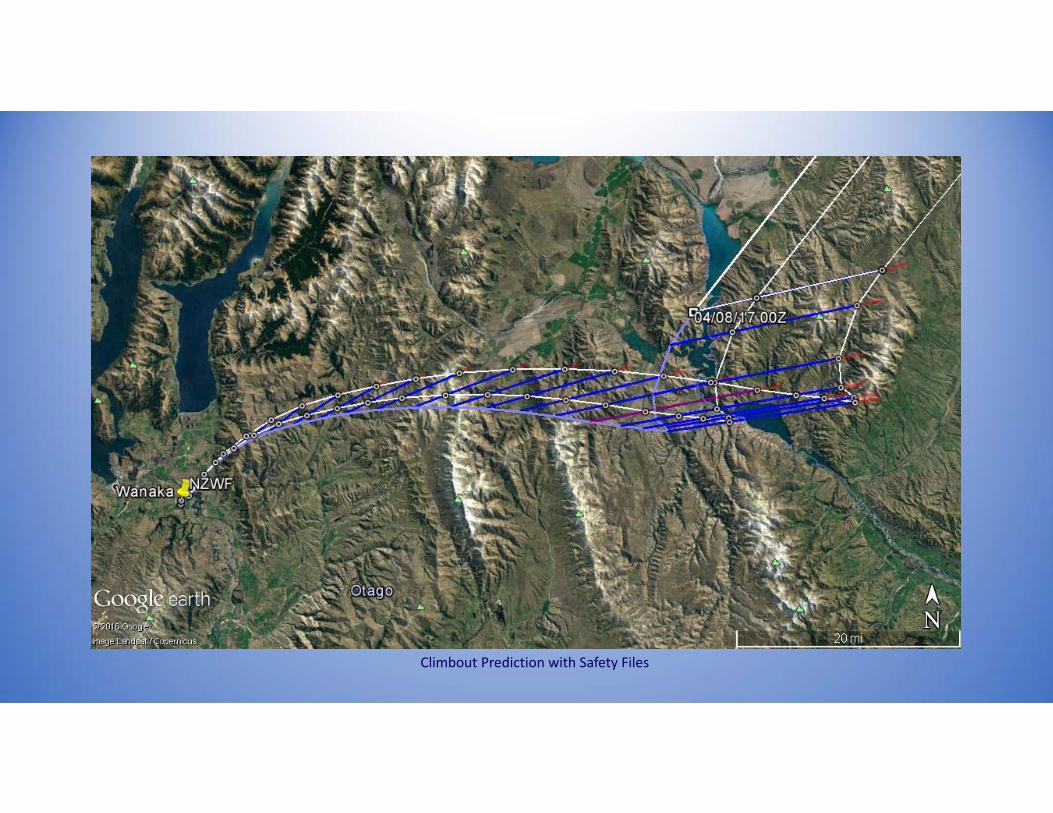
Climbout Prediction with Safety Files
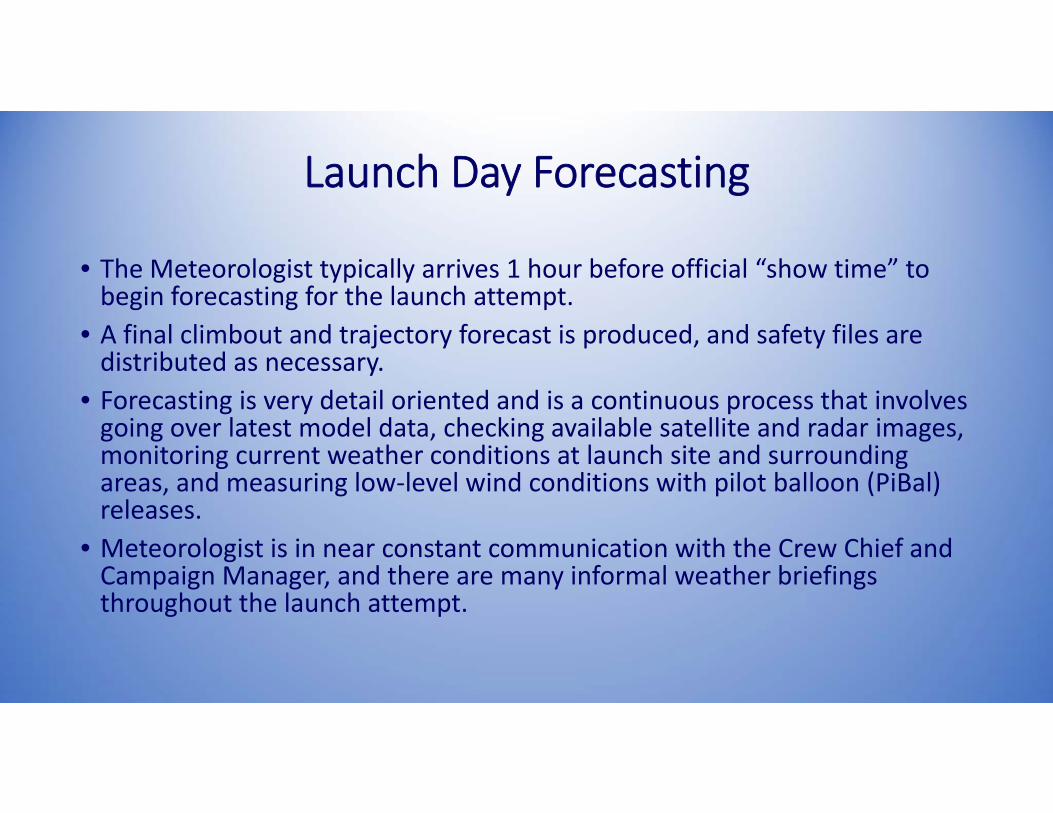
Launch Day Forecasting
• The Meteorologist typically arrives 1 hour before official “show time” to begin forecasting for the launch attempt.
• A final climbout and trajectory forecast is produced, and safety files are distributed as necessary.
• Forecasting is very detail oriented and is a continuous process that involves going over latest model data, checking available satellite and radar images, monitoring current weather conditions at launch site and surrounding areas, and measuring low‐level wind conditions with pilot balloon (PiBal) releases.
• Meteorologist is in near constant communication with the Crew Chief and Campaign Manager, and there are many informal weather briefings throughout the launch attempt.
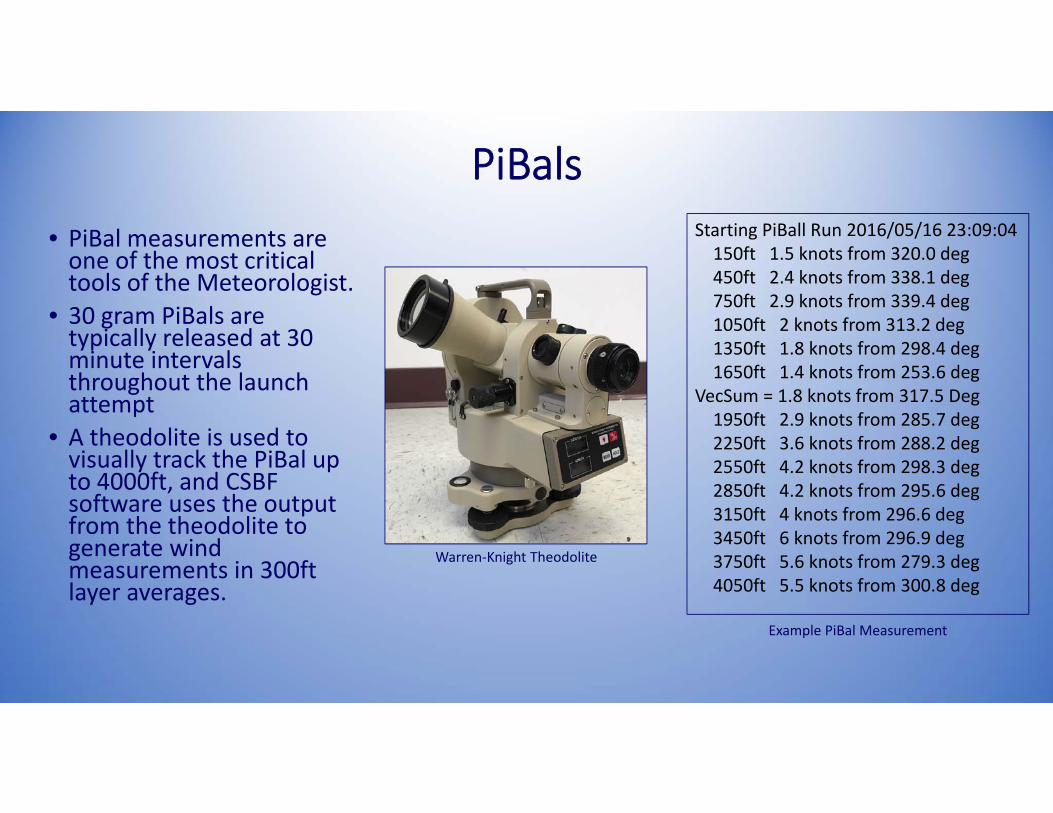
PiBals• PiBal measurements are one of the most critical tools of the Meteorologist.
• 30 gram PiBals are typically released at 30 minute intervals throughout the launch attempt
• A theodolite is used to visually track the PiBal up to 4000ft, and CSBF software uses the output from the theodolite to generate wind measurements in 300ft layer averages.
Starting PiBall Run 2016/05/16 23:09:04150ft 1.5 knots from 320.0 deg450ft 2.4 knots from 338.1 deg750ft 2.9 knots from 339.4 deg1050ft 2 knots from 313.2 deg1350ft 1.8 knots from 298.4 deg1650ft 1.4 knots from 253.6 deg
VecSum = 1.8 knots from 317.5 Deg1950ft 2.9 knots from 285.7 deg2250ft 3.6 knots from 288.2 deg2550ft 4.2 knots from 298.3 deg2850ft 4.2 knots from 295.6 deg3150ft 4 knots from 296.6 deg3450ft 6 knots from 296.9 deg3750ft 5.6 knots from 279.3 deg4050ft 5.5 knots from 300.8 deg
Example PiBal Measurement
Warren‐Knight Theodolite
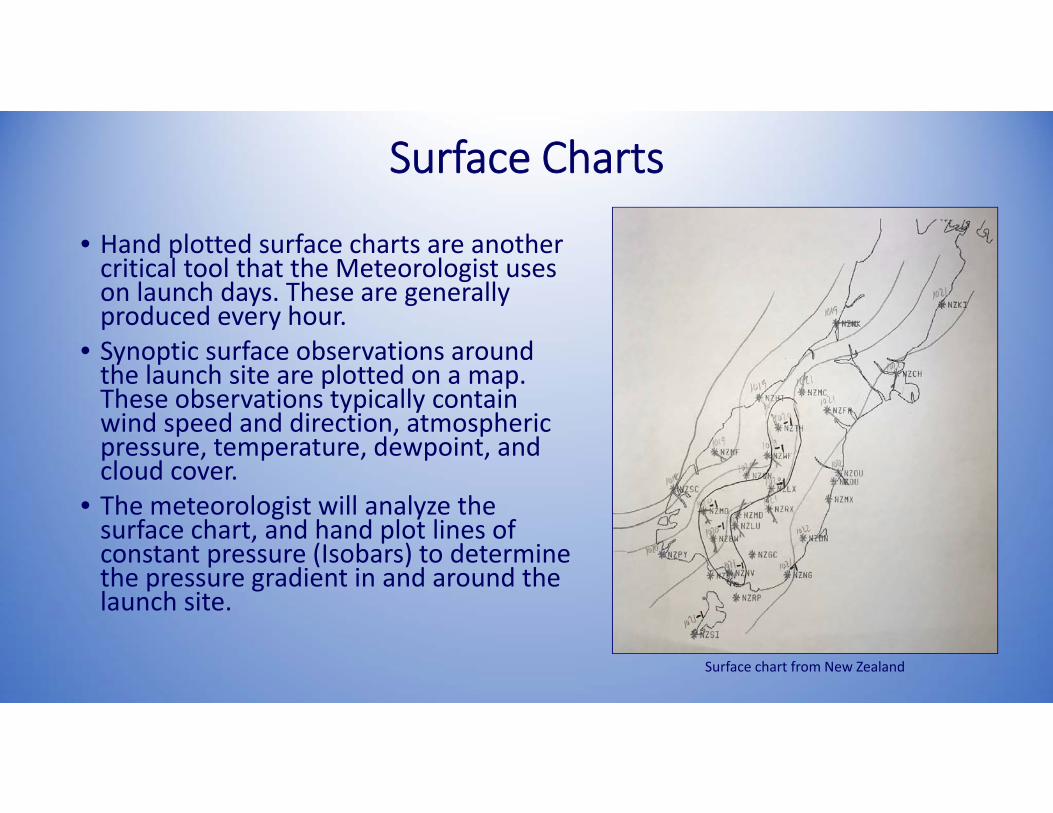
Surface Charts
• Hand plotted surface charts are another critical tool that the Meteorologist uses on launch days. These are generally produced every hour.
• Synoptic surface observations around the launch site are plotted on a map. These observations typically contain wind speed and direction, atmospheric pressure, temperature, dewpoint, and cloud cover.
• The meteorologist will analyze the surface chart, and hand plot lines of constant pressure (Isobars) to determine the pressure gradient in and around the launch site.
Surface chart from New Zealand
Post Launch Forecasting
• Once the balloon is launched, the Meteorologist will monitor the balloon until it gets to float altitude to provide emergency descent vectors if necessary.
• Provide input to Crew Chief about ballasting and/or valving.
• When the decision is made to terminate the flight, descent vectors will be produced. Prior to Descent Notices will also be created for CONUS flights to be distributed to the FAA.
• Impact area forecasts are provided to recovery team as needed.
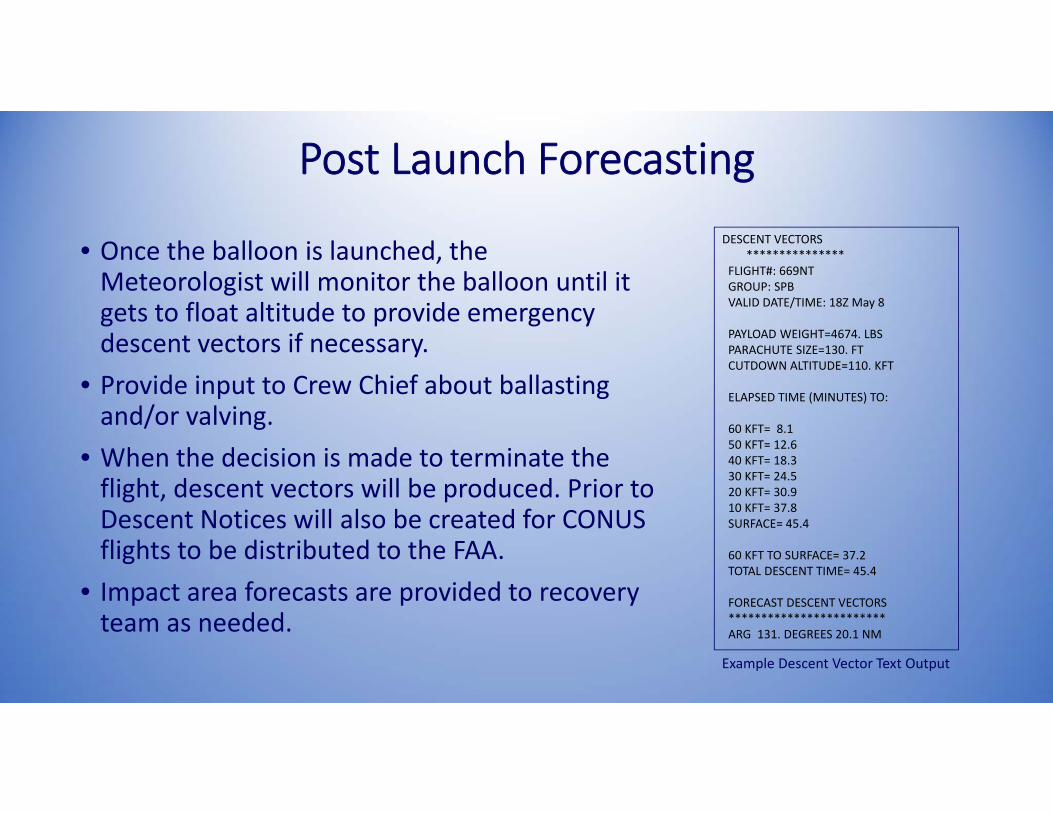
DESCENT VECTORS***************
FLIGHT#: 669NT GROUP: SPB VALID DATE/TIME: 18Z May 8
PAYLOAD WEIGHT=4674. LBSPARACHUTE SIZE=130. FTCUTDOWN ALTITUDE=110. KFT
ELAPSED TIME (MINUTES) TO:
60 KFT= 8.150 KFT= 12.640 KFT= 18.330 KFT= 24.520 KFT= 30.910 KFT= 37.8SURFACE= 45.4
60 KFT TO SURFACE= 37.2TOTAL DESCENT TIME= 45.4
FORECAST DESCENT VECTORS************************ARG 131. DEGREES 20.1 NM
Example Descent Vector Text Output
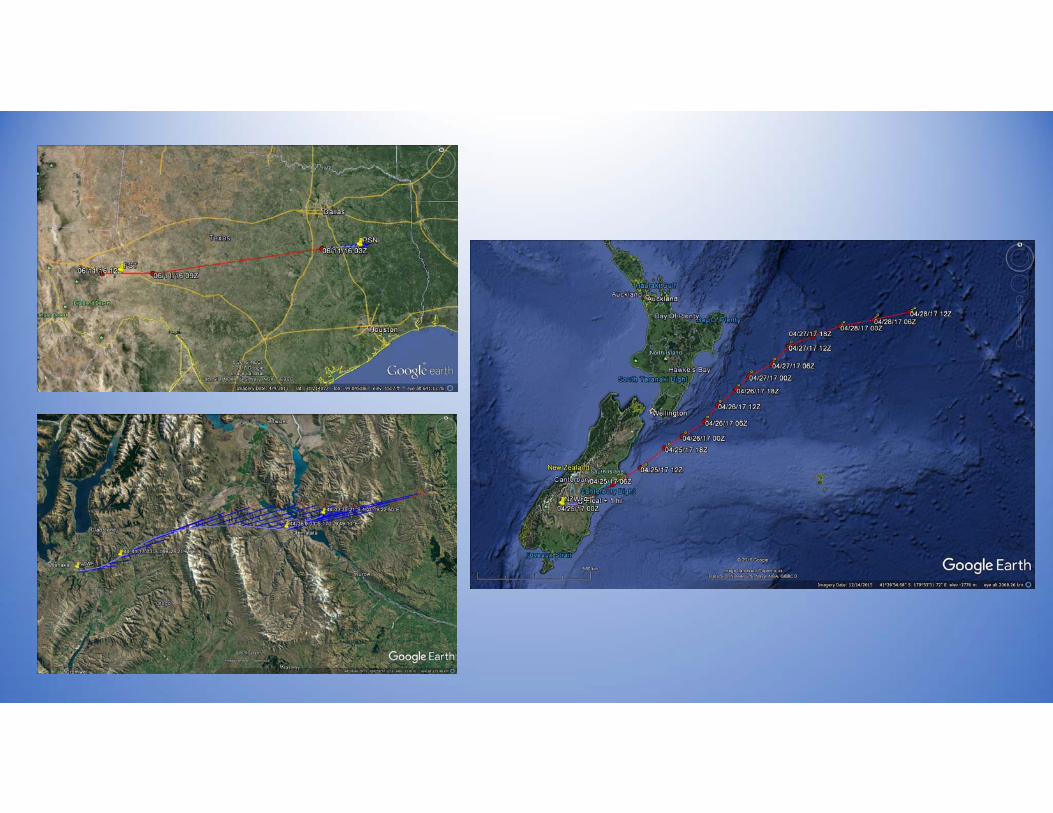
After Float Predictions• For longer flights, updated trajectory predictions will be produced daily.
• Required safety files will be generated and distributed as necessary.
• Cloud cover forecasts for flight path will be produced, and balloon performance predictions are made based on this forecast.
• Other in‐flight weather data provided to Science Team throughout the flight, such as forecast soundings, and lightning forecasts.
• Post flight weather data, such as satellite imagery, can be provided to the Science Team after the flight is complete.
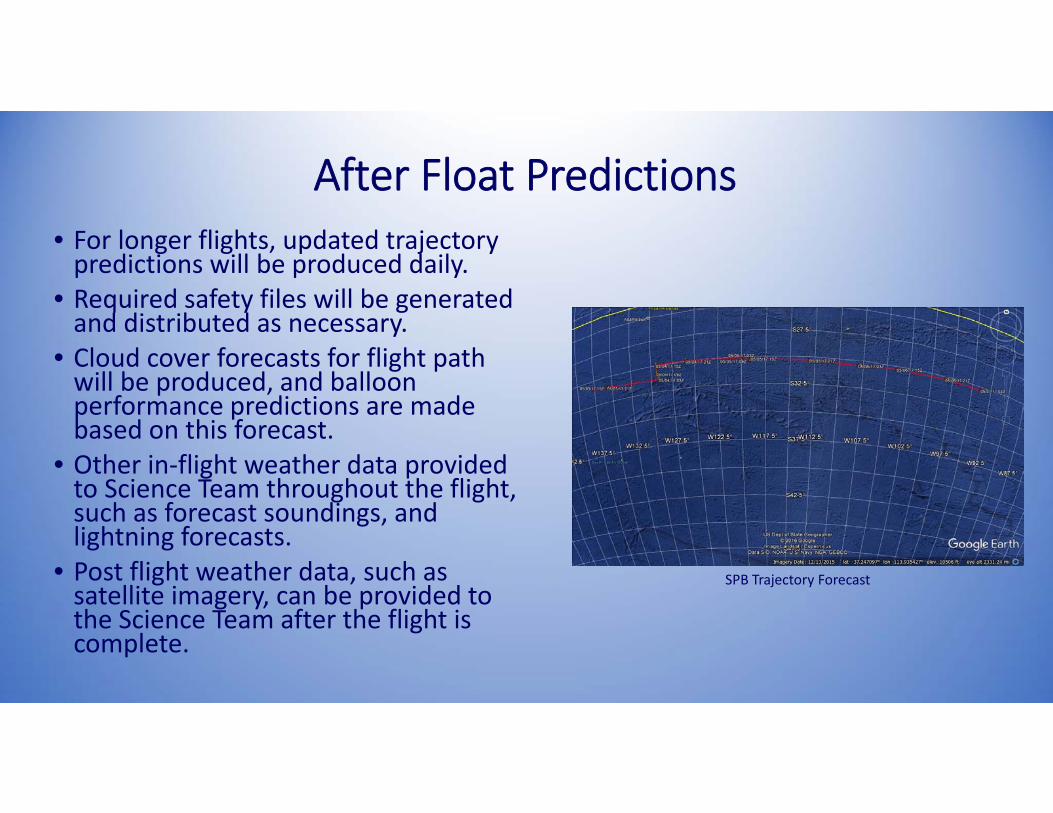
SPB Trajectory Forecast

Questions??