Embed Size (px)
Citation preview
Meteo 1020 – Lecture 4The Natural Variability of the Earth-Atmosphere System
• Natural variability can be classified by its forcing type (internal or external to the climate system) and whether it is periodic/cyclic or episodic.
Modes of Natural Variability that we know of:timescale form forcing
1. Seasonal 90 days cyclic external2. El Niño Southern Oscillation 3-5 yrs cyclic internal3. North Atlantic Oscillation decadal cyclic
internal??4. Volcanism none episodic external5. Ice ages 40,000 yrs cyclic internal6. Pacific Decadal 20-50 yrs cyclic ????
Meteo 1020 – Lecture 4The Natural Variability of the Earth-Atmosphere System
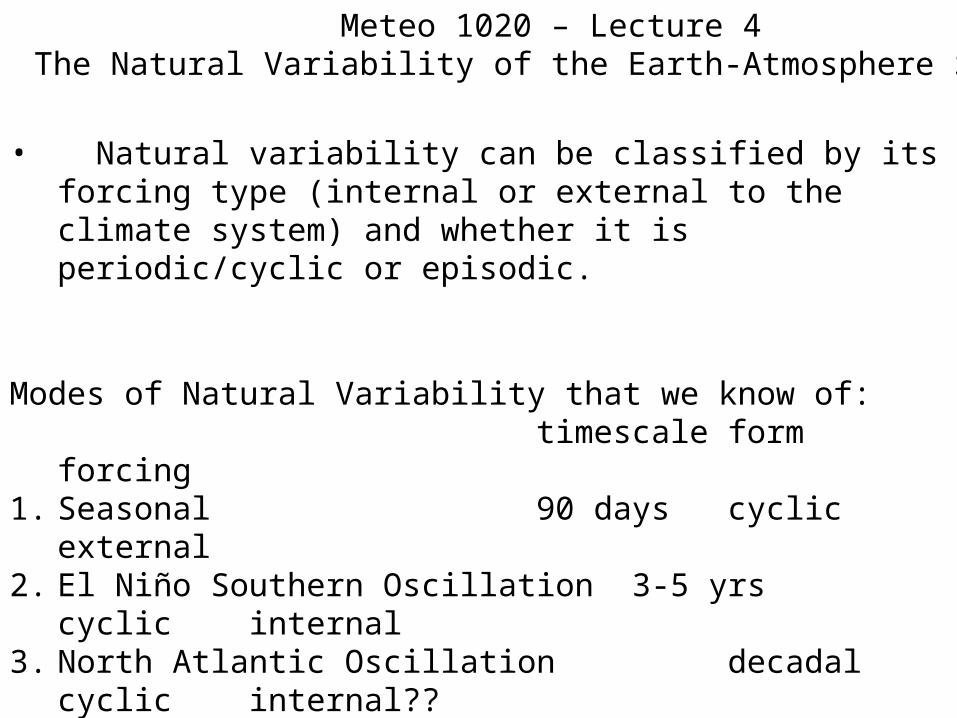
Air-Sea Interactions:
Ocean and atmosphere communicate with one another:
1. constituents: water (precipitation and evaporation), carbon dioxide, oxygen, trace gasses, etc
2. Energy – momentum through wind stress driving the surface currents
3. Heat – sensible heat and latent heat due to evaporation
http://science.hq.nasa.gov/oceans/images/water_cycle.jpg

Ocean structure: on average: warm and relatively fresh mixed layer lying on top of a nearly isothermal (same temperature) cold and salty water mass
http://www.wbgu.de/Images/sn_2006_en/2.1-4.png

How does ocean circulation affect local climates?
Intergovernmental Panel on Climate Change (IPCC), "Climate Change 2001: The Scientific Basis"
Warm surface current- Less Dense Cold deep water current–More DenseSalty water anywhere- More Dense
Answer: Heat release locations are warmer!
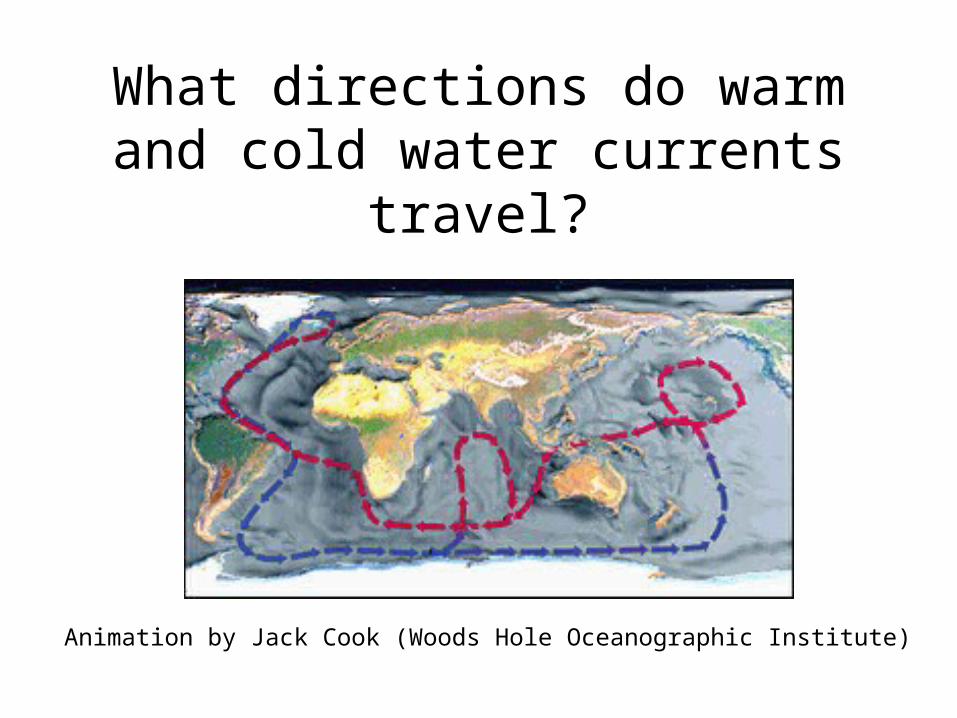
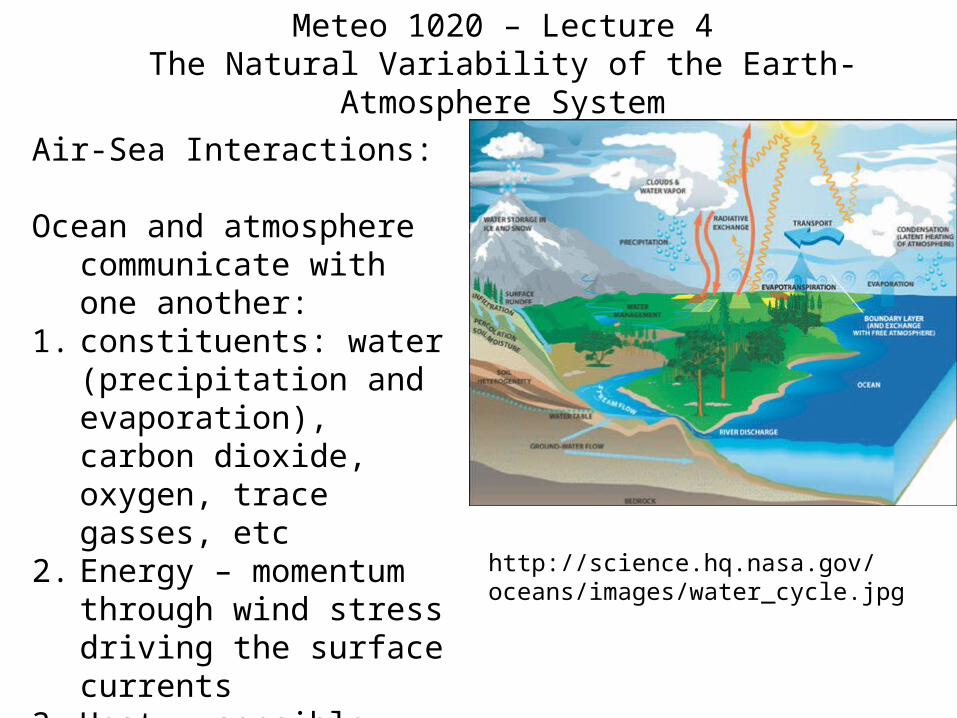
What directions do warm and cold water currents travel?
Animation by Jack Cook (Woods Hole Oceanographic Institute)

Is it true that the North Atlantic current could shut down?
The ocean surface transfers heat to the atmosphere!
Animation by Jack Cook (Woods Hole Oceanographic Institute)

Meteo 1020 – Lecture 4The Natural Variability of the Earth-Atmosphere System
The global thermohaline circulation: Cold Salty water in the north Atlantic becomes dense and convects downward, spreads southward and contributes to vertical overturning of deep ocean water on millennial timescales.
Importance: Climate of northern Europe and Asia rely on heat and moisture supplied to atmosphere to keep climate habitable in extreme northern latitudes.

What process could change the ocean circulation?
http://www.whoi.edu/page.do?pid=12455&tid=282&cid=10046go to bookmarks
Is freshwater increasing in the North Atlantic?
• http://www.whoi.edu/templates/files/multimedia.jsp?pid=12455&cid=7466&cl=6732
• http://www.whoi.edu/institutes/occi/images/occi_abrclimate_jk_lev_en.gif
Meteo 1020 – Lecture 4The Natural Variability of the Earth-Atmosphere System
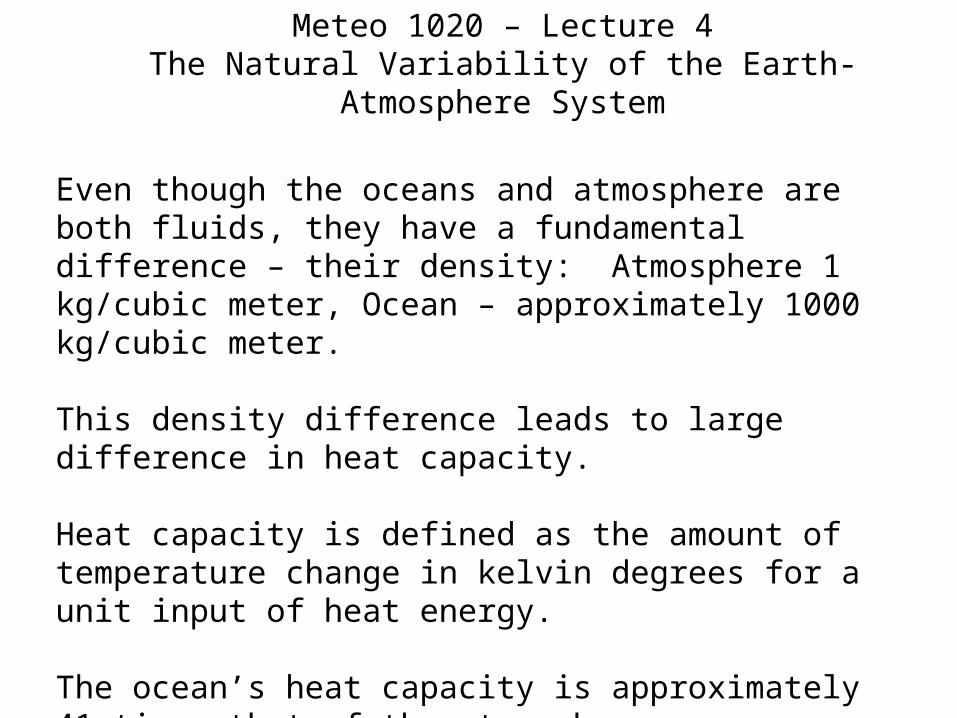
Even though the oceans and atmosphere are both fluids, they have a fundamental difference – their density: Atmosphere 1 kg/cubic meter, Ocean – approximately 1000 kg/cubic meter.
This density difference leads to large difference in heat capacity.
Heat capacity is defined as the amount of temperature change in kelvin degrees for a unit input of heat energy.
The ocean’s heat capacity is approximately 41 times that of the atmosphere.
A 1 degree change in atmospheric temperature is equivalent to an 0.02 change in ocean temperature change.

Meteo 1020 – Lecture 4The Natural Variability of the Earth-Atmosphere System
El Nino is an example of air-sea interactions that occur on annual time scales
Note figures 4.8 and 4.9:
Sea surface temperature (SST) patterns change fundamentally with the el nino cycle
The atmosphere both forces and responds to the el nino cycle.
Normal sst patterns: atmospheric forcing of sst is accomplished through easterly trade winds cooling the central and eastern equatorial pacific. Atmosphere responds to warm western pacific water by the occurrence of strong thunderstorms in that region

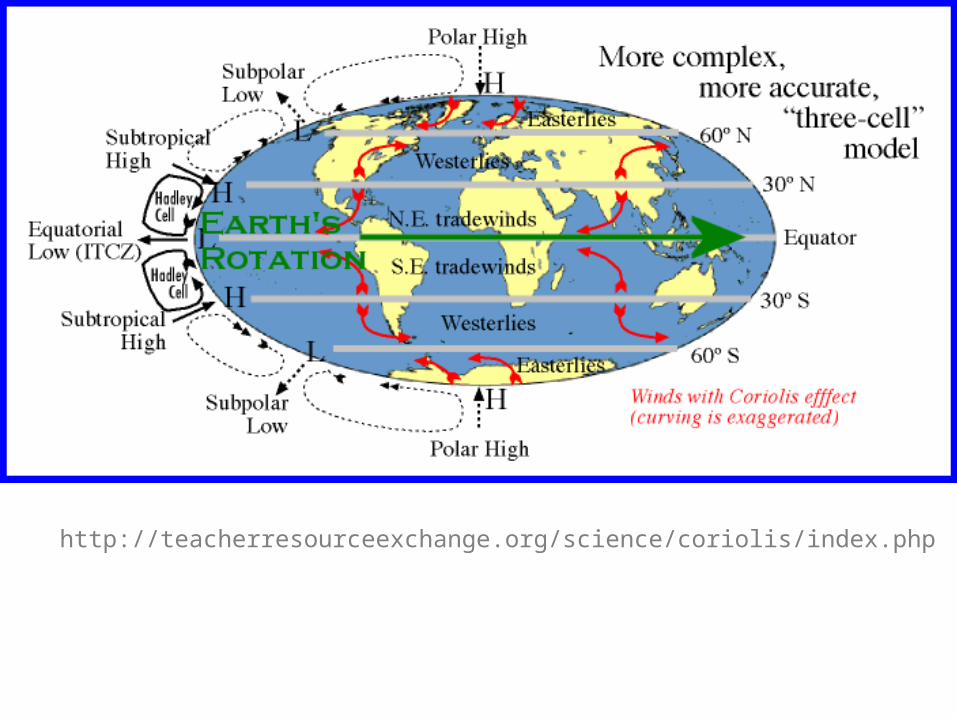
http://teacherresourceexchange.org/science/coriolis/index.php

http://sealevel.jpl.nasa.gov/science/images/el-nino-la-nina.jpg
ENSO Animation
http://www.cpc.noaa.gov/products/precip/CWlink/MJO/enso.shtml#current

ENSO Outline• Mean state of the ocean and atmosphere across the tropical Pacific Mean ocean surface temperatures
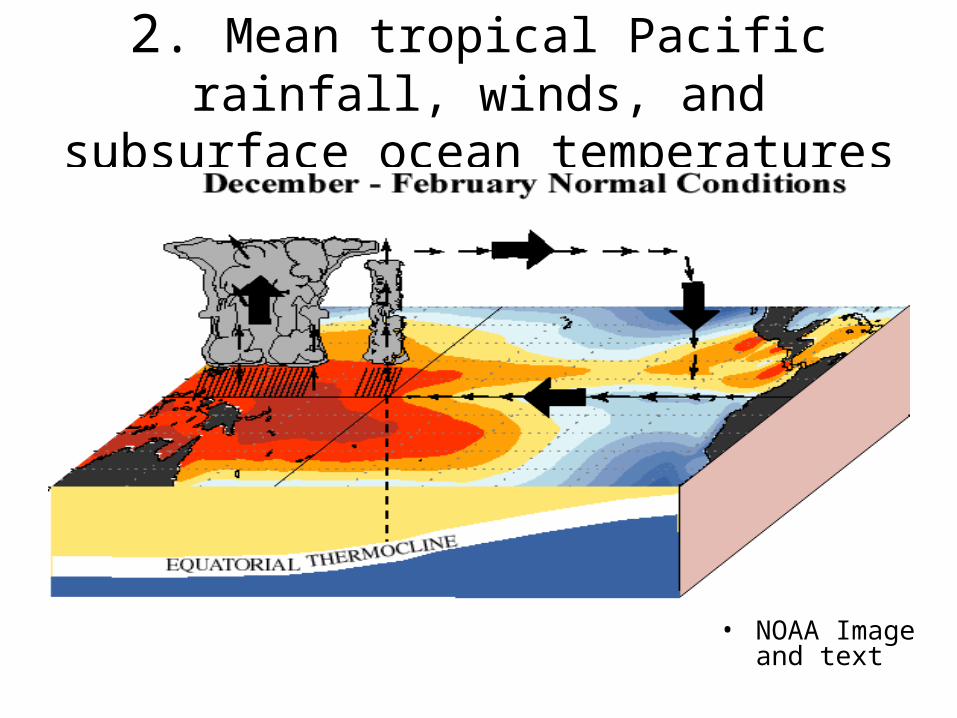
Mean tropical Pacific rainfall, winds, and subsurface ocean temperaturesMean wintertime jet streams over the North Pacific and South Pacific
• The ENSO cycle El Niño and La Niña Ocean Temperature Patterns
The Southern Oscillation and its link to the ENSO cycleThe Southern Oscillation Index (SOI)
• El Niño El Niño (ENSO) related rainfall patterns over the tropical Pacific
El Niño-related winds, the state of the equatorial Walker circulation, subsurface ocean structure
El Niño-related global temperature and rainfall patterns El Niño - related changes in atmospheric circulation in the subtropics and middle latitudes
• La Niña La Niña-related rainfall patterns over the tropical Pacific
La Niña-related winds, the state of the equatorial Walker circulation, subsurface ocean structure
La Niña-related global temperature and rainfall patternsLa Niña- related changes in atmospheric circulation in the subtropics

• NOAA Image and text
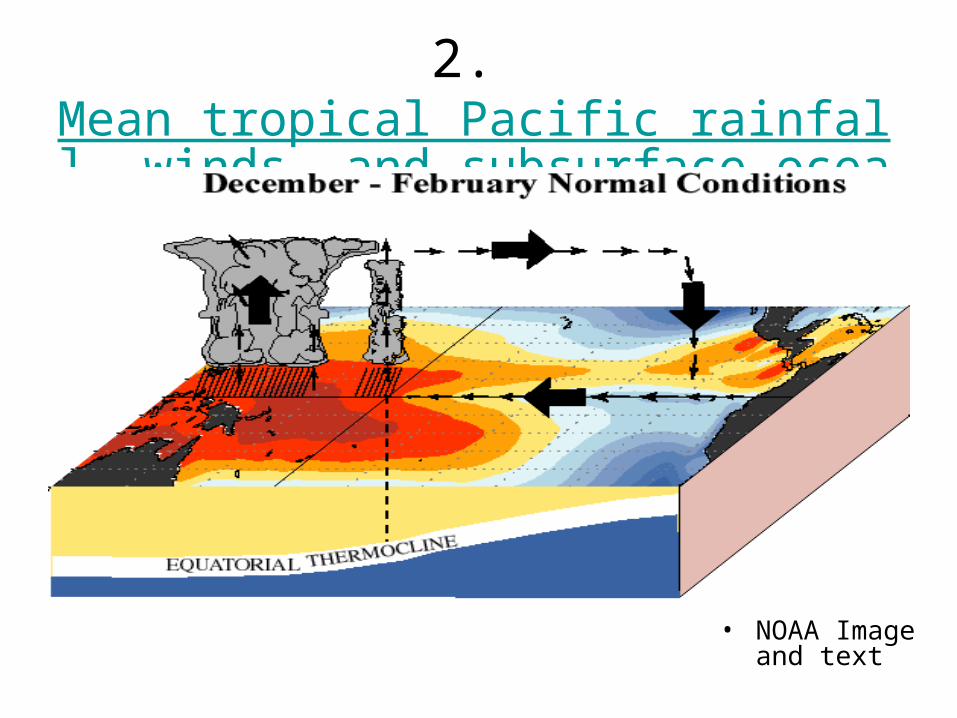
2. Mean tropical Pacific rainfall, winds, and subsurface ocean temperatures
• NOAA Image and text

Summary: Normally in the equatorial pacific
• Trade winds blow from the east to the west• Warm water piles up on the western side of the
equatorial pacific ocean• Cool water upwells along the coast of South
America• Low pressure is observed over Indonesia and
the western pacific ocean and heavy rainfall occurs there
• High pressure is observed in the eastern pacific ocean.

El Niño and La Niña Ocean Temperature Patterns
• NOAA Image and text

The Southern Oscillation and its link to the ENSO cycle
• NOAA Image and text

How are high and low pressures related to rainfall and winds?

Pressure Force
• More air on the left hand side (higher pressure).
• The pressure difference over that distance of the sheet (the pressure gradient force), pushes the sheet to the right.

Pressure Force
• More air on the left hand side (higher pressure).
• The pressure difference on either side of the parcel (the pressure gradient force), pushes the parcel to the right.

Pressure Gradient Force
http://ww2010.atmos.uiuc.edu/(Gh)/guides/mtr/fw/pgf.rxml

http://teacherresourceexchange.org/science/coriolis/index.phpIf the earth was not spinning,
air would move directly from high to low pressure areas.

http://teacherresourceexchange.org/science/coriolis/index.php

Coriolis Force
http://ww2010.atmos.uiuc.edu/(Gh)/guides/mtr/fw/gifs/coriolis.mpg
Video

El Nino Related Rainfall
• NOAA Image and text

2. Mean tropical Pacific rainfall, winds, and subsurface ocean temperatures
• NOAA Image and text

El Niño-related winds, the state of the equatorial Walker circulation, subsurface ocean structure
• NOAA Image and text
Ocean productivity and El Niño
– easterly trade winds weaken, • allowing warmer waters of the western Pacific to
migrate eastward and eventually reach the South American Coast.
– The cool nutrient-rich sea water normally found along the coast of Peru is replaced by warmer water depleted of nutrients, resulting in a dramatic reduction in marine fish and plant life.

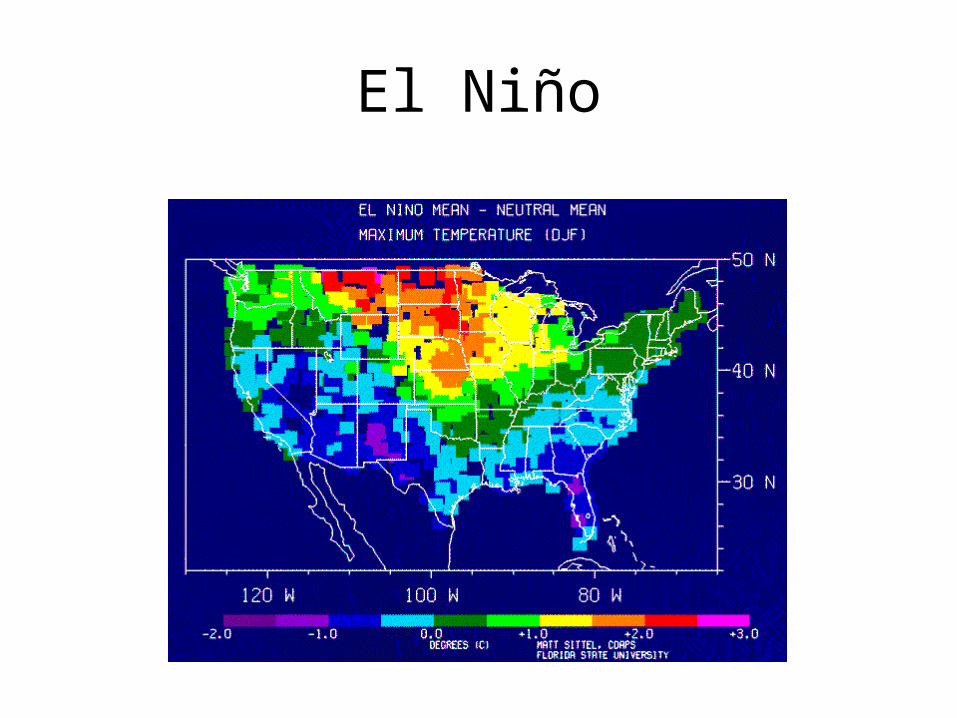
El Niño
• NOAA Image and text
El Niño

El Niño

La Niña-Related Rainfall Patterns over the Tropical Pacific
• NOAA Image and text
2. Mean tropical Pacific rainfall, winds, and subsurface ocean temperatures
• NOAA Image and text

La Niña-Related Winds, Walker Circulation,
and Subsurface Ocean Temperatures
• NOAA Image and text
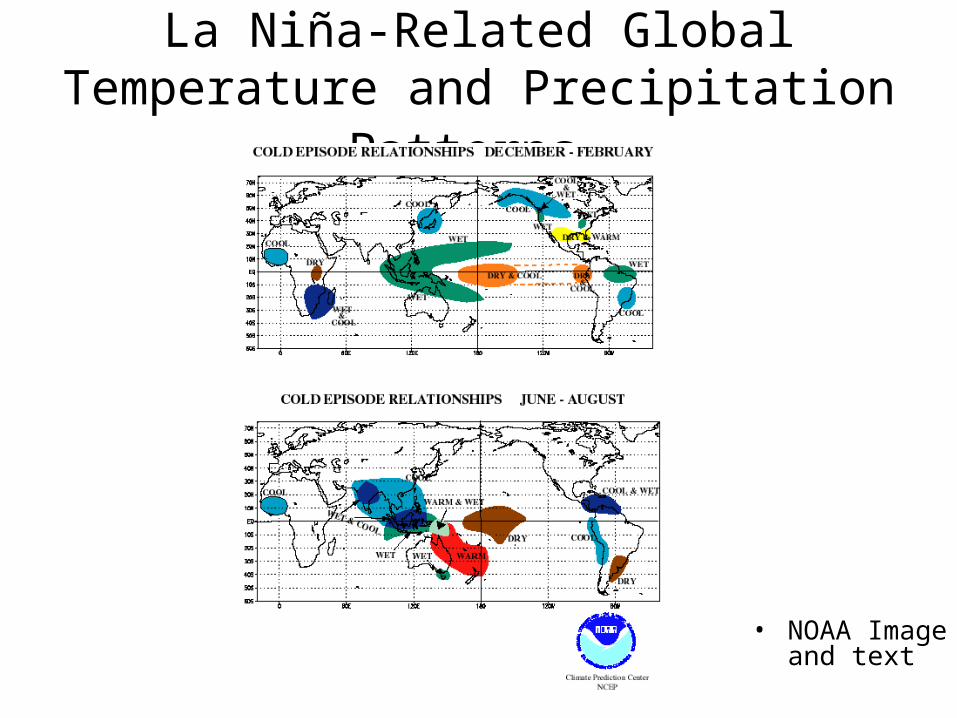
La Niña-Related Global Temperature and Precipitation Patterns
• NOAA Image and text

World Connections of weather patternsshift in the distribution of heat in the
atmosphere and ocean which moves things around (Boiling pot)
• NOAA Image and text

La Niña
• Stronger easterly (coming from the east) winds occur moving surface water away from the western coast of South America.
• La Niña (female child)
• La Niña occurs roughly half as often as El Niño.

Current Data
• NOAA Image and text

Current La Niña
• NOAA Image and text

Sea Surface Temperatures
• NOAA Image and text

Upper ocean heat changes
• NOAA Image and text

Ocean Anomalies
• NOAA Image and text

Meteo 1020 – Lecture 4The Natural Variability of the Earth-Atmosphere System
An el nino is characterized by a general warming of the water in the central and eastern pacific.
Atmosphere forces the ocean by a weakening of the easterly trades in the central and eastern pacific.
Atmosphere responds by shifting thunderstorm activity eastward to the central pacific.
Implications: Interruption of fishery along western margins of South America, failure and/or weakening of the Indian Monsoon impacting agriculture in that region.

Meteo 1020 – Lecture 4The Natural Variability of the Earth-Atmosphere System
El nino remote forcing: the modulation of the normal patterns in the equatorial pacific influence weather patterns around the world:
In the U.S., the pacific storm track is shifted southward leading resulting in storminess over the southwestern U.S. and droughts over the Pacific Northwest. Precipitation is often reduced over the southeastern U.S.

Meteo 1020 – Lecture 4The Natural Variability of the Earth-Atmosphere System
• Natural variability can be classified by its forcing type (internal or external to the climate system) and whether it is periodic/cyclic or episodic.
Modes of Natural Variability that we know of:timescale form forcing
1. Seasonal 90 days cyclic external2. El nino 3-5 yrs cyclic internal3. North Atlantic Oscillation decadal cyclic
internal??4. Volcanism none episodic external5. Ice ages 40,000 yrs cyclic internal6. Pacific Decadal 20-50 yrs cyclic ????

North Atlantic Oscillation•
The NAO index is defined as the anomalous difference between the polar low and the subtropical high during the winter season (December through March)

The Negative NAO• The negative NAO index phase
shows a weak subtropical high and a weak Icelandic low.
• The reduced pressure gradient results in fewer and weaker winter storms crossing on a more west-east pathway.
• They bring moist air into the Mediterranean and cold air to northern Europe
• The US east coast experiences more cold air outbreaks and hence snowy weather conditions.
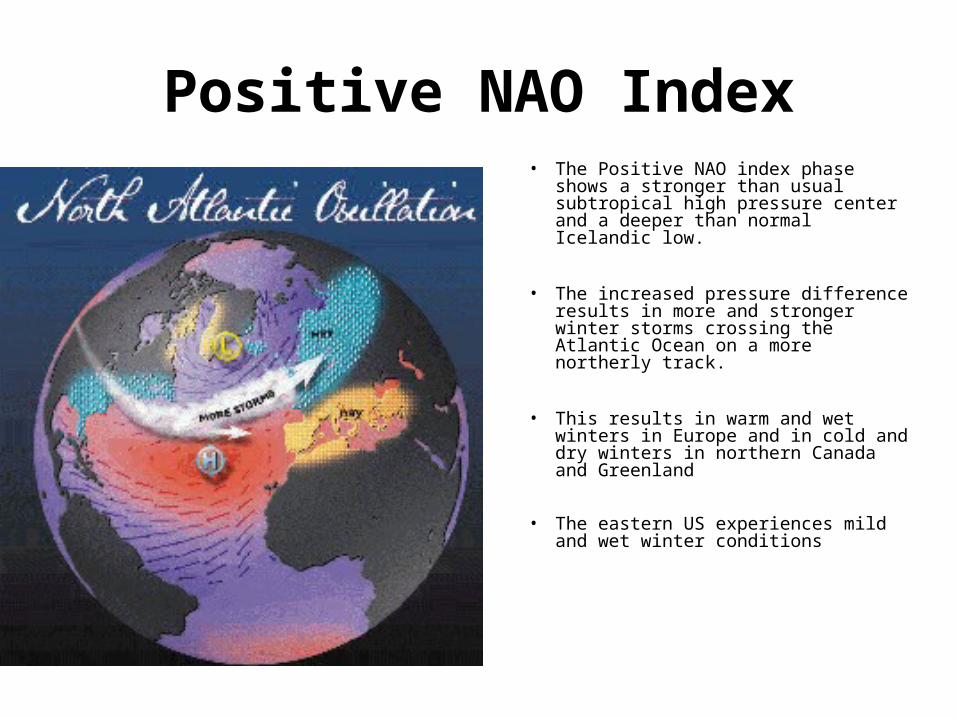
Positive NAO Index• The Positive NAO index phase
shows a stronger than usual subtropical high pressure center and a deeper than normal Icelandic low.
• The increased pressure difference results in more and stronger winter storms crossing the Atlantic Ocean on a more northerly track.
• This results in warm and wet winters in Europe and in cold and dry winters in northern Canada and Greenland
• The eastern US experiences mild and wet winter conditions

Meteo 1020 – Lecture 4The Natural Variability of the Earth-Atmosphere System
• Natural variability can be classified by its forcing type (internal or external to the climate system) and whether it is periodic/cyclic or episodic.
Modes of Natural Variability that we know of:timescale form forcing
1. Seasonal 90 days cyclic external2. El nino 3-5 yrs cyclic internal3. North Atlantic Oscillation decadal cyclic
internal??4. Volcanism none episodic external5. Ice ages 40,000 yrs cyclic internal6. Pacific Decadal 20-50 yrs cyclic ????

Volcanic eruptions and climate:
• The present atmospheric composition, Nitrogen-78%, Oxygen-21%, Argon-<1%, water vapor-0.4%, carbon dioxide-0.036%
• How did the present atmospheric composition evolve?
• Assume outgassing from early volcanoes provided the first atmosphere.
• Composition of volcanic gasses: Water vapor-80%, Nitrogen-1%, Oxygen-0%, carbon dioxide-12%, sulphur compounds and others-7%
Volcanism and the early atmosphere:
So how did the atmosphere evolve from the volcanic composition to our present composition?
1. Water began to precipitate early – forming oceans2. Carbon Dioxide dissolved rapidly in the early oceans reaching
saturation and leading to precipitate of Calcium carbonate to the deep ocean
3. Nitrogen and argon built up slowly since it does not dissolve in sea water
4. Oxygen built up in the atmosphere due to by product of photosynthesis.
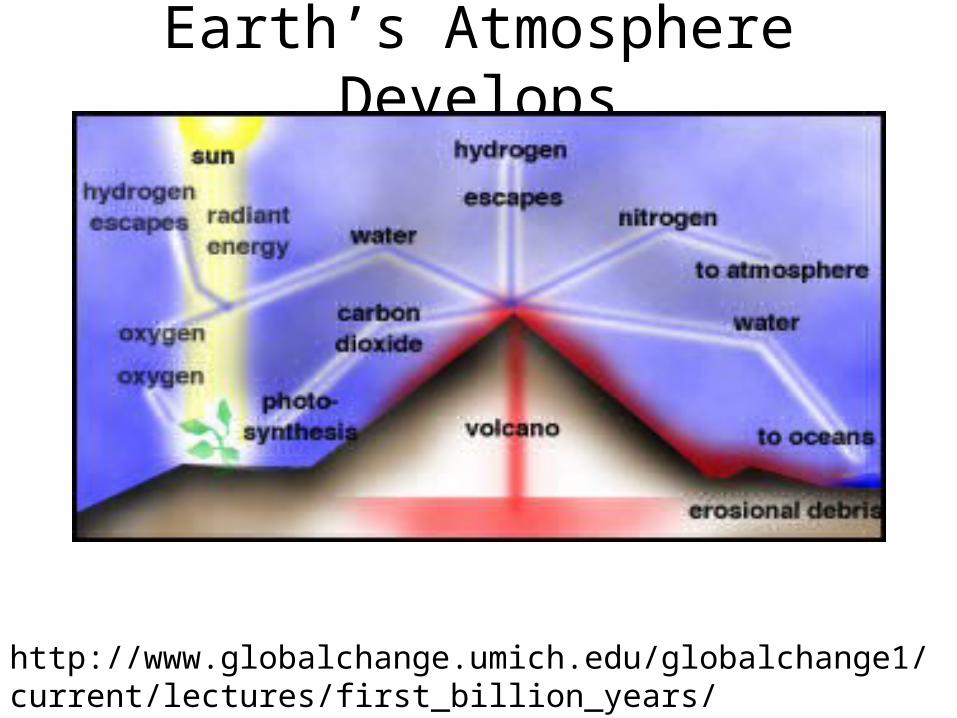
Earth’s Atmosphere Develops
http://www.globalchange.umich.edu/globalchange1/current/lectures/first_billion_years/first_billion_years.html
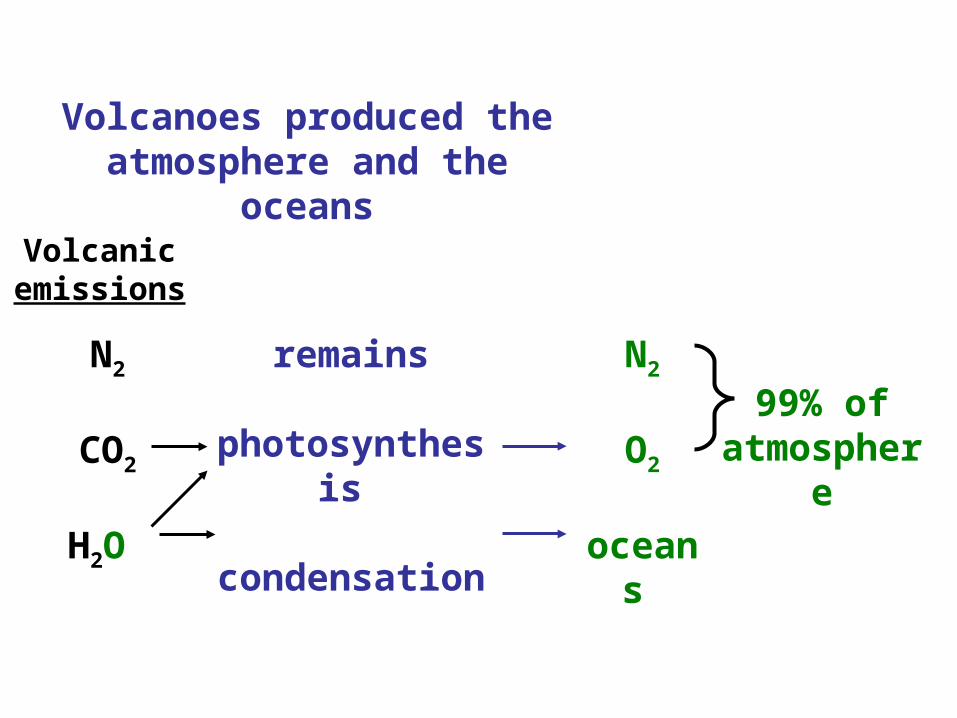
Volcanoes produced the atmosphere and the
oceans
N2
CO2
H2O
Volcanic emissions
N2
O2
oceans
99% of atmosphe
re
remains
photosynthesis
condensation

EFFECTS OF LARGE EXPLOSIVE TROPICAL
VOLCANOES ON WEATHER AND CLIMATEEFFECT/MECHANISM BEGI NS DURATION
1. Enhance or reduce El Niño? 1- 2 weeks 1- 2 months Tropospheric absorption of shortwave and longwave radiation, dynamics
2. Reduction of diurnal cycle Immediately 1- 4 days Blockage of shortwave and emission of longwave radiation
3. Summer cooling of NH tropics, subtropics Immediately 1- 2 years Blockage of shortwave radiation
4. Reduced tropical precipitation Immediately ~1 year Blockage of shortwave radiation, reduced evaporation
5. Reduced Sahel precipitation (?) 1- 3 months 1- 2 years Blockage of shortwave radiation, reduced land temp., reduced evaporation

EFFECTS OF LARGE EXPLOSIVE TROPICAL
VOLCANOES ON WEATHER AND CLIMATEEFFECT/MECHANISM BEGI NS DURATION
6. Ozone depletion, enhanced UV 1 day 1- 2 years Dilution, heterogeneous chemistry on aerosols
7. Global cooling Immediately 1- 3 years Blockage of shortwave radiation multiple eruptions: 10- 100 years
8. Stratospheric warming Immediately 1- 2 years Stratospheric absorption of shortwave and longwave radiation
9. Winter warming of NH continents ½- 1½ years 1 or 2 winters Stratospheric absorption of shortwave and longwave radiation, dynamics
High latitude eruptions:
10. Cooling of continents Immediately 1- 2 years Blockage of shortwave radiation
11. Reduction of I ndian summer monsoon ½- 1½ years 1 or 2 summers Continental cooling, reduction of land-sea temperature contrast

Tambora in 1815, together with an eruption from an unknown volcano in
1809, producedthe “Year Without a Summer” (1816)

Tambora, 1815, produced the “Year Without a Summer”
(1816)
George Gordon,
Lord Byron
Percy Bysshe Shelley Mary Shelley

“The Scream”
Edvard Munch
Painted in 1893 based on Munch’s
memory of the brilliant sunsets
following the 1883 Krakatau
eruption.

PinatuboJune 12, 1991
Three days before major eruption of
June 15, 1991
Photo from USGS.

These two photos show the Earth’s limb at sunset before and after the Mt. Pinatubo eruption. The first view (STS41D-32-14) shows a relatively clear atmosphere, taken August 30, 1984. Astronauts were looking at the profiles of high thunderstorms topping out at the tropopause at sunset; different atmospheric layers absorbed the last rays of light from the sun as the spacecraft moved eastward.
The same type of photograph (STS043-22-23) was taken August 8, 1991, less than two months after the Pinatubo eruption. Two dark layers of aerosols make distinct boundaries in the atmosphere. The estimated altitude of aerosol layers in this view is 20 to 25 km.
From http://earthobservatory.nasa.gov/Study/AstronautPinatubo/astronaut_pinatubo2.html

Casadevall et al. (1996)
Bataan

After Pinatubo, Clark Air Force Base 25 km from volcano
Photo by R. P. Hoblitt, June 15, 1991

After Pinatubo, Cubi Point Naval Air Station, 40 km from volcano
U.S. Navy photograph by R. L. Rieger

After Pinatubo, Subic Bay Naval Base 35 km from volcano
Photo by Tom Grzelak

The climate effects of volcanic eruptions:
What makes an eruption climatically significant?• nature of the eruption – lava vs. ash (ash is more significant)• composition – need high sulfur dioxide gas content• location – Tropical eruption spread globally
In most eruptions, the particulates have only a minor effect. If the sulfur dioxide gas can reach the stratosphere, it converts to small sulfuric acid droplets that have long residence times in the stable stratosphere. It is this cloud of particles that spread and influence climate over long periods. Note Figure 4.3 in the book.

• Natural variability can be classified by its forcing type (internal or external to the climate system) and whether it is periodic/cyclic or episodic.
Modes of Natural Variability that we know of:timescale form forcing
1. Seasonal 90 days cyclic external2. El nino 3-5 yrs cyclic internal3. North Atlantic Oscillation decadal cyclic
internal??4. Volcanism none episodic external5. Ice ages 40,000 yrs cyclic internal6. Pacific Decadal 20-50 yrs cyclic ????

Pacific Decadal Oscillation

warm phase cool phase
Pacific Decadal Oscillation