Embed Size (px)
Citation preview
cushmanwakefield.com I 1
Dallas-Fort WorthOffice Q4 2017
MARKETBEAT
EconomyThe Dallas-Fort Worth-Arlington economy continues to thrive, as increases in total population and overall employment persists. According to Moody’s Analytics, population increased by 144,000 year-over-year, reaching 7.44 million people at the close of 2017. This equates to an average of 400 new residents each day. During the same time period, the Dallas-Fort Worth-Arlington employment base increased by 90,000, dropping the unemployment rate by 70 basis points (bps) and closing 2017 at 3.3%. Out of the 90,000 jobs added, 37% (33,000 jobs) can be attributed to the office sector, which includes business and professional services, information/technology, and financial activities. The business and professional services category accounts for 62% (620,000 jobs) of the entire office sector employment base (993,000 jobs) and is the leading indicator for office space demand.
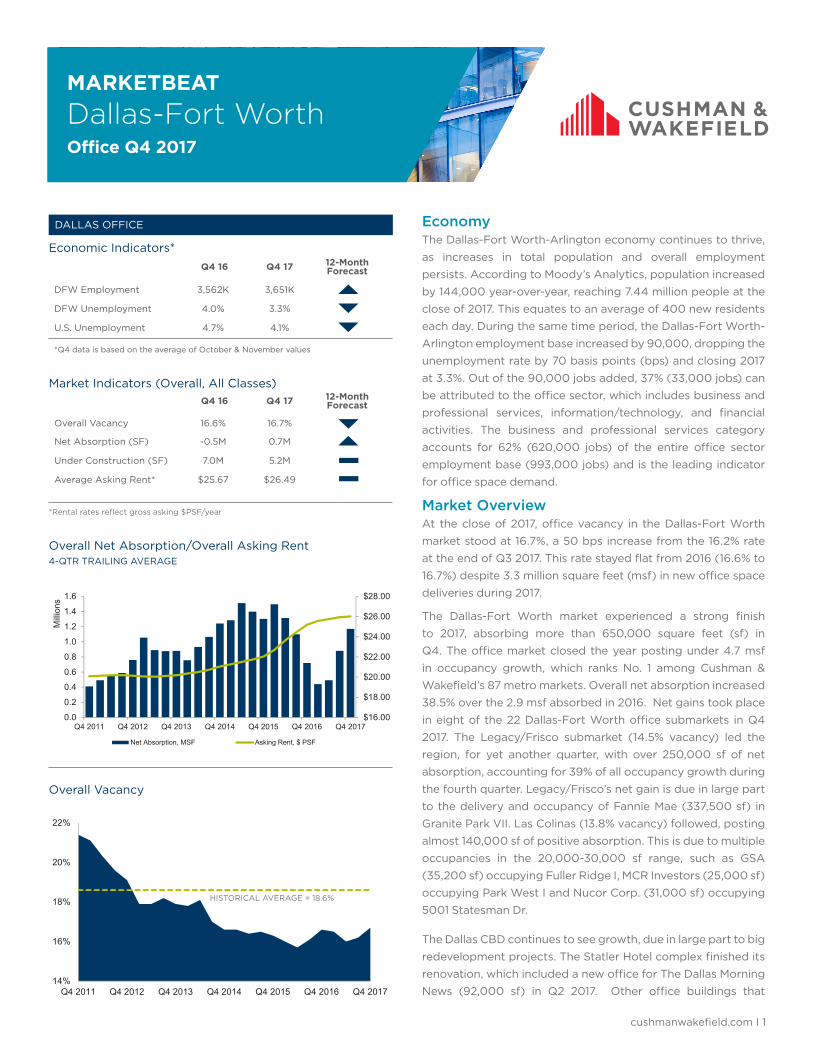
Market OverviewAt the close of 2017, office vacancy in the Dallas-Fort Worth market stood at 16.7%, a 50 bps increase from the 16.2% rate at the end of Q3 2017. This rate stayed flat from 2016 (16.6% to 16.7%) despite 3.3 million square feet (msf) in new office space deliveries during 2017.
The Dallas-Fort Worth market experienced a strong finish to 2017, absorbing more than 650,000 square feet (sf) in Q4. The office market closed the year posting under 4.7 msf in occupancy growth, which ranks No. 1 among Cushman & Wakefield’s 87 metro markets. Overall net absorption increased 38.5% over the 2.9 msf absorbed in 2016. Net gains took place in eight of the 22 Dallas-Fort Worth office submarkets in Q4 2017. The Legacy/Frisco submarket (14.5% vacancy) led the region, for yet another quarter, with over 250,000 sf of net absorption, accounting for 39% of all occupancy growth during the fourth quarter. Legacy/Frisco’s net gain is due in large part to the delivery and occupancy of Fannie Mae (337,500 sf) in Granite Park VII. Las Colinas (13.8% vacancy) followed, posting almost 140,000 sf of positive absorption. This is due to multiple occupancies in the 20,000-30,000 sf range, such as GSA (35,200 sf) occupying Fuller Ridge I, MCR Investors (25,000 sf) occupying Park West I and Nucor Corp. (31,000 sf) occupying 5001 Statesman Dr.
The Dallas CBD continues to see growth, due in large part to big redevelopment projects. The Statler Hotel complex finished its renovation, which included a new office for The Dallas Morning News (92,000 sf) in Q2 2017. Other office buildings that
DALLAS OFFICE
Overall Vacancy
Overall Net Absorption/Overall Asking Rent 4-QTR TRAILING AVERAGE
Market Indicators (Overall, All Classes) Q4 16 Q4 17 12-Month
Forecast
Overall Vacancy 16.6% 16.7%
Net Absorption (SF) -0.5M 0.7M
Under Construction (SF) 7.0M 5.2M
Average Asking Rent* $25.67 $26.49
Economic Indicators* Q4 16 Q4 17 12-Month
Forecast
DFW Employment 3,562K 3,651K
DFW Unemployment 4.0% 3.3%
U.S. Unemployment 4.7% 4.1%
*Q4 data is based on the average of October & November values
*Rental rates reflect gross asking $PSF/year
$16.00
$18.00
$20.00
$22.00
$24.00
$26.00
$28.00
0.0
0.2
0.4
0.6
0.8
1.0
1.2
1.4
1.6
Q4 2011 Q4 2012 Q4 2013 Q4 2014 Q4 2015 Q4 2016 Q4 2017
Milli
ons
Net Absorption, MSF Asking Rent, $ PSF
14%
16%
18%
20%
22%
Q4 2011 Q4 2012 Q4 2013 Q4 2014 Q4 2015 Q4 2016 Q4 2017
HISTORICAL AVERAGE = 18.6%
cushmanwakefield.com I 2
Dallas-Fort WorthOffice Q4 2017
MARKETBEAT
benefitted from renovations were 2551 Elm (44,600 sf YTD net absorption), Factory Six03 (34,800 sf), 400 Record (13,400 sf) and Ross Tower (12,000 sf). Trammell Crow Center is currently being redeveloped; improvements have encouraged tenants such as Vinson & Elkins and Baker Botts to renew their leases of 108,000 sf and 101,700 sf, respectively. Dallas CBD wrapped up 2017 with a vacancy rate of 24.7%, relatively unchanged from the rate (24.8%) that was in place at the close of Q4 2016.
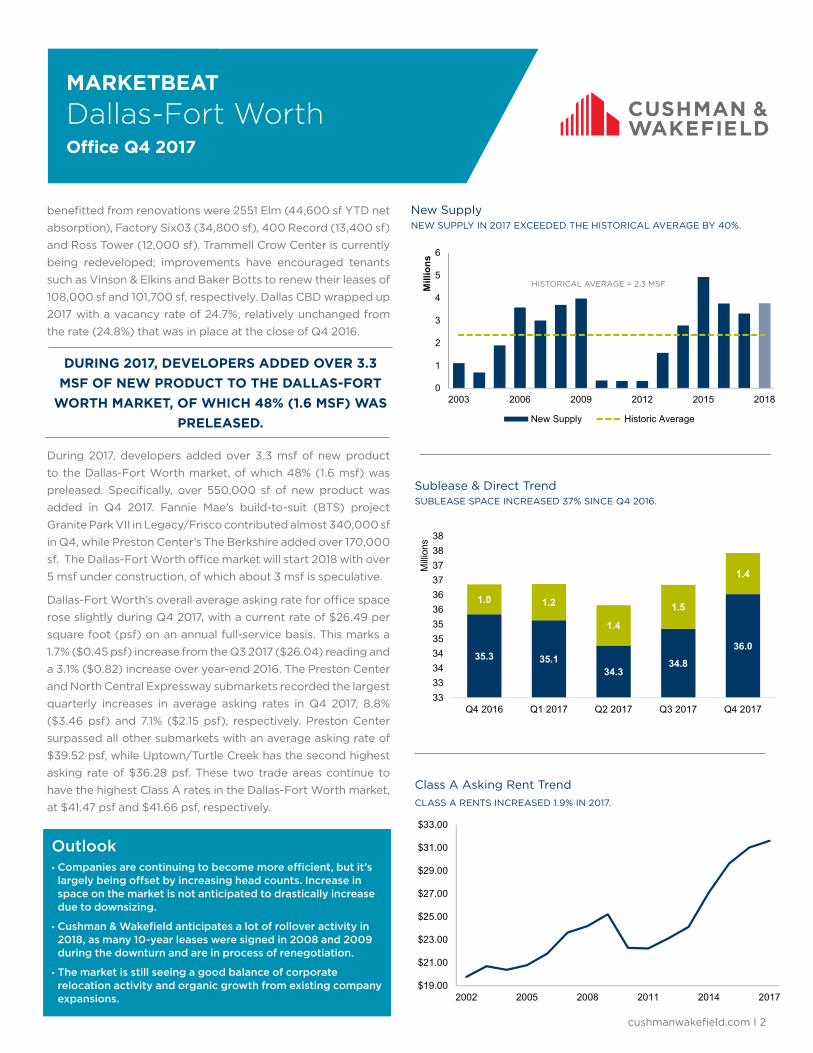
During 2017, developers added over 3.3 msf of new product to the Dallas-Fort Worth market, of which 48% (1.6 msf) was preleased. Specifically, over 550,000 sf of new product was added in Q4 2017. Fannie Mae’s build-to-suit (BTS) project Granite Park VII in Legacy/Frisco contributed almost 340,000 sf in Q4, while Preston Center’s The Berkshire added over 170,000 sf. The Dallas-Fort Worth office market will start 2018 with over 5 msf under construction, of which about 3 msf is speculative.
Dallas-Fort Worth’s overall average asking rate for office space rose slightly during Q4 2017, with a current rate of $26.49 per square foot (psf) on an annual full-service basis. This marks a 1.7% ($0.45 psf) increase from the Q3 2017 ($26.04) reading and a 3.1% ($0.82) increase over year-end 2016. The Preston Center and North Central Expressway submarkets recorded the largest quarterly increases in average asking rates in Q4 2017, 8.8% ($3.46 psf) and 7.1% ($2.15 psf), respectively. Preston Center surpassed all other submarkets with an average asking rate of $39.52 psf, while Uptown/Turtle Creek has the second highest asking rate of $36.28 psf. These two trade areas continue to have the highest Class A rates in the Dallas-Fort Worth market, at $41.47 psf and $41.66 psf, respectively.
Sublease & Direct Trend SUBLEASE SPACE INCREASED 37% SINCE Q4 2016.
DURING 2017, DEVELOPERS ADDED OVER 3.3 MSF OF NEW PRODUCT TO THE DALLAS-FORT
WORTH MARKET, OF WHICH 48% (1.6 MSF) WAS PRELEASED.
Class A Asking Rent TrendCLASS A RENTS INCREASED 1.9% IN 2017.
New Supply NEW SUPPLY IN 2017 EXCEEDED THE HISTORICAL AVERAGE BY 40%.
Outlook• Companies are continuing to become more efficient, but it’s largely being offset by increasing head counts. Increase in space on the market is not anticipated to drastically increase due to downsizing.
• Cushman & Wakefield anticipates a lot of rollover activity in 2018, as many 10-year leases were signed in 2008 and 2009 during the downturn and are in process of renegotiation.
• The market is still seeing a good balance of corporate relocation activity and organic growth from existing company expansions.
0
1
2
3
4
5
6
2003 2006 2009 2012 2015 2018
Mill
ions
New Supply Historic Average
35.3 35.134.3
34.8
36.0
1.0 1.2
1.4
1.5
1.4
333334343535363637373838
Q4 2016 Q1 2017 Q2 2017 Q3 2017 Q4 2017
Milli
ons
$19.00
$21.00
$23.00
$25.00
$27.00
$29.00
$31.00
$33.00
2002 2005 2008 2011 2014 2017
HISTORICAL AVERAGE = 2.3 MSF
cushmanwakefield.com I 3
Dallas-Fort WorthOffice Q4 2017
MARKETBEAT
*Rental rates reflect gross asking $PSF/year
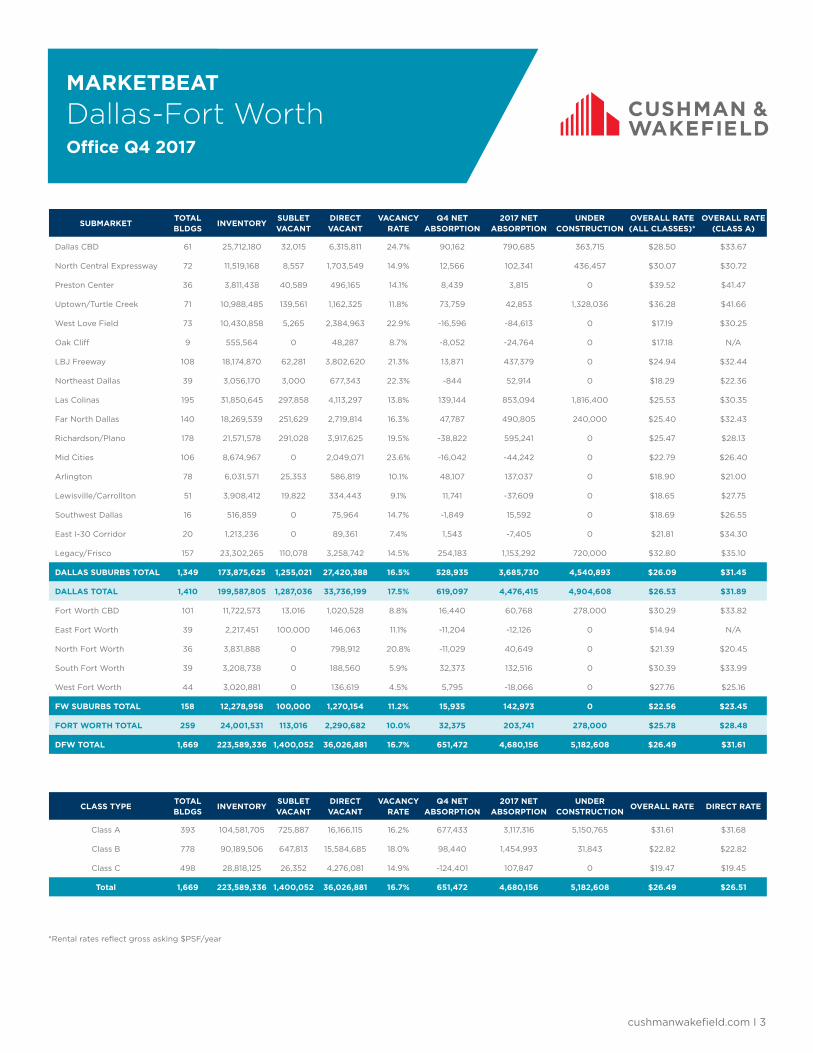
SUBMARKETTOTAL BLDGS
INVENTORYSUBLET VACANT
DIRECT VACANT
VACANCY RATE
Q4 NETABSORPTION
2017 NET ABSORPTION
UNDERCONSTRUCTION
OVERALL RATE (ALL CLASSES)*
OVERALL RATE (CLASS A)
Dallas CBD 61 25,712,180 32,015 6,315,811 24.7% 90,162 790,685 363,715 $28.50 $33.67
North Central Expressway 72 11,519,168 8,557 1,703,549 14.9% 12,566 102,341 436,457 $30.07 $30.72
Preston Center 36 3,811,438 40,589 496,165 14.1% 8,439 3,815 0 $39.52 $41.47
Uptown/Turtle Creek 71 10,988,485 139,561 1,162,325 11.8% 73,759 42,853 1,328,036 $36.28 $41.66
West Love Field 73 10,430,858 5,265 2,384,963 22.9% -16,596 -84,613 0 $17.19 $30.25
Oak Cliff 9 555,564 0 48,287 8.7% -8,052 -24,764 0 $17.18 N/A
LBJ Freeway 108 18,174,870 62,281 3,802,620 21.3% 13,871 437,379 0 $24.94 $32.44
Northeast Dallas 39 3,056,170 3,000 677,343 22.3% -844 52,914 0 $18.29 $22.36
Las Colinas 195 31,850,645 297,858 4,113,297 13.8% 139,144 853,094 1,816,400 $25.53 $30.35
Far North Dallas 140 18,269,539 251,629 2,719,814 16.3% 47,787 490,805 240,000 $25.40 $32.43
Richardson/Plano 178 21,571,578 291,028 3,917,625 19.5% -38,822 595,241 0 $25.47 $28.13
Mid Cities 106 8,674,967 0 2,049,071 23.6% -16,042 -44,242 0 $22.79 $26.40
Arlington 78 6,031,571 25,353 586,819 10.1% 48,107 137,037 0 $18.90 $21.00
Lewisville/Carrollton 51 3,908,412 19,822 334,443 9.1% 11,741 -37,609 0 $18.65 $27.75
Southwest Dallas 16 516,859 0 75,964 14.7% -1,849 15,592 0 $18.69 $26.55
East I-30 Corridor 20 1,213,236 0 89,361 7.4% 1,543 -7,405 0 $21.81 $34.30
Legacy/Frisco 157 23,302,265 110,078 3,258,742 14.5% 254,183 1,153,292 720,000 $32.80 $35.10
DALLAS SUBURBS TOTAL 1,349 173,875,625 1,255,021 27,420,388 16.5% 528,935 3,685,730 4,540,893 $26.09 $31.45
DALLAS TOTAL 1,410 199,587,805 1,287,036 33,736,199 17.5% 619,097 4,476,415 4,904,608 $26.53 $31.89
Fort Worth CBD 101 11,722,573 13,016 1,020,528 8.8% 16,440 60,768 278,000 $30.29 $33.82
East Fort Worth 39 2,217,451 100,000 146,063 11.1% -11,204 -12,126 0 $14.94 N/A
North Fort Worth 36 3,831,888 0 798,912 20.8% -11,029 40,649 0 $21.39 $20.45
South Fort Worth 39 3,208,738 0 188,560 5.9% 32,373 132,516 0 $30.39 $33.99
West Fort Worth 44 3,020,881 0 136,619 4.5% 5,795 -18,066 0 $27.76 $25.16
FW SUBURBS TOTAL 158 12,278,958 100,000 1,270,154 11.2% 15,935 142,973 0 $22.56 $23.45
FORT WORTH TOTAL 259 24,001,531 113,016 2,290,682 10.0% 32,375 203,741 278,000 $25.78 $28.48
DFW TOTAL 1,669 223,589,336 1,400,052 36,026,881 16.7% 651,472 4,680,156 5,182,608 $26.49 $31.61
CLASS TYPETOTAL BLDGS
INVENTORYSUBLET VACANT
DIRECT VACANT
VACANCY RATE
Q4 NETABSORPTION
2017 NET ABSORPTION
UNDERCONSTRUCTION
OVERALL RATE DIRECT RATE
Class A 393 104,581,705 725,887 16,166,115 16.2% 677,433 3,117,316 5,150,765 $31.61 $31.68
Class B 778 90,189,506 647,813 15,584,685 18.0% 98,440 1,454,993 31,843 $22.82 $22.82
Class C 498 28,818,125 26,352 4,276,081 14.9% -124,401 107,847 0 $19.47 $19.45
Total 1,669 223,589,336 1,400,052 36,026,881 16.7% 651,472 4,680,156 5,182,608 $26.49 $26.51
Dallas-Fort WorthOffice Q4 2017
MARKETBEAT
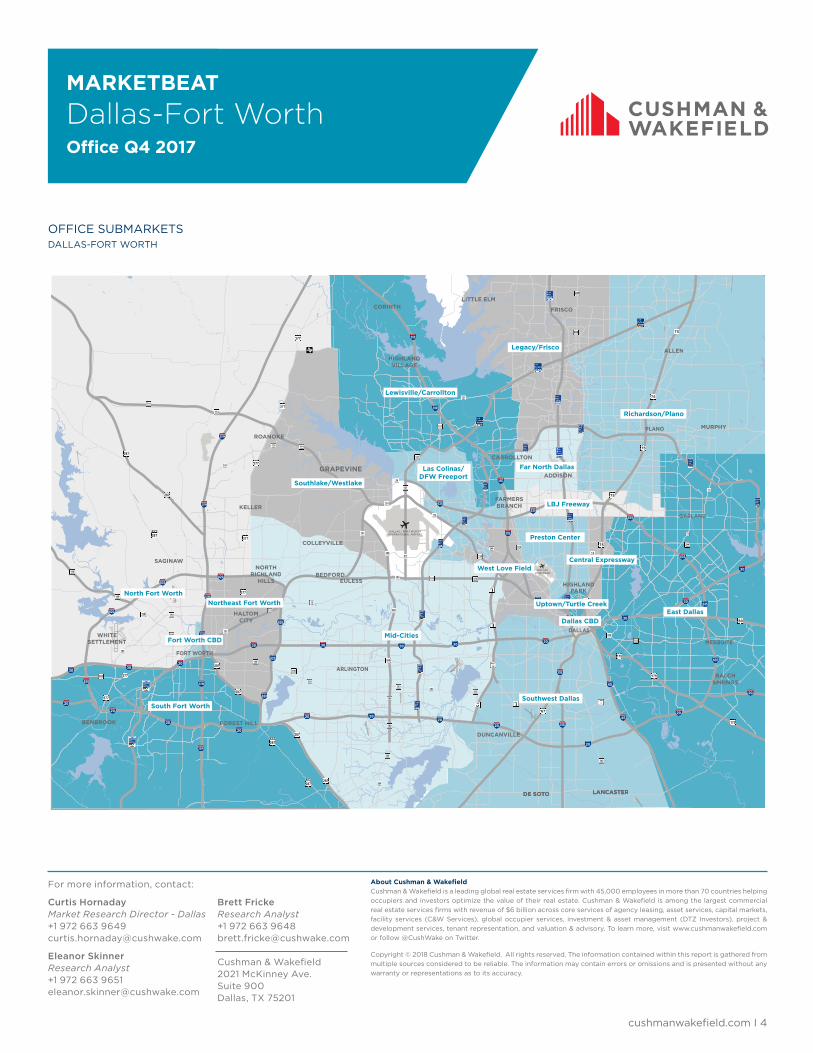
OFFICE SUBMARKETS DALLAS-FORT WORTH
ROANOKE
KELLER
LANCASTERLANCASTER
BALCHSPRINGS
MURPHY
NORTHRICHLAND
HILLS
HALTOMCITY
DE SOTODE SOTO
ALLEN
FRISCO
EULESS
COLLEYVILLE
SAGINAW
FOREST HILL
CORINTH
WHITESETTLEMENT
BEDFORD
DUNCANVILLE
LITTLE ELM
BENBROOK
FARMERSBRANCH
HIGHLANDPARK
ADDISON
HIGHLANDVILLAGE
CARROLLTON
DALLAS
FORT WORTH
MESQUITE
ARLINGTON
GARLAND
PLANO
DALLASLOVE FIELD
DALLAS / FORT WORTHINTERNATIONAL AIRPORT
GRAPEVINE
78TEXAS
78TEXAS
244TEXAS
12TEXAS
352TEXAS
352TEXAS
12TEXAS
75
75
75
75
75
75
75
175
67
30
30 635
30 80
635
635
635
20
20
175
20
45
45
17520 35E
35E
635
635
289TEXAS
289TEXAS
35E
35E
35E
354TEXAS
35E
35E
3030
114TEXAS
114TEXAS
183TEXAS
183TEXAS
348TEXAS
342TEXAS
360TEXAS
360TEXAS
20
360TEXAS
183TEXAS
97TEXAS
30
20
303TEXAS 303
TEXAS
360TEXAS
303TEXAS
360TEXAS
360TEXAS
180TEXAS
303TEXAS
820
20
30
820
820
287
287
287
20
287
10TEXAS
180TEXAS
121TEXAS
121TEXAS
37735W
820820
35W
35W
35W
30
3030
121TEXAS
360TEXAS
377
170TEXAS
114TEXAS
114TEXAS
114TEXAS
35W
35W
114TEXAS
114TEXAS
287
287
287B U S
377
820
199TEXAS
199TEXAS
199TEXAS
199TEXAS
183TEXAS
183TEXAS
20
20
20
30
820377
377
580TEXAS
287B U S
287B U S
170TEXAS
377
26TEXAS
121TEXAS
121TEXAS
635
121TEXAS
35E
35E
121TEXAS
377
407
North Fort Worth
South Fort Worth
Fort Worth CBD
Northeast Fort Worth
Mid-Cities
Southlake/Westlake
Southwest Dallas
Dallas CBD
Uptown/Turtle Creek
West Love Field
Las Colinas/DFW Freeport
Preston Center
Central Expressway
East Dallas
LBJ Freeway
Richardson/Plano
Legacy/Frisco
Far North Dallas
Lewisville/Carrollton
For more information, contact:
Curtis Hornaday Market Research Director - Dallas+1 972 663 [email protected]
Eleanor SkinnerResearch Analyst+1 972 663 [email protected]
Brett FrickeResearch Analyst+1 972 663 [email protected]
Cushman & Wakefield2021 McKinney Ave.Suite 900Dallas, TX 75201
cushmanwakefield.com I 4
About Cushman & WakefieldCushman & Wakefield is a leading global real estate services firm with 45,000 employees in more than 70 countries helping occupiers and investors optimize the value of their real estate. Cushman & Wakefield is among the largest commercial real estate services firms with revenue of $6 billion across core services of agency leasing, asset services, capital markets, facility services (C&W Services), global occupier services, investment & asset management (DTZ Investors), project & development services, tenant representation, and valuation & advisory. To learn more, visit www.cushmanwakefield.com or follow @CushWake on Twitter.
Copyright © 2018 Cushman & Wakefield. All rights reserved. The information contained within this report is gathered from multiple sources considered to be reliable. The information may contain errors or omissions and is presented without any warranty or representations as to its accuracy.