Embed Size (px)
Citation preview
1 September 2014 — Metals Monitor
1
Metals Monitor
1 September 2014 — Metals Monitor
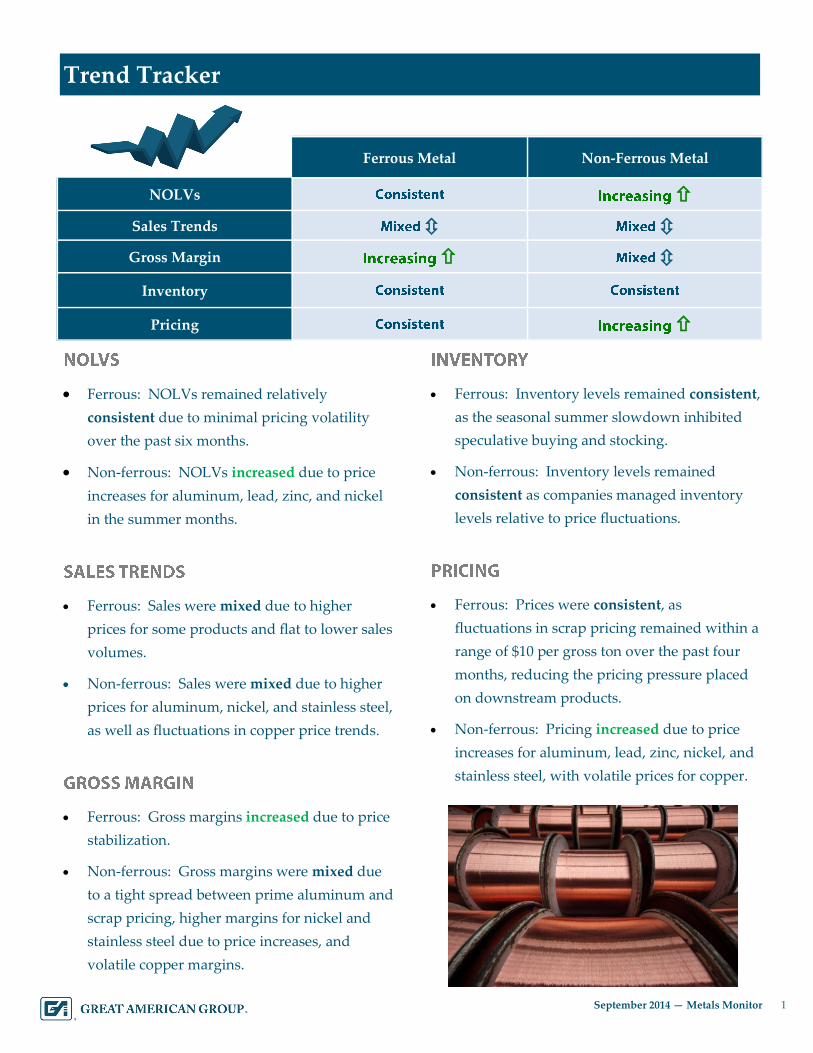
1 Trend Tracker
Ferrous: NOLVs remained relatively
consistent due to minimal pricing volatility
over the past six months.
Non-ferrous: NOLVs increased due to price
increases for aluminum, lead, zinc, and nickel
in the summer months.
Ferrous: Sales were mixed due to higher
prices for some products and flat to lower sales
volumes.
Non-ferrous: Sales were mixed due to higher
prices for aluminum, nickel, and stainless steel,
as well as fluctuations in copper price trends.
Ferrous: Gross margins increased due to price
stabilization.
Non-ferrous: Gross margins were mixed due
to a tight spread between prime aluminum and
scrap pricing, higher margins for nickel and
stainless steel due to price increases, and
volatile copper margins.
Ferrous: Inventory levels remained consistent,
as the seasonal summer slowdown inhibited
speculative buying and stocking.
Non-ferrous: Inventory levels remained
consistent as companies managed inventory
levels relative to price fluctuations.
Ferrous: Prices were consistent, as
fluctuations in scrap pricing remained within a
range of $10 per gross ton over the past four
months, reducing the pricing pressure placed
on downstream products.
Non-ferrous: Pricing increased due to price
increases for aluminum, lead, zinc, nickel, and
stainless steel, with volatile prices for copper.
Ferrous Metal Non-Ferrous Metal
NOLVs
Sales Trends
Gross Margin
Inventory
Pricing
2 September 2014 — Metals Monitor
2 Overview
Over the summer, the demand outlook for steel brightened
slightly, although the steel market remains clouded by excess
capacity and economic uncertainty. Meanwhile, supply
pressures boosted prices for many base metals in recent months.
In the U.S., prices for flat rolled coil and rebar
slipped in June amid the seasonal summer
slowdown. Hot rolled coil prices recovered in
July, joined by cold rolled coil prices in
August, while rebar prices held firm. Plate
pricing, meanwhile, continued its steady
ascent. Steel buyers demonstrated healthy
demand despite a high level of imports.
However, shifts in the economic or political
landscape, as well as the announced addition
of steel capacity through 2020, could pose a
threat to the domestic steel market.
Base metals have experienced tightness in the
physical markets due to supply and demand
factors, lifting prices for aluminum, zinc, and
lead more than expected.
The elevation in prices may be short-lived,
however, as the volumes of metals held in
and out of official exchange warehouses
distort the physical markets. In addition,
demand remains tepid, and supplies of base
metal scrap are readily available, with the
exception of stainless steel scrap.
3 September 2014 — Metals Monitor
3 Overview
The automotive industry is a significant consumer of steel
and aluminum. Auto sales climbed throughout the
summer, buoyed by a perfect storm of seasonal incentives,
higher demand for trucks and SUVs, easier accessibility to
credit, new product offerings, lower gas prices, and
improvement in the economy.
In August 2014, overall auto sales increased 5.5% year-
over-year, with one less selling day to boot. Moreover, the
industry’s annualized selling rate reached 17.5 million
vehicles, according to Autodata, marking the highest level
in nearly eight years and returning the industry to pre-
recession levels. Of the “Big Three” Detroit automakers,
Chrysler Group LLC posted the best results, with a 20%
sales increase in August. Meanwhile, Ford Motor
Company experienced flat year-over-year sales, while
General Motors Company’s sales slipped 1%. Asian
automakers fared better, with most registering sales
increases. Analysts are optimistic auto sales will continue
to grow at a healthy pace through the end of 2014.
The Institute for Supply Management’s purchasing
manager’s index (“PMI”), an indicator for manufacturing
activity, has generally increased in recent months. The
PMI rose 1.9 points from 57.1 in July to 59.0 in August,
marking the highest reading in the last year, while the
lowest reading of 51.3 was registered in January.
A reading above 50 indicates the manufacturing economy
is generally expanding, while a reading below 50 reflects
general contraction. The manufacturing sector has
expanded for the 15th consecutive month. A PMI above
42.2 over a period of time typically denotes an expansion
of the overall economy. The August PMI therefore
demonstrated growth in the overall economy for the 63rd
consecutive month.
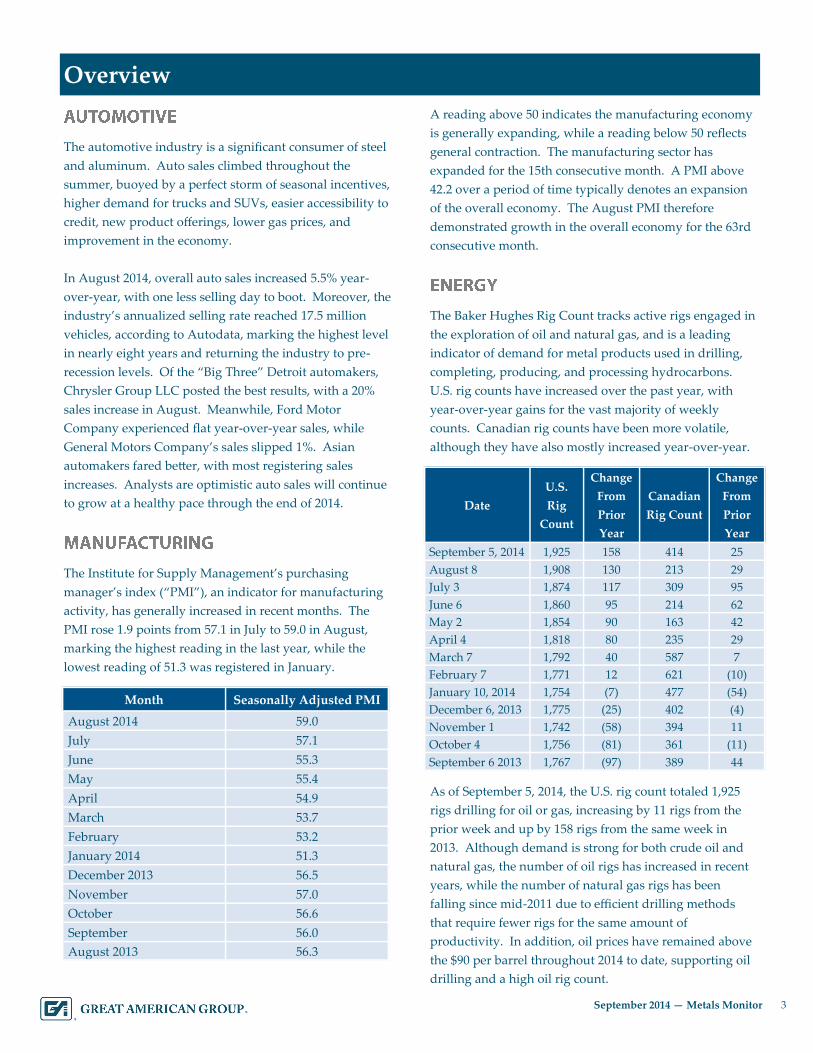
The Baker Hughes Rig Count tracks active rigs engaged in
the exploration of oil and natural gas, and is a leading
indicator of demand for metal products used in drilling,
completing, producing, and processing hydrocarbons.
U.S. rig counts have increased over the past year, with
year-over-year gains for the vast majority of weekly
counts. Canadian rig counts have been more volatile,
although they have also mostly increased year-over-year.
As of September 5, 2014, the U.S. rig count totaled 1,925
rigs drilling for oil or gas, increasing by 11 rigs from the
prior week and up by 158 rigs from the same week in
2013. Although demand is strong for both crude oil and
natural gas, the number of oil rigs has increased in recent
years, while the number of natural gas rigs has been
falling since mid-2011 due to efficient drilling methods
that require fewer rigs for the same amount of
productivity. In addition, oil prices have remained above
the $90 per barrel throughout 2014 to date, supporting oil
drilling and a high oil rig count.
Month Seasonally Adjusted PMI
August 2014 59.0
July 57.1
June 55.3
May 55.4
April 54.9
March 53.7
February 53.2
January 2014 51.3
December 2013 56.5
November 57.0
October 56.6
September 56.0
August 2013 56.3
Date
U.S.
Rig
Count
Change
From
Prior
Year
Canadian
Rig Count
Change
From
Prior
Year
September 5, 2014 1,925 158 414 25
August 8 1,908 130 213 29
July 3 1,874 117 309 95
June 6 1,860 95 214 62
May 2 1,854 90 163 42
April 4 1,818 80 235 29
March 7 1,792 40 587 7
February 7 1,771 12 621 (10)
January 10, 2014 1,754 (7) 477 (54)
December 6, 2013 1,775 (25) 402 (4)
November 1 1,742 (58) 394 11
October 4 1,756 (81) 361 (11)
September 6 2013 1,767 (97) 389 44
4 September 2014 — Metals Monitor
4 Recent Appraisal Trends
Appraisals valuing metals inventory typically rely on
market prices, which are affected by input costs,
supply levels, and demand from metal-consuming
industries such as the automotive, industrial, and oil
and gas drilling sectors.
Based on industry trends, NOLVs for ferrous metals
remained relatively consistent due to minimal
pricing volatility over the past six months. NOLVs
for non-ferrous metals increased, as supply-side
pressure drove up pricing for aluminum, lead, zinc,
and nickel throughout the summer months, while
other base metal prices were fairly volatile.
Sales of ferrous inventory were mixed, with no major
shift in demand for downstream products. Higher
prices this year versus last year helped stabilize
dollar sales trends, while sales volumes remained flat
to down. A number of companies expect demand
increases from the construction market in the third
quarter. Sales of non-ferrous inventory were also
mixed, as increases in aluminum, nickel, and
stainless steel pricing drove up dollar sales trends for
these metals versus last year, while copper sales
trends continue to fluctuate with pricing. However,
there were no major changes in sales volume trends.
Gross margins increased for ferrous metals as a result
of continued price stabilization, allowing mills and
distributors to rely on stable inventory costs and
maintain margins. Gross margin trends for non-
ferrous metals were mixed due to global pressures.
Continued increases in aluminum prices have
allowed companies to boost selling prices, but a tight
spread between prime aluminum and scrap pricing
has hindered gains in margin. Meanwhile, nickel
and stainless steel margins have gained steam from
price increases, while copper margins remain
volatile.
Inventory levels for ferrous metals were consistent,
as the seasonal summer slowdown inhibited
speculative buying and stocking. However, moving
into the fall season, restocking will begin to take
place in the market. Inventory levels for non-ferrous
metals also remained relatively consistent, as
companies continue to manage inventory levels
relative to pricing fluctuations.
Prices for ferrous metals were consistent, as
fluctuations in scrap pricing remained within a range
of $10 per gross ton over the past four months,
reducing the pricing pressure placed on downstream
products. Despite slight downward pricing pressure
for flat rolled coil products in certain months, the
declines were slight, as were the recent increases.
Plate and pipe/tube pricing have experienced slight
price increases over the past six months, while rebar
pricing remained largely unchanged.
Prices for non-ferrous metals increased domestically
due to tight supplies and anticipated demand
increases for aluminum, as well as tight nickel
supplies, which boosted pricing for both nickel and
stainless steel. Supply pressures also buoyed pricing
for lead and zinc in recent months. While copper
exhibited volatile prices, there had been no major
movement in the past few months.
For commodity-based appraisals, the gross recovery
rates are based on discounts from market pricing.
Specialized grades, sizes, and forms of metals with
limited distribution channels typically require
increased discounts off market price, or may be sold
at scrap market value. GA recognizes recovery
values are unique for each company based on
costing, gross margin trends, inventory mix and
levels, and other company-specific factors. In
addition, as market prices are volatile, a change in
metals market price trends would have an impact on
recovery values.
5 September 2014 — Metals Monitor
5 Carbon Steel
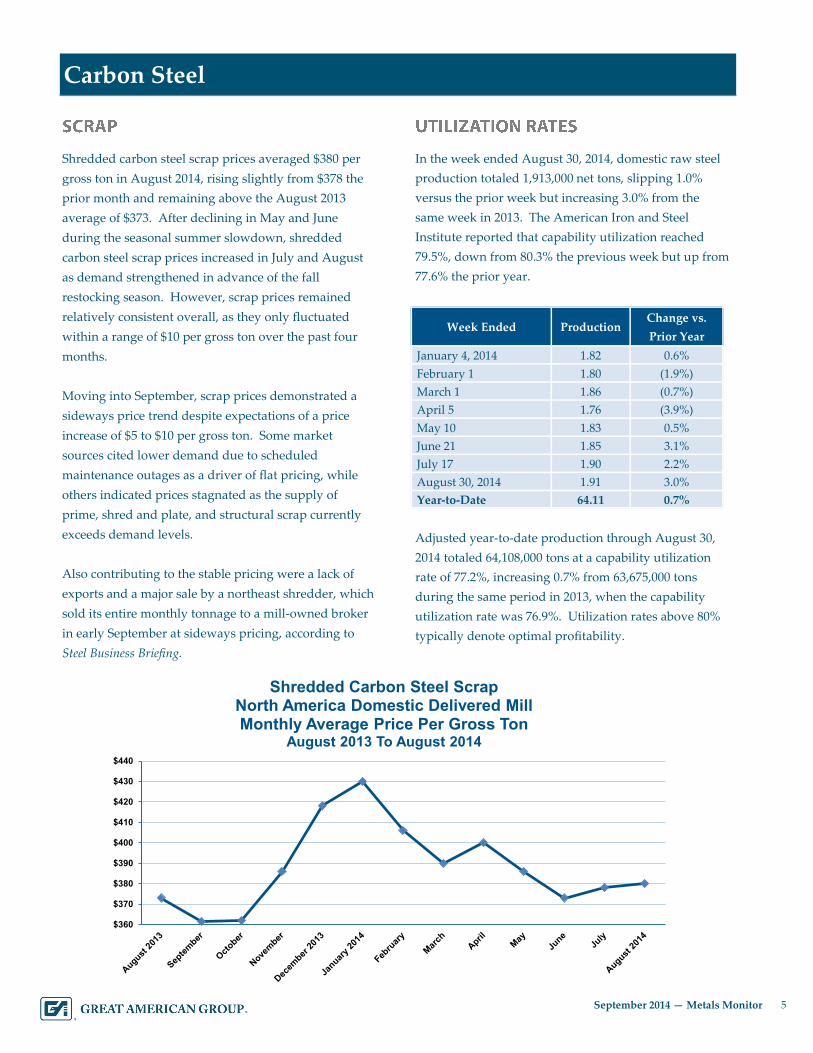
Shredded carbon steel scrap prices averaged $380 per
gross ton in August 2014, rising slightly from $378 the
prior month and remaining above the August 2013
average of $373. After declining in May and June
during the seasonal summer slowdown, shredded
carbon steel scrap prices increased in July and August
as demand strengthened in advance of the fall
restocking season. However, scrap prices remained
relatively consistent overall, as they only fluctuated
within a range of $10 per gross ton over the past four
months.
Moving into September, scrap prices demonstrated a
sideways price trend despite expectations of a price
increase of $5 to $10 per gross ton. Some market
sources cited lower demand due to scheduled
maintenance outages as a driver of flat pricing, while
others indicated prices stagnated as the supply of
prime, shred and plate, and structural scrap currently
exceeds demand levels.
Also contributing to the stable pricing were a lack of
exports and a major sale by a northeast shredder, which
sold its entire monthly tonnage to a mill-owned broker
in early September at sideways pricing, according to
Steel Business Briefing.
In the week ended August 30, 2014, domestic raw steel
production totaled 1,913,000 net tons, slipping 1.0%
versus the prior week but increasing 3.0% from the
same week in 2013. The American Iron and Steel
Institute reported that capability utilization reached
79.5%, down from 80.3% the previous week but up from
77.6% the prior year.
Adjusted year-to-date production through August 30,
2014 totaled 64,108,000 tons at a capability utilization
rate of 77.2%, increasing 0.7% from 63,675,000 tons
during the same period in 2013, when the capability
utilization rate was 76.9%. Utilization rates above 80%
typically denote optimal profitability.
Week Ended Production Change vs.
Prior Year
January 4, 2014 1.82 0.6%
February 1 1.80 (1.9%)
March 1 1.86 (0.7%)
April 5 1.76 (3.9%)
May 10 1.83 0.5%
June 21 1.85 3.1%
July 17 1.90 2.2%
August 30, 2014 1.91 3.0%
Year-to-Date 64.11 0.7%
$360
$370
$380
$390
$400
$410
$420
$430
$440
Shredded Carbon Steel ScrapNorth America Domestic Delivered MillMonthly Average Price Per Gross Ton
August 2013 To August 2014
6 September 2014 — Metals Monitor
6 Carbon Steel
Hot rolled coil steel prices averaged $681 per net ton in
August 2014, rising from $675 the prior month and
remaining above the August 2013 average of $659. Cold
rolled coil steel prices averaged $801 per net ton in
August 2014, up from $799 in July and remaining above
the August 2013 average of $765.
Market sentiment remained in flux in the early summer,
with tepid demand, steady end-user offtake, sufficient
stock levels, and slight de-stocking in advance of the
seasonally slower summer months. After falling in
June, hot rolled coil prices increased in July and August,
aided by US Steel’s price hike of $25 per net ton
announced at the beginning of July. After slipping in
June and July, cold rolled coil prices increased slightly
in August.
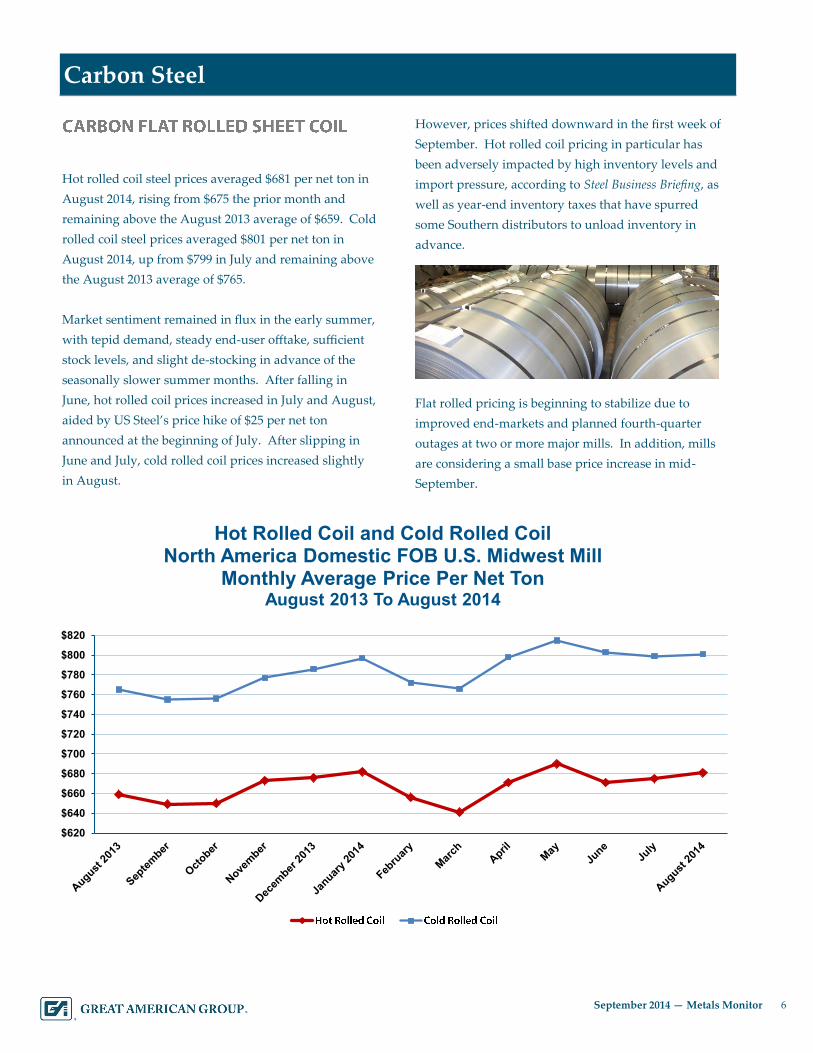
However, prices shifted downward in the first week of
September. Hot rolled coil pricing in particular has
been adversely impacted by high inventory levels and
import pressure, according to Steel Business Briefing, as
well as year-end inventory taxes that have spurred
some Southern distributors to unload inventory in
advance.
Flat rolled pricing is beginning to stabilize due to
improved end-markets and planned fourth-quarter
outages at two or more major mills. In addition, mills
are considering a small base price increase in mid-
September.
$620
$640
$660
$680
$700
$720
$740
$760
$780
$800
$820
Hot Rolled Coil and Cold Rolled CoilNorth America Domestic FOB U.S. Midwest Mill
Monthly Average Price Per Net TonAugust 2013 To August 2014
7 September 2014 — Metals Monitor
7 Carbon Steel
A36 steel plate prices averaged $850 per net ton in
August 2014, inching up from $847 per net ton in July
and remaining above the August 2013 average of $711.
Steel plate prices have been rising since late 2013 due to
strong demand, which has more than offset an influx of
plate imports and resulted in extended lead times
throughout 2014, according to Steel Business Briefing.
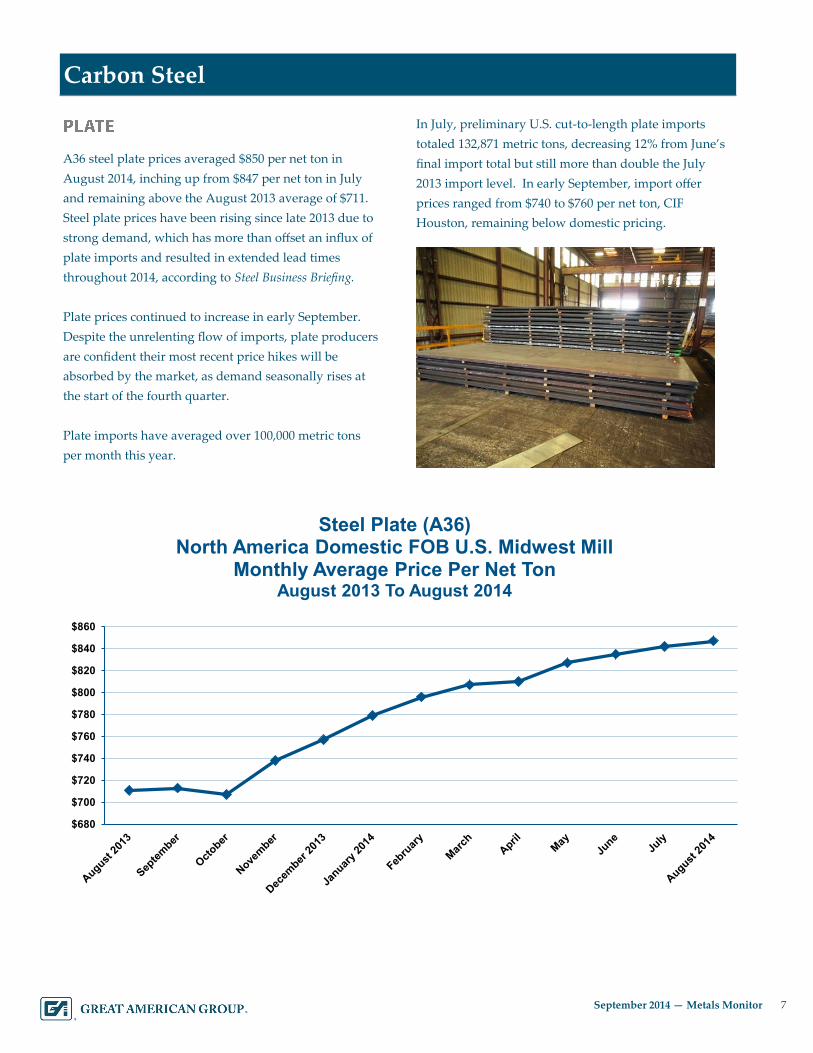
Plate prices continued to increase in early September.
Despite the unrelenting flow of imports, plate producers
are confident their most recent price hikes will be
absorbed by the market, as demand seasonally rises at
the start of the fourth quarter.
Plate imports have averaged over 100,000 metric tons
per month this year.
In July, preliminary U.S. cut-to-length plate imports
totaled 132,871 metric tons, decreasing 12% from June’s
final import total but still more than double the July
2013 import level. In early September, import offer
prices ranged from $740 to $760 per net ton, CIF
Houston, remaining below domestic pricing.
$680
$700
$720
$740
$760
$780
$800
$820
$840
$860
Steel Plate (A36)North America Domestic FOB U.S. Midwest Mill
Monthly Average Price Per Net TonAugust 2013 To August 2014
8 September 2014 — Metals Monitor
8 Carbon Steel
Prices for rebar, FOB Midwest mill, averaged $645 per
net ton in August 2014, remaining consistent with the
prior month as well as the prior year. Pricing remained
steady in April and May, then fell in June due to
pressure from lower-cost imports before leveling off in
July and August. An attempted mill price increase
failed to gain traction in the market in August, and
summer construction activity remained lackluster.
However, rebar prices in the Southeastern U.S. trended
upward by $10 to $20 per net ton, according to Steel
Business Briefing. Rebar prices began to climb in early
September, supported by strong demand and tighter
supply in the Midwest.
But the September 9th ruling by the Department of
Commerce (“DOC”) on the rebar trade case could cause
a shift in the market.
The DOC dropped a preliminary decision to impose
anti-dumping duties on steel rebar imports from
Turkey, although it confirmed duties of 20.6% to 66.7%
on Mexican material.
The DOC’s failure to find dumping against Turkish
rebar companies shocked the Rebar Trade Action
Coalition, which filed the trade lawsuit last year and
accused Turkey and Mexico of selling rebar at unfairly
low prices, according to Reuters. The coalition is
comprised of major steel producers Nucor Corp., Byer
Steel, Cascade Steel, Commercial Metals Co., and
Gerdau Long Products North America. It remains to be
seen how the ruling impacts the domestic rebar market.
“I think they [Turkish sellers] will try to push the
market a little bit up, too,” surmised one rebar trader, as
reported by Steel Business Briefing. “They know that
prices have gone up a little bit here. When they don’t
get the orders, they will go the other way.”
$630
$635
$640
$645
$650
$655
$660
$665
Long Products/RebarNorth America Domestic FOB U.S. Midwest Mill
Monthly Average Price Per Net TonAugust 2013 To August 2014
9 September 2014 — Metals Monitor
9 Tin
The market price for tin on the
London Metal Exchange
(“LME”) averaged $10.11 per
pound in August 2014,
slipping from $10.15 in July but
remaining above the August
2013 average of $9.81. Tin
prices have been declining over
the past several months due to
an oversupply in China and
rising exports from Indonesia,
and prices continued to trend
downward in early September.
However, although tin prices are slated to remain low into the fourth quarter of 2014, the International Tin Research
Institute (“ITRI”) anticipates a sharp increase over the next three to four years due to an expected shortage. The ITRI
projects a cumulative deficit of over 60,000 metric tons through 2018, in spite of slowing usage growth, due to a lack of
investment in new supply. In the longer term, the ITRI expects the tin market will expand as demand rises for tin
chemicals and tin used in energy-related applications.
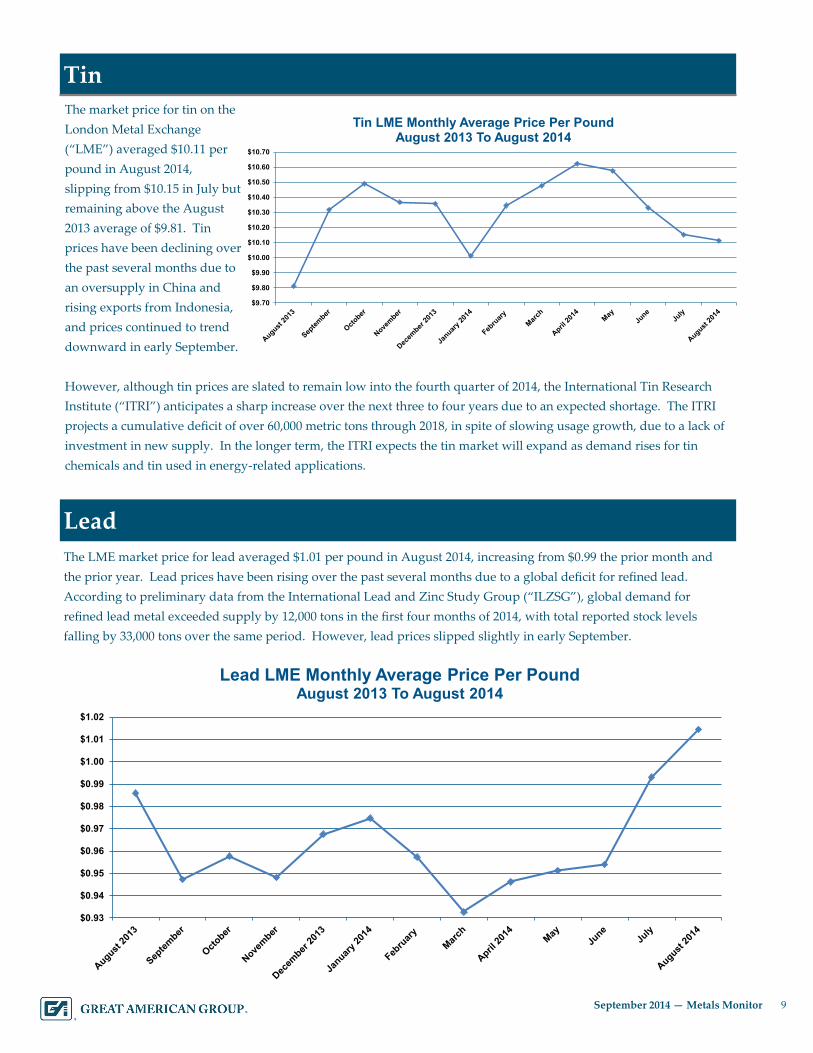
The LME market price for lead averaged $1.01 per pound in August 2014, increasing from $0.99 the prior month and
the prior year. Lead prices have been rising over the past several months due to a global deficit for refined lead.
According to preliminary data from the International Lead and Zinc Study Group (“ILZSG”), global demand for
refined lead metal exceeded supply by 12,000 tons in the first four months of 2014, with total reported stock levels
falling by 33,000 tons over the same period. However, lead prices slipped slightly in early September.
Lead
$9.70
$9.80
$9.90
$10.00
$10.10
$10.20
$10.30
$10.40
$10.50
$10.60
$10.70
Tin LME Monthly Average Price Per PoundAugust 2013 To August 2014
$0.93
$0.94
$0.95
$0.96
$0.97
$0.98
$0.99
$1.00
$1.01
$1.02
Lead LME Monthly Average Price Per PoundAugust 2013 To August 2014
10 September 2014 — Metals Monitor
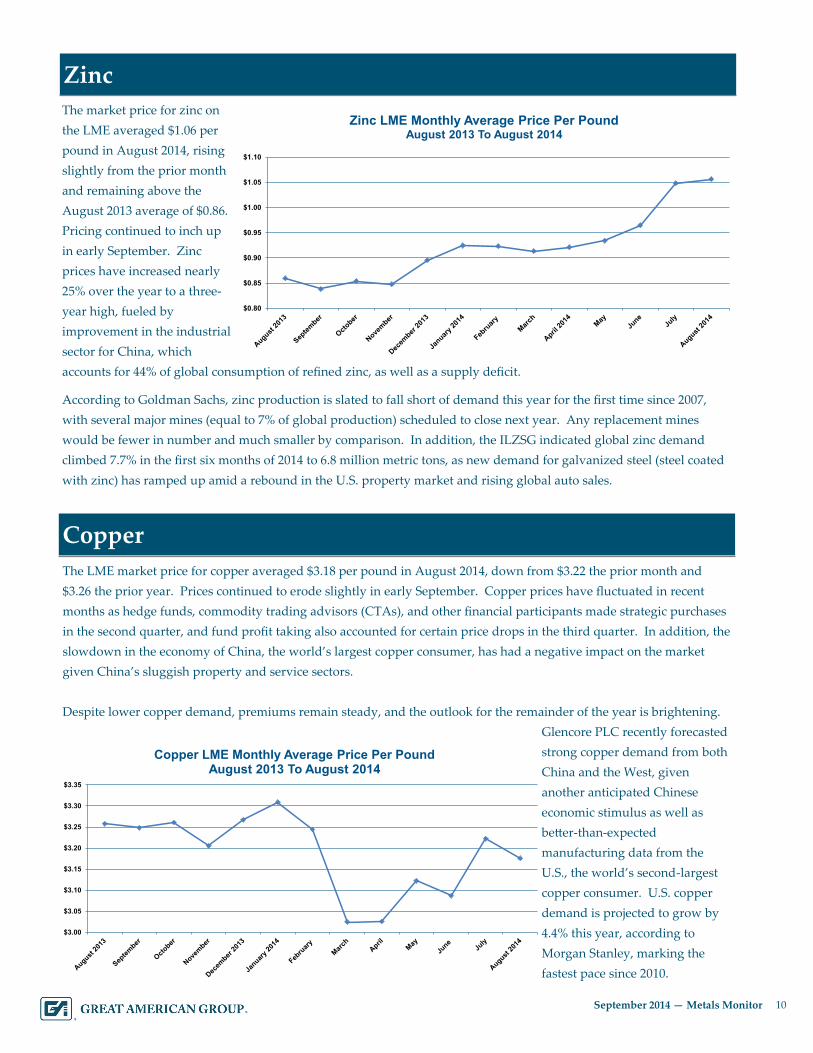
10 Zinc
The market price for zinc on
the LME averaged $1.06 per
pound in August 2014, rising
slightly from the prior month
and remaining above the
August 2013 average of $0.86.
Pricing continued to inch up
in early September. Zinc
prices have increased nearly
25% over the year to a three-
year high, fueled by
improvement in the industrial
sector for China, which
accounts for 44% of global consumption of refined zinc, as well as a supply deficit.
According to Goldman Sachs, zinc production is slated to fall short of demand this year for the first time since 2007,
with several major mines (equal to 7% of global production) scheduled to close next year. Any replacement mines
would be fewer in number and much smaller by comparison. In addition, the ILZSG indicated global zinc demand
climbed 7.7% in the first six months of 2014 to 6.8 million metric tons, as new demand for galvanized steel (steel coated
with zinc) has ramped up amid a rebound in the U.S. property market and rising global auto sales.
The LME market price for copper averaged $3.18 per pound in August 2014, down from $3.22 the prior month and
$3.26 the prior year. Prices continued to erode slightly in early September. Copper prices have fluctuated in recent
months as hedge funds, commodity trading advisors (CTAs), and other financial participants made strategic purchases
in the second quarter, and fund profit taking also accounted for certain price drops in the third quarter. In addition, the
slowdown in the economy of China, the world’s largest copper consumer, has had a negative impact on the market
given China’s sluggish property and service sectors.
Despite lower copper demand, premiums remain steady, and the outlook for the remainder of the year is brightening.
Glencore PLC recently forecasted
strong copper demand from both
China and the West, given
another anticipated Chinese
economic stimulus as well as
better-than-expected
manufacturing data from the
U.S., the world’s second-largest
copper consumer. U.S. copper
demand is projected to grow by
4.4% this year, according to
Morgan Stanley, marking the
fastest pace since 2010.
Copper
$0.80
$0.85
$0.90
$0.95
$1.00
$1.05
$1.10
Zinc LME Monthly Average Price Per PoundAugust 2013 To August 2014
$3.00
$3.05
$3.10
$3.15
$3.20
$3.25
$3.30
$3.35
Copper LME Monthly Average Price Per PoundAugust 2013 To August 2014
11 September 2014 — Metals Monitor
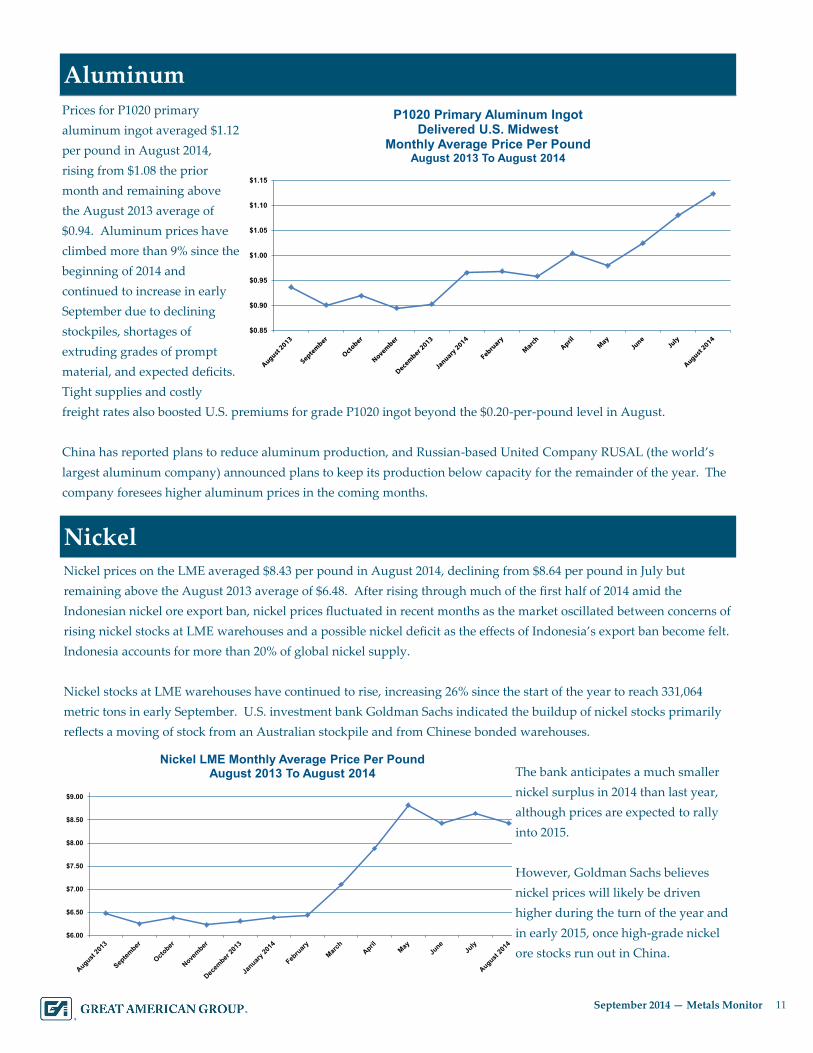
11 Aluminum
Prices for P1020 primary
aluminum ingot averaged $1.12
per pound in August 2014,
rising from $1.08 the prior
month and remaining above
the August 2013 average of
$0.94. Aluminum prices have
climbed more than 9% since the
beginning of 2014 and
continued to increase in early
September due to declining
stockpiles, shortages of
extruding grades of prompt
material, and expected deficits.
Tight supplies and costly
freight rates also boosted U.S. premiums for grade P1020 ingot beyond the $0.20-per-pound level in August.
China has reported plans to reduce aluminum production, and Russian-based United Company RUSAL (the world’s
largest aluminum company) announced plans to keep its production below capacity for the remainder of the year. The
company foresees higher aluminum prices in the coming months.
Nickel prices on the LME averaged $8.43 per pound in August 2014, declining from $8.64 per pound in July but
remaining above the August 2013 average of $6.48. After rising through much of the first half of 2014 amid the
Indonesian nickel ore export ban, nickel prices fluctuated in recent months as the market oscillated between concerns of
rising nickel stocks at LME warehouses and a possible nickel deficit as the effects of Indonesia’s export ban become felt.
Indonesia accounts for more than 20% of global nickel supply.
Nickel stocks at LME warehouses have continued to rise, increasing 26% since the start of the year to reach 331,064
metric tons in early September. U.S. investment bank Goldman Sachs indicated the buildup of nickel stocks primarily
reflects a moving of stock from an Australian stockpile and from Chinese bonded warehouses.
The bank anticipates a much smaller
nickel surplus in 2014 than last year,
although prices are expected to rally
into 2015.
However, Goldman Sachs believes
nickel prices will likely be driven
higher during the turn of the year and
in early 2015, once high-grade nickel
ore stocks run out in China.
Nickel
$0.85
$0.90
$0.95
$1.00
$1.05
$1.10
$1.15
P1020 Primary Aluminum IngotDelivered U.S. Midwest
Monthly Average Price Per PoundAugust 2013 To August 2014
$6.00
$6.50
$7.00
$7.50
$8.00
$8.50
$9.00
Nickel LME Monthly Average Price Per PoundAugust 2013 To August 2014
12 September 2014 — Metals Monitor
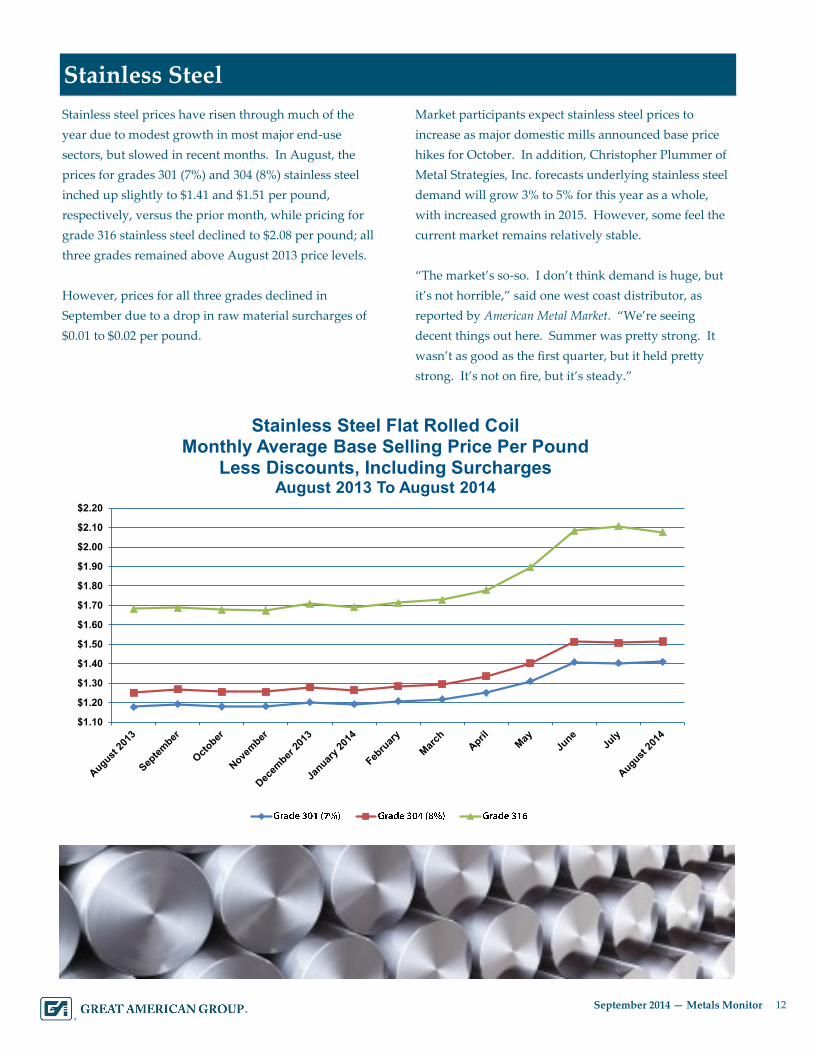
12 Stainless Steel
Stainless steel prices have risen through much of the
year due to modest growth in most major end-use
sectors, but slowed in recent months. In August, the
prices for grades 301 (7%) and 304 (8%) stainless steel
inched up slightly to $1.41 and $1.51 per pound,
respectively, versus the prior month, while pricing for
grade 316 stainless steel declined to $2.08 per pound; all
three grades remained above August 2013 price levels.
However, prices for all three grades declined in
September due to a drop in raw material surcharges of
$0.01 to $0.02 per pound.
Market participants expect stainless steel prices to
increase as major domestic mills announced base price
hikes for October. In addition, Christopher Plummer of
Metal Strategies, Inc. forecasts underlying stainless steel
demand will grow 3% to 5% for this year as a whole,
with increased growth in 2015. However, some feel the
current market remains relatively stable.
“The market’s so-so. I don’t think demand is huge, but
it’s not horrible,” said one west coast distributor, as
reported by American Metal Market. “We’re seeing
decent things out here. Summer was pretty strong. It
wasn’t as good as the first quarter, but it held pretty
strong. It’s not on fire, but it’s steady.”
$1.10
$1.20
$1.30
$1.40
$1.50
$1.60
$1.70
$1.80
$1.90
$2.00
$2.10
$2.20
Stainless Steel Flat Rolled CoilMonthly Average Base Selling Price Per Pound
Less Discounts, Including SurchargesAugust 2013 To August 2014
13 September 2014 — Metals Monitor
13 Metals Reference Sheet
YEAR AGO JUNE 2014 JULY 2014 AUGUST 2014
AUTO SHRED $367/GT $368/GT $373/GT $375/GT
HMS (HEAVY MELT STEEL) $351/GT $363/GT $363/GT $363/GT
BUSHLING $410/GT $397/GT $397/GT $397/GT
CARBON FLAT ROLLED SHEET COIL BASE PRICE
YEAR AGO JULY 2014 AUGUST 2014 JUNE 2014
HOT BANDS $656/NT $670/NT $674/NT $672/NT
COLD ROLLED $762/NT $792/NT $790/NT $798/NT
HOT-DIPPED COATED GALVANIZED $862/NT $879/NT $879/NT $877/NT
CARBON STEEL PLATES BASE PRICE
YEAR AGO JUNE 2014 JULY 2014 AUGUST 2014
PLATE COILS AND STRIP MILL COILS $645 - $670/NT $645 - $670/NT $645 - $670/NT $650 - $675/NT
DISCRETE
PLATES*
CARBON STEEL $720/NT $841/NT $860/NT $862/NT
ALLOYS PLATES $1,220/NT $1,220/NT $1,220/NT $1,220/NT
HOT ROLLED MERCHANT BAR (MBQ) SHAPES (NET OF DISCOUNTS AND REBATES)
YEAR AGO AUGUST 2014
DELIVERY
JUNE 2014
DELIVERY
JULY 2014
DELIVERY
1/2” X 4” FLATS* $760 Avg/NT $815 Avg/NT $815 Avg/NT $815 Avg/NT
2” X 2” X 1/4” ANGLES* $755 Avg/NT $815 Avg/NT $815 Avg/NT $815 Avg/NT
REBAR COILS, GRADE 60:
#3 TO #5 SIZES $645 Avg/NT $650 Avg/NT $680 Avg/NT $675 Avg/NT
MERCHANT BAR
(FOB MIDWEST MILL) $740 - $770/NT $775 - $805/NT $775 - $805/NT $775 - $805/NT
*Variances include East to West Coast markets and variances in rebates.
*Depending on thickness limits and subject to grade extras up to $600/NT
14 September 2014 — Metals Monitor
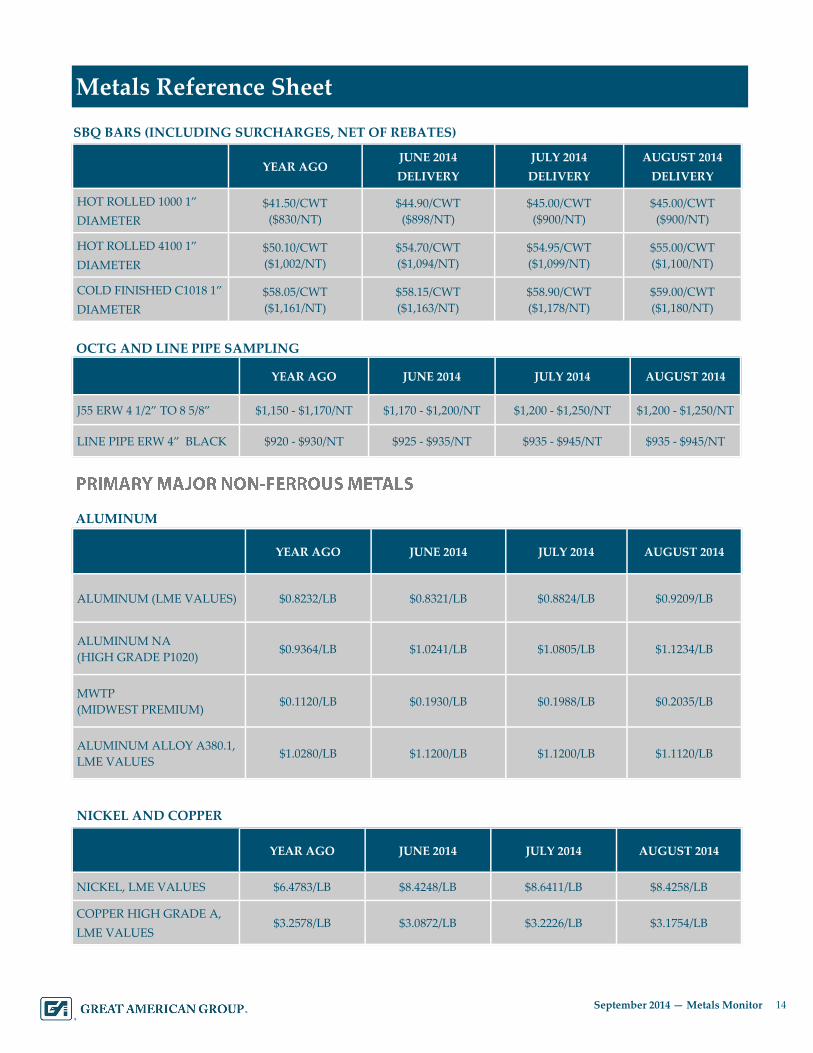
14 Metals Reference Sheet
YEAR AGO JUNE 2014 JULY 2014 AUGUST 2014
ALUMINUM (LME VALUES) $0.8232/LB $0.8321/LB $0.8824/LB $0.9209/LB
ALUMINUM NA
(HIGH GRADE P1020) $0.9364/LB $1.0241/LB $1.0805/LB $1.1234/LB
MWTP
(MIDWEST PREMIUM) $0.1120/LB $0.1930/LB $0.1988/LB $0.2035/LB
ALUMINUM ALLOY A380.1,
LME VALUES $1.0280/LB $1.1200/LB $1.1200/LB $1.1120/LB
ALUMINUM
YEAR AGO JUNE 2014 JULY 2014 AUGUST 2014
NICKEL, LME VALUES $6.4783/LB $8.4248/LB $8.6411/LB $8.4258/LB
COPPER HIGH GRADE A,
LME VALUES $3.2578/LB $3.0872/LB $3.2226/LB $3.1754/LB
NICKEL AND COPPER
YEAR AGO JULY 2014 JUNE 2014 AUGUST 2014
J55 ERW 4 1/2” TO 8 5/8” $1,150 - $1,170/NT $1,200 - $1,250/NT $1,170 - $1,200/NT $1,200 - $1,250/NT
LINE PIPE ERW 4” BLACK $920 - $930/NT $935 - $945/NT $925 - $935/NT $935 - $945/NT
YEAR AGO JUNE 2014
DELIVERY
JULY 2014
DELIVERY
AUGUST 2014
DELIVERY
HOT ROLLED 1000 1”
DIAMETER
$41.50/CWT
($830/NT)
$44.90/CWT
($898/NT)
$45.00/CWT
($900/NT)
$45.00/CWT
($900/NT)
HOT ROLLED 4100 1”
DIAMETER
$50.10/CWT
($1,002/NT)
$54.70/CWT
($1,094/NT)
$54.95/CWT
($1,099/NT)
$55.00/CWT
($1,100/NT)
COLD FINISHED C1018 1”
DIAMETER
$58.05/CWT
($1,161/NT)
$58.15/CWT
($1,163/NT)
$58.90/CWT
($1,178/NT)
$59.00/CWT
($1,180/NT)
OCTG AND LINE PIPE SAMPLING
SBQ BARS (INCLUDING SURCHARGES, NET OF REBATES)
15 September 2014 — Metals Monitor
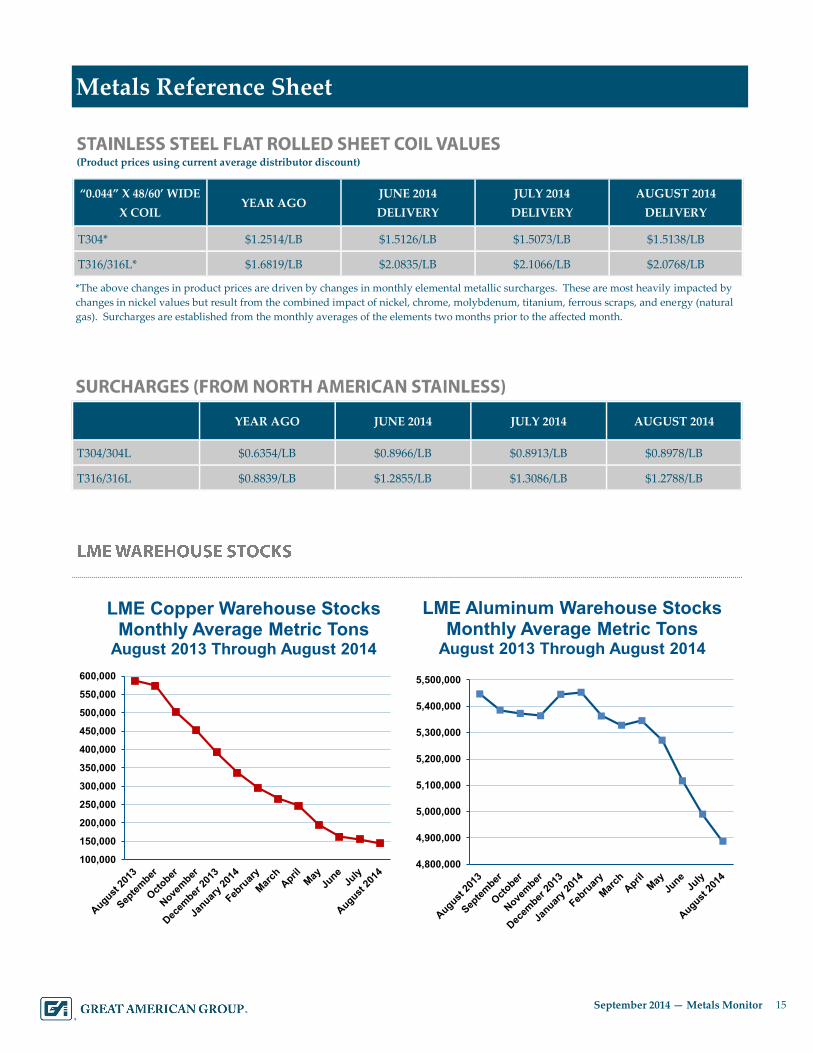
15 Metals Reference Sheet
(Product prices using current average distributor discount)
“0.044” X 48/60’ WIDE
X COIL YEAR AGO
JUNE 2014
DELIVERY
JULY 2014
DELIVERY
AUGUST 2014
DELIVERY
T304* $1.2514/LB $1.5126/LB $1.5073/LB $1.5138/LB
T316/316L* $1.6819/LB $2.0835/LB $2.1066/LB $2.0768/LB
*The above changes in product prices are driven by changes in monthly elemental metallic surcharges. These are most heavily impacted by
changes in nickel values but result from the combined impact of nickel, chrome, molybdenum, titanium, ferrous scraps, and energy (natural
gas). Surcharges are established from the monthly averages of the elements two months prior to the affected month.
YEAR AGO JUNE 2014 AUGUST 2014 JULY 2014
T304/304L $0.6354/LB $0.8966/LB $0.8978/LB $0.8913/LB
T316/316L $0.8839/LB $1.2855/LB $1.2788/LB $1.3086/LB
100,000
150,000
200,000
250,000
300,000
350,000
400,000
450,000
500,000
550,000
600,000
LME Copper Warehouse StocksMonthly Average Metric Tons
August 2013 Through August 2014
4,800,000
4,900,000
5,000,000
5,100,000
5,200,000
5,300,000
5,400,000
5,500,000
LME Aluminum Warehouse StocksMonthly Average Metric Tons
August 2013 Through August 2014
16 September 2014 — Metals Monitor
16 Experience
GA has worked with and appraised a number of companies within the metals industry, including industry leaders in
steel and aluminum production and processing. GA’s extensive record of metals inventory valuations also features
appraisals for companies throughout the entire metal supply chain, including foreign and domestic metal- and steel-
producing mills; metal converters that produce tubing and pipe, as well as expanded, grating, and perforated metal
types; metal service centers/processors as well as distributors; structural and custom fabricators and stampers;
manufacturers that utilize metals as raw materials; and scrap yards, recyclers, dealers, and brokers.
Over the past six months, GA performed appraisals of
companies with annual revenues ranging from $18.7
million to $2.8 billion, including the following sampling:
A supplier of metal inputs to ferrous foundries;
A manufacturer of high-quality light gauge common
alloy sheet, foil, and coated aluminum products;
An importer and master distributor of industrial
stainless steel and nickel alloy products;
A major UK producer of long steel products;
A producer of calcined petroleum coke;
A distributor of mill-length and processed steel;
A producer of carbon and alloy steel castings;
A producer of welded and seamless OCTG;
A steel distributor and service center;
A producer of lightweight aluminum die castings;
A manufacturer of mechanical steel tubing, chrome-
plated bars, tubular parts, and precision components;
A steel service center focused on flat rolled slit coil;
A master distributor of stainless steel products; and
A processor and recycler of scrap metals.
GA’s extensive appraisal experience also includes
valuations of the following major businesses in the
metals industry:
Globally recognized vertically integrated steel tube
manufacturers;
A vertically integrated aluminum producer including
both the upstream and downstream sides of the
industry, with over $1 billion in sales annually and
over $130 million in inventory;
One of the U.S.’s largest scrap recycling processors,
with nearly $550 million in sales annually; and
Well-known service centers across the nation, including
a multi-division full line steel service center consisting
of over 50 locations across the U.S., with $2.6 billion in
annual sales and over $500 million in inventory.
Moreover, GA has liquidated a number of companies with metal products, including Advanced Composites,
Aluminum Skylight & Specialty Corporation, Anello Corporation, Apex Pattern, Balox Fabricators, BJS Industries,
Buckner Foundry, Crown City Plating, GE Roto Flow, Laird Technology, Maddox Metal Works, Miller Pacific
Steel, R.D. Black Sheet Metal, Valley Brass Foundry, and Southline Steel.
GA has also been involved in liquidations of metalworking equipment for companies such as Adams Campbell
Company, CAMtech Precision Manufacturing, Inc., Gregg Industries, Inc., International Piping Systems, Heat
Transfer Products, PMC Machining and Manufacturing, Sherrill Manufacturing, Trans-Matic Manufacturing,
Veristeel, Inc., and Weiland Steel, Inc.
In addition to our vast appraisal and liquidation experience, GA maintains a staff of experienced metals experts
with personal contacts within the metals industry that we utilize for insight and perspective on recovery values.
GA additionally maintains appraisal experience involving precious metals and specialty metals, allowing GA to
provide experience-based valuations across the entire metals industry. The metal products that GA has appraised
have maintained applications throughout a wide variety of industries, including the automotive, construction,
aerospace, industrial machinery and equipment, and appliance and electrical equipment markets.
17 September 2014 — Metals Monitor
17 Monitor Information
The Metals Monitor provides market value trends in both
ferrous and non-ferrous metals. The commodity nature of
steel scrap, aluminum ingot, copper cathode, and nickel often
results in volatile market values. Our semi-annual Metals
Monitor reflects pricing and market trends over the prior six
months, as well as forward-looking projections, in order to
reflect significant developments in the metals markets.
The Metals Monitor includes a sampling covering most metals projects. GA’s metals expertise
is not confined to use on pure metals projects, but is always utilized in assuring the accuracy
and insight for all manufacturing projects where metals are the primary or significant raw
materials, regardless of the sector of the finished products. This assures that all appraisals
from GA reflect the full scope of our experience and insight. GA internally tracks additional
specialty and tool steels, all raw materials for steel, specialty steel, and primary aluminum
production and manufacturing, but we are mindful to adhere to your request for a simple
reference document. Should you need any further information or wish to discuss recovery
ranges for a particular segment, please feel free to contact your GA Business Development
Officer.
GA’s Metals Monitor provides market value and industry trend information for a variety of
metals products. The information contained herein is based on a composite of GA’s industry
expertise, contact with industry personnel, industry publications, liquidation and appraisal
experience, and data compiled from a variety of well-respected sources believed to be reliable.
We do not guarantee the completeness of such information or make any representation as to
its accuracy.
18 September 2014 — Metals Monitor
18 Appraisal & Valuation Team
About Great American Group
Great American Group is a leading provider of asset disposition solutions and valuation and appraisal services to
a wide range of retail, wholesale, and industrial clients, as well as lenders, capital providers, private equity
investors, and professional services firms. In addition to the Metals Monitor, GA also provides clients with industry
expertise in the form of monitors for the chemicals and plastics, food, and building products sectors, among many
others. GA also offers various industry monitors via its subsidiary, GA Europe Valuations Limited.
Headquarters
21860 Burbank Blvd. Suite 300 South
Woodland Hills, CA 91367 800-45-GREAT www.greatamerican.com
Mike Marchlik
National Sales & Marketing Director
(818) 746-9306
David Seiden
Executive Vice President, Southeast Region
(770) 551-8114
Ryan Mulcunry
Executive Vice President - Northeast Region, Canada & Europe
(617) 692-8310
Bill Soncini
Senior Vice President, Midwest Region
(312) 777-7945
Drew Jakubek
Managing Director, Southwest Region
(972) 265-7981
Jennie Kim
Vice President, Western Region
(818) 746-9370
Ken Bloore
Chief Operating Officer
(818) 884-3737
Michael Petruski
Executive Vice President, General Manager
(818) 884-3737
Greg Trilevsky
Senior Appraiser—Metals and Manufacturing
(909) 559-8135
Alex Tereszcuk
Senior Appraiser—Metals and Manufacturing
(336) 854-7859
Dan Tracy
Senior Appraiser—Metals and Manufacturing
(412) 953-6357
John Little
Senior Appraiser—Scrap Recycling
(864) 630-4799
Ryan Lutz
Senior Project Manager—Metals Specialist
(781) 429-4052 Daniel Williams
Managing Director, New York Region
(646) 381-9221


![New Approach of Metals Ductility in Tensile Test...Aluminium 2024 –T4 3.1 303 476 20 35 Table 1: Mechanical properties of some metals [57]. Metals A Z Ductile Iron A536 (65-45-12)](https://img.pdfslide.us/doc/110x75/609990b023f002571748a778/new-approach-of-metals-ductility-in-tensile-test-aluminium-2024-at4-31-303.jpg)