Embed Size (px)
Citation preview

1
Metal production
Morten Simonsen
Vestlandsforsking
5 April 2009

2
Contents Emission of CO2 from metal production. ........................................................................................ 4
Emission of CO2 from steel production........................................................................................ 4
Aluminium production ............................................................................................................. 12
Production of copper ............................................................................................................... 24
Tables Table 1 CO2-emissions pr tonne of steel by process and components ............................................. 5
Table 2 Basic data from production of 1 kg of steel for different electricity mix and production
processes , ................................................................................................................................... 7
Table 3 Impact of producing 12,3 kg of steel tailored welded blank for the automative industry with
and without steel recycling .......................................................................................................... 10
Table 4 Energy sources for production of 1 tonne of aluminium in EU27+EFTA countries 2005 ....... 13
Table 5 Total energy consumption for 1 tonne of cast aluminium ingot. EAA estimate. ................... 15
Table 6 Energy input for production of 1 kg of aluminium for Germany 2000, 2005 and 2010 ......... 15
Table 7 Energy input for production of 1 kg of aluminium for Norway 2000, 2005 and 2010 ........... 16
Table 8 Energy consumption for producing 1 kg of aluminium mix in Germany 2005....................... 17
Table 9 Emission of CO2 for production of one tonne of aluminium in some Indian aluminium plants
.................................................................................................................................................. 18
Table 10 CO2-emissions in kg from production of 1 tonne of aluminium products in EU27+EFTA 2005
.................................................................................................................................................. 19
Table 11 Emissions of CO2 from production of 1 kg of aluminium in Germany and Norway ............. 19
Table 12 Input and output for 1 tonne of aluminium ingot from process scrap ............................... 21
Table 13 Input and output for 1 tonne of aluminium ingot from used scrap .................................... 21
Table 14 Weighted input and output for 1 tonne of aluminium ingot from recycled aluminium scrap
.................................................................................................................................................. 22
Table 15 Input and output for production of 1 kg of aluminium from secondary raw material.
Germany 2000 and 2005.............................................................................................................. 22

3
Table 16 Effect of recycling in the ProBas model. Estimates with recycling relative to estimates
without recycling for energy use and environmental indicators. .................................................... 24
Table 17 Input and output for production of 1 kg of copper in Germany 2005 with and without
recycling ..................................................................................................................................... 26
Fant ingen figurlisteoppføringer.

4
Emission of CO2 from metal production.
Emission of CO2 from steel production.
The production of primary steel starts by reducing iron ore which is iron in oxidized form. During the
process of reducing, oxygen is removed from the ore. The outcome of the reduction is dependant on
whether the reduction takes place above or below the melting point of the ore 1. If the reduction
takes place above the melting point, the outcome of the reduction is pig iron. If the reduction takes
place below the melting point, the outcome is directly reduced iron (DRI). Pig iron is in liquid form,
DRI is in solid form 2.
Reduction takes place by using a reduction agent. This reduction agent combines with oxygen so that
it separates from the ore. Carbon in form of coke is the usual separation agent. Hydrogen can also be
used as a reduction agent. Coke is a solid material which is derived from distillation of bituminous
coal. Coke is produced by removing water and coal-gas from coal in high temperatures. Coke
therefore has to be produced from coal in an energy-intensive process.
Iron ore consists of gangue materials or rock materials not needed for steel production. When pig
iron is produced, the reduction process separates the gangue from the iron. This happens because
the reduction takes place at high temperatures. These temperatures cause the carbon to dissolve
into the pig iron. When DRI is produced, the gangue materials are left in the product. Therefore it
must be separated in a later process. This is done by melting the DRI and adding carbon because the
final hot metal product must have a required amount of carbon.
Blast furnace is a process whereby iron ore is reduced into pig iron. Pig iron or cast iron has a carbon
content over 2,1% whereas steel is an alloy of iron and carbon with carbon content less than 2,1% 3.
In the process, left over materials need to have a certain permeability so that they are separated
from the pig iron. Coke gives the gangue materials the necessary permeability. Coal is combusted
during the blast furnace process. COREX is another process by which pig iron is produced. The
process uses a shaft with high pressure oxygen in a smelter gasifier. A gasifier is a chemical gas oven.
The COREX-process does not use coke but coal directly as an reduction agent. The coal is converted
to char during combustion 4. COREX is a process which is used in South Africa and South-East Asia.
DRI (directly reduced iron) is converted to steel by a smelting process. Left-over materials from the
ore are removed. The undesired materials are removed by using oxygen so that the materials oxidize
and separates from the DRI. The process is carried out in a electric arc furnace. Several DRI-process
1 Daniëls, B. W.: Transition paths towards CO2 emission reduction in the steel industry, Dissertation at
University of Groningen, http://dissertations.ub.rug.nl/FILES/faculties/science/2002/b.w.daniels/thesis.pdf, page 21 2 ibid., page 28.
3 See http://no.wikipedia.org/wiki/St%C3%A5l
4 “Char is the solid material that remains after light gases (e.g. coal gas) and tar (e.g. coal tar) have been driven-
out or released from a carbonaceous material, during the initial stage of combustion ” Wikpedia, http://en.wikipedia.org/wiki/Char.

5
exist, the most important is MIDREX which accounts for two thirds of all DRI production in the world
in 1993 5.
Pig iron is further converted into steel by removing undesired left-over materials such as phosphor,
sulphur and silicon from the ore and adjusting the carbon content to the desired level. This removing
of materials is accomplished by oxidizing the undesired materials and the carbon. Consequently,
oxygen has to be added to the process. This is done in a process known as basic oxygen furnace.
There are two main steel producing processes:
the BF-route which uses pig iron with blast furnace (BF) and basic oxygen furnace,
the EAF route which uses DRI and the electric arc furnace.
According to the World Steel Association, 66,3% of the world’s steel production in 2007 was
produced by using the BF route while 31,2% of the steel was produced by the EAF-route 6. The routes
have different CO2-emission factors pr tonne of produced steel. Table 1 shows emission from
different processes split on different components in the processes. Negative numbers means
components are not double-counted in the table. The COREX method has the highest CO2 emission
factor pr tonne produced steel because it has the highest carbon input.
Table 1 CO2-emissions pr tonne of steel by process and components 7.
Method kg CO2 from coal
kg CO2 from gas
kg CO2 from electricity
kg CO2 miscell- aneous 1
Total kg CO2
MIDREX 800 340 1140
Blast Furnace (BF) 2030 -40 160 -30 2120
COREX 2810 -390 220 -200 2440
We can construct a weighted estimate for world total production by giving BF the weight of 0,663 and MIDREX 0,312. We let all DRI-produced steel be accounted for by the MIDREX-process. Further we let the remaining 2,5% be attributed to the COREX process. This gives us a global estimate of 1822 kg pr produced steel. Each tonne of steel produced globally in 2008 lead to emissions of 1,7 tonnes of CO2
8, according to World Steel Association’s Sustainability Report.
According to one report the CO2 emission factor in China in 1996 was a little over 1000 kg pr tonne steel 9. At the SSAB production plant in Luleå, Sweden, the emission factor was estimated to be 1250 kg pr produced tonne of steel 10. The steel plant NZ Steel in New Zealand reported 2666 kg pr
5 Danpëls, page 34.
6 See http://www.worldsteel.org/pictures/publicationfiles/Sustainability%20Report%202008_English.pdf, page
7 7 Daniëls, page 77.
8 See http://www.worldsteel.org/pictures/publicationfiles/Sustainability%20Report%202008_English.pdf , page
9 9 Ernest Orlando Lawrence Berkely National Laboratory, http://ies.lbl.gov/iespubs/47205.pdf, Figure 3.
10 Chuang Wang: Possibilities of CO2 emission reduction, Doctoral thesis, Luleaå University of Technology,
http://pure.ltu.se/ws/fbspretrieve/638356 , page 22.

6
produced steel from iron sand in 2004 11. Australia produced 7,9 million tonnes of steel in 2007 12. The total emission of CO2 from steel production was 11,3 million tonnes, yielding an average of 1430 kg pr tonne of produced steel 13. The US production of steel in 2007 was 97,2 million tonnes with 51,3 million tonnes of CO2-emission from steel production 14. This yields an estimate of 520 kg pr produced steel which is considerably less than the other estimates. The reason is probably that the US emission includes production of steel from scrap metal which is less CO2-intensive than production of steel from iron ore. The US steel plants also increasingly use the EAF production route which uses more recycled steel as input 15. The quoted emission factors presumably do not include emissions related to excavation of ore and transport of ore to steel production plant. They also presumably do not include emissions related to production of fuel and electricity bought by the plant. The amount of CO2-emission from production of steel is dependant on the electricity mix used at the steel plant. The more fossil fuels used for production of electricity for the production plant, the higher the emissions. The German Environmental Agency (Deutsche Bundesumweltsamt) 16 has together with the Institut für Angewandte Ökologie 17 developed a database which contains “process oriented data for environmental management instruments”. This database is accessible on the Internet 18. The data for one specific product are split into information on the specific production process and data from processes leading to this production, such as excavation of materials as well as production of electricity with a given electricity mix. This makes it possible to evaluate emission factor for steel given different electricity mixes. As can be seen from Table 2, emissions from steel production vary quite a lot dependant on the
electricity mix. The Chinese electricity mix in 1995 was more dependant on combustion of oil than
the electricity mix in Germany in 2000 and 2010. The electricity mix in the Czech Republic in 1990
used more brown coal than any other electricity mix listed. The electricity mix in Germany does not
change much from 2000 to 2010.
11
See http://www.med.govt.nz/templates/MultipageDocumentPage____18011.aspx#P641_27850 , table 7 12
See http://en.wikipedia.org/wiki/Steel_production_by_country 13
For emission data see http://www.climatechange.gov.au/projections/pubs/industrial2007.pdf, table 2.1. 14
For emission data, see http://www.epa.gov/climatechange/emissions/downloads09/07Industrial.pdf, side 4-1 15
World Steel Association, 2008 Sustainability Report, http://www.worldsteel.org/pictures/publicationfiles/Sustainability%20Report%202008_English.pdf , page 12 16
Germany’s federal authority on environmental matters, responsible for providing scientific data for the Federal Government, implementation of German Federal Laws and for public information on environmental issues. See http://www.umweltbundesamt.de/uba-info-e/index.htm 17
An independent institute for research and consultant services based in Freiburg, Germany, which originates
from the protest movement against nuclear power in Germany in 1977, see http://www.oeko.de/das_institut/dok/558.php 18 See http://www.probas.umweltbundesamt.de/php/index.php . This is a database for environmental cradle-to-grave assessment of a material or product: “Bei Ökobilanzen für Produkte –
zum Beispiel für Getränkeverpackungen – wird der gesamte Lebensweg des Produktes betrachtet. Von der Wiege bis zur Bahre - also von der Herstellung über die Nutzung bis zur Entsorgung des Produktes - werden die
Umweltauswirkungen erfasst. Dabei werden nicht nur die Umweltauswirkungen des eigentlichen Herstellungsprozesses berücksichtigt, sondern auch die Herstellung der Vorprodukte, teilweise sogar der Hilfs - und Betriebsstoffe, der Energieerzeugung sowie die Förderung und Bereitstellung der Rohstoffe. Einbezogen
werden auch alle Transporte.” http://www.probas.umweltbundesamt.de/download/uba_bewertungsmethode.pdf page 1

7
Table 2 Basic data from production of 1 kg of steel for different electricity mix and production processes 19, 20
China Germany Czech
Unit 1995 2000 2005 2010 1990
Input Nuclear power MJ 0,1 -0,5 -0,3 -0,5 12,1
Biomass MJ
0,0 0,0
Brown coal MJ 0,0 -0,4 -0,3 -0,5 36,5
Stone coal MJ 16,4 15,6 15,2 15,4 12,9
Natural gas MJ 0,0 -0,7 -0,6 -0,7 1,6
Crude oil MJ 67,0 2,8 2,8 2,8 1,3
Geothermal MJ 0,0 0,0 0,0 0,0 0,0
Garbage, waste MJ 0,0 -0,1 0,0 -0,1 0,0
Secondary material MJ 0,0 3,0 3,0 3,0 1,1
Sun
0,0 0,0 0,0 0,0
Hydropower MJ 2,0 0,1 0,1 0,1 0,8
Windpower MJ 0,0 0,0 0,0 0,0 0,0
Waste heat
0,0 -4,2
Total MJ 85,5 19,9 19,9 19,6 62,0
Outut CO2 kg 6,36 1,4 1,4 1,37 5,03
CO2-equiv kg 7,08 1,6 1,5 1,51 5,27
The German production is a mix of 200 g electric arc furnace (EAF) and 800 g pig iron and blast
furnace (BF). Each kg from the EAF route is based on 0,974 kg recycled steel in 2005, which means
that there was 195 g recycled steel for each kg produced steel in Germany in 2005. The Czech
production is based on 800 g from the EAF route and 200 g from pig iron. The Czech production is
based on old EAF technology where electricity is used to melt steel scrap. New EAF technology is
based on oxygen and fuel as input which not only melt old scrap but also processes it, thereby
increasing energy efficiency. The Chinese production is presumably based on pig iron and blast
furnace.
The data in Table 2 does include transport (see footnote on previous page). Emissions of CO2 vary
from 1,5 kg to 7 kg, dependent on the electricity mix and available production technology. Emissions
in Germany are considerably lower than emissions in China and Czech Republic.
Primary steel is steel processed directly from iron ore with no scrap content. Recycled steel or
secondary steel is steel made from melted steel scrap. Recycling of steel plays a major part in steel
processing. The recovering of steel from metal scrap is done with magnets and is a fairly easy
19
Negative values occur because surplus electricity is sold to the national grid so that the emissions are accounted for by household or other industrial processes. See http://pure.ltu.se/ws/fbspretrieve/638356, page
15 20
Data obtained from ProBas, see http://www.probas.umweltbundesamt.de/php/index.php

8
process. Steel can be recycled practically infinitely, it does not lose its metallurgic capabilities when
recycled.
The relative importance of recycling varies between the different steel producing processes. The EAF
route uses more steel scrap as input than the BF route since the EAF route does not depend on pig
iron from ore in melted form. According to the World Steel Association, some 459 million tonnes of
steel was recycled in 2006, representing 37% of all crude steel production this year 21. This recycling
figure is an average for both of the steel producing processes.
The total production of steel in 2007 was 1 343,5 million tonnes 22. Around 1 100 million tonnes
more steel is produced in 2007 as in the 1950’s. According to the World Steel Association, if the
people in China and India were to use as much steel as the people in the Western industrialized
world, the emissions of CO2 would double by the year 2050. Today, steel accounts for about 4-5% of
the world’s total CO2-emissions 23.
The EAF-route uses 80% old steel to make new steel 24. Strength is a major attribute of products
from this process. The BOF process uses 25 to 25 percent old steel to make new, drawability is the
major attribute of products from this process. Recycled steel comes in two major forms , pre-
consumer and post-consumer 25. The pre-consumer scrap is generated during the steel production
process. This pre-consumer scrap can be divided into two parts. Home scrap is scrap that never
leaves the steel plant. Prompt scrap 26 is residue steel which never enters the final product and which
is recovered at manufacturing site, not at the end-of-life for the product in question. Post-consumer
scrap comes from steel products which have reached their end-of life and are no longer in use. This
post-consumer scarp has to be collected and re-melted with or without primary steel to make new
steel products.
The American Iron and Steel Institute reports that energy consumption in US steel industry has been
reduced with 60% over the last 25 years. This is partly due to increased use of the EAF production
route which uses more steel scrap as input. The BOF process has also increased its use of recycled
scrap thereby contributing to the energy saving. In addition, a transition to production processes
which avoid reheating during steel production has also contributed to the energy savings 27.
Since steel can be recycled indefinitely, the effect of recycling on energy saving is asymptotically
decreasing. The effect of recycling is largest when the steel scrap is initially recycled. The more steel
is recycled, the less in the energy saving impact since for every recycling cycle, a energy saving has
already been accounted for. shows this relationship between recycling cycles and the energy saving
effect. The same relationship is also valid for CO2-emission since these emissions are highly
correlated with energy use.
21
http://www.worldsteel.org/pictures/publicationfiles/Sustainability%20Report%202008_English.pdf, page 15 22
ibid., page 9. 23
ibid., page 9 24
Steel Recycling Institute, http://www.recycle-steel.org/pdfs/Inherent2007FINAL.pdf, page 1 25
ibid. , page 1. 26
Eurofer: The European Steel Industry’s Contribution to an Integrated Product Policy. Final report. http://www.eurofer.org/eurofer/Publications/pdf/2007-IPP_Final_Report.pdf, page 123. 27
World Steel Association, 2008 Sustainability Report, http://www.worldsteel.org/pictures/publicationfiles/Sustainability%20Report%202008_English.pdf , page 12

9
Figure 1 Steel production: GJ/tonne steel pr recycling cycle 28
The World Steel Association claims that recycling 459 million tonnes of steel in 2006 saved 827
metric tonnes of CO2-emission. On average, this yields an reduced emission of 1,8 tonne of CO2 for
each tonne recycled. The European Confederation of Iron and Steel Industries, Eurofer, has
calculated the impact of steel recycling 29 in production of a specific steel product, a tailor welded
blank used in the automative industry. A tailor welded blank consists of steel sheets with different
thickness and grades welded together to form a single piece. This product is used in the automative
industry for weight saving purposes. Saving weight saves emission of CO2 during the use phase of a
vehicle. This reduction in use phase is not taken into consideration in the analysis of steel recycling
since the use phase is not known, only the manufacturing process for the steel product.
When steel is used for manufacturing of specific products, scrap is produced during manufacturing.
This scrap is known as prompt scrap 30. The weight of this scrap is included in the steel delivered at
the manufacturing plant. The difference between the weight of the final product and the weight
delivered at the manufacturing plant is prompt scrap. When the product has reached end-of life after
being used, some of the product’s weight will be recovered for recycling. When this end-of life scrap
is added to prompt scrap we get the total steel weight recycled. Let X be the steel weight delivered at
28
Corus Construction Centre, Steel: The world’s most recycled material,
http://www.steelconstruction.org/static/assets/source/Recycling%20and%20Re-Use%20in%20Steel.pdf , page 8 29
Eurofer: The European Steel Industry’s Contribution to an Integrated Product Policy. Final report.
http://www.eurofer.org/eurofer/Publications/pdf/2007-IPP_Final_Report.pdf, page 105-137. 30
ibid., page 123, 128.

10
the manufacturing plant, let Y be the prompt scrap and let Z be the steel weight recovered from the
final product after it has ended its use phase. The recovery rate (RR) 31 in percent is defined as
RR=[(X-Y+Z)/X]*100
All in all, the automotive industry has a recovery rate of 99,4% 32. Of this rate, 40 % is prompt scrap
and the rest (59,4%) is recovered from the final product. This recovery rate is far above the
construction industry (85%) and packaging industry (65,8%). Domestic appliances do better than
other industries, but the recovery rate is still less than the rate for the automotive industry (92,5%
for domestic appliances). The proportion of prompt scrap is larger for the automotive industry than
for the other industries, reflecting the fact that the final products are more demandi ng to
manufacture then products from other industries. Prompt scrap proportions for construction
industry and domestic appliances are 25% while the corresponding numbers for packaging industry
and machine industry are 10%.
Table 3 shows the result of recycling for production of 12,3 kg of tailored welded blank. The steel is
produced via the BOF-route using blast furnace and basic oxygen furnace.
Table 3 Impact of producing 12,3 kg of steel tailored welded blank for the automative industry with and without steel recycling
Energy (MJ)
CO2-equiv. (kg)
POCP
ethylene-equiv. (kg)
Manufacturing Material 553,7 43,1 0,25
Transport 3,7 0,27 0,0004
Assembly 11,7 0,5 0,0003
Processing 42,1 1,79 0,0011
Sum without recycling 611,2 45,66 0,2518
Recycling credit -234,5 -25,5 -0,0122
Sum with recycling 376,7 20,16 0,2396
According to Table 3 recycling of steel can save emission of CO2 in the order of 25,5 kg for a 12,3 kg
heavy tailored welded blank. This equals a saving of 2,07 kg CO2 for each kg of tailored welded blank.
Likewise, recycling of steel saves 19 MJ for each kg of tailored welded blank, while it saves 0,99 g of
ethylene equivalents. These savings are for a processed product. The savings for a kg of primary
steel will be less since processing of steel is not included.
Eurofer 33 has also calculated the effect of steel recycling for the manufacturing of 1 kg of steel
section used in buildings 34. This steel is also produced via the BOF-route using blast furnace and
basic oxygen furnace. The net saving of CO2-emission 35 is calculated as 1,4 kg for each kg of steel
31
ibid., page 129. 32
ibid., page 128. 33
European Confederation of Iron and Steel Industries 34
Eurofer: The European Steel Industry’s Contribution to an Integrated Product Policy. Final report.
http://www.eurofer.org/eurofer/Publications/pdf/2007-IPP_Final_Report.pdf, page 137. 35
ibid., page 137, the report refers to CO2-emission, not to CO2-equivalents.

11
section produced 36. This estimate presupposes a net scrap of 0,796 kg. The net scrap is the steel
scrap minus the scrap that was used to produce this scrap.
The estimate for the steel section is based on a factor of steel output to steel input. This factor is
called the metallic yield 37. The factor measures the amount of steel from a end-of-life product which
can be further used for steel manufacturing. Since recycling is not 100% effective, not all the steel
available for recycling will be reused. On average it takes 1,05 kg of steel scrap to produce 1 kg of
steel for re-melting at the steel plant. Consequently the metallic yield is 1,05-1=0,952. Both the
factors for net scrap and metallic yield is used to produce the estimate of CO2-savings for a steel
section.
Eurofer calculates that for each kg of recycled steel used to produce a steel section, 1,52 kg of iron
ore and 12,9 MJ of primary energy is saved. These estimates use the same factors for net scrap and
metallic yield as described above.
Using recycled steel for the tailored welded blank saved 2,07 kg of CO2 for each kg manufactured. For
the steel section the same estimate is 1,4 kg. The difference between the estimates should be
attributable to the difference in recovery rate between the automotive industry and the construction
industry.
Figure 1 shows the relationship between recycling cycles and saving in energy pr tonne steel. What
value should we use from this figure? Obviously the initial effect is misleading since the effect is an
asymptotically decreasing function. The effect of the first cycle can save 5 GJ of energy pr tonne
steel. The effect of the 10’th recycling cycle is 0,007 GJ according to the function in Figure 1. Also, all
steel used today is a mixture of new steel from iron ore and recycled steel as discussed above.
Therefore, the effect of 5 GJ pr tonne recycled steel is grossly exaggerated. The same goes for
reduction in emissions of CO2. A saving of 1,5-2 kg pr kg of manufactured steel product would
practically eliminate CO2-emission.
The number from ProBas for German steel production is based on 34% used scrap 38. This is about
the average proportion of scrap used in the BF production route which dominates in Europe. The
emission of 1 590 tonnes of CO2-emission for each tonne produced steel should therefore be
representative for steel produced in Europe. If the steel is produced in US or in Asia, the emission
could be lower since the EAF production route is more used in these areas. We therefore conclude
that the emission figures for CO2 from steel used in ProBas include the effect of recycled steel scrap.
Also, the energy input for 1 kg of steel produced in Germany is estimated to be 19,8 MJ pr kg. This
fits very well with Figure 1 (where the y-axis is in GJ/tonne) if the recycling cycles increase above 2 or
3 cycles.
36
ibid., page 137, the report refers to 1434 kg for each kg of steel selection. Presumably this is a misprint in the order of 10
3.
37 ibid., page 130.
38 0,34kg “Eisen-Scrott” for 1 kg of produced steel, see ProBas - Details: Metall\Stahl-DE-mix

12
Aluminium production
Aluminium production 39,40, 41 is quite different from steel production. The main difference is the way
aluminium oxide (alumina) is extracted from ore. The production of aluminium can be separated
into two different stages:
extraction of alumina (aluminium oxide) from ore, mainly from bauxite (the Bayer process),
smelting of alumina into pure aluminium (Hall-Héroult process) .
The outcome of the Bayer process is alumina. Bauxite consists of aluminium hydroxide compounds.
Bauxite also consists of impurities in regard to aluminium, these are silica, iron and titanium oxides.
Bauxite is first washed with sodium hydroxide (caustic soda) and lime at temperatures between 100
and 350oC 42. This process yields aluminium hydroxide. Particles which do not dissolve in this
leaching process are filtered out as so-called red mud. The aluminium hydroxide is dried and
separated from the soda solution, then heated to 1050 oC in order to produce alumina which is
caused by calcination of aluminium hydroxide. Alumina or aluminium oxide (AI2O3) is produced as a
white, grained powder during this process 43. This product is then used in the electrolysis process.
Coal cannot be used as an reduction agent for aluminium production because the oxygen in the ore
will combine with the aluminium and not with the carbon 44. This makes the production process of
aluminium and steel very different. It also means that the two materials have different emission
factors of CO2 for every tonne of the material produced.
An electrolysis is a process that separates elements that are bound together chemically. An
electrolysis process involves three main components:
Electrodes, plates or rods made of a material that is able to conduct electricity. In aluminium
production, electrodes are made of carbon. The electrodes are known as cathodes
(negatively electrically charged, a surplus of electrons) and anodes (a deficit of electrons and
therefore positively electrically charged).
An electrolyte, a solvent that can conduct electricity. Electrical conductors has movable
electrically charged particles which can be positively or negatively charged. The electrolyte is
a solvent with a surplus of positively charged ions (or deficit of electrons) 45. In aluminium
production, the electrolyte is made of sodium hexafluoraluminate which occurs naturally as
the mineral cryolite.
An electric current from an external source.
39 See Big Sky Carbon Sequestration Partnership,
http://www.bigskyco2.org/files/pdfs/BigSkyPtSrceCO2Emit_methods_20070817.pdf , page 3, 40 Das, A. and Kandpal, T.C.: Analysis of energy demand and CO2 emissions for the Indian aluminium industry
using a dynamic programming model, International Journal of Energy Research, 2000, 51-59, available at http://www3.interscience.wiley.com/cgi -bin/fulltext/69503091/PDFSTART 41
See http://en.wikipedia.org/wiki/Aluminium 42
http://www.eaa.net/upl/4/en/doc/EAA_Environmental_profile_report_May08.pdf , page 19. 43
ibid., page 19. 44
http://en.wikipedia.org/wiki/Aluminium 45
http://en.wikipedia.org/wiki/Electrolyte

13
The Hall-Héroult process is an electrolyzing process whereby chemically elements that are bonded
together are separated by an electric current. This happens at temperatures at over 2000 oC. The
electrolysis consists of two electrodes, one cathode which generate electrons (negatively charged
atoms) and one anode which generate protons, positively charged atoms. The cathode attracts ions
with a positive charge while the anode attracts ions with a negative charge, they each attract ions
with the opposite charge as they have themselves. An ion is an atom which has either more or less
electrons than protons, making them negatively charged (anion) or positively charged (cathion).
During electrolysis the positively charged ions in the electrolyte will move towards the surplus of
electrons at the cathode. This happens because the electrolyte is a solvent with movable electrical
charges. The result is that the electric charges are neutralized, electrons are released from the
cathode and flow towards the anode while the positively charged ions in the electrolyte, the solvent,
flow towards the cathode. The chemical reaction in the electrolysis is made possible with the free
flow of electrons. An external electric circuit provide the electrons which are added to or removed
by the electrolysis.
During the electrolysis the aluminium is deposited at the cathode as left-over material while the
anode oxidizes to CO2 46 since the carbon in the anode reacts with the oxygen from the alumina
(aluminium oxide). The aluminium is reduced at the cathode since oxygen is removed from it.
Aluminium production requires much energy for the electrolysis. Consequently, the emission of CO2
from the production is highly dependant on the electricity mix, how much fossil fuel is used for
electricity production.
Table 4 Energy sources for production of 1 tonne of aluminium in EU27+EFTA countries 2005 47
Alumina
Anode (90% pre-bake, 10%
carbon paste) Electrolysis
Ingot at
cast house
Hard coal (kg) 0 % 0 % 39 % 0 %
Brown coal (kg) 0 % 0 % 35 % 0 %
Heavy oil (kg) 89 % 24 % 5 % 27 %
Natural gas (kg) 11 % 76 % 21 % 70 %
Diesel oil 0 % 0 % 0 % 3 %
Nuclear (kWh) 2299
Thermal energy MJ 9514 2677 1276
Hydroelectricity
(kWh) 6830
Electricity kWh 241 145 15027 126
Table 4 shows energy from different sources required to produce 1 tonne of aluminium as an
average in the 27 countries in EU plus the EFTA countries (Iceland, Norway, Lichtenstein) in 2005. The
data are compiled by the European Aluminium Association. The energy use is split into thermal
46
See http://en.wikipedia.org/wiki/Hall -H%C3%A9roult_process 47
http://www.eaa.net/upl/4/en/doc/EAA_Environmental_profile_report_May08.pdf , table 3.3, 3.4, 3.5, 3.6, 3,11.

14
energy and electricity. Thermal energy is energy caused by heat 48. Thermal energy in a substance is
the energy released when the substance is subjected to heat. When fossil fuel is combusted, thermal
energy is produced. The numbers for thermal energy in Table 4 is the energy released from
combustion of fossil fuels used directly in the production process of alumina, anode and cast ingot.
The different energy carriers used in production of thermal energy is listed with their relative
importance. The numbers for fissile fuel and nuclear power for the electrolysis step show their
contribution to electricity production, not their direct use in the production process as thermal
energy. The electrolysis step use only electricity as energy input.
As Table 4 shows, heavy oil is the major fossil fuel used in production of alumina from bauxite. Close
to 90% of thermal energy in this process comes from heavy oil. About a fourth of all thermal energy
used in the production of anode and cast ingot also comes from heavy oil. For the last two products,
natural gas is the dominant energy carrier for thermal energy. About two-thirds of all thermal energy
in anode production comes from natural gas on average in Europe. For production of cast ingot a
little more than two-thirds of all thermal energy comes in form of natural gas. Cast ingot is produced
from primary aluminium and the energy required to produce primary aluminium is not included in
the numbers for cast ingot.
Table 4 shows that roughly 15 000 kWh is needed to produce 1 tonne of pure aluminium at the
electrolysis step. Consequently, this production is very energy intensive. This number covers only the
consumption of electricity for the electrolysis step. Additionally energy is consumed during extraction
of bauxite, during production of alumina, and during casting of an aluminium ingot from pure
aluminium. Also, energy is consumed during transport of bauxite to alumina plant and during
transport of alumina to the aluminium smelters.
The European Aluminium Association (EAA) has calculated the total primary energy consumption for
production of 1 tonne of cast aluminium ingot 49. The calculated energy is classified into 5 categories.
These are:
The primary energy needed to produce electricity, including extraction and refining of fuels.
Thermal energy, the direct use of fuel combusted in the process of making aluminium.
The primary energy needed to produce auxiliary materials such as caustic soda, lime and
aluminium fluoride.
Transport, the energy needed to transport bauxite to alumina factories and alumina to
aluminium factories (only sea transport is considered).
Direct energy, the energy embedded in materials used in aluminium production such as
bauxite, alumina, anode and paste materials and materials used in casting aluminium.
The consumption of primary energy in order to produce 1 tonne of pure aluminium including all
categories is shown in Table 5.
48
http://discover.edventures.com/functions/termlib.php?action=&single=&word=thermal+energy 49
http://www.eaa.net/upl/4/en/doc/EAA_Environmental_profile_report_May08.pdf, table 3.13

15
Table 5 Total energy consumption for 1 tonne of cast aluminium ingot. EAA estimate.
Energy MJ
Categories Renewable Non-renewable Sum CO2-equivalents
Direct process 28 16872 16900 2594
Electricity 42162 84169 126331 4826
Thermal energy 56 24395 24451 1820
Transport 1 905 906 69
Auxiliary processes
138 4358 4496 368
Total 42385 130699 173084 9677
As Table 5 shows, producing 1 tonne of cast aluminium ingot consumes 173084 MJ of primary energy
including transport. This corresponds to 48 079 kWh. This estimate includes energy embedded in
imported aluminium to Europe. According to EAA, 36% of primary aluminium used in
EU+Norway+Switzerland + Iceland in 2005 was imported.
Lensink 50
reports a GER-value (Gross Energy Requirement) for aluminium of 140 MJ/kg aluminium
based on an electricity mix of western European countries. This includes raw material excavation,
processing of alumina, transport and production of aluminium in the electrolysis step. This
corresponds to 140 000 MJ/tonne of aluminium. The data set from EAA is for 1 tonne of cast
aluminium ingot and is 12 000 MJ higher. Both estimates are in primary energy. The estimates fit
reasonably well together. The difference could probably mostly be accounted for by difference in the
electricity mix uses.
Data from ProBas include all energy consumption included in the production of aluminium. There are
different data sets for different countries with different electricity mix. Table 6 shows historical data
for Germany for 2000,2005 and a forecast for Germany in 2020.
Table 6 Energy input for production of 1 kg of aluminium for Germany 2000, 2005 and 2010 51
Output Aluminium 1 kg Germany 2000
Germany 2005
Germany 2020
Input Nuclear power MJ 58,3 42,0 9,9
Biomass MJ 0,1 5,0 3,6
Brown coal MJ 47,5 38,4 33,2
Hard coal MJ 18,5 36,1 28,3
Natural gas MJ 23,4 27,7 37,3
Heavy oil MJ 24,7 27,8 27,5
Geothermal MJ 0,0002 0,0001 0,2870
Sun power MJ 0,0 0,1 0,9
Hydropower MJ 2,6 1,9 2,5
Wind power MJ 0,03 2,2 7,2
Garbage, waste MJ 19,4 7,3 7,0
Recycling MJ -0,1 -0,1 -0,1
50
Lensink, S.M.: Capacity Building for Sustainable Transport, 2005,
http://dissertations.ub.rug.nl/FILES/faculties/science/2005/s.m.lensink/thesis.pdf, page 36 51
ProBas, http://www.probas.umweltbundesamt.de/php/profisuche.php , choose aluminium from the option box “Bereitgestelltes Produkt”

16
Waste heat MJ -0,0000004
Total MJ 194,4 188,5 157,6
kWh 54,0 52,4 43,8
The ProBas estimates are based on the following transport estimates for producing 1 kg of
aluminium: 9 tonne-km by freight boat and 0,2 km by freight train for each kg bauxite-ore for
processing into aluminium oxide in Germany . These estimates are for all years in Table 6.
Table 6 shows that the energy consumption for production of 1 kg of aluminium will decrease from
54 kWh to 43,8 kWh from 2000 to 2020. This is a total reduction in consumption of energy in the
order of 18,8% . The input of nuclear power will fall from 23,7 percentage points, the share for
nuclear power is 30% in 2000 and is estimated to be 6,3% in 2020. Natural gas will increase it’s
share of energy consumption from 12% in 2000 to 23,7% in 2020. There is a slight decrease in the
consumption of brown coal but an increase in the consumption of hard coal measured in MJ. All in all
the consumption of coal will decrease from 66 MJ/kg aluminium in 2000 to 61,5 MJ/kg in 2020. Since
the total reduction on energy consumption is greater than the reduction in consumption of coal, it’s
share of total energy consumption will rise from 34% to 29% in 2020.
There is a remarkable increase in consumption of wind power from 2000 to 2020 in Germany. The
relative importance of wind power will rise from practically zero in 2000 to nearly 5% in 2020. The
consumption of wind power is actually close to the consumption of nuclear power in 2020. Transport
by freight trains of 1,9 tonnes of aluminium oxide as input for the production is included for all years.
Table 7 Energy input for production of 1 kg of aluminium for Norway 2000, 2005 and 2010 52
Output Aluminium 1 kg Norway 2000 Norway 2005 Norway 2020
Input Nuclear power MJ 1,7 1,7 1,7
Biomass MJ 0,02 0,02 0,02
Brown coal MJ 1,5 1,5 1,5
Hard coal MJ 2,6 2,4 2,4
Natural gas MJ 2,8 2,7 7,3
Heavy oil MJ 47,8 47,7 47,7
Geothermal MJ 0,00001 0,00001 0,00001
Sun power MJ 0,0 0,0 0,0
Hydropower MJ 48,1 48,1 45,2
Wind power MJ 0,01 0,01 0,01
Garbage, waste MJ 1,4 1,9 5,5
Recycling MJ -0,3 0,0 -0,3
Waste heat MJ -0,00000002
Total MJ 105,6 106,1 111,1
kWh 29,3 29,5 30,9
Table 7shows the same data for Norway. Transport is estimated as 0,1 tonne-km with freight train for
each kg produced aluminium. Transport by freight boat is not specified.
52
ProBas, http://www.probas.umweltbundesamt.de/php/profisuche.php , choose aluminium from the option box “Bereitgestelltes Produkt”

17
The striking difference in Table 7 as opposed to Table 6 is that the total amount of energy
consumption is much lower in Norway than in Germany and that the share of hydropower is much
larger. The consumption of heavy oil is larger, presumably due to more transport in order to get
alumina to the aluminium plant. Fossil fuel is practically not used in the electrolysis step in Norway,
but will be a significant part of the energy consumption in production of alumina. The total amount
of energy in Norway is practically standing still from 2000 to 2020 as opposed to Germany. The
relative importance of hydropower as energy source in Norway will decline while that of natural gas
will rise. All in all, the energy consumption of 1 kg of aluminium in Norway in 2020 will be 70% of the
corresponding consumption in Germany in 2020. This difference is due to the fact that hydropower is
much more energy effective, meaning that hydropower wastes less energy in order to produce 1 unit
of energy output in comparison to i.e. coal or natural gas. Consequently the consumption of primary
energy in Norway is less since the proportion of hydropower is greater.
Table 8 Energy consumption for producing 1 kg of aluminium mix in Germany 2005
Energy source MJ
Nuclear power 23,9
Biomass 1,7
Brown coal 13,7
Natural gas 45,8
Crude oil 27,8
Geothermisk 0,0
Waste hear 3,3
Secondary raw
materials
-0,2
Sun power 0,0
Stone coal 41,4
Hydro power 17,7
Wind power 0,7
Total 175,9
Table 8 shows energy required to produce 1 kg of aluminium in Germany 2005 based on import from
other countries. Germany is not self-supplied with aluminium and consequently needs to import
primary aluminium from other countries. Germany contributes 33% of the primary aluminium in
Table 8, 30% is imported from Russia, 12% from Australia, 17% from Brazil, South Africa and
Venezuela combined and finally 8% is imported from Norway. The energy efficiency in producing
countries will have an impact on the energy consumption required to produce this aluminium mix. All
in all, 175,9 MJ is required to produce 1 kg of primary aluminium under these assumptions. The
emissions of CO2-equivalents resulting from this production is 16,9 kg pr produced kg aluminium.
As is evident from the discussion above, the electricity mix is decisive for the total amount of energy
consumption for producing 1 unit of aluminium. As a corollary, the emission of CO2 should be
dependent on the electricity mix used in the electrolysis step and of the consumption of thermal
energy as input to the production of alumina and in transport. Table 9 shows data for CO2-emission
in India where the emission is split on combustion of fuel, production of alumina and emission from
the chemical reactions in the electrolysis step. This last emission occurs when the oxygen from
alumina reacts with the carbon in the anode electrode.

18
Table 9 Emission of CO2 for production of one tonne of aluminium in some Indian aluminium plants 53
Pr tonne produced aluminium tonne CO2
Combustion of fuel
Production of alumina
Chemical reaction in electrolysis
HINDALCO, Uttar Pradesh, India 20.99 14.50 2.05 2. 54
INDAL, Orissa, India 20.62 16.31 0.92 2. 54
NALCO, Orissa, India 20.66 14. 83 1.7 2. 54
BALCO, India 22.78 16. 83 1. 77 2. 54
Table 9 shows emission of CO2 for production of aluminium at some Indian aluminium plants. The
emissions data include production of alumina, emissions from combustion of fossil fuel as well as
emissions due to chemical reactions in the electrolysis step. The numbers for combustion of fuel
include emission of CO2 originating from production of electricity as well as emission from direct use
of fossil fuel as thermal energy in the production of alumina. Indian electricity mix has a high
proportion of coal which explains part of the high emission of CO2 54 pr tonne aluminium in Table 9.
As is evident from the tables above, aluminium has a much higher CO2-emission pr produced tonne
than steel. The table clearly shows that combustion of fuel is the most important contributor to CO2-
emissions and that the CO2-emission originating from the chemical reaction at the electrolysis step is
greater than CO2 from production of alumina. Table 9 shows the importance of the electrolysis step
in CO2-emission from aluminium production. Presumably, the data from Indian aluminium smelters
do not include transport of alumina to the aluminium smelters or transport of bauxite to the alumina
plant. At least this is not stated in the article.
Table 10 shows the emission of CO2 from aluminium plants in EU27+EFTA in 2005 calculated by the
European Aluminium Association. The table is split between CO2 and CO2-equivalents. It is assumed
that the calculation of CO2-equivalents is in line with the IPCC definition of “Kyoto basket” of
greenhouse gases, though that is not stated in the report 55. Emission of CO2 from thermal energy is
caused by direct use of combustion of fossil fuels in the production processes of bauxite, alumina and
aluminium ingot. In addition, fossil fuel is used to produce electricity which will generate CO2-
emissions. All in all, an emission of 9,7 tonne of CO2 is required to make 1 tonne of aluminium cast
ingot in EU27 and EFTA in 2005. This is about half the emission data from Indian plants, probably
reflecting the higher dependence of coal in the Indian electricity mix 56. Table 10 also shows that
production of electricity accounts for about half of all emission of CO2-equivalents in production of 1
53
See http://www3.interscience.wiley.com/cgi -bin/fulltext/69503091/PDFSTART , page 53, table II 54
Coal covers about 56,2% of domestic demand for commercial primary energy. See http://www.ifp.com/content/download/58416/1278358/version/2/file/7-va_Coal+in+India+current+status+and+outlook.pdf 55
For definition of “Kyoto basket” see http://www.darkoptimism.org/2008/09/03/the-climate-science-
translation-guide/ , footnote 8 and IPCC, http://www.ipcc.ch/pdf/assessment-report/ar4/wg3/ar4-wg3-chapter1.pdf , page 102-103 56
A global economy where capital flows to the locations with highest profit potential could cause international
aluminium production to be located in countries with low labour wages, subsidised energy and high CO 2-emissions if CO2 emissions continue to be free.
19
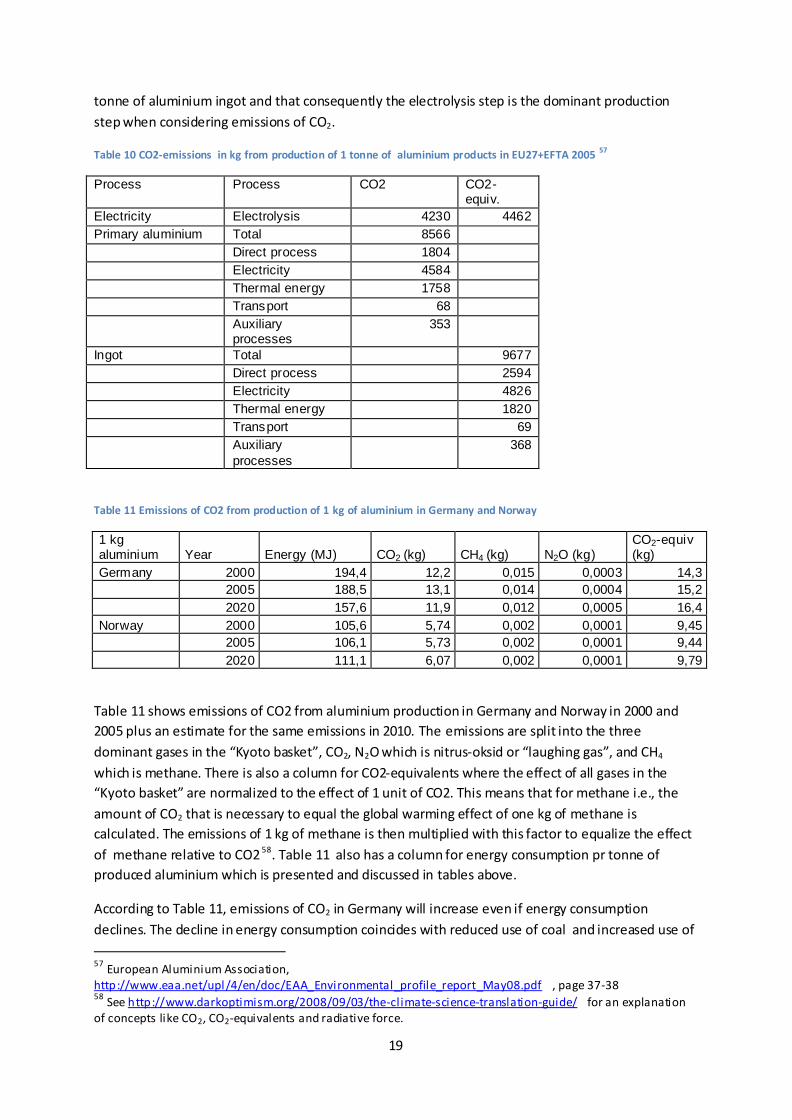
tonne of aluminium ingot and that consequently the electrolysis step is the dominant production
step when considering emissions of CO2.
Table 10 CO2-emissions in kg from production of 1 tonne of aluminium products in EU27+EFTA 2005 57
Process Process CO2 CO2-equiv.
Electricity Electrolysis 4230 4462
Primary aluminium Total 8566
Direct process 1804
Electricity 4584
Thermal energy 1758
Transport 68
Auxiliary processes
353
Ingot Total 9677
Direct process 2594
Electricity 4826
Thermal energy 1820
Transport 69
Auxiliary
processes
368
Table 11 Emissions of CO2 from production of 1 kg of aluminium in Germany and Norway
1 kg aluminium Year Energy (MJ) CO2 (kg) CH4 (kg) N2O (kg)
CO2-equiv (kg)
Germany 2000 194,4 12,2 0,015 0,0003 14,3
2005 188,5 13,1 0,014 0,0004 15,2
2020 157,6 11,9 0,012 0,0005 16,4
Norway 2000 105,6 5,74 0,002 0,0001 9,45
2005 106,1 5,73 0,002 0,0001 9,44
2020 111,1 6,07 0,002 0,0001 9,79
Table 11 shows emissions of CO2 from aluminium production in Germany and Norway in 2000 and
2005 plus an estimate for the same emissions in 2010. The emissions are split into the three
dominant gases in the “Kyoto basket”, CO2, N2O which is nitrus-oksid or “laughing gas”, and CH4
which is methane. There is also a column for CO2-equivalents where the effect of all gases in the
“Kyoto basket” are normalized to the effect of 1 unit of CO2. This means that for methane i.e., the
amount of CO2 that is necessary to equal the global warming effect of one kg of methane is
calculated. The emissions of 1 kg of methane is then multiplied with this factor to equalize the effect
of methane relative to CO2 58. Table 11 also has a column for energy consumption pr tonne of
produced aluminium which is presented and discussed in tables above.
According to Table 11, emissions of CO2 in Germany will increase even if energy consumption
declines. The decline in energy consumption coincides with reduced use of coal and increased use of
57
European Aluminium Association, http://www.eaa.net/upl/4/en/doc/EAA_Environmental_profile_report_May08.pdf , page 37-38 58
See http://www.darkoptimism.org/2008/09/03/the-climate-science-translation-guide/ for an explanation of concepts like CO2, CO2-equivalents and radiative force.

20
natural gas and oil. It seems rather odd that reduced consumption of energy and reduced relative
use of coal should generate more emissions of CO2. The increased use of natural gas (from 12-23,7%)
and heavy oil (12,7-17,5%) over the period should account for some of this increase in emissions.
Also, for the CO2-gas itself, there is a decline over the period, which is also true for methane while
there is an approximate 76% increase of emissions of N2O. This is probably due to the shift in the
composition of the electricity mix and thermal energy.
There is a slight increase (3,6%) in emissions of CO2 from Norwegian aluminium plants over the
period 2000-2020. In Norway, a reduction in use of hydropower will be substituted for by increased
use of natural gas which should lead to more emissions of CO2. Since the energy efficiency of natural
gas is lower than the one for hydropower, this should also increase the primary energy consumption
pr produced kg. All in all, the emissions of CO2-equivalents in Germany compared to Norway is 4,9 kg
higher for each kg produced aluminium in 2000 while the corresponding number for 2020 is 6,6 kg.
Recycling of aluminium is not a new process, it has been ongoing almost since the start of aluminium
production. According to the European Aluminium Association ”...it is estimated that 75% of all
aluminium ever produced is still in use today” 59. Also according to EAA more than half of the
aluminium produced in EU 27+EFTA today is based on recycled aluminium scrap.
Aluminium scrap comes in two different forms. New scrap is surplus materials from aluminium plants
which is not part of the final finished product. This scrap is left-over materials. They also include
dross from the production. This new scrap is melted in furnaces and used to produce aluminium
alloys. There is no specific scrap preparation step needed in order to use new scrap since most of the
materials come directly from production of primary aluminium without any additional preparation or
processing. New scrap is also called process scrap.
Old scrap is scrap obtained from aluminium products which have reached their end-of life as
consumer goods. These goods are fabricated from primary aluminium with other materials added in
the fabrication. Consequently, they need to be processed before they can be used to produce
aluminium alloys.. So the main difference between old and new scrap is the inclusion of a processing
step before the scrap can be re-melted. According to EAA, new scrap is re-melted while old scrap is
refined 60. Alloys from remitting are wrought aluminium alloys with less than 5% of alloying elements
in them while alloys from refining include alloying elements such as magnesium and copper which
can contribute 5-15% of the final product mass 61. Old scrap is also called used scrap 62.
In Europe, the total amount of scrap used in recycling was 5,5 million tonnes in 2005. Refiners used
65% of this amount while re-melters used the rest. In comparison, 4,5 million tonnes of pure
aluminium was produced in the electrolysis step 63. It took 1,009 tonnes of aluminium scrap plus 29
kg of alloy elements to produce 1 tonne of aluminium ingot from re-melting in 2005. For refining, it
took 1,054 tonnes of aluminium scrap plus 64 kg of alloying elements to produce 1 tonne of
aluminium ingot in 2005. Hence recycled aluminium contributed about half of all aluminium
produced in EU 27+EFTA in 2005.
59
http://www.eaa.net/upl/4/en/doc/EAA_Environmental_profile_report_May08.pdf , page 50 60
ibid., page 51. 61
ibid., page 7 and 53. 62
ibid., page 5 63
ibid., page 22 and 54.

21
Table 12 Input and output for 1 tonne of aluminium ingot from process scrap
Remelted aluminium
Process, thermal and
others Electricity Total Unit
Input Type Value Value
Crude oil 3,4 2,4 5,8 kg
Hard coal 0,5 12 12,5 kg
Brown coal 0,9 19,2 20,1 kg
Natural gas 80,9 6,6 87,5 kg
Primary energy 3849 1737 5586 MJ
Output CO2 219 79 298 kg
CO2-equivalents 234 83 317 kg
Nox 0,25 0,14 0,39 kg
Ethene-equiv. 0,04 0,029 0,069 kg
Table 12 shows input and output for production of 1 tonne of aluminium ingot from new scrap or
process scrap. All in all, 5586 MJ of primary energy is needed to produce 1 tonne of aluminium ingot.
This is equivalent to 1551 kWh of primary energy which is substantially less than what is required for
1 tonne of ingot made of pure aluminium from the electrolysis step. According to table 4, 151632 MJ
of primary energy was needed to produce 1 tonne of aluminium ingot from the electrolysis step.
Recycling thus requires only 3,7% of all primary energy needed for production through electrolysis.
Recycling new scrap or process scrap requires emissions of 317 tonnes of CO2-equivalents for
production of 1 tonne of aluminium ingot. According to Table 10, it takes 9677 tonnes of CO2-
equivalents to produce 1 tonne of ingot based on pure aluminium from the electrolysis step. Thus,
recycling new scrap saves 96,7% of these CO2-emissions.
Table 13Table 12 shows the input and output for producing 1 tonne of aluminium ingot from old
used scrap. Since this scrap requires a preparation step the primary energy consumption and the
emissions are higher than what is the case for recycling new process scrap. Recycling old scrap
requires about 38% more primary energy than recycling new scrap, and the CO2-emissions measured
in CO2-equivalents are about 60% higher.
Compared to producing 1 tonne of aluminium ingot from the electrolysis step, recycling old scrap
requires only 5% of the primary energy consumption for the same product. Recycling old scrap
requires emissions of 506 kg of CO2-equivalents opposed to 9677 tonnes for aluminium from the
electrolysis step. Thus, 95% of CO2-emissions from production of primary aluminium are saved by re-
melting recycled old scrap.
Table 13 Input and output for 1 tonne of aluminium ingot from used scrap
Refined aluminium
Process, thermal and
others Electricity Total Unit
Input Type Value Value
Crude oil 8,2 2,7 10,9 kg
Hard coal 1,9 13,4 15,3 kg
Brown coal 1,7 21,5 23,2 kg
Natural gas 104,6 15,5 120,1 kg

22
Primary energy 5376 2308 7684 MJ
Output CO2 382 99 481 kg
CO2-equivalents 391 115 506 kg
Nox 0,37 0,18 0,55 kg
Ethene-equiv. 0,05 0,035 0,085 kg
In 2005, refiners used 65% of all scrap collected in EU27+EFTA. The emissions of CO2-equivalents for
refiners pr tonne of produces ingot is 506 kg according to Table 13. The corresponding value for re-
melters is 317 kg according to Table 10. Weighing the two results together, we obtain emissions of
440 kg CO2-equivalents for production of 1 tonne of aluminium ingot based on recycled aluminium.
This includes both recycling of process scrap and old used scrap. Doing the same weighing for the
other indicators we obtain the numbers in Table 14. These values should be representative for
recycled aluminium in EU27+EFTA.
Table 14 Weighted input and output for 1 tonne of aluminium ingot from recycled aluminium scrap
Weighted average
Process,
thermal and others Electricity Total Unit
Input Type Value Value
Crude oil 6,5 2,6 9,1 kg
Hard coal 1,4 12,9 14,3 kg
Brown coal 1,4 20,7 22,1 kg
Natural gas 96,3 12,4 108,7 kg
Primary energy 4842 2108 6950 MJ
Output CO2 325 92 417 kg
CO2-equivalents 336 104 440 kg
Nox 0,3 0,2 0,5 kg
Ethene-equiv. 0,0 0,0 0,1 kg
Table 15 shows input and output for the production of kg of aluminium from secondary material in
Germany in 2000 and 2005. The data are obtained from ProBas. The values are higher than in the
EAA-report. By converting the data in Table 15 to production of 1 tonne (from 1 kg) we make them
comparable to the EAA estimate. The estimate for primary energy for production of 1 tonne of
aluminium based on secondary material in ProBas is 3,6 times higher than the EAA’s weighted
estimate for production of 1 tonne of ingot from recycled scrap. Estimates for emissions of CO2-
equivalents are almost 4 times higher in the ProBas estimate.
Table 15 Input and output for production of 1 kg of aluminium from secondary raw material. Germany 2000 and 2005.
Germany 2000 2005 Unit
Input Nuclear power 5,58 5,09 MJ
Biomass 0,00621 0,156 MJ
Brown coal 4,54 4,27 MJ
Hard coal 1,77 2,31 MJ
Natural gas 11,1 9,89 MJ
Crude oil 2,02 2,11 MJ
Geothermal 0,000016 0,0000147 MJ

23
Garbage, waste 1,85 1,49 MJ
Sun 0,00000415 0,00302 MJ
Wind 0,00255 0,0672 MJ
Hydropower 0,255 0,235 MJ
Secondary material -0,00346 -0,0031 MJ
Total 27,12032015 25,6181347 MJ
Output CO2 1,58 1,53 kg
CO2-equiv. 1,76 1,72 kg
N2O 0,0000377 0,000039 kg
NMVOC 0,00016 0,000157 kg
NOx 0,00262 0,00256 kg
CH4 0,00267 0,00252 kg
CO 0,0083 0,00832 kg
One reason for the discrepancy between ProBas and EAA-estimate could be the materials going into
the production of 1 unit of aluminium. According to ProBas, 66 g pure aluminium from electrolysis
step is used together with 1,1 kg of scrap to produce 1 kg of secondary aluminium. The ProBas
estimate contains no information on whether this scrap is old or new scrap.
In the EAA recycling model for re-melting the input for re-melting is clean process scrap (66%), ingot
for re-melting (21%), alloying elements (3%) and some liquid aluminium from special scrap (10%).
According to EAA, only scrap input is considered, other forms for input is substituted by clean process
scrap 64. This could explain some of the discrepancy, since the pure aluminium used in the ProBas
estimate will require more energy to produce. Then again, in the EAA model for refined used scrap
alloying elements are substituted for by pure aluminium which should increase the EAA estimate 65.
Also, the EAA estimate is for one unit of aluminium cast ingot which requires more processing than
one unit of aluminium made from primary or secondary materials.
Also, EAA claims that the use of thermal energy in the melting process has been “significant ly
reduced” 66. The ProBas estimate is not split into electricity and thermal energy. According to the EAA
estimate thermal energy constitutes close to 70% of all primary energy use.
The ProBas estimate is also valid only for Germany while the EAA recycl ing model is valid for
EU27+EFTA. This could explain some of the difference between the two estimates, though it is not
clearly how the estimates would be affected.
All in all, the ProBas estimate seems high in relation to the EAA recycling model. There is also little
difference between the 2000 and 2005 estimates from ProBas. This is contrary to the assumptions in
the EAA estimates.
In conclusion, the EAA estimates are representative for recycled aluminium in EU27+EFTA in 2005.
The ProBas estimates cover not only recycled materials, they are a mix of pure and recycled
materials. As an estimate of materials actually used in production of aluminium products these
estimates from ProBas may be more representative.
64
ibid., page 55. 65
ibid., page 61. 66
ibid., page 62.

24
Table 16 shows the effect of recycling in the ProBas model. The table shows the proportion in
percentage points for estimates with recycling relative to estimates without recycling. Use of brown
coal with recycling is for instance 7,5% of the use of brown coal without recycling in 2000 and 3,1% in
2005.
Table 16 Effect of recycling in the ProBas model. Estimates with recycling relative to estimates without recycling for
energy use and environmental indicators.
2000 2005
Input Nuclear power 9,6 % 12,1 %
Biomass 7,5 % 3,1 %
Brown coal 9,6 % 11,1 %
Hard coal 9,6 % 6,4 %
Natural gas 47,4 % 35,7 %
Crude oil 8,2 % 7,6 %
Geothermal 9,6 % 12,0 %
Garbage, waste 9,5 % 20,5 %
Sun 47,5 % 3,0 %
Wind 7,6 % 3,1 %
Hydropower 9,7 % 12,1 %
Secondary material
Total 13,9 % 13,6 %
Output CO2 13,0 % 11,7 %
CO2-equiv. 12,3 % 11,3 %
N2O 12,6 % 10,1 %
NMVOC
NOx
CH4 17,9 % 17,6 %
As can be seen from Table 16, emissions of CO2-equivalents with recycling are only 12% of what they
are without recycling in 2005, according to the ProBas estimates. Recycling only requires about 14%
of all primary energy required without recycling. The additional benefit of the recycling effect in
2005 required more use of hydropower, geothermal energy and electricity produced from waste and
garbage in 2005 relative to the year 2000.
Production of copper
Copper is produced 67 from copper ore which comes in two forms, sulphide or oxide ores. Sulphide
ores must be concentrated before producing copper, this process involves removing water and slag
which is waste materials for the copper production. Copper concentrate can be turned into copper in
two ways:
leaching the ore with an acid solution yielding copper sulphate solution which is used it in an
electrolysis where cathodes made from pure copper foils attract pure copper,
67
Based on http://www.copper.org/education/production.html and http://en.wikipedia.org/wiki/Copper_extraction
25
smelting the copper concentrate before using it in an electrolysis as above, the difference
being that the product from leaching is copper sulphate while the product from smelting is
99% pure copper.
During electrolysis metals like gold, silver and platinum may be recovered. Recycled copper can be
used in the smelting process.
A Japanese study 68 estimates the emissions of CO2 from copper production to be between 1400
tonne and 2240 tonne of CO2 pr produced tonne of copper. The emissions are dependant on
material composition, energy consumption and the electricity mix when energy sources are
converted into electricity.
Copper has excellent electrical conductive properties. So more use of copper should increase loss of
energy during use of electrical appliances 69. According to Leonardo Energy 70 the total loss of energy
in electricity networks globally is in the order of 1279 TWh per year which corresponds to emissions
of 750 million tonnes of CO2. Reducing loss in electricity networks could therefore have a huge
impact on use of fossil fuel to produce electricity. It is claimed that the present technology is capable
of reducing the loss to 30-50% of what it is today by increased use of copper 71. This is also true for
vehicles, more copper should increase energy efficiency in vehicles, thereby reducing the
consumption of fossil fuels since vehicles use these fuels to produce their electricity. The European
Copper Institute (ECI) claims that a “high-efficiency” motor has 30% more copper then the average
motor. ECI claims that use of one additional kg of copper in a rotor made of copper reduce the
emissions of CO2 by 3,674 kg pr year 72.
According to ECI 41% of copper produced in Europe comes from recycled copper. All in all, 889 000
tonnes of copper was produced in EU-countries in 2005 73, which means close to 365 000 tonnes of
copper are recycled each year in Europe.
There is about 23 kg of copper in an average US car, 18 kg for electrical components and 5 for non-
electrical components 74. A modern US car contains come 1500 electrical wires (in total 1,62 km of
wires) while the same number for a car in 1948 was 55 wires (in total 45 m). In comparison, a
construction vehicle contains about 30 kg of copper, an electrical forklift 63 kg, a Boeing 747-200
4082 kg of copper and a typical diesel-electric railroad locomotive 4990 kg of copper 75. Railroads and
subways use much copper both in locomotives and subway cars, in transformers for electricity to the
catenary and for the tracks which can be made of copper alloys like brass and nickel silver.
68
Narita, N., Sagisaka, M. and Inaba, A.: Life Cycle Inventory Analysis of CO2 Emission from Copper Products
Manufacturing System, http://www.jstage.jst.go.jp/article/shigentosozai/117/8/117_671/_article (abstract) 69
“More copper means greater energy efficiency and less CO2”, European Copper Institute,
http://www.openpr.com/pdf/27374/Copper-to-the-fore-in-the-eco-design-revolution.pdf 70
Leonardo Energy is a web-site managed by European Copper Institute and its European network of 11 offices, see http://www.leonardo-energy.org/welcome-leonardo-energy 71
Main, M, De Keulenaer, H., Ferreira, S.: A Carbon Strategy for Copper, available at http://www.leonardo-energy.org/carbon-strategy-copper 72
http://www.openpr.com/pdf/27374/Copper-to-the-fore-in-the-eco-design-revolution.pdf . Radiators can be made of copper as can tubes in air-conditioning and heating. 73
http://www.indexmundi.com/en/commodities/minerals/copper/copper_t20.html 74
http://www.copper.org/education/c-facts/c-trans_industry.html 75
Ibid.

26
The problem with recycling copper is that it must be pure to retain its electrical conductive
properties. Copper used in alloys such as brass cannot be recycled as pure copper with accordingly
electrical conductive superiority. Brass is an alloy of copper and zinc. Brass scrap can only be used as
input for products which contain brass.
Table 17 shows input and output for production of 1 kg of copper in Germany 2005. The data
includes all energy consumption and emissions in the entire production chain up to production of
pure copper. The table contains data both with and without recycling. Recycled copper covers both
pure copper as well as alloys which contains copper. The data for recycling is calculated as an average
of all recycled material in which copper is a part. Negative values for energy consumption in the
column for recycling is a credit allocated to the energy item on bases of saved energy.
As Table 17 shows, recycling of copper saves 43,3 MJ of primary energy pr kg produced copper.
Looking at emissions, recycling saves nearly 4 kg CO2-equivalents, 30 g of NOx and 10 g of CO for 1 kg
of produced copper in Germany 2005.
Table 17 also shows a column for a mix of 50% primary copper and 50% secondary from scrap. The
estimates for secondary copper includes transport of 0,3 tonne-km with freight train for each kg of
copper produced. The mix of primary and secondary is probably most representative for the mix of
copper used in manufacturing goods in Germany. The German mix corresponds reasonably well with
the ECI estimate of use of 41% recycled copper in production of new copper in Europe. According to
the table, using a production mix of 50-50 of new and recycled copper reduces the energy
consumption with 22 MJ per produced kg and emissions of CO2-equivalents with close to 1,9 kg.
Table 17 Input and output for production of 1 kg of copper in Germany 2005 with and without recycling
Germany 2005
Without recycling
With recycling
Mix 50-50
Input Nuclear power 3,34 3,34 3,34 MJ
Biomass 0,43 0,411 0,422 MJ
Brown coal 3,14 3,07 3,1 MJ
Hard coal 28,90 16 22,5 MJ
Natural gas 10,90 -0,35 5,26 MJ
Heavy oil 22,60 0,892 11,8 MJ
Geothermal 0,00 9,79E-06 0,00001 MJ
Garbage, waste 0,55 0,566 0,559 MJ
Secondary raw materials 0,13 2,89 1,51 MJ
Sun 0,01 0,00827 0,00861 MJ
Hydropower 0,27 0,154 0,212 MJ
Windpower 0,19 0,178 0,183 MJ
Total 70,46 27,16 48,89 MJ
Output CH4 0,0134 0,00591 0,00964 kg
CO 0,0128 0,00422 0,0085 kg
CO2 5,62 1,92 3,77 kg
N2O 0,000333 2,95E-05 0,000181 kg
NMVOC 0,000685 6,32E-05 0,000374 kg
NOx 0,0293 0,00348 0,0164 kg

27
SF6 0 0 0 kg
SO2 0,019 0,00466 0,0118 kg
Staub 0,00362 0,000283 0,00195 kg
CO2-Equivalent 5,93 2,06 4,04 kg