Embed Size (px)
Citation preview
1
Metal Matrix – Metal Nanoparticle Composites with
Tunable Melting Temperature and High Thermal
Conductivity for Phase Change Thermal Storage
Minglu Liu,1 Yuanyu Ma,2 Hsinwei Wu2 and Robert Y. Wang1,2*
1Department of Mechanical Engineering, Arizona State University, Tempe, Arizona 85287
2Department of Material Science & Engineering, Arizona State University, Tempe, Arizona
85287
*Corresponding author, [email protected]
Abstract:
Phase change materials (PCMs) are of broad interest for thermal storage and management
applications. For energy dense storage with fast thermal charging/discharging rates, a PCM
should have a suitable melting temperature, large enthalpy of fusion, and high thermal
conductivity. To simultaneously accomplish these traits, we custom design nanocomposites
consisting of phase change Bi nanoparticles embedded in an Ag matrix. We precisely control
nanoparticle size, shape, and volume fraction in the composite by separating the nanoparticle
2
synthesis and nanocomposite formation steps. We demonstrate a 50 – 100% thermal energy
density improvement relative to common organic PCMs with equivalent volume fraction. We
also tune melting temperature from 236 – 252°C by varying nanoparticle diameter from 8.1 –
14.9 nm. Importantly, the silver matrix successfully prevents nanoparticle coalescence and no
melting changes are observed during 100 melt-freeze cycles. The nanocomposite’s Ag matrix
also leads to very high thermal conductivities. For example, the thermal conductivity of a
composite with a 10% volume fraction of 13 nm Bi nanoparticles is 128 ± 23 W/m-K, which is
several orders of magnitude higher than typical thermal storage materials. We complement these
measurements with calculations using a modified effective medium approximation for nanoscale
thermal transport. These calculations predict that the thermal conductivity of composite’s with
13 nm Bi nanoparticles varies from 142 to 47 W/m-K as the nanoparticle volume fraction
changes from 10 to 35%. Larger nanoparticle diameters and/or smaller nanoparticle volume
fractions lead to larger thermal conductivities.
KEYWORDS: metal nanocomposites, solution-phase synthesis, tunable melting temperature ,
high thermal conductivity, phase change material, size-dependent melting
Latent heat thermal storage systems utilize the solid-liquid transition of phase change materials
(PCMs) to store thermal energy. This results in much higher energy densities than commonly
used sensible heat thermal storage systems and in turn leads to both material and space savings.1-3
For instance, the latent heat of ice is equivalent to 80 degrees of sensible heat in water.
Nevertheless, challenges exist for employing PCMs for effective latent heat thermal storage in
varying environmental conditions. Commercially used PCMs are mostly organics and salt
3
hydrates, which are limited to applications from 10 °C – 120 °C.4 This is suitable for thermal
management of buildings5 and typical electronics,6 but is mismatched for higher temperature
applications such as industrial process heat,7 power electronics thermal management,8 and
concentrated solar thermal power plants.9 Latent heat storage at elevated temperatures has been
generally restricted to phase change salts in lab settings,10 whereas industrial practice instead
focuses on molten salts for sensible heat storage.9, 11 However, salts are prone to corrosion
problems and also suffer from low thermal conductivity, which in turn leads to slow thermal
charging/discharging rates. In fact, this issue of low thermal conductivity is common to thermal
storage materials in general.12-14 The thermal conductivities of organic PCMs and salt hydrates
range from ~ 0.1 – 1 W/m-K,4 and the thermal conductivity of salts range from ~ 0.5 – 5 W/m-
K.10
Previous efforts to improve the thermal conductivity of PCMs have focused on the use of
thermally conductive filler materials (e.g. graphite,15 metallic nanoparticles,16 and carbon
nanotubes17) or foams (e.g. graphite and metal). While fillers are easy to implement, thermal
conductivity enhancements are unfortunately limited because the fillers do not form a continuous
structure and the thermal interface resistance between the PCM and fillers is non-negligible. To
overcome this problem, many researchers infiltrate PCM into thermally conductive foams (i.e.
metal foam18 and graphite foam19), which have a continuous structure and leads to better thermal
conductivity improvements. For example, a recent study using a graphite foam – paraffin wax
composite demonstrated a thermal conductivity of 3.6 W/m-K, which is a 18-fold improvement
over paraffin.12 The use of foams has been demonstrated for many low melting temperature
4
organic PCMs, however this technique is problematic for high melting temperature PCMs (e.g.
salt) due to difficulties with the infiltration process and corrosivity.20
To find a PCM that has high thermal conductivity, high melting temperature, and large
enthalpy of fusion, we turned our focus to metallic materials. Metals have excellent thermal
conductivities ranging from ~ 10 – 400 W/m-K and a broad range of melting temperatures
ranging from -40 °C to over 3000 °C. Relative to other PCMs, metals have received little
attention primarily due to their weight (i.e. poor gravimetric energy density).1, 14 While
gravimetric energy density is important for mobile applications, many thermal storage
applications are stationary, and in these cases volumetric energy density is of more importance.
Hence metallic PCMs could find applications in buildings thermal management, industrial
process heat, and concentrated solar thermal power plants.
In this paper, we propose the use of composites that consist of phase change metallic
inclusions distributed in a metal matrix. The phase change inclusions provide the desired melting
temperature and high volumetric energy density, whereas the matrix provides excellent thermal
transport and mechanical strength when the inclusions melt. Furthermore, we explore the use of
phase change nanoparticle inclusions as opposed to phase change macroparticle inclusions. The
choice of nanoparticles is motivated by the use of size-dependent melting as a new PCM design
tool. Size-dependent melting is a commonly-observed phenomenon in nanostructures and was
first predicted by Pawlow.21 Substantial theoretical and experimental efforts have since been
devoted to explaining the relation between nanoparticle diameter and melting temperature.22-28
5
These fundamental studies inspired us to develop nanoparticle-based PCMs for application
purposes.
We demonstrate this nanoparticle-based PCM concept by creating composites consisting of
phase change Bi nanoparticles embedded in an Ag matrix. We first present a solution-phase
approach to embed high-quality colloidal Bi nanoparticles into a bulk Ag matrix. This approach
separates the nanoparticle synthesis and composite formation steps, thereby enabling excellent
control over nanoparticle morphology and volume fraction. This in turn permits control over the
composite's melting temperature and energy density. We investigate the composite’s thermal
storage performance by using cyclic differential scanning calorimetry (DSC). Our composite’s
energy density is 50 – 100% better than composites containing an equivalent volume fraction of
typical organic PCMs. Furthermore, varying the Bi nanoparticle diameter tunes the
nanocomposite’s melting temperature from 236 – 252 °C. Importantly, these DSC measurements
also demonstrate that the silver matrix offers effective protection against coalescence of the Bi
nanoparticles during melt-freeze cycles. The Ag matrix also greatly improves thermal transport
in the nanocomposite. Thermal conductivity measurements using the Wiedemann-Franz law29
demonstrate that our nanocomposite’s thermal conductivity is several orders of magnitude better
than typical thermal storage materials. We also employ a modified effective medium
approximation (EMA) for nanoscale thermal transport to calculate the composite thermal
conductivity over a broad range of nanoparticle diameters and volume fractions.
6
Results and discussion
Metal Matrix – Metal Nanoparticle Composite Synthesis
The nanocomposite was prepared by a simple three-step approach: (a) synthesis of colloidal Bi
nanoparticles, (b) co-dissolution of Bi nanoparticles and Ag precursor in a solvent mixture, and
(c) heating to thermally decompose the Ag precursor into an Ag matrix. This three-step
nanocomposite approach enables independent control of nanoparticle size, shape, and volume
fraction by using a modular technique that separates nanoparticle synthesis from nanocomposite
formation. Nanoparticle size and shape are controlled by step (a) whereas nanoparticle volume
fraction is controlled by step (b). The formation of the metal matrix - metal nanoparticle
composite occurs in the last step, during which the Ag precursor thermally decomposes into an
Ag matrix that encapsulates the Bi nanoparticles.
The Bi nanoparticles were prepared by a hot injection technique reported by Yarema et al.30 In
brief, Bi[N(SiMe3)2]3 was used as a Bi precursor and reduced by hexadecylamine at a elevated
temperature. Size variation was achieved by varying the reaction temperature from 115 to 140
°C. This synthesis yields Bi nanoparticles with surface-bound hexadecylamine ligands. In order
to improve colloidal nanoparticle stability, the hexadecylamine ligands were exchanged with
oleic acid ligands post-synthesis. Figure 1 illustrates the high quality Bi nanoparticles prepared
by this approach, which exhibit spherical shape, excellent size control, and narrow size
distribution.
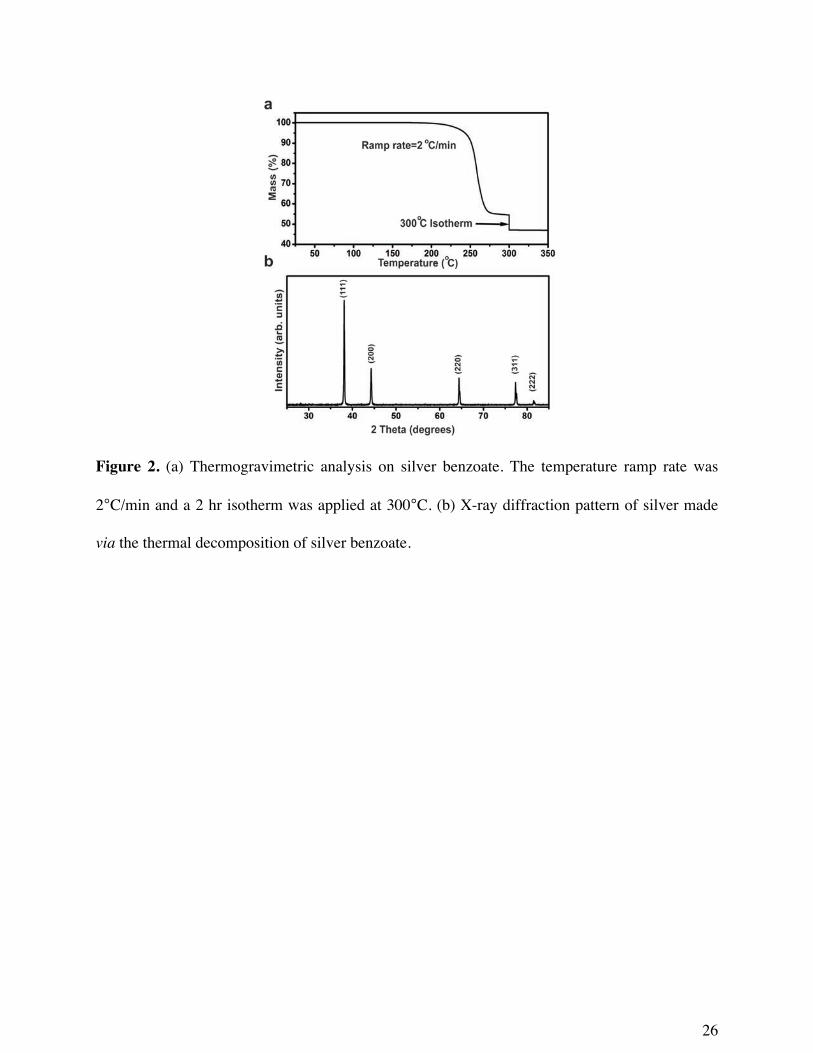
We used silver benzoate as the precursor to create the nanocomposite’s Ag matrix. Silver
benzoate is an organic silver salt with good solubility in amine solvents and is a well-known
7
silver precursor.31, 32 Thermogravimetric analysis was employed to identify appropriate
conditions for decomposing this precursor. A temperature ramp of 2 °C/min was performed from
room temperature to 300 °C, where the sample was kept isothermal for 2 hours and then resumed
up to 350 °C. As Figure 2a shows, after the isotherm process at 300 °C, the mass reached its final
value of ~ 47% and no further decrease in mass was observed. This mass ratio indicates that the
final product is Ag and this conclusion is further corroborated by x-ray diffraction measurements
(Figure 2b). Together, these results indicate that 300 °C is sufficient to fully decompose the
silver benzoate.
Prior to nanocomposite formation, the Bi nanoparticles and silver benzoate were mixed in an
appropriate ratio to yield the desired nanoparticle volume fraction. We note that this step is
sensitive to solvent choice because the Bi nanoparticles prefer nonpolar solvents whereas the
silver benzoate prefers mildly polar solvents. We addressed this issue by choosing a miscible
solvent pair and controlling the concentration of Bi nanoparticles and silver benzoate. Prior to
mixing, the Bi nanoparticles were suspended in toluene at ~ 1 mg/mL and the silver benzoate
was dissolved in pyridine at ~ 2 mg/mL. The Bi nanoparticle suspension and silver benzoate
solution were then combined, stirred for 2 hours, and used promptly. If not used promptly, partial
precipitation could be observed the following day. We also chose toluene and pyridine as the
miscible solvent pair because of their similar boiling temperatures, which should help prevent
phase segregation as the solvent evaporates during the nanocomposite formation step. We note
that since pyridine is a known ligand for colloidial nanocrystals,33, 34 a potential for ligand
exchange between oleic acid and pyridine exists during this step. However, we do not believe
ligand exchange occurs because the Bi nanoparticles with oleic acid ligands are insoluble in
8
pyridine. Had a ligand exchange occurred, the Bi nanoparticles should be soluble in pyridine
and our use of a pyridine-toluene solvent pair would be unnecessary.
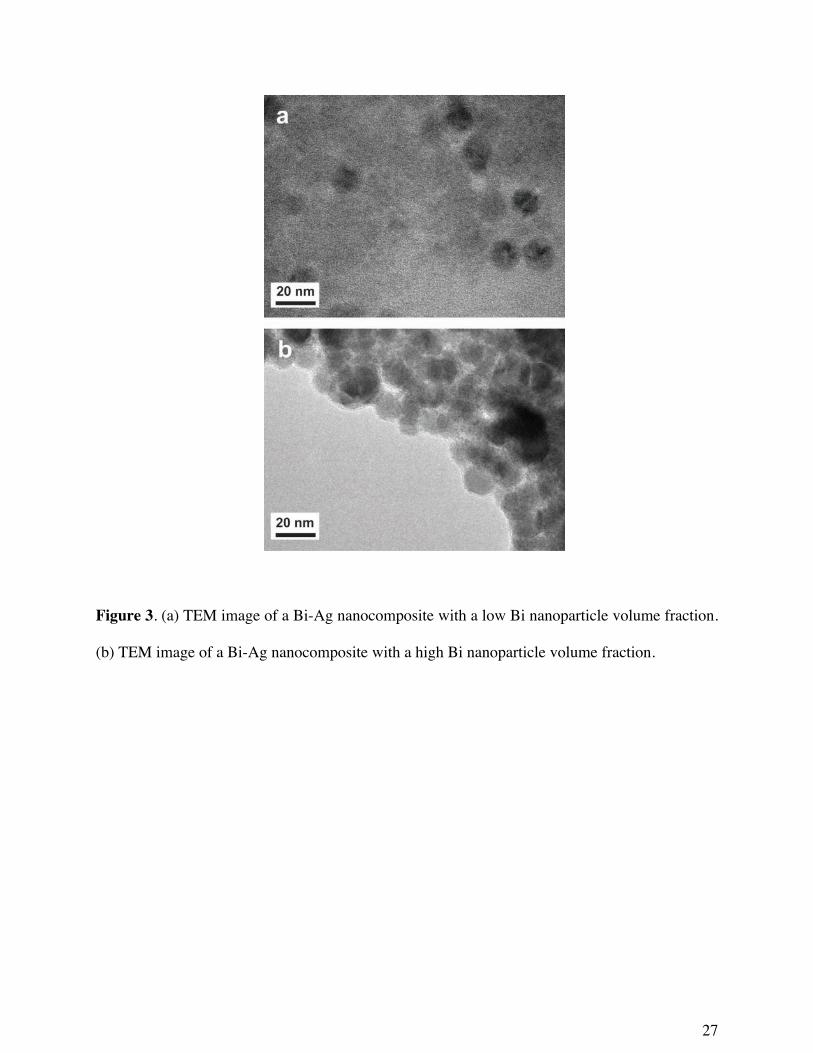
Composites used for phase change studies were prepared by drop-casting the combined Bi
nanoparticle – silver benzoate solution, solvent removal at 100°C, and then silver benzoate
thermal decomposition at 300°C for 2 hours. The results of this nanocomposite formation
process are shown in Figure 3. The size and shape preservation of the Bi nanoparticles during
this process is most clearly seen in Figure 3a, which has a low Bi volume fraction. Figure 3b
shows a composite with a large volume fraction of Bi nanoparticles, which is more
representative of the composites used for phase change studies (i.e. Figures 4 and 5). To confirm
the homogeneous dispersion of the Bi nanoparticles throughout the matrix, we imaged a
composite over a large area and collected chemical composition maps using energy dispersive x-
ray spectroscopy (Figure S1). Nanocomposite pores, which arise due to silver benzoate’s mass
loss during thermal decomposition, are also visible in Figure S1.
Despite the decomposition temperature of the silver benzoate being above the melting
temperature of the Bi, we do not observe any alloying between the Bi nanoparticles and Ag
matrix. This is primarily because the phase behavior of Ag-Bi is such that no compounds form
between these elements.35 In addition, the solubility of Ag in Bi is negligibly small and the
solubility of Bi in Ag is only 0.83 at% at 262°C.35 We also believe the oleic acid ligands protect
the Bi nanoparticles during silver benzoate decomposition. In our past work on Bi nanoparticle
melting inside polymer matrices,35 Bi nanoparticle melting was only observed after an initial
“break-in” period at elevated temperature (e.g. 1 hour at 300°C). We presume this is due to the
9
oleic acid ligands stabilizing the Bi surface and temporarily inhibiting melting. Similar surface
stabilization effects have been observed in other literature such as Pb nanoparticles in Al
matrices36 and Ag nanoparticles in Ni matrices.37
Unlike typical in situ metal nanocomposite formation techniques (i.e. ball milling,38, 39 melt
spinning,40, 41 and ion implantation26, 42), our metal matrix - metal nanoparticle composite
formation technique enables excellent control over particle size, shape, and composition. By
separating the steps of nanoparticle synthesis and nanocomposite formation, we have enabled
independent quality control over nanoparticle morphology and facile control over nanoparticle
volume fraction. This concept of separating nanoparticle synthesis and nanocomposite formation
has been previously demonstrated to produce nanocomposites with organic matrices43-45, oxide
matrices 46, 47 and semiconductor matrices.48-50 Herein, we have applied this concept to metal
matrix nanocomposites. We do note that identifying appropriate metal precursors is not trivial
because many precursors decompose into metal-oxide instead of metal. This was another reason
for our choice of a silver matrix; in addition to its favorable phase behavior with bismuth and its
very high thermal conductivity, it is energetically favorable to form silver over silver oxide due
to silver’s high reduction potential. By judicious selection of solvents, nanoparticles, and metal
precursors, we believe this approach can be generalized to other metal nanocomposite chemical
compositions. Soluble metal precursors that decompose into copper,51, 52 silver,53, 54 gold,55
palladium56, cobalt,57 and rhodium57 have been identified in the literature.
10
Nanocomposite Melting Temperature and Thermal Energy Storage Density
To investigate the melting characteristics of our Ag matrix – Bi nanoparticle composites,
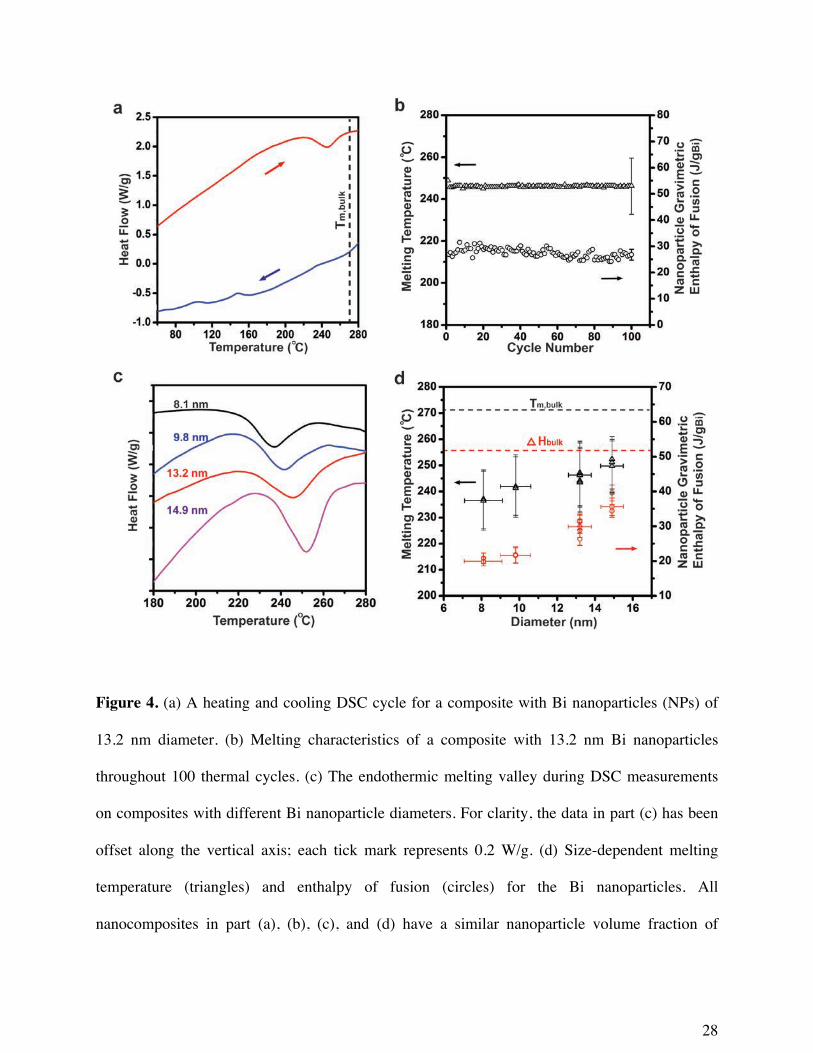
differential scanning calorimetry (DSC) measurements were performed. A representative heating
and cooling cycle of a nanocomposite containing 13.2 nm Bi nanoparticles is shown in Figure
4a. One endothermic valley was observed at 246 °C during heating and we attribute this to
nanoparticle melting. In accordance with size-dependent melting, this melting occurs well below
the melting temperature of bulk Bi, 271 °C. During cooling, three exothermic peaks were
observed. The first peak was broad and appeared around 224 °C, where as the second and third
peak appeared around 137 °C and 93 °C, respectively. We attribute these peaks to three separate
nanoparticle freezing events because the total energy released is equivalent to the energy
absorbed during nanoparticle melting; this data suggests that three different nucleation
mechanisms are present within our nanocomposite. The Bi nanoparticles also exhibit a
significant amount of supercooling, which could likely be mitigated via surface chemistry
modification on the nanoparticles.58 The melting and freezing assignments in our nanocomposite
were corroborated by a control DSC measurement on silver prepared via silver benzoate thermal
decomposition. No discernible features in the control measurement are observed throughout the
whole temperature range (Figure S2). In addition to facilitating fast thermal transport, the
composite’s Ag matrix is also intended to function as a nanoparticle isolation barrier that
prevents nanoparticle coalescence during melt-freeze cycles. To examine the matrix’s
effectiveness, we subjected a composite to 100 melt-freeze cycles. As shown in Figure 4b, no
notable changes in melting temperature or enthalpy of fusion were observed throughout the
cycles. Note that in Figure 4 we have used the endothermic valley minimum and full width half
maximum for the melting temperature and melting temperature uncertainty, respectively.
11
One benefit of employing nanoparticles as PCM is that the melting temperature can be tuned
via particle diameter. This design variable provides additional flexibility when engineering the
working temperature of a PCM. To demonstrate this capability, we prepared twelve composites
containing 8.1 ± 1.0, 9.8 ± 0.8, 13.2 ± 0.6 and 14.9 ± 0.6 nm Bi nanoparticles. As the
nanoparticle diameter varied from 8.1 – 14.9 nm, the melting temperature varied from 236 –
252°C (Figure 4c-d). We also observe a size-dependent enthalpy of fusion that accompanies the
size-dependent melting temperature; the nanoparticle enthalpy of fusion varied from 20.1 – 37.6
J/gBi over our range of nanoparticle diameters (Figure 4c-d). Our prior work on Bi nanoparticles
in polymer matrices showed different ranges of melting temperature and enthalpy of fusion in
similarly-sized nanoparticles (218 – 240°C and 12.9 – 42.1 J/gBi).45 This indicates that the
melting temperature and enthalpy of fusion of nanoparticles is a function of both size and
surrounding environment. Past observations of size-dependent enthalpy of fusion required the
use of sophisticated nanocalorimetry techniques.59 It is notable that we are able to extract size-
dependent enthalpies of fusion using widely available standard benchtop DSC measurements.
This is possible because our nanocomposite formation technique yields large sample sizes of
monodisperse nanoparticles, accurate Bi volume fraction control, and protection against
nanoparticle coalescence. We now note that this paper discusses two different types of enthalpy
of fusion. The first one is the gravimetric enthalpy of fusion of the nanoparticle component in the
composite, which is the enthalpy of fusion discussed above and in Figure 4. In the following
discussion and Figure 5, we focus on the nanocomposite’s effective volumetric enthalpy of
fusion. We note that we use nanocomposite mass to deduce nanocomposite volume, and hence
the volumetric enthalpy of fusions below do not account for porosity effects.
12
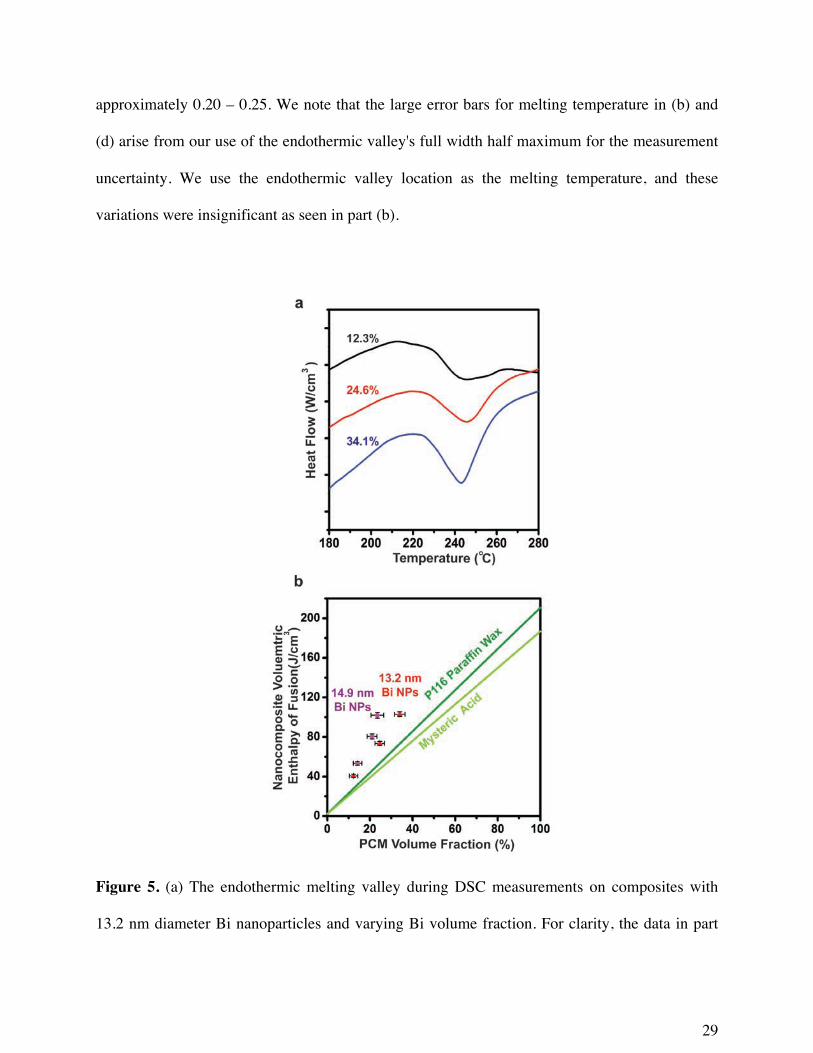
The thermal energy storage density of the composite can be controlled independently of
melting temperature by varying the nanoparticle volume fraction. As shown in Figure 5a, the
composite exhibits an increase in volumetric enthalpy of fusion as the volume fraction of Bi
nanoparticles is increased. This enables a simple two-step process for PCM design. First, the
nanoparticle size is chosen to yield the desired melting temperature. Second, the Bi content is
varied to yield the desired composite volumetric enthalpy of fusion. We successfully increased
the Bi nanoparticles volume fraction to ~34% without observing detrimental effects on melting
temperature (i.e. nanoparticle coalescence during melt-freeze cycling), which indicates that the
Ag matrix effectively protects to this level of nanoparticle loading (Figure 5a). The Bi volume
fraction in the nanocomposite was determined by using the relative concentrations of the bismuth
nanoparticle and silver benzoate solutions. Since the Bi nanoparticle solution contains both the
nanoparticles and surface ligands, we used a procedure described in our prior work45 to
determine the nanoparticle solution’s true Bi content. In brief, this procedure works by doing
cyclic DSC measurements on the Bi nanoparticles in the absence of Ag matrix. During this
procedure, the nanoparticles coalesce into bulk and melting is observed at the bulk Bi melting
temperature, 271°C. The Bi mass is then determined by comparing the absorbed energy during
melting to the bulk Bi enthalpy of fusion (51.9 J/g). Our nanocomposites achieve a ~ 50 – 100%
enhancement in volumetric energy density relative to composites with an equivalent volume
fraction of typical organic PCMs (Figure 5b).60 61 However, due to nanoparticle coalescence at
high nanoparticle volume fractions, the maximum PCM volume fraction in our composites is
lower than that achievable with organic PCM composites.
13
Nanocomposite Thermal Transport
Another objective of this nanocomposite design is to facilitate fast thermal
charging/discharging. Conventional thermal storage materials such as paraffins, salt hydrates,
and inorganic salts have poor thermal conductivities on the order of 10-1 – 100 W/m-K, which
lead to poor thermal charging/discharging rates. In contrast, metals have thermal conductivities
ranging from 101 – 102 W/m-K, which suggests our metal nanocomposite should have superior
thermal transport performance. To validate this conjecture, we measured the thermal
conductivity of our nanocomposites using the Wiedemann-Franz law.29
The Wiedemann-Franz law states that the thermal conductivity, k, of metallic materials can be
related to the electrical conductivity, σ, via the Lorenz number, L, and absolute temperature, T.
𝑘 = 𝐿𝜎𝑇
For most metals, the Sommerfeld value for the Lorenz number, L0, is a reasonable
approximation:62, 63
L0 = 2
22
3ekBπ = 2.44 × 10⁻⁸ WΩK-2
where kB, and e are the Boltzmann constant and elementary charge, respectively. In general, both
electrons and phonons conduct heat in solids, and so it should be noted that thermal conductivity
measurements obtained using the Wiedemann-Franz law approach only contain electron
contributions.29, 64 However, since the phonon contribution to thermal conductivity in metals is
negligible, this approach effectively measures the total thermal conductivity in our
nanocomposites.64 We prepared thin film nanocomposite samples by spin-coating and then
measured their corresponding electrical conductivity using the Van der Pauw method. The
14
thermal conductivity was then obtained using the Sommerfeld value for the Lorenz number in
the Wiedemann-Franz law.
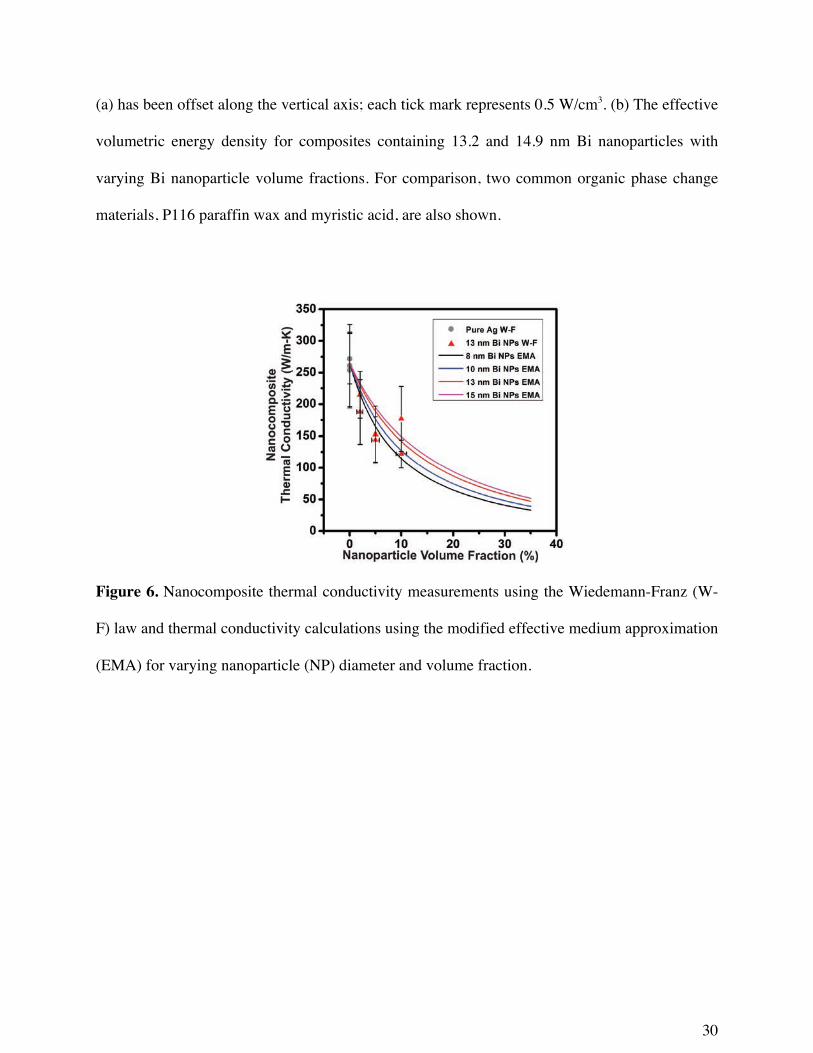
We measured the thermal conductivity of nanocomposites containing 13 nm Bi nanoparticles
with volume fractions ranging from 0 – 10% (Figure 6). The nanocomposite thermal
conductivity varied from 270 ± 61 W/m-K to 128 ± 23 W/m-K over this range and larger Bi
nanoparticle volume fractions resulted in lower thermal conductivities. Notably, these thermal
conductivity values are significantly greater than typical thermal storage materials by several
orders of magnitude. The thermal conductivity of our nanocomposite with 0% Bi nanoparticles
corresponds to silver prepared via thermal decomposition of silver benzoate and is approximately
40% less than literature values for bulk silver. Given that our Ag samples exhibit porosity and
are nanocrystalline with grain sizes on the order of 100 nm (see Figure S3), this moderate
decrease in thermal conductivity is reasonable. The uncertainty in nanocomposite thermal
conductivity was dominated by film thickness uncertainty caused by roughness. Samples with Bi
nanoparticle fractions greater than 10 vol% were not experimentally measured due to poor film
quality. We also note that our use of the Sommerfeld value for the Lorenz number assumes that
the nanocomposite’s electron gas is degenerate and that the electron mean free path is the same
for both electrical conductivity and thermal conductivity.62, 63 Since Lorenz number deviations of
up to ~50% from the Sommerfeld value have been reported in the literature,65, 66 our use of this
value introduces additional uncertainty. Nonetheless, this uncertainty is relatively small given the
several orders of magnitude improvement in thermal conductivity of our nanocomposites.
15
The nanocomposite thermal conductivity decreases from 215 ± 51 W/m-K to 128 ± 23 W/m-K
as the volume fraction of 13 nm Bi nanoparticles increases from 2% - 10%. This thermal
conductivity trend arises due to two different effects. The first effect is that increasing
nanoparticle volume fraction decreases the thermal conductivity of the Ag matrix itself. This
arises because the nanocomposite’s interface density is commensurate with the mean free path of
the thermal energy carriers in the Ag phase (i.e. ~ 33 nm, see Supporting Information). These
interfaces act as scattering sites, which leads to smaller effective mean free paths in the Ag and
lower Ag thermal conductivities. The second effect causing this thermal conductivity trend is
that the volume fraction of the highly-conductive Ag component decreases as the nanoparticle
volume increases. It should also be noted that due to the finite thermal interface conductance
between the Ag and Bi, the Bi nanoparticles contribute a negligible amount to the overall
nanocomposite thermal conductivity. Based on experimental data for similar interfaces,67, 68 we
estimate that the thermal interface conductance between the Bi nanoparticles and the Ag matrix
is 34 MW/m2-K (this value is lower than typical metal-metal interface conductances69 due to the
presence of organic ligands at the Bi-Ag interface). For reference purposes, an interface
conductance can be converted into an equivalent film thickness by dividing the film’s thermal
conductivity by its thickness. In the case of our nanocomposite, the interface conductance
between the Bi nanoparticles and Ag matrix is equivalent to a 7.9 µm thick Ag film.
Consequently, the nanocomposite’s thermal conductivity is dominated by the thermal
conductivity of the monolithic Ag matrix and smaller Ag matrix volume fractions directly lead to
small thermal conductivities.
16
To further explore the effects of nanoparticle size and volume fraction on the nanocomposite
thermal conductivity, we utilize a modified effective medium approximation (EMA) that
accounts for nanoscale thermal transport effects. The conventional EMA approach is invalid for
nanostructured materials because large interface densities lead to enhanced scattering of thermal
energy carriers. This scattering leads to thermal conductivity changes in the nanocomposite as
well as the individual nanocomposite constituents themselves. The modified EMA approach
suggested by Minnich and Chen70 addresses this issue by accounting for interface density when
estimating the mean free path of thermal energy carriers. Using their modified EMA approach,
they obtained good agreement with more sophisticated Monte Carlo calculations on
nanocomposite thermal conductivity. Recently, Ong et al.71 successfully applied this approach to
fit experimental thermal conductivity data on nanocrystal arrays comprised of nanoparticles with
similar structure to the nanoparticles in our work. Consequently, we believe this modified EMA
method should provide reasonable predictions for the thermal conductivity of our
nanocomposites. Note that the original work by Minnich and Chen70 focused on thermal
transport via phonons. Since our nanocomposites are metallic, the predominant heat carriers are
free electrons instead of phonons and we have adapted our calculations to account for this. We
neglect the phonon contribution to thermal conductivity because it is typically three orders of
magnitude smaller than the electron contribution in metals. Additional calculation details can be
found in Supporting Information.
Figure 6 directly compares our modified EMA calculations with our experimental
measurements. Given our measurement uncertainty, these results are in reasonable agreement.
These calculations indicate that our nanocomposites with ~35 vol% Bi (i.e. the highest volume
17
fraction for which melting point depression could be maintained) have a thermal conductivity of
approximately 33 to 52 W/m-K for nanoparticle diameters from 8 to 15 nm. Changing the Ag-Bi
thermal interface conductance and/or the Bi nanoparticle thermal conductivity by several orders
of magnitude in the EMA calculations had negligible effects on the nanocomposite thermal
conductivity (see Supporting Information). This supports our above assertions that the dominant
factors causing the nanocomposite thermal conductivity trend for increasing Bi nanoparticle
volume fraction are decreases in Ag thermal conductivity and Ag volume fraction. These
modified EMA calculations also indicate that smaller Bi nanoparticle diameters lead to smaller
nanocomposite thermal conductivities. This can be understood by realizing that for equivalent
volume fractions, the Ag-Bi interface density increases as the Bi nanoparticle diameter
decreases. This increased interface density causes the effective mean free path in the Ag matrix
to decrease and consequently the thermal conductivity of the Ag matrix itself decreases as
nanoparticle diameter decreases. Overall, our combined thermal conductivity calculations and
modified EMA calculations indicate that our nanocomposite thermal conductivity is on the order
of 101 – 102 W/m-K, which is several orders of magnitude better than typical thermal storage
materials (e.g. 10-1 – 100).4, 10 This increased thermal conductivity improves thermal energy
storage performance via significantly faster thermal charging/discharging times
Conclusion
We have created nanocomposites that consist of phase change Bi nanoparticles embedded in
an Ag matrix. Our nanocomposite formation approach enables excellent control over
nanoparticle size, shape, and volume fraction, and can likely be generalized to other metal matrix
– metal nanoparticle compositions. Using these Ag matrix – Bi nanoparticle composites, we have
18
experimentally demonstrated PCMs with tunable melting temperatures and large thermal energy
densities. The Ag matrix preserves the nanocomposite structure during melt-freeze cycles and
enables excellent thermal conductivities. Thermal conductivity measurements and modified
EMA calculations indicate that our nanocomposite thermal conductivity is on the order of 101 –
102 W/m-K, which is several orders of magnitude better than typical thermal storage materials.
Overall, this metal matrix – metal nanoparticle composites represents a new paradigm for PCMs
that can be used for thermal storage and management applications.
Materials and Methods
Materials and Equipment: All reagents and solvents were purchased from Sigma Aldrich. Sample imaging was
done with transmission electron microscopy (TEM, Tecnai F20) and scanning electron microscopy (SEM, Nova 200
NanoLab FEI). The X-ray diffraction was taken on high resolution x-ray diffractometer (XRD, PANALYTICAL
X’PERT PRO), with CuKα X-ray source operating at 40 kV and 40 mA. The thermogravimetric analysis and
differential scanning calorimetry were performed using a TA Instruments Q500 TGA and TA Instruments Q20
DSC. Elemental analysis was carried out by energy dispersive spectroscopy (EDS, EDAX). The masses of
nanoparticles and nanocomposites were determined using a Mettler Toledo UMX2 Ultra-Microbalance. Thin film
conductivity measurements were performed with a Keithley 2400 sourcemeter and film thicknesses were determined
by profilometry (Dektak XT stylus profilometer). Unless otherwise indicated, all samples were prepared and stored
in an air-free environment. Samples were exposed to air for brief periods when using the above instruments.
Bi Precursor Synthesis: Bi[N(SiMe3)2]3 is a metal silylamide and was used as the Bi precursor in this work. This
precursor was prepared by reacting BiCl3 and Li[N(SiMe3)2] at 0 °C for 2 hours.30 In a typical synthesis, two
solutions were prepared in a nitrogen filled glovebox: 1) 3.34 g of Li[N(SiMe3)2] dissolved in 40 mL diethyl ether,
and 2) 2.10 g BiCl3 dissolved in a mixture of 40 mL diethyl ether and 10 mL tetrahydrofuran (THF). Solution 1 was
firstly added into the flask and cooled down to 0 °C with an ice bath. Solution 2 was then added drop-wise to the
flask and reacted for 2 hours. After 2 hours, the reaction mixture was a non-transparent yellow color and was then
filtered through a PTFE filter (pore size 200 nm). The resulting bright yellow solution was dried under vacuum for 1
19
hour, and then redissolved in 15 mL of anhydrous pentane. The solution was again filtered and dried under vacuum
for another 2 hours. The final product Bi[N(SiMe3)2]3 was a yellow powder and stored in a nitrogen-filled glovebox
for future use.
Bi Nanoparticle Synthesis: In a typical 13 nm Bi nanoparticle synthesis, 20 g of hexdecylamine (HDA) was
loaded into a three-neck flask and degassed before heating to 130 °C. At this temperature, two solutions were
injected into the flask with a time interval of 15 seconds between injections. The first solution was 100 µL of 1 M
Li(Et3BH) in THF and the second was 0.14 g Bi[N(SiMe3)2]3 and 0.17 g Li[N(SiMe3)2] co-dissolved in 2 mL of
toluene. 15 seconds after the 2nd injection, the flask was swiftly removed from the heating mantle and cooled using a
water bath. During cooling, 20 mL toluene was injected into the reaction mixture to prevent the HDA from
solidifying. Once the temperature dropped to 40 °C, the flask was disconnected from the schlenk line and the
cleaning process was done in air. The Bi nanoparticles were isolated from the mixture by precipitating with a 1:1
addition of ethanol and centrifuging at 3000 rpm for 5 minutes. It should be noted that this synthesis yields Bi
nanoparticles with surface-bound HDA ligands. We switched these HDA ligands for oleic acid ligands immediately
after the first precipitation, which led to improved colloidal nanoparticle solution stability. The Bi nanoparticles
were further cleaned three times by precipitating with ethanol and finally suspended in toluene.
Nanocomposite Formation: The nanocomposites were prepared in three steps. First, the Bi nanoparticles were
synthesized as described above. The nanoparticles were further cleaned by additional precipitations with ethanol and
then dissolved in toluene with a concentration of ~ 1 mg/mL. A fresh silver precursor solution was prepared by
dissolving silver benzoate using pyridine and stirring overnight. The concentration of silver benzoate solution was ~
2 mg/mL. Second, an appropriate amount of Bi nanoparticle suspension and silver benzoate solution were combined
to yield the desired Bi nanoparticle volume fraction and this combined solution was stirred for an additional 2 hours.
This combined solution was then filtered through a PTFE filter and drop-cast on appropriate substrates (e.g. DSC
pan or TEM silicon nitride window). Finally, the cast film was thermally annealed in two steps: 100 °C for 1 hour
and then 300 °C for 2 hours in a nitrogen atmosphere.
DSC Measurements: All DSC samples were prepared by drop-casting an appropriate amount of Bi nanoparticle –
silver benzoate combined solution into an aluminum DSC pan. The sample was then subjected to a two-step thermal
anneal in a nitrogen atmosphere as described above. During DSC experiments, all samples were heated and cooled
between 0 °C to 300 °C at a rate of 10 °C/min for at least 15 cycles.
20
Thermal Conductivity Measurements: The thermal conductivity measurements were carried out by first
measuring electrical conductivity using the Van der Pauw method and then converting this electrical conductivity
into a thermal conductivity using the Wiedemann-Franz law.29 Samples for thermal conductivity measurements were
prepared on silicon substrates by spin coating 100 µL of solution at 1500 rpm. The film was then heated sequentially
at 100 °C and 350 °C. In some instances this deposition process was repeated to yield an appropriate film thickness.
Final film thicknesses were typically 200 - 600 nm.
TEM sample preparation and particle size determination: All Bi nanoparticle TEM samples were prepared by
drop-casting 50 µL of a dilute nanoparticle suspension onto a carbon film supported copper TEM grid. The
nanoparticle diameter was determined with ImageJ by analyzing a representative TEM image containing 100 - 200
Bi nanoparticles. The diameter uncertainties in manuscript represent the standard deviation of the nanoparticle
diameters. The nanocomposite TEM samples were prepared by drop-casting a dilute combined solution of Bi
nanoparticles and silver benzoate onto a Si3N4 window and then annealed as described in the nanocomposite
formation section above.
Supporting Information Available
This material contains additional details on the modified effective medium approximation
calculations. This material also contains additional figures showing scanning electron
microscopy images, energy dispersive x-ray spectroscopy chemical composition maps, DSC
data, and modified effective medium approximation results on nanocomposite thermal
conductivity. This material is available free of charge via the Internet at http://pubs.acs.org.
Acknowledgements
This work was supported by the National Science Foundation through Grant no. CBET-
1236656. We gratefully acknowledge the use of facilities within the LeRoy Eyring Center for
21
Solid State Science at Arizona State University. The authors thank Lenore Dai for use of her
thermogravimetric analyzer.
References
1. Hyun, D. C.; Levinson, N. S.; Jeong, U.; Xia, Y. Emerging Applications of Phase-Change Materials (PCMs): Teaching an Old Dog New Tricks. Angew. Chem., Int. Ed. 2014, 53, 3780-3795. 2. Liu, C.; Li, F.; Ma, L. P.; Cheng, H. M. Advanced Materials for Energy Storage. Adv. Mater. 2010, 22, E28-E62. 3. Sharma, A.; Tyagi, V. V.; Chen, C. R.; Buddhi, D. Review on Thermal Energy Storage with Phase Change Materials and Applications. Renewable Sustainable Energy Rev. 2009, 13, 318-345. 4. Kenisarin, M.; Mahkamov, K. Solar Energy Storage Using Phase Change Materials. Renewable Sustainable Energy Rev. 2007, 11, 1913-1965. 5. Pasupathy, A.; Velraj, R.; Seeniraj, R. V. Phase Change Material-Based Building Architecture for Thermal Management in Residential and Commercial Establishments. Renewable Sustainable Energy Rev. 2008, 12, 39-64. 6. Krishnan, S.; Garimella, S. V. Thermal Management of Transient Power Spikes in Electronics - Phase Change Energy Storage or Copper Heat Sinks? J. Electron. Packag. 2004, 126, 308-316. 7. Tamme, R.; Bauer, T.; Buschle, J.; Laing, D.; Müller-Steinhagen, H.; Steinmann, W.-D. Latent Heat Storage above 120°C for Applications in the Industrial Process Heat Sector and Solar Power Generation. Int. J. Energy Res. 2008, 32, 264-271. 8. Lu, T. J. Thermal Management of High Power Electronics with Phase Change Cooling. Int. J. Heat Mass Transfer 2000, 43, 2245-2256. 9. Stekli, J.; Irwin, L.; Pitchumani, R. Technical Challenges and Opportunities for Concentrating Solar Power With Thermal Energy Storage. J. Therm. Sci. Eng. Appl. 2013, 5, 021011-021011. 10. Kenisarin, M. M. High-Temperature Phase Change Materials for Thermal Energy Storage. Renewable Sustainable Energy Rev. 2010, 14, 955-970. 11. Flueckiger, S.; Yang, Z.; Garimella, S. V. An Integrated Thermal and Mechanical Investigation of Molten-Salt Thermocline Energy Storage. Appl. Energy 2011, 88, 2098-2105. 12. Ji, H.; Sellan, D. P.; Pettes, M. T.; Kong, X.; Ji, J.; Shi, L.; Ruoff, R. S. Enhanced Thermal Conductivity of Phase Change Materials with Ultrathin-Graphite Foams for Thermal Energy Storage. Energy Environ. Sci. 2014, 7, 1185-1192. 13. Schiffres, S. N.; Harish, S.; Maruyama, S.; Shiomi, J.; Malen, J. A. Tunable Electrical and Thermal Transport in Ice-Templated Multi layer Graphene Nanocomposites through Freezing Rate Control. ACS nano 2013, 7, 11183-11189. 14. Zalba, B.; Marin, J. M.; Cabeza, L. F.; Mehling, H. Review on Thermal Energy Storage with Phase Change: Materials, Heat Transfer Analysis and Applications. Appl. Therm. Eng. 2003, 23, 251-283. 15. Li, M. A Nano-Graphite/Paraffin Phase Change Material with High Thermal Conductivity. Appl. Energy 2013, 106, 25-30.

22
16. Parameshwaran, R.; Jayavel, R.; Kalaiselvam, S. Study on Thermal Properties of Organic Ester Phase-Change Material Embedded with Silver Nanoparticles. J. Therm. Anal. Calorim. 2013, 114, 845-858. 17. Chen, L.; Zou, R.; Xia, W.; Liu, Z.; Shang, Y.; Zhu, J.; Wang, Y.; Lin, J.; Xia, D.; Cao, A. Electro and Photodriven Phase Change Composites Based on Wax-Infiltrated Carbon Nanotube Sponges. ACS nano 2012, 6, 10884-10892. 18. Cui, H. T. Experimental Investigation on the Heat Charging Process by Paraffin Filled with High Porosity Copper Foam. Appl. Therm. Eng. 2012, 39, 26-28. 19. Lafdi, K.; Mesalhy, O.; Elgafy, A. Graphite Foams Infiltrated with Phase Change Materials as Alternative Materials for Space and Terrestrial Thermal Energy Storage Applications. Carbon 2008, 46, 159-168. 20. Zhao, C. Y.; Wu, Z. G. Heat Transfer Enhancement of High Temperature Thermal Energy Storage Using Metal Foams and Expanded Graphite. Sol. Energy Mater. Sol. Cells 2011, 95, 636-643. 21. Pawlow, P. The Dependency of The Melting Point on the Surface Energy of a Solid Body. (Supplement) Z. Phys. Chem. 1909, 65, 545-548. 22. Buffat, P.; Borel, J. P. Size Effect on Melting Temperature of Gold Particles. Phys. Rev. A 1976, 13, 2287-2298. 23. Couchman, P. R.; Jesser, W. A. Thermodynamic Theory of Size Dependence of Melting Temperature in Metals. Nature 1977, 269, 481-483. 24. Liang, L. H.; Li, J. C.; Jiang, Q. Size-Dependent Melting Depression and Lattice Contraction of Bi Nanocrystals. Phys. B 2003, 334, 49-53. 25. Hu, J.; Hong, Y.; Muratore, C.; Su, M.; Voevodin, A. A. In-situ Transmission Electron Microscopy of Solid-Liquid Phase Transition of Silica Encapsulated Bismuth Nanoparticles. Nanoscale 2011, 3, 3700-3704. 26. Xu, Q.; Sharp, I. D.; Yuan, C. W.; Yi, D. O.; Liao, C. Y.; Glaeser, A. M.; Minor, A. M.; Beeman, J. W.; Ridgway, M. C.; Kluth, P., et al. Large Melting-Point Hysteresis of Ge Nanocrystals Embedded in SiO2. Phys. Rev. Lett. 2006, 97, 155701. 27. Tang, C. Y.; Sung, Y. M.; Lee, J. Nonlinear Size-Dependent Melting of the Silica-Encapsulated Silver Nanoparticles. Appl. Phys. Lett. 2012, 100, 201903. 28. Goldstein, A. N.; Echer, C. M.; Alivisatos, A. P. Melting in Semiconductor Nanocrystals. Science 1992, 256, 1425-1427. 29. Neil W. Ashcroft, N. D. M., Solid State Physics. New York: Holt, Rinehart and Winston 1976; p 33-53. 30. Yarema, M.; Kovalenko, M. V.; Hesser, G.; Talapin, D. V.; Heiss, W. Highly Monodisperse Bismuth Nanoparticles and Their Three-Dimensional Superlattices. J. Am. Chem. Soc. 2010, 132, 15158-15159. 31. Dujardin, E.; Peet, C.; Stubbs, G.; Culver, J. N.; Mann, S. Organization of Metallic Nanoparticles Using Tobacco Mosaic Virus Templates. Nano Lett. 2003, 3, 413-417. 32. Kumar, A.; Vemula, P. K.; Ajayan, P. M.; John, G. Silver-Nanoparticle-Embedded Antimicrobial Paints Based on Vegetable Oil. Nat. Mater. 2008, 7, 236-241. 33. Murray, C. B.; Norris, D. J.; Bawendi, M. G. Synthesis and Characterization of Nearly Monodisperse CdE(E=S, Se, Te) Semiconductor Nanocrystallites. J. Am. Chem. Soc. 1993, 115, 8706-8715.
23
34. Hanrath, T.; Veldman, D.; Choi, J. J.; Christova, C. G.; Wienk, M. M.; Janssen, R. A. J. PbSe Nanocrystal Network Formation during Pyridine Ligand Displacement. ACS Appl. Mater. Interfaces 2009, 1, 244-250. 35. Binary Alloy Phase Diagrams 2.2. Materials Park, Ohio: The Materials Information Society, 1996;. 36. Gråbaek, L.; Bohr, J.; Johnson, E.; Johansen, A.; Sarholt-Kristensen, L.; Andersen, H. Superheating and Supercooling of Lead Precipitates in Aluminum. Phys. Rev. Lett. 1990, 64, 934-937. 37. Zhong, J.; Zhang, L. H.; Jin, Z. H.; Sui, M. L.; Lu, K. Superheating of Ag Nanoparticles Embedded in Ni Matrix. Acta Mater. 2001, 49, 2897-2904. 38. Meitl, M. A.; Dellinger, T. M.; Braun, P. V. Bismuth-Ceramic Nanocomposites with Unusual Thermal Stability via High-Energy Ball Milling. Adv. Funct. Mater. 2003, 13, 795-799. 39. Poudel, B.; Hao, Q.; Ma, Y.; Lan, Y.; Minnich, A.; Yu, B.; Yan, X.; Wang, D.; Muto, A.; Vashaee, D., et al. High-Thermoelectric Performance of Nanostructured Bismuth Antimony Telluride Bulk Alloys. Science 2008, 320, 634-638. 40. Haro-Poniatowski, E.; Jimenez de Castro, M.; Fernandez Navarro, J. M.; Morhange, J. F.; Ricolleau, C. Melting and Solidification of Bi Nanoparticles in a Germanate Glass. Nanotechnology 2007, 18. 41. Mu, J.; Zhu, Z. W.; Zhang, H. F.; Fu, H. M.; Wang, A. M.; Li, H.; Hu, Z. Q. Size Dependent Melting Behaviors of Nanocrystalline in Particles Embedded in Amorphous Matrix. J. Appl. Phys. 2012, 111, 043515. 42. Sharp, I. D.; Yi, D. O.; Xu, Q.; Liao, C. Y.; Beeman, J. W.; Liliental-Weber, Z.; Yu, K. M.; Zakharov, D. N.; Ager, J. W.; Chrzan, D. C., et al. Mechanism of Stress Relaxation in Ge Nanocrystals Embedded in SiO2. Appl. Phys. Lett. 2005, 86, 063107. 43. Bieligmeyer, M.; Taheri, S. M.; German, I.; Boisson, C.; Probst, C.; Milius, W.; Altstadt, V.; Breu, J.; Schmidt, H. W.; D'Agosto, F., et al. Completely Miscible Polyethylene Nanocomposites. J. Am. Chem. Soc. 2012, 134, 18157-18160. 44. Jeon, K.-J.; Moon, H. R.; Ruminski, A. M.; Jiang, B.; Kisielowski, C.; Bardhan, R.; Urban, J. J. Air-Stable Magnesium Nanocomposites Provide Rapid and High-Capacity Hydrogen Storage without Using Heavy-Metal Catalysts. Nat. Mater. 2011, 10, 286-290. 45. Liu, M.; Wang, R. Y. Phase Change Nanocomposites with Tunable Melting Temperature and Thermal Energy Storage Density. Nanoscale 2013, 5, 7234-7237. 46. Llordes, A.; Garcia, G.; Gazquez, J.; Milliron, D. J. Tunable Near-Infrared and Visible-Light Transmittance in Nanocrystal-in-Glass Composites. Nature 2013, 500, 323-326. 47. Choi, H.; Lee, J. P.; Ko, S. J.; Jung, J. W.; Park, H.; Yoo, S.; Park, O.; Jeong, J. R.; Park, S.; Kim, J. Y. Multipositional Silica-Coated Silver Nanoparticles for High-Performance Polymer Solar Cells. Nano Lett. 2013, 13, 2204-2208. 48. Kovalenko, M. V.; Scheele, M.; Talapin, D. V. Colloidal Nanocrystals with Molecular Metal Chalcogenide Surface Ligands. Science 2009, 324, 1417-1420. 49. Tangirala, R.; Baker, J. L.; Alivisatos, A. P.; Milliron, D. J. Modular Inorganic Nanocomposites by Conversion of Nanocrystal Superlattices. Angew. Chem., Int. Ed. 2010, 49, 2878-2882. 50. Kovalenko, M. V.; Spokoyny, B.; Lee, J.-S.; Scheele, M.; Weber, A.; Perera, S.; Landry, D.; Talapin, D. V. Semiconductor Nanocrystals Functionalized with Antimony Telluride Zintl Ions for Nanostructured Thermoelectrics. J. Am. Chem. Soc. 2010, 132, 6686-6695.
24
51. Galwey, A. K.; Jamieson, D.; Brown, M. E. Thermal Decomposition of Three Crystalline Modifications of Anhydrous Copper(II) Formate. J. Phys. Chem. 1974, 78, 2664-2670. 52. Gupta, A.; Jagannathan, R. Laser Writing of Copper Lines from Metalorganic Films. Appl. Phys. Lett. 1987, 51, 2254-2256. 53. Fields, E. K.; Meyerson, S. Thermal and Photochemical Decomposition of Silver Carboxylates. J. Org. Chem. 1976, 41, 916-920. 54. Logvinenko, V.; Polunina, O.; Mikhailov, Y.; Mikhailov, K.; Bokhonov, B. Study of Thermal Decomposition of Silver Acetate. J. Therm. Anal. Calorim. 2007, 90, 813-816. 55. Bessonov, A. A.; Morozova, N. B.; Semyannikov, P. P.; Trubin, S. V.; Gelfond, N. V.; Igumenov, I. K. Thermal Behaviour of Dimethylgold(III) Carboxylates. J. Therm. Anal. Calorim. 2008, 92, 751-755. 56. Gallagher, P. K.; Gross, M. E. The Thermal Decomposition of Palladium Acetate. J. Therm. Anal. 1986, 31, 1231-1241. 57. Fillman, L. M.; Tang, S. C. Thermal Decomposition of Metal-Carbonyls - a Thermogravimetry Mass-Spectrometry Study. Thermochim. Acta 1984, 75, 71-84. 58. Hong, Y.; Wu, W.; Hu, J.; Zhang, M.; Voevodin, A. A.; Chow, L.; Su, M. Controlling Supercooling of Encapsulated Phase Change Nanoparticles for Enhanced Heat Transfer. Chem. Phys. Lett. 2011, 504, 180-184. 59. Lai, S. L.; Guo, J. Y.; Petrova, V.; Ramanath, G.; Allen, L. H. Size-Dependent Melting Properties of Small Tin Particles: Nanocalorimetric Measurements. Phys. Rev. Lett. 1996, 77, 99-102. 60. Himran, S.; Suwono, A.; Mansoori, G. A. Characterization of Alkanes and Paraffin Waxes for Application as Phase-Change Energy Storage Medium. Energy Sources 1994, 16, 117-128. 61. Hasan, A.; Sayigh, A. A. Some Fatty Acids as Phase-Change Thermal Energy Storage Materials. Renewable Energy 1994, 4, 69-76. 62. Kumar, G. S.; Prasad, G.; Pohl, R. O. Experimental Determinations of the Lorenz Number. J. Mater. Sci. 1993, 28, 4261-4272. 63. Sommerfeld, A. The Theory of Electrons of Metals. Naturwissenschaften 1928, 16, 374-381. 64. Chen, G., Nanoscale energy transport and conversion: A parallel treatment of electrons, molecules, phonons, and photons. New York: Oxford University Press, 2005; pp 249-253. 65. Yang, H.; Bahk, J.-H.; Day, T.; Mohammed, A. M. S.; Min, B.; Snyder, G. J.; Shakouri, A.; Wu, Y. Composition Modulation of Ag2Te Nanowires for Tunable Electrical and Thermal Properties. Nano Lett. 2014, 14, 5398-5404. 66. Zhao, L.-D.; Lo, S.-H.; He, J.; Li, H.; Biswas, K.; Androulakis, J.; Wu, C.-I.; Hogan, T. P.; Chung, D.-Y.; Dravid, V. P., et al. High Performance Thermoelectrics from Earth-Abundant Materials: Enhanced Figure of Merit in PbS by Second Phase Nanostructures. J. Am. Chem. Soc. 2011, 133, 20476-20487. 67. Losego, M. D.; Grady, M. E.; Sottos, N. R.; Cahill, D. G.; Braun, P. V. Effects of Chemical Bonding on Heat Transport across Interfaces. Nat. Mater. 2012, 11, 502-506. 68. Wang, R. Y.; Segalman, R. A.; Majumdar, A. Room Temperature Thermal Conductance of Alkanedithiol Self-Assembled Monolayers. Appl. Phys. Lett. 2006, 89, 173113. 69. Gundrum, B. C.; Cahill, D. G.; Averback, R. S. Thermal Conductance of Metal-Metal Interfaces. Phys. Rev. B 2005, 72, 245426.
25
70. Minnich, A.; Chen, G. Modified Effective Medium Formulation for the Thermal Conductivity of Nanocomposites. Appl. Phys. Lett. 2007, 91, 073105. 71. Ong, W.-L.; Rupich, S. M.; Talapin, D. V.; McGaughey, A. J. H.; Malen, J. A. Surface Chemistry Mediates Thermal Transport in Three-Dimensional Nanocrystal Arrays. Nat. Mater. 2013, 12, 410-415.
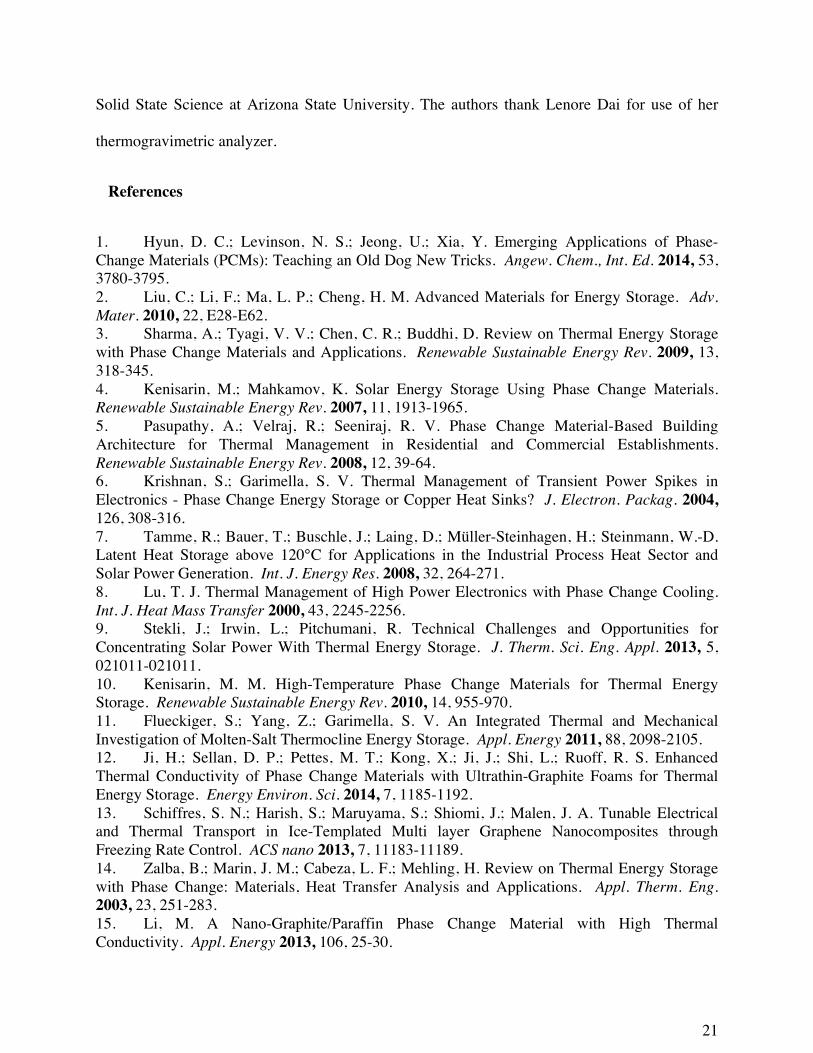
Figure 1. Transmission electron microscopy images of the Bi nanoparticles used to create the Ag
matrix – Bi nanoparticle composites. The nanoparticle diameters are (a) 8.1 ± 1.0 nm, (b) 9.8 ±
0.8 nm, (c) 13.2 ± 0.6 nm and (d) 14.9 ± 0.6 nm. (e) X-ray diffraction pattern of Bi nanoparticles
with 13.6 nm diameter.
26
Figure 2. (a) Thermogravimetric analysis on silver benzoate. The temperature ramp rate was
2°C/min and a 2 hr isotherm was applied at 300°C. (b) X-ray diffraction pattern of silver made
via the thermal decomposition of silver benzoate.
27
Figure 3. (a) TEM image of a Bi-Ag nanocomposite with a low Bi nanoparticle volume fraction.
(b) TEM image of a Bi-Ag nanocomposite with a high Bi nanoparticle volume fraction.
28
Figure 4. (a) A heating and cooling DSC cycle for a composite with Bi nanoparticles (NPs) of
13.2 nm diameter. (b) Melting characteristics of a composite with 13.2 nm Bi nanoparticles
throughout 100 thermal cycles. (c) The endothermic melting valley during DSC measurements
on composites with different Bi nanoparticle diameters. For clarity, the data in part (c) has been
offset along the vertical axis; each tick mark represents 0.2 W/g. (d) Size-dependent melting
temperature (triangles) and enthalpy of fusion (circles) for the Bi nanoparticles. All
nanocomposites in part (a), (b), (c), and (d) have a similar nanoparticle volume fraction of
29
approximately 0.20 – 0.25. We note that the large error bars for melting temperature in (b) and
(d) arise from our use of the endothermic valley's full width half maximum for the measurement
uncertainty. We use the endothermic valley location as the melting temperature, and these
variations were insignificant as seen in part (b).
Figure 5. (a) The endothermic melting valley during DSC measurements on composites with
13.2 nm diameter Bi nanoparticles and varying Bi volume fraction. For clarity, the data in part
30
(a) has been offset along the vertical axis; each tick mark represents 0.5 W/cm3. (b) The effective
volumetric energy density for composites containing 13.2 and 14.9 nm Bi nanoparticles with
varying Bi nanoparticle volume fractions. For comparison, two common organic phase change
materials, P116 paraffin wax and myristic acid, are also shown.
Figure 6. Nanocomposite thermal conductivity measurements using the Wiedemann-Franz (W-
F) law and thermal conductivity calculations using the modified effective medium approximation
(EMA) for varying nanoparticle (NP) diameter and volume fraction.