Embed Size (px)
Citation preview
Metal Leaching and Acid Rock Drainage Characterization West Detour Deposit FINAL
Prepared for
Detour Gold Corporation
Prepared by
SRK Consulting (Canada) Inc. 1CD011.008 August 2016
Metal Leaching and Acid Rock Drainage Characterization West Detour Deposit FINAL
August 2016
Prepared for Prepared by
Detour Gold Corporation Commerce Court West 199 Bay Street, Suite 4100 Toronto, Ontario M5L 1E2
SRK Consulting (Canada) Inc. 2200–1066 West Hastings Street Vancouver, BC V6E 3X2 Canada
Tel: +1 416 304 0800 Web: http://www.detourgold.com
Tel: +1 604 681 4196 Web: www.srk.com
Project No: 1CD011.008 File Name: WestDetour_MLARD_EAReport_Final_1CD011008_20160819_CBK_SJD_FNL
Copyright © SRK Consulting (Canada) Inc., 2016
SRK Consulting West Detour ML/ARD Characterization – FINAL Page ii
LNB/CBK/SJD WestDetour_MLARD_EAReport_Final_1CD011008_20160819_CBK_SJD_FNL August 2016
Executive Summary Detour Gold Corporation (DGC) is proposing to extract gold from the West Detour deposit, which is located approximately 185 km north-east of Cochrane, Ontario and 5 km west of DGCs operating Detour Lake Mine (DLM). SRK was retained by DGC to characterize the metal leaching and acid rock drainage (ML/ARD) potential of the project. This report is a supporting document for the environmental assessment (EA) report being prepared for the project.
The West Detour property is directly adjacent to the western border of Detour Lake Mine (DLM) gold deposit, which is situated in the northwestern portion of the Abitibi Greenstone Belt. The deposit at West Detour (and DLM) has been classified as a greenstone-hosted hydrothermal lode gold deposit. Mineralization in terms of assessing ML/ARD potential includes the variable presence of the sulphides pyrite and pyrrhotite with carbonate (calcite) formation from alteration of host rock.
The mine plan at West Detour includes conventional open pit mining with truck and shovel removal of ore, mid-grade ore, mineralized rock (i.e. rock that contains gold below economic cutoff) and waste rock. There will be one main pit and a smaller satellite pit to the north. Ore will be mixed at a ratio of 1:9, West Detour to DLM ore. West Detour tailings will be deposited mixed in with the DLM tailings in the existing tailings management area. The mine life is estimated to be 10 years.
Characterization design was developed to provide design criteria for the planning, operation, and management of the various facilities containing geological materials at the site to the project engineers. These criteria include segregation criteria to address ARD potential, criteria to define exposure times for reactive materials, and recommendations for construction of facilities (e.g. placement methods). This study has also set the basis for future permitting activities to predict the chemistry of water coming into contact with geological materials as “source terms” for inputs into the water quality modelling for the site.
Characterization methods were based on procedures and guidance by the Canadian Mine Environment Neutral Drainage (MEND) reports (MEND 1991 and MEND 2009), Guidelines and Recommended Methods for the Prediction of Metal Leaching and Acid Rock Drainage at Minesites in British Columbia (Price 1997 and Price 2009), and The Guide for Acid Rock Drainage (GARD) produced by the International Network for Acid Prevention (INAP 2009).
Industry best practices acid base accounting, kinetic testing, and mineralogical characterization was performed on drill core to provide inputs to ML/ARD characterization. A relationship to parameters in the exploration database that could predict the acid base accounting for samples was also established. This allowed for block modeling of ARD potential and expanded the number of samples from hundreds to tens of thousands, providing a degree of characterization understanding that far exceeded what is possible with drill core characterization alone.
Characterization results indicated that a portion of the waste rock and pit walls in West Detour have ARD potential. Testing on drill core only indicated that approximately 47% of the rock is potentially acid rock generating (ARD) generating or PAG, whereas 53% of the rock is non-ARD
SRK Consulting West Detour ML/ARD Characterization – FINAL Page iii
LNB/CBK/SJD WestDetour_MLARD_EAReport_Final_1CD011008_20160819_CBK_SJD_FNL August 2016
generating or NAG. However, block modeling results indicated there could be much less PAG material with only 29% and 71% NAG. Metal leaching under neutral leaching conditions is expected to be low based on screening to typical basalt rocks, kinetic testing, and similarity to DLM rocks, which has also shown low ML. Timing to onset of ARD is expected to take decades to hundreds of years and the segregation approach being used at the DLM is expected to be applicable to West Detour and provide the site with management options of PAG material.
The open pit is expected to be backfilled with either PAG waste rock or tailings and the water level will reach top of exposed bedrock within 30 years. As a result, sulphide oxidation will effectively be inhibited and ARD will not be able to develop in the pit walls.
Tailings mixed with the DLM tailings were shown to have low ML/ARD potential. Water submerged tailings will inhibit sulphide oxidation and ML.
Overburden was shown to have low ML/ARD potential, with neutralization potential typically several times greater than acid potential. A small portion of peat was present in the overburden, with some of those samples already being acidic, which is typical of this organic material in many wetland settings. Peat is a small proportion of the overburden and intermixing is expected to maintain pH neutral conditions.
Overall the geological materials expected to be disturbed or processed during operations have low ML/ARD potential and the performance of the DLM is an appropriate analogue to understand how West Detour could impact water quality. The basis for understanding geochemical reactivity has been established and further work to support ML/ARD characterization can proceed to generate geochemical source terms for the project.
SRK Consulting West Detour ML/ARD Characterization – FINAL Page iv
LNB/CBK/SJD WestDetour_MLARD_EAReport_Final_1CD011008_20160819_CBK_SJD_FNL August 2016
Table of Contents 1 Introduction ......................................................................................................................................... 1
1.1 Overview ....................................................................................................................................... 1
1.2 Report Structure ............................................................................................................................ 1
1.3 Acknowledgments ......................................................................................................................... 2 2 Background ......................................................................................................................................... 3
2.1 Geological Setting ......................................................................................................................... 3
2.2 Overburden Characteristics .......................................................................................................... 5
2.3 Geochemical Setting ..................................................................................................................... 6
2.3.1 Previous ML/ARD Characterization .................................................................................... 6
2.3.2 Research Programs ............................................................................................................ 6
2.4 West Detour Mine Plan ................................................................................................................. 6 3 Characterization Design ..................................................................................................................... 9
3.1 Basis ............................................................................................................................................. 9
3.2 Conceptual Geochemical Models ................................................................................................. 9
3.2.1 Overall ............................................................................................................................... 9
3.2.2 NAG Waste Rock .............................................................................................................. 10
3.2.3 PAG Waste Rock .............................................................................................................. 10 3.2.4 Open Pit ............................................................................................................................ 11
3.2.5 Tailings Facility .................................................................................................................. 11
3.2.6 Overburden ....................................................................................................................... 12
3.2.7 Nitrogen Model .................................................................................................................. 12 4 Characterization Methods ................................................................................................................ 13
4.1 Basis ........................................................................................................................................... 13
4.2 Sample Acquisition Methods ...................................................................................................... 13
4.2.1 Waste Rock and Ore ......................................................................................................... 13
4.2.2 Pit Walls ............................................................................................................................ 16
4.2.3 Tailings and Process Water .............................................................................................. 16
4.2.4 Overburden ....................................................................................................................... 18 4.3 Analytical Methods ...................................................................................................................... 19
4.3.1 Sample Preparation .......................................................................................................... 19
4.3.2 Physical Analyses ............................................................................................................. 19
4.3.3 Static Geochemical Tests ................................................................................................. 20
4.3.4 Mineralogical Analyses ..................................................................................................... 20
4.3.5 Humidity Cells ................................................................................................................... 20 4.3.6 Solution Analyses .............................................................................................................. 23
SRK Consulting West Detour ML/ARD Characterization – FINAL Page v
LNB/CBK/SJD WestDetour_MLARD_EAReport_Final_1CD011008_20160819_CBK_SJD_FNL August 2016
4.3.7 Quality Control .................................................................................................................. 23
4.4 Data Interpretation Methods ....................................................................................................... 24
4.4.1 ARD Potential .................................................................................................................... 24 4.4.2 ARD Proxies ...................................................................................................................... 24
4.4.3 Block Modelling ................................................................................................................. 25
4.4.4 Metal Leaching Potential ................................................................................................... 25 5 Results................................................................................................................................................ 26
5.1 Quality Control for Analytical Data .............................................................................................. 26
5.2 Waste Rock and Ore................................................................................................................... 26 5.2.1 Sulphur Occurrence .......................................................................................................... 29
5.2.2 Neutralization Potential Occurrence ................................................................................. 31
5.2.3 ARD Potential .................................................................................................................... 34
5.2.4 ARD Block Modeling ......................................................................................................... 38
5.2.5 Element Leaching Potential .............................................................................................. 40
5.2.6 Humidity Cells ................................................................................................................... 40 5.3 Pit Walls ...................................................................................................................................... 48
5.3.1 ARD Potential by Block Modeling ..................................................................................... 48
5.3.2 Element Leaching Potential .............................................................................................. 49
5.4 Tailings ........................................................................................................................................ 51
5.4.1 Mineralogy ......................................................................................................................... 51
5.4.2 Particle Size ...................................................................................................................... 52 5.4.3 Sulphur Occurrence and Acid Potential ............................................................................ 52
5.4.4 Neutralization Potential Occurrence ................................................................................. 53
5.4.5 ARD Classification ............................................................................................................ 54
5.4.6 Metal Leaching Potential ................................................................................................... 55
5.4.7 Humidity Cells ................................................................................................................... 55 5.5 Overburden ................................................................................................................................. 59
5.5.1 Sulphur Occurrence .......................................................................................................... 59
5.5.2 Neutralization Potential Occurrence ................................................................................. 61
5.5.3 ARD Potential .................................................................................................................... 62
5.5.4 Element Leaching Potential .............................................................................................. 63 6 Discussion ......................................................................................................................................... 64
6.1 Comparison with the Detour Lake Deposit ................................................................................. 64
6.2 Management Plans ..................................................................................................................... 65
6.2.1 Waste and Mineralized Rock Management Criteria ......................................................... 65
6.2.2 Delay to ARD Onset .......................................................................................................... 66
6.2.3 Metal Leaching .................................................................................................................. 69
SRK Consulting West Detour ML/ARD Characterization – FINAL Page vi
LNB/CBK/SJD WestDetour_MLARD_EAReport_Final_1CD011008_20160819_CBK_SJD_FNL August 2016
6.2.4 Application of Detour Lake Mine Management Plan ......................................................... 70
6.2.5 Pit Wall Management Criteria ........................................................................................... 70
6.2.6 Tailings Management Criteria ........................................................................................... 71 6.2.7 Overburden Management Criteria .................................................................................... 71
7 Conclusions ....................................................................................................................................... 73
8 References ......................................................................................................................................... 75
SRK Consulting West Detour ML/ARD Characterization – FINAL Page vii
LNB/CBK/SJD WestDetour_MLARD_EAReport_Final_1CD011008_20160819_CBK_SJD_FNL August 2016
List of Figures Figure 1-1: Location of Detour Lake Mine and West Detour Project ............................................................ 1
Figure 2-1: West Detour and Detour Lake geology and proposed pit outline ............................................... 3
Figure 2-2: Geology cross section of West Detour ....................................................................................... 4
Figure 2-3: West Detour and Detour Lake Mine life of mine facility configuration ........................................ 8
Figure 4-1: Spatial distribution of drill core for West Detour ML/ARD characterization program ............... 15
Figure 4-2: Spatial distribution of exploration drill holes selected for ML/ARD characterization. ............... 16
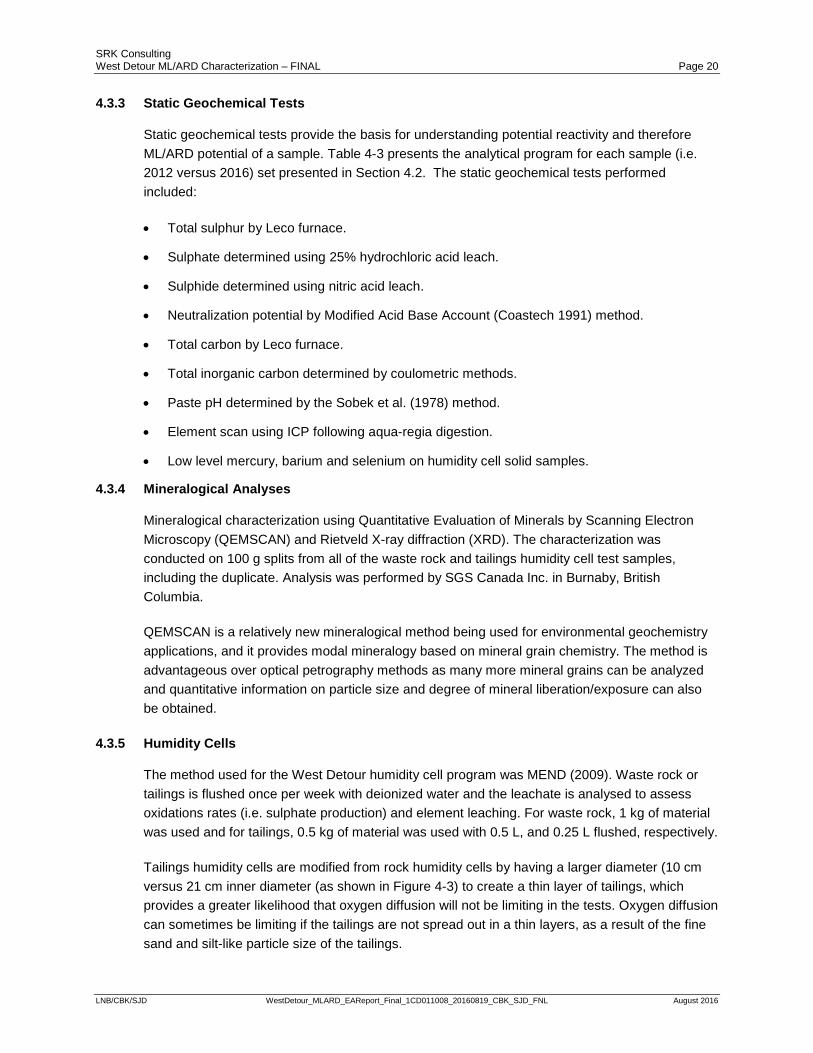
Figure 4-3: West Detour waste rock humidity cell (A) and tailings humidity cell (B) ................................... 21
Figure 5-1: Comparison of sulphur content from the exploration and 2012 ABA sample sets ................... 30
Figure 5-2: Percentile distribution of ICP sulphur by rock type – comparison of ABA and exploration sample sets ................................................................................................................................................. 30
Figure 5-3: Modified NP vs. total inorganic carbon by rock type ................................................................ 31
Figure 5-4 Percentile distribution of NPTIC by rock type. ............................................................................. 32
Figure 5-5: Comparison of calcium and NPTIC for West Detour rock samples ............................................ 32
Figure 5-6: Measured versus predicted TIC from multi-variate regression ................................................ 34
Figure 5-7: ARD potential classification for waste rock and ore samples ................................................... 35
Figure 5-8: Downhole ARD characterization for drillhole TWDDH-363 ...................................................... 37
Figure 5-9: Downhole ARD characterization for drillhole TWDDH-347 ...................................................... 37
Figure 5-10: ARD block model of waste rock in West Detour ..................................................................... 39
Figure 5-11: ARD block model cross-section of West Detour .................................................................... 40
Figure 5-12: Cumulative percent sulphur of rock from the West Detour deposit as compared to humidity cells ................................................................................................................................................. 43
Figure 5-13: Cumulative percent TIC of rock from the West Detour deposit as compared to humidity cells. ................................................................................................................................................. 44
Figure 5-14: ARD potential classification of West Detour humidity cell samples in comparison to the complete dataset (grey x’s) ......................................................................................................................... 44
Figure 5-15: pH in West Detour humidity cells............................................................................................ 47
Figure 5-16: Sulphate loadings in humidity cells ........................................................................................ 47
Figure 5-17: Cobalt loadings in humidity cells ............................................................................................ 47
Figure 5-18: Copper loadings in humidity cells ........................................................................................... 47
Figure 5-19: Nickel loadings in humidity cells ............................................................................................. 47
Figure 5-20: Selenium loadings in humidity cells ........................................................................................ 47
SRK Consulting West Detour ML/ARD Characterization – FINAL Page viii
LNB/CBK/SJD WestDetour_MLARD_EAReport_Final_1CD011008_20160819_CBK_SJD_FNL August 2016
Figure 5-21: Pit wall block model ARD estimation ...................................................................................... 48
Figure 5-22: Cross-section of West Detour pit ARD block model ............................................................... 49
Figure 5-23: Comparison of NPTIC versus NP by titration ........................................................................... 54
Figure 5-24: ARD Potential classification of comingled Detour West tailings ............................................. 55
Figure 5-25: pH in comingled tailings humidity cells ................................................................................... 58
Figure 5-26: Sulphate loadings in comingled tailings humidity cells ........................................................... 58
Figure 5-27: Cyanide loadings in comingled tailings humidity cells ............................................................ 58
Figure 5-28: Copper loadings in comingled tailings humidity cells ............................................................. 58
Figure 5-29: Nickel loadings in comingled tailings humidity cells ............................................................... 58
Figure 5-30: Selenium loadings in comingled tailings humidity cells .......................................................... 58
Figure 5-31: Distribution of sulphur by aqua regia for overburden samples .............................................. 59
Figure 5-32: West Detour overburden sampling program .......................................................................... 60
Figure 5-33: Peat sulphur speciation results ............................................................................................... 61
Figure 5-34: Distribution of NPTIC for overburden samples ........................................................................ 62
Figure 5-35: ARD potential classification for overburden samples ............................................................ 63
Figure 6-1: Comparison of sulphur distribution in waste rock for Detour Lake and West Detour deposits 64
Figure 6-2: Relative rate of acid generation compared to sulphide oxidation rate for comingled tailings samples ................................................................................................................................................. 66
Figure 6-3: Regression analysis of sulphate release and total sulphide for pyrrhotite dominated samples ................................................................................................................................................. 68
List of Tables Table 2-1: West Detour deposit rock types and tonnages of waste rock within the pit ................................ 4
Table 4-1: Summary of ore types and relative proportions in West Detour ................................................ 17
Table 4-2: Co-mingling material types for West Detour and DLM operational tailings ............................... 18
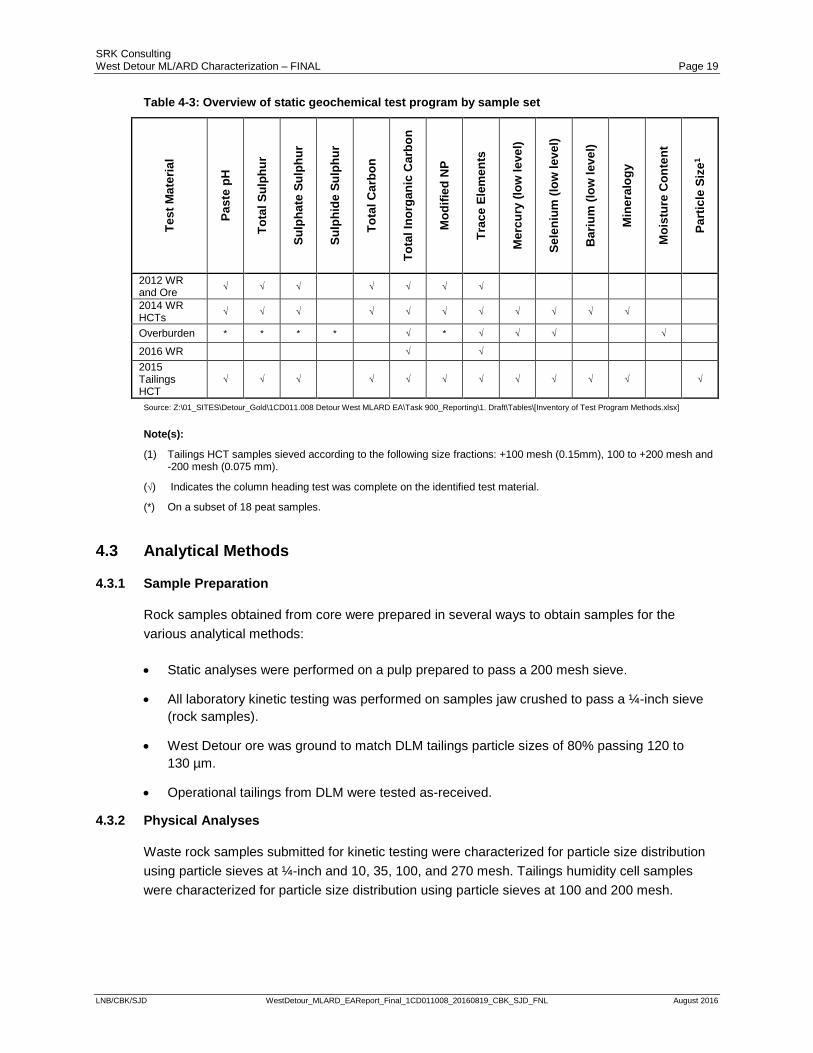
Table 4-3: Overview of static geochemical test program by sample set .................................................... 19
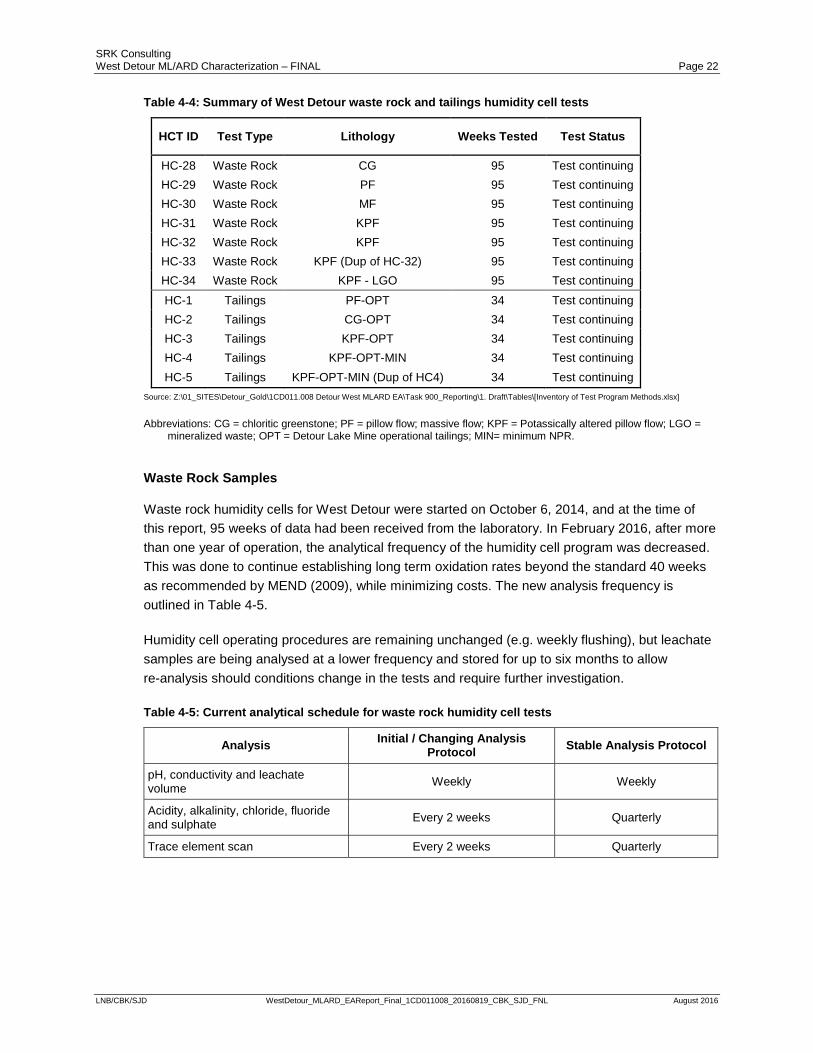
Table 4-4: Summary of West Detour waste rock and tailings humidity cell tests ....................................... 22
Table 4-5: Current analytical schedule for waste rock humidity cell tests .................................................. 22
Table 4-6: List of analyses and detection limits used for testing solutions produced by humidity cell testing ................................................................................................................................................. 23
Table 4-7: Quality control samples for West Detour ................................................................................... 24
SRK Consulting West Detour ML/ARD Characterization – FINAL Page ix
LNB/CBK/SJD WestDetour_MLARD_EAReport_Final_1CD011008_20160819_CBK_SJD_FNL August 2016
Table 5-1: Quality control measures and outcomes ................................................................................... 26
Table 5-2: Summary of West Detour ABA data .......................................................................................... 27
Table 5-3: Summary of West Detour trace element data ........................................................................... 28
Table 5-4: Multivariate correlation coefficient for unweighted and length-weighted regression of Total inorganic carbon .......................................................................................................................................... 33
Table 5-5: ARD potential classification of waste rock and ore samples by rock type................................. 36
Table 5-6: ARD Potential Classification of Waste Rock and Ore Samples by Economic Classification .... 36
Table 5-7: Block model sulphur and NPETIC statistics ................................................................................ 38
Table 5-8: ARD block modeling criteria ...................................................................................................... 38
Table 5-9: Mineral composition of West Detour humidity cell samples ...................................................... 42
Table 5-10: West Detour pit wall statistical summary of drill core element composition data .................... 50
Table 5-11: Mineral composition of comingled Detour West and DLM tailings .......................................... 52
Table 5-12: Acid-base accounting results for tailings from Detour West and DLM used as a basis to design humidity cell mixtures ...................................................................................................................... 53
Table 6-1: Years to ARD onset for humidity cell samples in the laboratory ............................................... 69
Table 6-2: Overburden co-mingling proportion estimate to off-set peat ARD potential .............................. 72
List of Appendices Appendix A – 2012 Waste Rock and Ore Static Sample Set – Static Data
Appendix B – Waste Rock Humidity Cell Tests – QEMSCAN Mineralogy Report
Appendix C – Waste Rock Humidity Cell Tests – Static Data
Appendix D – Waste Rock Humidity Cell Tests – Charts
Appendix E – Tailings Humidity Cell Tests – QEMSCAN Mineralogy Report
Appendix F – Tailings Humidity Cell Tests – Static Data
Appendix G – Tailings Humidity Cell Tests – Average Loadings Rates
Appendix H – Tailings Humidity Cell Tests – Charts
Appendix I – Overburden Samples – Static Data
SRK Consulting West Detour ML/ARD Characterization – FINAL Page 1
LNB/CBK/SJD WestDetour_MLARD_EAReport_Final_1CD011008_20160819_CBK_SJD_FNL August 2016
1 Introduction 1.1 Overview
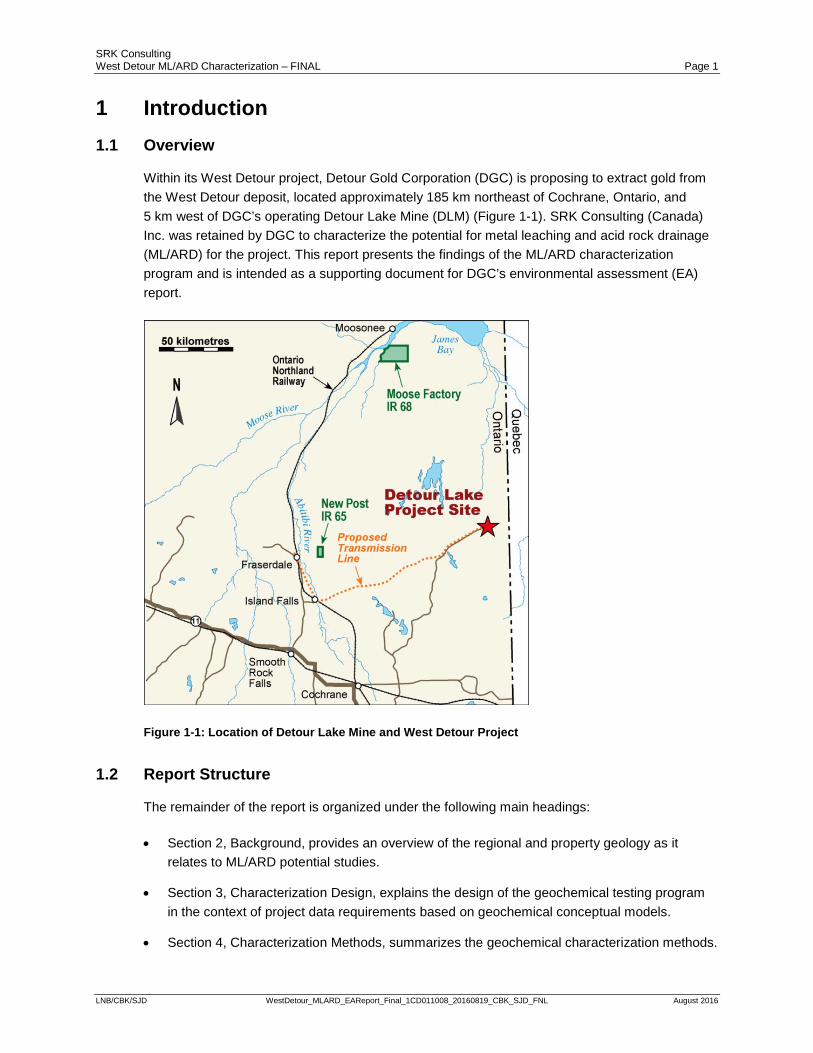
Within its West Detour project, Detour Gold Corporation (DGC) is proposing to extract gold from the West Detour deposit, located approximately 185 km northeast of Cochrane, Ontario, and 5 km west of DGC’s operating Detour Lake Mine (DLM) (Figure 1-1). SRK Consulting (Canada) Inc. was retained by DGC to characterize the potential for metal leaching and acid rock drainage (ML/ARD) for the project. This report presents the findings of the ML/ARD characterization program and is intended as a supporting document for DGC’s environmental assessment (EA) report.
Figure 1-1: Location of Detour Lake Mine and West Detour Project
1.2 Report Structure
The remainder of the report is organized under the following main headings:
• Section 2, Background, provides an overview of the regional and property geology as it relates to ML/ARD potential studies.
• Section 3, Characterization Design, explains the design of the geochemical testing program in the context of project data requirements based on geochemical conceptual models.
• Section 4, Characterization Methods, summarizes the geochemical characterization methods.
SRK Consulting West Detour ML/ARD Characterization – FINAL Page 2
LNB/CBK/SJD WestDetour_MLARD_EAReport_Final_1CD011008_20160819_CBK_SJD_FNL August 2016
• Section 5, Results, describes the results of the geochemical characterization program.
• Section 6, Management Plan, provides an overview of how ML/ARD potential findings have been used to inform the project design and minimize leaching effects.
• Section 7 provides conclusions for the study.
The results from this study will also be used to derive contact water chemistry predictions of geological materials (e.g. waste rock, overburden, pit walls, etc.), also referred to as geochemical “source terms”. Subsequent reporting will provide the methodology and outcomes of geochemical source term predictions that will be used by DGC’s consulting team to predict water quality for the project.
1.3 Acknowledgments
This report was prepared by SRK Consulting (Canada) Inc. with input from the following organizations:
• Detour Gold Corporation (Toronto, Ontario) is the project owner.
• SGS Canada Inc. (Burnaby, British Columbia) provided ML/ARD testing services.
• Golder Associates (Mississauga, Ontario) provided sampling logs and material from overburden sampling.
• BBA (Toronto, Ontario) provided tailings samples and guidance on sample preparation.
SRK Consulting West Detour ML/ARD Characterization – FINAL Page 3
LNB/CBK/SJD WestDetour_MLARD_EAReport_Final_1CD011008_20160819_CBK_SJD_FNL August 2016
2 Background 2.1 Geological Setting
The following geological summary for the property was taken from two different Canadian National Instrument 43-101 technical reports on the West Detour Project (Watts et. al., 2009 and DGC 2016).
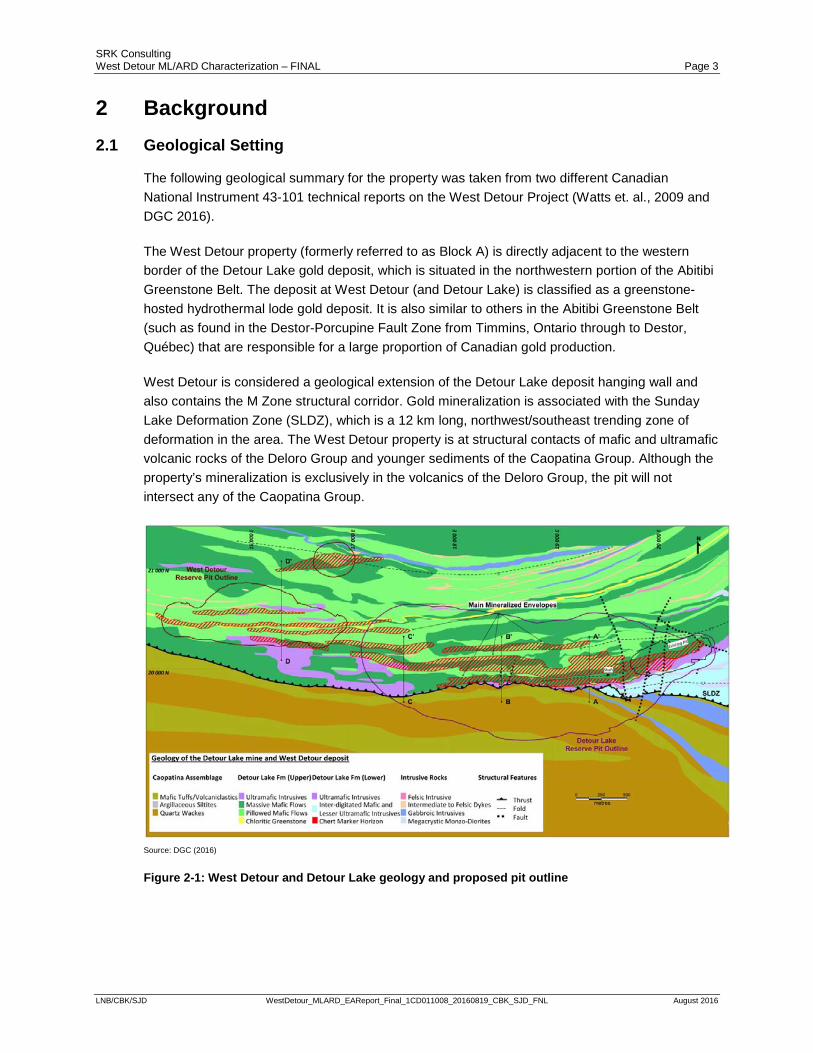
The West Detour property (formerly referred to as Block A) is directly adjacent to the western border of the Detour Lake gold deposit, which is situated in the northwestern portion of the Abitibi Greenstone Belt. The deposit at West Detour (and Detour Lake) is classified as a greenstone-hosted hydrothermal lode gold deposit. It is also similar to others in the Abitibi Greenstone Belt (such as found in the Destor-Porcupine Fault Zone from Timmins, Ontario through to Destor, Québec) that are responsible for a large proportion of Canadian gold production.
West Detour is considered a geological extension of the Detour Lake deposit hanging wall and also contains the M Zone structural corridor. Gold mineralization is associated with the Sunday Lake Deformation Zone (SLDZ), which is a 12 km long, northwest/southeast trending zone of deformation in the area. The West Detour property is at structural contacts of mafic and ultramafic volcanic rocks of the Deloro Group and younger sediments of the Caopatina Group. Although the property’s mineralization is exclusively in the volcanics of the Deloro Group, the pit will not intersect any of the Caopatina Group.
Source: DGC (2016)
Figure 2-1: West Detour and Detour Lake geology and proposed pit outline
SRK Consulting West Detour ML/ARD Characterization – FINAL Page 4
LNB/CBK/SJD WestDetour_MLARD_EAReport_Final_1CD011008_20160819_CBK_SJD_FNL August 2016
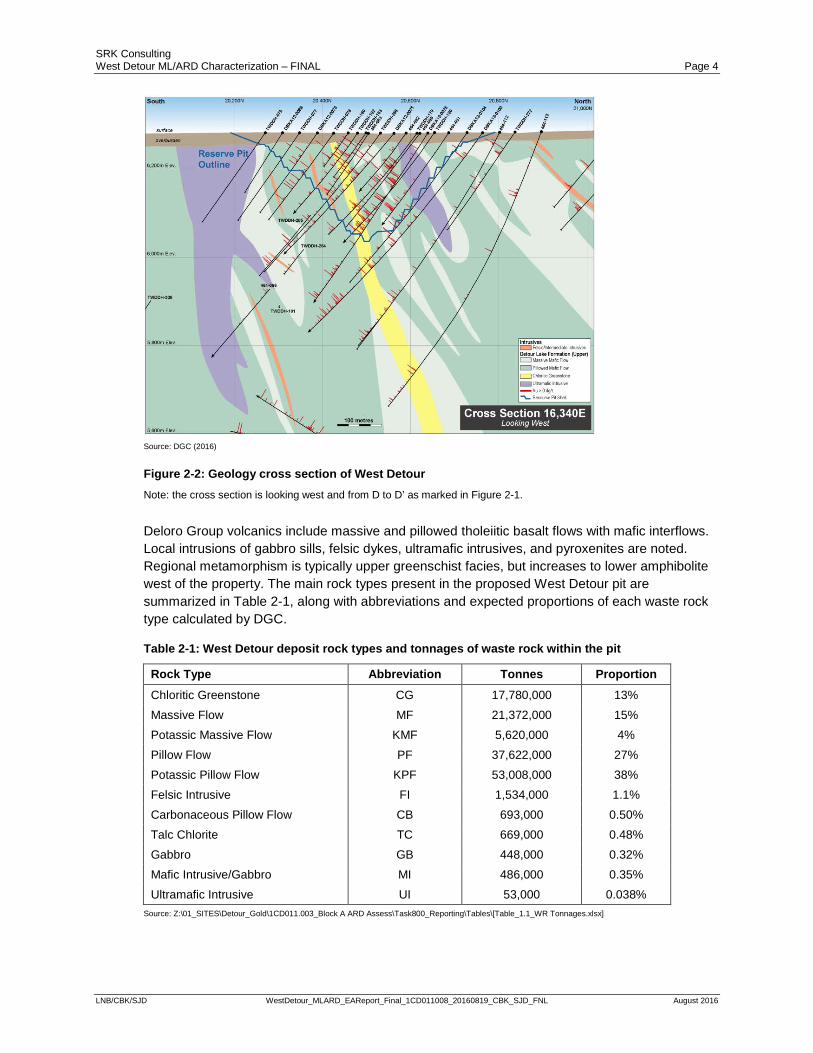
Source: DGC (2016)
Figure 2-2: Geology cross section of West Detour Note: the cross section is looking west and from D to D’ as marked in Figure 2-1.
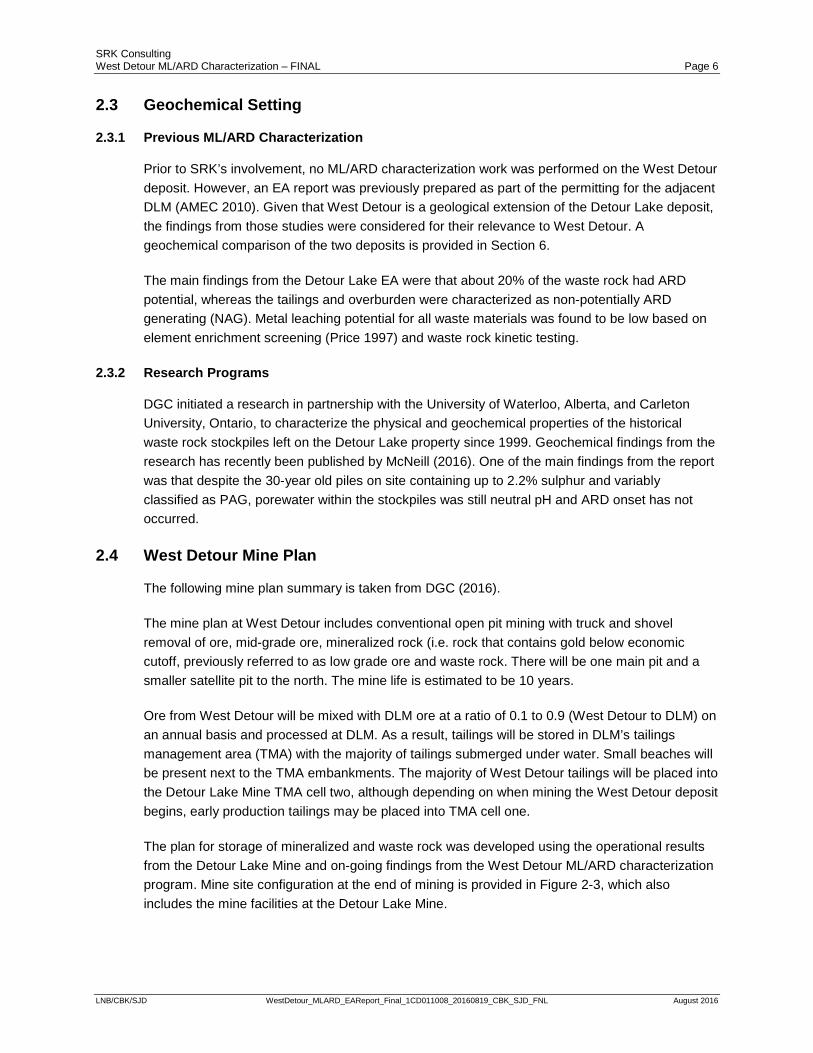
Deloro Group volcanics include massive and pillowed tholeiitic basalt flows with mafic interflows. Local intrusions of gabbro sills, felsic dykes, ultramafic intrusives, and pyroxenites are noted. Regional metamorphism is typically upper greenschist facies, but increases to lower amphibolite west of the property. The main rock types present in the proposed West Detour pit are summarized in Table 2-1, along with abbreviations and expected proportions of each waste rock type calculated by DGC.
Table 2-1: West Detour deposit rock types and tonnages of waste rock within the pit
Rock Type Abbreviation Tonnes Proportion Chloritic Greenstone CG 17,780,000 13% Massive Flow MF 21,372,000 15% Potassic Massive Flow KMF 5,620,000 4% Pillow Flow PF 37,622,000 27% Potassic Pillow Flow KPF 53,008,000 38% Felsic Intrusive FI 1,534,000 1.1% Carbonaceous Pillow Flow CB 693,000 0.50% Talc Chlorite TC 669,000 0.48% Gabbro GB 448,000 0.32% Mafic Intrusive/Gabbro MI 486,000 0.35% Ultramafic Intrusive UI 53,000 0.038%
Source: Z:\01_SITES\Detour_Gold\1CD011.003_Block A ARD Assess\Task800_Reporting\Tables\[Table_1.1_WR Tonnages.xlsx]
SRK Consulting West Detour ML/ARD Characterization – FINAL Page 5
LNB/CBK/SJD WestDetour_MLARD_EAReport_Final_1CD011008_20160819_CBK_SJD_FNL August 2016
The majority of gold mineralization at West Detour is associated with a moderately to strongly sheared magnesium-rich ultramafic komatiitic volcanic unit (i.e. chloritic greenstone), which is similar to mineralization at DLM. The mineralization is within a relatively weak quartz vein stockwork with the sulphides pyrite and pyrrhotite variably present.
Carbonates, primarily calcite according to DGC geological staff, are present in West Detour arising from alteration, most commonly with the pillowed mafic flows and less commonly with the massive mafic flows. The alteration has resulted in patchy carbonates as millimetre sized wisps as pillow selvages, amygdules, quartz-calcite veins and stringers.
Based on the presence of sulphides in the rock types at West Detour along with variable amounts of carbonate, there appears to be a localized potential for ARD. However, the geological description does not indicate if sulphide and calcite mineralization is correlated; therefore, ARD potential may be highly variable.
2.2 Overburden Characteristics
The overburden surficial geology characteristics for West Detour deposit were previously characterized by the Ontario Geological Survey (Gao 2015), as part of assessing the potential of the surficial deposits in the area to contain minerals indicative of economic mineralization. While the work was not focused on ML/ARD potential, several relevant findings from collection of about 23 samples in the immediate vicinity of the DLM are useful for the West Detour EA studies relative to ML/ARD including the following:
• The overburden in the project area is comprised mainly of silty to clayey till and organic deposits containing peat. The till in some areas can get up to 20 m thick. Minor amounts of glaciolacustrine and alluvial surficial deposits will also be disturbed during project development.
• The presence of organic deposits in the West Detour area appears to be the main difference between West Detour and the previously characterized DLM.
• The till likely contains a high neutralization potential (NP). This is based on the matrix strongly reacting to 10% hydrochloric acid and also containing a high proportion of limestone clasts.
• Acid generating sulphides are relatively low in abundance in the till, which is based on aqua regia digestion with an inductively coupled plasma mass spectrometry or ICP-MS finish of 86 samples with an average sulphur content of less than 0.01% and only one sample containing 0.2% sulphur.
A map of the overburden surficial geology with an outline of the DLM facilities and West Detour pit is provided in Figure 5-32.
SRK Consulting West Detour ML/ARD Characterization – FINAL Page 6
LNB/CBK/SJD WestDetour_MLARD_EAReport_Final_1CD011008_20160819_CBK_SJD_FNL August 2016
2.3 Geochemical Setting
2.3.1 Previous ML/ARD Characterization
Prior to SRK’s involvement, no ML/ARD characterization work was performed on the West Detour deposit. However, an EA report was previously prepared as part of the permitting for the adjacent DLM (AMEC 2010). Given that West Detour is a geological extension of the Detour Lake deposit, the findings from those studies were considered for their relevance to West Detour. A geochemical comparison of the two deposits is provided in Section 6.
The main findings from the Detour Lake EA were that about 20% of the waste rock had ARD potential, whereas the tailings and overburden were characterized as non-potentially ARD generating (NAG). Metal leaching potential for all waste materials was found to be low based on element enrichment screening (Price 1997) and waste rock kinetic testing.
2.3.2 Research Programs
DGC initiated a research in partnership with the University of Waterloo, Alberta, and Carleton University, Ontario, to characterize the physical and geochemical properties of the historical waste rock stockpiles left on the Detour Lake property since 1999. Geochemical findings from the research has recently been published by McNeill (2016). One of the main findings from the report was that despite the 30-year old piles on site containing up to 2.2% sulphur and variably classified as PAG, porewater within the stockpiles was still neutral pH and ARD onset has not occurred.
2.4 West Detour Mine Plan
The following mine plan summary is taken from DGC (2016).
The mine plan at West Detour includes conventional open pit mining with truck and shovel removal of ore, mid-grade ore, mineralized rock (i.e. rock that contains gold below economic cutoff, previously referred to as low grade ore and waste rock. There will be one main pit and a smaller satellite pit to the north. The mine life is estimated to be 10 years.
Ore from West Detour will be mixed with DLM ore at a ratio of 0.1 to 0.9 (West Detour to DLM) on an annual basis and processed at DLM. As a result, tailings will be stored in DLM’s tailings management area (TMA) with the majority of tailings submerged under water. Small beaches will be present next to the TMA embankments. The majority of West Detour tailings will be placed into the Detour Lake Mine TMA cell two, although depending on when mining the West Detour deposit begins, early production tailings may be placed into TMA cell one.
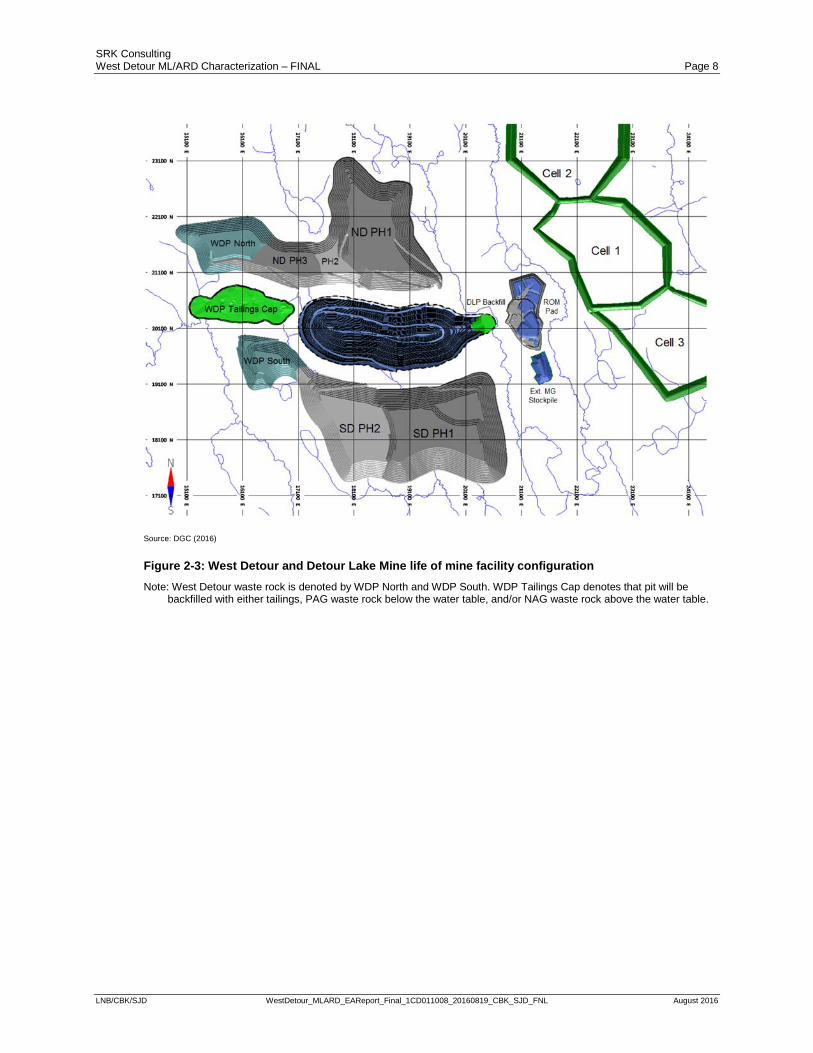
The plan for storage of mineralized and waste rock was developed using the operational results from the Detour Lake Mine and on-going findings from the West Detour ML/ARD characterization program. Mine site configuration at the end of mining is provided in Figure 2-3, which also includes the mine facilities at the Detour Lake Mine.
SRK Consulting West Detour ML/ARD Characterization – FINAL Page 7
LNB/CBK/SJD WestDetour_MLARD_EAReport_Final_1CD011008_20160819_CBK_SJD_FNL August 2016
The following elements in the context of management of ML/ARD potential are incorporated into the West Detour mine plan:
• An open pit that will backfilled with tailings or PAG waste rock, capped with NAG waste rock to the level of the original topography and then flooded once backfilled. Flooding when mining ceases will effectively inhibit ML/ARD potential of pit walls at closure as bedrock will be completely submerged.
• Construction of the tailings embankments and other site fills using NAG rock from the Detour Lake Mine.
• Segregation of PAG and NAG waste rock during operations.
• Two waste rock piles with one to the north and one to the south. The north stockpile will contain PAG material so that drainage will flow toward the pit and allow for management if needed.
• All ore (rock containing greater than 0.5 g/t) and mineralized waste (rock containing between 0.5 and 0.3 g/t gold) to be segregated for ARD potential. Mineralized waste will be stored in one location in the event the material becomes economic to process at the end of mine life.
• Conventional beach deposition of West Detour tailings blended with Detour Lake Mine tailings.
• Production of gold doré on-site through whole ore cyanidation (i.e. no sulphide flotation or ore oxidation required).
SRK Consulting West Detour ML/ARD Characterization – FINAL Page 8
LNB/CBK/SJD WestDetour_MLARD_EAReport_Final_1CD011008_20160819_CBK_SJD_FNL August 2016
Source: DGC (2016)
Figure 2-3: West Detour and Detour Lake Mine life of mine facility configuration Note: West Detour waste rock is denoted by WDP North and WDP South. WDP Tailings Cap denotes that pit will be
backfilled with either tailings, PAG waste rock below the water table, and/or NAG waste rock above the water table.
SRK Consulting West Detour ML/ARD Characterization – FINAL Page 9
LNB/CBK/SJD WestDetour_MLARD_EAReport_Final_1CD011008_20160819_CBK_SJD_FNL August 2016
3 Characterization Design 3.1 Basis
The two objectives of the geochemical testing program were to:
• Provide design criteria for the planning, operation, and management of the various facilities containing geological materials at the site to the project engineers. These criteria include segregation criteria to address ARD potential, criteria to define exposure times for reactive materials, and recommendations for construction of facilities such as placement methods.
• Provide the basis to predict the chemistry of water coming into contact with geological materials as “source terms” for inputs into the water quality modelling for the site.
The underlying basis for the design of the program is the development of conceptual geochemical models (CGMs), which capture the expected geochemical performance of each project component for which a source term is required. CGMs frame the geochemical questions that need to be answered for each component and therefore focus on the characterization program by selecting the appropriate methodologies for sample collection, testing, and data interpretation. The following sections describe the CGMs.
3.2 Conceptual Geochemical Models
3.2.1 Overall
Review of the geological setting (Section 2.1) indicates the following general observations on geochemical performance of wastes and facilities at the site:
• Both pyrite and pyrrhotite occur throughout the host rocks implying that at least potential acid generation with associated sulphate, metal, and other trace element leaching is a consideration for the project.
• The absence of abundant sulphides of copper, lead, zinc, arsenic, and antimony indicates that neutral pH leaching of these elements may not be important.
• The deposit does not have a gossan and no naturally acidic seeps have been encountered in the area.
• Carbonate alternation is noted throughout the host rocks indicating that delay or prevention of ARD is expected. Significant (decades) delay in onset of ARD may be anticipated.
• Carbonate mineralogy includes primarily calcite, which makes the interpretation of standard acid base accounting (ABA) procedures straightforward (as opposed to the presence of iron carbonates).
The following sections indicate the CGMs for specific site facilities and material types.
SRK Consulting West Detour ML/ARD Characterization – FINAL Page 10
LNB/CBK/SJD WestDetour_MLARD_EAReport_Final_1CD011008_20160819_CBK_SJD_FNL August 2016
3.2.2 NAG Waste Rock
NAG waste rock will be placed in dedicated waste rock storage areas and may also be used for construction material on-site. It will originate by mining in the open pit. The following components of the CGM have been identified:
• Weathering will occur under well-oxygenated conditions with movement of oxygen into the facilities driven by diffusive, convective, and advective processes.
• Sulphide minerals will weather to leach acidity, sulphate, and elements contained in the sulphides that will include iron, heavy metals (including iron and copper), and other heavy elements. The latter will include elements contained within the structure of pyrite.
• Dissolved bicarbonate and carbonate minerals will neutralize acidity adding calcium and magnesium to solution.
• Non-acidic conditions are expected to be dominant throughout the facilities except in the immediate micro-environments adjacent to oxidizing sulphide grains and in larger scale environments where unsegregated PAG materials are present. Excess of NP results in NAG.
• Solubility of leached components is constrained by the formation of specific secondary minerals (eg. gypsum for sulphate, iron oxyhydroxides for iron, and copper oxides for copper) and sorptive processes (e.g. adsorption of arsenic to iron oxyhydroxides). Under neutral to basic conditions, oxyanions (e.g. selenium and arsenic) are expected to be more mobile than cations.
3.2.3 PAG Waste Rock
PAG waste rock is expected to behave the same as NAG waste rock prior to onset of acidic conditions. This could be for several decades as West Detour owing to the presence of carbonate throughout the deposit. University research monitoring of historical waste rock stockpiles on-site are showing that despite sulphide oxidation occurring, ARD has not been produced from the 30 year-old stockpiles to date (McNeill 2016).
If the PAG rock becomes acidic, the solubility of heavy metals (e.g. copper, lead, iron, etc) will become several orders of magnitude more soluble as the pH decreases. Metalloids forming oxyanions in solution (e.g. selenium and molybdenum) will become less soluble because they are expected to sorb more readily at lower pH.
Due to the relatively low sulphide content at West Detour (as compared to typical massive sulphide deposits), the expected low residual sulphide content following depletion of carbonate minerals. In addition, with the presence of reactive ferromagnesian silicates, drainage pH may be buffered well above that of “conventional” acid rock drainage for which pHs are typically below 4.
SRK Consulting West Detour ML/ARD Characterization – FINAL Page 11
LNB/CBK/SJD WestDetour_MLARD_EAReport_Final_1CD011008_20160819_CBK_SJD_FNL August 2016
3.2.4 Open Pit
Operational
Water chemistry of the operational pit sump will be a combination of inflows from groundwater, direct precipitation, and contact water flow over broken rock on benches and pit walls. NAG and PAG walls are expected to be non-acidic during operations with the greatest loadings coming from shattered bedrock on benches and less load from walls. Broken rock will weather and leach with the same processes as indicated for NAG waste rock (Section 3.2.2).
Closure
During closure, flooding of the pit will occur resulting in submergence of walls and backfilled materials (PAG waste rock or tailings). As the water level rises, oxidation of flooding walls and backfilled materials will effectively stop (INAP 2010). The pit is expected to be completely backfilled up to top of competent bedrock with tailings and or PAG rock and then either filled with NAG or flooded to the original ground surface.
The filling of the pit lake is expected to take less than 30 years (estimated provided by DGC) from the start of operations, which is less time than the historic stockpiles at the DLM have been oxidizing for and not produced ARD. It is likely that the West Detour pit will be submerged before any of the PAG material left in the pit walls could produce ARD. However, any oxidation products will be flushed and contribute a one-time load to the pit lake. The water level will completely submerge bedrock with the remaining ‘high wall’ in overburden only a few metres high (Golder 2016).
3.2.5 Tailings Facility
Tailings from West Detour will be comingled with DLM tailings (Section 2.3.2) at a ratio of 1 to 9 (West Detour to DLM, respectively) and disposed of by conventional spigoting to the tailings beaches. Some of the tailings will remain as an unsaturated wedge against the embankment, while a large part of the tailings will become saturated as the phreatic surface in the facility rises. At closure, the phreatic surface will lower due to reduction in the water discharging to the facility.
Oxidation rates in well- and fully-saturated tailings near and below the phreatic surface will be negligible compared to atmospheric conditions. Oxidation of partially saturated tailings will take place as oxygen penetrates the tailings mass due to diffusion. The rate of diffusion of oxygen will be controlled by the physical characteristics of the tailings, the degree of saturation and the rate of oxidation of sulphide minerals. Oxidation is expected to be most intense at the surface, and oxidation processes will be broadly similar to weathering of waste rock (e.g. oxidation of sulphides in response to the presence of oxygen, neutralization of acidity by reaction with acid consuming minerals, and leaching of soluble minerals and weathering products). Reductive dissolution is not expected to be a significant process in the tailings as oxidation products are unlikely to develop in ore. However, if stockpiled ore is processed at the end of mine life and been exposed to atmospheric conditions for several years, this process has the potential to contribute to element leaching to tailings pore water.
SRK Consulting West Detour ML/ARD Characterization – FINAL Page 12
LNB/CBK/SJD WestDetour_MLARD_EAReport_Final_1CD011008_20160819_CBK_SJD_FNL August 2016
The tailings embankments will be constructed from NAG rock from the DLM and not part of this characterization program as they are already permitted. However, they are expected to behave as NAG rock (Section 3.2.2)
Chemical loadings introduced by processing will be derived from leaching of explosives residuals (i.e. nitrate and ammonia), process chemicals (i.e. cyanide), leaching of secondary minerals formed in ore prior to processing, and oxidation of sulphides occurring during processing. Oxidation of pyrrhotite during processing may result in formation of unstable thiosalts. The proportions of West Detour and DLM ores are not expected to affect these loadings as no modifications to the process flowsheet are planned and the ores are geologically similar.
If mineralized waste is processed at the end of mine life or there is a delay in processing mid-grade ore, a greater chemical load for some parameters in the process water is expected as compared to what would leach from freshly mined ore. These chemical loads will be dependent on the how long the mid-grade or mineralized rock is stockpiled.
Cyanide will undergo destruction by the INCO-SO2 process (DGC 2016). Ammonia is one of the degradation products that will also naturally degrade in the tailings pond to nitrite and ultimately nitrate.
Portions of tailings that are either water saturated or suboxic will likely provide opportunities to sequester some elements (e.g. selenium) and denitrify nitrate to nitrogen gas. This is because selenium and nitrate can be chemically reduced under suboxic conditions (MEND 2015) and lead to lower pore water concentrations leaving the TMA.
3.2.6 Overburden
Contact water characteristics are expected to be controlled mainly by secondary minerals formed by weathering over geological time under neutral pH. The biggest risk is the potential for sulphides to have formed in organic deposits which lack carbonates (i.e. peat).
3.2.7 Nitrogen Model
Emulsion based explosives will be used for blasting in the pit. However, as emulsion is still based on ammonium nitrate fuel oil chemistry, which is typically 94% ammonium nitrate (NH4NO3) and 6% number 2 fuel oil). Incomplete combustion will result in explosives residuals that contribute to nitrogen forms (nitrate, nitrite, and ammonia) in waters contacting blasted rock and pit walls.
SRK Consulting West Detour ML/ARD Characterization – FINAL Page 13
LNB/CBK/SJD WestDetour_MLARD_EAReport_Final_1CD011008_20160819_CBK_SJD_FNL August 2016
4 Characterization Methods 4.1 Basis
Sample acquisition, testing approaches, and data interpretation for ML/ARD characterization of mine waste expected to be produced from the project was guided by SRK’s experience at other mine sites and also internationally-recognized best practices documents. The guidance and procedures used were documented in several reports including:
• Canadian Mine Environment Neutral Drainage (MEND) reports (MEND 1991 and MEND 2009).
• Guidelines and Recommended Methods for the Prediction of Metal Leaching and Acid Rock Drainage at Minesites in British Columbia (Price 1997 and Price 2009).
• The Guide for Acid Rock Drainage (GARD) produced by the International Network for Acid Prevention (INAP 2010).
4.2 Sample Acquisition Methods
Samples used for the West Detour ML/ARD characterization program were obtained from exploration drill core as part of mineral resource estimates for the deposit. The majority of core was analysed in 2012, but DGC (2016) submitted additional core to refine gold grade estimates, for which splits were prepared specifically for ML/ARD studies. Details of how each sample set was obtained are provided in the following sections.
4.2.1 Waste Rock and Ore
2012 Sample Set
Exploration drilling assay pulps from the previous owner of the West Detour deposit (Trade Winds Ventures Inc.) were used. A total of 494 ABA samples, inclusive of 21 duplicate pairs, were selected in the manner outlined below.
• Sample selections were limited to assay pulps that were in storage and inventoried, resulting in 46 drill holes and almost 15,000 assay pulps available for selection. For each assay sample, the lithologies were assigned from the geological database.
• Pulps deeper than 20 m from the pit bottom were excluded. The pit shell was generated on the basis of a gold grade cut-off of 0.5 g/t.
• To focus the sample selection on waste rock, each pulp sample was assigned an economic classification: ore, waste, and mineralized waste (previously low-grade ore). Ore was defined as having a gold grade of at least 0.5 g/t, waste as <0.3 g/t, and mineralized waste between 0.3 and 0.5 g/t.
Two drill holes (TWDDH-347 and TWDDH-363) were selected for continuous downhole ABA sampling. Drill hole selection was on the basis that the majority of rock types within the pit being represented in the drill holes, with the exception being gabbro and fault/breccia. ABA samples
SRK Consulting West Detour ML/ARD Characterization – FINAL Page 14
LNB/CBK/SJD WestDetour_MLARD_EAReport_Final_1CD011008_20160819_CBK_SJD_FNL August 2016
were selected so that each sample was composed of a unique rock type and economic classification. Samples from the other drill holes were selected in a randomized manner using Excel®.
All prospective ABA samples were identified, with each sample having five contiguous assay pulps with a unique lithology and economic classification. As assay pulps were typically 1 m in length, the objective was to obtain 5 m long ABA samples. There were no mineralized waste samples that fulfilled these criteria and instead these samples were randomly selected on the basis of three contiguous samples rather than five.
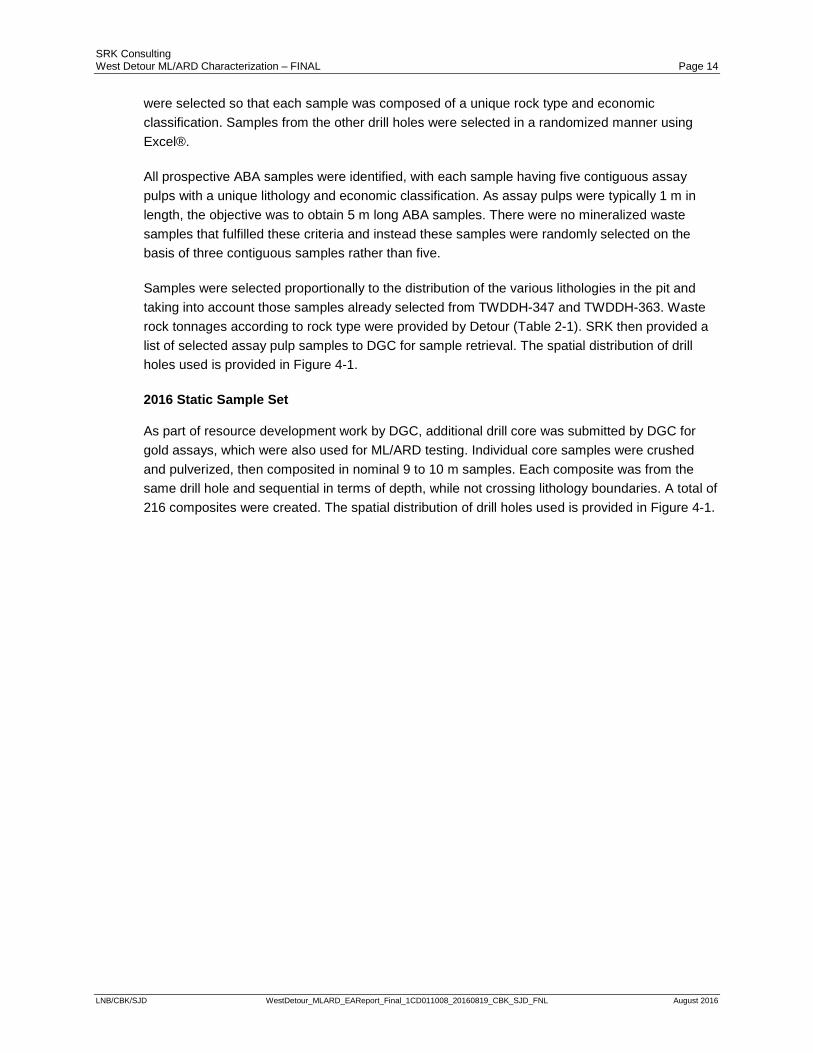
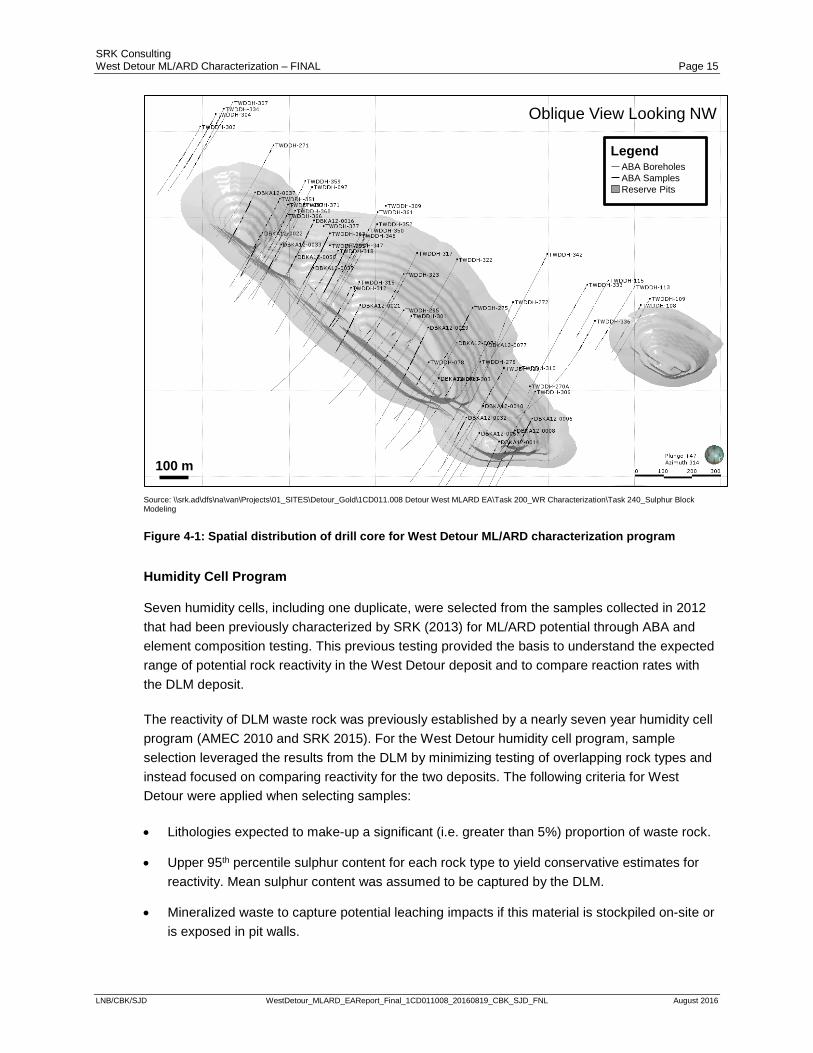
Samples were selected proportionally to the distribution of the various lithologies in the pit and taking into account those samples already selected from TWDDH-347 and TWDDH-363. Waste rock tonnages according to rock type were provided by Detour (Table 2-1). SRK then provided a list of selected assay pulp samples to DGC for sample retrieval. The spatial distribution of drill holes used is provided in Figure 4-1.
2016 Static Sample Set
As part of resource development work by DGC, additional drill core was submitted by DGC for gold assays, which were also used for ML/ARD testing. Individual core samples were crushed and pulverized, then composited in nominal 9 to 10 m samples. Each composite was from the same drill hole and sequential in terms of depth, while not crossing lithology boundaries. A total of 216 composites were created. The spatial distribution of drill holes used is provided in Figure 4-1.
SRK Consulting West Detour ML/ARD Characterization – FINAL Page 15
LNB/CBK/SJD WestDetour_MLARD_EAReport_Final_1CD011008_20160819_CBK_SJD_FNL August 2016
Source: \\srk.ad\dfs\na\van\Projects\01_SITES\Detour_Gold\1CD011.008 Detour West MLARD EA\Task 200_WR Characterization\Task 240_Sulphur Block Modeling
Figure 4-1: Spatial distribution of drill core for West Detour ML/ARD characterization program
Humidity Cell Program
Seven humidity cells, including one duplicate, were selected from the samples collected in 2012 that had been previously characterized by SRK (2013) for ML/ARD potential through ABA and element composition testing. This previous testing provided the basis to understand the expected range of potential rock reactivity in the West Detour deposit and to compare reaction rates with the DLM deposit.
The reactivity of DLM waste rock was previously established by a nearly seven year humidity cell program (AMEC 2010 and SRK 2015). For the West Detour humidity cell program, sample selection leveraged the results from the DLM by minimizing testing of overlapping rock types and instead focused on comparing reactivity for the two deposits. The following criteria for West Detour were applied when selecting samples:
• Lithologies expected to make-up a significant (i.e. greater than 5%) proportion of waste rock.
• Upper 95th percentile sulphur content for each rock type to yield conservative estimates for reactivity. Mean sulphur content was assumed to be captured by the DLM.
• Mineralized waste to capture potential leaching impacts if this material is stockpiled on-site or is exposed in pit walls.
ABA Boreholes ABA SamplesReserve Pits
Legend
Oblique View Looking NW
100 m
SRK Consulting West Detour ML/ARD Characterization – FINAL Page 16
LNB/CBK/SJD WestDetour_MLARD_EAReport_Final_1CD011008_20160819_CBK_SJD_FNL August 2016
Rock types not tested included potassic massive flow, gabbro, mafic intrusive/gabbro, and felsic intrusive as these were all estimated by DGC to be at or less than 5% of the waste proportion (DGC 2016) and the basis for reactivity is fairly well established from the original DLM program (SRK 2015).
4.2.2 Pit Walls
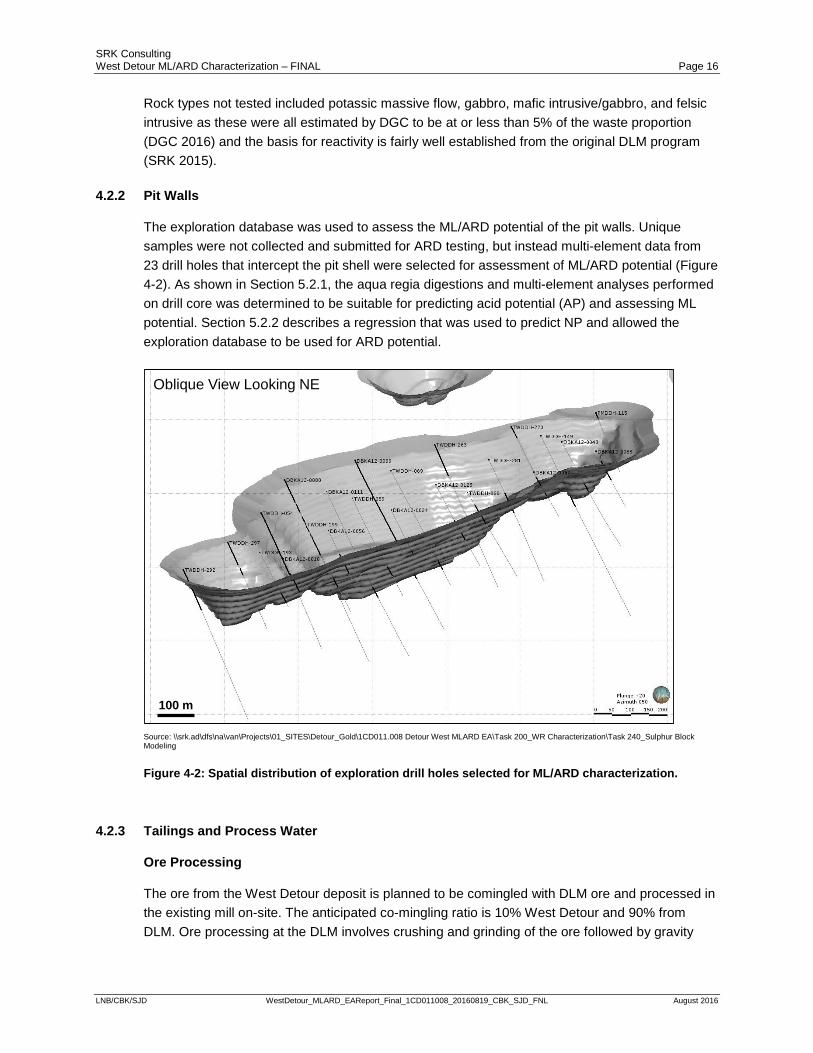
The exploration database was used to assess the ML/ARD potential of the pit walls. Unique samples were not collected and submitted for ARD testing, but instead multi-element data from 23 drill holes that intercept the pit shell were selected for assessment of ML/ARD potential (Figure 4-2). As shown in Section 5.2.1, the aqua regia digestions and multi-element analyses performed on drill core was determined to be suitable for predicting acid potential (AP) and assessing ML potential. Section 5.2.2 describes a regression that was used to predict NP and allowed the exploration database to be used for ARD potential.
Source: \\srk.ad\dfs\na\van\Projects\01_SITES\Detour_Gold\1CD011.008 Detour West MLARD EA\Task 200_WR Characterization\Task 240_Sulphur Block Modeling
Figure 4-2: Spatial distribution of exploration drill holes selected for ML/ARD characterization.
4.2.3 Tailings and Process Water
Ore Processing
The ore from the West Detour deposit is planned to be comingled with DLM ore and processed in the existing mill on-site. The anticipated co-mingling ratio is 10% West Detour and 90% from DLM. Ore processing at the DLM involves crushing and grinding of the ore followed by gravity
Oblique View Looking NE
100 m
SRK Consulting West Detour ML/ARD Characterization – FINAL Page 17
LNB/CBK/SJD WestDetour_MLARD_EAReport_Final_1CD011008_20160819_CBK_SJD_FNL August 2016
separation of free gold. After gravity processing, whole ore is treated with cyanide with the dissolved gold recovered by carbon-in-pulp and gold electrowinning from the pregnant strip solution. The gravity concentrate is also treated with cyanide before further recovery in the refining circuit. Lime is added during the cyanidation process to maintain pH between 10.5 and 11. Since only elemental gold is recovered from the ore, tailings bulk geochemical characteristics are expected to be similar to the ore.
Tailings Sources and Comingling Basis
West Detour tailings used in this characterization program were produced from grinding ore composites previously prepared from drill core as part of metallurgical feasibility studies for the project (BBA 2014). The tailings produced during the actual feasibility study were not used as they were oven dried and probably oxidized prior to environmental geochemical testing. As ore processing at Detour is not expected to alter the mineral composition of the tailings, testing ore material ground to the same particle size as operational tailings is expected to be represent the physical and chemical characteristics of the tailings.
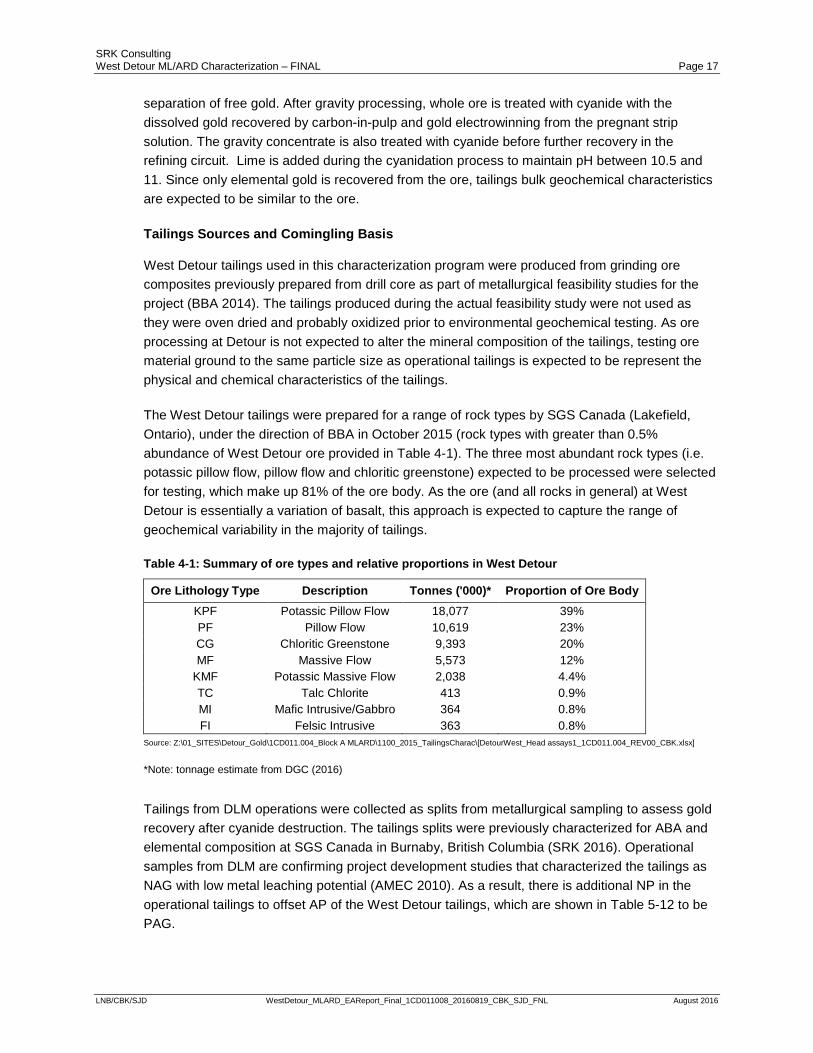
The West Detour tailings were prepared for a range of rock types by SGS Canada (Lakefield, Ontario), under the direction of BBA in October 2015 (rock types with greater than 0.5% abundance of West Detour ore provided in Table 4-1). The three most abundant rock types (i.e. potassic pillow flow, pillow flow and chloritic greenstone) expected to be processed were selected for testing, which make up 81% of the ore body. As the ore (and all rocks in general) at West Detour is essentially a variation of basalt, this approach is expected to capture the range of geochemical variability in the majority of tailings.
Table 4-1: Summary of ore types and relative proportions in West Detour
Ore Lithology Type Description Tonnes ('000)* Proportion of Ore Body KPF Potassic Pillow Flow 18,077 39% PF Pillow Flow 10,619 23% CG Chloritic Greenstone 9,393 20% MF Massive Flow 5,573 12%
KMF Potassic Massive Flow 2,038 4.4% TC Talc Chlorite 413 0.9% MI Mafic Intrusive/Gabbro 364 0.8% FI Felsic Intrusive 363 0.8%
Source: Z:\01_SITES\Detour_Gold\1CD011.004_Block A MLARD\1100_2015_TailingsCharac\[DetourWest_Head assays1_1CD011.004_REV00_CBK.xlsx]
*Note: tonnage estimate from DGC (2016)
Tailings from DLM operations were collected as splits from metallurgical sampling to assess gold recovery after cyanide destruction. The tailings splits were previously characterized for ABA and elemental composition at SGS Canada in Burnaby, British Columbia (SRK 2016). Operational samples from DLM are confirming project development studies that characterized the tailings as NAG with low metal leaching potential (AMEC 2010). As a result, there is additional NP in the operational tailings to offset AP of the West Detour tailings, which are shown in Table 5-12 to be PAG.
SRK Consulting West Detour ML/ARD Characterization – FINAL Page 18
LNB/CBK/SJD WestDetour_MLARD_EAReport_Final_1CD011008_20160819_CBK_SJD_FNL August 2016
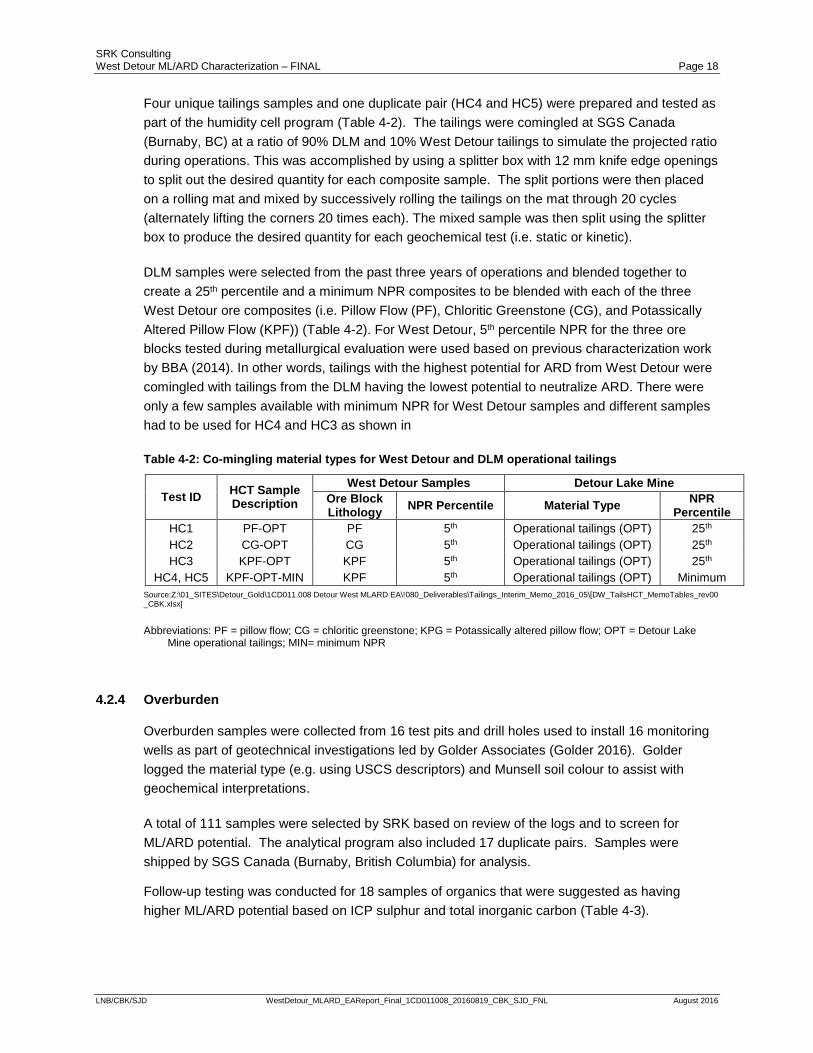
Four unique tailings samples and one duplicate pair (HC4 and HC5) were prepared and tested as part of the humidity cell program (Table 4-2). The tailings were comingled at SGS Canada (Burnaby, BC) at a ratio of 90% DLM and 10% West Detour tailings to simulate the projected ratio during operations. This was accomplished by using a splitter box with 12 mm knife edge openings to split out the desired quantity for each composite sample. The split portions were then placed on a rolling mat and mixed by successively rolling the tailings on the mat through 20 cycles (alternately lifting the corners 20 times each). The mixed sample was then split using the splitter box to produce the desired quantity for each geochemical test (i.e. static or kinetic).
DLM samples were selected from the past three years of operations and blended together to create a 25th percentile and a minimum NPR composites to be blended with each of the three West Detour ore composites (i.e. Pillow Flow (PF), Chloritic Greenstone (CG), and Potassically Altered Pillow Flow (KPF)) (Table 4-2). For West Detour, 5th percentile NPR for the three ore blocks tested during metallurgical evaluation were used based on previous characterization work by BBA (2014). In other words, tailings with the highest potential for ARD from West Detour were comingled with tailings from the DLM having the lowest potential to neutralize ARD. There were only a few samples available with minimum NPR for West Detour samples and different samples had to be used for HC4 and HC3 as shown in
Table 4-2: Co-mingling material types for West Detour and DLM operational tailings
Test ID HCT Sample Description
West Detour Samples Detour Lake Mine Ore Block Lithology NPR Percentile Material Type NPR
Percentile HC1 PF-OPT PF 5th Operational tailings (OPT) 25th HC2 CG-OPT CG 5th Operational tailings (OPT) 25th HC3 KPF-OPT KPF 5th Operational tailings (OPT) 25th
HC4, HC5 KPF-OPT-MIN KPF 5th Operational tailings (OPT) Minimum Source:Z:\01_SITES\Detour_Gold\1CD011.008 Detour West MLARD EA\!080_Deliverables\Tailings_Interim_Memo_2016_05\[DW_TailsHCT_MemoTables_rev00_CBK.xlsx]
Abbreviations: PF = pillow flow; CG = chloritic greenstone; KPG = Potassically altered pillow flow; OPT = Detour Lake Mine operational tailings; MIN= minimum NPR
4.2.4 Overburden
Overburden samples were collected from 16 test pits and drill holes used to install 16 monitoring wells as part of geotechnical investigations led by Golder Associates (Golder 2016). Golder logged the material type (e.g. using USCS descriptors) and Munsell soil colour to assist with geochemical interpretations.
A total of 111 samples were selected by SRK based on review of the logs and to screen for ML/ARD potential. The analytical program also included 17 duplicate pairs. Samples were shipped by SGS Canada (Burnaby, British Columbia) for analysis.
Follow-up testing was conducted for 18 samples of organics that were suggested as having higher ML/ARD potential based on ICP sulphur and total inorganic carbon (Table 4-3).
SRK Consulting West Detour ML/ARD Characterization – FINAL Page 19
LNB/CBK/SJD WestDetour_MLARD_EAReport_Final_1CD011008_20160819_CBK_SJD_FNL August 2016
Table 4-3: Overview of static geochemical test program by sample set
Test
Mat
eria
l
Past
e pH
Tota
l Sul
phur
Sulp
hate
Sul
phur
Sulp
hide
Sul
phur
Tota
l Car
bon
Tota
l Ino
rgan
ic C
arbo
n
Mod
ified
NP
Trac
e El
emen
ts
Mer
cury
(low
leve
l)
Sele
nium
(low
leve
l)
Bar
ium
(low
leve
l)
Min
eral
ogy
Moi
stur
e C
onte
nt
Part
icle
Siz
e1
2012 WR and Ore √ √ √ √ √ √ √
2014 WR HCTs √ √ √ √ √ √ √ √ √ √ √
Overburden * * * * √ * √ √ √ √
2016 WR √ √
2015 Tailings HCT
√ √ √ √ √ √ √ √ √ √ √ √
Source: Z:\01_SITES\Detour_Gold\1CD011.008 Detour West MLARD EA\Task 900_Reporting\1. Draft\Tables\[Inventory of Test Program Methods.xlsx]
Note(s):
(1) Tailings HCT samples sieved according to the following size fractions: +100 mesh (0.15mm), 100 to +200 mesh and -200 mesh (0.075 mm).
(√) Indicates the column heading test was complete on the identified test material.
(*) On a subset of 18 peat samples.
4.3 Analytical Methods
4.3.1 Sample Preparation
Rock samples obtained from core were prepared in several ways to obtain samples for the various analytical methods:
• Static analyses were performed on a pulp prepared to pass a 200 mesh sieve.
• All laboratory kinetic testing was performed on samples jaw crushed to pass a ¼-inch sieve (rock samples).
• West Detour ore was ground to match DLM tailings particle sizes of 80% passing 120 to 130 µm.
• Operational tailings from DLM were tested as-received.
4.3.2 Physical Analyses
Waste rock samples submitted for kinetic testing were characterized for particle size distribution using particle sieves at ¼-inch and 10, 35, 100, and 270 mesh. Tailings humidity cell samples were characterized for particle size distribution using particle sieves at 100 and 200 mesh.
SRK Consulting West Detour ML/ARD Characterization – FINAL Page 20
LNB/CBK/SJD WestDetour_MLARD_EAReport_Final_1CD011008_20160819_CBK_SJD_FNL August 2016
4.3.3 Static Geochemical Tests
Static geochemical tests provide the basis for understanding potential reactivity and therefore ML/ARD potential of a sample. Table 4-3 presents the analytical program for each sample (i.e. 2012 versus 2016) set presented in Section 4.2. The static geochemical tests performed included:
• Total sulphur by Leco furnace.
• Sulphate determined using 25% hydrochloric acid leach.
• Sulphide determined using nitric acid leach.
• Neutralization potential by Modified Acid Base Account (Coastech 1991) method.
• Total carbon by Leco furnace.
• Total inorganic carbon determined by coulometric methods.
• Paste pH determined by the Sobek et al. (1978) method.
• Element scan using ICP following aqua-regia digestion.
• Low level mercury, barium and selenium on humidity cell solid samples.
4.3.4 Mineralogical Analyses
Mineralogical characterization using Quantitative Evaluation of Minerals by Scanning Electron Microscopy (QEMSCAN) and Rietveld X-ray diffraction (XRD). The characterization was conducted on 100 g splits from all of the waste rock and tailings humidity cell test samples, including the duplicate. Analysis was performed by SGS Canada Inc. in Burnaby, British Columbia.
QEMSCAN is a relatively new mineralogical method being used for environmental geochemistry applications, and it provides modal mineralogy based on mineral grain chemistry. The method is advantageous over optical petrography methods as many more mineral grains can be analyzed and quantitative information on particle size and degree of mineral liberation/exposure can also be obtained.
4.3.5 Humidity Cells
The method used for the West Detour humidity cell program was MEND (2009). Waste rock or tailings is flushed once per week with deionized water and the leachate is analysed to assess oxidations rates (i.e. sulphate production) and element leaching. For waste rock, 1 kg of material was used and for tailings, 0.5 kg of material was used with 0.5 L, and 0.25 L flushed, respectively.
Tailings humidity cells are modified from rock humidity cells by having a larger diameter (10 cm versus 21 cm inner diameter (as shown in Figure 4-3) to create a thin layer of tailings, which provides a greater likelihood that oxygen diffusion will not be limiting in the tests. Oxygen diffusion can sometimes be limiting if the tailings are not spread out in a thin layers, as a result of the fine sand and silt-like particle size of the tailings.
SRK Consulting West Detour ML/ARD Characterization – FINAL Page 21
LNB/CBK/SJD WestDetour_MLARD_EAReport_Final_1CD011008_20160819_CBK_SJD_FNL August 2016
(A)
(B)
Figure 4-3: West Detour waste rock humidity cell (A) and tailings humidity cell (B)
The volume, pH, and conductivity of the waste rock and tailings humidity cell test leachates were analyzed weekly. The initial analytical schedule for the following parameters was weekly for the first four weeks and then every two weeks thereafter:
• Acidity, Alkalinity • Sulphate • Total cyanide, weak acid dissociable (WAD) cyanide (tailings samples only) • Nitrogen forms – ammonia, nitrite and nitrate (tailings samples only) • Fluoride • Major cations (Al, Ca, Mg, Na, K) • Trace element scan (Sb, As, Ba, Be, Bi, B, Cd, Cr, Co, Cu, Fe, Pb, Li, Mn, Mo, Ni, P, Se,
Si, Ag, Sr, Tl, Sn, Ti, U, V, Zn, Zr) • Low level mercury
The resulting samples for both humidity cell programs and duration of testing at the time of this report are provided in Table 4-4.
SRK Consulting West Detour ML/ARD Characterization – FINAL Page 22
LNB/CBK/SJD WestDetour_MLARD_EAReport_Final_1CD011008_20160819_CBK_SJD_FNL August 2016
Table 4-4: Summary of West Detour waste rock and tailings humidity cell tests
HCT ID Test Type Lithology Weeks Tested Test Status
HC-28 Waste Rock CG 95 Test continuing HC-29 Waste Rock PF 95 Test continuing HC-30 Waste Rock MF 95 Test continuing HC-31 Waste Rock KPF 95 Test continuing HC-32 Waste Rock KPF 95 Test continuing HC-33 Waste Rock KPF (Dup of HC-32) 95 Test continuing HC-34 Waste Rock KPF - LGO 95 Test continuing HC-1 Tailings PF-OPT 34 Test continuing HC-2 Tailings CG-OPT 34 Test continuing HC-3 Tailings KPF-OPT 34 Test continuing HC-4 Tailings KPF-OPT-MIN 34 Test continuing HC-5 Tailings KPF-OPT-MIN (Dup of HC4) 34 Test continuing
Source: Z:\01_SITES\Detour_Gold\1CD011.008 Detour West MLARD EA\Task 900_Reporting\1. Draft\Tables\[Inventory of Test Program Methods.xlsx]
Abbreviations: CG = chloritic greenstone; PF = pillow flow; massive flow; KPF = Potassically altered pillow flow; LGO = mineralized waste; OPT = Detour Lake Mine operational tailings; MIN= minimum NPR.
Waste Rock Samples
Waste rock humidity cells for West Detour were started on October 6, 2014, and at the time of this report, 95 weeks of data had been received from the laboratory. In February 2016, after more than one year of operation, the analytical frequency of the humidity cell program was decreased. This was done to continue establishing long term oxidation rates beyond the standard 40 weeks as recommended by MEND (2009), while minimizing costs. The new analysis frequency is outlined in Table 4-5.
Humidity cell operating procedures are remaining unchanged (e.g. weekly flushing), but leachate samples are being analysed at a lower frequency and stored for up to six months to allow re-analysis should conditions change in the tests and require further investigation.
Table 4-5: Current analytical schedule for waste rock humidity cell tests
Analysis Initial / Changing Analysis Protocol Stable Analysis Protocol
pH, conductivity and leachate volume Weekly Weekly
Acidity, alkalinity, chloride, fluoride and sulphate Every 2 weeks Quarterly
Trace element scan Every 2 weeks Quarterly
SRK Consulting West Detour ML/ARD Characterization – FINAL Page 23
LNB/CBK/SJD WestDetour_MLARD_EAReport_Final_1CD011008_20160819_CBK_SJD_FNL August 2016
Tailings Samples
The tests were initiated on December 21, 2015, and have yielded 34 weeks of data at the time the data were interpreted for this report. While these tests typically run for a minimum of 40 weeks, release rates are just starting to stabilize and initial interpretations are provided herein. All tests are continuing.
4.3.6 Solution Analyses
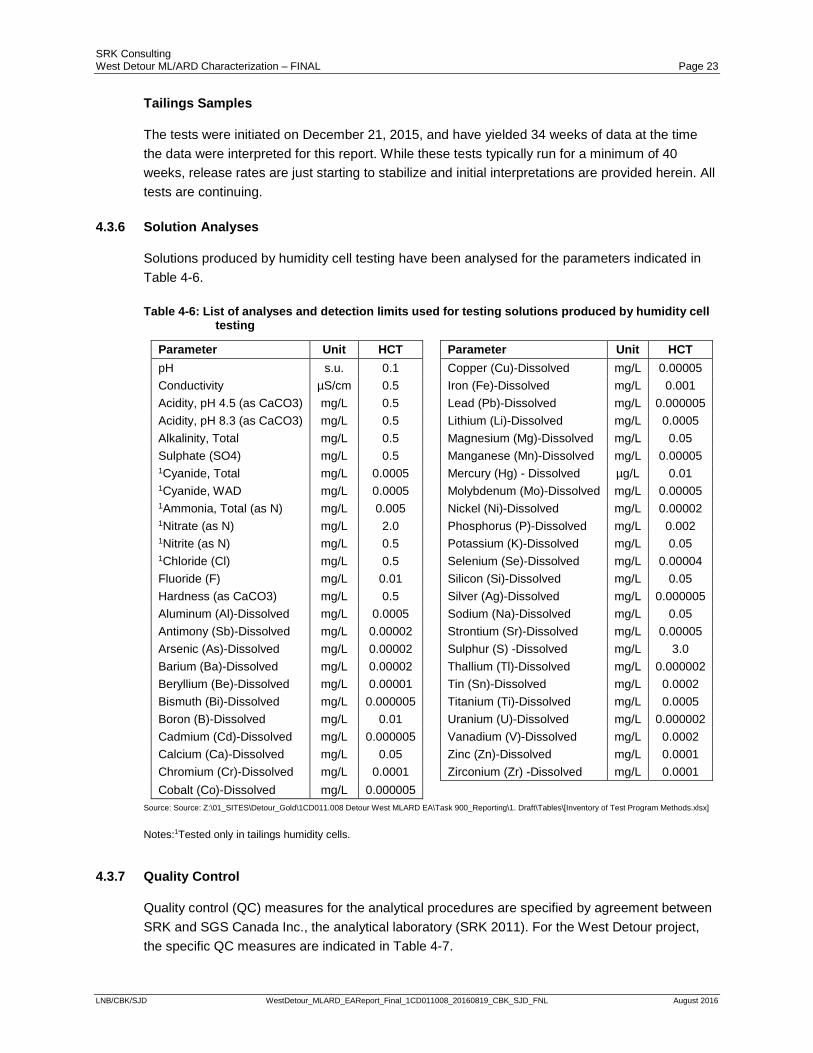
Solutions produced by humidity cell testing have been analysed for the parameters indicated in Table 4-6.
Table 4-6: List of analyses and detection limits used for testing solutions produced by humidity cell testing
Parameter Unit HCT Parameter Unit HCT pH s.u. 0.1 Copper (Cu)-Dissolved mg/L 0.00005 Conductivity µS/cm 0.5 Iron (Fe)-Dissolved mg/L 0.001 Acidity, pH 4.5 (as CaCO3) mg/L 0.5 Lead (Pb)-Dissolved mg/L 0.000005 Acidity, pH 8.3 (as CaCO3) mg/L 0.5 Lithium (Li)-Dissolved mg/L 0.0005 Alkalinity, Total mg/L 0.5 Magnesium (Mg)-Dissolved mg/L 0.05 Sulphate (SO4) mg/L 0.5 Manganese (Mn)-Dissolved mg/L 0.00005 1Cyanide, Total mg/L 0.0005 Mercury (Hg) - Dissolved µg/L 0.01 1Cyanide, WAD mg/L 0.0005 Molybdenum (Mo)-Dissolved mg/L 0.00005 1Ammonia, Total (as N) mg/L 0.005 Nickel (Ni)-Dissolved mg/L 0.00002 1Nitrate (as N) mg/L 2.0 Phosphorus (P)-Dissolved mg/L 0.002 1Nitrite (as N) mg/L 0.5 Potassium (K)-Dissolved mg/L 0.05 1Chloride (Cl) mg/L 0.5 Selenium (Se)-Dissolved mg/L 0.00004 Fluoride (F) mg/L 0.01 Silicon (Si)-Dissolved mg/L 0.05 Hardness (as CaCO3) mg/L 0.5 Silver (Ag)-Dissolved mg/L 0.000005 Aluminum (Al)-Dissolved mg/L 0.0005 Sodium (Na)-Dissolved mg/L 0.05 Antimony (Sb)-Dissolved mg/L 0.00002 Strontium (Sr)-Dissolved mg/L 0.00005 Arsenic (As)-Dissolved mg/L 0.00002 Sulphur (S) -Dissolved mg/L 3.0 Barium (Ba)-Dissolved mg/L 0.00002 Thallium (Tl)-Dissolved mg/L 0.000002 Beryllium (Be)-Dissolved mg/L 0.00001 Tin (Sn)-Dissolved mg/L 0.0002 Bismuth (Bi)-Dissolved mg/L 0.000005 Titanium (Ti)-Dissolved mg/L 0.0005 Boron (B)-Dissolved mg/L 0.01 Uranium (U)-Dissolved mg/L 0.000002 Cadmium (Cd)-Dissolved mg/L 0.000005 Vanadium (V)-Dissolved mg/L 0.0002 Calcium (Ca)-Dissolved mg/L 0.05 Zinc (Zn)-Dissolved mg/L 0.0001 Chromium (Cr)-Dissolved mg/L 0.0001 Zirconium (Zr) -Dissolved mg/L 0.0001 Cobalt (Co)-Dissolved mg/L 0.000005
Source: Source: Z:\01_SITES\Detour_Gold\1CD011.008 Detour West MLARD EA\Task 900_Reporting\1. Draft\Tables\[Inventory of Test Program Methods.xlsx]
Notes:1Tested only in tailings humidity cells.
4.3.7 Quality Control
Quality control (QC) measures for the analytical procedures are specified by agreement between SRK and SGS Canada Inc., the analytical laboratory (SRK 2011). For the West Detour project, the specific QC measures are indicated in Table 4-7.
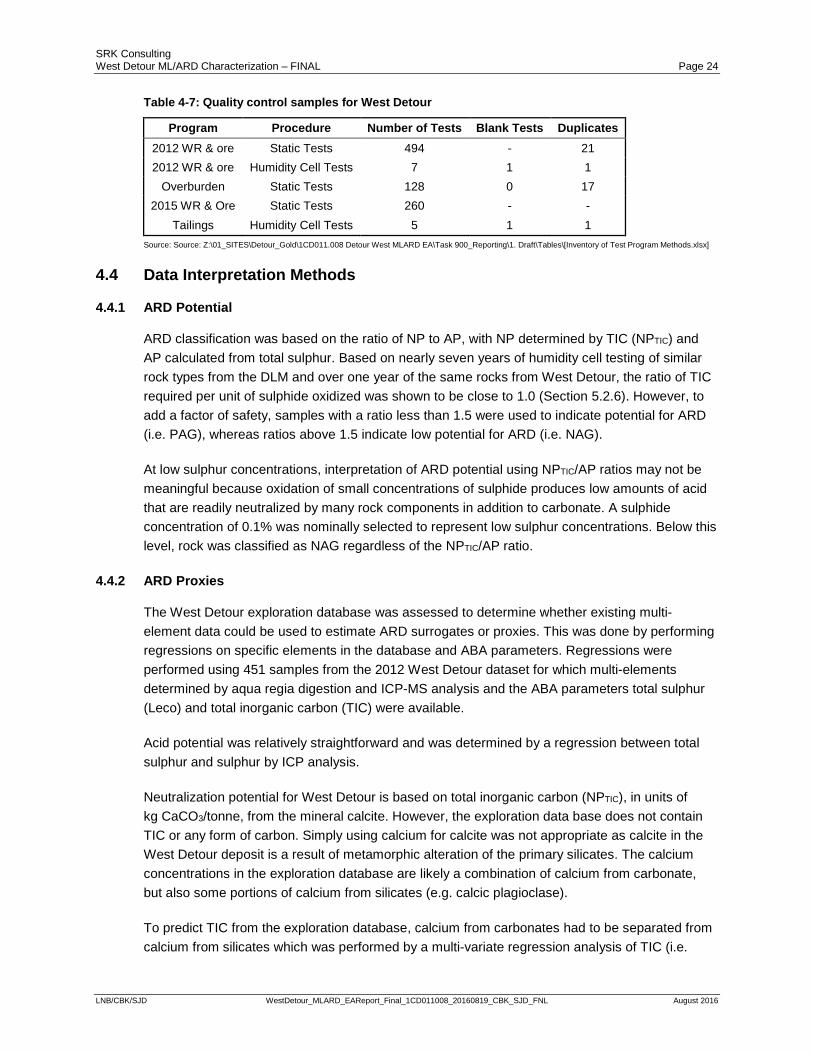
SRK Consulting West Detour ML/ARD Characterization – FINAL Page 24
LNB/CBK/SJD WestDetour_MLARD_EAReport_Final_1CD011008_20160819_CBK_SJD_FNL August 2016
Table 4-7: Quality control samples for West Detour
Program Procedure Number of Tests Blank Tests Duplicates 2012 WR & ore Static Tests 494 - 21 2012 WR & ore Humidity Cell Tests 7 1 1
Overburden Static Tests 128 0 17 2015 WR & Ore Static Tests 260 - -
Tailings Humidity Cell Tests 5 1 1 Source: Source: Z:\01_SITES\Detour_Gold\1CD011.008 Detour West MLARD EA\Task 900_Reporting\1. Draft\Tables\[Inventory of Test Program Methods.xlsx]
4.4 Data Interpretation Methods
4.4.1 ARD Potential
ARD classification was based on the ratio of NP to AP, with NP determined by TIC (NPTIC) and AP calculated from total sulphur. Based on nearly seven years of humidity cell testing of similar rock types from the DLM and over one year of the same rocks from West Detour, the ratio of TIC required per unit of sulphide oxidized was shown to be close to 1.0 (Section 5.2.6). However, to add a factor of safety, samples with a ratio less than 1.5 were used to indicate potential for ARD (i.e. PAG), whereas ratios above 1.5 indicate low potential for ARD (i.e. NAG).
At low sulphur concentrations, interpretation of ARD potential using NPTIC/AP ratios may not be meaningful because oxidation of small concentrations of sulphide produces low amounts of acid that are readily neutralized by many rock components in addition to carbonate. A sulphide concentration of 0.1% was nominally selected to represent low sulphur concentrations. Below this level, rock was classified as NAG regardless of the NPTIC/AP ratio.
4.4.2 ARD Proxies
The West Detour exploration database was assessed to determine whether existing multi-element data could be used to estimate ARD surrogates or proxies. This was done by performing regressions on specific elements in the database and ABA parameters. Regressions were performed using 451 samples from the 2012 West Detour dataset for which multi-elements determined by aqua regia digestion and ICP-MS analysis and the ABA parameters total sulphur (Leco) and total inorganic carbon (TIC) were available.
Acid potential was relatively straightforward and was determined by a regression between total sulphur and sulphur by ICP analysis.
Neutralization potential for West Detour is based on total inorganic carbon (NPTIC), in units of kg CaCO3/tonne, from the mineral calcite. However, the exploration data base does not contain TIC or any form of carbon. Simply using calcium for calcite was not appropriate as calcite in the West Detour deposit is a result of metamorphic alteration of the primary silicates. The calcium concentrations in the exploration database are likely a combination of calcium from carbonate, but also some portions of calcium from silicates (e.g. calcic plagioclase).
To predict TIC from the exploration database, calcium from carbonates had to be separated from calcium from silicates which was performed by a multi-variate regression analysis of TIC (i.e.
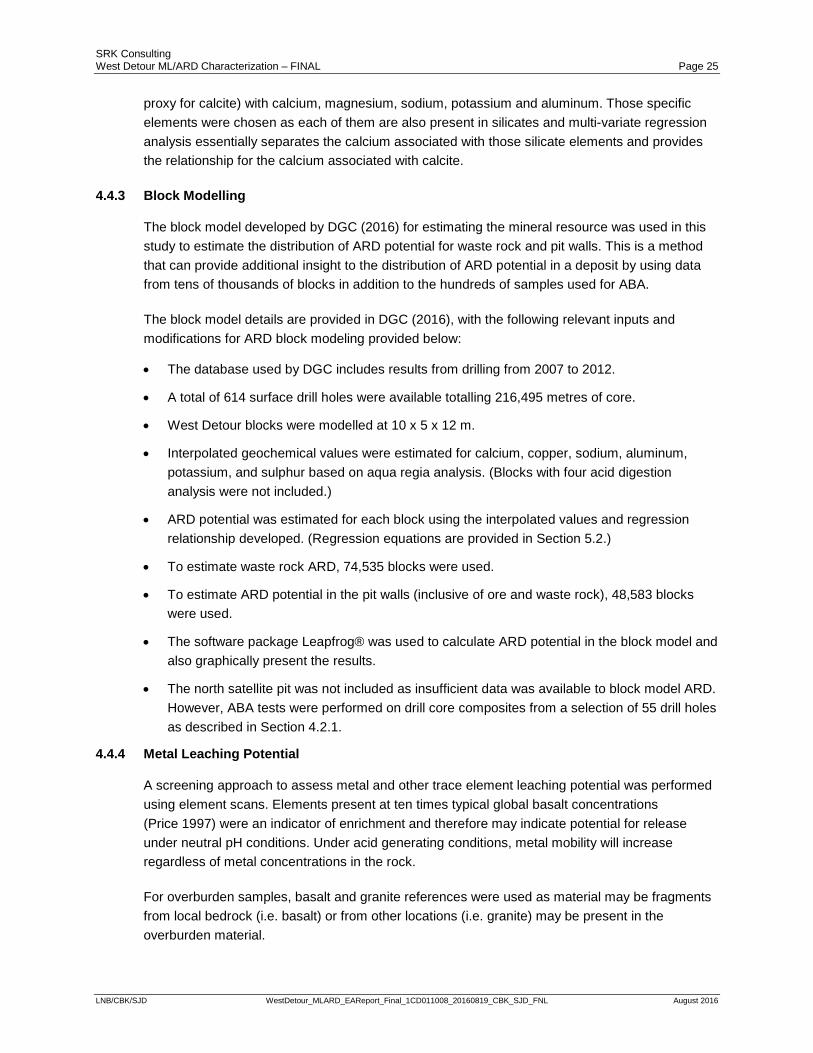
SRK Consulting West Detour ML/ARD Characterization – FINAL Page 25
LNB/CBK/SJD WestDetour_MLARD_EAReport_Final_1CD011008_20160819_CBK_SJD_FNL August 2016
proxy for calcite) with calcium, magnesium, sodium, potassium and aluminum. Those specific elements were chosen as each of them are also present in silicates and multi-variate regression analysis essentially separates the calcium associated with those silicate elements and provides the relationship for the calcium associated with calcite.
4.4.3 Block Modelling
The block model developed by DGC (2016) for estimating the mineral resource was used in this study to estimate the distribution of ARD potential for waste rock and pit walls. This is a method that can provide additional insight to the distribution of ARD potential in a deposit by using data from tens of thousands of blocks in addition to the hundreds of samples used for ABA.
The block model details are provided in DGC (2016), with the following relevant inputs and modifications for ARD block modeling provided below:
• The database used by DGC includes results from drilling from 2007 to 2012.
• A total of 614 surface drill holes were available totalling 216,495 metres of core.
• West Detour blocks were modelled at 10 x 5 x 12 m.
• Interpolated geochemical values were estimated for calcium, copper, sodium, aluminum, potassium, and sulphur based on aqua regia analysis. (Blocks with four acid digestion analysis were not included.)
• ARD potential was estimated for each block using the interpolated values and regression relationship developed. (Regression equations are provided in Section 5.2.)
• To estimate waste rock ARD, 74,535 blocks were used.
• To estimate ARD potential in the pit walls (inclusive of ore and waste rock), 48,583 blocks were used.
• The software package Leapfrog® was used to calculate ARD potential in the block model and also graphically present the results.
• The north satellite pit was not included as insufficient data was available to block model ARD. However, ABA tests were performed on drill core composites from a selection of 55 drill holes as described in Section 4.2.1.
4.4.4 Metal Leaching Potential
A screening approach to assess metal and other trace element leaching potential was performed using element scans. Elements present at ten times typical global basalt concentrations (Price 1997) were an indicator of enrichment and therefore may indicate potential for release under neutral pH conditions. Under acid generating conditions, metal mobility will increase regardless of metal concentrations in the rock.
For overburden samples, basalt and granite references were used as material may be fragments from local bedrock (i.e. basalt) or from other locations (i.e. granite) may be present in the overburden material.
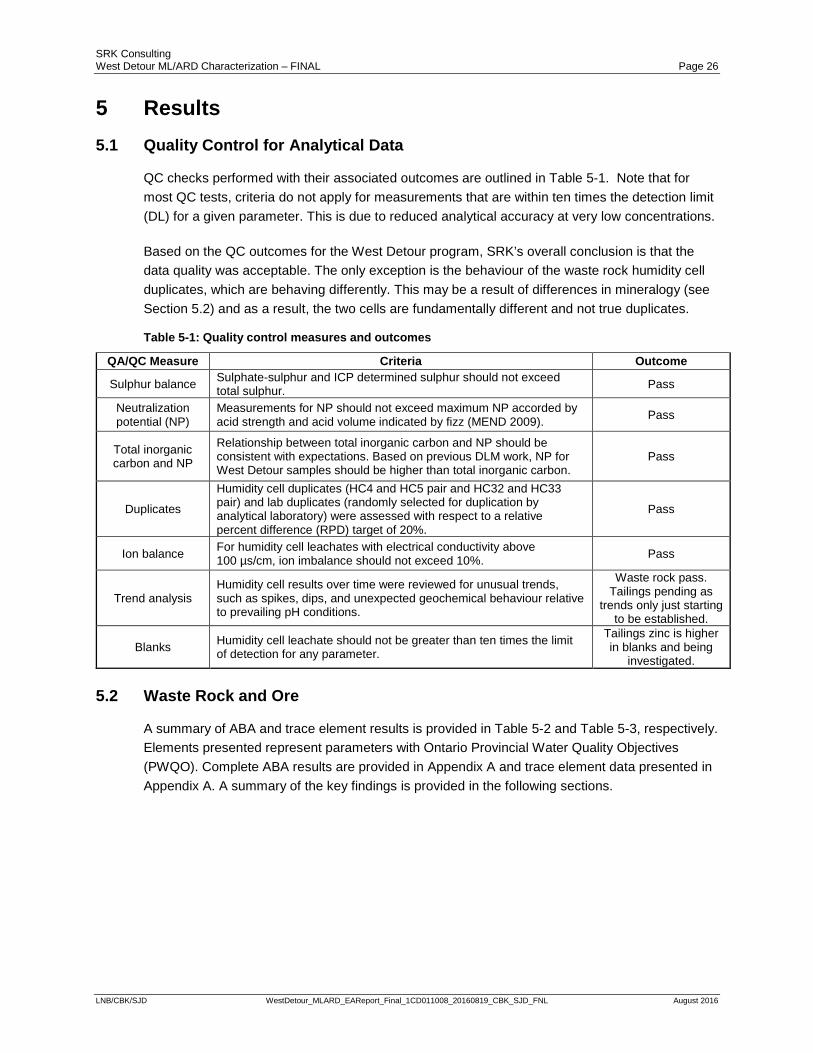
SRK Consulting West Detour ML/ARD Characterization – FINAL Page 26
LNB/CBK/SJD WestDetour_MLARD_EAReport_Final_1CD011008_20160819_CBK_SJD_FNL August 2016
5 Results 5.1 Quality Control for Analytical Data
QC checks performed with their associated outcomes are outlined in Table 5-1. Note that for most QC tests, criteria do not apply for measurements that are within ten times the detection limit (DL) for a given parameter. This is due to reduced analytical accuracy at very low concentrations.
Based on the QC outcomes for the West Detour program, SRK’s overall conclusion is that the data quality was acceptable. The only exception is the behaviour of the waste rock humidity cell duplicates, which are behaving differently. This may be a result of differences in mineralogy (see Section 5.2) and as a result, the two cells are fundamentally different and not true duplicates.
Table 5-1: Quality control measures and outcomes
QA/QC Measure Criteria Outcome
Sulphur balance Sulphate-sulphur and ICP determined sulphur should not exceed total sulphur. Pass
Neutralization potential (NP)
Measurements for NP should not exceed maximum NP accorded by acid strength and acid volume indicated by fizz (MEND 2009). Pass
Total inorganic carbon and NP
Relationship between total inorganic carbon and NP should be consistent with expectations. Based on previous DLM work, NP for West Detour samples should be higher than total inorganic carbon.
Pass
Duplicates
Humidity cell duplicates (HC4 and HC5 pair and HC32 and HC33 pair) and lab duplicates (randomly selected for duplication by analytical laboratory) were assessed with respect to a relative percent difference (RPD) target of 20%.
Pass
Ion balance For humidity cell leachates with electrical conductivity above 100 µs/cm, ion imbalance should not exceed 10%. Pass
Trend analysis Humidity cell results over time were reviewed for unusual trends, such as spikes, dips, and unexpected geochemical behaviour relative to prevailing pH conditions.
Waste rock pass. Tailings pending as
trends only just starting to be established.
Blanks Humidity cell leachate should not be greater than ten times the limit of detection for any parameter.
Tailings zinc is higher in blanks and being
investigated. 5.2 Waste Rock and Ore
A summary of ABA and trace element results is provided in Table 5-2 and Table 5-3, respectively. Elements presented represent parameters with Ontario Provincial Water Quality Objectives (PWQO). Complete ABA results are provided in Appendix A and trace element data presented in Appendix A. A summary of the key findings is provided in the following sections.
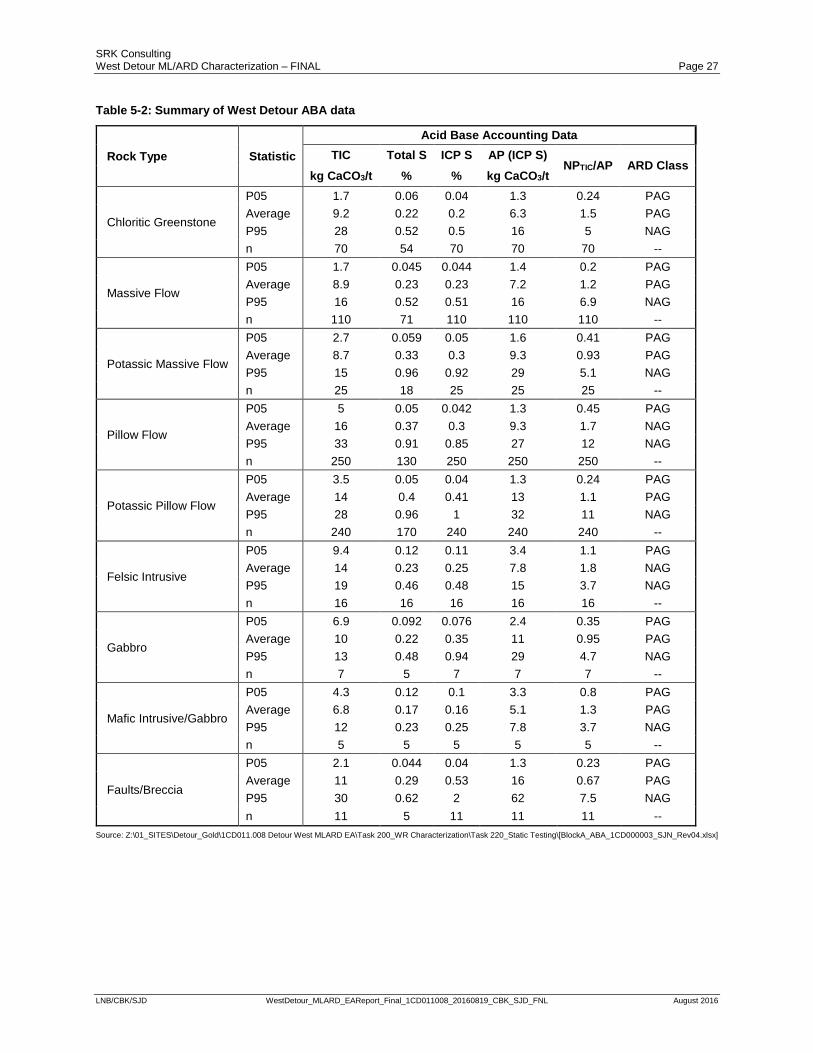
SRK Consulting West Detour ML/ARD Characterization – FINAL Page 27
LNB/CBK/SJD WestDetour_MLARD_EAReport_Final_1CD011008_20160819_CBK_SJD_FNL August 2016
Table 5-2: Summary of West Detour ABA data
Rock Type Statistic Acid Base Accounting Data
TIC Total S ICP S AP (ICP S) NPTIC/AP ARD Class
kg CaCO3/t % % kg CaCO3/t
Chloritic Greenstone
P05 1.7 0.06 0.04 1.3 0.24 PAG Average 9.2 0.22 0.2 6.3 1.5 PAG P95 28 0.52 0.5 16 5 NAG n 70 54 70 70 70 --
Massive Flow
P05 1.7 0.045 0.044 1.4 0.2 PAG Average 8.9 0.23 0.23 7.2 1.2 PAG P95 16 0.52 0.51 16 6.9 NAG n 110 71 110 110 110 --
Potassic Massive Flow
P05 2.7 0.059 0.05 1.6 0.41 PAG Average 8.7 0.33 0.3 9.3 0.93 PAG P95 15 0.96 0.92 29 5.1 NAG n 25 18 25 25 25 --
Pillow Flow
P05 5 0.05 0.042 1.3 0.45 PAG Average 16 0.37 0.3 9.3 1.7 NAG P95 33 0.91 0.85 27 12 NAG n 250 130 250 250 250 --
Potassic Pillow Flow
P05 3.5 0.05 0.04 1.3 0.24 PAG Average 14 0.4 0.41 13 1.1 PAG P95 28 0.96 1 32 11 NAG n 240 170 240 240 240 --
Felsic Intrusive
P05 9.4 0.12 0.11 3.4 1.1 PAG Average 14 0.23 0.25 7.8 1.8 NAG P95 19 0.46 0.48 15 3.7 NAG n 16 16 16 16 16 --
Gabbro
P05 6.9 0.092 0.076 2.4 0.35 PAG Average 10 0.22 0.35 11 0.95 PAG P95 13 0.48 0.94 29 4.7 NAG n 7 5 7 7 7 --
Mafic Intrusive/Gabbro
P05 4.3 0.12 0.1 3.3 0.8 PAG Average 6.8 0.17 0.16 5.1 1.3 PAG P95 12 0.23 0.25 7.8 3.7 NAG n 5 5 5 5 5 --
Faults/Breccia
P05 2.1 0.044 0.04 1.3 0.23 PAG Average 11 0.29 0.53 16 0.67 PAG P95 30 0.62 2 62 7.5 NAG n 11 5 11 11 11 --
Source: Z:\01_SITES\Detour_Gold\1CD011.008 Detour West MLARD EA\Task 200_WR Characterization\Task 220_Static Testing\[BlockA_ABA_1CD000003_SJN_Rev04.xlsx]
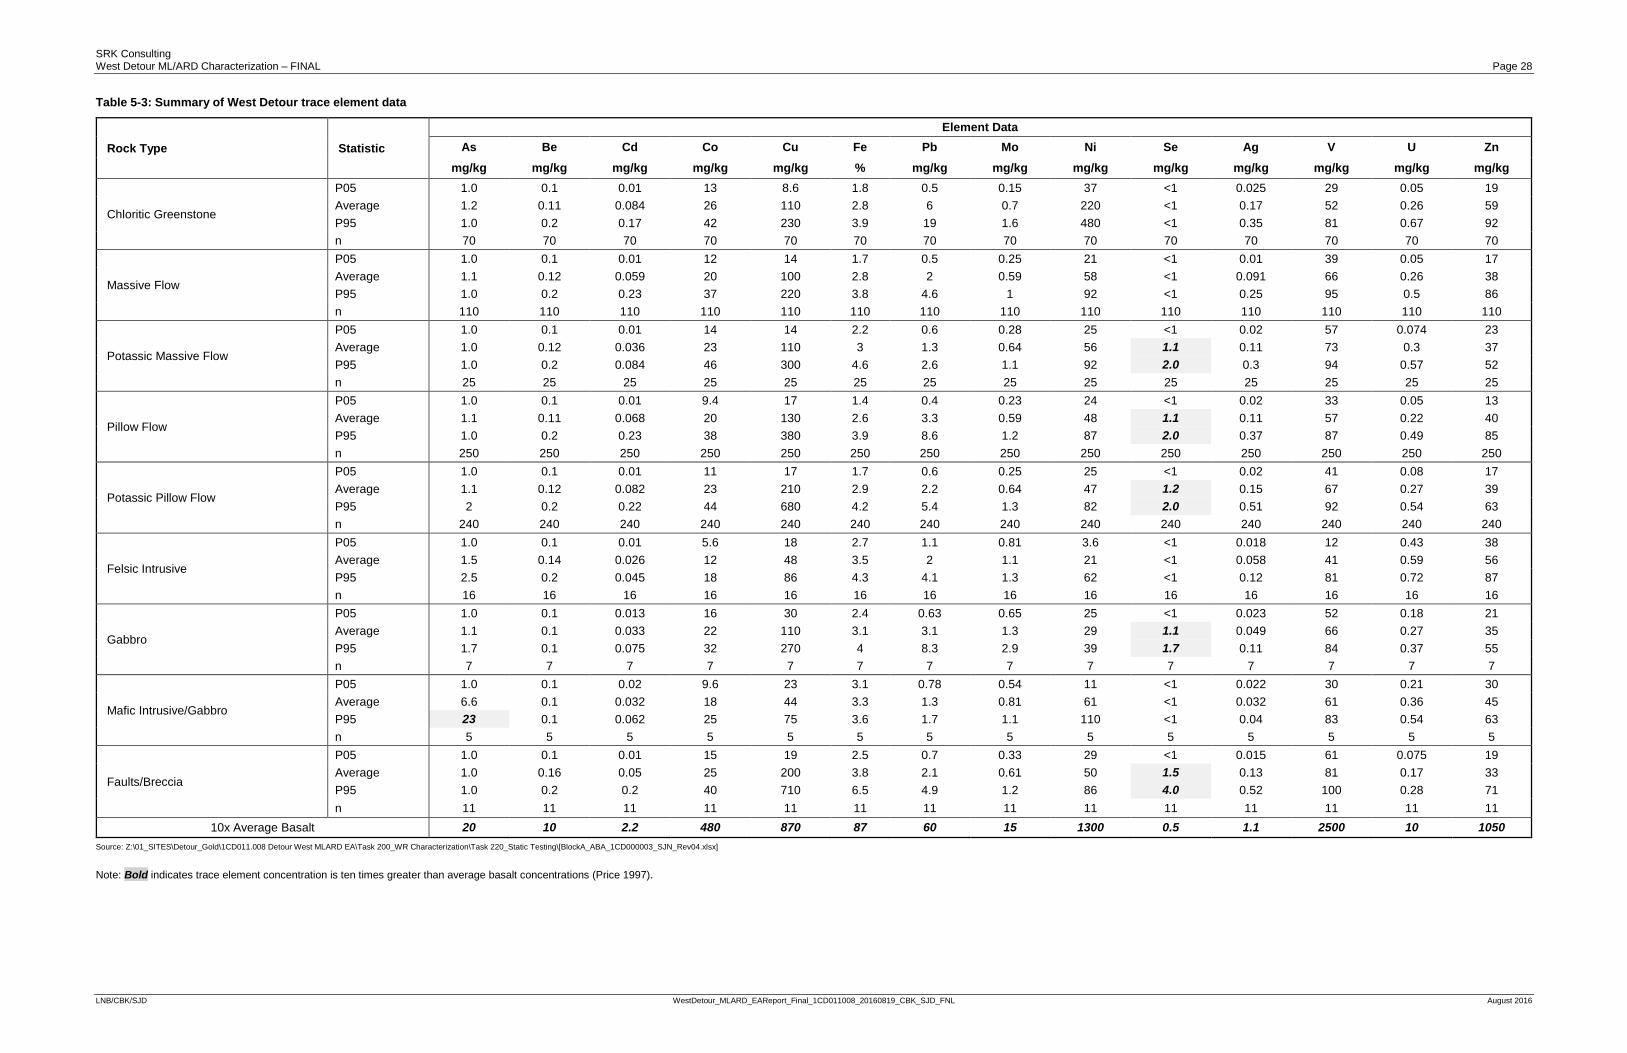
SRK Consulting West Detour ML/ARD Characterization – FINAL Page 28
LNB/CBK/SJD WestDetour_MLARD_EAReport_Final_1CD011008_20160819_CBK_SJD_FNL August 2016
Table 5-3: Summary of West Detour trace element data
Rock Type Statistic Element Data
As Be Cd Co Cu Fe Pb Mo Ni Se Ag V U Zn mg/kg mg/kg mg/kg mg/kg mg/kg % mg/kg mg/kg mg/kg mg/kg mg/kg mg/kg mg/kg mg/kg
Chloritic Greenstone
P05 1.0 0.1 0.01 13 8.6 1.8 0.5 0.15 37 <1 0.025 29 0.05 19 Average 1.2 0.11 0.084 26 110 2.8 6 0.7 220 <1 0.17 52 0.26 59 P95 1.0 0.2 0.17 42 230 3.9 19 1.6 480 <1 0.35 81 0.67 92 n 70 70 70 70 70 70 70 70 70 70 70 70 70 70
Massive Flow
P05 1.0 0.1 0.01 12 14 1.7 0.5 0.25 21 <1 0.01 39 0.05 17 Average 1.1 0.12 0.059 20 100 2.8 2 0.59 58 <1 0.091 66 0.26 38 P95 1.0 0.2 0.23 37 220 3.8 4.6 1 92 <1 0.25 95 0.5 86 n 110 110 110 110 110 110 110 110 110 110 110 110 110 110
Potassic Massive Flow
P05 1.0 0.1 0.01 14 14 2.2 0.6 0.28 25 <1 0.02 57 0.074 23 Average 1.0 0.12 0.036 23 110 3 1.3 0.64 56 1.1 0.11 73 0.3 37 P95 1.0 0.2 0.084 46 300 4.6 2.6 1.1 92 2.0 0.3 94 0.57 52 n 25 25 25 25 25 25 25 25 25 25 25 25 25 25
Pillow Flow
P05 1.0 0.1 0.01 9.4 17 1.4 0.4 0.23 24 <1 0.02 33 0.05 13 Average 1.1 0.11 0.068 20 130 2.6 3.3 0.59 48 1.1 0.11 57 0.22 40 P95 1.0 0.2 0.23 38 380 3.9 8.6 1.2 87 2.0 0.37 87 0.49 85 n 250 250 250 250 250 250 250 250 250 250 250 250 250 250
Potassic Pillow Flow
P05 1.0 0.1 0.01 11 17 1.7 0.6 0.25 25 <1 0.02 41 0.08 17 Average 1.1 0.12 0.082 23 210 2.9 2.2 0.64 47 1.2 0.15 67 0.27 39 P95 2 0.2 0.22 44 680 4.2 5.4 1.3 82 2.0 0.51 92 0.54 63 n 240 240 240 240 240 240 240 240 240 240 240 240 240 240
Felsic Intrusive
P05 1.0 0.1 0.01 5.6 18 2.7 1.1 0.81 3.6 <1 0.018 12 0.43 38 Average 1.5 0.14 0.026 12 48 3.5 2 1.1 21 <1 0.058 41 0.59 56 P95 2.5 0.2 0.045 18 86 4.3 4.1 1.3 62 <1 0.12 81 0.72 87 n 16 16 16 16 16 16 16 16 16 16 16 16 16 16
Gabbro
P05 1.0 0.1 0.013 16 30 2.4 0.63 0.65 25 <1 0.023 52 0.18 21 Average 1.1 0.1 0.033 22 110 3.1 3.1 1.3 29 1.1 0.049 66 0.27 35 P95 1.7 0.1 0.075 32 270 4 8.3 2.9 39 1.7 0.11 84 0.37 55 n 7 7 7 7 7 7 7 7 7 7 7 7 7 7
Mafic Intrusive/Gabbro
P05 1.0 0.1 0.02 9.6 23 3.1 0.78 0.54 11 <1 0.022 30 0.21 30 Average 6.6 0.1 0.032 18 44 3.3 1.3 0.81 61 <1 0.032 61 0.36 45 P95 23 0.1 0.062 25 75 3.6 1.7 1.1 110 <1 0.04 83 0.54 63 n 5 5 5 5 5 5 5 5 5 5 5 5 5 5
Faults/Breccia
P05 1.0 0.1 0.01 15 19 2.5 0.7 0.33 29 <1 0.015 61 0.075 19 Average 1.0 0.16 0.05 25 200 3.8 2.1 0.61 50 1.5 0.13 81 0.17 33 P95 1.0 0.2 0.2 40 710 6.5 4.9 1.2 86 4.0 0.52 100 0.28 71 n 11 11 11 11 11 11 11 11 11 11 11 11 11 11
10x Average Basalt 20 10 2.2 480 870 87 60 15 1300 0.5 1.1 2500 10 1050 Source: Z:\01_SITES\Detour_Gold\1CD011.008 Detour West MLARD EA\Task 200_WR Characterization\Task 220_Static Testing\[BlockA_ABA_1CD000003_SJN_Rev04.xlsx]
Note: Bold indicates trace element concentration is ten times greater than average basalt concentrations (Price 1997).
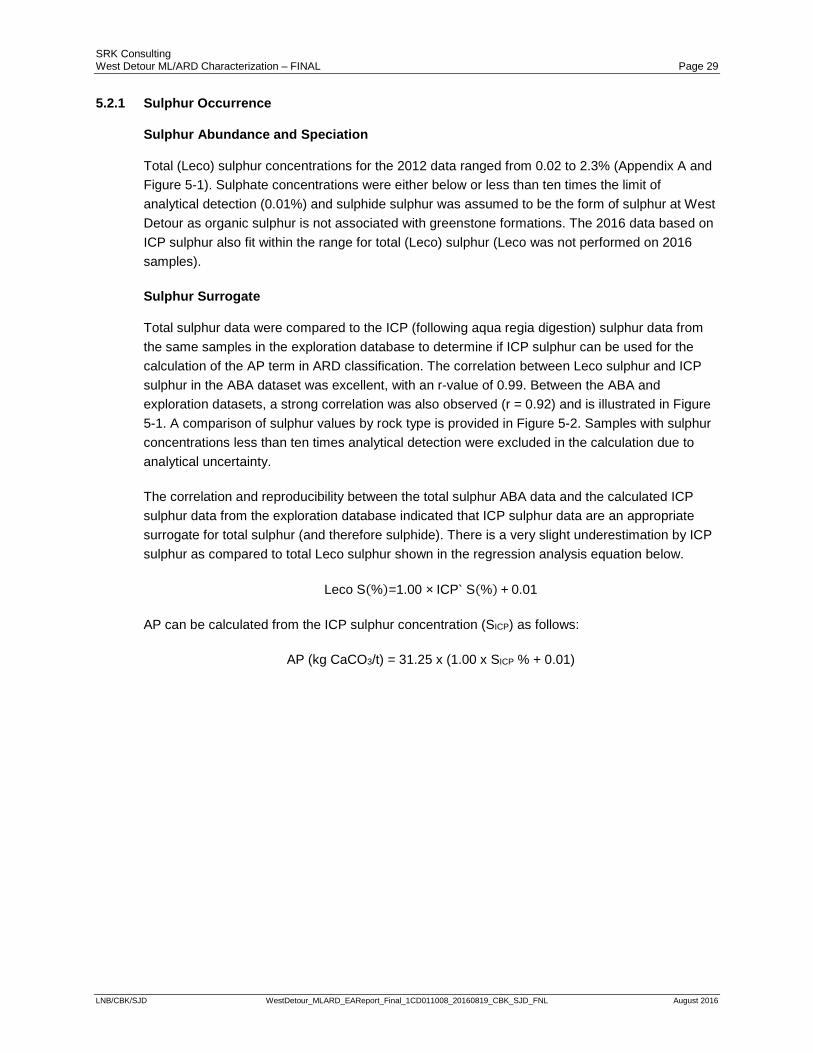
SRK Consulting West Detour ML/ARD Characterization – FINAL Page 29
LNB/CBK/SJD WestDetour_MLARD_EAReport_Final_1CD011008_20160819_CBK_SJD_FNL August 2016
5.2.1 Sulphur Occurrence
Sulphur Abundance and Speciation
Total (Leco) sulphur concentrations for the 2012 data ranged from 0.02 to 2.3% (Appendix A and Figure 5-1). Sulphate concentrations were either below or less than ten times the limit of analytical detection (0.01%) and sulphide sulphur was assumed to be the form of sulphur at West Detour as organic sulphur is not associated with greenstone formations. The 2016 data based on ICP sulphur also fit within the range for total (Leco) sulphur (Leco was not performed on 2016 samples).
Sulphur Surrogate
Total sulphur data were compared to the ICP (following aqua regia digestion) sulphur data from the same samples in the exploration database to determine if ICP sulphur can be used for the calculation of the AP term in ARD classification. The correlation between Leco sulphur and ICP sulphur in the ABA dataset was excellent, with an r-value of 0.99. Between the ABA and exploration datasets, a strong correlation was also observed (r = 0.92) and is illustrated in Figure 5-1. A comparison of sulphur values by rock type is provided in Figure 5-2. Samples with sulphur concentrations less than ten times analytical detection were excluded in the calculation due to analytical uncertainty.
The correlation and reproducibility between the total sulphur ABA data and the calculated ICP sulphur data from the exploration database indicated that ICP sulphur data are an appropriate surrogate for total sulphur (and therefore sulphide). There is a very slight underestimation by ICP sulphur as compared to total Leco sulphur shown in the regression analysis equation below.
Leco S(%)=1.00 × ICP` S(%) + 0.01
AP can be calculated from the ICP sulphur concentration (SICP) as follows:
AP (kg CaCO3/t) = 31.25 x (1.00 x SICP % + 0.01)
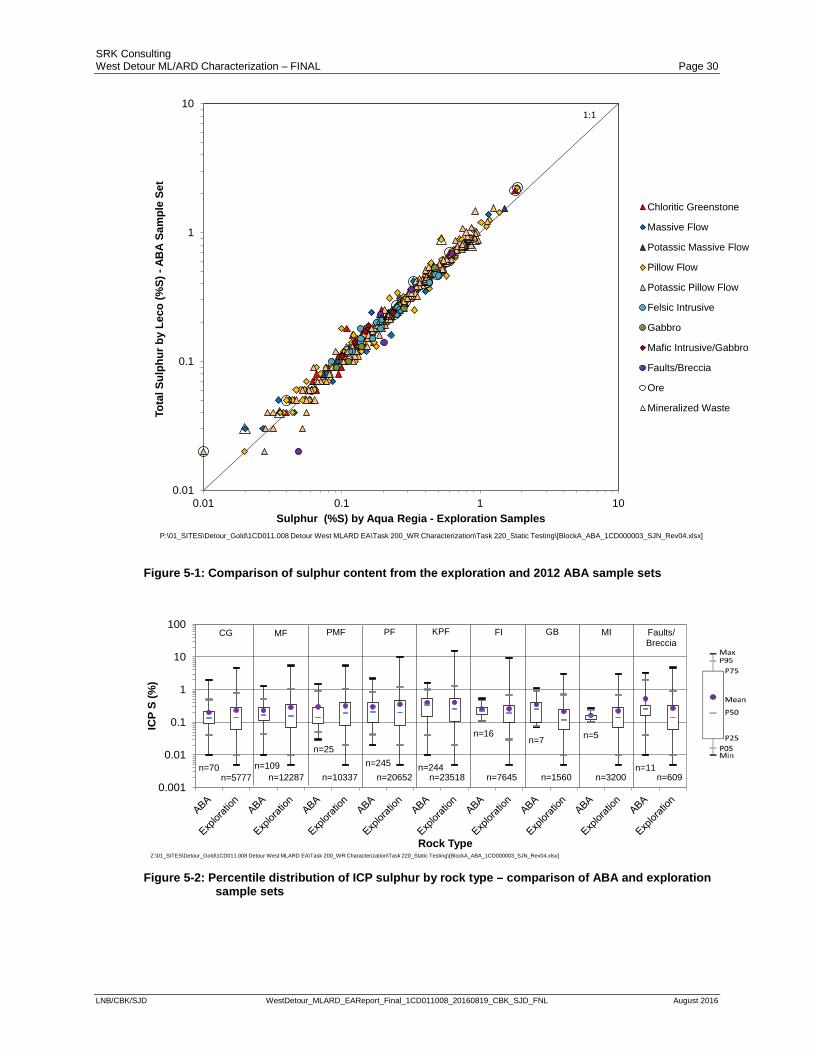
SRK Consulting West Detour ML/ARD Characterization – FINAL Page 30
LNB/CBK/SJD WestDetour_MLARD_EAReport_Final_1CD011008_20160819_CBK_SJD_FNL August 2016
Figure 5-1: Comparison of sulphur content from the exploration and 2012 ABA sample sets
Figure 5-2: Percentile distribution of ICP sulphur by rock type – comparison of ABA and exploration
sample sets
0.01
0.1
1
10
0.01 0.1 1 10
Tota
l Sul
phur
by
Leco
(%S)
-AB
A Sa
mpl
e Se
t
Sulphur (%S) by Aqua Regia - Exploration Samples
Chloritic Greenstone
Massive Flow
Potassic Massive Flow
Pillow Flow
Potassic Pillow Flow
Felsic Intrusive
Gabbro
Mafic Intrusive/Gabbro
Faults/Breccia
Ore
Mineralized Waste
P:\01_SITES\Detour_Gold\1CD011.008 Detour West MLARD EA\Task 200_WR Characterization\Task 220_Static Testing\[BlockA_ABA_1CD000003_SJN_Rev04.xlsx]
1:1
n=70n=5777
n=109n=12287
n=25
n=10337n=245
n=20652n=244
n=23518
n=16
n=7645
n=7
n=1560
n=5
n=3200n=11
n=6090.001
0.01
0.1
1
10
100
ICP
S (%
)
Rock TypeZ:\01_SITES\Detour_Gold\1CD011.008 Detour West MLARD EA\Task 200_WR Characterization\Task 220_Static Testing\[BlockA_ABA_1CD000003_SJN_Rev04.xlsx]
Faults/Breccia
MF PMF PF KPF FI GB MICG
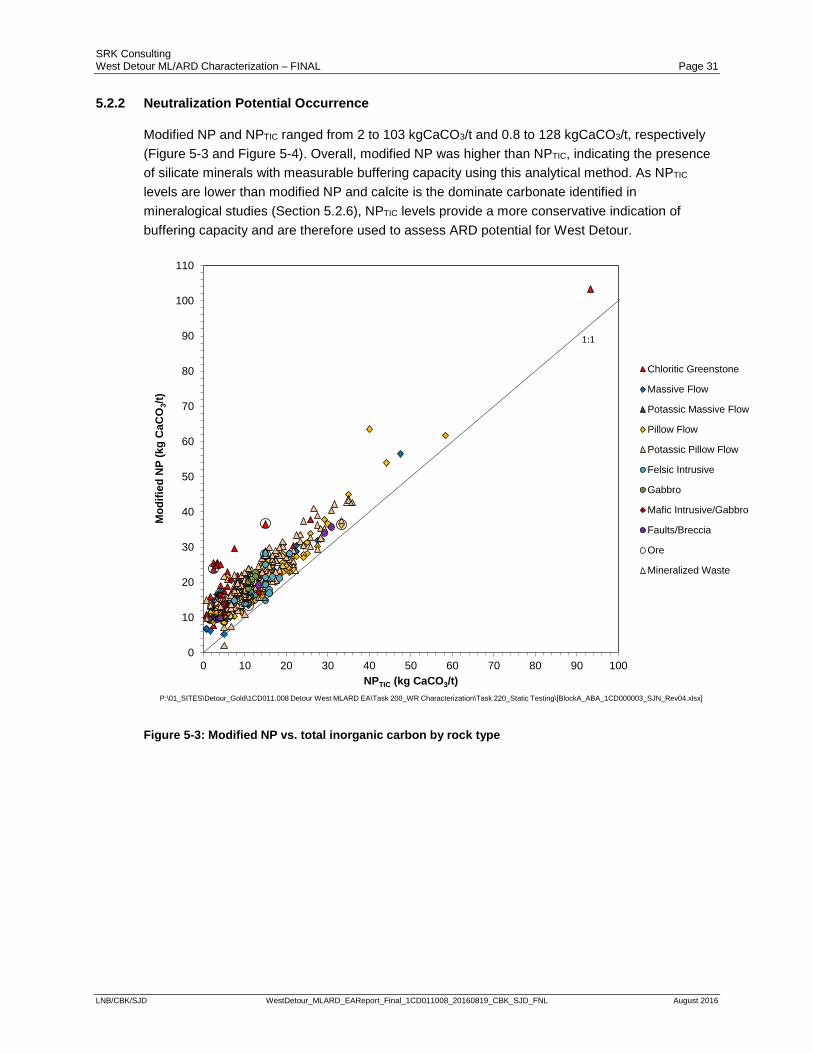
SRK Consulting West Detour ML/ARD Characterization – FINAL Page 31
LNB/CBK/SJD WestDetour_MLARD_EAReport_Final_1CD011008_20160819_CBK_SJD_FNL August 2016
5.2.2 Neutralization Potential Occurrence
Modified NP and NPTIC ranged from 2 to 103 kgCaCO3/t and 0.8 to 128 kgCaCO3/t, respectively (Figure 5-3 and Figure 5-4). Overall, modified NP was higher than NPTIC, indicating the presence of silicate minerals with measurable buffering capacity using this analytical method. As NPTIC levels are lower than modified NP and calcite is the dominate carbonate identified in mineralogical studies (Section 5.2.6), NPTIC levels provide a more conservative indication of buffering capacity and are therefore used to assess ARD potential for West Detour.
Figure 5-3: Modified NP vs. total inorganic carbon by rock type
0
10
20
30
40
50
60
70
80
90
100
110
0 10 20 30 40 50 60 70 80 90 100
Mod
ified
NP
(kg
CaC
O3/t
)
NPTIC (kg CaCO3/t)
Chloritic Greenstone
Massive Flow
Potassic Massive Flow
Pillow Flow
Potassic Pillow Flow
Felsic Intrusive
Gabbro
Mafic Intrusive/Gabbro
Faults/Breccia
Ore
Mineralized Waste
P:\01_SITES\Detour_Gold\1CD011.008 Detour West MLARD EA\Task 200_WR Characterization\Task 220_Static Testing\[BlockA_ABA_1CD000003_SJN_Rev04.xlsx]
1:1
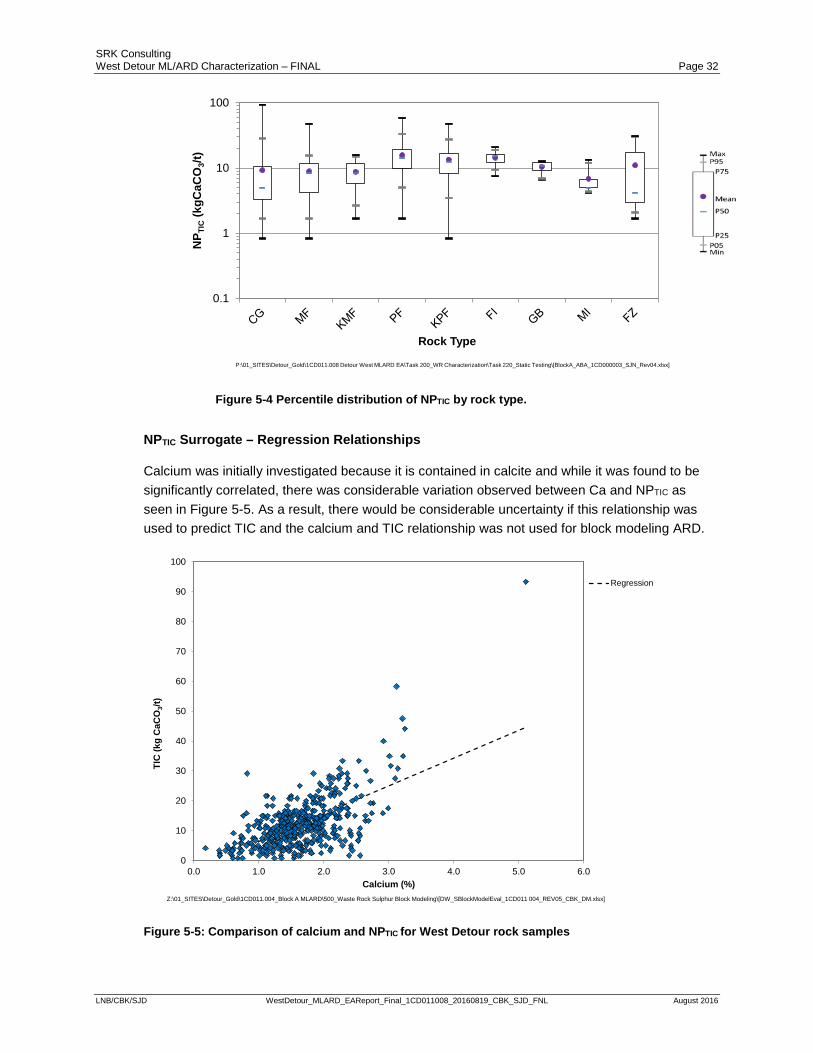
SRK Consulting West Detour ML/ARD Characterization – FINAL Page 32
LNB/CBK/SJD WestDetour_MLARD_EAReport_Final_1CD011008_20160819_CBK_SJD_FNL August 2016
Figure 5-4 Percentile distribution of NPTIC by rock type.
NPTIC Surrogate – Regression Relationships
Calcium was initially investigated because it is contained in calcite and while it was found to be significantly correlated, there was considerable variation observed between Ca and NPTIC as seen in Figure 5-5. As a result, there would be considerable uncertainty if this relationship was used to predict TIC and the calcium and TIC relationship was not used for block modeling ARD.
Figure 5-5: Comparison of calcium and NPTIC for West Detour rock samples
0.1
1
10
100
NP T
IC(k
gCaC
O3/t
)
Rock Type
P:\01_SITES\Detour_Gold\1CD011.008 Detour West MLARD EA\Task 200_WR Characterization\Task 220_Static Testing\[BlockA_ABA_1CD000003_SJN_Rev04.xlsx]
0
10
20
30
40
50
60
70
80
90
100
0.0 1.0 2.0 3.0 4.0 5.0 6.0
TIC
(kg
CaC
O3/t
)
Calcium (%)
Regression
Z:\01_SITES\Detour_Gold\1CD011.004_Block A MLARD\500_Waste Rock Sulphur Block Modeling\[DW_SBlockModelEval_1CD011 004_REV05_CBK_DM.xlsx]
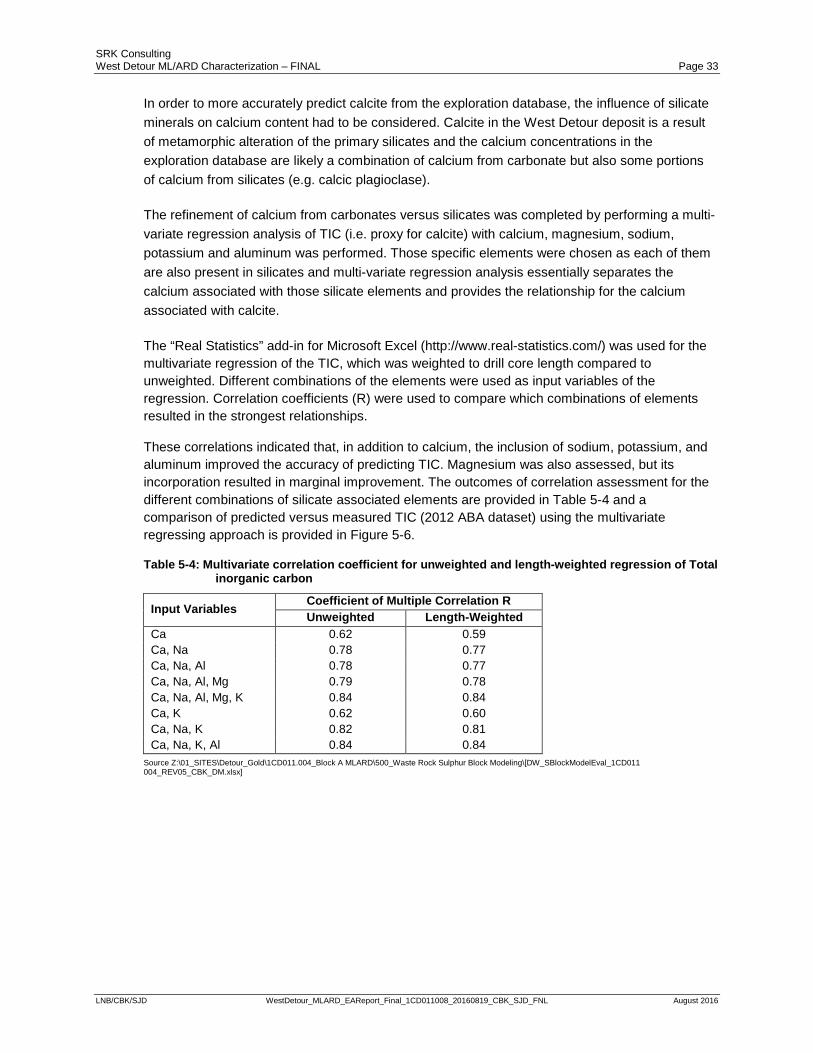
SRK Consulting West Detour ML/ARD Characterization – FINAL Page 33
LNB/CBK/SJD WestDetour_MLARD_EAReport_Final_1CD011008_20160819_CBK_SJD_FNL August 2016
In order to more accurately predict calcite from the exploration database, the influence of silicate minerals on calcium content had to be considered. Calcite in the West Detour deposit is a result of metamorphic alteration of the primary silicates and the calcium concentrations in the exploration database are likely a combination of calcium from carbonate but also some portions of calcium from silicates (e.g. calcic plagioclase).
The refinement of calcium from carbonates versus silicates was completed by performing a multi-variate regression analysis of TIC (i.e. proxy for calcite) with calcium, magnesium, sodium, potassium and aluminum was performed. Those specific elements were chosen as each of them are also present in silicates and multi-variate regression analysis essentially separates the calcium associated with those silicate elements and provides the relationship for the calcium associated with calcite.
The “Real Statistics” add-in for Microsoft Excel (http://www.real-statistics.com/) was used for the multivariate regression of the TIC, which was weighted to drill core length compared to unweighted. Different combinations of the elements were used as input variables of the regression. Correlation coefficients (R) were used to compare which combinations of elements resulted in the strongest relationships.
These correlations indicated that, in addition to calcium, the inclusion of sodium, potassium, and aluminum improved the accuracy of predicting TIC. Magnesium was also assessed, but its incorporation resulted in marginal improvement. The outcomes of correlation assessment for the different combinations of silicate associated elements are provided in Table 5-4 and a comparison of predicted versus measured TIC (2012 ABA dataset) using the multivariate regressing approach is provided in Figure 5-6.
Table 5-4: Multivariate correlation coefficient for unweighted and length-weighted regression of Total inorganic carbon
Input Variables Coefficient of Multiple Correlation R Unweighted Length-Weighted
Ca 0.62 0.59 Ca, Na 0.78 0.77 Ca, Na, Al 0.78 0.77 Ca, Na, Al, Mg 0.79 0.78 Ca, Na, Al, Mg, K 0.84 0.84 Ca, K 0.62 0.60 Ca, Na, K 0.82 0.81 Ca, Na, K, Al 0.84 0.84
Source Z:\01_SITES\Detour_Gold\1CD011.004_Block A MLARD\500_Waste Rock Sulphur Block Modeling\[DW_SBlockModelEval_1CD011 004_REV05_CBK_DM.xlsx]
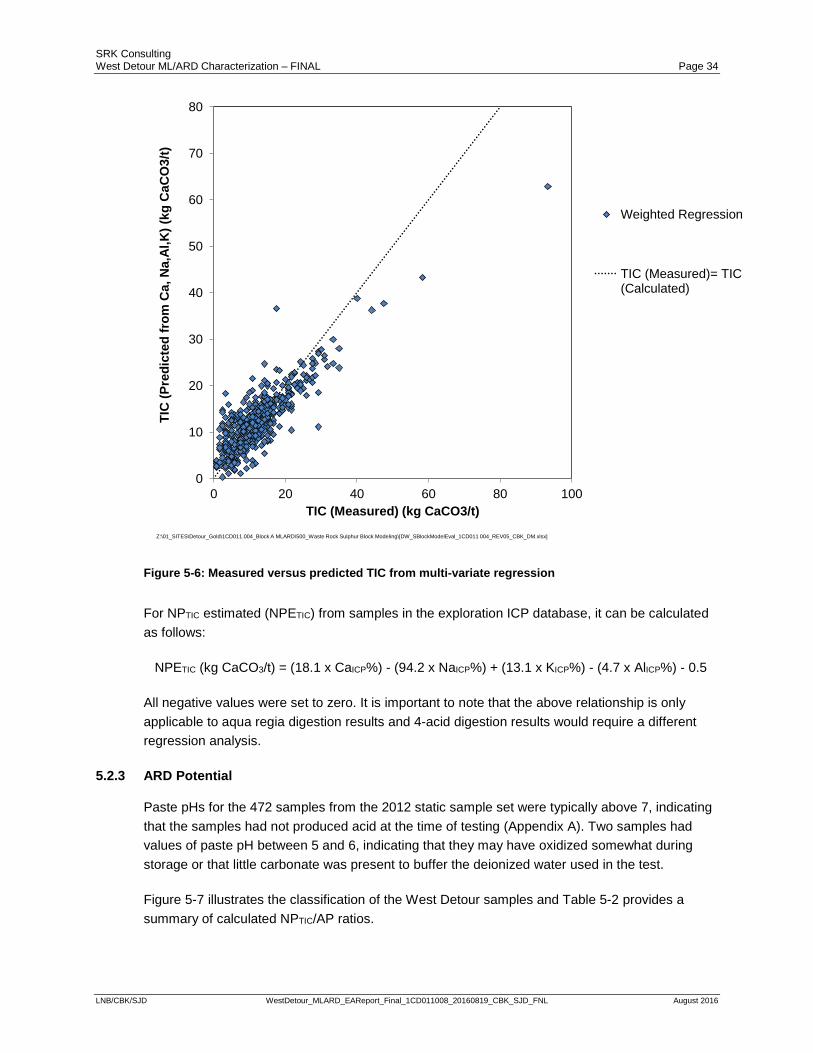
SRK Consulting West Detour ML/ARD Characterization – FINAL Page 34
LNB/CBK/SJD WestDetour_MLARD_EAReport_Final_1CD011008_20160819_CBK_SJD_FNL August 2016
Figure 5-6: Measured versus predicted TIC from multi-variate regression
For NPTIC estimated (NPETIC) from samples in the exploration ICP database, it can be calculated as follows:
NPETIC (kg CaCO3/t) = (18.1 x CaICP%) - (94.2 x NaICP%) + (13.1 x KICP%) - (4.7 x AlICP%) - 0.5
All negative values were set to zero. It is important to note that the above relationship is only applicable to aqua regia digestion results and 4-acid digestion results would require a different regression analysis.
5.2.3 ARD Potential
Paste pHs for the 472 samples from the 2012 static sample set were typically above 7, indicating that the samples had not produced acid at the time of testing (Appendix A). Two samples had values of paste pH between 5 and 6, indicating that they may have oxidized somewhat during storage or that little carbonate was present to buffer the deionized water used in the test.
Figure 5-7 illustrates the classification of the West Detour samples and Table 5-2 provides a summary of calculated NPTIC/AP ratios.
0
10
20
30
40
50
60
70
80
0 20 40 60 80 100
TIC
(Pre
dict
ed fr
om C
a, N
a,Al
,K) (
kg C
aCO
3/t)
TIC (Measured) (kg CaCO3/t)
Weighted Regression
TIC (Measured)= TIC(Calculated)
Z:\01_SITES\Detour_Gold\1CD011.004_Block A MLARD\500_Waste Rock Sulphur Block Modeling\[DW_SBlockModelEval_1CD011 004_REV05_CBK_DM.xlsx]
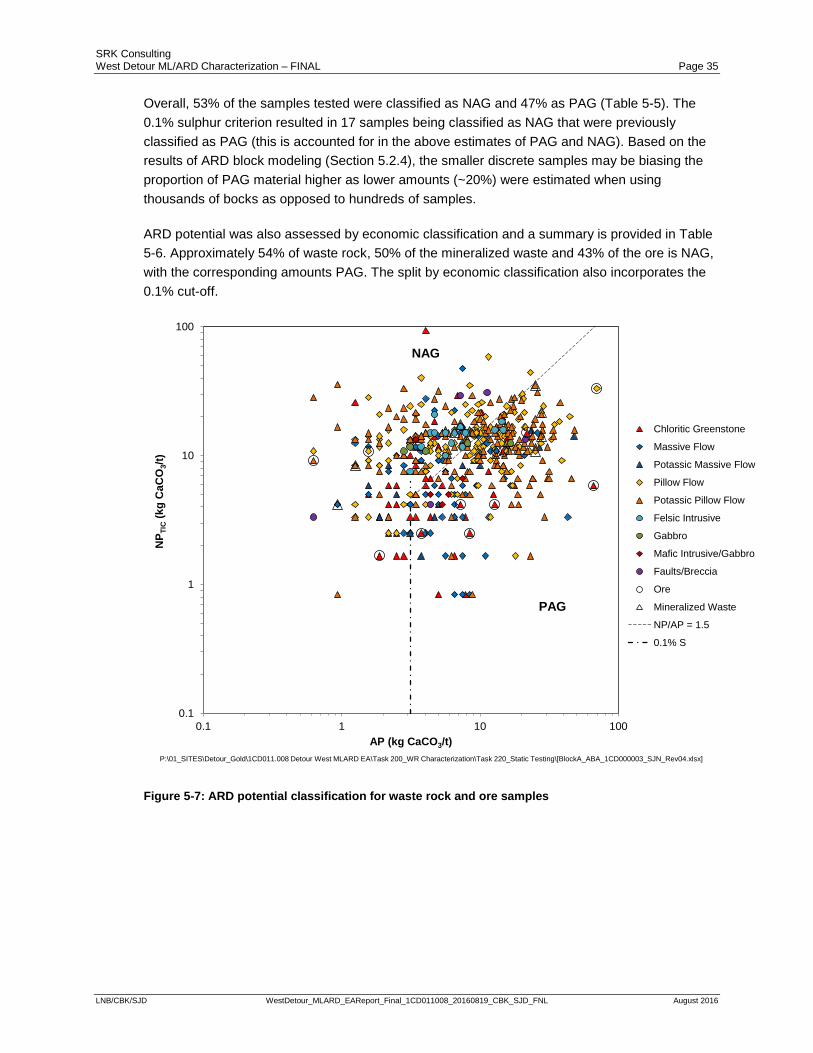
SRK Consulting West Detour ML/ARD Characterization – FINAL Page 35
LNB/CBK/SJD WestDetour_MLARD_EAReport_Final_1CD011008_20160819_CBK_SJD_FNL August 2016
Overall, 53% of the samples tested were classified as NAG and 47% as PAG (Table 5-5). The 0.1% sulphur criterion resulted in 17 samples being classified as NAG that were previously classified as PAG (this is accounted for in the above estimates of PAG and NAG). Based on the results of ARD block modeling (Section 5.2.4), the smaller discrete samples may be biasing the proportion of PAG material higher as lower amounts (~20%) were estimated when using thousands of bocks as opposed to hundreds of samples.
ARD potential was also assessed by economic classification and a summary is provided in Table 5-6. Approximately 54% of waste rock, 50% of the mineralized waste and 43% of the ore is NAG, with the corresponding amounts PAG. The split by economic classification also incorporates the 0.1% cut-off.
Figure 5-7: ARD potential classification for waste rock and ore samples
0.1
1
10
100
0.1 1 10 100
NP T
IC(k
g C
aCO
3/t)
AP (kg CaCO3/t)
Chloritic Greenstone
Massive Flow
Potassic Massive Flow
Pillow Flow
Potassic Pillow Flow
Felsic Intrusive
Gabbro
Mafic Intrusive/Gabbro
Faults/Breccia
Ore
Mineralized Waste
NP/AP = 1.5
0.1% S
P:\01_SITES\Detour_Gold\1CD011.008 Detour West MLARD EA\Task 200_WR Characterization\Task 220_Static Testing\[BlockA_ABA_1CD000003_SJN_Rev04.xlsx]
PAG
NAG
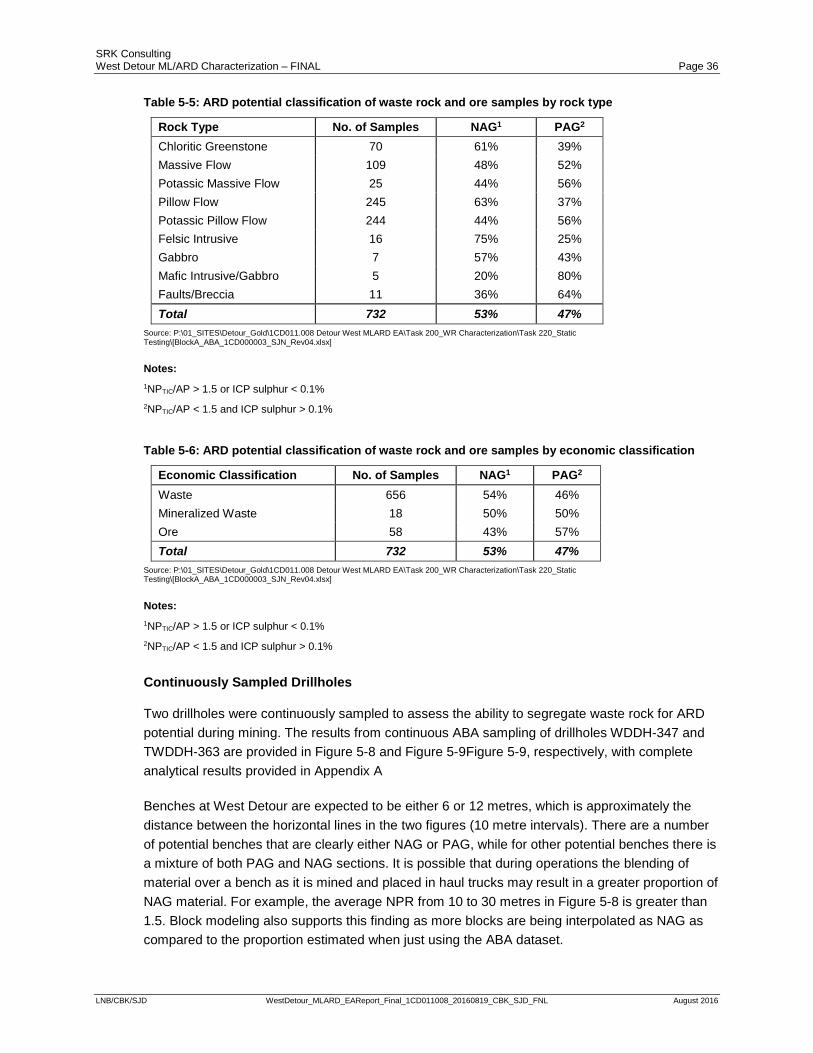
SRK Consulting West Detour ML/ARD Characterization – FINAL Page 36
LNB/CBK/SJD WestDetour_MLARD_EAReport_Final_1CD011008_20160819_CBK_SJD_FNL August 2016
Table 5-5: ARD potential classification of waste rock and ore samples by rock type
Rock Type No. of Samples NAG1 PAG2 Chloritic Greenstone 70 61% 39% Massive Flow 109 48% 52% Potassic Massive Flow 25 44% 56% Pillow Flow 245 63% 37% Potassic Pillow Flow 244 44% 56% Felsic Intrusive 16 75% 25% Gabbro 7 57% 43% Mafic Intrusive/Gabbro 5 20% 80% Faults/Breccia 11 36% 64% Total 732 53% 47%
Source: P:\01_SITES\Detour_Gold\1CD011.008 Detour West MLARD EA\Task 200_WR Characterization\Task 220_Static Testing\[BlockA_ABA_1CD000003_SJN_Rev04.xlsx]
Notes: 1NPTIC/AP > 1.5 or ICP sulphur < 0.1% 2NPTIC/AP < 1.5 and ICP sulphur > 0.1%
Table 5-6: ARD potential classification of waste rock and ore samples by economic classification
Economic Classification No. of Samples NAG1 PAG2 Waste 656 54% 46% Mineralized Waste 18 50% 50% Ore 58 43% 57% Total 732 53% 47%
Source: P:\01_SITES\Detour_Gold\1CD011.008 Detour West MLARD EA\Task 200_WR Characterization\Task 220_Static Testing\[BlockA_ABA_1CD000003_SJN_Rev04.xlsx]
Notes: 1NPTIC/AP > 1.5 or ICP sulphur < 0.1% 2NPTIC/AP < 1.5 and ICP sulphur > 0.1%
Continuously Sampled Drillholes
Two drillholes were continuously sampled to assess the ability to segregate waste rock for ARD potential during mining. The results from continuous ABA sampling of drillholes WDDH-347 and TWDDH-363 are provided in Figure 5-8 and Figure 5-9Figure 5-9, respectively, with complete analytical results provided in Appendix A
Benches at West Detour are expected to be either 6 or 12 metres, which is approximately the distance between the horizontal lines in the two figures (10 metre intervals). There are a number of potential benches that are clearly either NAG or PAG, while for other potential benches there is a mixture of both PAG and NAG sections. It is possible that during operations the blending of material over a bench as it is mined and placed in haul trucks may result in a greater proportion of NAG material. For example, the average NPR from 10 to 30 metres in Figure 5-8 is greater than 1.5. Block modeling also supports this finding as more blocks are being interpolated as NAG as compared to the proportion estimated when just using the ABA dataset.
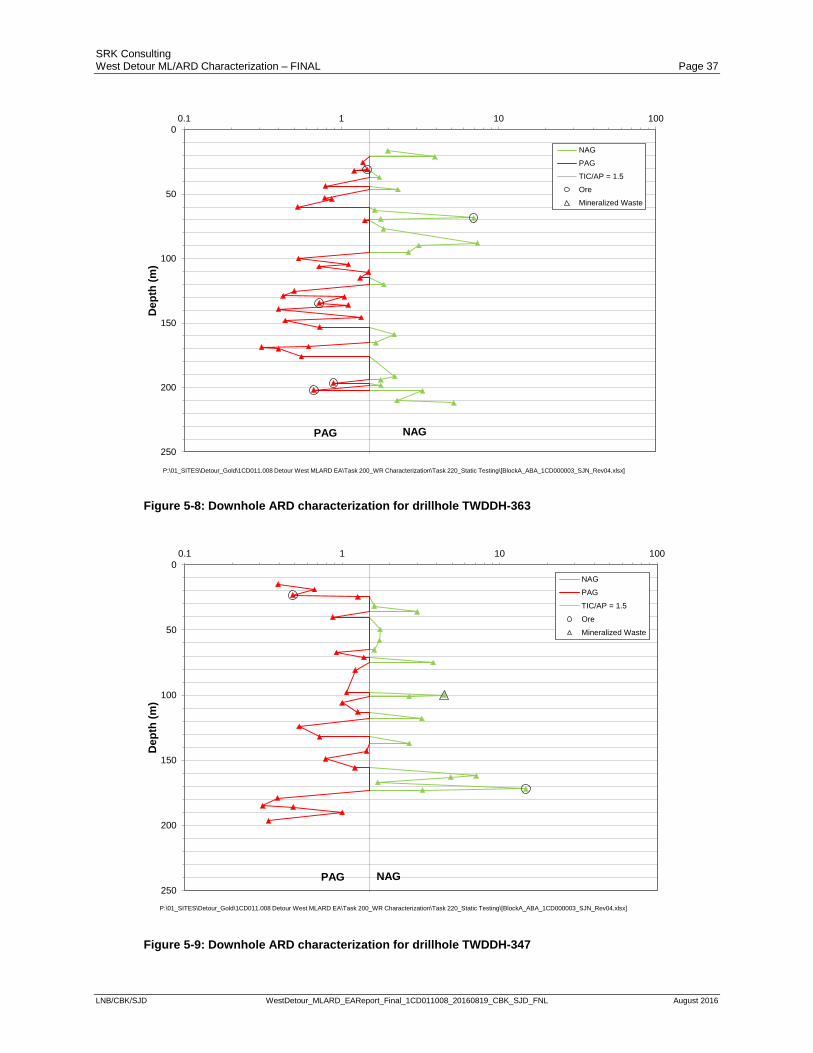
SRK Consulting West Detour ML/ARD Characterization – FINAL Page 37
LNB/CBK/SJD WestDetour_MLARD_EAReport_Final_1CD011008_20160819_CBK_SJD_FNL August 2016
Figure 5-8: Downhole ARD characterization for drillhole TWDDH-363
Figure 5-9: Downhole ARD characterization for drillhole TWDDH-347
0
50
100
150
200
250
0.1 1 10 100
Dep
th (m
)NAG
PAG
TIC/AP = 1.5
Ore
Mineralized Waste
P:\01_SITES\Detour_Gold\1CD011.008 Detour West MLARD EA\Task 200_WR Characterization\Task 220_Static Testing\[BlockA_ABA_1CD000003_SJN_Rev04.xlsx]
PAG NAG
0
50
100
150
200
250
0.1 1 10 100
Dep
th (m
)
NAG
PAG
TIC/AP = 1.5
Ore
Mineralized Waste
P:\01_SITES\Detour_Gold\1CD011.008 Detour West MLARD EA\Task 200_WR Characterization\Task 220_Static Testing\[BlockA_ABA_1CD000003_SJN_Rev04.xlsx]
PAG NAG
SRK Consulting West Detour ML/ARD Characterization – FINAL Page 38
LNB/CBK/SJD WestDetour_MLARD_EAReport_Final_1CD011008_20160819_CBK_SJD_FNL August 2016
5.2.4 ARD Block Modeling
Sulphur and NPTIC statistics were generated from the block model to compare with the ABA dataset. Results are provided in Table 5-7 for waste rock and pit walls. Median sulphur was essentially the same as the ABA dataset at 0.25% sulphur as compared to 0.23%, respectively. NPTIC was estimated to be slightly higher in the ARD block model, with a median of 18 kg CaCO3/t versus 12 CaCO3/t in the ABA dataset.
Table 5-7: Block model sulphur and NPETIC statistics
Location No. of Samples Min* Percentile
Median Mean Percentile
Max* 5th 25th 75th 95th
Waste Rock**
Sulphur (%) 74,566 0.02 0.08 0.14 0.25 0.29 0.39 0.62 2.2 NPETIC 74,566 0.00 8.1 14 18 18 22 30 75 Pit Walls*** Sulphur (%) 48,583 0.02 0.08 0.13 0.24 0.28 0.39 0.62 2.2 NPETIC 48,583 0.00 7.2 13 18 18 23 29 72
Source: Z:\01_SITES\Detour_Gold\1CD011.008 Detour West MLARD EA\Task 200_WR Characterization\Task 240_Sulphur Block Modeling\[Detour_Tables_1CD011.008_DC_rev03.xlsx]
Notes:
*Min=Minimum, Max=Maximum
**Excludes blocks grading > 0.5 g/t gold, within West Detour pit and 25m buffer outside pit
***Within 25m of West Detour pit final walls and including all gold grade blocks.
ARD potential was modeled by first calculating the NPETIC and AP of each block using the regression relationships defined in Section 5.2.1 and Section 5.2.2. The NPETIC/AP ratio was then calculated for each block so that as ARD potential category could be assigned to each block. If any block has a sulphur value of less than 0.1%, it was automatically assigned NAG regardless of the NPTIC/AP ratio. ARD criteria are summarized in Table 5-8.
Table 5-8: ARD block modeling criteria
Category Description NPTIC/AP Range
NAG: non-potentially ARD generating S <0.1% or
NPETIC/AP > 1.5
PAG: potentially ARD generating S ≥ 0.1% and
NPETIC/AP ≤ 1.5
The results of ARD block modeling indicate that 71% of the waste rock and mineralized rock (combined) will be NAG, while 29% will be PAG based on 74,535 blocks. The blocks were selected based on all non-ore rock (gold grade cut-off of 0.5 g/t) and a 25 m buffer around the pit shell to account for potential shifts in the ultimate location of the pit shell. Block modeling is
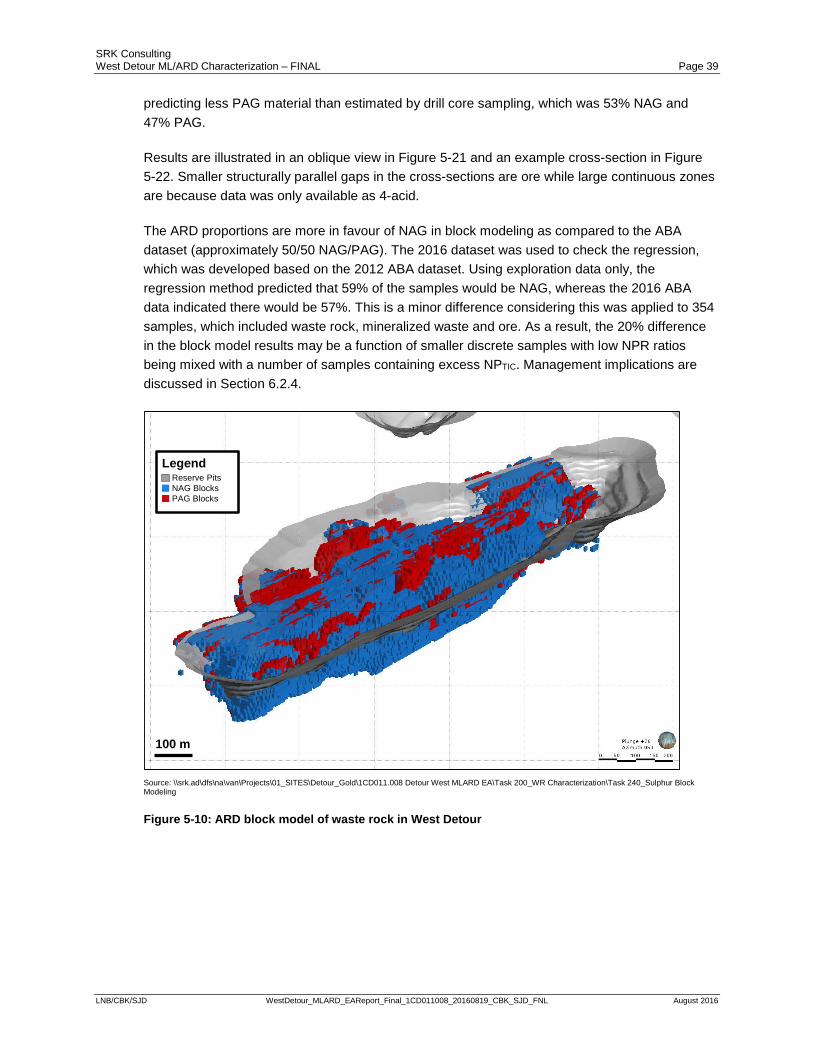
SRK Consulting West Detour ML/ARD Characterization – FINAL Page 39
LNB/CBK/SJD WestDetour_MLARD_EAReport_Final_1CD011008_20160819_CBK_SJD_FNL August 2016
predicting less PAG material than estimated by drill core sampling, which was 53% NAG and 47% PAG.
Results are illustrated in an oblique view in Figure 5-21 and an example cross-section in Figure 5-22. Smaller structurally parallel gaps in the cross-sections are ore while large continuous zones are because data was only available as 4-acid.
The ARD proportions are more in favour of NAG in block modeling as compared to the ABA dataset (approximately 50/50 NAG/PAG). The 2016 dataset was used to check the regression, which was developed based on the 2012 ABA dataset. Using exploration data only, the regression method predicted that 59% of the samples would be NAG, whereas the 2016 ABA data indicated there would be 57%. This is a minor difference considering this was applied to 354 samples, which included waste rock, mineralized waste and ore. As a result, the 20% difference in the block model results may be a function of smaller discrete samples with low NPR ratios being mixed with a number of samples containing excess NPTIC. Management implications are discussed in Section 6.2.4.
Source: \\srk.ad\dfs\na\van\Projects\01_SITES\Detour_Gold\1CD011.008 Detour West MLARD EA\Task 200_WR Characterization\Task 240_Sulphur Block Modeling
Figure 5-10: ARD block model of waste rock in West Detour
Reserve PitsNAG BlocksPAG Blocks
Legend
100 m
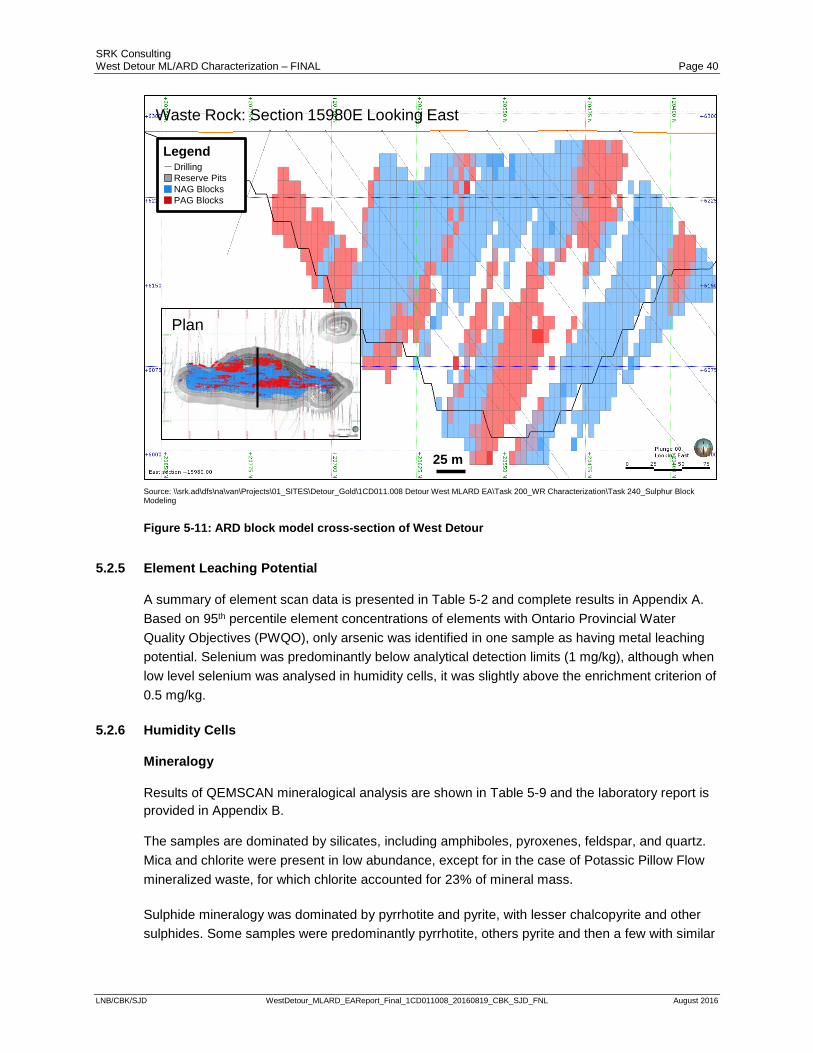
SRK Consulting West Detour ML/ARD Characterization – FINAL Page 40
LNB/CBK/SJD WestDetour_MLARD_EAReport_Final_1CD011008_20160819_CBK_SJD_FNL August 2016
Source: \\srk.ad\dfs\na\van\Projects\01_SITES\Detour_Gold\1CD011.008 Detour West MLARD EA\Task 200_WR Characterization\Task 240_Sulphur Block Modeling
Figure 5-11: ARD block model cross-section of West Detour
5.2.5 Element Leaching Potential
A summary of element scan data is presented in Table 5-2 and complete results in Appendix A. Based on 95th percentile element concentrations of elements with Ontario Provincial Water Quality Objectives (PWQO), only arsenic was identified in one sample as having metal leaching potential. Selenium was predominantly below analytical detection limits (1 mg/kg), although when low level selenium was analysed in humidity cells, it was slightly above the enrichment criterion of 0.5 mg/kg.
5.2.6 Humidity Cells
Mineralogy
Results of QEMSCAN mineralogical analysis are shown in Table 5-9 and the laboratory report is provided in Appendix B.
The samples are dominated by silicates, including amphiboles, pyroxenes, feldspar, and quartz. Mica and chlorite were present in low abundance, except for in the case of Potassic Pillow Flow mineralized waste, for which chlorite accounted for 23% of mineral mass.
Sulphide mineralogy was dominated by pyrrhotite and pyrite, with lesser chalcopyrite and other sulphides. Some samples were predominantly pyrrhotite, others pyrite and then a few with similar
Waste Rock: Section 15980E Looking East
Plan
25 m
DrillingReserve PitsNAG BlocksPAG Blocks
Legend
SRK Consulting West Detour ML/ARD Characterization – FINAL Page 41
LNB/CBK/SJD WestDetour_MLARD_EAReport_Final_1CD011008_20160819_CBK_SJD_FNL August 2016
proportions. The gold mineralized waste sample (HC-33) contained predominantly chalcopyrite. The term ‘other sulphides’ describes sulphide minerals that are present at a low abundance and that could not be differentiated based on composition alone.
One of the duplicates, HC-32, was predominantly pyrite whereas HC-33 was predominantly pyrrhotite. This may indicate that there is a significant amount of heterogeneity in the Pillow Flow material or that the cells were not true duplicates. Re-analysis by the laboratory confirmed a similar chemical composition, but rates of oxidation will be different owing to the reactivity differences between pyrite (slower) and pyrrhotite (faster).
Calcite was the dominant carbonate mineral further supporting that TIC is an appropriate means of estimating carbonate NP (Section 5.2.2). Dolomite was only detected in a trace amount (0.02%) in one sample (HC-33).
Apatite and oxides were detected in trace amounts (under 1%), which includes any iron oxides as QEMSCAN groups them together based on composition.
The degree of mineral exposure (also referred to as liberation) measured by QEMSCAN indicated that both the sulphides and carbonates were well exposed. This can be a useful characteristic to understand as changes in exposure have the potential to affect reactivity of the sulphides or neutralization of the carbonates.
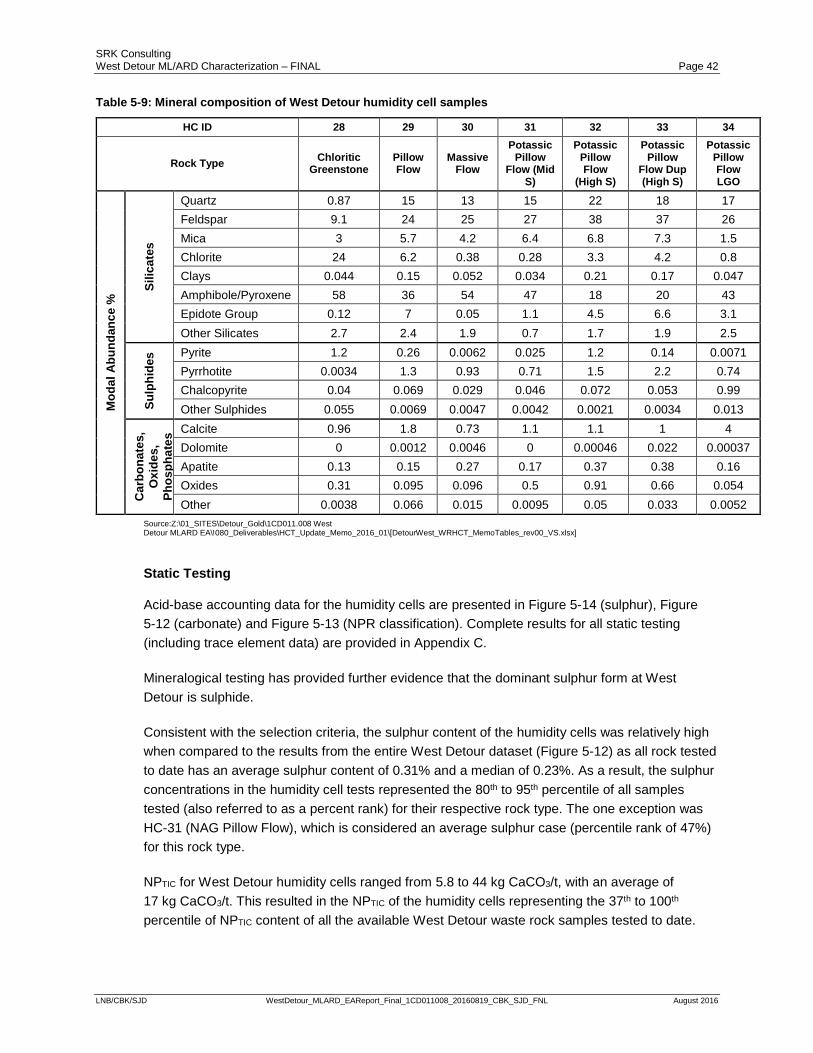
SRK Consulting West Detour ML/ARD Characterization – FINAL Page 42
LNB/CBK/SJD WestDetour_MLARD_EAReport_Final_1CD011008_20160819_CBK_SJD_FNL August 2016
Table 5-9: Mineral composition of West Detour humidity cell samples
HC ID 28 29 30 31 32 33 34
Rock Type Chloritic Greenstone
Pillow Flow
Massive Flow
Potassic Pillow
Flow (Mid S)
Potassic Pillow Flow
(High S)
Potassic Pillow
Flow Dup (High S)
Potassic Pillow Flow LGO
Mod
al A
bund
ance
% Si
licat
es
Quartz 0.87 15 13 15 22 18 17 Feldspar 9.1 24 25 27 38 37 26 Mica 3 5.7 4.2 6.4 6.8 7.3 1.5 Chlorite 24 6.2 0.38 0.28 3.3 4.2 0.8 Clays 0.044 0.15 0.052 0.034 0.21 0.17 0.047 Amphibole/Pyroxene 58 36 54 47 18 20 43 Epidote Group 0.12 7 0.05 1.1 4.5 6.6 3.1 Other Silicates 2.7 2.4 1.9 0.7 1.7 1.9 2.5
Sulp
hide
s Pyrite 1.2 0.26 0.0062 0.025 1.2 0.14 0.0071 Pyrrhotite 0.0034 1.3 0.93 0.71 1.5 2.2 0.74 Chalcopyrite 0.04 0.069 0.029 0.046 0.072 0.053 0.99 Other Sulphides 0.055 0.0069 0.0047 0.0042 0.0021 0.0034 0.013
Car
bona
tes,
O
xide
s,
Phos
phat
es Calcite 0.96 1.8 0.73 1.1 1.1 1 4
Dolomite 0 0.0012 0.0046 0 0.00046 0.022 0.00037 Apatite 0.13 0.15 0.27 0.17 0.37 0.38 0.16 Oxides 0.31 0.095 0.096 0.5 0.91 0.66 0.054 Other 0.0038 0.066 0.015 0.0095 0.05 0.033 0.0052
Source:Z:\01_SITES\Detour_Gold\1CD011.008 West Detour MLARD EA\!080_Deliverables\HCT_Update_Memo_2016_01\[DetourWest_WRHCT_MemoTables_rev00_VS.xlsx]
Static Testing
Acid-base accounting data for the humidity cells are presented in Figure 5-14 (sulphur), Figure 5-12 (carbonate) and Figure 5-13 (NPR classification). Complete results for all static testing (including trace element data) are provided in Appendix C.
Mineralogical testing has provided further evidence that the dominant sulphur form at West Detour is sulphide.
Consistent with the selection criteria, the sulphur content of the humidity cells was relatively high when compared to the results from the entire West Detour dataset (Figure 5-12) as all rock tested to date has an average sulphur content of 0.31% and a median of 0.23%. As a result, the sulphur concentrations in the humidity cell tests represented the 80th to 95th percentile of all samples tested (also referred to as a percent rank) for their respective rock type. The one exception was HC-31 (NAG Pillow Flow), which is considered an average sulphur case (percentile rank of 47%) for this rock type.
NPTIC for West Detour humidity cells ranged from 5.8 to 44 kg CaCO3/t, with an average of 17 kg CaCO3/t. This resulted in the NPTIC of the humidity cells representing the 37th to 100th percentile of NPTIC content of all the available West Detour waste rock samples tested to date.
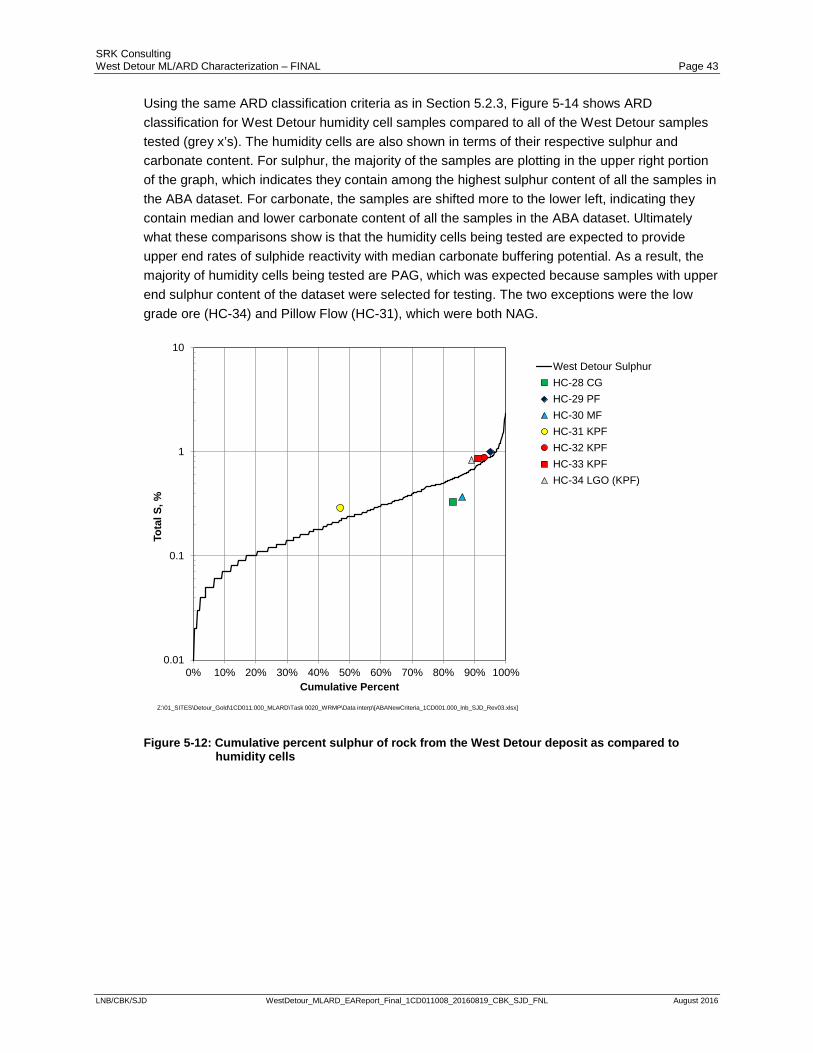
SRK Consulting West Detour ML/ARD Characterization – FINAL Page 43
LNB/CBK/SJD WestDetour_MLARD_EAReport_Final_1CD011008_20160819_CBK_SJD_FNL August 2016
Using the same ARD classification criteria as in Section 5.2.3, Figure 5-14 shows ARD classification for West Detour humidity cell samples compared to all of the West Detour samples tested (grey x’s). The humidity cells are also shown in terms of their respective sulphur and carbonate content. For sulphur, the majority of the samples are plotting in the upper right portion of the graph, which indicates they contain among the highest sulphur content of all the samples in the ABA dataset. For carbonate, the samples are shifted more to the lower left, indicating they contain median and lower carbonate content of all the samples in the ABA dataset. Ultimately what these comparisons show is that the humidity cells being tested are expected to provide upper end rates of sulphide reactivity with median carbonate buffering potential. As a result, the majority of humidity cells being tested are PAG, which was expected because samples with upper end sulphur content of the dataset were selected for testing. The two exceptions were the low grade ore (HC-34) and Pillow Flow (HC-31), which were both NAG.
Figure 5-12: Cumulative percent sulphur of rock from the West Detour deposit as compared to humidity cells
0.01
0.1
1
10
0% 10% 20% 30% 40% 50% 60% 70% 80% 90% 100%
Tota
l S, %
Cumulative Percent
West Detour SulphurHC-28 CGHC-29 PFHC-30 MFHC-31 KPFHC-32 KPFHC-33 KPFHC-34 LGO (KPF)
Z:\01_SITES\Detour_Gold\1CD011.000_MLARD\Task 0020_WRMP\Data interp\[ABANewCriteria_1CD001.000_lnb_SJD_Rev03.xlsx]
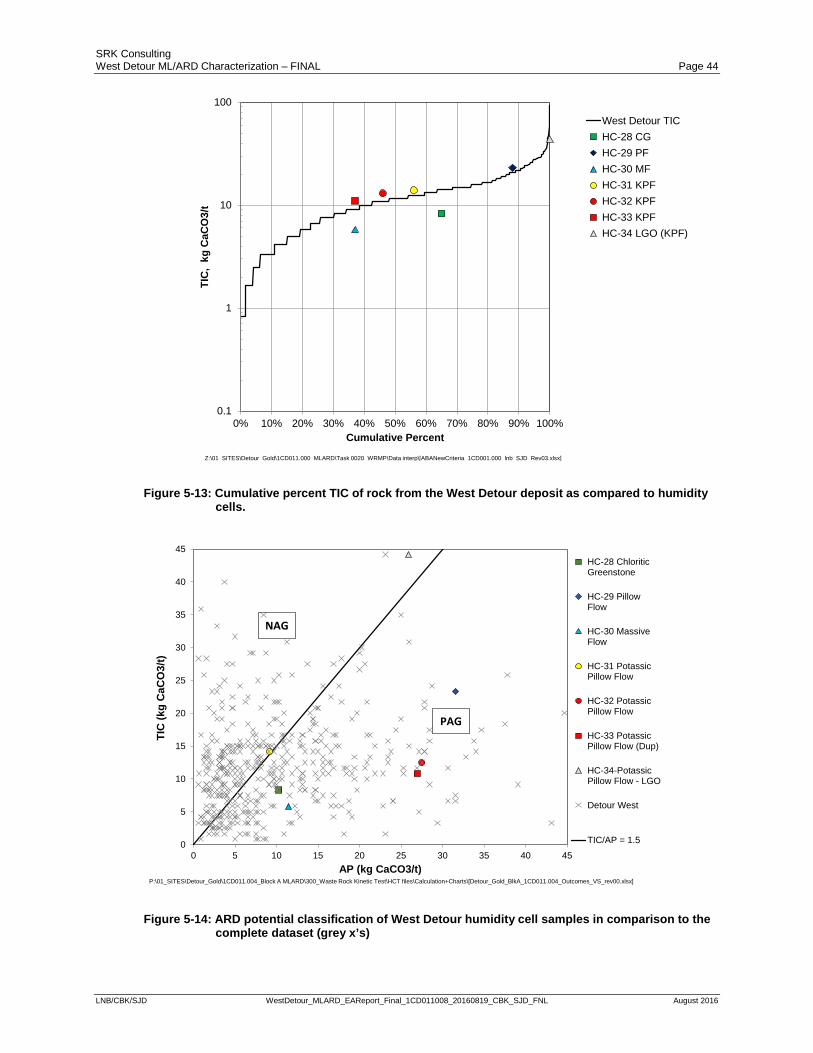
SRK Consulting West Detour ML/ARD Characterization – FINAL Page 44
LNB/CBK/SJD WestDetour_MLARD_EAReport_Final_1CD011008_20160819_CBK_SJD_FNL August 2016
Figure 5-13: Cumulative percent TIC of rock from the West Detour deposit as compared to humidity cells.
Figure 5-14: ARD potential classification of West Detour humidity cell samples in comparison to the complete dataset (grey x’s)
0.1
1
10
100
0% 10% 20% 30% 40% 50% 60% 70% 80% 90% 100%
TIC
, kg
CaC
O3/
t
Cumulative Percent
West Detour TICHC-28 CGHC-29 PFHC-30 MFHC-31 KPFHC-32 KPFHC-33 KPFHC-34 LGO (KPF)
Z:\01_SITES\Detour_Gold\1CD011.000_MLARD\Task 0020_WRMP\Data interp\[ABANewCriteria_1CD001.000_lnb_SJD_Rev03.xlsx]
0
5
10
15
20
25
30
35
40
45
0 5 10 15 20 25 30 35 40 45
TIC
(kg
CaC
O3/
t)
AP (kg CaCO3/t)
HC-28 ChloriticGreenstone
HC-29 PillowFlow
HC-30 MassiveFlow
HC-31 PotassicPillow Flow
HC-32 PotassicPillow Flow
HC-33 PotassicPillow Flow (Dup)
HC-34-PotassicPillow Flow - LGO
Detour West
TIC/AP = 1.5
P:\01_SITES\Detour_Gold\1CD011.004_Block A MLARD\300_Waste Rock Kinetic Test\HCT files\Calculation+Charts\[Detour_Gold_BlkA_1CD011.004_Outcomes_VS_rev00.xlsx]
PAG
NAG
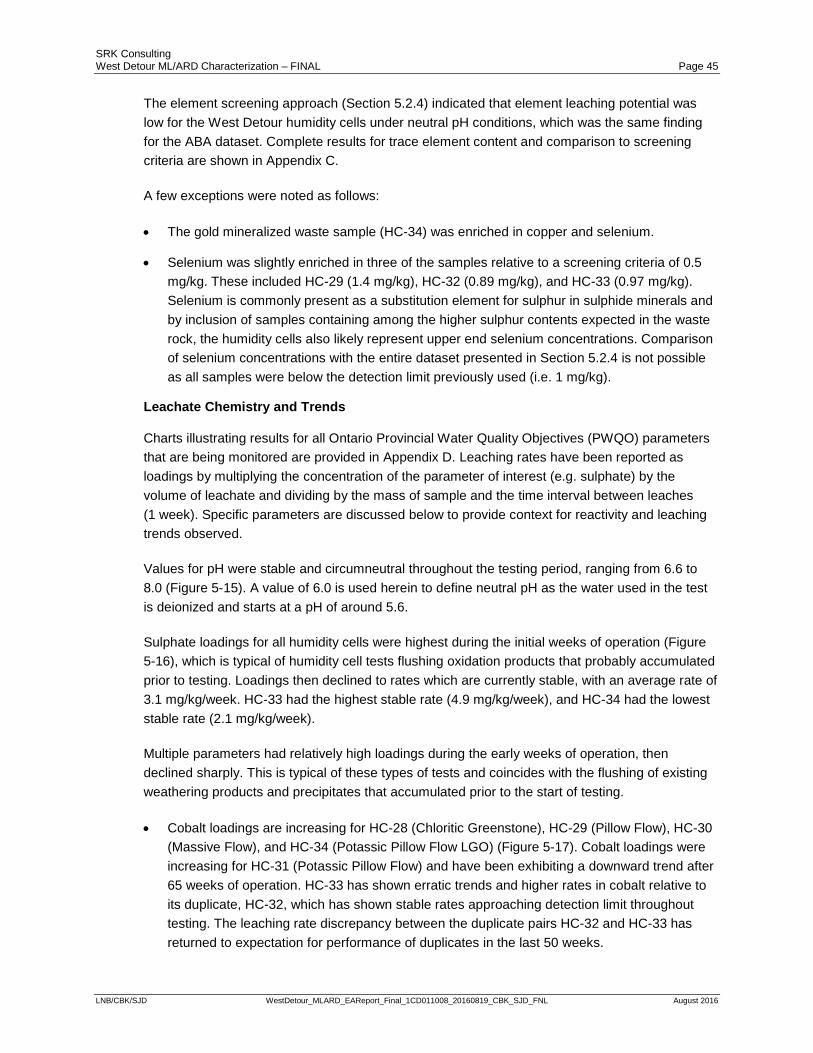
SRK Consulting West Detour ML/ARD Characterization – FINAL Page 45
LNB/CBK/SJD WestDetour_MLARD_EAReport_Final_1CD011008_20160819_CBK_SJD_FNL August 2016
The element screening approach (Section 5.2.4) indicated that element leaching potential was low for the West Detour humidity cells under neutral pH conditions, which was the same finding for the ABA dataset. Complete results for trace element content and comparison to screening criteria are shown in Appendix C.
A few exceptions were noted as follows:
• The gold mineralized waste sample (HC-34) was enriched in copper and selenium.
• Selenium was slightly enriched in three of the samples relative to a screening criteria of 0.5 mg/kg. These included HC-29 (1.4 mg/kg), HC-32 (0.89 mg/kg), and HC-33 (0.97 mg/kg). Selenium is commonly present as a substitution element for sulphur in sulphide minerals and by inclusion of samples containing among the higher sulphur contents expected in the waste rock, the humidity cells also likely represent upper end selenium concentrations. Comparison of selenium concentrations with the entire dataset presented in Section 5.2.4 is not possible as all samples were below the detection limit previously used (i.e. 1 mg/kg).
Leachate Chemistry and Trends
Charts illustrating results for all Ontario Provincial Water Quality Objectives (PWQO) parameters that are being monitored are provided in Appendix D. Leaching rates have been reported as loadings by multiplying the concentration of the parameter of interest (e.g. sulphate) by the volume of leachate and dividing by the mass of sample and the time interval between leaches (1 week). Specific parameters are discussed below to provide context for reactivity and leaching trends observed.
Values for pH were stable and circumneutral throughout the testing period, ranging from 6.6 to 8.0 (Figure 5-15). A value of 6.0 is used herein to define neutral pH as the water used in the test is deionized and starts at a pH of around 5.6.
Sulphate loadings for all humidity cells were highest during the initial weeks of operation (Figure 5-16), which is typical of humidity cell tests flushing oxidation products that probably accumulated prior to testing. Loadings then declined to rates which are currently stable, with an average rate of 3.1 mg/kg/week. HC-33 had the highest stable rate (4.9 mg/kg/week), and HC-34 had the lowest stable rate (2.1 mg/kg/week).
Multiple parameters had relatively high loadings during the early weeks of operation, then declined sharply. This is typical of these types of tests and coincides with the flushing of existing weathering products and precipitates that accumulated prior to the start of testing.
• Cobalt loadings are increasing for HC-28 (Chloritic Greenstone), HC-29 (Pillow Flow), HC-30 (Massive Flow), and HC-34 (Potassic Pillow Flow LGO) (Figure 5-17). Cobalt loadings were increasing for HC-31 (Potassic Pillow Flow) and have been exhibiting a downward trend after 65 weeks of operation. HC-33 has shown erratic trends and higher rates in cobalt relative to its duplicate, HC-32, which has shown stable rates approaching detection limit throughout testing. The leaching rate discrepancy between the duplicate pairs HC-32 and HC-33 has returned to expectation for performance of duplicates in the last 50 weeks.
SRK Consulting West Detour ML/ARD Characterization – FINAL Page 46
LNB/CBK/SJD WestDetour_MLARD_EAReport_Final_1CD011008_20160819_CBK_SJD_FNL August 2016
• Copper loadings were low (with concentrations approaching detection limits during trace element analysis) for all humidity cells except for the Chloritic Greenstone sample (HC-28), which began to display increasing trends after 25 weeks of operation, just after the pH dropped below 7.0 (Figure 5-18), but stabilized after approximately 62 weeks.
• Nickel is leaching at low levels (at detection limits) for the majority of tests except for the Chloritic Greenstone sample (HC-28), which began increasing around the same time as copper, and may have stabilized after approximately 80 week. The increase coincides with the time at which pH dropped below 7.0 (Figure 5-19).
• Selenium loadings for the majority of humidity cells were highest during the initial weeks of operation (Figure 5-20), similar to sulphate loadings and typical of humidity cell tests flushing oxidation products that accumulated prior to testing. Loadings then became stable and some are slowly declining, with an average stable rate of 0.0001 mg/kg/week. HC-33 and HC-34 have the highest stable rates (around 0.0002 mg/kg/week), whereas HC-30 had the lowest stable rate near detection limits (0.00003 mg/kg/week). Exceptions to the above trends are HC-28 (Chloritic Greenstone) and HC-31 (Potassic Pillow Flow), which are slowly increasing, although their stable rates are lower than the overall average rate. On-going monitoring will help refine long term leaching rate expectations.
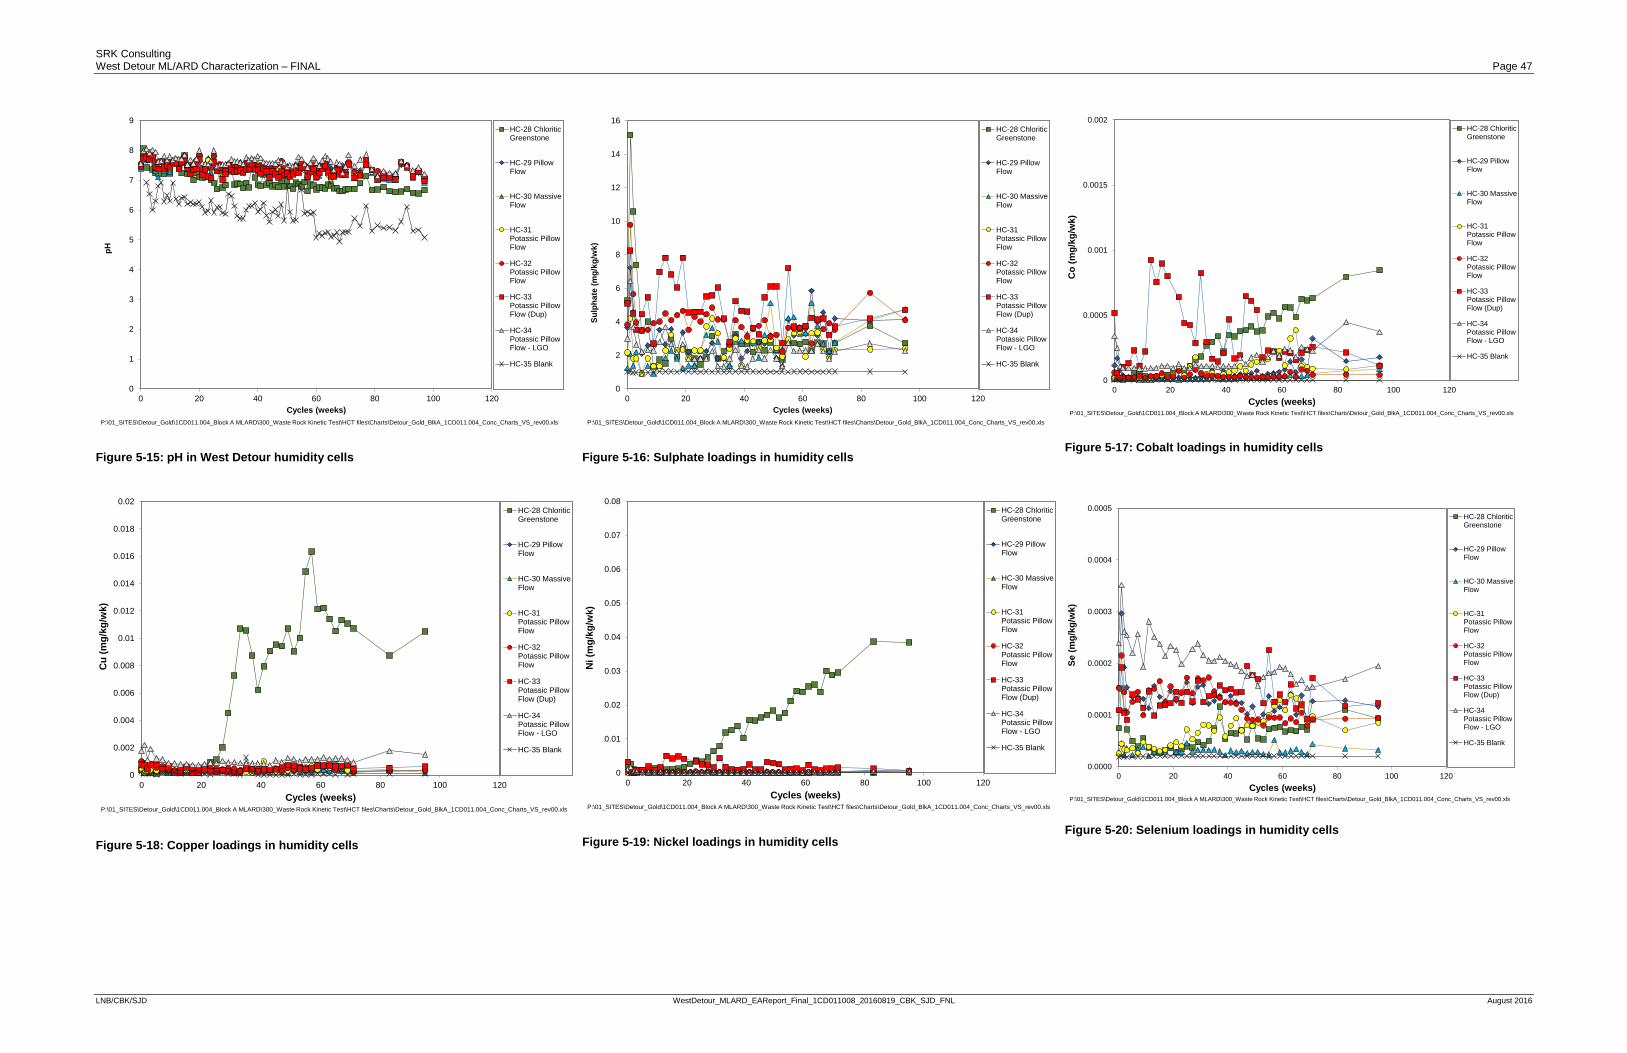
SRK Consulting West Detour ML/ARD Characterization – FINAL Page 47
LNB/CBK/SJD WestDetour_MLARD_EAReport_Final_1CD011008_20160819_CBK_SJD_FNL August 2016
Figure 5-15: pH in West Detour humidity cells
Figure 5-16: Sulphate loadings in humidity cells
Figure 5-17: Cobalt loadings in humidity cells
Figure 5-18: Copper loadings in humidity cells
Figure 5-19: Nickel loadings in humidity cells
Figure 5-20: Selenium loadings in humidity cells
0
1
2
3
4
5
6
7
8
9
0 20 40 60 80 100 120
pH
Cycles (weeks)
HC-28 ChloriticGreenstone
HC-29 PillowFlow
HC-30 MassiveFlow
HC-31Potassic PillowFlow
HC-32Potassic PillowFlow
HC-33Potassic PillowFlow (Dup)
HC-34Potassic PillowFlow - LGO
HC-35 Blank
P:\01_SITES\Detour_Gold\1CD011.004_Block A MLARD\300_Waste Rock Kinetic Test\HCT files\Charts\Detour_Gold_BlkA_1CD011.004_Conc_Charts_VS_rev00.xls
0
2
4
6
8
10
12
14
16
0 20 40 60 80 100 120
Sulp
hate
(mg/
kg/w
k)
Cycles (weeks)
HC-28 ChloriticGreenstone
HC-29 PillowFlow
HC-30 MassiveFlow
HC-31Potassic PillowFlow
HC-32Potassic PillowFlow
HC-33Potassic PillowFlow (Dup)
HC-34Potassic PillowFlow - LGO
HC-35 Blank
P:\01_SITES\Detour_Gold\1CD011.004_Block A MLARD\300_Waste Rock Kinetic Test\HCT files\Charts\Detour_Gold_BlkA_1CD011.004_Conc_Charts_VS_rev00.xls
0
0.0005
0.001
0.0015
0.002
0 20 40 60 80 100 120
Co
(mg/
kg/w
k)
Cycles (weeks)
HC-28 ChloriticGreenstone
HC-29 PillowFlow
HC-30 MassiveFlow
HC-31Potassic PillowFlow
HC-32Potassic PillowFlow
HC-33Potassic PillowFlow (Dup)
HC-34Potassic PillowFlow - LGO
HC-35 Blank
P:\01_SITES\Detour_Gold\1CD011.004_Block A MLARD\300_Waste Rock Kinetic Test\HCT files\Charts\Detour_Gold_BlkA_1CD011.004_Conc_Charts_VS_rev00.xls
0
0.002
0.004
0.006
0.008
0.01
0.012
0.014
0.016
0.018
0.02
0 20 40 60 80 100 120
Cu
(mg/
kg/w
k)
Cycles (weeks)
HC-28 ChloriticGreenstone
HC-29 PillowFlow
HC-30 MassiveFlow
HC-31Potassic PillowFlow
HC-32Potassic PillowFlow
HC-33Potassic PillowFlow (Dup)
HC-34Potassic PillowFlow - LGO
HC-35 Blank
P:\01_SITES\Detour_Gold\1CD011.004_Block A MLARD\300_Waste Rock Kinetic Test\HCT files\Charts\Detour_Gold_BlkA_1CD011.004_Conc_Charts_VS_rev00.xls
0
0.01
0.02
0.03
0.04
0.05
0.06
0.07
0.08
0 20 40 60 80 100 120
Ni (
mg/
kg/w
k)
Cycles (weeks)
HC-28 ChloriticGreenstone
HC-29 PillowFlow
HC-30 MassiveFlow
HC-31Potassic PillowFlow
HC-32Potassic PillowFlow
HC-33Potassic PillowFlow (Dup)
HC-34Potassic PillowFlow - LGO
HC-35 Blank
P:\01_SITES\Detour_Gold\1CD011.004_Block A MLARD\300_Waste Rock Kinetic Test\HCT files\Charts\Detour_Gold_BlkA_1CD011.004_Conc_Charts_VS_rev00.xls
0.0000
0.0001
0.0002
0.0003
0.0004
0.0005
0 20 40 60 80 100 120
Se (m
g/kg
/wk)
Cycles (weeks)
HC-28 ChloriticGreenstone
HC-29 PillowFlow
HC-30 MassiveFlow
HC-31Potassic PillowFlow
HC-32Potassic PillowFlow
HC-33Potassic PillowFlow (Dup)
HC-34Potassic PillowFlow - LGO
HC-35 Blank
P:\01_SITES\Detour_Gold\1CD011.004_Block A MLARD\300_Waste Rock Kinetic Test\HCT files\Charts\Detour_Gold_BlkA_1CD011.004_Conc_Charts_VS_rev00.xls
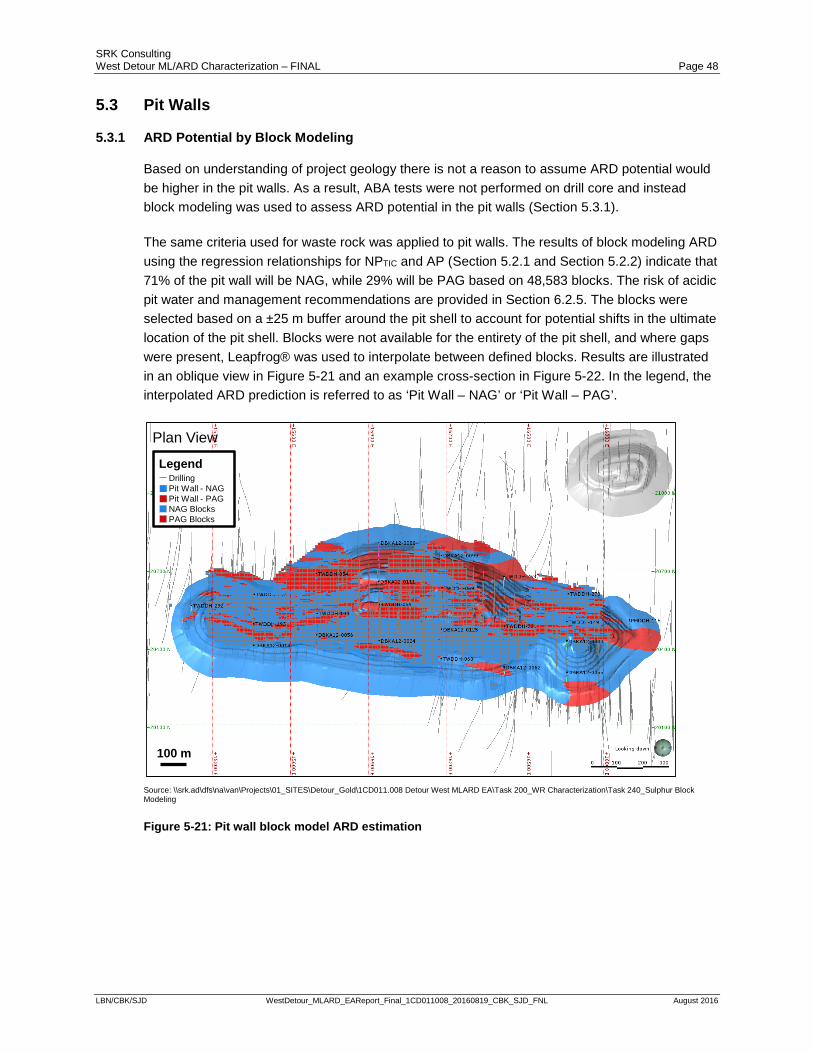
SRK Consulting West Detour ML/ARD Characterization – FINAL Page 48
LBN/CBK/SJD WestDetour_MLARD_EAReport_Final_1CD011008_20160819_CBK_SJD_FNL August 2016
5.3 Pit Walls
5.3.1 ARD Potential by Block Modeling
Based on understanding of project geology there is not a reason to assume ARD potential would be higher in the pit walls. As a result, ABA tests were not performed on drill core and instead block modeling was used to assess ARD potential in the pit walls (Section 5.3.1).
The same criteria used for waste rock was applied to pit walls. The results of block modeling ARD using the regression relationships for NPTIC and AP (Section 5.2.1 and Section 5.2.2) indicate that 71% of the pit wall will be NAG, while 29% will be PAG based on 48,583 blocks. The risk of acidic pit water and management recommendations are provided in Section 6.2.5. The blocks were selected based on a ±25 m buffer around the pit shell to account for potential shifts in the ultimate location of the pit shell. Blocks were not available for the entirety of the pit shell, and where gaps were present, Leapfrog® was used to interpolate between defined blocks. Results are illustrated in an oblique view in Figure 5-21 and an example cross-section in Figure 5-22. In the legend, the interpolated ARD prediction is referred to as ‘Pit Wall – NAG’ or ‘Pit Wall – PAG’.
Source: \\srk.ad\dfs\na\van\Projects\01_SITES\Detour_Gold\1CD011.008 Detour West MLARD EA\Task 200_WR Characterization\Task 240_Sulphur Block Modeling
Figure 5-21: Pit wall block model ARD estimation
Plan View
DrillingPit Wall - NAGPit Wall - PAGNAG BlocksPAG Blocks
Legend
100 m
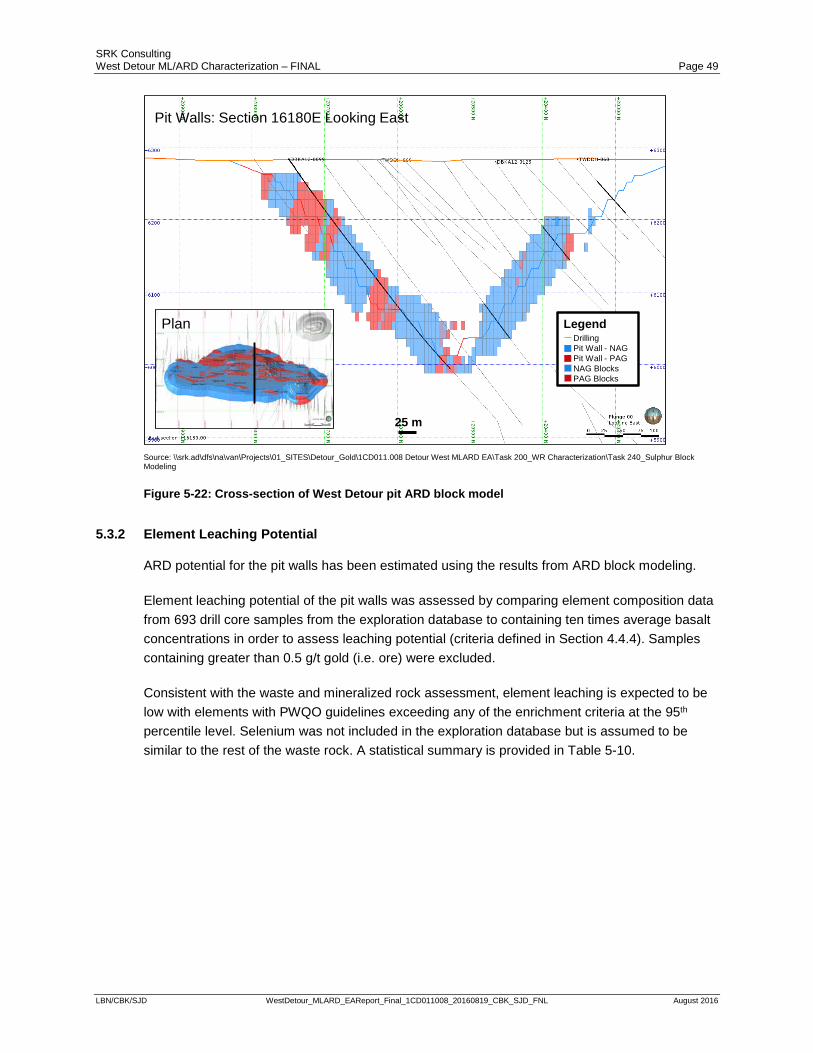
SRK Consulting West Detour ML/ARD Characterization – FINAL Page 49
LBN/CBK/SJD WestDetour_MLARD_EAReport_Final_1CD011008_20160819_CBK_SJD_FNL August 2016
Source: \\srk.ad\dfs\na\van\Projects\01_SITES\Detour_Gold\1CD011.008 Detour West MLARD EA\Task 200_WR Characterization\Task 240_Sulphur Block Modeling
Figure 5-22: Cross-section of West Detour pit ARD block model
5.3.2 Element Leaching Potential
ARD potential for the pit walls has been estimated using the results from ARD block modeling.
Element leaching potential of the pit walls was assessed by comparing element composition data from 693 drill core samples from the exploration database to containing ten times average basalt concentrations in order to assess leaching potential (criteria defined in Section 4.4.4). Samples containing greater than 0.5 g/t gold (i.e. ore) were excluded.
Consistent with the waste and mineralized rock assessment, element leaching is expected to be low with elements with PWQO guidelines exceeding any of the enrichment criteria at the 95th percentile level. Selenium was not included in the exploration database but is assumed to be similar to the rest of the waste rock. A statistical summary is provided in Table 5-10.
Pit Walls: Section 16180E Looking East
Plan
25 m
DrillingPit Wall - NAGPit Wall - PAGNAG BlocksPAG Blocks
Legend
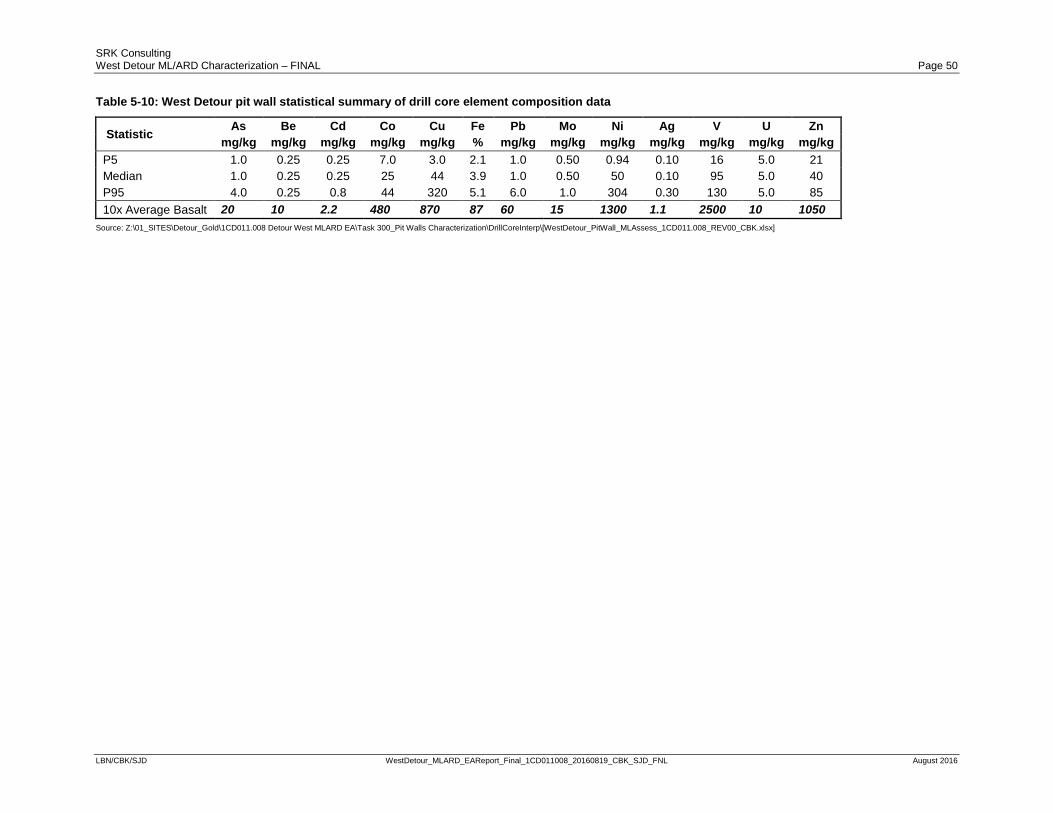
SRK Consulting West Detour ML/ARD Characterization – FINAL Page 50
LBN/CBK/SJD WestDetour_MLARD_EAReport_Final_1CD011008_20160819_CBK_SJD_FNL August 2016
Table 5-10: West Detour pit wall statistical summary of drill core element composition data
Statistic As Be Cd Co Cu Fe Pb Mo Ni Ag V U Zn mg/kg mg/kg mg/kg mg/kg mg/kg % mg/kg mg/kg mg/kg mg/kg mg/kg mg/kg mg/kg
P5 1.0 0.25 0.25 7.0 3.0 2.1 1.0 0.50 0.94 0.10 16 5.0 21 Median 1.0 0.25 0.25 25 44 3.9 1.0 0.50 50 0.10 95 5.0 40 P95 4.0 0.25 0.8 44 320 5.1 6.0 1.0 304 0.30 130 5.0 85 10x Average Basalt 20 10 2.2 480 870 87 60 15 1300 1.1 2500 10 1050
Source: Z:\01_SITES\Detour_Gold\1CD011.008 Detour West MLARD EA\Task 300_Pit Walls Characterization\DrillCoreInterp\[WestDetour_PitWall_MLAssess_1CD011.008_REV00_CBK.xlsx]
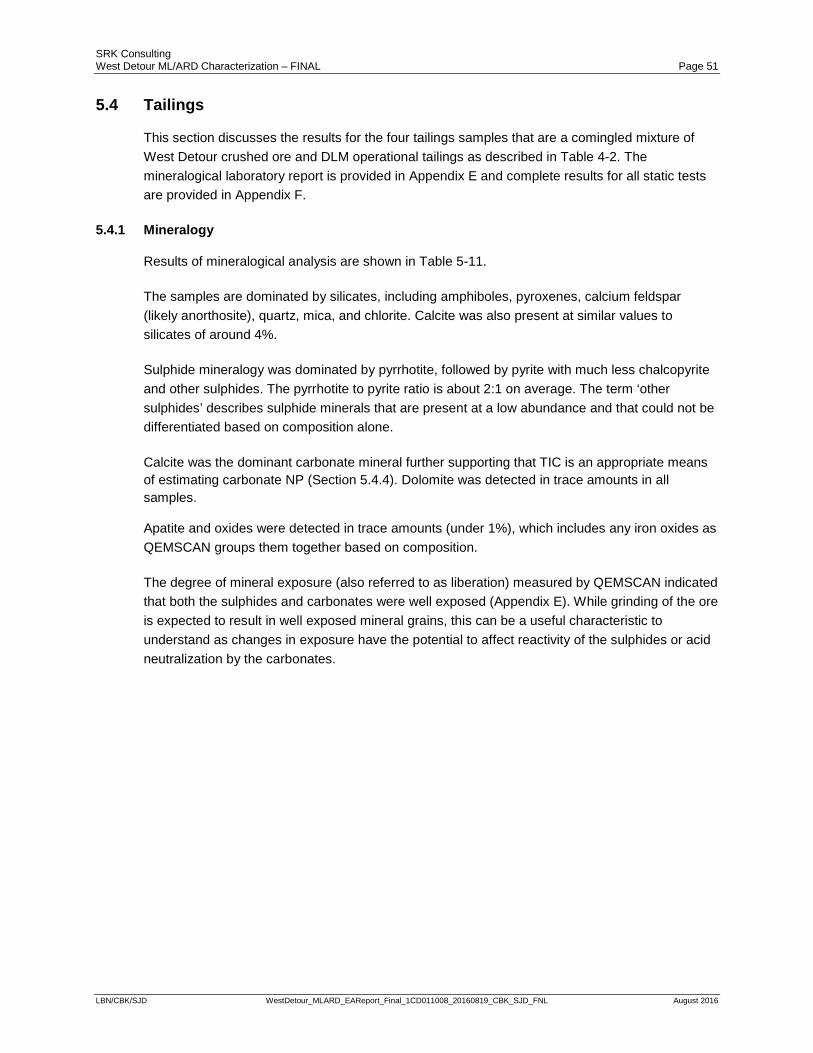
SRK Consulting West Detour ML/ARD Characterization – FINAL Page 51
LBN/CBK/SJD WestDetour_MLARD_EAReport_Final_1CD011008_20160819_CBK_SJD_FNL August 2016
5.4 Tailings
This section discusses the results for the four tailings samples that are a comingled mixture of West Detour crushed ore and DLM operational tailings as described in Table 4-2. The mineralogical laboratory report is provided in Appendix E and complete results for all static tests are provided in Appendix F.
5.4.1 Mineralogy
Results of mineralogical analysis are shown in Table 5-11.
The samples are dominated by silicates, including amphiboles, pyroxenes, calcium feldspar (likely anorthosite), quartz, mica, and chlorite. Calcite was also present at similar values to silicates of around 4%.
Sulphide mineralogy was dominated by pyrrhotite, followed by pyrite with much less chalcopyrite and other sulphides. The pyrrhotite to pyrite ratio is about 2:1 on average. The term ‘other sulphides’ describes sulphide minerals that are present at a low abundance and that could not be differentiated based on composition alone.
Calcite was the dominant carbonate mineral further supporting that TIC is an appropriate means of estimating carbonate NP (Section 5.4.4). Dolomite was detected in trace amounts in all samples.
Apatite and oxides were detected in trace amounts (under 1%), which includes any iron oxides as QEMSCAN groups them together based on composition.
The degree of mineral exposure (also referred to as liberation) measured by QEMSCAN indicated that both the sulphides and carbonates were well exposed (Appendix E). While grinding of the ore is expected to result in well exposed mineral grains, this can be a useful characteristic to understand as changes in exposure have the potential to affect reactivity of the sulphides or acid neutralization by the carbonates.
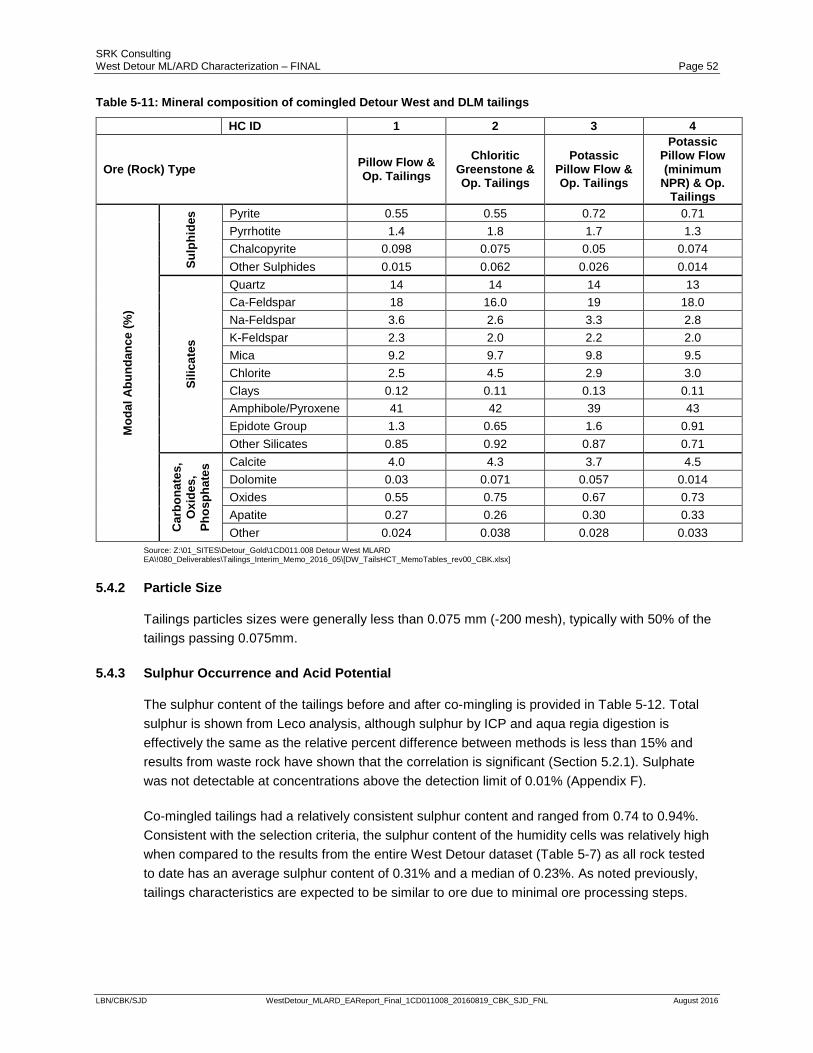
SRK Consulting West Detour ML/ARD Characterization – FINAL Page 52
LBN/CBK/SJD WestDetour_MLARD_EAReport_Final_1CD011008_20160819_CBK_SJD_FNL August 2016
Table 5-11: Mineral composition of comingled Detour West and DLM tailings
HC ID 1 2 3 4
Ore (Rock) Type Pillow Flow & Op. Tailings
Chloritic Greenstone & Op. Tailings
Potassic Pillow Flow & Op. Tailings
Potassic Pillow Flow (minimum
NPR) & Op. Tailings
Mod
al A
bund
ance
(%)
Sulp
hide
s Pyrite 0.55 0.55 0.72 0.71 Pyrrhotite 1.4 1.8 1.7 1.3 Chalcopyrite 0.098 0.075 0.05 0.074 Other Sulphides 0.015 0.062 0.026 0.014
Silic
ates
Quartz 14 14 14 13 Ca-Feldspar 18 16.0 19 18.0 Na-Feldspar 3.6 2.6 3.3 2.8 K-Feldspar 2.3 2.0 2.2 2.0 Mica 9.2 9.7 9.8 9.5 Chlorite 2.5 4.5 2.9 3.0 Clays 0.12 0.11 0.13 0.11 Amphibole/Pyroxene 41 42 39 43 Epidote Group 1.3 0.65 1.6 0.91 Other Silicates 0.85 0.92 0.87 0.71
Car
bona
tes,
O
xide
s,
Phos
phat
es Calcite 4.0 4.3 3.7 4.5
Dolomite 0.03 0.071 0.057 0.014 Oxides 0.55 0.75 0.67 0.73 Apatite 0.27 0.26 0.30 0.33 Other 0.024 0.038 0.028 0.033
Source: Z:\01_SITES\Detour_Gold\1CD011.008 Detour West MLARD EA\!080_Deliverables\Tailings_Interim_Memo_2016_05\[DW_TailsHCT_MemoTables_rev00_CBK.xlsx]
5.4.2 Particle Size
Tailings particles sizes were generally less than 0.075 mm (-200 mesh), typically with 50% of the tailings passing 0.075mm.
5.4.3 Sulphur Occurrence and Acid Potential
The sulphur content of the tailings before and after co-mingling is provided in Table 5-12. Total sulphur is shown from Leco analysis, although sulphur by ICP and aqua regia digestion is effectively the same as the relative percent difference between methods is less than 15% and results from waste rock have shown that the correlation is significant (Section 5.2.1). Sulphate was not detectable at concentrations above the detection limit of 0.01% (Appendix F).
Co-mingled tailings had a relatively consistent sulphur content and ranged from 0.74 to 0.94%. Consistent with the selection criteria, the sulphur content of the humidity cells was relatively high when compared to the results from the entire West Detour dataset (Table 5-7) as all rock tested to date has an average sulphur content of 0.31% and a median of 0.23%. As noted previously, tailings characteristics are expected to be similar to ore due to minimal ore processing steps.
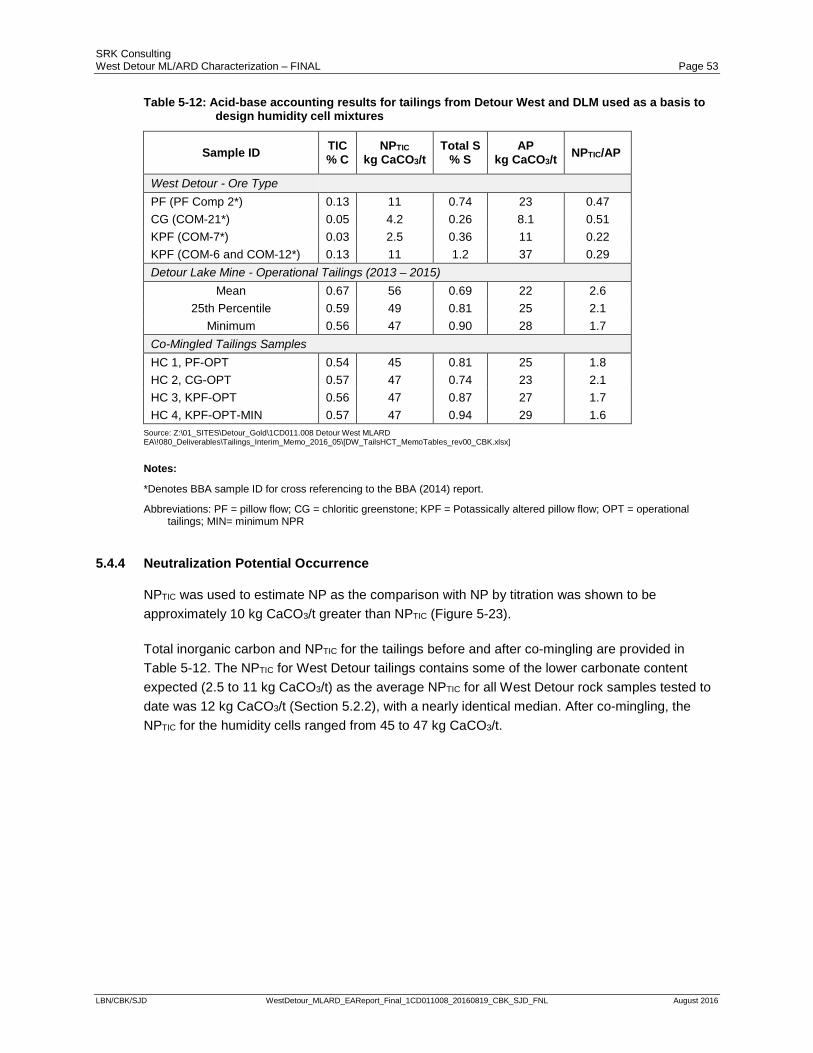
SRK Consulting West Detour ML/ARD Characterization – FINAL Page 53
LBN/CBK/SJD WestDetour_MLARD_EAReport_Final_1CD011008_20160819_CBK_SJD_FNL August 2016
Table 5-12: Acid-base accounting results for tailings from Detour West and DLM used as a basis to design humidity cell mixtures
Sample ID TIC % C
NPTIC kg CaCO3/t
Total S % S
AP kg CaCO3/t NPTIC/AP
West Detour - Ore Type PF (PF Comp 2*) 0.13 11 0.74 23 0.47 CG (COM-21*) 0.05 4.2 0.26 8.1 0.51 KPF (COM-7*) 0.03 2.5 0.36 11 0.22 KPF (COM-6 and COM-12*) 0.13 11 1.2 37 0.29 Detour Lake Mine - Operational Tailings (2013 – 2015)
Mean 0.67 56 0.69 22 2.6 25th Percentile 0.59 49 0.81 25 2.1
Minimum 0.56 47 0.90 28 1.7 Co-Mingled Tailings Samples HC 1, PF-OPT 0.54 45 0.81 25 1.8 HC 2, CG-OPT 0.57 47 0.74 23 2.1 HC 3, KPF-OPT 0.56 47 0.87 27 1.7 HC 4, KPF-OPT-MIN 0.57 47 0.94 29 1.6
Source: Z:\01_SITES\Detour_Gold\1CD011.008 Detour West MLARD EA\!080_Deliverables\Tailings_Interim_Memo_2016_05\[DW_TailsHCT_MemoTables_rev00_CBK.xlsx]
Notes:
*Denotes BBA sample ID for cross referencing to the BBA (2014) report.
Abbreviations: PF = pillow flow; CG = chloritic greenstone; KPF = Potassically altered pillow flow; OPT = operational tailings; MIN= minimum NPR
5.4.4 Neutralization Potential Occurrence
NPTIC was used to estimate NP as the comparison with NP by titration was shown to be approximately 10 kg CaCO3/t greater than NPTIC (Figure 5-23).
Total inorganic carbon and NPTIC for the tailings before and after co-mingling are provided in Table 5-12. The NPTIC for West Detour tailings contains some of the lower carbonate content expected (2.5 to 11 kg CaCO3/t) as the average NPTIC for all West Detour rock samples tested to date was 12 kg CaCO3/t (Section 5.2.2), with a nearly identical median. After co-mingling, the NPTIC for the humidity cells ranged from 45 to 47 kg CaCO3/t.
SRK Consulting West Detour ML/ARD Characterization – FINAL Page 54
LBN/CBK/SJD WestDetour_MLARD_EAReport_Final_1CD011008_20160819_CBK_SJD_FNL August 2016
Figure 5-23: Comparison of NPTIC versus NP by titration
5.4.5 ARD Classification
Classification of ARD potential was based on the ratio of NPTIC to AP, with AP calculated from total sulphur using a criterion of 1.5 to delineate PAG and NAG material as per waste rock samples.
The ARD classification for the tailings after co-mingling to simulate reasonable worst case ARD potential is shown in Figure 5-24. As expected, the excess NPTIC in the DLM tailings is able to provide enough additional acid buffering such that all comingled tailings samples are NAG.
0
10
20
30
40
50
60
70
80
0 10 20 30 40 50 60 70 80
NP T
IC(k
g C
aCO
3/t)
NP - titration (kg CaCO3/t)
HC1 PF-OPT
HC2 CG-OPT
HC3 KPF-OPT
HC4 KPF-OPT-MIN
1:1
P:\01_SITES\Detour_Gold\1CD011.004_Block A MLARD\1100_2015_TailingsCharac\Kinetics\Calculations\[Detour Gold_Tailings_Outcomes_1CD011.004_rtc_rev00.xlsx]
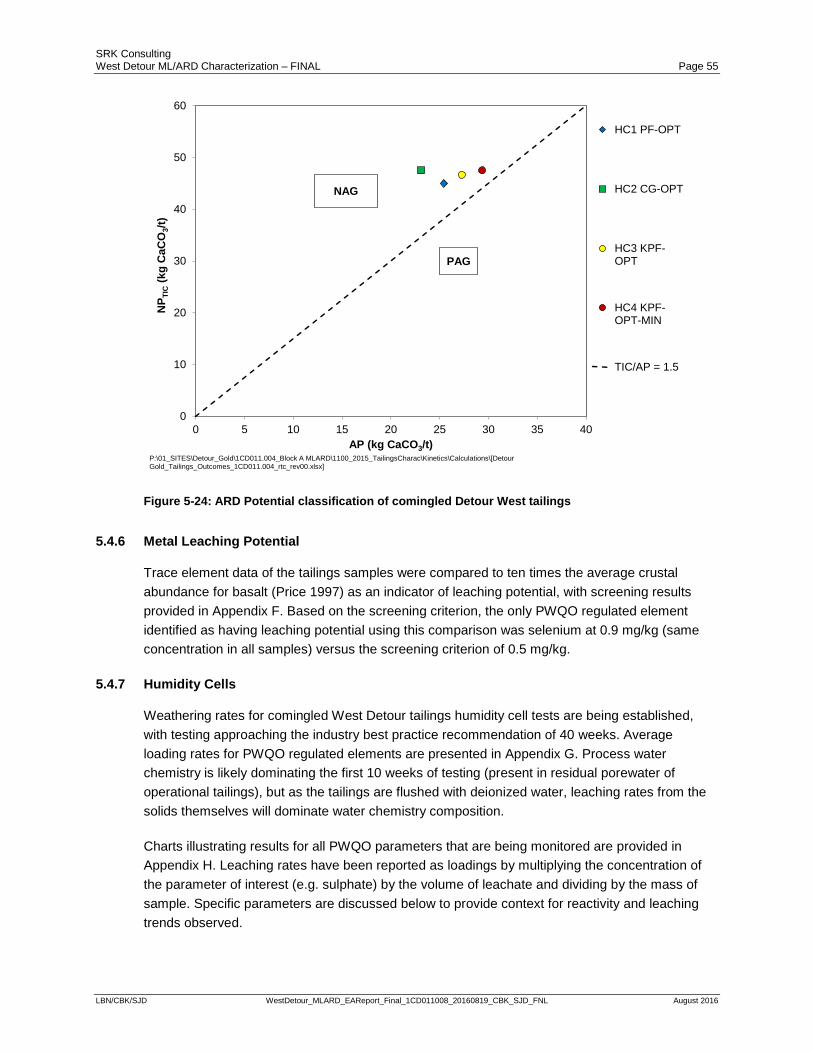
SRK Consulting West Detour ML/ARD Characterization – FINAL Page 55
LBN/CBK/SJD WestDetour_MLARD_EAReport_Final_1CD011008_20160819_CBK_SJD_FNL August 2016
Figure 5-24: ARD Potential classification of comingled Detour West tailings
5.4.6 Metal Leaching Potential
Trace element data of the tailings samples were compared to ten times the average crustal abundance for basalt (Price 1997) as an indicator of leaching potential, with screening results provided in Appendix F. Based on the screening criterion, the only PWQO regulated element identified as having leaching potential using this comparison was selenium at 0.9 mg/kg (same concentration in all samples) versus the screening criterion of 0.5 mg/kg.
5.4.7 Humidity Cells
Weathering rates for comingled West Detour tailings humidity cell tests are being established, with testing approaching the industry best practice recommendation of 40 weeks. Average loading rates for PWQO regulated elements are presented in Appendix G. Process water chemistry is likely dominating the first 10 weeks of testing (present in residual porewater of operational tailings), but as the tailings are flushed with deionized water, leaching rates from the solids themselves will dominate water chemistry composition.
Charts illustrating results for all PWQO parameters that are being monitored are provided in Appendix H. Leaching rates have been reported as loadings by multiplying the concentration of the parameter of interest (e.g. sulphate) by the volume of leachate and dividing by the mass of sample. Specific parameters are discussed below to provide context for reactivity and leaching trends observed.
0
10
20
30
40
50
60
0 5 10 15 20 25 30 35 40
NP T
IC(k
g C
aCO
3/t)
AP (kg CaCO3/t)
HC1 PF-OPT
HC2 CG-OPT
HC3 KPF-OPT
HC4 KPF-OPT-MIN
TIC/AP = 1.5
P:\01_SITES\Detour_Gold\1CD011.004_Block A MLARD\1100_2015_TailingsCharac\Kinetics\Calculations\[Detour Gold_Tailings_Outcomes_1CD011.004_rtc_rev00.xlsx]
NAG
PAG
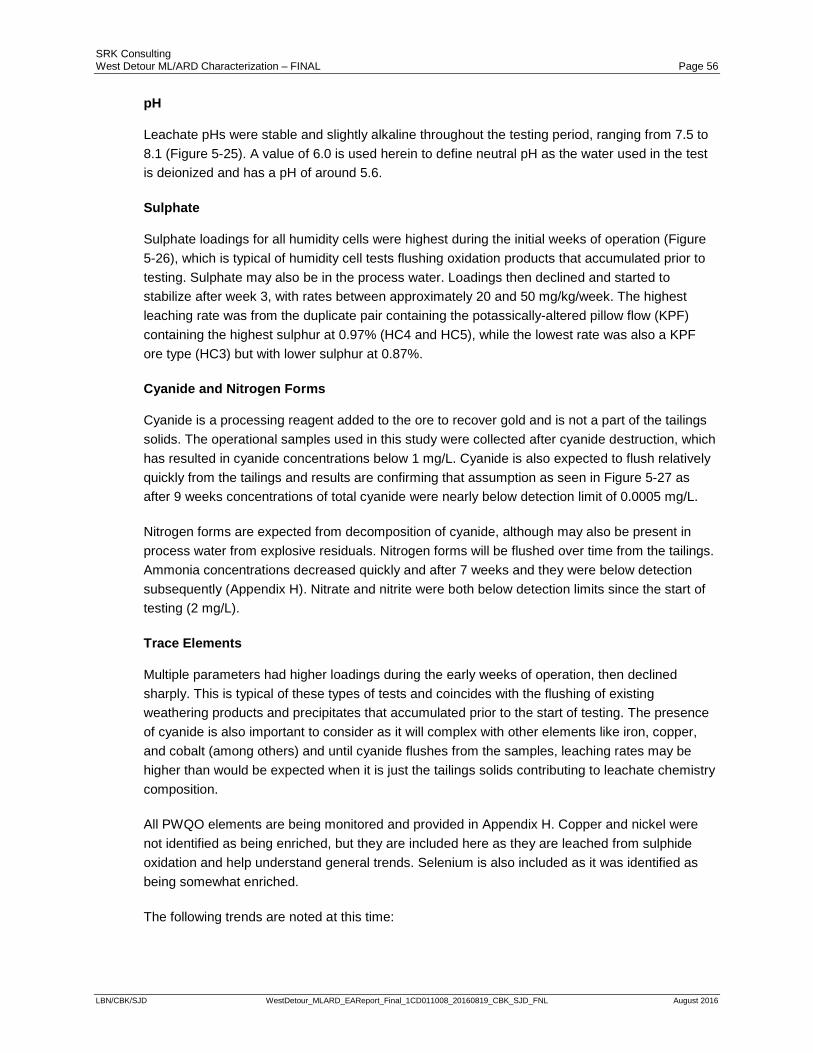
SRK Consulting West Detour ML/ARD Characterization – FINAL Page 56
LBN/CBK/SJD WestDetour_MLARD_EAReport_Final_1CD011008_20160819_CBK_SJD_FNL August 2016
pH
Leachate pHs were stable and slightly alkaline throughout the testing period, ranging from 7.5 to 8.1 (Figure 5-25). A value of 6.0 is used herein to define neutral pH as the water used in the test is deionized and has a pH of around 5.6.
Sulphate
Sulphate loadings for all humidity cells were highest during the initial weeks of operation (Figure 5-26), which is typical of humidity cell tests flushing oxidation products that accumulated prior to testing. Sulphate may also be in the process water. Loadings then declined and started to stabilize after week 3, with rates between approximately 20 and 50 mg/kg/week. The highest leaching rate was from the duplicate pair containing the potassically-altered pillow flow (KPF) containing the highest sulphur at 0.97% (HC4 and HC5), while the lowest rate was also a KPF ore type (HC3) but with lower sulphur at 0.87%.
Cyanide and Nitrogen Forms
Cyanide is a processing reagent added to the ore to recover gold and is not a part of the tailings solids. The operational samples used in this study were collected after cyanide destruction, which has resulted in cyanide concentrations below 1 mg/L. Cyanide is also expected to flush relatively quickly from the tailings and results are confirming that assumption as seen in Figure 5-27 as after 9 weeks concentrations of total cyanide were nearly below detection limit of 0.0005 mg/L.
Nitrogen forms are expected from decomposition of cyanide, although may also be present in process water from explosive residuals. Nitrogen forms will be flushed over time from the tailings. Ammonia concentrations decreased quickly and after 7 weeks and they were below detection subsequently (Appendix H). Nitrate and nitrite were both below detection limits since the start of testing (2 mg/L).
Trace Elements
Multiple parameters had higher loadings during the early weeks of operation, then declined sharply. This is typical of these types of tests and coincides with the flushing of existing weathering products and precipitates that accumulated prior to the start of testing. The presence of cyanide is also important to consider as it will complex with other elements like iron, copper, and cobalt (among others) and until cyanide flushes from the samples, leaching rates may be higher than would be expected when it is just the tailings solids contributing to leachate chemistry composition.
All PWQO elements are being monitored and provided in Appendix H. Copper and nickel were not identified as being enriched, but they are included here as they are leached from sulphide oxidation and help understand general trends. Selenium is also included as it was identified as being somewhat enriched.
The following trends are noted at this time:

SRK Consulting West Detour ML/ARD Characterization – FINAL Page 57
LBN/CBK/SJD WestDetour_MLARD_EAReport_Final_1CD011008_20160819_CBK_SJD_FNL August 2016
• Copper loadings were low (with concentrations approaching detection limits during trace element analysis) for all humidity cells (Figure 5-28).
• Nickel is leaching at low levels (approaching detection limits) for all tests (Figure 5-29).
• Selenium loadings for all humidity cells were highest during the initial weeks of operation (Figure 5-30), similar to sulphate loadings and typical of humidity cell tests flushing oxidation products that accumulated prior to testing. Selenium has also been shown to complex with cyanide and rates may decline further as cyanide is flushed from the samples (Kyle et al. 2012).
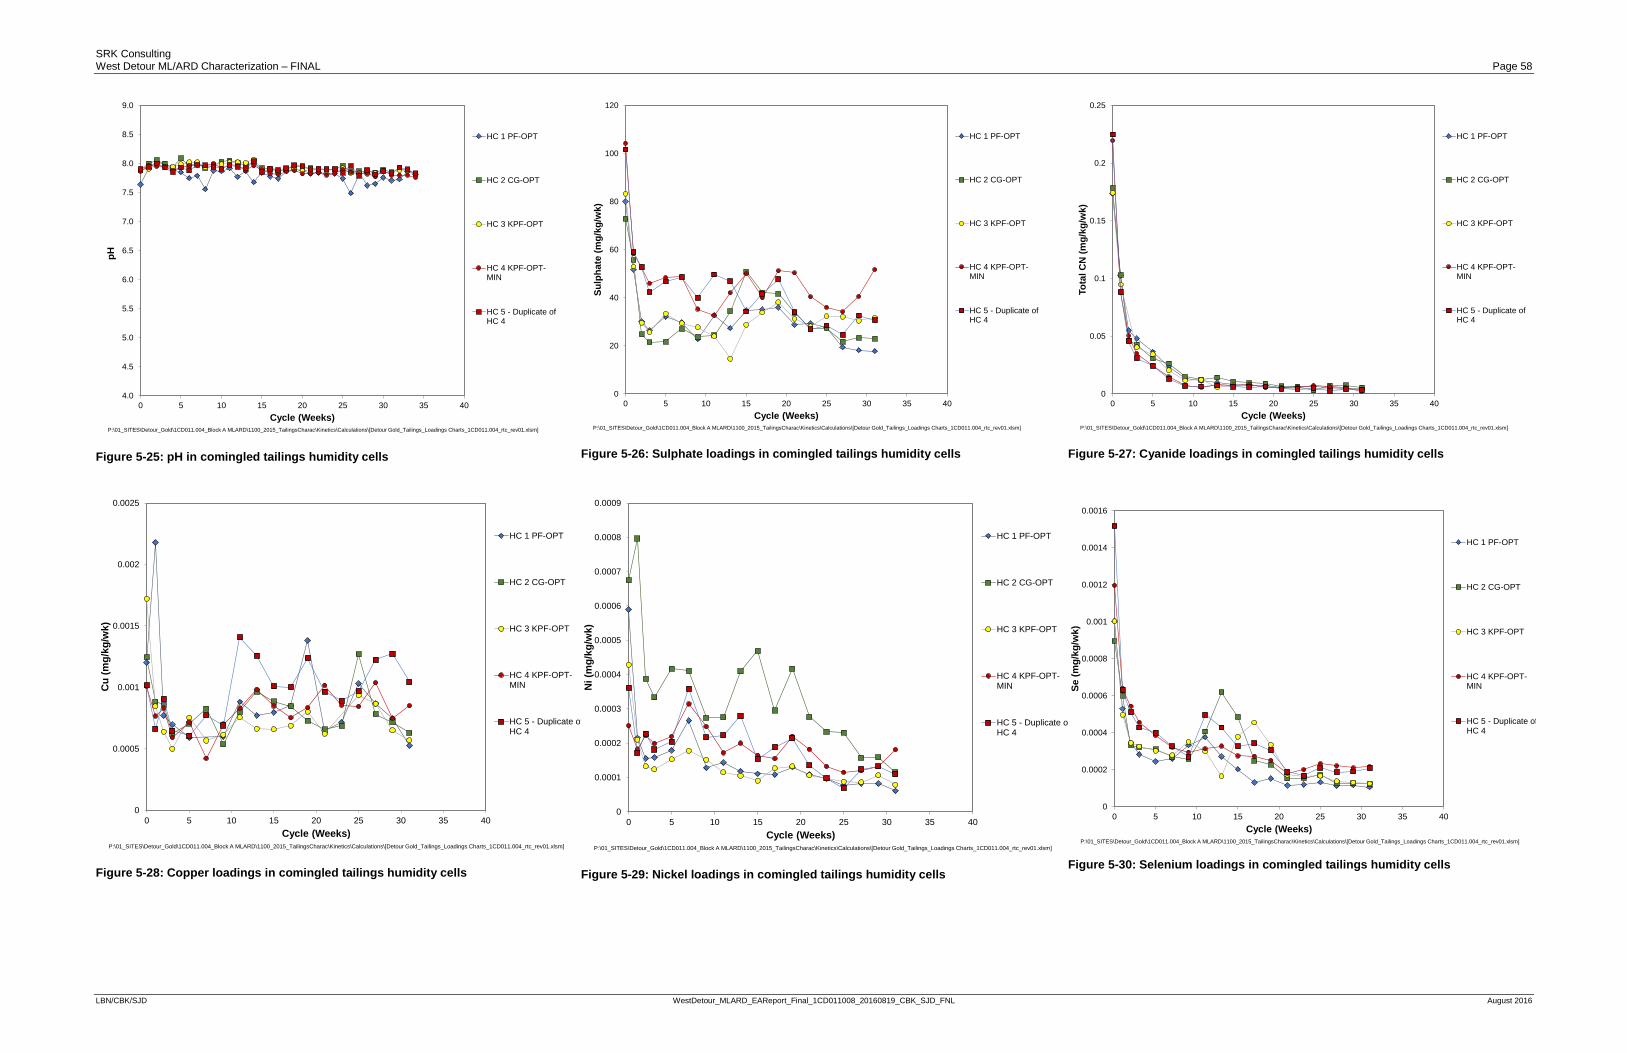
SRK Consulting West Detour ML/ARD Characterization – FINAL Page 58
LBN/CBK/SJD WestDetour_MLARD_EAReport_Final_1CD011008_20160819_CBK_SJD_FNL August 2016
Figure 5-25: pH in comingled tailings humidity cells
Figure 5-26: Sulphate loadings in comingled tailings humidity cells
Figure 5-27: Cyanide loadings in comingled tailings humidity cells
Figure 5-28: Copper loadings in comingled tailings humidity cells
Figure 5-29: Nickel loadings in comingled tailings humidity cells
Figure 5-30: Selenium loadings in comingled tailings humidity cells
4.0
4.5
5.0
5.5
6.0
6.5
7.0
7.5
8.0
8.5
9.0
0 5 10 15 20 25 30 35 40
pH
Cycle (Weeks)
HC 1 PF-OPT
HC 2 CG-OPT
HC 3 KPF-OPT
HC 4 KPF-OPT-MIN
HC 5 - Duplicate ofHC 4
P:\01_SITES\Detour_Gold\1CD011.004_Block A MLARD\1100_2015_TailingsCharac\Kinetics\Calculations\[Detour Gold_Tailings_Loadings Charts_1CD011.004_rtc_rev01.xlsm]
0
20
40
60
80
100
120
0 5 10 15 20 25 30 35 40
Sulp
hate
(mg/
kg/w
k)
Cycle (Weeks)
HC 1 PF-OPT
HC 2 CG-OPT
HC 3 KPF-OPT
HC 4 KPF-OPT-MIN
HC 5 - Duplicate ofHC 4
P:\01_SITES\Detour_Gold\1CD011.004_Block A MLARD\1100_2015_TailingsCharac\Kinetics\Calculations\[Detour Gold_Tailings_Loadings Charts_1CD011.004_rtc_rev01.xlsm]
0
0.05
0.1
0.15
0.2
0.25
0 5 10 15 20 25 30 35 40
Tota
l CN
(mg/
kg/w
k)
Cycle (Weeks)
HC 1 PF-OPT
HC 2 CG-OPT
HC 3 KPF-OPT
HC 4 KPF-OPT-MIN
HC 5 - Duplicate ofHC 4
P:\01_SITES\Detour_Gold\1CD011.004_Block A MLARD\1100_2015_TailingsCharac\Kinetics\Calculations\[Detour Gold_Tailings_Loadings Charts_1CD011.004_rtc_rev01.xlsm]
0
0.0005
0.001
0.0015
0.002
0.0025
0 5 10 15 20 25 30 35 40
Cu
(mg/
kg/w
k)
Cycle (Weeks)
HC 1 PF-OPT
HC 2 CG-OPT
HC 3 KPF-OPT
HC 4 KPF-OPT-MIN
HC 5 - Duplicate ofHC 4
P:\01_SITES\Detour_Gold\1CD011.004_Block A MLARD\1100_2015_TailingsCharac\Kinetics\Calculations\[Detour Gold_Tailings_Loadings Charts_1CD011.004_rtc_rev01.xlsm]
0
0.0001
0.0002
0.0003
0.0004
0.0005
0.0006
0.0007
0.0008
0.0009
0 5 10 15 20 25 30 35 40
Ni (
mg/
kg/w
k)
Cycle (Weeks)
HC 1 PF-OPT
HC 2 CG-OPT
HC 3 KPF-OPT
HC 4 KPF-OPT-MIN
HC 5 - Duplicate ofHC 4
P:\01_SITES\Detour_Gold\1CD011.004_Block A MLARD\1100_2015_TailingsCharac\Kinetics\Calculations\[Detour Gold_Tailings_Loadings Charts_1CD011.004_rtc_rev01.xlsm]
0
0.0002
0.0004
0.0006
0.0008
0.001
0.0012
0.0014
0.0016
0 5 10 15 20 25 30 35 40
Se (m
g/kg
/wk)
Cycle (Weeks)
HC 1 PF-OPT
HC 2 CG-OPT
HC 3 KPF-OPT
HC 4 KPF-OPT-MIN
HC 5 - Duplicate ofHC 4
P:\01_SITES\Detour_Gold\1CD011.004_Block A MLARD\1100_2015_TailingsCharac\Kinetics\Calculations\[Detour Gold_Tailings_Loadings Charts_1CD011.004_rtc_rev01.xlsm]
SRK Consulting West Detour ML/ARD Characterization – FINAL Page 59
LBN/CBK/SJD WestDetour_MLARD_EAReport_Final_1CD011008_20160819_CBK_SJD_FNL August 2016
5.5 Overburden
Figure 5-32 presents the West Detour overburden sampling program. Static data for the 111 overburden samples are provided in Appendix I.
5.5.1 Sulphur Occurrence
Sulphur levels for the overburden samples are typically low, with 80% of the sample set containing less than 0.1% sulphur. For all overburden samples, 75th percentile levels of sulphur were less than 0.1% with the exception of gravel and peat, the former which only had one sample (Figure 5-31). Sulphur levels for peat samples were higher than other overburden types, with levels ranging from 0.02% to 0.36% and median levels of 0.16%.
Figure 5-31: Distribution of sulphur by aqua regia for overburden samples
n=16
n=1
n=22n=44
n=27
n=1
0.01
0.1
1
Sulp
hur (
%)
Overburden Type
P:\01_SITES\Detour_Gold\1CD011.008 Detour West MLARD EA\Task 500_OB Characterization\Task 530_Static Testing\Results\[OB_Static_1CD011008_Rev00_LNB.xlsx]
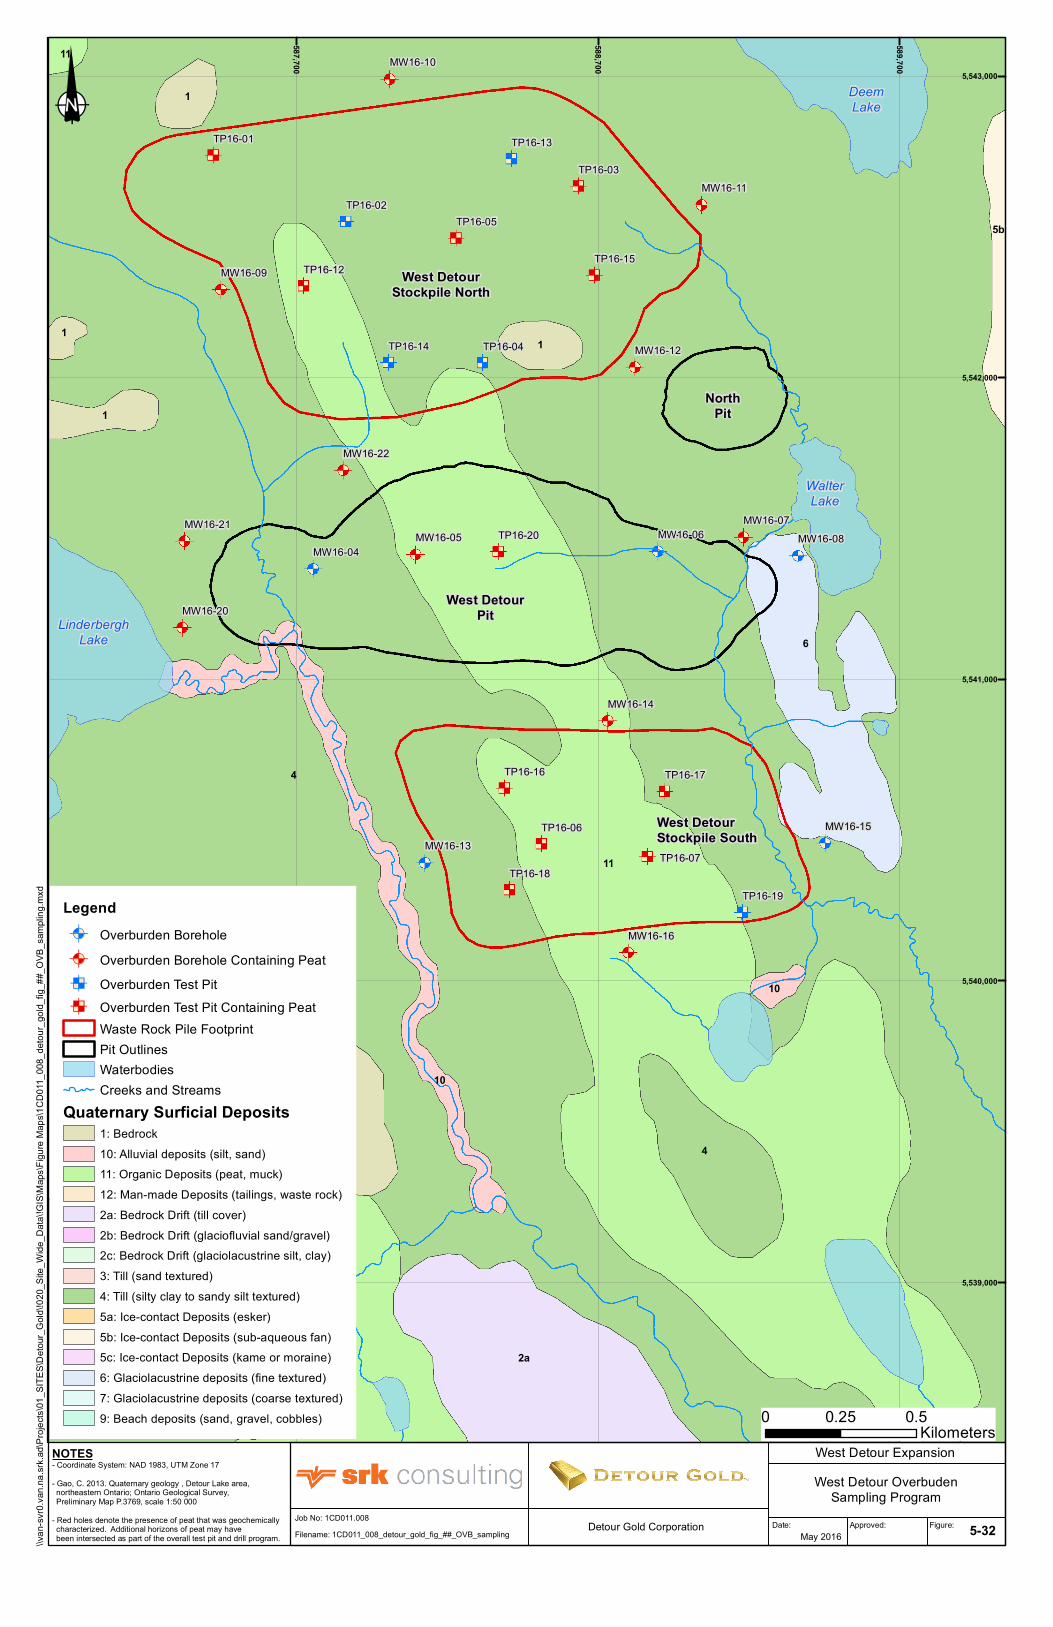
West DetourStockpile North
West DetourPit
West DetourStockpile South
NorthPit
DeemLake
WalterLake
LinderberghLake
5b
11
4
10
1
112a
11
1
11
1
6
4
10
TP16-02
TP16-04
TP16-13
TP16-14
TP16-19
TP16-01
TP16-03
TP16-05
TP16-06
TP16-07
TP16-12TP16-15
TP16-16 TP16-17
TP16-18
TP16-20MW16-04
MW16-06 MW16-08
MW16-13MW16-15
MW16-05MW16-07
MW16-09
MW16-10
MW16-11
MW16-12
MW16-14
MW16-16
MW16-20
MW16-21
MW16-22
587,700
588,700
589,700
5,539,000
5,540,000
5,541,000
5,542,000
5,543,000
Date: Approved: Figure:
\\van
-svr0.
van.n
a.srk.
ad\P
rojec
ts\01
_SITE
S\Deto
ur_Go
ld\!02
0_Sit
e_W
ide_D
ata\!G
IS\M
aps\F
igure
Maps
\1CD0
11_0
08_d
etour_
gold_
fig_#
#_OV
B_sa
mplin
g.mxd
0 0.25 0.5Kilometers
Filename: 1CD011_008_detour_gold_fig_##_OVB_sampling
West Detour OverbudenSampling Program
May 2016 5-32Detour Gold CorporationJob No: 1CD011.008
LegendMKLNA Overburden BoreholeMKLNA Overburden Borehole Containing Peat""")Ò Overburden Test Pit""")Ò Overburden Test Pit Containing Peat
Waste Rock Pile FootprintPit OutlinesWaterbodiesCreeks and Streams
Quaternary Surficial Deposits1: Bedrock10: Alluvial deposits (silt, sand)11: Organic Deposits (peat, muck)12: Man-made Deposits (tailings, waste rock)2a: Bedrock Drift (till cover)2b: Bedrock Drift (glaciofluvial sand/gravel)2c: Bedrock Drift (glaciolacustrine silt, clay)3: Till (sand textured)4: Till (silty clay to sandy silt textured)5a: Ice-contact Deposits (esker)5b: Ice-contact Deposits (sub-aqueous fan)5c: Ice-contact Deposits (kame or moraine)6: Glaciolacustrine deposits (fine textured)7: Glaciolacustrine deposits (coarse textured)9: Beach deposits (sand, gravel, cobbles)
West Detour ExpansionNOTES- Coordinate System: NAD 1983, UTM Zone 17- Gao, C. 2013. Quaternary geology , Detour Lake area, northeastern Ontario; Ontario Geological Survey, Preliminary Map P.3769, scale 1:50 000- Red holes denote the presence of peat that was geochemically characterized. Additional horizons of peat may have been intersected as part of the overall test pit and drill program.
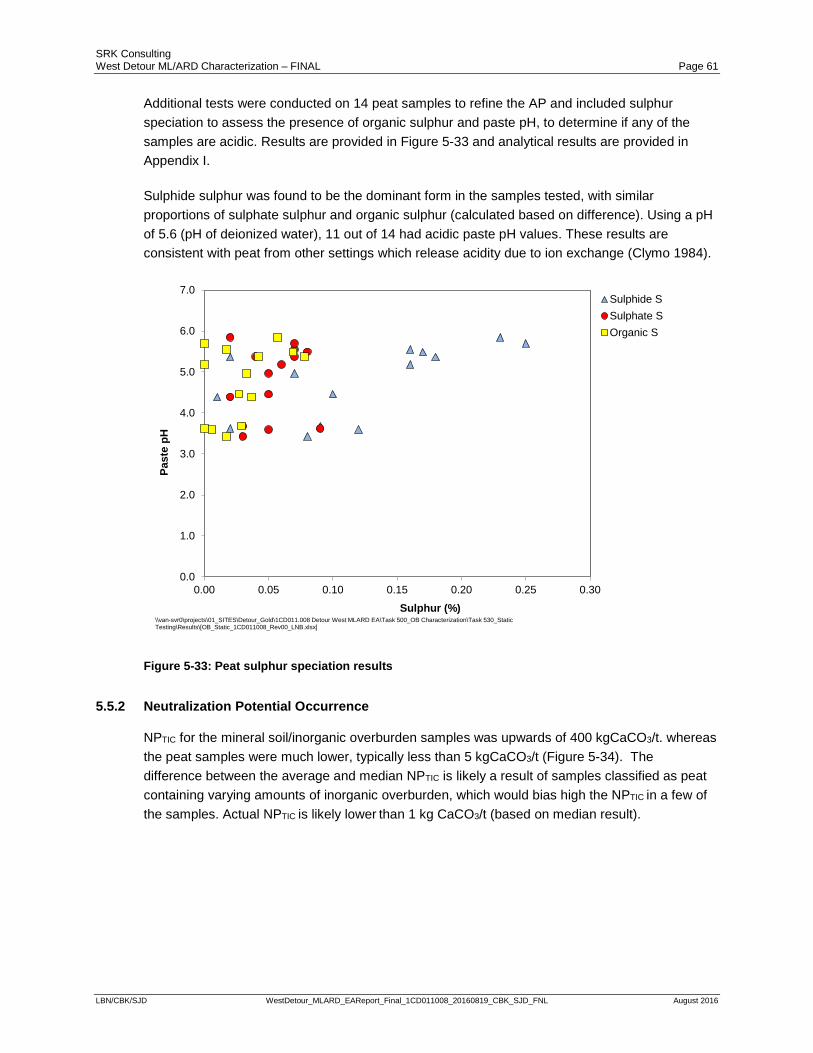
SRK Consulting West Detour ML/ARD Characterization – FINAL Page 61
LBN/CBK/SJD WestDetour_MLARD_EAReport_Final_1CD011008_20160819_CBK_SJD_FNL August 2016
Additional tests were conducted on 14 peat samples to refine the AP and included sulphur speciation to assess the presence of organic sulphur and paste pH, to determine if any of the samples are acidic. Results are provided in Figure 5-33 and analytical results are provided in Appendix I.
Sulphide sulphur was found to be the dominant form in the samples tested, with similar proportions of sulphate sulphur and organic sulphur (calculated based on difference). Using a pH of 5.6 (pH of deionized water), 11 out of 14 had acidic paste pH values. These results are consistent with peat from other settings which release acidity due to ion exchange (Clymo 1984).
Figure 5-33: Peat sulphur speciation results
5.5.2 Neutralization Potential Occurrence
NPTIC for the mineral soil/inorganic overburden samples was upwards of 400 kgCaCO3/t. whereas the peat samples were much lower, typically less than 5 kgCaCO3/t (Figure 5-34). The difference between the average and median NPTIC is likely a result of samples classified as peat containing varying amounts of inorganic overburden, which would bias high the NPTIC in a few of the samples. Actual NPTIC is likely lower than 1 kg CaCO3/t (based on median result).
0.0
1.0
2.0
3.0
4.0
5.0
6.0
7.0
0.00 0.05 0.10 0.15 0.20 0.25 0.30
Past
e pH
Sulphur (%)
Sulphide SSulphate SOrganic S
\\van-svr0\projects\01_SITES\Detour_Gold\1CD011.008 Detour West MLARD EA\Task 500_OB Characterization\Task 530_Static Testing\Results\[OB_Static_1CD011008_Rev00_LNB.xlsx]
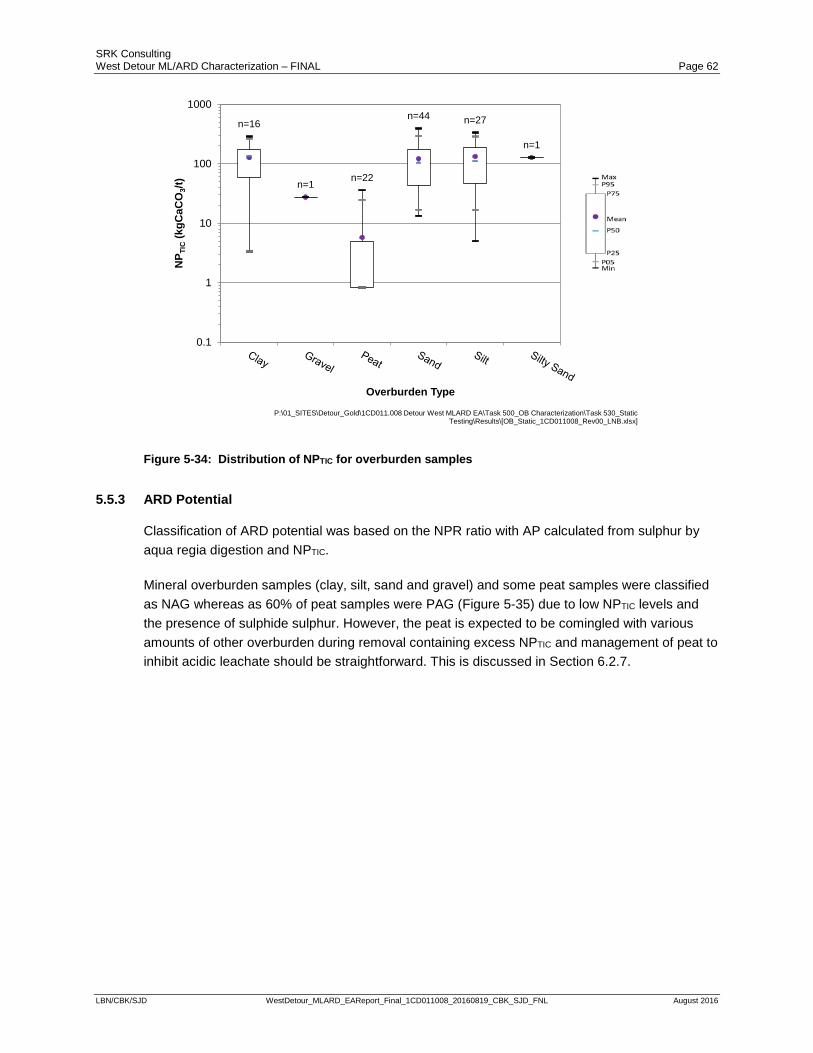
SRK Consulting West Detour ML/ARD Characterization – FINAL Page 62
LBN/CBK/SJD WestDetour_MLARD_EAReport_Final_1CD011008_20160819_CBK_SJD_FNL August 2016
Figure 5-34: Distribution of NPTIC for overburden samples
5.5.3 ARD Potential
Classification of ARD potential was based on the NPR ratio with AP calculated from sulphur by aqua regia digestion and NPTIC.
Mineral overburden samples (clay, silt, sand and gravel) and some peat samples were classified as NAG whereas as 60% of peat samples were PAG (Figure 5-35) due to low NPTIC levels and the presence of sulphide sulphur. However, the peat is expected to be comingled with various amounts of other overburden during removal containing excess NPTIC and management of peat to inhibit acidic leachate should be straightforward. This is discussed in Section 6.2.7.
n=16
n=1n=22
n=44 n=27
n=1
0.1
1
10
100
1000
NP T
IC(k
gCaC
O3/t
)
Overburden Type
P:\01_SITES\Detour_Gold\1CD011.008 Detour West MLARD EA\Task 500_OB Characterization\Task 530_Static Testing\Results\[OB_Static_1CD011008_Rev00_LNB.xlsx]
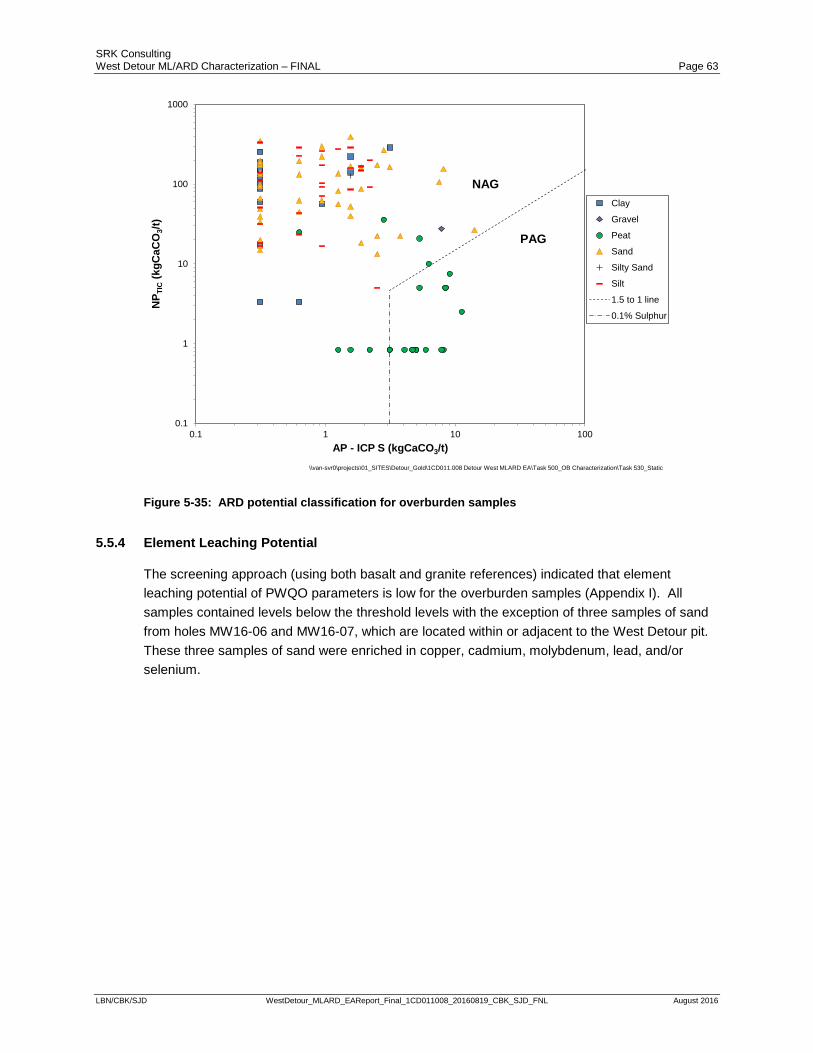
SRK Consulting West Detour ML/ARD Characterization – FINAL Page 63
LBN/CBK/SJD WestDetour_MLARD_EAReport_Final_1CD011008_20160819_CBK_SJD_FNL August 2016
Figure 5-35: ARD potential classification for overburden samples
5.5.4 Element Leaching Potential
The screening approach (using both basalt and granite references) indicated that element leaching potential of PWQO parameters is low for the overburden samples (Appendix I). All samples contained levels below the threshold levels with the exception of three samples of sand from holes MW16-06 and MW16-07, which are located within or adjacent to the West Detour pit. These three samples of sand were enriched in copper, cadmium, molybdenum, lead, and/or selenium.
0.1
1
10
100
1000
0.1 1 10 100
NP T
IC(k
gCaC
O3/t
)
AP - ICP S (kgCaCO3/t)
Clay
Gravel
Peat
Sand
Silty Sand
Silt
1.5 to 1 line
0.1% Sulphur
\\van-svr0\projects\01_SITES\Detour_Gold\1CD011.008 Detour West MLARD EA\Task 500_OB Characterization\Task 530_Static
PAG
NAG
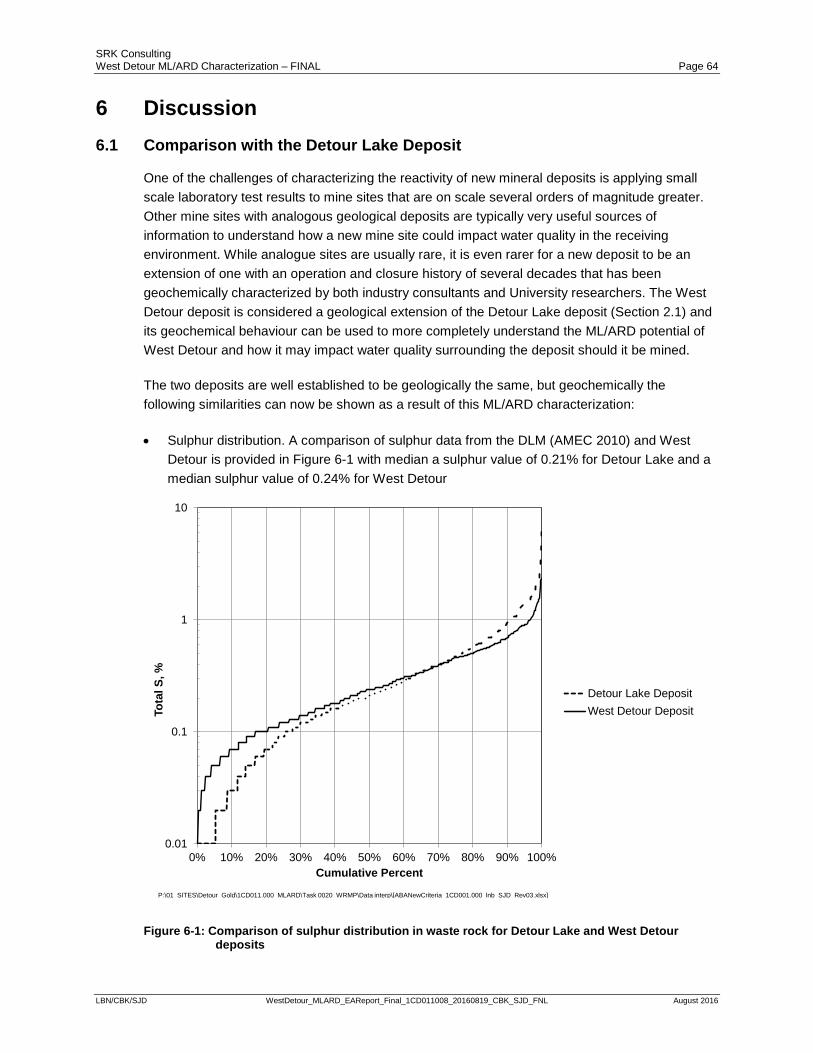
SRK Consulting West Detour ML/ARD Characterization – FINAL Page 64
LBN/CBK/SJD WestDetour_MLARD_EAReport_Final_1CD011008_20160819_CBK_SJD_FNL August 2016
6 Discussion 6.1 Comparison with the Detour Lake Deposit
One of the challenges of characterizing the reactivity of new mineral deposits is applying small scale laboratory test results to mine sites that are on scale several orders of magnitude greater. Other mine sites with analogous geological deposits are typically very useful sources of information to understand how a new mine site could impact water quality in the receiving environment. While analogue sites are usually rare, it is even rarer for a new deposit to be an extension of one with an operation and closure history of several decades that has been geochemically characterized by both industry consultants and University researchers. The West Detour deposit is considered a geological extension of the Detour Lake deposit (Section 2.1) and its geochemical behaviour can be used to more completely understand the ML/ARD potential of West Detour and how it may impact water quality surrounding the deposit should it be mined.
The two deposits are well established to be geologically the same, but geochemically the following similarities can now be shown as a result of this ML/ARD characterization:
• Sulphur distribution. A comparison of sulphur data from the DLM (AMEC 2010) and West Detour is provided in Figure 6-1 with median a sulphur value of 0.21% for Detour Lake and a median sulphur value of 0.24% for West Detour
Figure 6-1: Comparison of sulphur distribution in waste rock for Detour Lake and West Detour deposits
0.01
0.1
1
10
0% 10% 20% 30% 40% 50% 60% 70% 80% 90% 100%
Tota
l S, %
Cumulative Percent
Detour Lake DepositWest Detour Deposit
P:\01_SITES\Detour_Gold\1CD011.000_MLARD\Task 0020_WRMP\Data interp\[ABANewCriteria_1CD001.000_lnb_SJD_Rev03.xlsx]
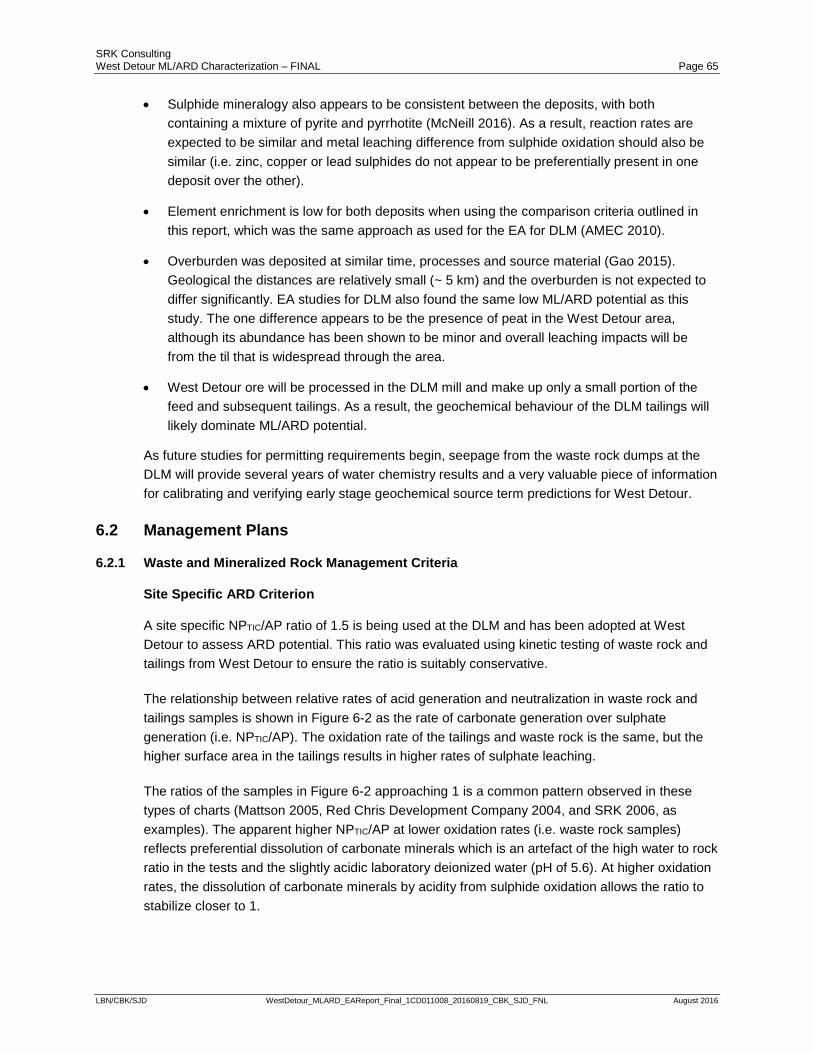
SRK Consulting West Detour ML/ARD Characterization – FINAL Page 65
LBN/CBK/SJD WestDetour_MLARD_EAReport_Final_1CD011008_20160819_CBK_SJD_FNL August 2016
• Sulphide mineralogy also appears to be consistent between the deposits, with both containing a mixture of pyrite and pyrrhotite (McNeill 2016). As a result, reaction rates are expected to be similar and metal leaching difference from sulphide oxidation should also be similar (i.e. zinc, copper or lead sulphides do not appear to be preferentially present in one deposit over the other).
• Element enrichment is low for both deposits when using the comparison criteria outlined in this report, which was the same approach as used for the EA for DLM (AMEC 2010).
• Overburden was deposited at similar time, processes and source material (Gao 2015). Geological the distances are relatively small (~ 5 km) and the overburden is not expected to differ significantly. EA studies for DLM also found the same low ML/ARD potential as this study. The one difference appears to be the presence of peat in the West Detour area, although its abundance has been shown to be minor and overall leaching impacts will be from the til that is widespread through the area.
• West Detour ore will be processed in the DLM mill and make up only a small portion of the feed and subsequent tailings. As a result, the geochemical behaviour of the DLM tailings will likely dominate ML/ARD potential.
As future studies for permitting requirements begin, seepage from the waste rock dumps at the DLM will provide several years of water chemistry results and a very valuable piece of information for calibrating and verifying early stage geochemical source term predictions for West Detour.
6.2 Management Plans
6.2.1 Waste and Mineralized Rock Management Criteria
Site Specific ARD Criterion
A site specific NPTIC/AP ratio of 1.5 is being used at the DLM and has been adopted at West Detour to assess ARD potential. This ratio was evaluated using kinetic testing of waste rock and tailings from West Detour to ensure the ratio is suitably conservative.
The relationship between relative rates of acid generation and neutralization in waste rock and tailings samples is shown in Figure 6-2 as the rate of carbonate generation over sulphate generation (i.e. NPTIC/AP). The oxidation rate of the tailings and waste rock is the same, but the higher surface area in the tailings results in higher rates of sulphate leaching.
The ratios of the samples in Figure 6-2 approaching 1 is a common pattern observed in these types of charts (Mattson 2005, Red Chris Development Company 2004, and SRK 2006, as examples). The apparent higher NPTIC/AP at lower oxidation rates (i.e. waste rock samples) reflects preferential dissolution of carbonate minerals which is an artefact of the high water to rock ratio in the tests and the slightly acidic laboratory deionized water (pH of 5.6). At higher oxidation rates, the dissolution of carbonate minerals by acidity from sulphide oxidation allows the ratio to stabilize closer to 1.
SRK Consulting West Detour ML/ARD Characterization – FINAL Page 66
LBN/CBK/SJD WestDetour_MLARD_EAReport_Final_1CD011008_20160819_CBK_SJD_FNL August 2016
The interpretation of West Detour samples trending towards 1 is that the actual NPTIC/AP is closer to 1 and that an NPTIC/AP ratio of 1.5 is suitably conservative to assess ARD potential at West Detour.
Figure 6-2: Relative rate of acid generation compared to sulphide oxidation rate for comingled tailings samples
6.2.2 Delay to ARD Onset
Using a previously established method (SRK 2006), the results from the humidity cells tests were used to estimate delay to onset of ARD for PAG material using an NPTIC/AP criterion of 1.5. Estimating the delay to ARD onset for PAG material is a required prediction for management of ARD at any mine site. For West Detour specifically, estimating ARD delay (or rock reactivity) is needed to confirm that the ARD management plan being implemented at the DLM can be applied to West Detour.
The time or delay to onset of ARD (tonset) depends on the site-specific availability of reactive NP (NPTIC) and the rate at which reactive TIC (RTIC) is depleted:
tonset = NPTIC/RTIC
However, the rate at which carbonate is depleted is actually a function of the acid generation (sulphide oxidation) rate (RS). In molar terms, the rate of carbonate depletion to sulphide depletion is the same as the NPTIC/AP criterion for PAG rock ({NPTIC/AP}crit).
RTIC*/ RS = {NPTIC/AP}crit
0.0
0.5
1.0
1.5
2.0
2.5
3.0
3.5
4.0
4.5
5.0
0 10 20 30 40 50 60
(Ca+
Mg)
/SO
4(m
ol/m
ol)
Average sulphate release (mg/kg/week)
HC1 PF-OPTHC2 CG-OPTHC3 KPF-OPTHC4 KPF-OPT-MINWaste Rock HCTsNPTIC/AP = 1.0NPTIC/AP = 1.5
P:\01_SITES\Detour_Gold\1CD011.004_Block A MLARD\1100_2015_TailingsCharac\Kinetics\Calculations\[Detour Gold_Tailings_Outcomes_1CD011.004_rtc_rev00.xlsx]
SRK Consulting West Detour ML/ARD Characterization – FINAL Page 67
LBN/CBK/SJD WestDetour_MLARD_EAReport_Final_1CD011008_20160819_CBK_SJD_FNL August 2016
Assuming a direct linear relationship between oxidation rate and sulphur content and conservatively a zero order chemical reaction, then
RS = k.AP0
where k is the slope of the line and the rate constant; and AP0 is the initial sulphur content. The non-zero intercept is not included because if no sulphide is present then the rate of sulphide oxidation is zero.
When these three relationships are combined, the delay to onset is:
tonset=�NPTIC
AP �0
k �NPTICAP �
crit
Therefore, the delay to onset is a function of NPTIC/AP of the sample, the overall rate of oxidation of sulphide (k), and the effectiveness of neutralization ({NPTIC/AP}crit). Longer delays are indicated for rock with higher NPTIC/AP values assuming constant values for the two other factors. Using these values of k, lag time can be estimated for all rock types using a site specific NPTIC/AP criterion of 1.5 (Section 6.2.1).
The value for k was defined by the relationship between initial sulphide content (S0) and sulphate release in the West Detour humidity cells. For West Detour, the samples contain a mixture of sulphide minerals and reaction rates are different for pyrrhotite and pyrite, with pyrrhotite reacting faster than pyrite. As a result, the rate of reaction for pyrrhotite was used to conservatively estimate the value of k for the time delay calculation. Figure 6-3 shows the relationship between sulphate release and sulphide content, with labels to indicate the dominant sulphide, or samples where there was a mixture of sulphides.
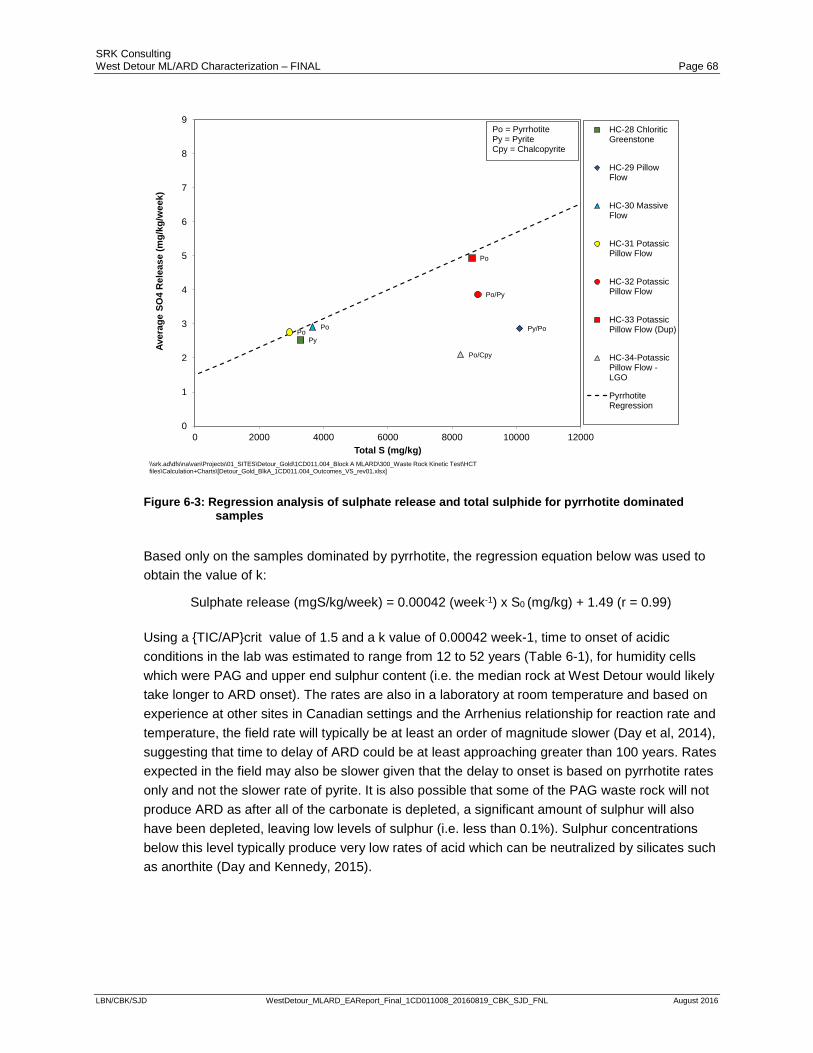
SRK Consulting West Detour ML/ARD Characterization – FINAL Page 68
LBN/CBK/SJD WestDetour_MLARD_EAReport_Final_1CD011008_20160819_CBK_SJD_FNL August 2016
Figure 6-3: Regression analysis of sulphate release and total sulphide for pyrrhotite dominated samples
Based only on the samples dominated by pyrrhotite, the regression equation below was used to obtain the value of k:
Sulphate release (mgS/kg/week) = 0.00042 (week-1) x S0 (mg/kg) + 1.49 (r = 0.99)
Using a {TIC/AP}crit value of 1.5 and a k value of 0.00042 week-1, time to onset of acidic conditions in the lab was estimated to range from 12 to 52 years (Table 6-1), for humidity cells which were PAG and upper end sulphur content (i.e. the median rock at West Detour would likely take longer to ARD onset). The rates are also in a laboratory at room temperature and based on experience at other sites in Canadian settings and the Arrhenius relationship for reaction rate and temperature, the field rate will typically be at least an order of magnitude slower (Day et al, 2014), suggesting that time to delay of ARD could be at least approaching greater than 100 years. Rates expected in the field may also be slower given that the delay to onset is based on pyrrhotite rates only and not the slower rate of pyrite. It is also possible that some of the PAG waste rock will not produce ARD as after all of the carbonate is depleted, a significant amount of sulphur will also have been depleted, leaving low levels of sulphur (i.e. less than 0.1%). Sulphur concentrations below this level typically produce very low rates of acid which can be neutralized by silicates such as anorthite (Day and Kennedy, 2015).
PyPy/PoPo
Po
Po/Py
Po
Po/Cpy
0
1
2
3
4
5
6
7
8
9
0 2000 4000 6000 8000 10000 12000
Aver
age
SO4
Rel
ease
(mg/
kg/w
eek)
Total S (mg/kg)
HC-28 ChloriticGreenstone
HC-29 PillowFlow
HC-30 MassiveFlow
HC-31 PotassicPillow Flow
HC-32 PotassicPillow Flow
HC-33 PotassicPillow Flow (Dup)
HC-34-PotassicPillow Flow -LGO
PyrrhotiteRegression
\\srk.ad\dfs\na\van\Projects\01_SITES\Detour_Gold\1CD011.004_Block A MLARD\300_Waste Rock Kinetic Test\HCT files\Calculation+Charts\[Detour_Gold_BlkA_1CD011.004_Outcomes_VS_rev01.xlsx]
Po = PyrrhotitePy = PyriteCpy = Chalcopyrite
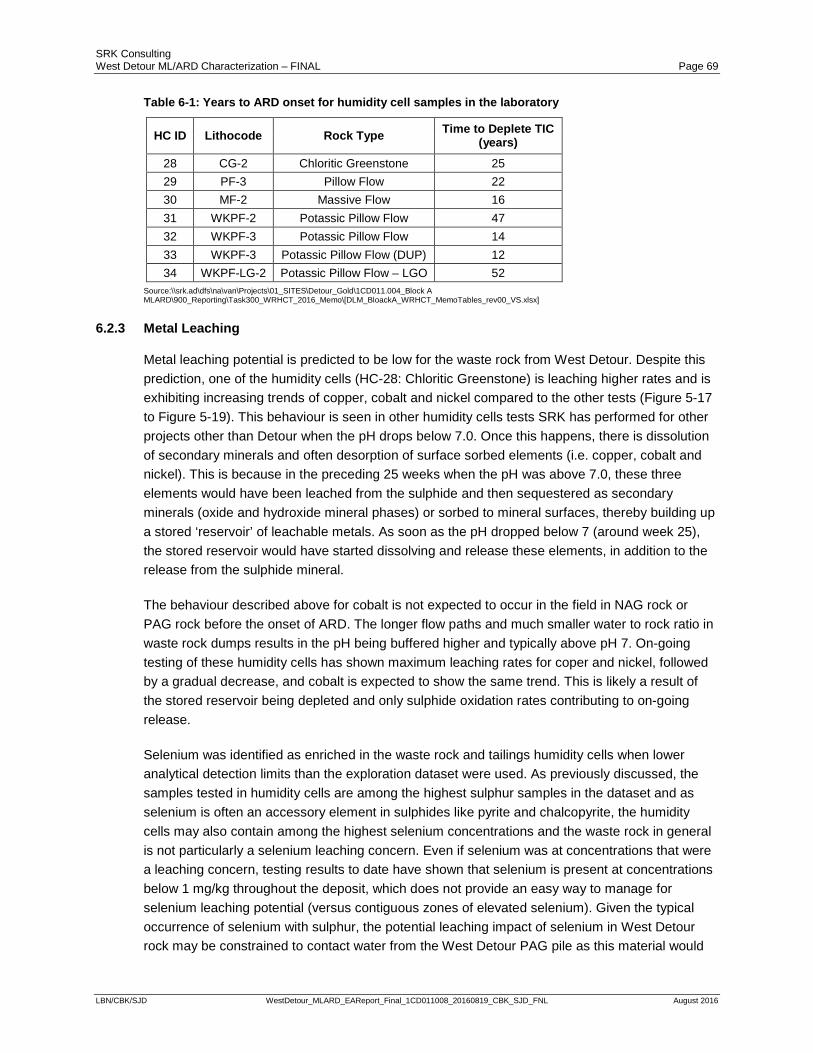
SRK Consulting West Detour ML/ARD Characterization – FINAL Page 69
LBN/CBK/SJD WestDetour_MLARD_EAReport_Final_1CD011008_20160819_CBK_SJD_FNL August 2016
Table 6-1: Years to ARD onset for humidity cell samples in the laboratory
HC ID Lithocode Rock Type Time to Deplete TIC (years)
28 CG-2 Chloritic Greenstone 25 29 PF-3 Pillow Flow 22 30 MF-2 Massive Flow 16 31 WKPF-2 Potassic Pillow Flow 47 32 WKPF-3 Potassic Pillow Flow 14 33 WKPF-3 Potassic Pillow Flow (DUP) 12 34 WKPF-LG-2 Potassic Pillow Flow – LGO 52
Source:\\srk.ad\dfs\na\van\Projects\01_SITES\Detour_Gold\1CD011.004_Block A MLARD\900_Reporting\Task300_WRHCT_2016_Memo\[DLM_BloackA_WRHCT_MemoTables_rev00_VS.xlsx]
6.2.3 Metal Leaching
Metal leaching potential is predicted to be low for the waste rock from West Detour. Despite this prediction, one of the humidity cells (HC-28: Chloritic Greenstone) is leaching higher rates and is exhibiting increasing trends of copper, cobalt and nickel compared to the other tests (Figure 5-17 to Figure 5-19). This behaviour is seen in other humidity cells tests SRK has performed for other projects other than Detour when the pH drops below 7.0. Once this happens, there is dissolution of secondary minerals and often desorption of surface sorbed elements (i.e. copper, cobalt and nickel). This is because in the preceding 25 weeks when the pH was above 7.0, these three elements would have been leached from the sulphide and then sequestered as secondary minerals (oxide and hydroxide mineral phases) or sorbed to mineral surfaces, thereby building up a stored ‘reservoir’ of leachable metals. As soon as the pH dropped below 7 (around week 25), the stored reservoir would have started dissolving and release these elements, in addition to the release from the sulphide mineral.
The behaviour described above for cobalt is not expected to occur in the field in NAG rock or PAG rock before the onset of ARD. The longer flow paths and much smaller water to rock ratio in waste rock dumps results in the pH being buffered higher and typically above pH 7. On-going testing of these humidity cells has shown maximum leaching rates for coper and nickel, followed by a gradual decrease, and cobalt is expected to show the same trend. This is likely a result of the stored reservoir being depleted and only sulphide oxidation rates contributing to on-going release.
Selenium was identified as enriched in the waste rock and tailings humidity cells when lower analytical detection limits than the exploration dataset were used. As previously discussed, the samples tested in humidity cells are among the highest sulphur samples in the dataset and as selenium is often an accessory element in sulphides like pyrite and chalcopyrite, the humidity cells may also contain among the highest selenium concentrations and the waste rock in general is not particularly a selenium leaching concern. Even if selenium was at concentrations that were a leaching concern, testing results to date have shown that selenium is present at concentrations below 1 mg/kg throughout the deposit, which does not provide an easy way to manage for selenium leaching potential (versus contiguous zones of elevated selenium). Given the typical occurrence of selenium with sulphur, the potential leaching impact of selenium in West Detour rock may be constrained to contact water from the West Detour PAG pile as this material would
SRK Consulting West Detour ML/ARD Characterization – FINAL Page 70
LBN/CBK/SJD WestDetour_MLARD_EAReport_Final_1CD011008_20160819_CBK_SJD_FNL August 2016
be expected to contain among the highest sulphur content of waste rock. Operational seepage monitoring of a West Detour PAG pile will help inform whether West Detour leach selenium at rates that require additional consideration such as treatment.
6.2.4 Application of Detour Lake Mine Management Plan
One of the objectives of the ML/ARD program is to provide inputs to management measures for handling waste rock to be conservatively protective of the environment. Waste rock management plans have been established for the DLM and the reactivity of the West Detour waste rock has been shown to be similar. Based on the outcomes of the work completed to date for West Detour (i.e. this study), there is no evidence to indicate that West Detour should be handled any differently than DLM waste rock. Delay to onset of ARD is expected to be longer than the life of mine and leaching potential will be low under neutral drainage conditions.
The amount of West Detour waste and mineralized rock that will need to be managed as PAG may be up to 50% based on ABA testing results. Block modeling has shown that this is potentially a conservative estimate and actual volumes will be closer to 70% NAG, 30% PAG. Operational monitoring will help refine this estimate.
Specific details of waste rock management are provided in DGC (2014), but SRK understands that the main components include identification of PAG and NAG rock prior to being mined and then subsequent segregation of NAG and PAG rock into distinct stockpiles for storage on-site. PAG waste rock and mineralized waste is to be placed in the north stockpile at West Detour, which will allow gravity drainage of acidic seepage if it develops at some point in the future.
Several approaches at the end of mine life to sustainably manage PAG material are still being considered, and may include re-handling to submerge under water in mined out pits or placing covers on the piles to inhibit oxygen diffusion.
6.2.5 Pit Wall Management Criteria
Block modeling pit walls showed that approximately 30% of the walls will likely be PAG, although the average NPTIC/AP for all pit walls blocks is 2.1 and the 30% appears to be spread out and not concentrated in any one zone. ARD from the pit walls should be managed as follows:
• Ensure all bedrock is submerged once the pit is full to inhibit sulphide oxidation. Based on overburden characteristics and geotechnical investigations by Golder (2016), the water level will only be a few metres below the surface and with overburden being up to 20 m thick over West Detour, no bedrock is expected to be exposed;
• Encourage filling the pit as fast as possible. Current estimates are around 30 years, which appears to be much shorted than ARD onset is expected to occur. Filling the pit faster than the natural rate can be accomplished by backfilling, which is currently in the mine plan to possibly include tailings, waste rock or possibly both.
SRK Consulting West Detour ML/ARD Characterization – FINAL Page 71
LBN/CBK/SJD WestDetour_MLARD_EAReport_Final_1CD011008_20160819_CBK_SJD_FNL August 2016
6.2.6 Tailings Management Criteria
Characterization of tailings shows that they are NAG, even with reasonable worst case scenarios comingled for testing in this investigation. The West Detour ore and DLM ore should continue to be comingled at a ratio of 0.1 to 0.9, respectively. Any deviations from this co-mingling ratio would need to assess the ARD potential of the ore prior to milling to ensure PAG tailings were not created.
While it is predicted that the tailings will be NAG for the life of the project, continued monitoring of metallurgical splits in the mill should be performed during operations to confirm the prediction. This sampling is currently happening as part of DLM tailings management.
Element leaching potential was shown to be low for trace elements and neutral pH leaching will also support low solubility of trace metals. Selenium was noted to be slightly enriched, although during operations leaching will be limited due to submergence of the majority of tailings with leaching only possible from the unsaturated beaches. This is because water submergence inhibits sulphide oxidation and selenium release (MEND 2015). At closure, a greater proportion of tailings will become unsaturated, but low oxygen diffusion rates may also support microbial communities capable of selenium reduction to less mobile forms (MEND 2015) and sequester dissolved selenium from pore water before it leaves the facility. Comparison of beach seepage and source terms during operations and closure will help better understand if this mechanism is happening in the TMA.
6.2.7 Overburden Management Criteria
Overburden generally has low ML/ARD potential, with only peat samples having ARD potential. SRK understands that the current plan is to stockpile overburden for reclamation and closure, but that there are considerations for segregation some of the organic rich overburden (which would include peat) and using this as a cover material on portions of the NAG dumps (DGC 2016).
In order to ensure ARD does not develop in either of the above scenarios, the peat will need to be comingled with till. This will likely happen naturally as the peat is present in relatively thin layers (maximum thickness up to 3 m), whereas the inorganic overburden in the area is up to 20 metres thick. Even within the peat layers, often other overburden types are intermixed (Golder 2016).
The amount of co-mingling required to buffer the peat from producing ARD was estimated by using 95th percentile and 5th percentile AP and NPTIC, respectively, for peat and mixing with average overburden (excluding peat) to determine what could be a reasonably high amount of peat mixed with overburden and still have a material that was NAG. The outcome to this approach indicates that a comingled peat – overburden mixture could contain 90% peat and only 10% overburden and still not produce ARD. Input parameters and calculation output are provided in Table 6-2.
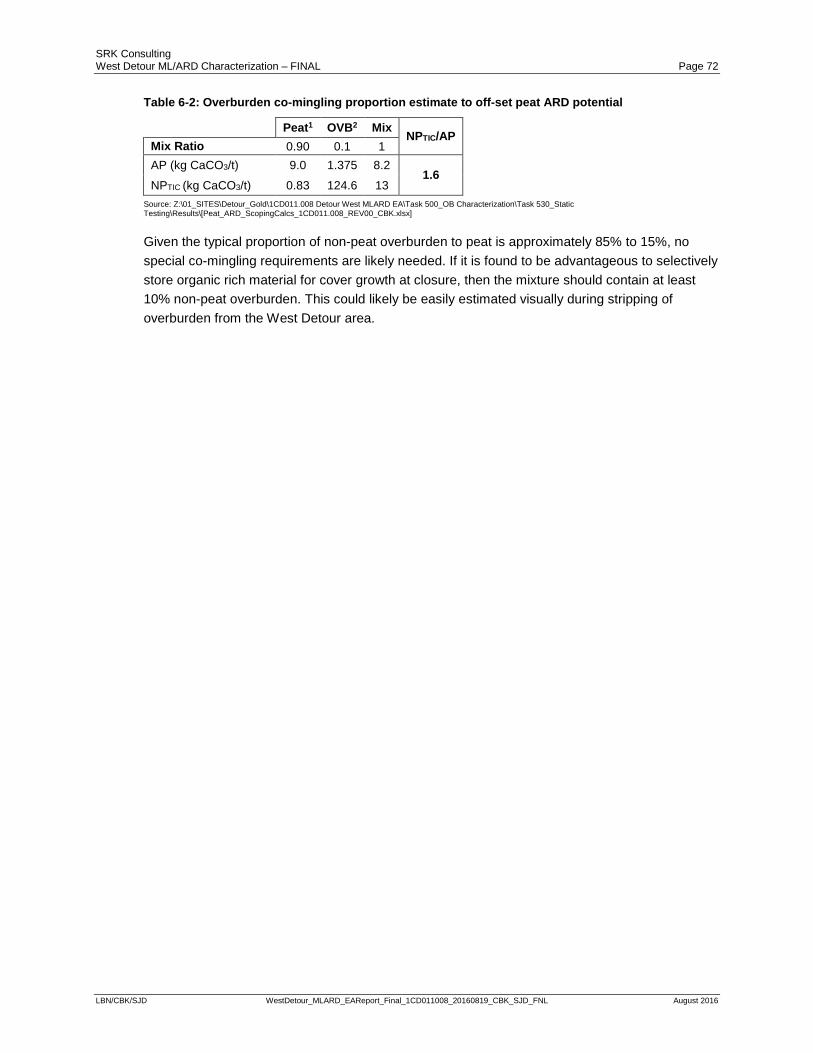
SRK Consulting West Detour ML/ARD Characterization – FINAL Page 72
LBN/CBK/SJD WestDetour_MLARD_EAReport_Final_1CD011008_20160819_CBK_SJD_FNL August 2016
Table 6-2: Overburden co-mingling proportion estimate to off-set peat ARD potential
Peat1 OVB2 Mix NPTIC/AP Mix Ratio 0.90 0.1 1 AP (kg CaCO3/t) 9.0 1.375 8.2
1.6 NPTIC (kg CaCO3/t) 0.83 124.6 13
Source: Z:\01_SITES\Detour_Gold\1CD011.008 Detour West MLARD EA\Task 500_OB Characterization\Task 530_Static Testing\Results\[Peat_ARD_ScopingCalcs_1CD011.008_REV00_CBK.xlsx]
Given the typical proportion of non-peat overburden to peat is approximately 85% to 15%, no special co-mingling requirements are likely needed. If it is found to be advantageous to selectively store organic rich material for cover growth at closure, then the mixture should contain at least 10% non-peat overburden. This could likely be easily estimated visually during stripping of overburden from the West Detour area.
SRK Consulting West Detour ML/ARD Characterization – FINAL Page 73
LBN/CBK/SJD WestDetour_MLARD_EAReport_Final_1CD011008_20160819_CBK_SJD_FNL August 2016
7 Conclusions The ML/ARD baseline characterization and prediction program indicates:
• Waste rock and mineralized rock contains up to 50% PAG material. Block modeling results indicate that there could be much less PAG material with the estimate closer to 30% PAG. Waste management planning should conservatively estimate 50% PAG material will need to be managed. Operational testing of waste and mineralized rock will help refine the proportion, and there may be opportunities to reduce PAG storage requirements, if the testing results are more consistent with block modeling predictions.
• For management of PAG rock, the segregation approach being used at the DLM is appropriate owing to long delays predicted on account of carbonate buffering for at least several decades. Several options exist to manage ARD from the PAG material at closure, from seepage management (e.g. drainage into the pit lake) to covers to backfilling into the open pit for water submergence to inhibit sulphide oxidation.
• The pit wall rock contains PAG material (~30%) but filling of the pit is expected to take place faster than ARD onset and inhibit sulphide oxidation. An additional consideration is that the majority of the pit wall is not expected to be PAG and buffering exists to inhibit ARD onset while the pit is filling.
• Overburden ML/ARD potential is low, although a portion of the peat samples have naturally become mildly acidic. There is excess acidity buffering in the majority of overburden and any peat acidity is expected to be neutralized.
• Tailings mixed with DLM tailings are NAG and have low ML potential. Any tailings submerged underwater will also be non-reactive in terms of sulphide oxidation and ML.
• The West Detour deposit is geologically similar to the DLM. Future water quality predictions can leverage the historical and on-going results from that site.
• The geochemical basis for reactivity has been established for West Detour. Geochemical source terms can now be developed for the project and used for site wide water quality predictions.
SRK Consulting West Detour ML/ARD Characterization – FINAL Page 74
LBN/CBK/SJD WestDetour_MLARD_EAReport_Final_1CD011008_20160819_CBK_SJD_FNL August 2016
This report, Metal Leaching and Acid Rock Drainage Characterization West Detour Deposit, was prepared by Original Signed By Lisa Barazzuol, PGeo. Senior Consultant (Geochemistry) Original Signed By Chris Kennedy, PGeo. Principal Consultant (Geochemistry) and reviewed by Original Signed By Stephen Day, PGeo. Corporate Consultant (Geochemistry) All data used as source material plus the text, tables, figures, and attachments of this document have been reviewed and prepared in accordance with generally accepted professional engineering and environmental practices. Disclaimer—SRK Consulting (Canada) Inc. has prepared this document for Detour Gold Corporation. Any use or decisions by which a third party makes of this document are the responsibility of such third parties. In no circumstance does SRK accept any consequential liability arising from commercial decisions or actions resulting from the use of this report by a third party.
The opinions expressed in this report have been based on the information available to SRK at the time of preparation. SRK has exercised all due care in reviewing information supplied by others for use on this project. Whilst SRK has compared key supplied data with expected values, the accuracy of the results and conclusions from the review are entirely reliant on the accuracy and completeness of the supplied data. SRK does not accept responsibility for any errors or omissions in the supplied information, except to the extent that SRK was hired to verify the data.
SRK Consulting West Detour ML/ARD Characterization – FINAL Page 75
LBN/CBK/SJD WestDetour_MLARD_EAReport_Final_1CD011008_20160819_CBK_SJD_FNL August 2016
8 References AMEC. 2010. Detour Lake Project, Metal Leaching and Acid Rock Drainage Characterization
Report – Vol I and II. Report Prepared for Detour Gold Corporation by AMEC Earth & Environmental, August 2010.
BBA. 2014. Block A Zone Testwork Program. Report prepared for Detour Gold by BBA. February 2014. BBA Project Number 5847013.
Clymo RS. 1984. The Limits to Peat Bog Growth. Philiosophical Transaction of the Royal Society B. Biological Sciences. January 1984.
Coastech Research. 1991. Acid Rock Drainage Prediction Manual. MEND Project 1.16.1b., March, 1991.
Day S, Sexsmith K, and Shaw S. 2014. Progress on Translating (“Scaling”) Laboratory Weathering Tests on Mine Wastes to Full Scale Facilities. Presentation and paper given at the B.C. BC MEND Workshop, December 4, 2014. Vancouver, B.C.
Day S, Kennedy C. 2015. Setting ARD management criteria for mine wastes with low sulfide and negligible carbonate content. 10th ICARD IMWA 2015. Santiago, Chile.
DGC. 2016. Mineral Resource and Reserve Estimate for the Detour Lake Property. 43-101 Technical Report. January 25, 2016.
Gao C. 2015. Results of Regional Till Sampling in the Detour Lake and Burntbush Area, Northern Ontario. Ontario Geological Survey, Open File Report 6297, 120 p.
Golder. 2016. Geotechnical Investigation (Draft 2) Report. Report prepared by Golder Associates for Detour Gold Corporation, May 2016.
INAP. 2010. The Guide for Acid Rock Drainage (GARD) produced by the International Network for Acid Prevention (http://www.inap.com.au/).
Kyle JH, Breuer PL, Bunney, KG, and Pleysier R. 2012. Review of trace toxic elements (Pb, Cd, Hg, As, Sb, Bi, Se, Te) and their deportment in gold processing. Part II: Deportment in gold ore processing by cyanidation Hydrometallurgy. Vol. 111-112, pp. 10–21.
Mattson B. 2005. MLARD Prediction: FeCO3 and Low Sulphide Minerals. Proceedings of the 12th Annual British Columbia – MEND ML/ARD Workshop. Challenges in the Prediction of Drainage Chemistry. November 30 and December 1, 2005. Vancouver, British Columbia.
McNeill B. 2016. Geochemical and Microbiological Characterization of the Historic Waste Rock Piles at the Detour Lake Mine. Master of Science Thesis, Department of Earth and Environmental Science, University of Waterloo.
SRK Consulting West Detour ML/ARD Characterization – FINAL Page 76
LBN/CBK/SJD WestDetour_MLARD_EAReport_Final_1CD011008_20160819_CBK_SJD_FNL August 2016
MEND. 1991. Acid Rock Drainage Prediction Manual. Mine Environment Neutral Drainage Program. Report 1.16.1b.
MEND. 2009. Prediction Manual for Drainage Chemistry from Sulphidic Geologic Material, MEND Report 1.20.1; Version 0 - Dec. 2009.
MEND 2015. Role of Nitrate in the Remobilization and Attenuation of Selenium in Coal Mine Waste Environments. Report 10.3.
Price W. 1997. Draft Guidelines and Recommended Methods for the Prediction of Metal Leaching and Acid Rock Drainage at Minesites in British Columbia. Reclamation Section, British Columbia Ministry of Energy and Mines. April 1997.
Price WA. 2009. Prediction Manual for Drainage Chemistry from Sulphidic Materials. Report prepared for MEND Program. MEND Report 1.20.1. 579p.
Red Chris Development Company. 2004. Red Chris Development Company Limited. 2004. Application for Environmental Assessment Certificate for the Red Chris Porphyry Project (October 2004). Volumes 1 to IV. Submitted to the British Columbia Environmental Assessment Office, October 2004.
Sobek AA, Schuller WA, Freeman JR, and Smith RM. 1978. Field and laboratory methods applicable to overburden and minesoils. USEPA Report No. 600/2-78-054, 203 pp.
SRK Consulting. 2006. Galore Creek Project ML/ARD Characterization Report. Report prepared for Novagold Resources Inc. SRK Project Number 1CR003.003. May 2006.
SRK Consulting. 2011. Expectations for Laboratory Geochemical Data Quality. Prepared for SGS Canada Inc.
SRK Consulting. 2013. Static Geochemical Characterization Report (ABA) of Mine Rock from the Block A Property, Detour Lake. Report prepared for Detour Gold Corp by SRK Consulting (Canada) Inc.
SRK Consulting. 2015. Geochemical Management of Waste Rock from Detour West, Detour Lake Mine. SRK Project Number 1CD011.004. November 2015.
SRK Consulting. 2016. Detour Lake Gold Mine – 2015 Annual ML/ARD Characterization Results of Operational Tailings. Memo prepared for Detour Gold Corp. SRK Project Number 1CD011.006. February 2016.
Watts, Griffis, and McOuat Limited. 2009. Technical Report and Mineral Resource Estimate on the Block A Property, Ontario, Canada. Prepared for Trade Winds Ventures Inc. and Detour Gold Corporation by Watts, Griffis and McOuat, Consulting Geologists and Engineers, July 9, 2009.
Appendix A – 2012 Waste Rock and Ore Static Sample Set – Static Data
Appendix B – Waste Rock Humidity Cell Tests – QEMSCAN Mineralogy Report
Appendix C – Waste Rock Humidity Cell Tests – Static Data
Appendix D – Waste Rock Humidity Cell Tests – Charts

Appendix E – Tailings Humidity Cell Tests – QEMSCAN Mineralogy Report
Appendix F – Tailings Humidity Cell Tests – Static Data
Appendix G – Tailings Humidity Cell Tests – Average Loadings Rates
Appendix H – Tailings Humidity Cell Tests – Charts
Appendix I – Overburden Samples – Static Data