Embed Size (px)
Citation preview
METAL ION COMPLEXING PROPERTIES OF THE HIGHLY PREORGANIZED
TETRADENTATE LIGAND 1,10-PHENANTHROLINE-2,9-DICARBOXAMIDE
Danielle Merrill
A Thesis Submitted to the
University of North Carolina Wilmington in Partial Fulfillment
of the Requirements for the Degree of
Master of Science
Department of Chemistry and Biochemistry
University of North Carolina Wilmington
2010
Approved by
Advisory Committee
Jeremy B. Morgan John A. Tyrell
Robert D. Hancock
Chair
Accepted by
_________________________________
Dean, Graduate School
ii
TABLE OF CONTENTS
ABSTRACT .........................................................................................................................v
ACKNOWLEDGMENTS ................................................................................................. vi
DEDICATION .................................................................................................................. vii
LIST OF TABLES ........................................................................................................... viii
LIST OF FIGURES ........................................................................................................... xi
INTRODUCTION ...............................................................................................................1
Ligands in Nuclear Waste Industry.................................................................................1
1,10-Phenanthroline-2,9-dicarboxamide.........................................................................5
Chelate Ring Size ............................................................................................................7
Hard and Soft Acid-Base (HSAB) Theory .....................................................................8
Donor Atoms .................................................................................................................11
Preorganization .............................................................................................................13
METHODS AND MATERIALS .......................................................................................15
General and Chemicals .................................................................................................15
Synthesis of PDAM ......................................................................................................15
UV/Vis Spectrophotometry ..........................................................................................19
iii
Fluorescence ................................................................................................................ 24
Degradation Experiment ................................................................................................27
Molecular Mechanics Calculations ...............................................................................27
RESULTS AND DISCUSSION ........................................................................................28
Synthesis of PDAM ......................................................................................................28
Protonation Constant .....................................................................................................40
Log K1 Results for Metal Ions Studied .........................................................................43
Nickel Results ...............................................................................................................46
Zinc Results ..................................................................................................................50
Scandium Results ..........................................................................................................55
Copper Results ..............................................................................................................59
Indium Results ..............................................................................................................63
Uranyl Results ...............................................................................................................67
Yttrium Results .............................................................................................................71
Thorium Results ............................................................................................................75
Cadmium Results ..........................................................................................................79
Calcium Results ............................................................................................................86
iv
Bismuth Results ............................................................................................................90
Lead Results ..................................................................................................................94
Lanthanide Series Results ............................................................................................ 97
Fluorescence Results ...................................................................................................126
PDAM Degradation Experiment .................................................................................136
Molecular Mechanics Calculations .............................................................................138
CONCLUSIONS..............................................................................................................141
REFERENCES ................................................................................................................143
v
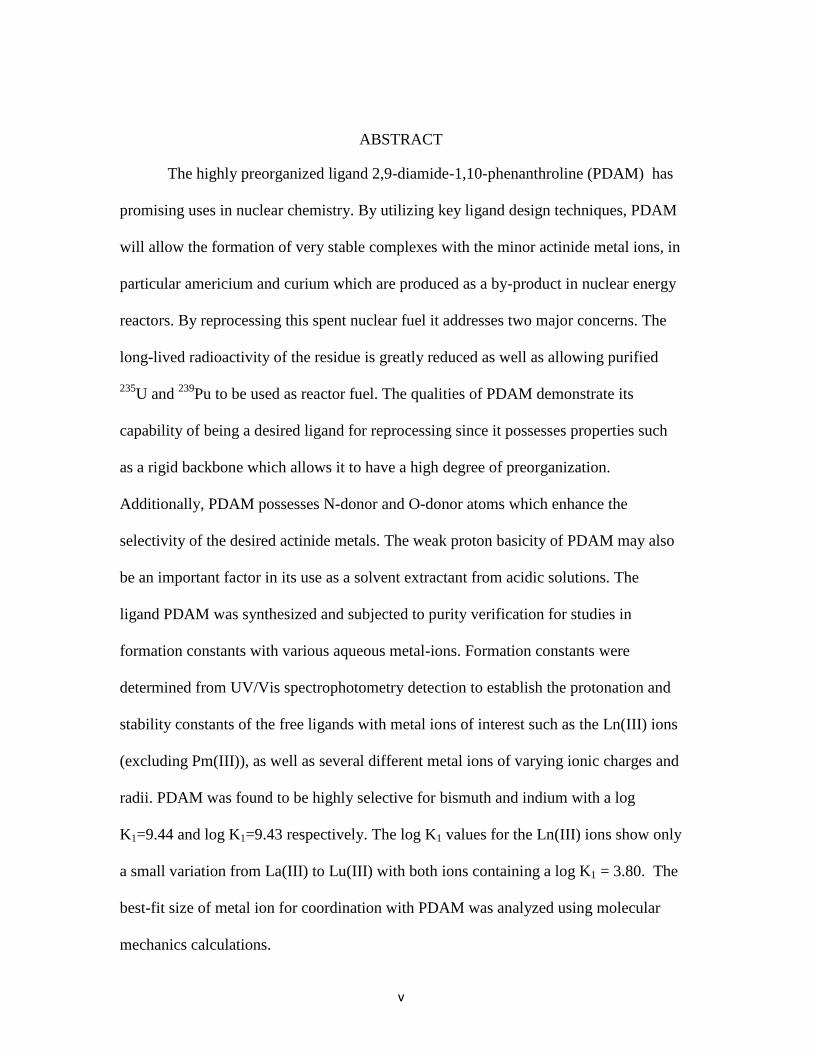
ABSTRACT
The highly preorganized ligand 2,9-diamide-1,10-phenanthroline (PDAM) has
promising uses in nuclear chemistry. By utilizing key ligand design techniques, PDAM
will allow the formation of very stable complexes with the minor actinide metal ions, in
particular americium and curium which are produced as a by-product in nuclear energy
reactors. By reprocessing this spent nuclear fuel it addresses two major concerns. The
long-lived radioactivity of the residue is greatly reduced as well as allowing purified
235U and
239Pu to be used as reactor fuel. The qualities of PDAM demonstrate its
capability of being a desired ligand for reprocessing since it possesses properties such
as a rigid backbone which allows it to have a high degree of preorganization.
Additionally, PDAM possesses N-donor and O-donor atoms which enhance the
selectivity of the desired actinide metals. The weak proton basicity of PDAM may also
be an important factor in its use as a solvent extractant from acidic solutions. The
ligand PDAM was synthesized and subjected to purity verification for studies in
formation constants with various aqueous metal-ions. Formation constants were
determined from UV/Vis spectrophotometry detection to establish the protonation and
stability constants of the free ligands with metal ions of interest such as the Ln(III) ions
(excluding Pm(III)), as well as several different metal ions of varying ionic charges and
radii. PDAM was found to be highly selective for bismuth and indium with a log
K1=9.44 and log K1=9.43 respectively. The log K1 values for the Ln(III) ions show only
a small variation from La(III) to Lu(III) with both ions containing a log K1 = 3.80. The
best-fit size of metal ion for coordination with PDAM was analyzed using molecular
mechanics calculations.
vi
ACKNOWLEDGEMENTS
I would like to thank my advisor Dr. Robert Hancock for all his help and
support in my academic career in addition to furthering my knowledge in the vast field
of inorganic chemistry. I would also like to thank my committee members Dr. John
Tyrell and Dr. Jeremy Morgan for their help in my endeavors.
Finally, I would like to thank my chemistry friends (Neil Williams, Amy Mroz,
Jennifer Wilent, Natalie Mitchell), my family and my wonderful boyfriend. Without
their support and encouragement through the hard times I would never be able to make
it to where I am today. Thank you all for the awesome memories!

vii
DEDICATION
I would like to dedicate my thesis to the most epic band of all time MUSE.
Thank you, Matt Bellamy, for your amazing vocals and guitar riffs to get me through
each day.
viii
LIST OF TABLES
Table Page
1. Classification of hard and soft acids and bases by HSAB principle .........................10
2. Formation constants for ammonia complexes in aqueous solution for a selection
of metal ions. .............................................................................................................12
3. Summary of prepared metal solutions ......................................................................20
4. Summary of prepared competition reaction solutions with PDAM all diluted
from1.0*10-3
stock solutions .....................................................................................21
5. Summary of the preparation of fluorescence solutions.............................................25
6. List of log K1 for PDAM with various metal ions in order of ionic radii (Å) ........44
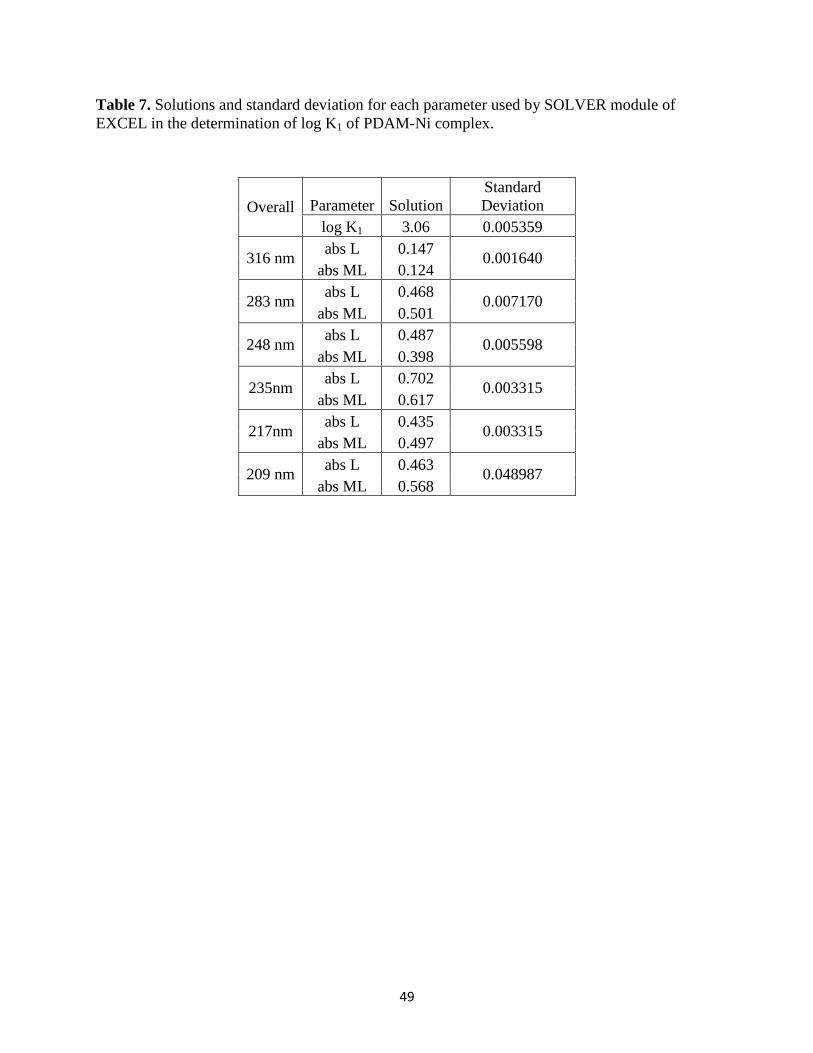
7. Solutions and standard deviation for each parameter used by SOLVER module
of EXCEL in the determination of log K1 of PDAM-Ni complex. .........................49
8. Solutions and standard deviation for each parameter used by SOLVER module
of EXCEL in the determination of log K1 of PDAM-Zn complex. .........................54
9. Solutions and standard deviation for each parameter used by SOLVER module
of EXCEL in the determination of log K1 of PDAM-Sc complex. .........................58
10. Solutions and standard deviation for each parameter used by SOLVER module
of EXCEL in the determination of log K1 of PDAM-Cu complex. .........................62
11. Solutions and standard deviation for each parameter used by SOLVER module
of EXCEL in the determination of log K1 of PDAM:TETREN:In 1:1:1. ...............66
12. Solutions and standard deviation for each parameter used by SOLVER module
of EXCEL in the determination of log K1 of PDAM-UO2 complex. ......................70
13. Solutions and standard deviation for each parameter used by SOLVER module
of EXCEL in the determination of log K1 of PDAM-Y complex. ...........................74
14. Solutions and standard deviation for each parameter used by SOLVER module
of EXCEL in the determination of log K1 of PDAM-Th complex. .........................78
15. Solutions and standard deviation for each parameter used by SOLVER module
of EXCEL in the determination of log K1 of PDAM:EDTA:Cd 1:1:1 complex.. ...84
ix
16. Solutions and standard deviation for each parameter used by SOLVER module
of EXCEL in the determination of log K1 of PDAM:TETREN:Cd 1:1:1
complex.. ..................................................................................................................84
17. Solutions and standard deviation for each parameter used by SOLVER module
of EXCEL in the determination of log K1 of PDAM-Ca complex. .........................89
18. Solutions and standard deviation for each parameter used by SOLVER module
of EXCEL in the determination of log K1 of PDAM:TETREN:Bi 1:1:1
complex. ....................................................................................................................92
19. Solutions and standard deviation for each parameter used by SOLVER module
of EXCEL in the determination of log K1 of PDAM:TETREN:Pb 1:1:1
complex. ...................................................................................................................97
20. Protonation and formation constants for the lanthanide(III) series with PDAM
determined in 0.1 M NaClO4 at 25 ºC. (L = PDAM in given equilibria) ..............103
21. Solutions and standard deviation for each parameter used by SOLVER module
of EXCEL in the determination of log K1 of PDAM-La complex. .......................119
22. Solutions and standard deviation for each parameter used by SOLVER module
of EXCEL in the determination of log K1 of PDAM-Ce complex. .......................119
23. Solutions and standard deviation for each parameter used by SOLVER module
of EXCEL in the determination of log K1 of PDAM-Pr complex. ........................119
24. Solutions and standard deviation for each parameter used by SOLVER module
of EXCEL in the determination of log K1 of PDAM-Nd complex. .......................120
25. Solutions and standard deviation for each parameter used by SOLVER module
of EXCEL in the determination of log K1 of PDAM-Sm complex. ......................120
26. Solutions and standard deviation for each parameter used by SOLVER module
of EXCEL in the determination of log K1 of PDAM-Eu complex. .......................121
27. Solutions and standard deviation for each parameter used by SOLVER module
of EXCEL in the determination of log K1 of PDAM-Gd complex. .......................121
28. Solutions and standard deviation for each parameter used by SOLVER module
of EXCEL in the determination of log K1 of PDAM-Tb complex. .......................122
x
29. Solutions and standard deviation for each parameter used by SOLVER module
of EXCEL in the determination of log K1 of PDAM-Dy complex. .......................122
30. Solutions and standard deviation for each parameter used by SOLVER module
of EXCEL in the determination of log K1 of PDAM-Ho complex.........................123
31. Solutions and standard deviation for each parameter used by SOLVER module
of EXCEL in the determination of log K1 of PDAM-Er complex ..........................123
32. Solutions and standard deviation for each parameter used by SOLVER module
of EXCEL in the determination of log K1 of PDAM-Tm complex ........................124
33. Solutions and standard deviation for each parameter used by SOLVER module
of EXCEL in the determination of log K1 of PDAM-Yb complex.........................124
34. Solutions and standard deviation for each parameter used by SOLVER module
of EXCEL in the determination of log K1 of PDAM-Lu complex .........................125
xi
LIST OF FIGURES
Figure Page
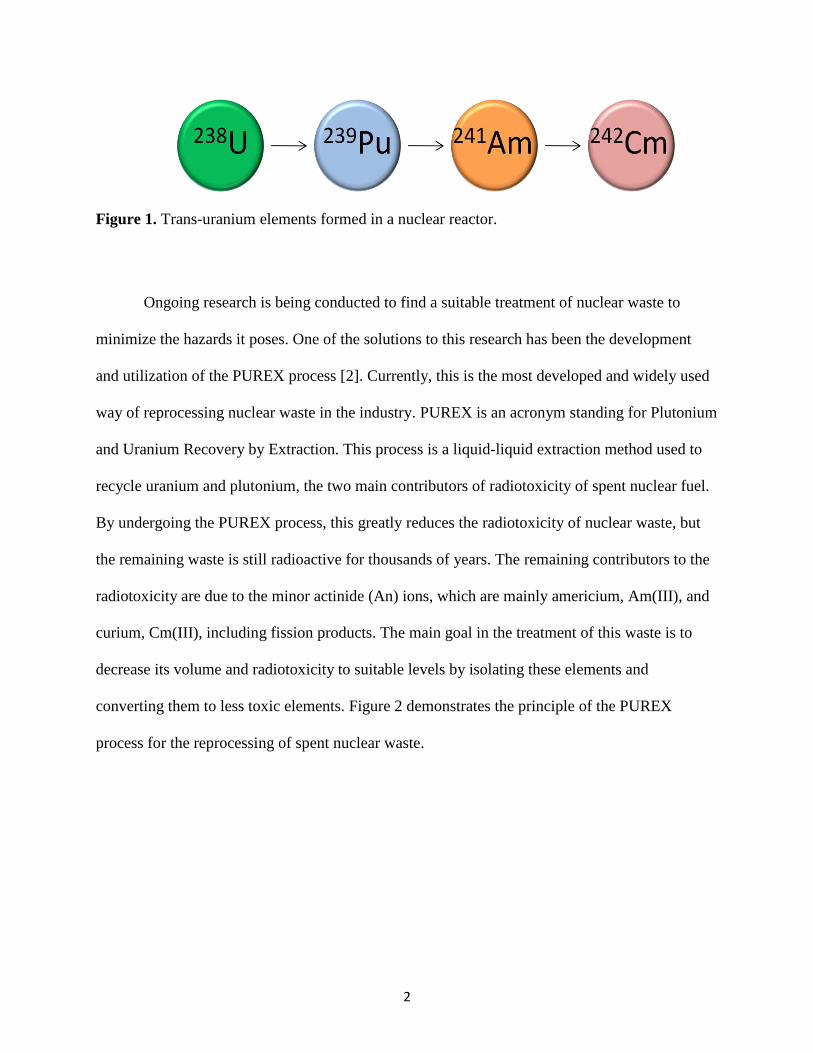
1. Trans-uranium elements formed in a nuclear reactor .................................................2
2. Diagram of the PUREX process for the separation of uranium and plutonium
from fission products ..................................................................................................3
3. Structures of BTP, TPEN, di-phenyl-phen, and TPTZ ...............................................5
4. Summarization of the ideal characteristics of the PDAM complex ............................6
5. Classification of metal according to HSAB principle and illustration of periodic
table trend....................................................................................................................9
6. Structure of L1, BTP, and TBP .................................................................................11
7. Structures of PDA, PDAM, DPP, 1,10-phen and PDALC .......................................13
8. Chemical structure of QUATERPY compared to the chemical structure of
PDAM to illustrate preorganization ..........................................................................14
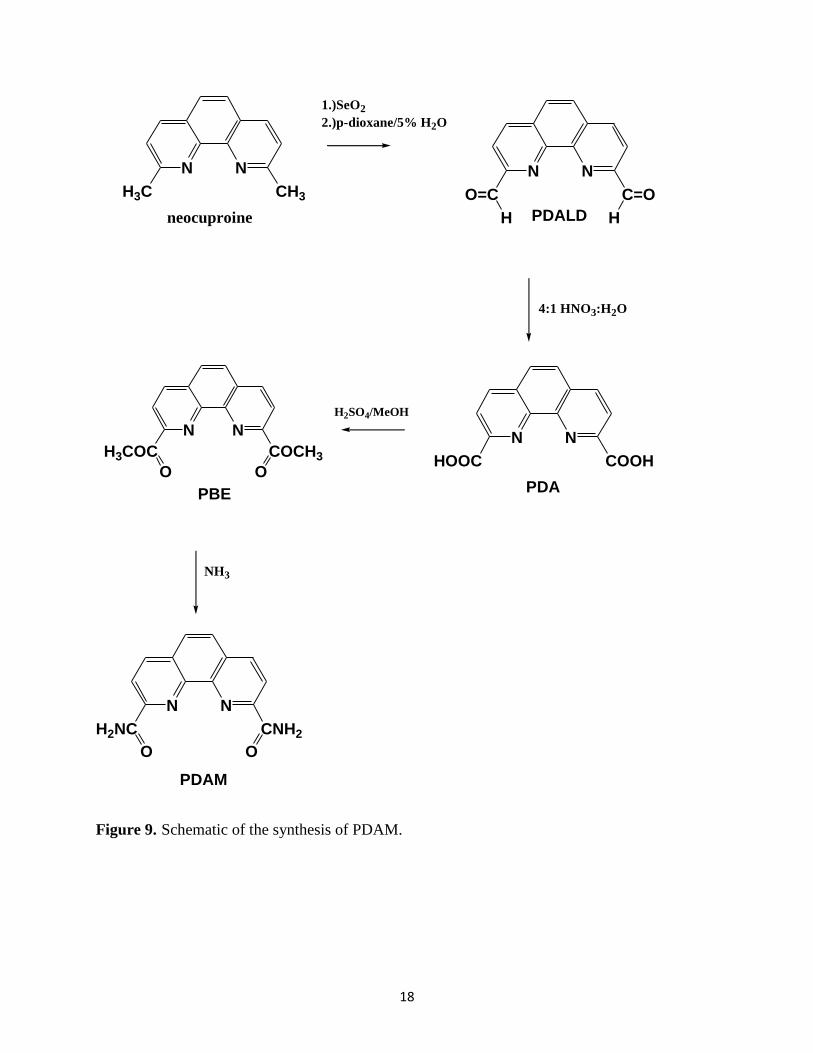
9. Schematic of the synthesis of PDAM. .....................................................................18
10. Diagram of a flow cell apparatus used in the titration experiments .........................23
11. Diagram of a flow cell apparatus used in fluorescence experiments ........................26
12. M-N and M-O bond lengths calculated through molecular mechanics
calculations. ..............................................................................................................27
13. IR-spectra of PDALD in KBr pellet .........................................................................29
14. NMR-spectra of PDALD in DMSO-d5 .....................................................................30
15. IR spectra of PDA in KBr pellet ...............................................................................32
16. NMR spectra of PDA in DMSO-d5 ..........................................................................33
17. IR-spectra of PBE in KBr pellet ...............................................................................35
18. NMR-spectra of PBE in DMSO-d5 ...........................................................................36
19. IR-spectra of PDAM in KBr pellet ...........................................................................38
xii
20. NMR-spectra of PDAM in DMSO-d5.......................................................................39
21. UV-Vis absorbance spectrum of the titration of PDAM at 2.00x10⁻⁵
M ...................41
22. Protonation equilibrium for 2,9-diamide-1,10-phenanthroline (PDAM) .................42
23. UV/Vis spectra of PDAM (2x10⁻⁵
M) and Ni(ClO4)2 (0.10 M) with 0.1 M
NaClO4 present held at a pH 5.37 .............................................................................47
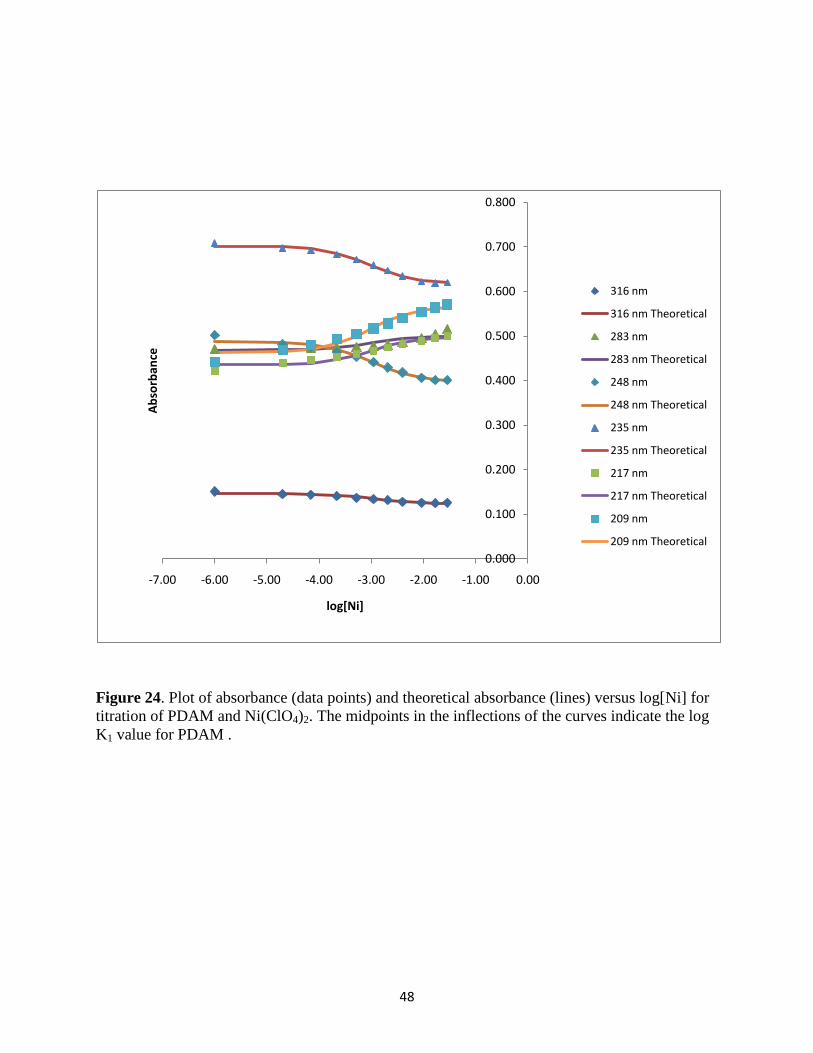
24. Plot of absorbance (data points) and theoretical absorbance (lines) versus
log[Ni] for titration of PDAM and Ni(ClO4)2. ..........................................................48
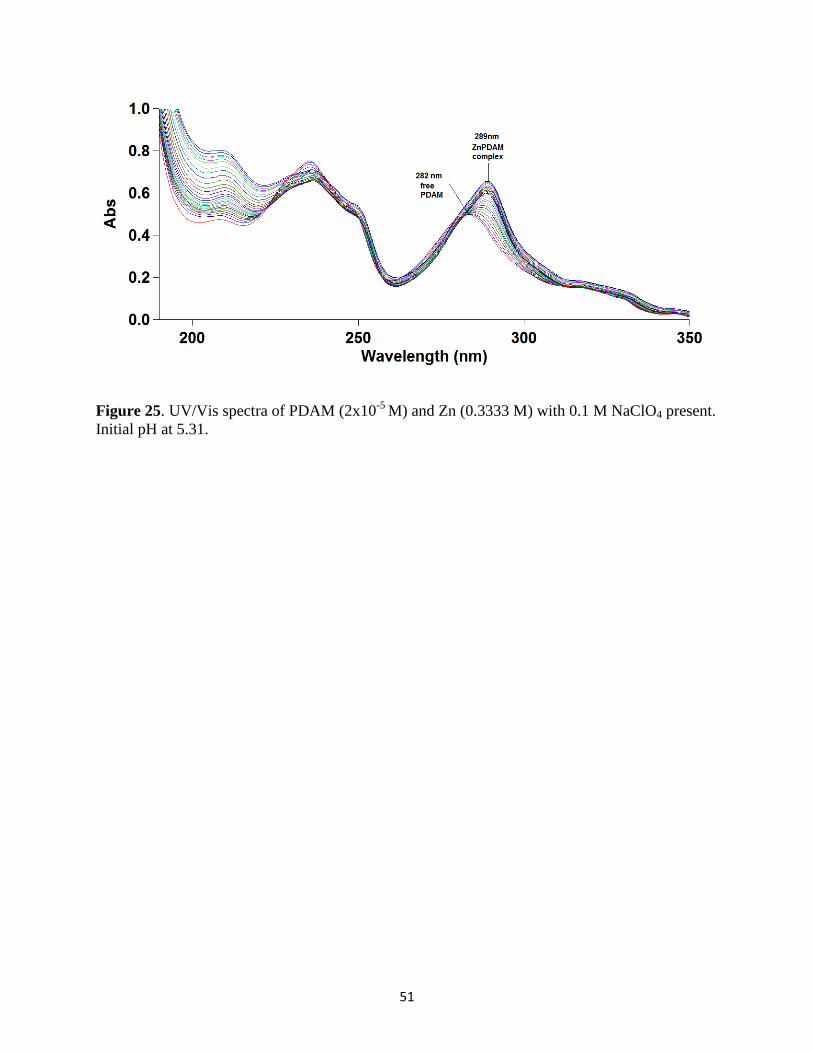
25. UV/Vis spectra of PDAM (2x10⁻⁵
M) and Zn (0.3333 M) with 0.1 M NaClO4
present. Initial pH at 5.31 ..........................................................................................51
26. UV/Vis spectra of PDAM (2x10⁻⁵
M) and Zn (0.3333 M) with 0.1 M NaClO4
present. Initial at pH 4.19 ..........................................................................................52
27. Plot of absorbance (data points) and theoretical absorbance (lines) versus
log[Zn] for titration of PDAM and Zn(ClO4)2. .........................................................53
28. UV/Vis spectra of PDAM (2x10⁻⁵
M) and Sc(0.003361 M) with 0.1 M NaClO4
present. Initial pH at 2.14. .........................................................................................56
29. Plot of absorbance (data points) and theoretical absorbance (lines) versus
log[Sc] for titration of PDAM and Sc(ClO4)3. ..........................................................57
30. UV/Vis spectra of PDAM:TETREN:In (2x10⁻⁵
M) with 0.1 M NaClO4 present.
Initial pH at 2.07 to a final pH of 7.31. .....................................................................60
31. Plot of absorbance (data points) and theoretical absorbance (lines) versus pH for
titration of PDAM:TETREN:In (2x10⁻⁵
M). ..............................................................61
32. UV/Vis spectra of PDAM (2x10⁻⁵
M) and UO2(0.003333 M) with 0.1 M
NaClO4 present. Initial pH at 2.11. ...........................................................................64
33. Plot of absorbance (data points) and theoretical absorbance (lines) versus
log[UO2] for titration of PDAM and UO2(NO3)2. ....................................................65
34. UV/Vis spectra of PDAM (2x10⁻⁵
M) and Cu(0.003522 M) with 0.1 M NaClO4
present. Initial pH at 2.14. .........................................................................................68
35. Plot of absorbance (data points) and theoretical absorbance (lines) versus
log[Cu] for titration of PDAM and Cu(ClO4)2 ........................................................69
xiii
36. UV/Vis spectra of PDAM (2x10⁻⁵
M) and Y(0.003333 M) with 0.1 M NaClO4
present. Initial pH at 2.22. .........................................................................................72
37. Plot of absorbance (data points) and theoretical absorbance (lines) versus log[Y]
for titration of PDAM and Y(NO3)3..........................................................................73
38. UV/Vis spectra of PDAM (2x10⁻⁵
M) and Th(0.003488 M) with 0.1 M NaClO4
present. Initial pH at 2.23. .........................................................................................76
39. Plot of absorbance (data points) and theoretical absorbance (lines) versus
log[Th] for titration of PDAM and Th(NO3)4. ..........................................................77
40. UV/Vis spectra of PDAM (2x10⁻⁵
M) and Cd(0.003230 M) with 0.1 M NaClO4
present. Initial pH at 5.50. .........................................................................................80
41. UV/Vis spectra of PDAM:Cd(ClO4)3:EDTA 1:1:1 (2x10⁻⁵
M) and 0.1 M
NaClO4 present. Initial at pH 2.20. ...........................................................................81
42. UV/Vis spectra of PDAM:Cd(ClO4)3:TETREN 1:1:1 (2x10⁻⁵
M) and 0.1 M
NaClO4 present. Initial at pH 2.44 to a final pH of 9.49. ..........................................82
43. Plot of corrected absorbance (data points) and theoretical absorbance (lines)
versus pH for titration of 1:1:1 PDAM:Cd(ClO4)2:EDTA. ......................................83
44. Plot of corrected absorbance (data points) and theoretical absorbance (lines)
versus pH for titration of 1:1:1 PDAM:Cd(ClO4)2:TETREN. ..................................84
45. UV/Vis spectra of PDAM (2x10⁻⁵
M) and Ca(1.0 M) with 0.1 M NaClO4
present. Initial pH 5.37..............................................................................................87
46. Plot of absorbance (data points) and theoretical absorbance (lines) versus
log[Ca] for titration of PDAM and Ca(ClO4)2. .........................................................88
47. UV/Vis spectra of PDAM:TETREN:Bi (2x10⁻⁵
M) with 0.1 M NaClO4 present.
Initial pH at 2.10 to a final pH of 7.11. .....................................................................91
48. Plot of absorbance (data points) and theoretical absorbance (lines) versus
pH for titration of PDAM:TETREN:Bi (2x10⁻⁵
M). ..................................................92
49. UV/Vis spectra of PDAM :TETREN:Pb 1:1:1 (2x10⁻⁵
M) with 0.1 M NaClO4
present. Initial pH at 2.27 to final pH of 8.11. ..........................................................95
50. Plot of absorbance (data points) and theoretical absorbance (lines) versus
pH for titration of PDAM:TETREN:Pb 1:1:1 ..........................................................96
xiv
51. UV/Vis spectra of PDAM (2x10⁻⁵
M) and Ce(0.003333 M) with 0.1 M NaClO4
present. Note the sharp band at 250 nm. ...................................................................99
52. Plot of change in log K1 for various ligands comparing the La(III) complex for
Ln(III) ions as a function of the number of f-electrons ..........................................100
53. Comparison of ionic radii for the Ln(III) ions in angstroms. .................................101
54. UV/Vis spectra of PDAM (2x10⁻⁵
M) and La(0.003333M) with 0.1 M NaClO4
present. Initial pH at 5.46 ........................................................................................104
55. UV/Vis spectra of PDAM (2x10⁻⁵
M) and Ce(0.003333 M) with 0.1 M NaClO4
present. Initial pH at 4.70 ........................................................................................105
56. UV/Vis spectra of PDAM (2x10⁻⁵
M) and Pr(0.003402 M) with 0.1 M NaClO4
present. Initial pH at 2.27 ........................................................................................105
57. UV/Vis spectra of PDAM (2x10⁻⁵
M) and Nd(0.003385 M) with 0.1 M NaClO4
present. Initial pH at 2.12. .......................................................................................106
58. UV/Vis spectra of PDAM (2x10⁻⁵
M) and Sm(0.003505 M) with 0.1 M NaClO4
present. Initial pH at 2.25. .......................................................................................106
59. UV/Vis spectra of PDAM (2x10⁻⁵
M) and Eu(0.003360 M) with 0.1 M NaClO4
present. Initial pH at 2.17 .......................................................................................107
60. UV/Vis spectra of PDAM (2x10⁻⁵
M) and Gd (0.003333M) with 0.1 M NaClO4
present. Initial pH at 4.18. .......................................................................................107
61. UV/Vis spectra of PDAM (2x10⁻⁵
M) and Tb(0.003557 M) with 0.1 M NaClO4
present. Initial pH at 2.28. .......................................................................................108
62. UV/Vis spectra of PDAM (2x10⁻⁵
M) and Dy(0.003557 M) with 0.1 M NaClO4
present. Initial pH at 2.16. .......................................................................................108
63. UV/Vis spectra of PDAM (2x10⁻⁵
M) and Ho(0.003271 M) with 0.1 M NaClO4
present. Initial pH at 2.20. .......................................................................................109
64. UV/Vis spectra of PDAM (2x10⁻⁵
M) and Er(0.003354 M) with 0.1 M NaClO4
present. Initial pH at 2.22. .......................................................................................109
65. UV/Vis spectra of PDAM (2x10⁻⁵
M) and Tm(0.003343 M) with 0.1 M NaClO4
present. Initial pH at 2.23. .......................................................................................110
xv
66. UV/Vis spectra of PDAM (2x10⁻⁵
M) and Yb(0.003333 M) with 0.1 M NaClO4
present. Initial pH at 5.51. .......................................................................................110
67. UV/Vis spectra of PDAM (2x10⁻⁵
M) and Lu (0.003333M) with 0.1 M NaClO4
present. Initial pH at 4.15. .......................................................................................111
68. Plot of absorbance (data points) and theoretical absorbance (lines) versus
log[La] for titration of PDAM and La(ClO4)3. .......................................................112
69. Plot of absorbance (data points) and theoretical absorbance (lines) versus
log[Ce] for titration of PDAM and Ce(ClO4)4. .......................................................112
70. Plot of absorbance (data points) and theoretical absorbance (lines) versus
log[Pr] for titration of PDAM and Pr(ClO4)3. .........................................................113
71. Plot of absorbance (data points) and theoretical absorbance (lines) versus
log[Nd] for titration of PDAM and Nd(ClO4)3. ......................................................113
72. Plot of absorbance (data points) and theoretical absorbance (lines) versus
log[Sm] for titration of PDAM and Sm(ClO4)3. .....................................................114
73. Plot of absorbance (data points) and theoretical absorbance (lines) versus
log[Eu] for titration of PDAM and Eu(OSO2CF3)3. ...............................................114
74. Plot of absorbance (data points) and theoretical absorbance (lines) versus
log[Gd] for titration of PDAM and Gd(ClO4) 3. .....................................................115
75. Plot of absorbance (data points) and theoretical absorbance (lines) versus
log[Tb] for titration of PDAM and Tb(ClO4)3. .......................................................115
76. Plot of absorbance (data points) and theoretical absorbance (lines) versus
log[Dy] for titration of PDAM and Dy(ClO4)3. ......................................................116
77. Plot of absorbance (data points) and theoretical absorbance (lines) versus
log[Ho] for titration of PDAM and Ho(ClO4)3. ......................................................116
78. Plot of absorbance (data points) and theoretical absorbance (lines) versus
log[Er] for titration of PDAM and Er(ClO4)3. ........................................................117
79. Plot of absorbance (data points) and theoretical absorbance (lines) versus
log[Tm] for titration of PDAM and Tm(CF3SO3)3. ................................................117
80. Plot of absorbance (data points) and theoretical absorbance (lines) versus
log[Yb] for titration of PDAM and Yb(NO3)3. .......................................................118
xvi
81. Plot of absorbance (data points) and theoretical absorbance (lines) versus
log[Lu] for titration of PDAM and Lu(ClO4)3. .......................................................118
82. Resonance of PDAM when bound to a metal, (M) .................................................127
83. Fluorescence spectrum of 2x10⁻⁵
M PDAM as a function of emission intensity
(a.u.) versus wavelength (nm). Excitation wavelength = 250 nm ..........................128
84. Fluorescence spectra of 2x10⁻⁵
M PDAM as a function of Zn(II) concentration,
in exponent-form notation.......................................................................................129
85. Fluorescence spectra of 2x10⁻⁵
M PDAM as a function of Gd(II) concentration,
in exponent-form notation.......................................................................................130
86. Fluorescence spectra of 2x10⁻⁵
M PDAM as a function of Cd(II) concentration,
in exponent-form notation.......................................................................................131
87. Fluorescence spectra of 2x10⁻⁵
M PDAM as a function of Sc(II) concentration,
in exponent-form notation.......................................................................................132
88. Fluorescence spectra of 2x10⁻⁵
M PDAM as a function of Pb(III) concentration,
in exponent-form notation.......................................................................................133
89. Fluorescence spectra of 2x10⁻⁵
M PDAM as a function of Pb(III) concentration,
in exponent-form notation...................................................................................... 134
90. Fluorescence spectra of 2x10⁻⁵
M PDAM as a function of Lu(III) concentration,
in exponent-form notation.......................................................................................135
91. UV/Vis spectra of PDAM degradation experiment ................................................137
92. The polynomial equation of strain energy (U) for [M(PDAM)(H2O)2]3+ as a
function of M-N bond length determined by MM calculations. .............................139
93. Predicted structure of [Y(PDAM)(NO3)3] through MM calculations .....................140

xvii
INTRODUCTION
Ligands in Nuclear Waste Treatment
As the demand for energy increases at alarming rates, there has been a growing
awareness of the need to find efficient sources of energy. As of 2005, nuclear power provided
6.3% of the world’s energy and 15% of the world’s electricity [1]. Countries that use the most
nuclear energy as fuel include the United States, France, and Japan. When combined together,
they account for 56.5% of nuclear generated electricity. Many countries have considered nuclear
energy because it is a sustainable energy source with a low emission rate on greenhouse gases.
Consequently, a key problem the nuclear energy industry faces is the radioactivity of its waste
that spent nuclear fuel generates. Even with this risk posed, many countries such as Jordan,
Malaysia, Vietnam, Indonesia, United Arab Emirates and Nigeria are turning to nuclear power
plants as their major source of energy, thereby increasing the importance of reprocessing of spent
nuclear fuel.
There are many important chemical reactions that occur in a nuclear reactor. The most
common source of fuel source during the nuclear process is uranium-235, U235
. The other isotope
present in nuclear waste, U238
, undergoes transmutation when a neutron collides with U238
causing it to trans-mutate into a larger element, plutonium-239, P239
. This isotope in turn trans-
mutates into larger metal ions which are called the trans-uranium elements. Particular trans-
uranium ions of interest in the reuse of nuclear fuel are americium(III), Am(III), and curium(III),
Cm(III) as shown in Figure 1.
2
Figure 1. Trans-uranium elements formed in a nuclear reactor.
Ongoing research is being conducted to find a suitable treatment of nuclear waste to
minimize the hazards it poses. One of the solutions to this research has been the development
and utilization of the PUREX process [2]. Currently, this is the most developed and widely used
way of reprocessing nuclear waste in the industry. PUREX is an acronym standing for Plutonium
and Uranium Recovery by Extraction. This process is a liquid-liquid extraction method used to
recycle uranium and plutonium, the two main contributors of radiotoxicity of spent nuclear fuel.
By undergoing the PUREX process, this greatly reduces the radiotoxicity of nuclear waste, but
the remaining waste is still radioactive for thousands of years. The remaining contributors to the
radiotoxicity are due to the minor actinide (An) ions, which are mainly americium, Am(III), and
curium, Cm(III), including fission products. The main goal in the treatment of this waste is to
decrease its volume and radiotoxicity to suitable levels by isolating these elements and
converting them to less toxic elements. Figure 2 demonstrates the principle of the PUREX
process for the reprocessing of spent nuclear waste.
3
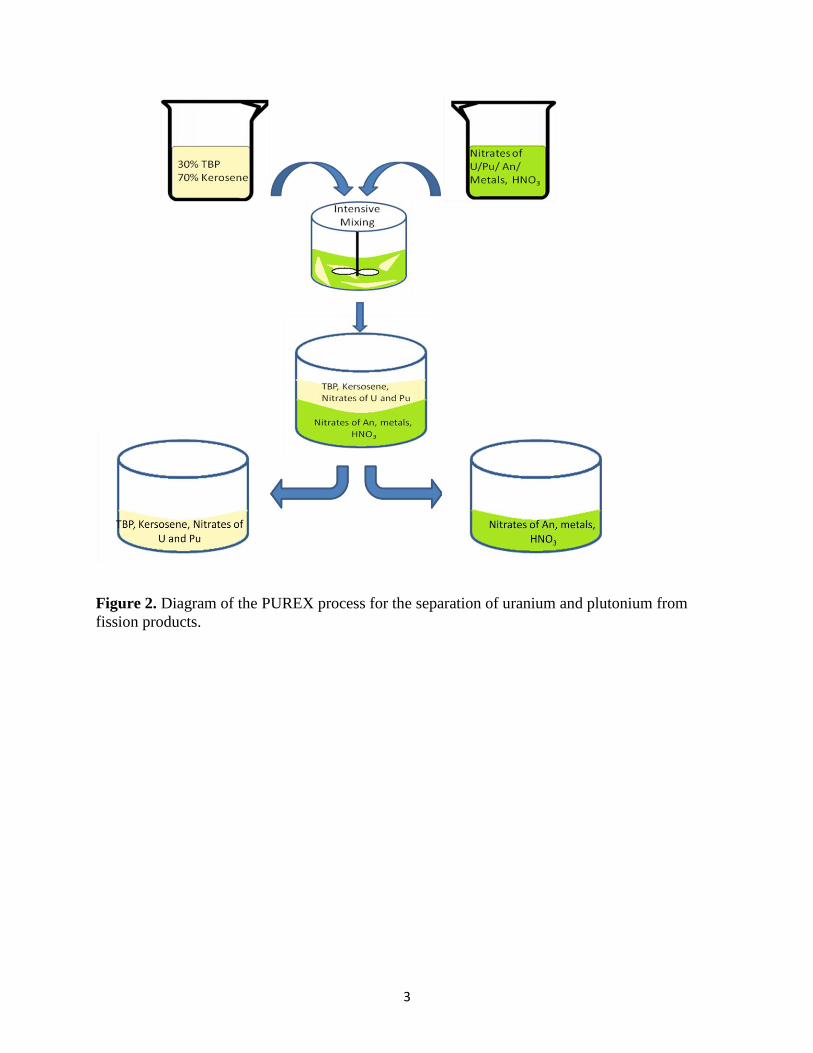
Figure 2. Diagram of the PUREX process for the separation of uranium and plutonium from
fission products.
4
As seen in Figure 2, the first step of the separation of nuclear waste begins with the
dissolution of irradiated fuel in aqueous nitric acid. The organic solvent extraction is composed
of 30% tributyl phosphate (TBP) in kerosene. The aqueous and organic phases are mixed
thoroughly to allow the uranium and plutonium to transfer into the organic phase. The minor
actinides and smaller metals including the fission products remain in the aqueous phase. Further
extractions allow uranium to be separated from plutonium to be recycled as fuel.
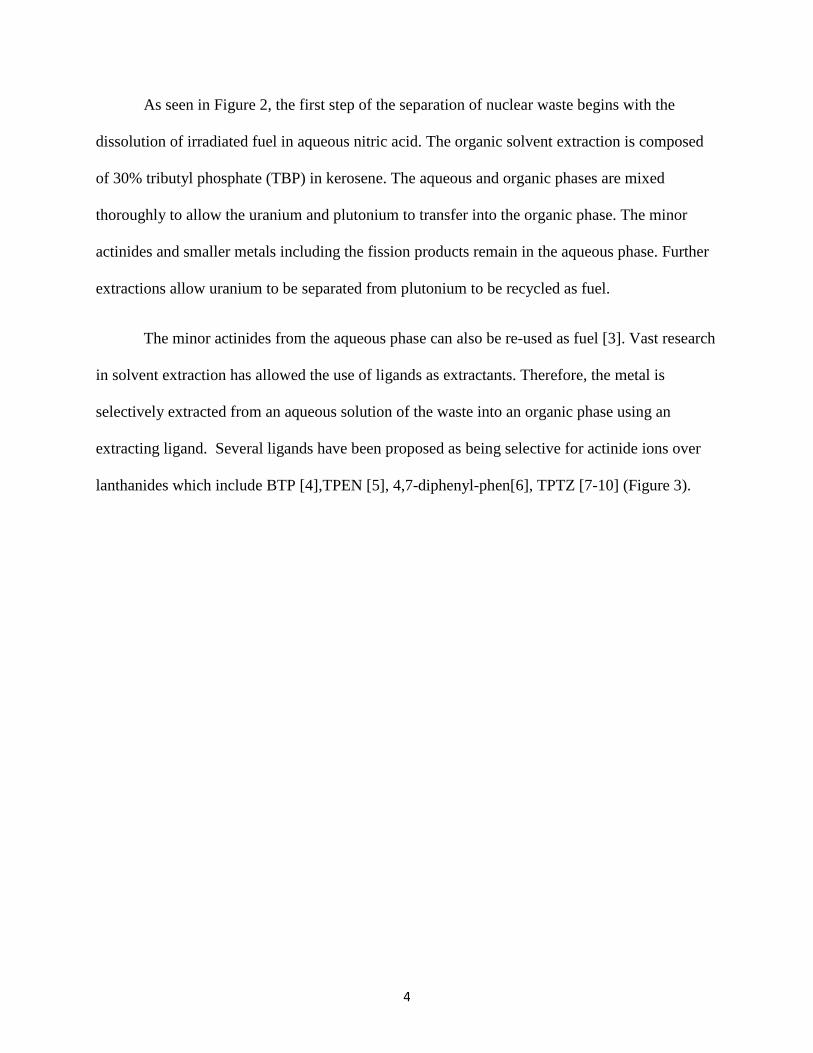
The minor actinides from the aqueous phase can also be re-used as fuel [3]. Vast research
in solvent extraction has allowed the use of ligands as extractants. Therefore, the metal is
selectively extracted from an aqueous solution of the waste into an organic phase using an
extracting ligand. Several ligands have been proposed as being selective for actinide ions over
lanthanides which include BTP [4],TPEN [5], 4,7-diphenyl-phen[6], TPTZ [7-10] (Figure 3).
5
NN
NN
NN
NN
N
BTP
N
N NN
N
N
TPEN
di-phenyl-phen
N
N
NN
N
N
TPTZ
Figure 3. Structures of BTP, TPEN, di-phenyl-phen, and TPTZ.
1,10-phenanthroline-2,9-dicarboxamide
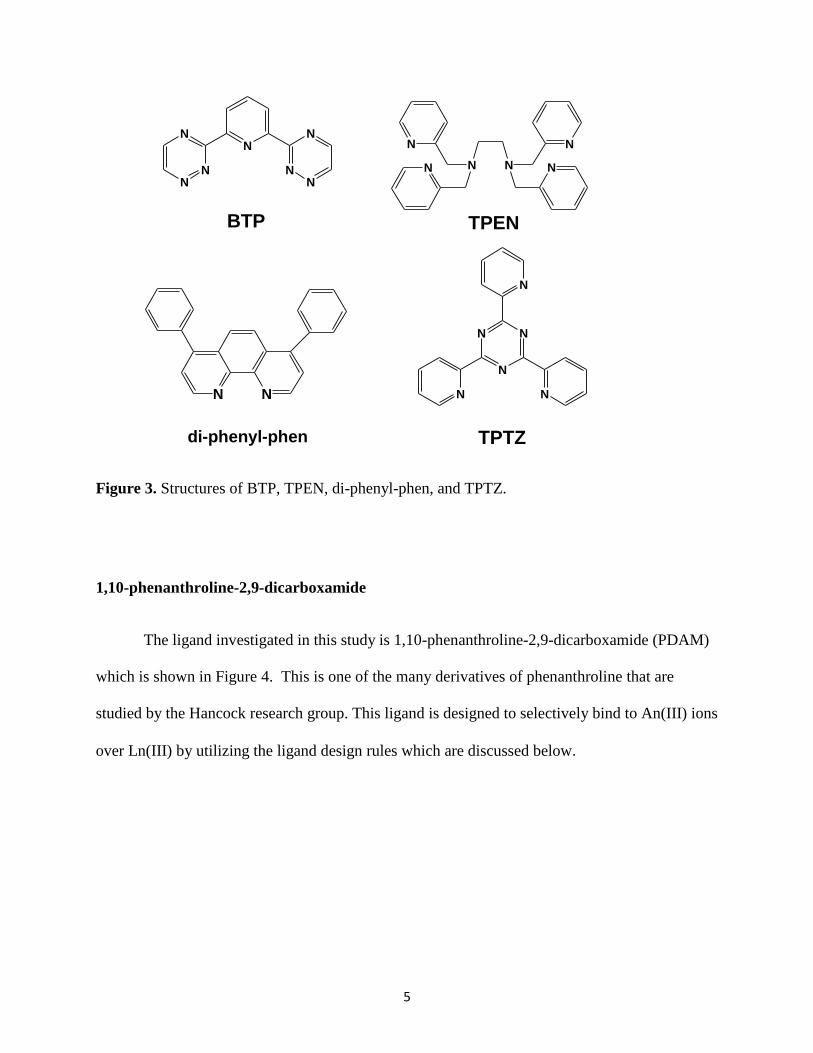
The ligand investigated in this study is 1,10-phenanthroline-2,9-dicarboxamide (PDAM)
which is shown in Figure 4. This is one of the many derivatives of phenanthroline that are
studied by the Hancock research group. This ligand is designed to selectively bind to An(III) ions
over Ln(III) by utilizing the ligand design rules which are discussed below.
6
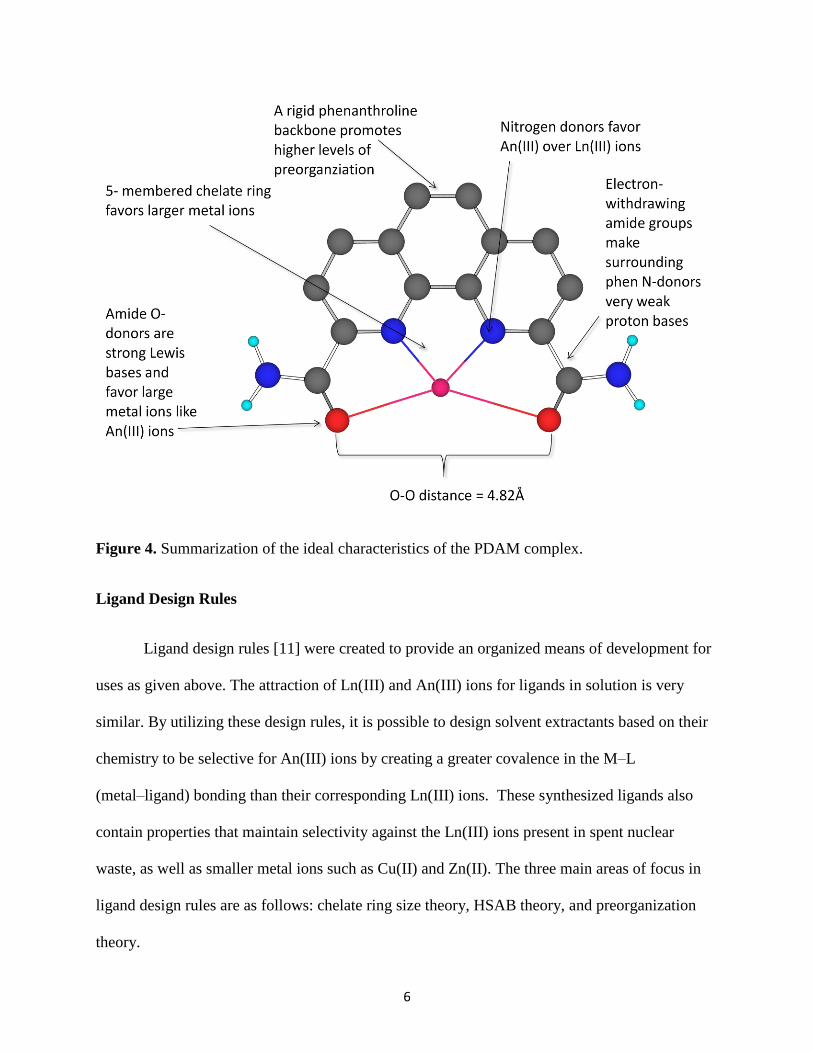
Figure 4. Summarization of the ideal characteristics of the PDAM complex.
Ligand Design Rules
Ligand design rules [11] were created to provide an organized means of development for
uses as given above. The attraction of Ln(III) and An(III) ions for ligands in solution is very
similar. By utilizing these design rules, it is possible to design solvent extractants based on their
chemistry to be selective for An(III) ions by creating a greater covalence in the M–L
(metal–ligand) bonding than their corresponding Ln(III) ions. These synthesized ligands also
contain properties that maintain selectivity against the Ln(III) ions present in spent nuclear
waste, as well as smaller metal ions such as Cu(II) and Zn(II). The three main areas of focus in
ligand design rules are as follows: chelate ring size theory, HSAB theory, and preorganization
theory.
7
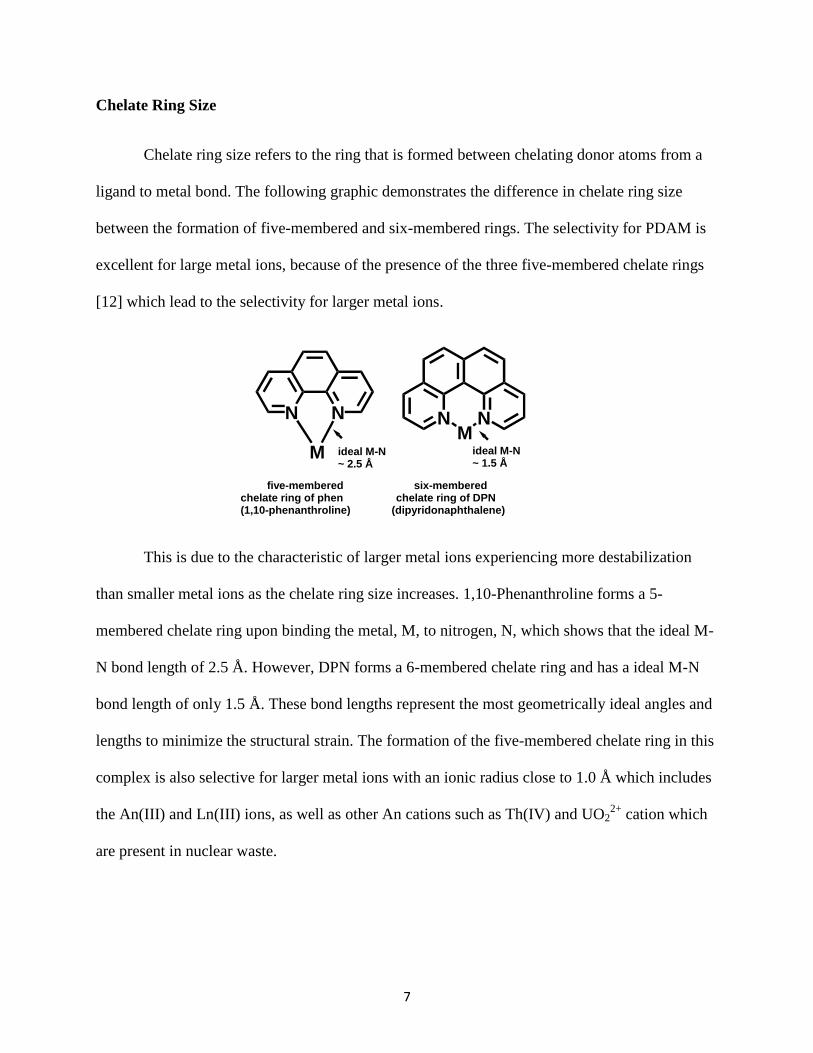
Chelate Ring Size
Chelate ring size refers to the ring that is formed between chelating donor atoms from a
ligand to metal bond. The following graphic demonstrates the difference in chelate ring size
between the formation of five-membered and six-membered rings. The selectivity for PDAM is
excellent for large metal ions, because of the presence of the three five-membered chelate rings
[12] which lead to the selectivity for larger metal ions.
N N N N
MM
ideal M-N~ 1.5 Å
ideal M-N~ 2.5 Å
five-membered six-memberedchelate ring of phen chelate ring of DPN(1,10-phenanthroline) (dipyridonaphthalene)
This is due to the characteristic of larger metal ions experiencing more destabilization
than smaller metal ions as the chelate ring size increases. 1,10-Phenanthroline forms a 5-
membered chelate ring upon binding the metal, M, to nitrogen, N, which shows that the ideal M-
N bond length of 2.5 Å. However, DPN forms a 6-membered chelate ring and has a ideal M-N
bond length of only 1.5 Å. These bond lengths represent the most geometrically ideal angles and
lengths to minimize the structural strain. The formation of the five-membered chelate ring in this
complex is also selective for larger metal ions with an ionic radius close to 1.0 Å which includes
the An(III) and Ln(III) ions, as well as other An cations such as Th(IV) and UO22+
cation which
are present in nuclear waste.
8
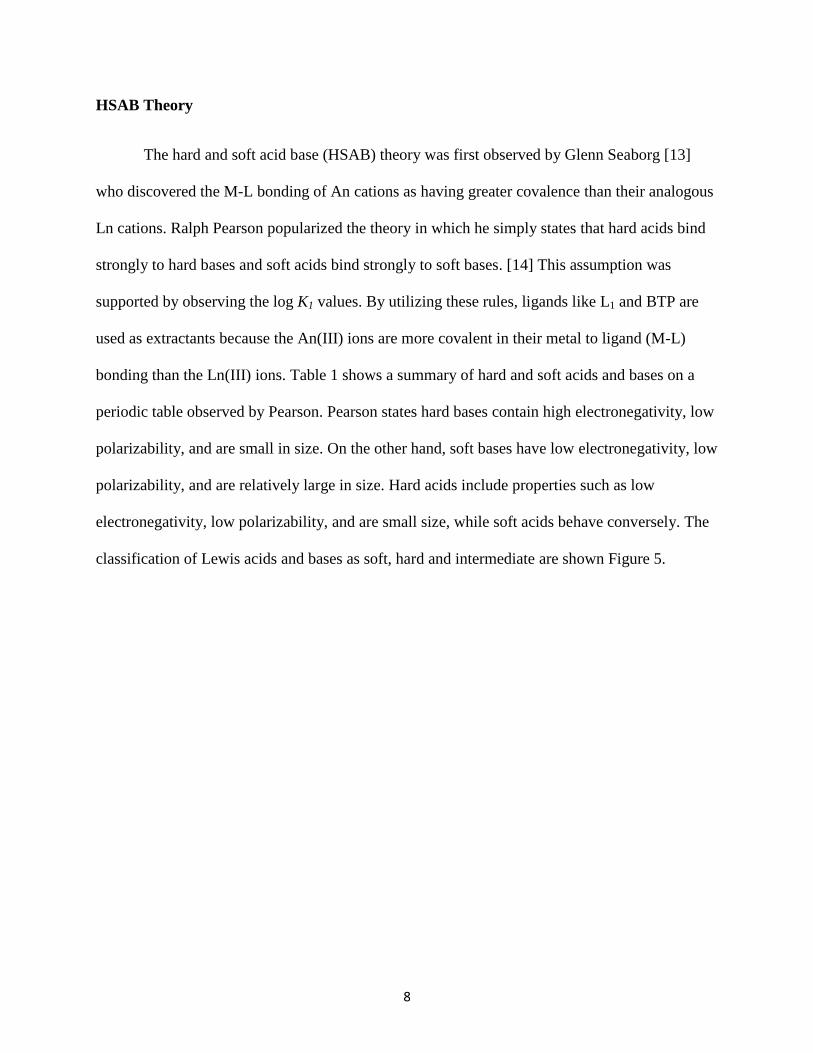
HSAB Theory
The hard and soft acid base (HSAB) theory was first observed by Glenn Seaborg [13]
who discovered the M-L bonding of An cations as having greater covalence than their analogous
Ln cations. Ralph Pearson popularized the theory in which he simply states that hard acids bind
strongly to hard bases and soft acids bind strongly to soft bases. [14] This assumption was
supported by observing the log K1 values. By utilizing these rules, ligands like L1 and BTP are
used as extractants because the An(III) ions are more covalent in their metal to ligand (M-L)
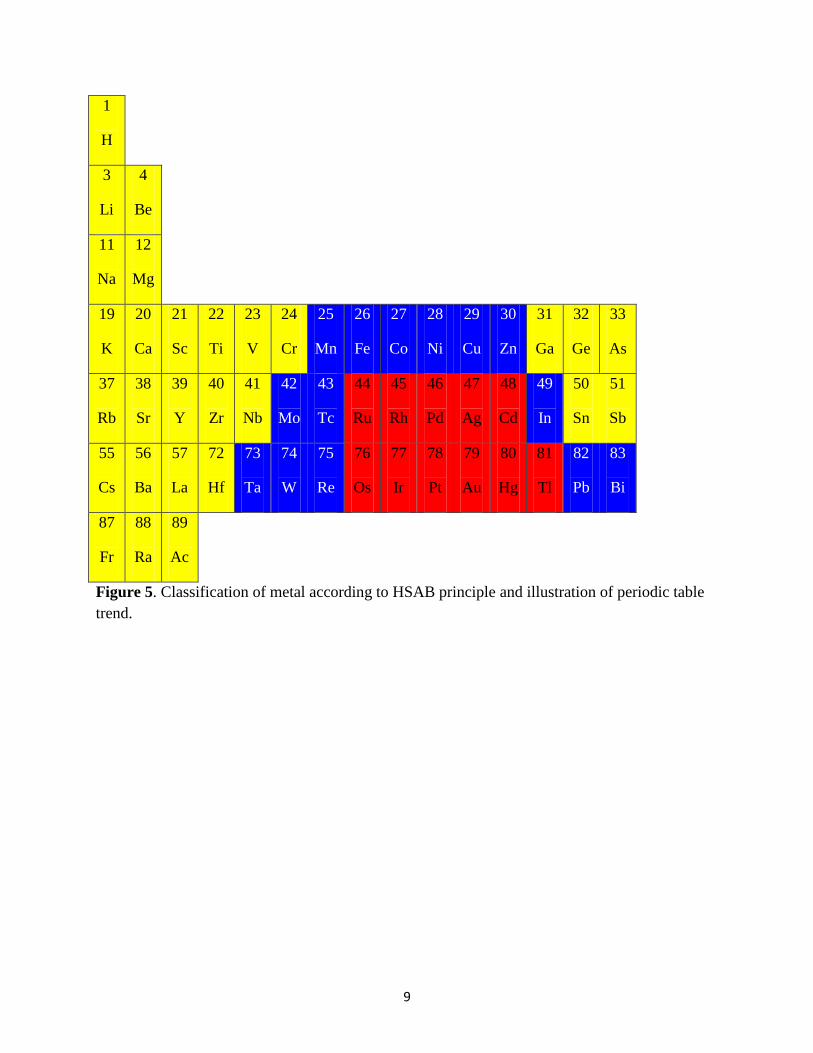
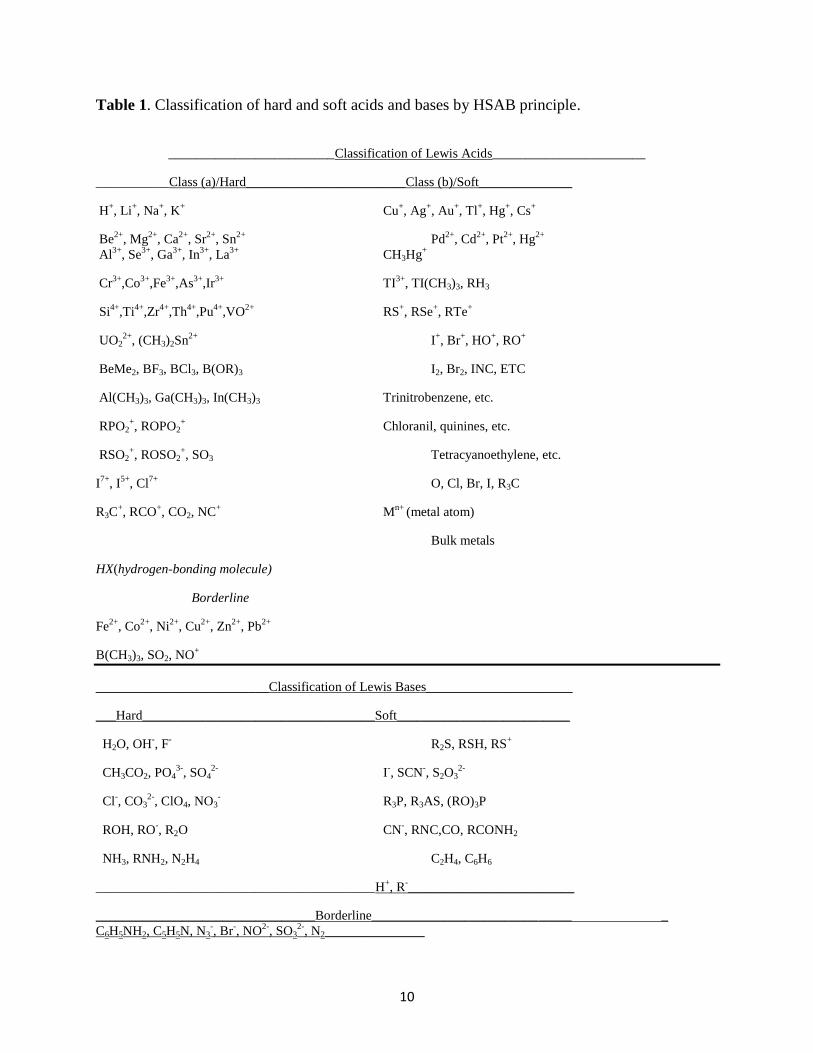
bonding than the Ln(III) ions. Table 1 shows a summary of hard and soft acids and bases on a
periodic table observed by Pearson. Pearson states hard bases contain high electronegativity, low
polarizability, and are small in size. On the other hand, soft bases have low electronegativity, low
polarizability, and are relatively large in size. Hard acids include properties such as low
electronegativity, low polarizability, and are small size, while soft acids behave conversely. The
classification of Lewis acids and bases as soft, hard and intermediate are shown Figure 5.
9
1
H
3
Li
4
Be
11
Na
12
Mg
19
K
20
Ca
21
Sc
22
Ti
23
V
24
Cr
25
Mn
26
Fe
27
Co
28
Ni
29
Cu
30
Zn
31
Ga
32
Ge
33
As
37
Rb
38
Sr
39
Y
40
Zr
41
Nb
42
Mo
43
Tc
44
Ru
45
Rh
46
Pd
47
Ag
48
Cd
49
In
50
Sn
51
Sb
55
Cs
56
Ba
57
La
72
Hf
73
Ta
74
W
75
Re
76
Os
77
Ir
78
Pt
79
Au
80
Hg
81
Tl
82
Pb
83
Bi
87
Fr
88
Ra
89
Ac
Figure 5. Classification of metal according to HSAB principle and illustration of periodic table
trend.
10
Table 1. Classification of hard and soft acids and bases by HSAB principle.
_________________________Classification of Lewis Acids_______________________
___________Class (a)/Hard________________________Class (b)/Soft______________
H+, Li
+, Na
+, K
+ Cu
+, Ag
+, Au
+, Tl
+, Hg
+, Cs
+
Be2+
, Mg2+
, Ca2+
, Sr2+
, Sn2+
Pd2+
, Cd2+
, Pt2+
, Hg2+
Al3+
, Se3+
, Ga3+
, In3+
, La3+
CH3Hg+
Cr3+
,Co3+
,Fe3+
,As3+
,Ir3+
TI3+
, TI(CH3)3, RH3
Si4+
,Ti4+
,Zr4+
,Th4+
,Pu4+
,VO2+
RS+, RSe
+, RTe
+
UO22+
, (CH3)2Sn2+
I+, Br
+, HO
+, RO
+
BeMe2, BF3, BCl3, B(OR)3 I2, Br2, INC, ETC
Al(CH3)3, Ga(CH3)3, In(CH3)3 Trinitrobenzene, etc.
RPO2+, ROPO2
+ Chloranil, quinines, etc.
RSO2+, ROSO2
+, SO3 Tetracyanoethylene, etc.
I7+
, I5+
, Cl7+
O, Cl, Br, I, R3C
R3C+, RCO
+, CO2, NC
+ M
n+ (metal atom)
Bulk metals
HX(hydrogen-bonding molecule)
Borderline
Fe2+
, Co2+
, Ni2+
, Cu2+
, Zn2+
, Pb2+
B(CH3)3, SO2, NO+
__________________________Classification of Lewis Bases______________________
___Hard___________________________________Soft__________________________
H2O, OH-, F
- R2S, RSH, RS
+
CH3CO2, PO43-
, SO42-
I-, SCN
-, S2O3
2-
Cl-, CO3
2-, ClO4, NO3
- R3P, R3AS, (RO)3P
ROH, RO-, R2O CN
-, RNC,CO, RCONH2
NH3, RNH2, N2H4 C2H4, C6H6
__________________________________________H+, R
-_________________________
_________________________________Borderline______________________________ _
C6H5NH2, C5H5N, N3-, Br
-, NO
2-, SO3
2-, N2_______________
11
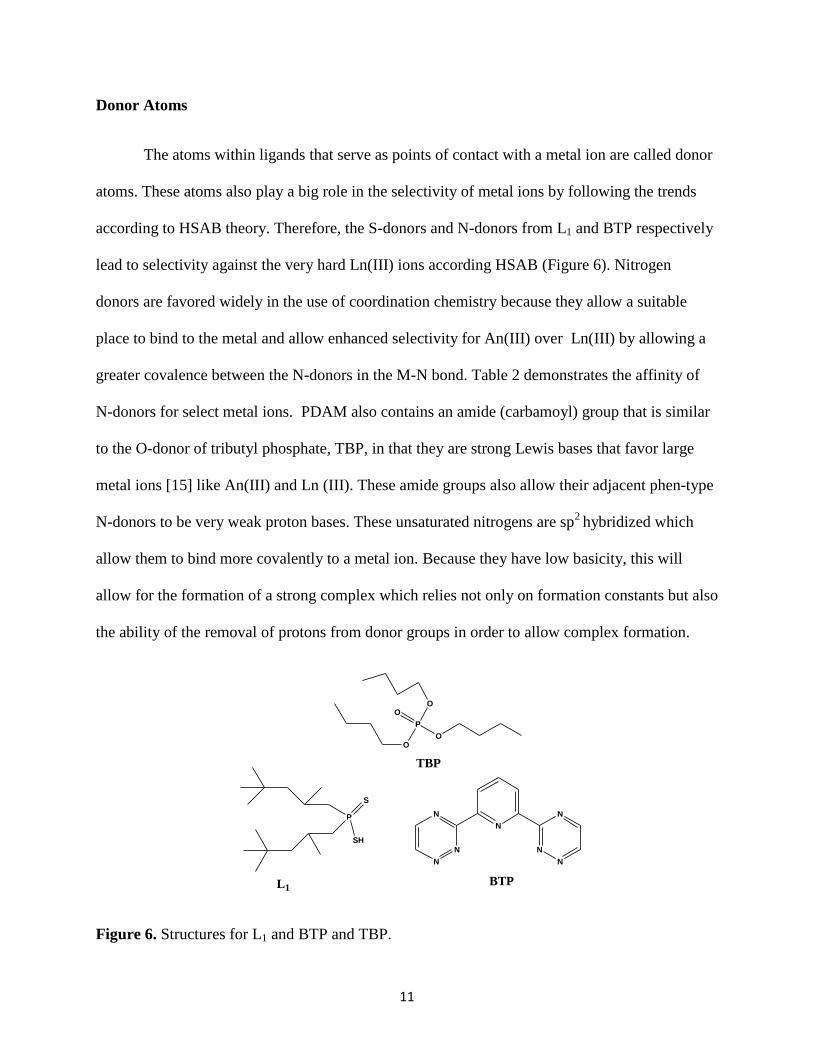
Donor Atoms
The atoms within ligands that serve as points of contact with a metal ion are called donor
atoms. These atoms also play a big role in the selectivity of metal ions by following the trends
according to HSAB theory. Therefore, the S-donors and N-donors from L1 and BTP respectively
lead to selectivity against the very hard Ln(III) ions according HSAB (Figure 6). Nitrogen
donors are favored widely in the use of coordination chemistry because they allow a suitable
place to bind to the metal and allow enhanced selectivity for An(III) over Ln(III) by allowing a
greater covalence between the N-donors in the M-N bond. Table 2 demonstrates the affinity of
N-donors for select metal ions. PDAM also contains an amide (carbamoyl) group that is similar
to the O-donor of tributyl phosphate, TBP, in that they are strong Lewis bases that favor large
metal ions [15] like An(III) and Ln (III). These amide groups also allow their adjacent phen-type
N-donors to be very weak proton bases. These unsaturated nitrogens are sp2
hybridized which
allow them to bind more covalently to a metal ion. Because they have low basicity, this will
allow for the formation of a strong complex which relies not only on formation constants but also
the ability of the removal of protons from donor groups in order to allow complex formation.
P
OO
OO
TBP
P
S
SH
L1
N
N
N
N
N
N
N
BTP
Figure 6. Structures for L1 and BTP and TBP.
12
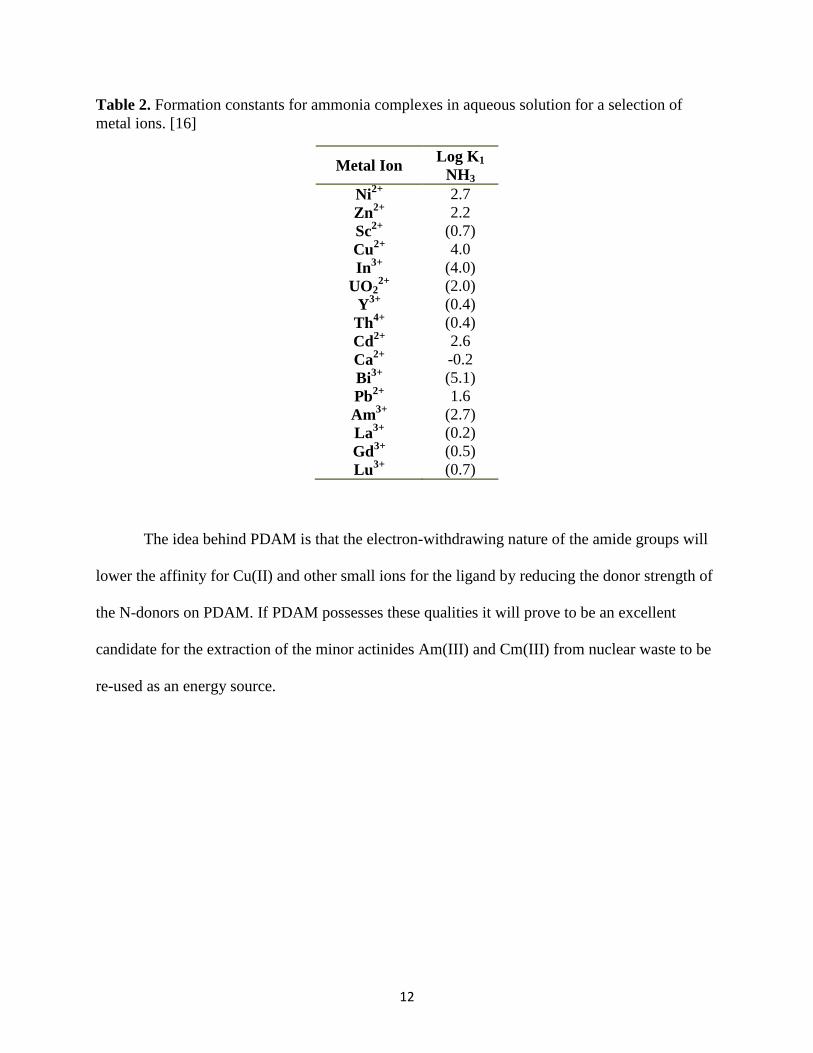
Table 2. Formation constants for ammonia complexes in aqueous solution for a selection of
metal ions. [16]
Metal Ion Log K1
NH3
Ni2+
2.7
Zn2+
2.2
Sc2+
(0.7)
Cu2+
4.0
In3+
(4.0)
UO22+
(2.0)
Y3+
(0.4)
Th4+
(0.4)
Cd2+
2.6
Ca2+
-0.2
Bi3+
(5.1)
Pb2+
1.6
Am3+
(2.7)
La3+
(0.2)
Gd3+
(0.5)
Lu3+
(0.7)
The idea behind PDAM is that the electron-withdrawing nature of the amide groups will
lower the affinity for Cu(II) and other small ions for the ligand by reducing the donor strength of
the N-donors on PDAM. If PDAM possesses these qualities it will prove to be an excellent
candidate for the extraction of the minor actinides Am(III) and Cm(III) from nuclear waste to be
re-used as an energy source.
13
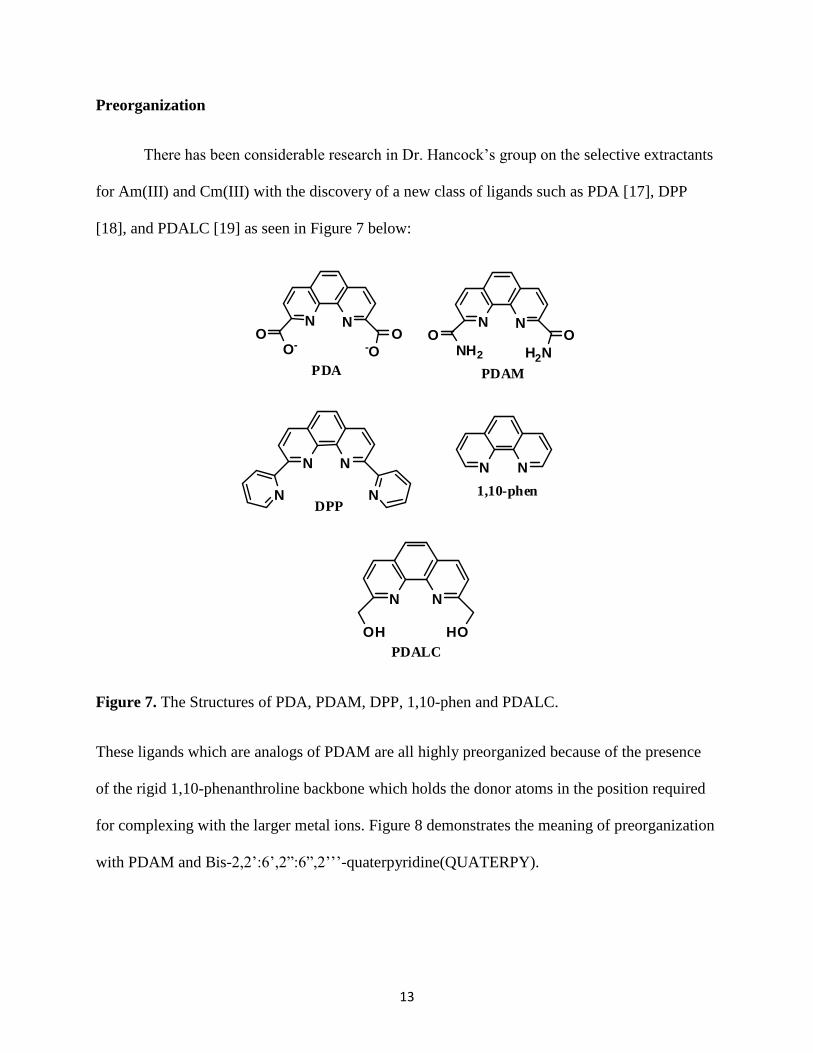
Preorganization
There has been considerable research in Dr. Hancock’s group on the selective extractants
for Am(III) and Cm(III) with the discovery of a new class of ligands such as PDA [17], DPP
[18], and PDALC [19] as seen in Figure 7 below:
Figure 7. The Structures of PDA, PDAM, DPP, 1,10-phen and PDALC.
These ligands which are analogs of PDAM are all highly preorganized because of the presence
of the rigid 1,10-phenanthroline backbone which holds the donor atoms in the position required
for complexing with the larger metal ions. Figure 8 demonstrates the meaning of preorganization
with PDAM and Bis-2,2’:6’,2”:6”,2’’’-quaterpyridine(QUATERPY).
N NO
-O
OO-
PDA
N NO
H2N
ONH2
PDAM
N N
N NDPP
N N
1,10-phen
N N
HOOH
PDALC
14
a)
N
N
N
N
b)
N N
O
H2N
O
NH2
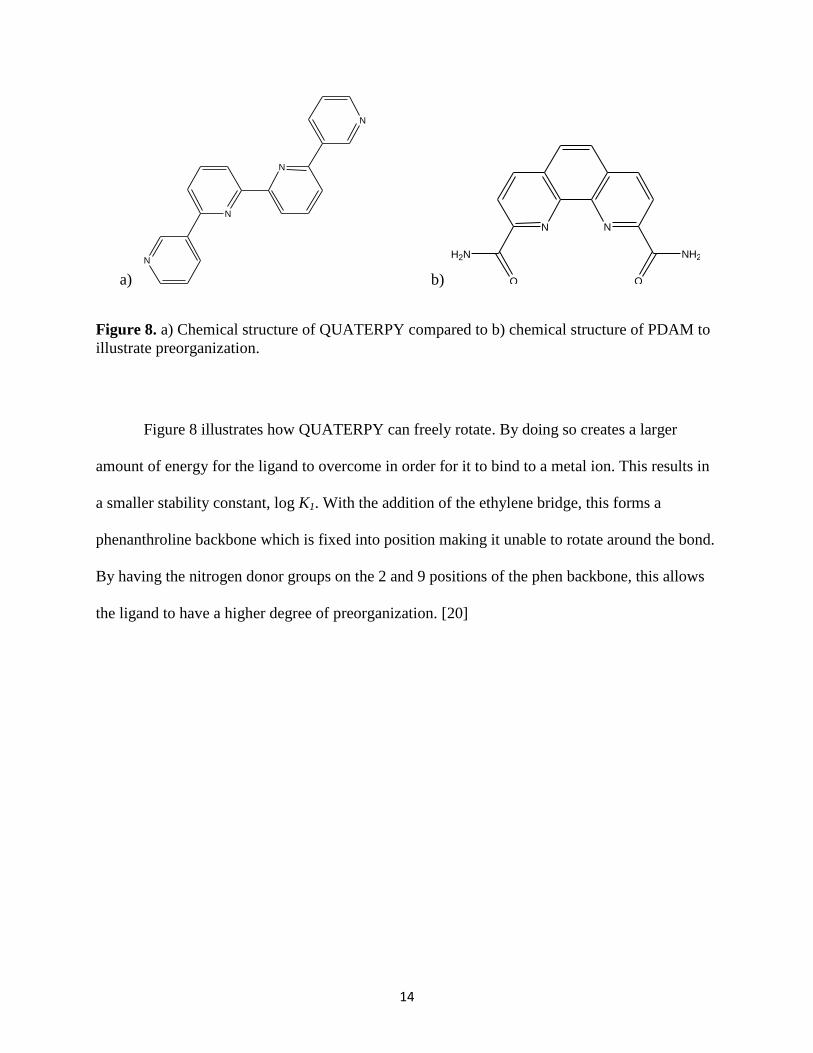
Figure 8. a) Chemical structure of QUATERPY compared to b) chemical structure of PDAM to
illustrate preorganization.
Figure 8 illustrates how QUATERPY can freely rotate. By doing so creates a larger
amount of energy for the ligand to overcome in order for it to bind to a metal ion. This results in
a smaller stability constant, log K1. With the addition of the ethylene bridge, this forms a
phenanthroline backbone which is fixed into position making it unable to rotate around the bond.
By having the nitrogen donor groups on the 2 and 9 positions of the phen backbone, this allows
the ligand to have a higher degree of preorganization. [20]
15
METHODS AND MATERIALS
General
All chemicals and reagents used were of analytical grade and purchased commercially.
Aqueous metal-ligand solutions were made using deionized water (Milli-Q, Waters Corp.) of
>18 MΩ.cm-1
resistivity.
To determine the purity of the PDAM ligand and its intermediates FT-IR analysis,
melting point analysis, and 1H-NMR were analyzed. The final products and intermediates of the
synthesis were prepared for 1H-NMR analysis in DMSO-d5.
1H-NMR spectra were performed
using a Bruker 400 MHz NMR spectrometer. The synthesis products were prepared for FT-IR
analysis as KBr pellets (Alfa Aesar, 99%) and spectra were taken using a Thermo Scientific
Nicolet 6700 FT-IR spectrometer with OMNIC32 Version 2.09 software. The melting point
analysis was also performed using a Haake Buchler melting point apparatus.
Synthesis of PDAM
The synthesis of PDAM was carried out as described in the literature [21,22] with a few
modifications. Characterization of the products was performed using FT-IR analysis, NMR, and
melting point analysis.
Synthesis of 1,10-phenanthroline-2,9-dicarboxaldehyde (PDALD)
A mixture of 3.0058 g 2,9-methyl-1,10-phenanthroline hemihydrate (13.84 mmol, Alfa
Aesar, 98+%) and 7.5002 g selenium dioxide (67.59 mmol, Alfa Aesar, 99.4%) was placed in a
250 ml round-bottom flask. The compounds were dissolved in 200 ml of 95% p-dioxane (Alfa
Aesar, 99+%)/5% milliQ water. The mixture was then heated to 122 oC in a wax bath while
16
stirring, and was allowed to reflux for 3 hours. The hot solution was filtered through celite by
vacuum filtration and placed in a freezer overnight. The solution thawed to room temperature
and the precipitate that was formed was collected on a glass-frit through filtration. The product
was allowed to dry then weighted yielding 1.9904g of un-pure product, the percent yield was
(8.43 mmol, 60.88%)
Synthesis of 1,10-phenanthroline-2,9-dicarboxylic acid (PDA)
A solution 1.9904 g of non-purified 1,10-phenanthroline-2,9-dicarboxaldehyde (8.42
mmol) was placed into a 250mL round bottom flask and dissolved in 80 mL of a 4:1 HNO3 (15.8
N, Fisher Scientific)/H2O mixture and stirred and refluxed at 122oC for 10 hours. After 10 hours,
the solution was taken off the heat and allowed to cool to room temperature then placed into a
freezer for 48 hours. During this time yellow crystals formed at the bottom of the flask. These
crystals were gravity filtered through filter paper then allowed to dry. The dry crystals were
weighted to give a yield of 0.9866g (3.68 mmol, 43.71%).
Synthesis of 2,9-Bis(carbomethoxy)-1,10-phenathroline (PBE)
0.9866 g (3.68 mmol) of 1,10-phenanthroline-2,9-dicarboxylic acid was placed into a
250mL round bottom flask along with 125mL of anhydrous methanol. 5mL of concentrated
H2SO4 was added to the solution to catalyze the esterification of the carboxylic acid. The
solution was heated to reflux for 4 hours; the solution was then allowed to cool to room
temperature. Once the solution was at room temperature the acid was neutralized using saturated
Na2CO3. The desired product fell out of solution once when the pH was neutral. The product was
gravity filtered and allowed to dry, giving an overall yield of 0.5863g (1.98 mmol, 53.80%).
17
Synthesis of 1,10-phenanthroline-2,9-diamide (PDAM)
0.5863g (1.98 mmol) of PBE was placed into a 250mL round bottom flask along with
200mL of 28% ammonia (28% w/w aq. soln., Alfa Aesar) and 0.6 g ammonium chloride (99%,
VWR). The mixture was then stoppered and vented by using a syringe needle and stirred for 24
hours; after that period the solution was then gravity filtered and allowed to dry yielding 0.1811
g (0.68 mmol, 34.34%) of product.
18
NN
H3C CH3
neocuproine
NN
O=C C=O
PDALD
1.)SeO2
2.)p-dioxane/5% H2O
H H
4:1 HNO3:H2O
NN
HOOC COOH
PDA
NN
H3COC COCH3
O O
H2SO4/MeOH
PBE
NN
H2NC CNH2
O O
NH3
PDAM
Figure 9. Schematic of the synthesis of PDAM.
19
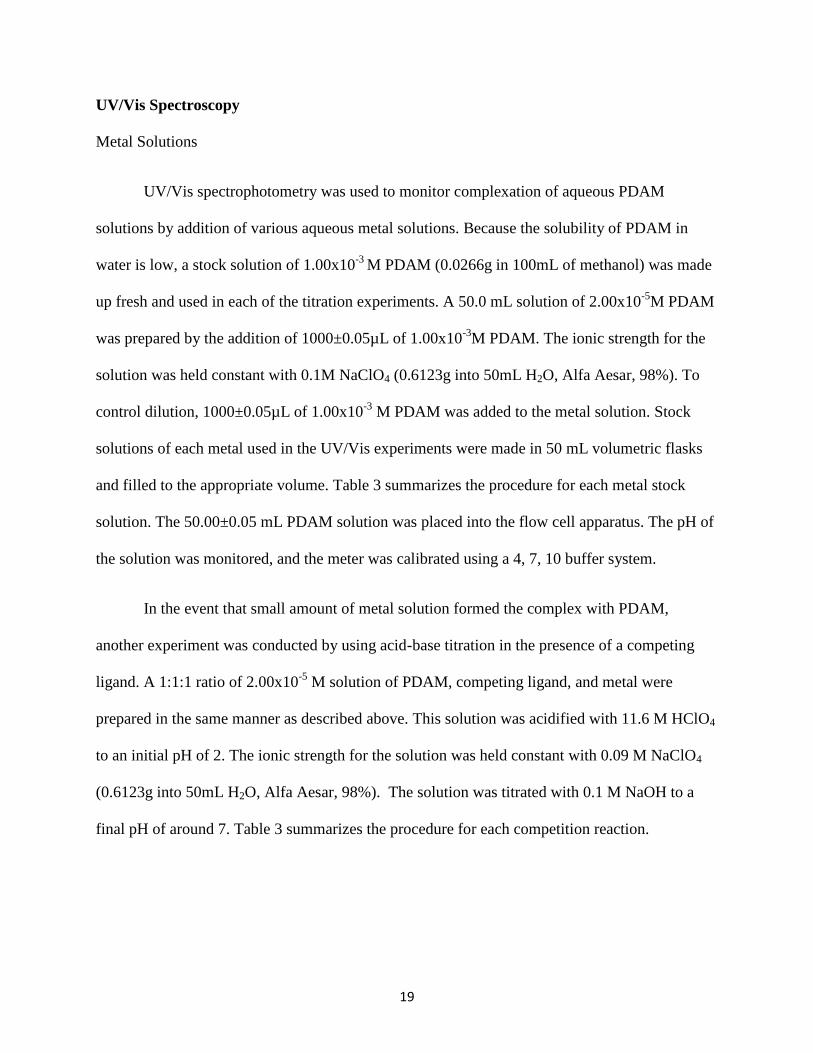
UV/Vis Spectroscopy
Metal Solutions
UV/Vis spectrophotometry was used to monitor complexation of aqueous PDAM
solutions by addition of various aqueous metal solutions. Because the solubility of PDAM in
water is low, a stock solution of 1.00x10⁻³
M PDAM (0.0266g in 100mL of methanol) was made
up fresh and used in each of the titration experiments. A 50.0 mL solution of 2.00x10⁻⁵
M PDAM
was prepared by the addition of 1000±0.05µL of 1.00x10⁻³
M PDAM. The ionic strength for the
solution was held constant with 0.1M NaClO4 (0.6123g into 50mL H2O, Alfa Aesar, 98%). To
control dilution, 1000±0.05µL of 1.00x10⁻³
M PDAM was added to the metal solution. Stock
solutions of each metal used in the UV/Vis experiments were made in 50 mL volumetric flasks
and filled to the appropriate volume. Table 3 summarizes the procedure for each metal stock
solution. The 50.00±0.05 mL PDAM solution was placed into the flow cell apparatus. The pH of
the solution was monitored, and the meter was calibrated using a 4, 7, 10 buffer system.
In the event that small amount of metal solution formed the complex with PDAM,
another experiment was conducted by using acid-base titration in the presence of a competing
ligand. A 1:1:1 ratio of 2.00x10⁻⁵
M solution of PDAM, competing ligand, and metal were
prepared in the same manner as described above. This solution was acidified with 11.6 M HClO4
to an initial pH of 2. The ionic strength for the solution was held constant with 0.09 M NaClO4
(0.6123g into 50mL H2O, Alfa Aesar, 98%). The solution was titrated with 0.1 M NaOH to a
final pH of around 7. Table 3 summarizes the procedure for each competition reaction.
20
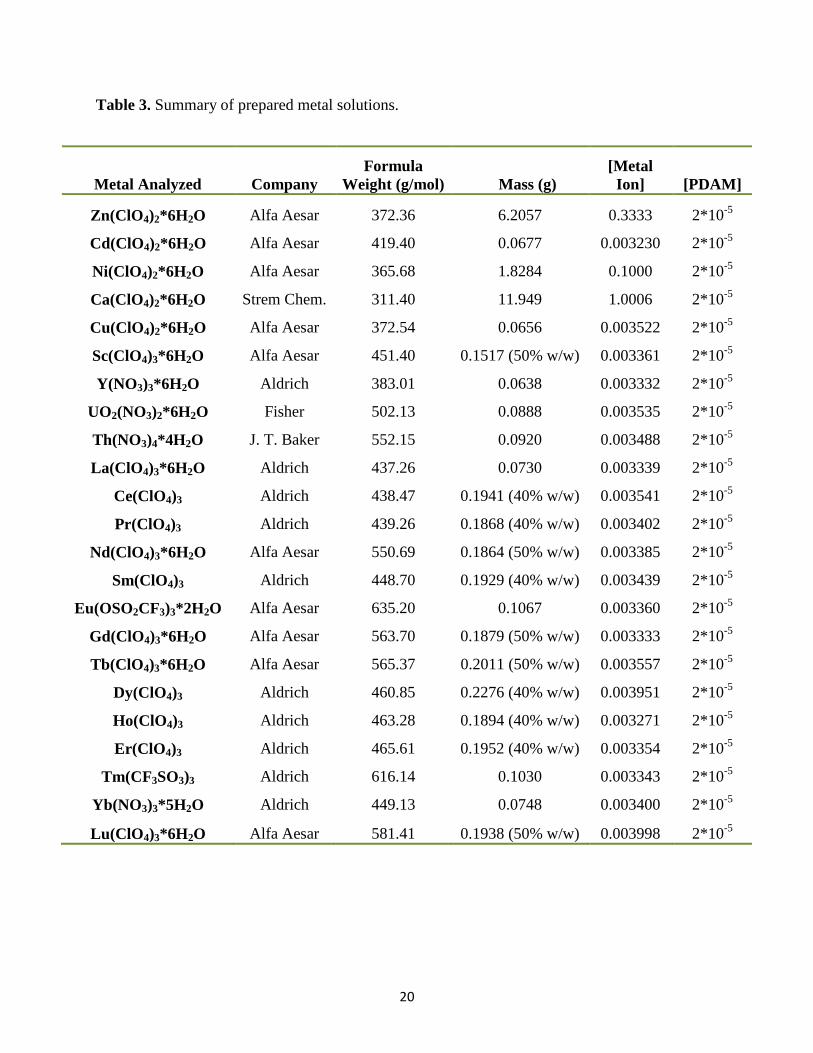
Table 3. Summary of prepared metal solutions.
Metal Analyzed Company
Formula
Weight (g/mol) Mass (g)
[Metal
Ion] [PDAM]
Zn(ClO4)2*6H2O Alfa Aesar 372.36 6.2057 0.3333 2*10-5
Cd(ClO4)2*6H2O Alfa Aesar 419.40 0.0677 0.003230 2*10-5
Ni(ClO4)2*6H2O Alfa Aesar 365.68 1.8284 0.1000 2*10-5
Ca(ClO4)2*6H2O Strem Chem. 311.40 11.949 1.0006 2*10-5
Cu(ClO4)2*6H2O Alfa Aesar 372.54 0.0656 0.003522 2*10-5
Sc(ClO4)3*6H2O Alfa Aesar 451.40 0.1517 (50% w/w) 0.003361 2*10-5
Y(NO3)3*6H2O Aldrich 383.01 0.0638 0.003332 2*10-5
UO2(NO3)2*6H2O Fisher 502.13 0.0888 0.003535 2*10-5
Th(NO3)4*4H2O J. T. Baker 552.15 0.0920 0.003488 2*10-5
La(ClO4)3*6H2O Aldrich 437.26 0.0730 0.003339 2*10-5
Ce(ClO4)3 Aldrich 438.47 0.1941 (40% w/w) 0.003541 2*10-5
Pr(ClO4)3 Aldrich 439.26 0.1868 (40% w/w) 0.003402 2*10-5
Nd(ClO4)3*6H2O Alfa Aesar 550.69 0.1864 (50% w/w) 0.003385 2*10-5
Sm(ClO4)3 Aldrich 448.70 0.1929 (40% w/w) 0.003439 2*10-5
Eu(OSO2CF3)3*2H2O Alfa Aesar 635.20 0.1067 0.003360 2*10-5
Gd(ClO4)3*6H2O Alfa Aesar 563.70 0.1879 (50% w/w) 0.003333 2*10-5
Tb(ClO4)3*6H2O Alfa Aesar 565.37 0.2011 (50% w/w) 0.003557 2*10-5
Dy(ClO4)3 Aldrich 460.85 0.2276 (40% w/w) 0.003951 2*10-5
Ho(ClO4)3 Aldrich 463.28 0.1894 (40% w/w) 0.003271 2*10-5
Er(ClO4)3 Aldrich 465.61 0.1952 (40% w/w) 0.003354 2*10-5
Tm(CF3SO3)3 Aldrich 616.14 0.1030 0.003343 2*10-5
Yb(NO3)3*5H2O Aldrich 449.13 0.0748 0.003400 2*10-5
Lu(ClO4)3*6H2O Alfa Aesar 581.41 0.1938 (50% w/w) 0.003998 2*10-5

21
Table 4. Summary of prepared competition reaction solutions. Note: competing ligand, metal
ion, and PDAM all diluted from 1.0*10-3
stock solutions.
Metal Analyzed Company
Formula
Weight
(g/mol)
Competing
Ligand
[Competing
Ligand]
[Metal
Ion] [PDAM]
Cd(ClO4)2*6H2O
Alfa
Aesar 419.40 EDTA 2*10-5
2*10-5
2*10-5
Cd(ClO4)2*6H2O
Alfa
Aesar 419.40 TETREN 2*10-5
2*10-5
2*10-5
Pb(ClO4)2*3H2O
Alfa
Aesar 460.15 TETREN 2*10-5
2*10-5
2*10-5
Bi(NO3)3*5H2O Aldrich 485.07 TETREN 2*10-5
2*10-5
2*10-5
In(ClO4)3*8H2O Aldrich 557.26 TETREN 2*10-5
2*10-5
2*10-5
22
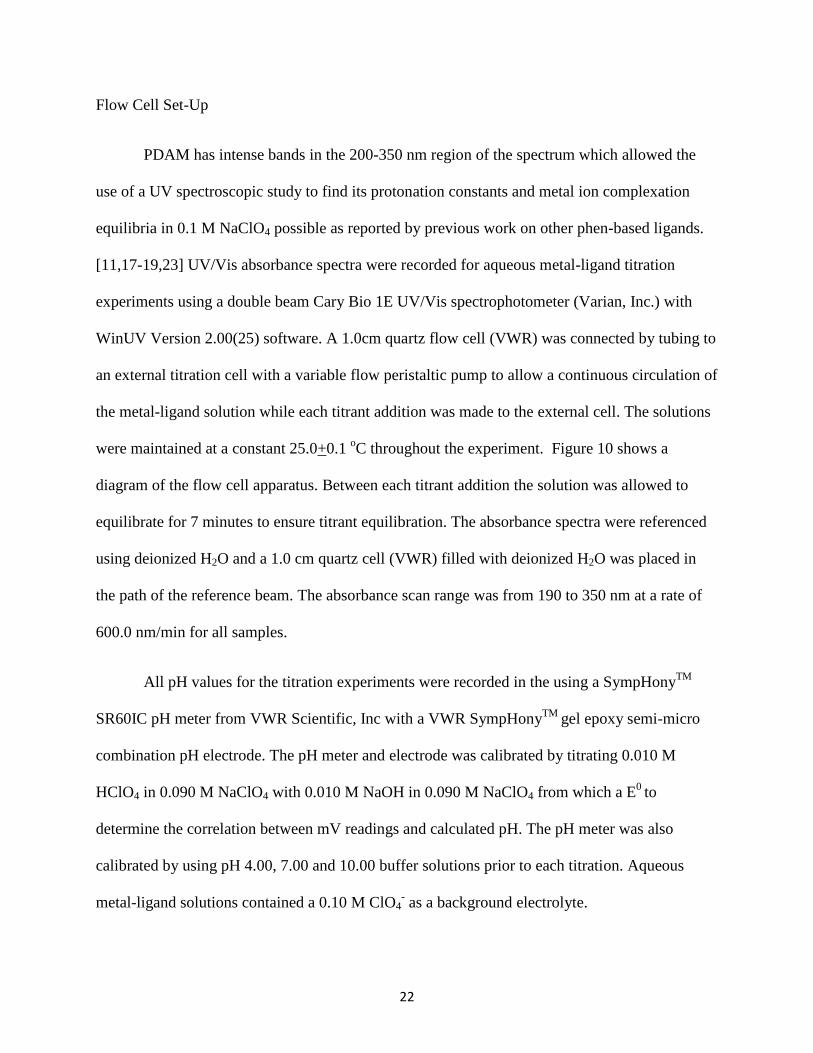
Flow Cell Set-Up
PDAM has intense bands in the 200-350 nm region of the spectrum which allowed the
use of a UV spectroscopic study to find its protonation constants and metal ion complexation
equilibria in 0.1 M NaClO4 possible as reported by previous work on other phen-based ligands.
[11,17-19,23] UV/Vis absorbance spectra were recorded for aqueous metal-ligand titration
experiments using a double beam Cary Bio 1E UV/Vis spectrophotometer (Varian, Inc.) with
WinUV Version 2.00(25) software. A 1.0cm quartz flow cell (VWR) was connected by tubing to
an external titration cell with a variable flow peristaltic pump to allow a continuous circulation of
the metal-ligand solution while each titrant addition was made to the external cell. The solutions
were maintained at a constant 25.0+0.1 oC throughout the experiment. Figure 10 shows a
diagram of the flow cell apparatus. Between each titrant addition the solution was allowed to
equilibrate for 7 minutes to ensure titrant equilibration. The absorbance spectra were referenced
using deionized H2O and a 1.0 cm quartz cell (VWR) filled with deionized H2O was placed in
the path of the reference beam. The absorbance scan range was from 190 to 350 nm at a rate of
600.0 nm/min for all samples.
All pH values for the titration experiments were recorded in the using a SympHonyTM
SR60IC pH meter from VWR Scientific, Inc with a VWR SympHonyTM
gel epoxy semi-micro
combination pH electrode. The pH meter and electrode was calibrated by titrating 0.010 M
HClO4 in 0.090 M NaClO4 with 0.010 M NaOH in 0.090 M NaClO4 from which a E0
to
determine the correlation between mV readings and calculated pH. The pH meter was also
calibrated by using pH 4.00, 7.00 and 10.00 buffer solutions prior to each titration. Aqueous
metal-ligand solutions contained a 0.10 M ClO4- as a background electrolyte.
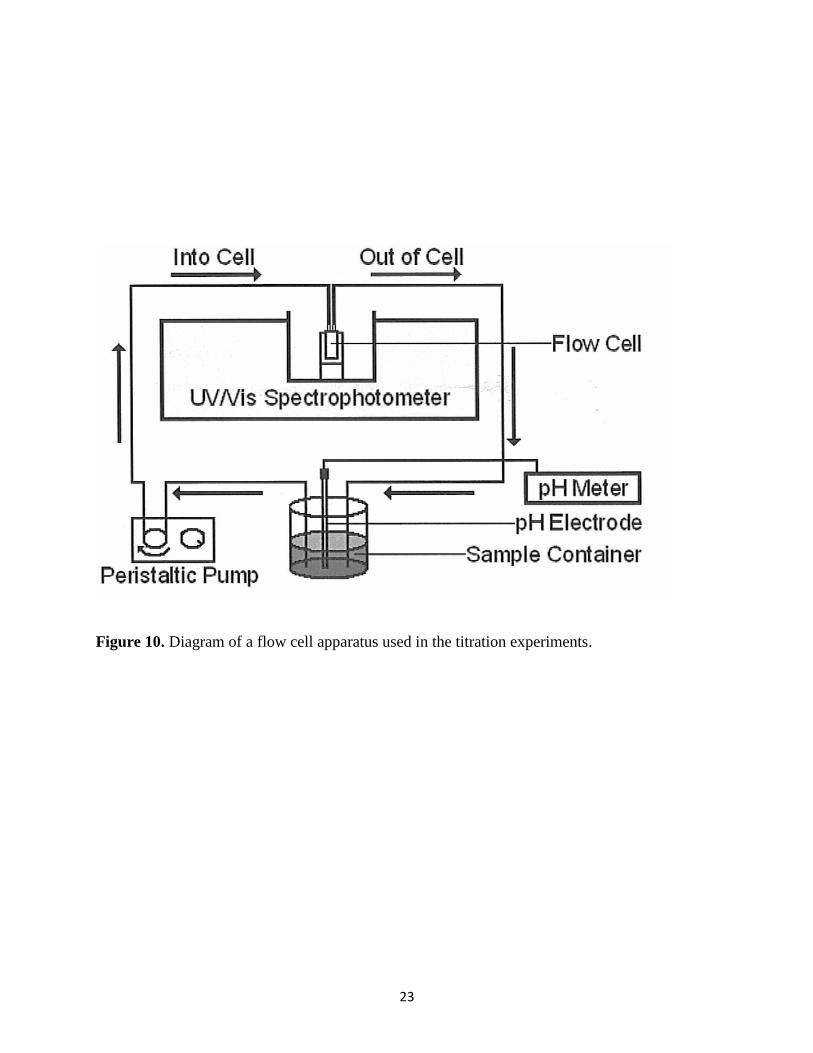
23
Figure 10. Diagram of a flow cell apparatus used in the titration experiments.
24
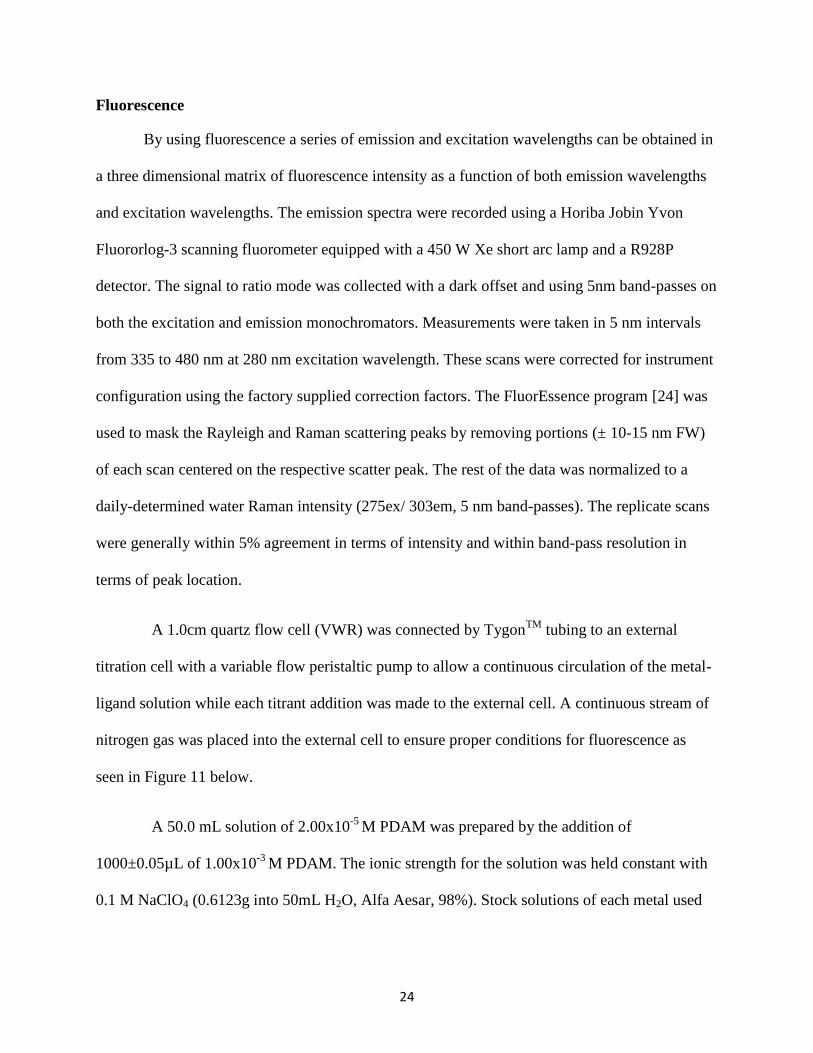
Fluorescence
By using fluorescence a series of emission and excitation wavelengths can be obtained in
a three dimensional matrix of fluorescence intensity as a function of both emission wavelengths
and excitation wavelengths. The emission spectra were recorded using a Horiba Jobin Yvon
Fluororlog-3 scanning fluorometer equipped with a 450 W Xe short arc lamp and a R928P
detector. The signal to ratio mode was collected with a dark offset and using 5nm band-passes on
both the excitation and emission monochromators. Measurements were taken in 5 nm intervals
from 335 to 480 nm at 280 nm excitation wavelength. These scans were corrected for instrument
configuration using the factory supplied correction factors. The FluorEssence program [24] was
used to mask the Rayleigh and Raman scattering peaks by removing portions (± 10-15 nm FW)
of each scan centered on the respective scatter peak. The rest of the data was normalized to a
daily-determined water Raman intensity (275ex/ 303em, 5 nm band-passes). The replicate scans
were generally within 5% agreement in terms of intensity and within band-pass resolution in
terms of peak location.
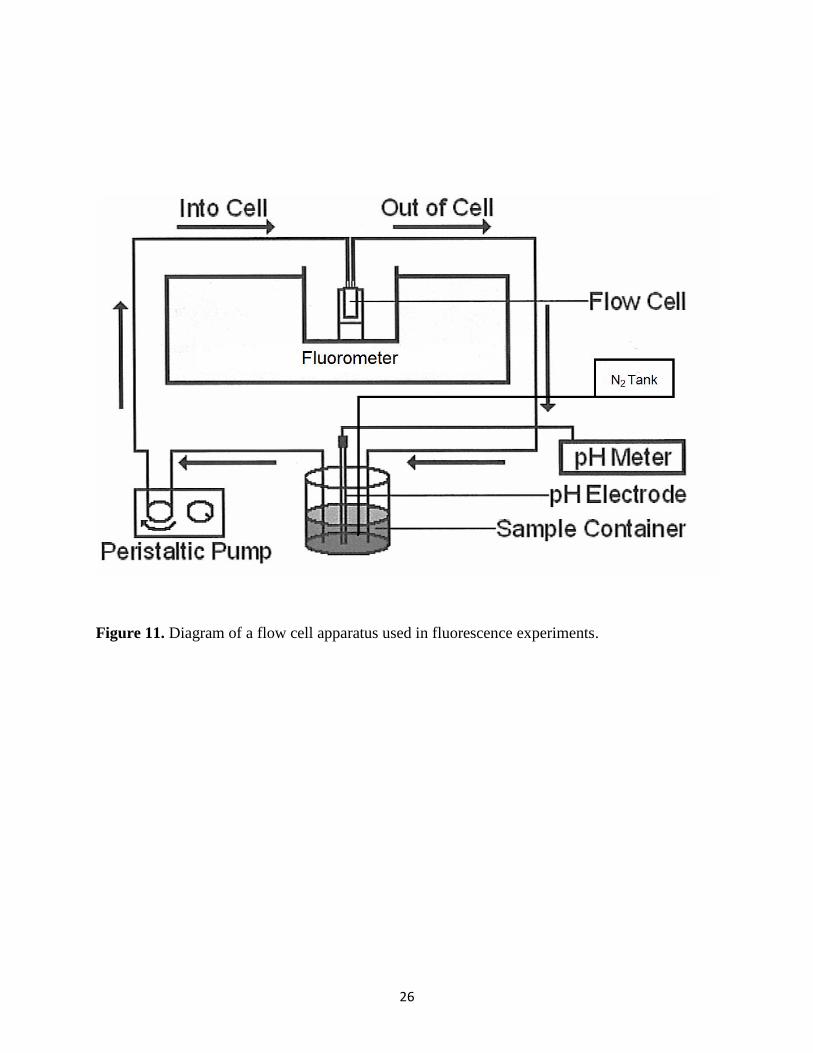
A 1.0cm quartz flow cell (VWR) was connected by TygonTM
tubing to an external
titration cell with a variable flow peristaltic pump to allow a continuous circulation of the metal-
ligand solution while each titrant addition was made to the external cell. A continuous stream of
nitrogen gas was placed into the external cell to ensure proper conditions for fluorescence as
seen in Figure 11 below.
A 50.0 mL solution of 2.00x10⁻⁵
M PDAM was prepared by the addition of
1000±0.05µL of 1.00x10⁻³
M PDAM. The ionic strength for the solution was held constant with
0.1 M NaClO4 (0.6123g into 50mL H2O, Alfa Aesar, 98%). Stock solutions of each metal used
25
in the fluorescence experiments were made in 50 mL volumetric flasks and filled to the
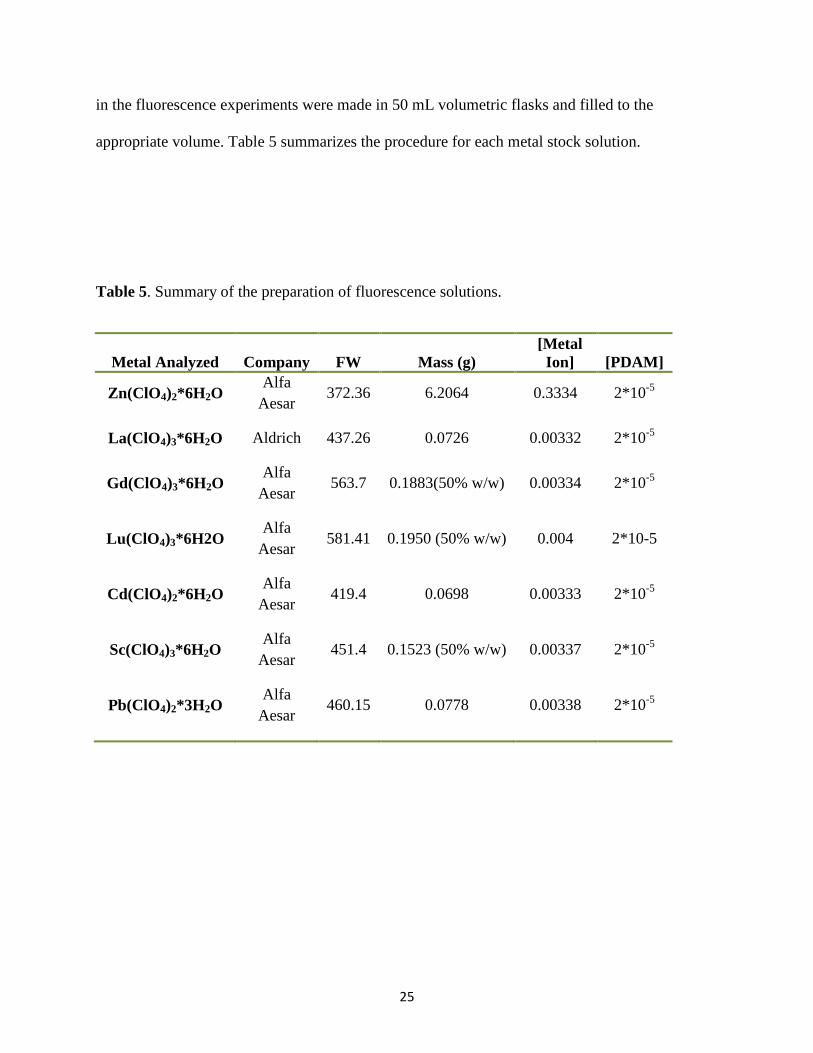
appropriate volume. Table 5 summarizes the procedure for each metal stock solution.
Table 5. Summary of the preparation of fluorescence solutions.
Metal Analyzed Company FW Mass (g)
[Metal
Ion] [PDAM]
Zn(ClO4)2*6H2O Alfa
Aesar 372.36 6.2064 0.3334 2*10
-5
La(ClO4)3*6H2O Aldrich 437.26 0.0726 0.00332 2*10-5
Gd(ClO4)3*6H2O Alfa
Aesar 563.7 0.1883(50% w/w) 0.00334 2*10
-5
Lu(ClO4)3*6H2O Alfa
Aesar 581.41 0.1950 (50% w/w) 0.004 2*10-5
Cd(ClO4)2*6H2O Alfa
Aesar 419.4 0.0698 0.00333 2*10
-5
Sc(ClO4)3*6H2O Alfa
Aesar 451.4 0.1523 (50% w/w) 0.00337 2*10
-5
Pb(ClO4)2*3H2O Alfa
Aesar 460.15 0.0778 0.00338 2*10
-5
26
Figure 11. Diagram of a flow cell apparatus used in fluorescence experiments.
27
PDAM Degradation Experiment
A degradation experiment was needed to see the stability of PDAM under acidic
conditions similar to nuclear waste. A 50.0 mL solution of 2.00x10⁻⁵
M with 1.0 M HClO4 was
analyzed by UV/Vis in intervals of 3 hours over a 12 hour period. The solution was placed in a
cabinet and left for 3 months. After 3 months the solution was analyzed each consecutive month
for a total of 7 months.
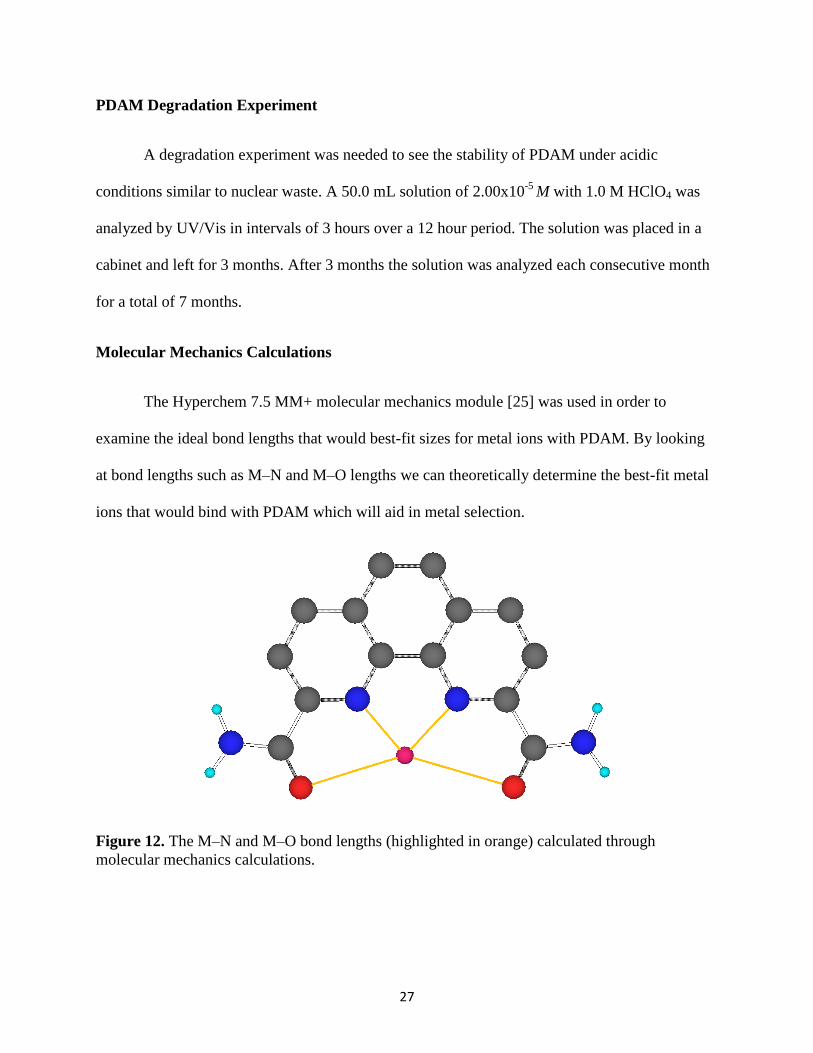
Molecular Mechanics Calculations
The Hyperchem 7.5 MM+ molecular mechanics module [25] was used in order to
examine the ideal bond lengths that would best-fit sizes for metal ions with PDAM. By looking
at bond lengths such as M–N and M–O lengths we can theoretically determine the best-fit metal
ions that would bind with PDAM which will aid in metal selection.
Figure 12. The M–N and M–O bond lengths (highlighted in orange) calculated through
molecular mechanics calculations.
28
RESULTS AND DISCUSSION
Synthesis of PDAM
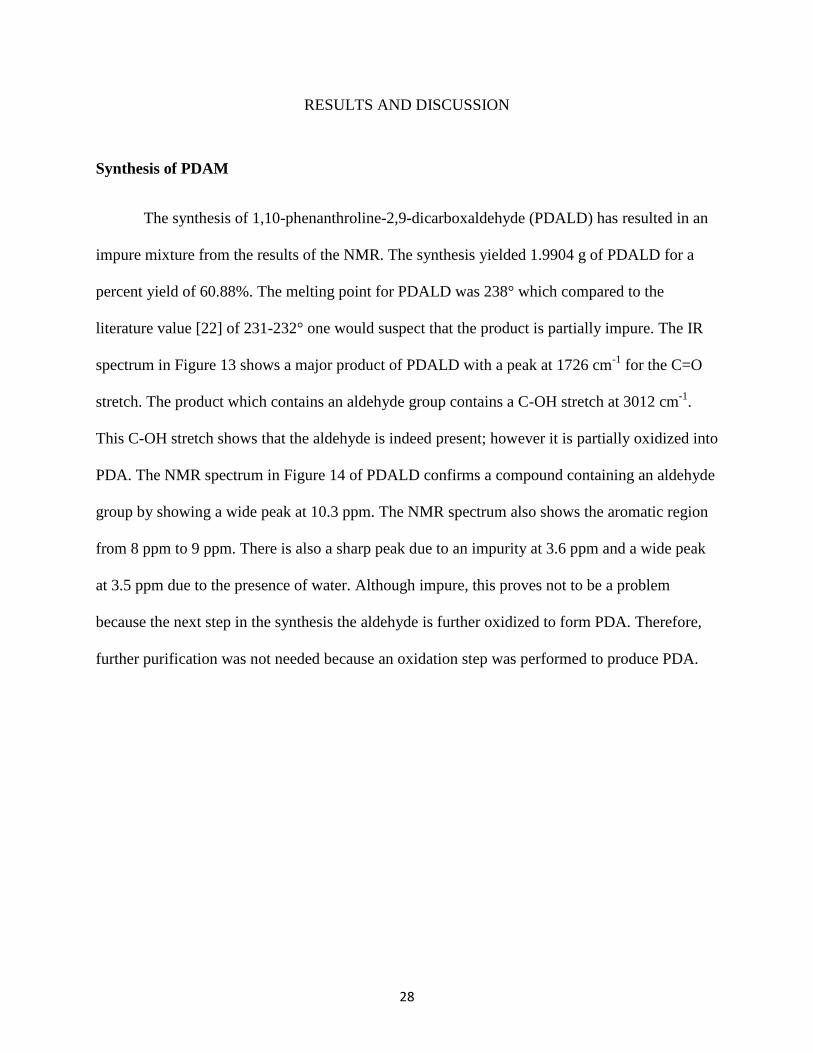
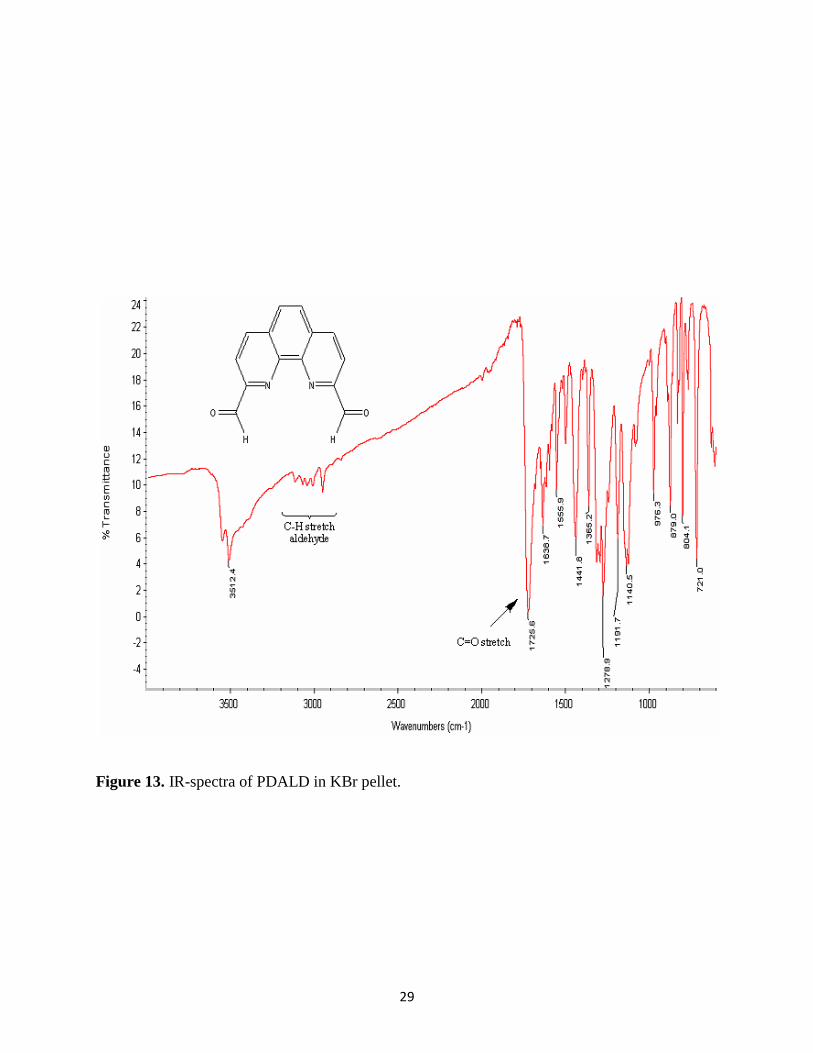
The synthesis of 1,10-phenanthroline-2,9-dicarboxaldehyde (PDALD) has resulted in an
impure mixture from the results of the NMR. The synthesis yielded 1.9904 g of PDALD for a
percent yield of 60.88%. The melting point for PDALD was 238° which compared to the
literature value [22] of 231-232° one would suspect that the product is partially impure. The IR
spectrum in Figure 13 shows a major product of PDALD with a peak at 1726 cm-1
for the C=O
stretch. The product which contains an aldehyde group contains a C-OH stretch at 3012 cm-1
.
This C-OH stretch shows that the aldehyde is indeed present; however it is partially oxidized into
PDA. The NMR spectrum in Figure 14 of PDALD confirms a compound containing an aldehyde
group by showing a wide peak at 10.3 ppm. The NMR spectrum also shows the aromatic region
from 8 ppm to 9 ppm. There is also a sharp peak due to an impurity at 3.6 ppm and a wide peak
at 3.5 ppm due to the presence of water. Although impure, this proves not to be a problem
because the next step in the synthesis the aldehyde is further oxidized to form PDA. Therefore,
further purification was not needed because an oxidation step was performed to produce PDA.
29
Figure 13. IR-spectra of PDALD in KBr pellet.
30
Figure 14. NMR-spectra of PDALD in DMSO-d5.
31
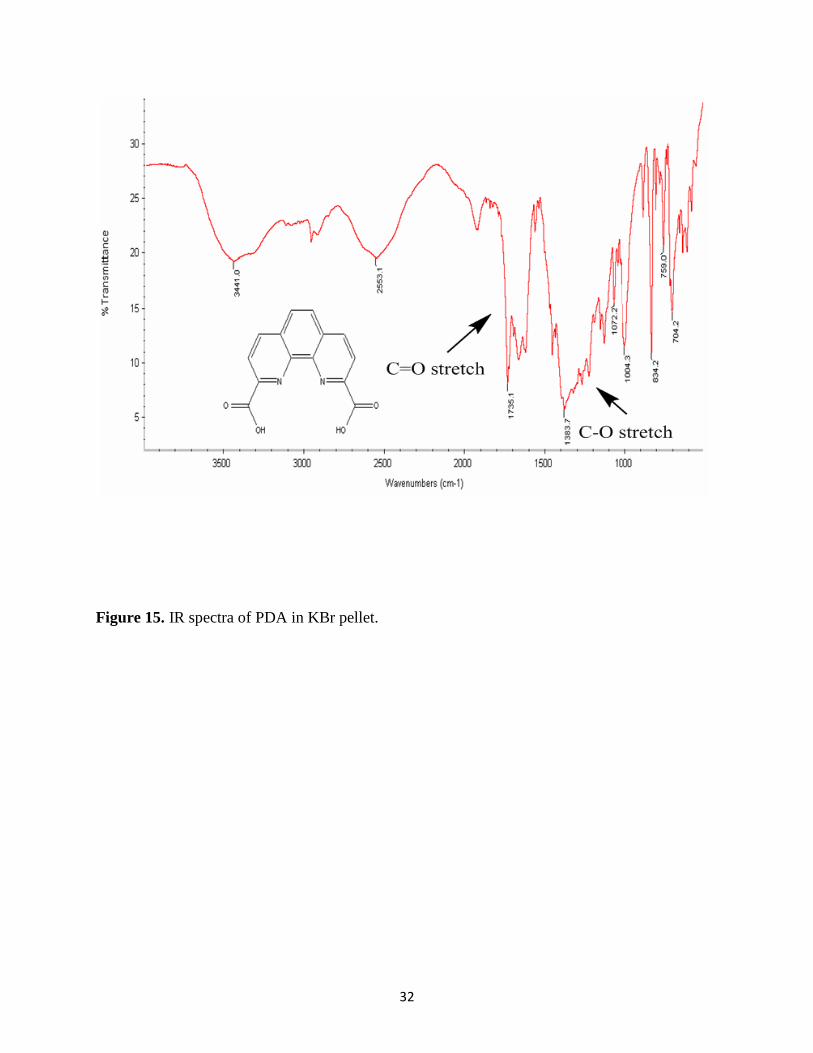
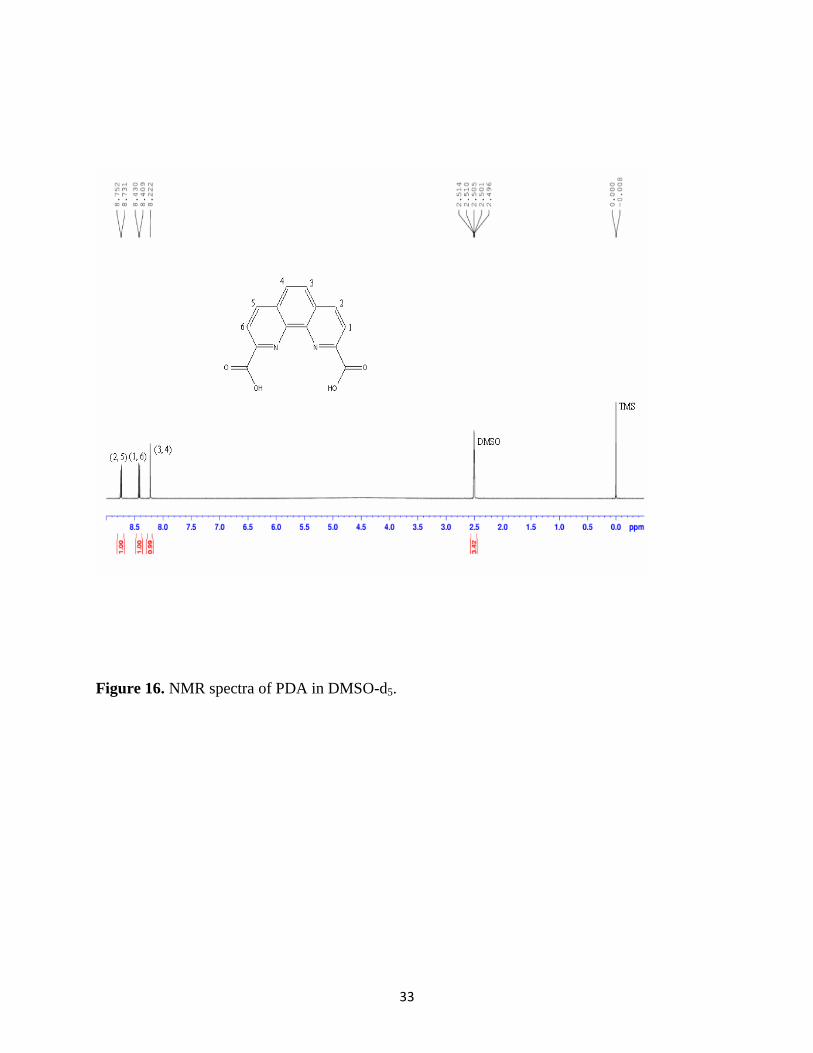
The PDALD product was used to synthesize 1, 10-phenanthroline-2, 9-dicarboxylic acid
(PDA). The reaction yielded .9866 g of PDA for a percent yield of 43.71%. The melting point
for the crystalline product was 243.8° which compared to the literature [22] value of 238° agrees
with the literature value. An IR analysis was also conducted and the spectrum is shown in Figure
15. The spectrum shows a clean carboxylic acid peak at 1735 cm-1
for the C=O stretch band a
peak at 1384 cm-1
for the C-O stretch. The NMR results shown in Figure 16 shows a pure PDA
product. There are 3 peaks from 8.0 to 8.7 ppm which indicate the aromatic region. The
carboxylic acid is confirmed by the IR results which indicate the carboxylic acid group by the
large bands in the C=O stretch region. The results from the melting point determination, NMR,
and IR spectrum showed a clean product of PDA from the synthesis using PDALD.
32
Figure 15. IR spectra of PDA in KBr pellet.
33
Figure 16. NMR spectra of PDA in DMSO-d5.
34
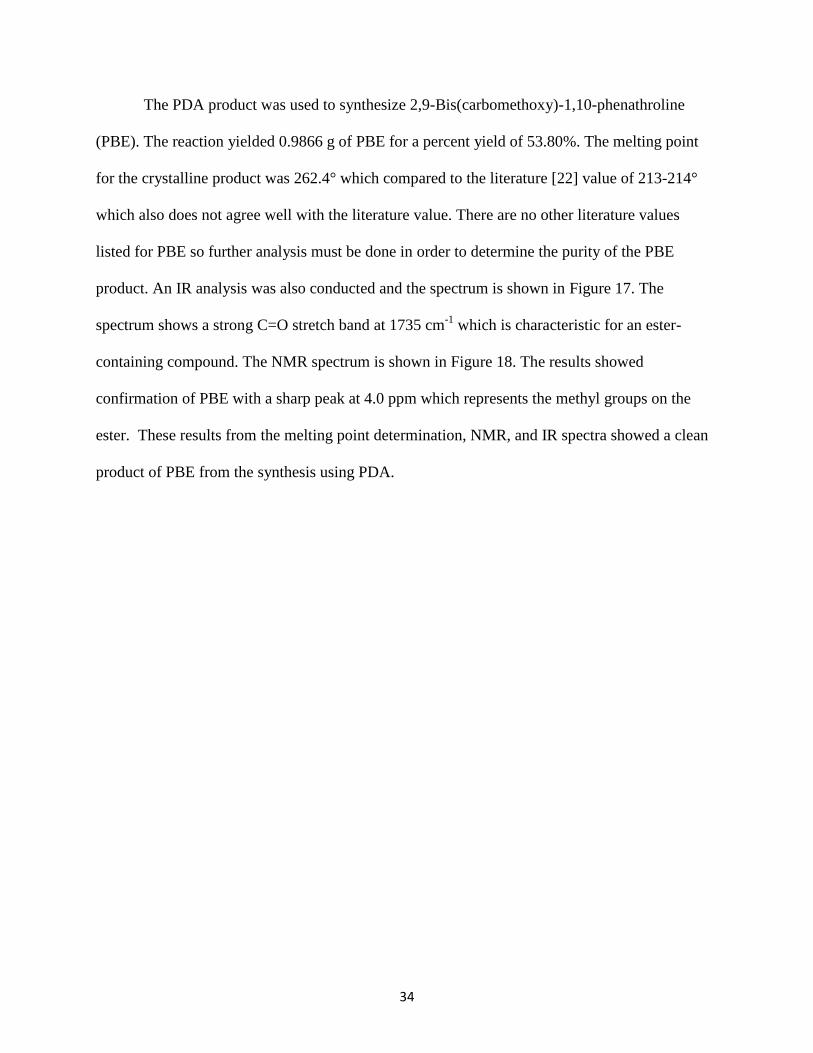
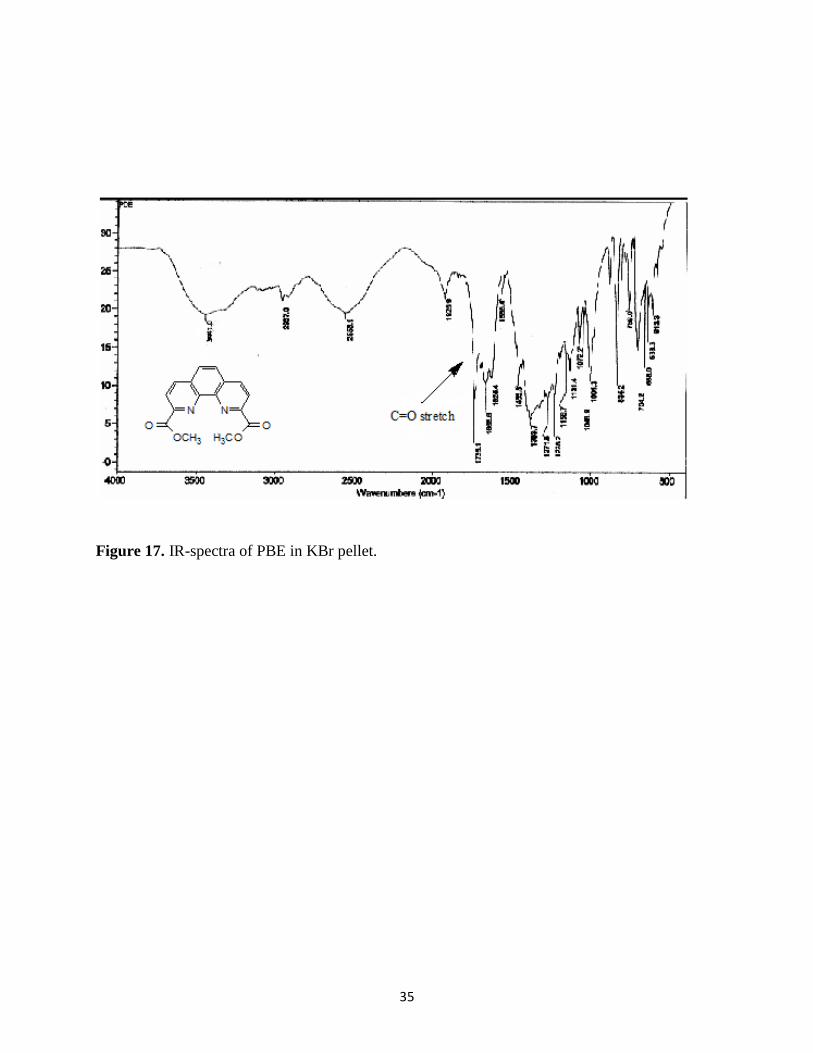
The PDA product was used to synthesize 2,9-Bis(carbomethoxy)-1,10-phenathroline
(PBE). The reaction yielded 0.9866 g of PBE for a percent yield of 53.80%. The melting point
for the crystalline product was 262.4° which compared to the literature [22] value of 213-214°
which also does not agree well with the literature value. There are no other literature values
listed for PBE so further analysis must be done in order to determine the purity of the PBE
product. An IR analysis was also conducted and the spectrum is shown in Figure 17. The
spectrum shows a strong C=O stretch band at 1735 cm-1
which is characteristic for an ester-
containing compound. The NMR spectrum is shown in Figure 18. The results showed
confirmation of PBE with a sharp peak at 4.0 ppm which represents the methyl groups on the
ester. These results from the melting point determination, NMR, and IR spectra showed a clean
product of PBE from the synthesis using PDA.
35
Figure 17. IR-spectra of PBE in KBr pellet.
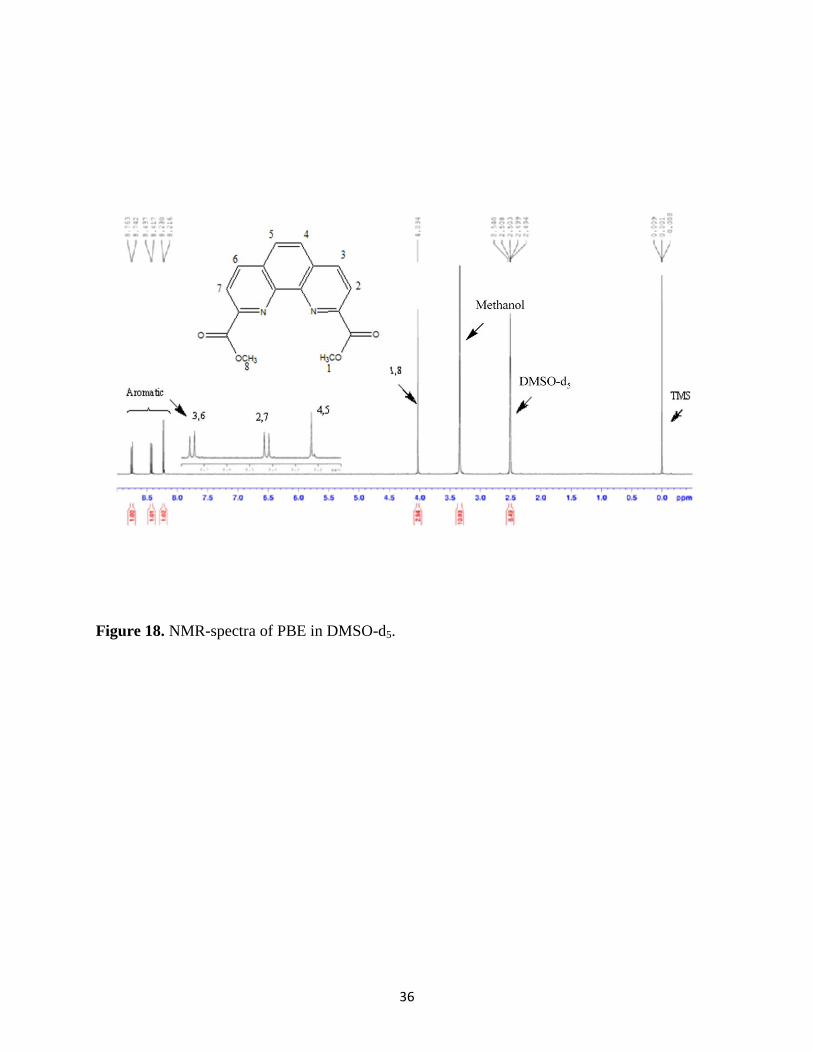
36
Figure 18. NMR-spectra of PBE in DMSO-d5.
37
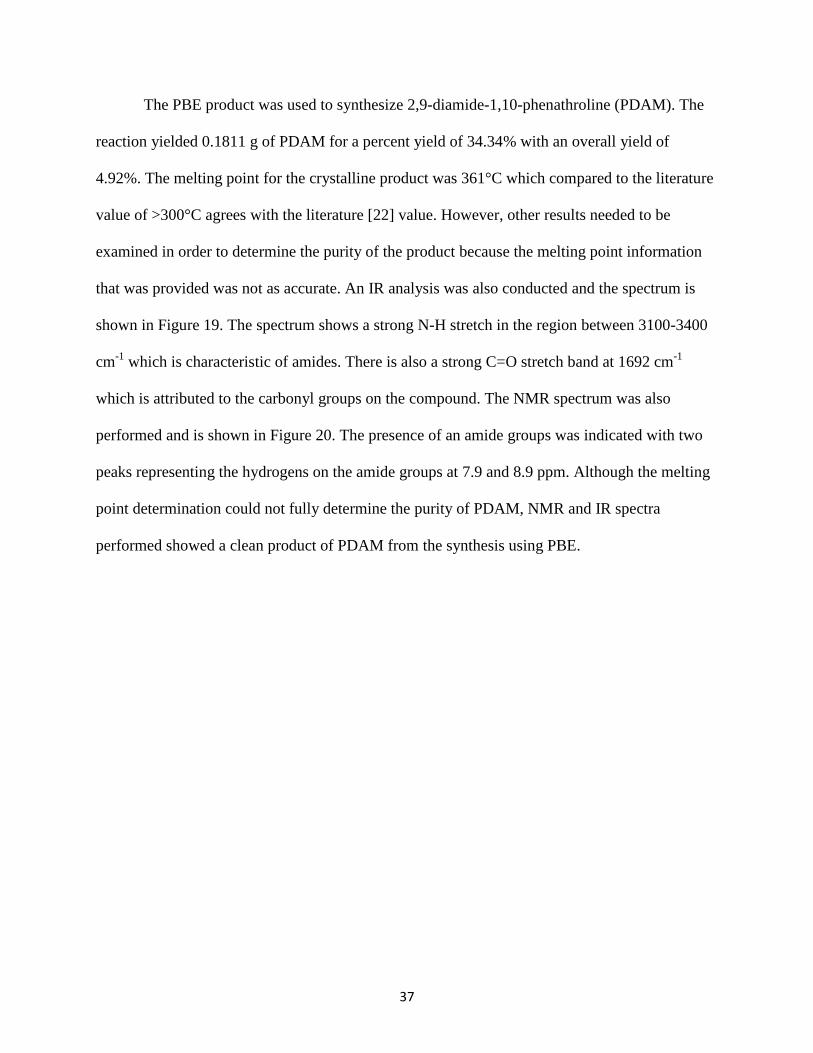
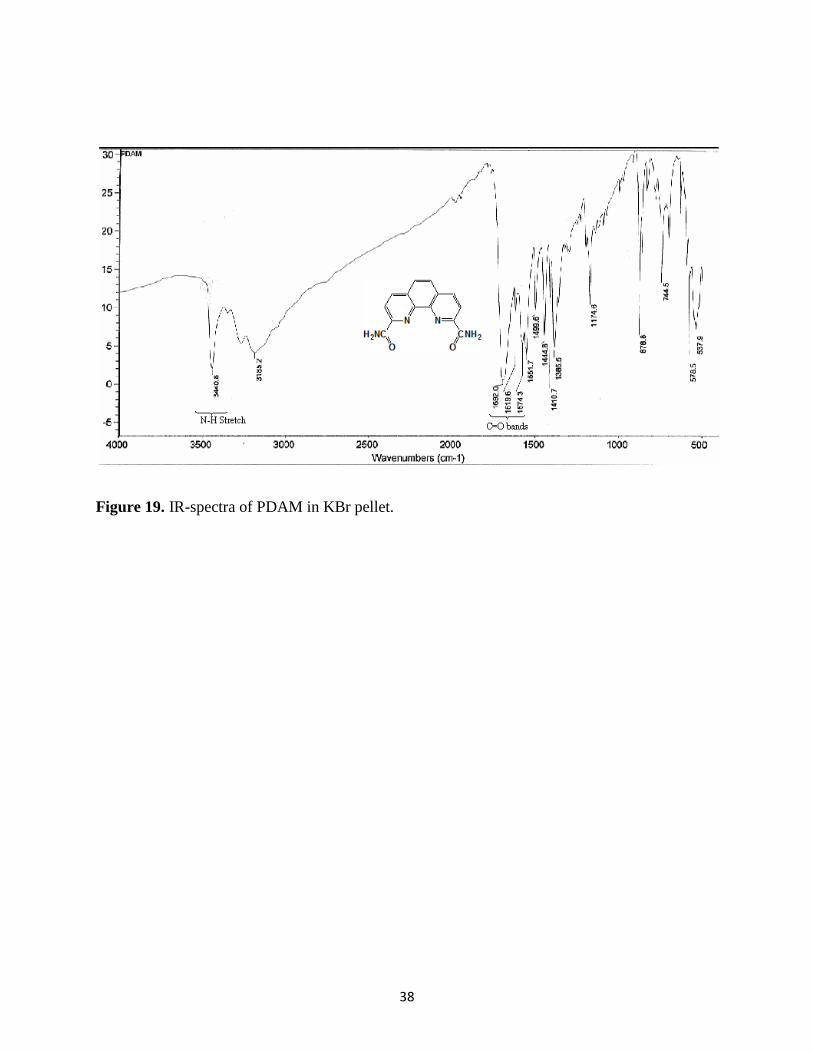
The PBE product was used to synthesize 2,9-diamide-1,10-phenathroline (PDAM). The
reaction yielded 0.1811 g of PDAM for a percent yield of 34.34% with an overall yield of
4.92%. The melting point for the crystalline product was 361°C which compared to the literature
value of >300°C agrees with the literature [22] value. However, other results needed to be
examined in order to determine the purity of the product because the melting point information
that was provided was not as accurate. An IR analysis was also conducted and the spectrum is
shown in Figure 19. The spectrum shows a strong N-H stretch in the region between 3100-3400
cm-1
which is characteristic of amides. There is also a strong C=O stretch band at 1692 cm-1
which is attributed to the carbonyl groups on the compound. The NMR spectrum was also
performed and is shown in Figure 20. The presence of an amide groups was indicated with two
peaks representing the hydrogens on the amide groups at 7.9 and 8.9 ppm. Although the melting
point determination could not fully determine the purity of PDAM, NMR and IR spectra
performed showed a clean product of PDAM from the synthesis using PBE.
38
Figure 19. IR-spectra of PDAM in KBr pellet.
39
Figure 20. NMR-spectra of PDAM in DMSO-d5.
40
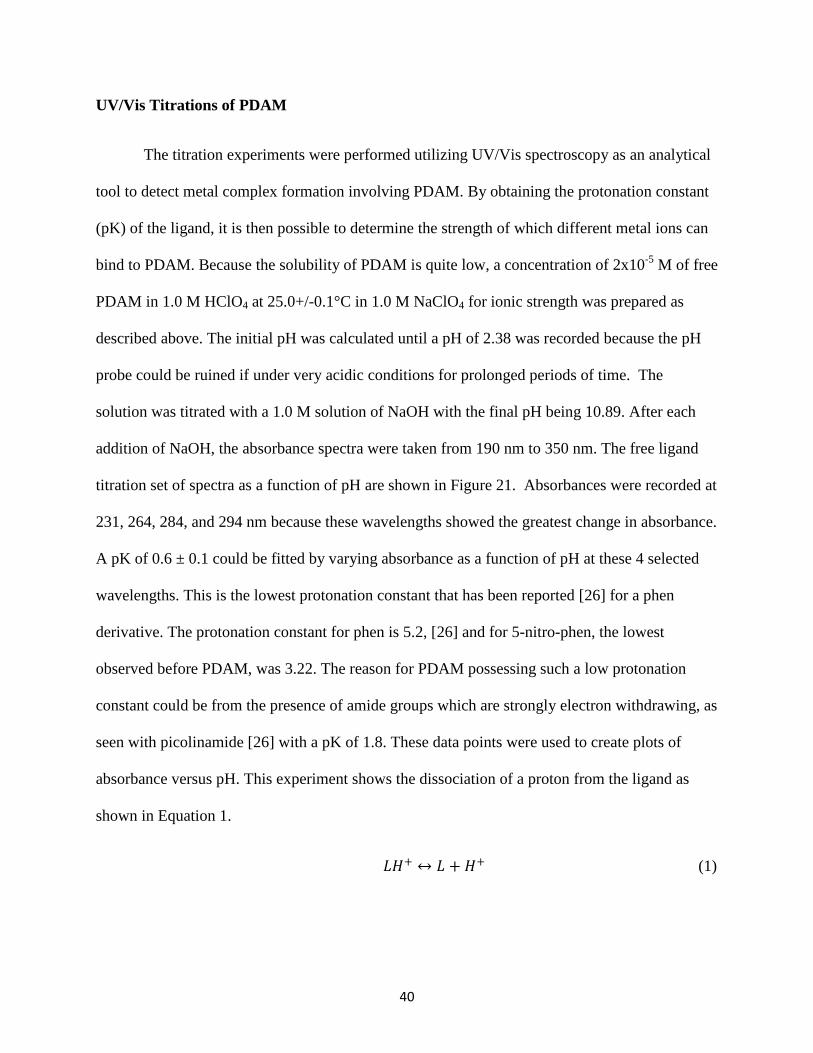
UV/Vis Titrations of PDAM
The titration experiments were performed utilizing UV/Vis spectroscopy as an analytical
tool to detect metal complex formation involving PDAM. By obtaining the protonation constant
(pK) of the ligand, it is then possible to determine the strength of which different metal ions can
bind to PDAM. Because the solubility of PDAM is quite low, a concentration of 2x10⁻⁵
M of free
PDAM in 1.0 M HClO4 at 25.0+/-0.1°C in 1.0 M NaClO4 for ionic strength was prepared as
described above. The initial pH was calculated until a pH of 2.38 was recorded because the pH
probe could be ruined if under very acidic conditions for prolonged periods of time. The
solution was titrated with a 1.0 M solution of NaOH with the final pH being 10.89. After each
addition of NaOH, the absorbance spectra were taken from 190 nm to 350 nm. The free ligand
titration set of spectra as a function of pH are shown in Figure 21. Absorbances were recorded at
231, 264, 284, and 294 nm because these wavelengths showed the greatest change in absorbance.
A pK of 0.6 ± 0.1 could be fitted by varying absorbance as a function of pH at these 4 selected
wavelengths. This is the lowest protonation constant that has been reported [26] for a phen
derivative. The protonation constant for phen is 5.2, [26] and for 5-nitro-phen, the lowest
observed before PDAM, was 3.22. The reason for PDAM possessing such a low protonation
constant could be from the presence of amide groups which are strongly electron withdrawing, as
seen with picolinamide [26] with a pK of 1.8. These data points were used to create plots of
absorbance versus pH. This experiment shows the dissociation of a proton from the ligand as
shown in Equation 1.
𝐿𝐻+ ↔ 𝐿 + 𝐻+ (1)
41
Figure 21. UV-Vis absorbance spectrum of the titration of PDAM at 2.00x10⁻⁵
M
42
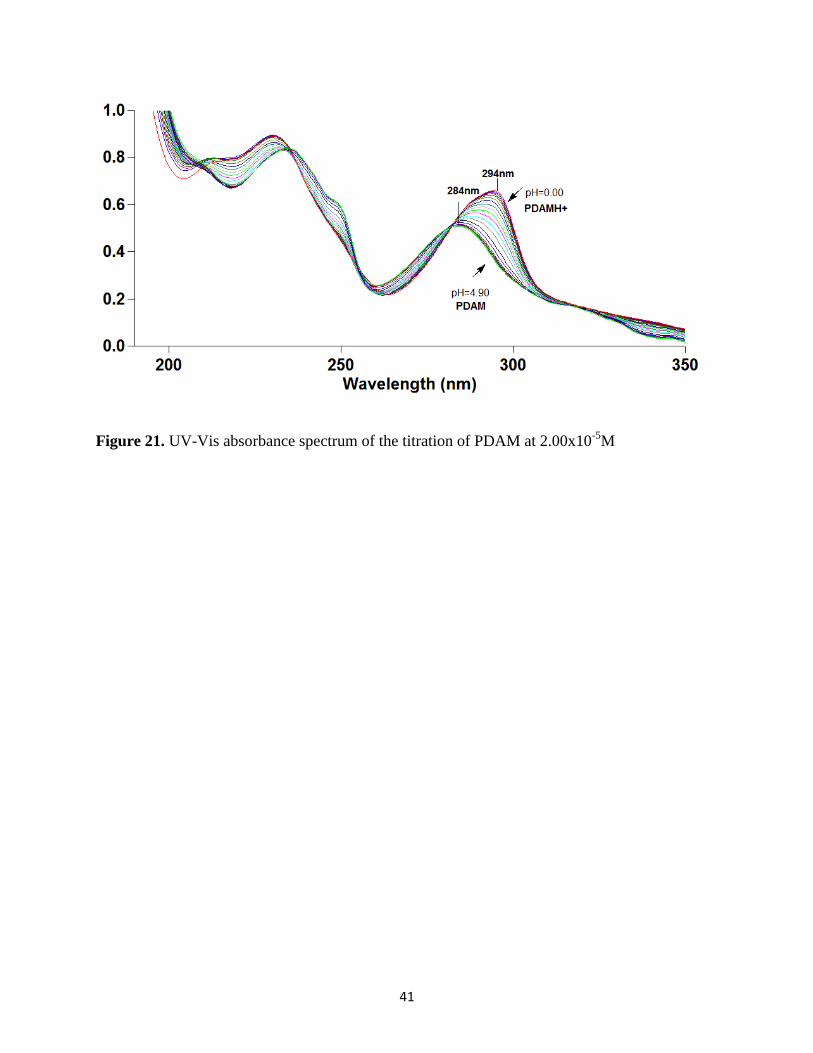
Figure 22. Protonation equilibrium for 2,9-diamide-1,10-phenanthroline (PDAM).
43
Log K1 Results for Metal Ions with PDAM
The metal ions that were complexed with PDAM were chosen based on varying ionic
radii and ionic charge. Because PDAM has a low protonation constant 0.6 meant that the
competition between the metal ion and the proton for coordination to the ligand could not be
used for the determination of log K1. Instead, a 50.0 mL stock solution of 2.00x10⁻⁵
M PDAM
was prepared and placed into the sample container in which multiple additions of the aqueous
metal in interest were added to the PDAM solution and absorbance values were recorded. By
measuring the variation of the absorbance 2.00x10⁻⁵
M PDAM solutions as a function of metal
ion concentration in titrations with 0.1 M NaClO4 was found to be an acceptable method of
analyzing the complexation of the metal and PDAM. Table 6 summarizes the log K1 for select
metal-1,10-phenanthroline and metal-PDAM complexes.
44
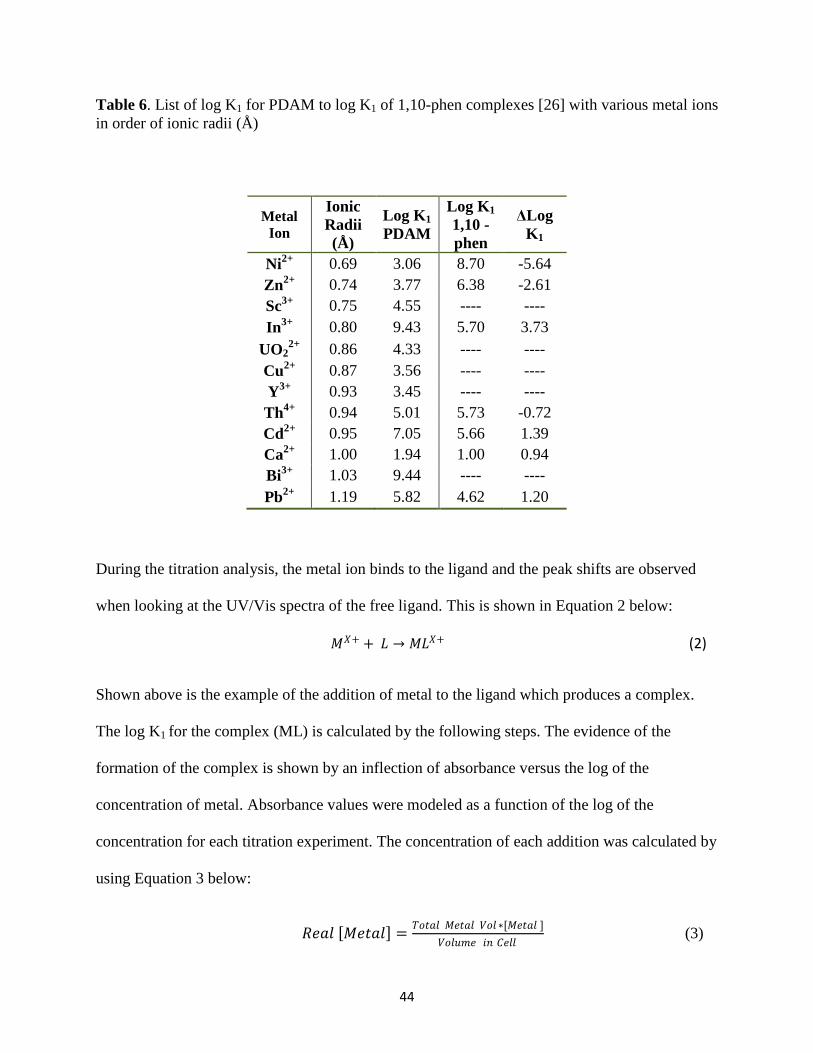
Table 6. List of log K1 for PDAM to log K1 of 1,10-phen complexes [26] with various metal ions
in order of ionic radii (Å)
Metal
Ion
Ionic
Radii
(Å)
Log K1
PDAM
Log K1
1,10 -
phen
ΔLog
K1
Ni2+
0.69 3.06 8.70 -5.64
Zn2+
0.74 3.77 6.38 -2.61
Sc3+
0.75 4.55 ---- ----
In3+
0.80 9.43 5.70 3.73
UO22+
0.86 4.33 ---- ----
Cu2+
0.87 3.56 ---- ----
Y3+
0.93 3.45 ---- ----
Th4+
0.94 5.01 5.73 -0.72
Cd2+
0.95 7.05 5.66 1.39
Ca2+
1.00 1.94 1.00 0.94
Bi3+
1.03 9.44 ---- ----
Pb2+
1.19 5.82 4.62 1.20
During the titration analysis, the metal ion binds to the ligand and the peak shifts are observed
when looking at the UV/Vis spectra of the free ligand. This is shown in Equation 2 below:
𝑀𝑋+ + 𝐿 → 𝑀𝐿𝑋+ (2)
Shown above is the example of the addition of metal to the ligand which produces a complex.
The log K1 for the complex (ML) is calculated by the following steps. The evidence of the
formation of the complex is shown by an inflection of absorbance versus the log of the
concentration of metal. Absorbance values were modeled as a function of the log of the
concentration for each titration experiment. The concentration of each addition was calculated by
using Equation 3 below:
𝑅𝑒𝑎𝑙 𝑀𝑒𝑡𝑎𝑙 =𝑇𝑜𝑡𝑎𝑙 𝑀𝑒𝑡𝑎𝑙 𝑉𝑜𝑙 ∗[𝑀𝑒𝑡𝑎𝑙 ]
𝑉𝑜𝑙𝑢𝑚𝑒 𝑖𝑛 𝐶𝑒𝑙𝑙 (3)
45
The real concentration of the metal is observed for each addition. This represents total metal
volume represents the volume added to the solution which is multiplied by the concentration of
the metal. The product of the total metal volume and concentration of the metal is divided by
volume of the cell which is the original 50.0 mL PDAM solution plus the total metal volume.
The log of this value is used to plot absorbance as a function of the log of the concentration of
the metal. Because the ligand was added to the metal solution there is no need to correct for
dilution. The theoretical values for absorbance were calculated by using the formula 3, 4, and 5
below,
𝐸𝑞𝑢𝑎𝑡𝑖𝑜𝑛 1: 10 𝑀𝑒𝑡𝑎𝑙 × 𝑅𝑒𝑎𝑙 (4)
𝐸𝑞𝑢𝑎𝑡𝑖𝑜𝑛 2: 1 + 𝐸𝑞𝑢𝑎𝑡𝑖𝑜𝑛 1 (5)
𝐴𝑏𝑠.𝑇ℎ𝑒𝑜𝑟𝑒𝑡𝑖𝑐𝑎𝑙 = 1
𝐸𝑞 .1× 𝑎𝑏𝑠. 𝐿 + (
𝐸𝑞 .1
𝐸𝑞 .2× 𝑎𝑏𝑠 𝑀𝐿) (6)
Equation 4 represents the species of ligand whereas Equation 5 represents the species of the
metal-ligand complex. These values are used in Equation 6 above to calculate the theoretical
absorbance. The difference of the two absorbances is represented in Equation 7 below:
𝑑𝑖𝑓𝑓 = 𝑎𝑏𝑠 𝑡ℎ𝑒𝑜𝑟 − 𝑎𝑏𝑠 𝑜𝑏𝑠 (7)
The standard deviations of these differences were used in the SOLVER module so that they were
minimized. The points in the plots are the observed values of absorbance. The theoretical curves
of absorbance versus log of the concentration were fitted to the experimental points using the
SOLVER module of the program EXCEL. Results for individual metal ions are discussed below.
46
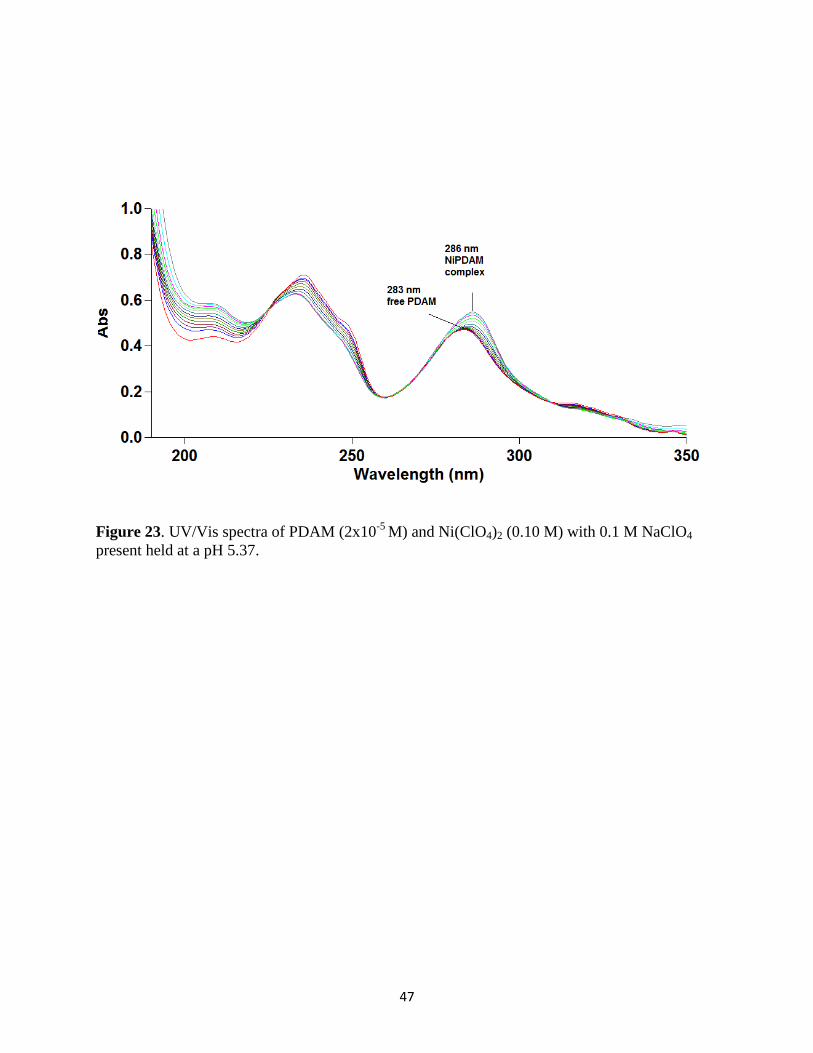
Nickel(II)-PDAM results
Nickel has an ionic radius of 0.69 Å and is an intermediate acid according to the HSAB
principle. Nickel is the smallest metal analyzed and was expected to bind weakly with PDAM
compared to the other larger metals analyzed. Due to the chelate ring size rules discussed
previously, nickel forms a 5-membered ring when binding to PDAM which is unfavorable for
small metal ions.[12] A solution of 0.10M Ni(ClO4)2 was added to 2x10⁻⁵
M PDAM with 0.1M
NaClO4 at a pH held at 5.37. The UV/Vis spectra plotting absorbance versus log of the
concentration of Ni(ClO4)2 are show in Figure 23. Absorbances were recorded at 316, 283, 248,
235, 217, 209 nm because these wavelengths exhibited the largest change in absorbances. The
theoretical and measured absorbances were plotted for every wavelength by minimizing the sum
of the squares as shown in Figure 24. Table 7 summarizes the solutions of each parameter that
was changed by SOLVER. This program was used to minimize the standard deviation so that a
more accurate log K1 value could be calculated. The log K1 was calculated to be 3.06 by using
Equations 2-7 mentioned above.
47
Figure 23. UV/Vis spectra of PDAM (2x10⁻⁵
M) and Ni(ClO4)2 (0.10 M) with 0.1 M NaClO4
present held at a pH 5.37.
48
Figure 24. Plot of absorbance (data points) and theoretical absorbance (lines) versus log[Ni] for
titration of PDAM and Ni(ClO4)2. The midpoints in the inflections of the curves indicate the log
K1 value for PDAM .
0.000
0.100
0.200
0.300
0.400
0.500
0.600
0.700
0.800
-7.00 -6.00 -5.00 -4.00 -3.00 -2.00 -1.00 0.00
Ab
sorb
ance
log[Ni]
316 nm
316 nm Theoretical
283 nm
283 nm Theoretical
248 nm
248 nm Theoretical
235 nm
235 nm Theoretical
217 nm
217 nm Theoretical
209 nm
209 nm Theoretical
49
Table 7. Solutions and standard deviation for each parameter used by SOLVER module of
EXCEL in the determination of log K1 of PDAM-Ni complex.
Overall Parameter Solution
Standard
Deviation
log K1 3.06 0.005359
316 nm abs L 0.147
0.001640 abs ML 0.124
283 nm abs L 0.468
0.007170 abs ML 0.501
248 nm abs L 0.487
0.005598 abs ML 0.398
235nm abs L 0.702
0.003315 abs ML 0.617
217nm abs L 0.435
0.003315 abs ML 0.497
209 nm abs L 0.463
0.048987 abs ML 0.568
50
Zinc(II)-PDAM results
Zinc has an ionic radius of 0.74 Å which is slightly smaller than the ideal 1.0Å ionic
radius for PDAM. Zinc is classified as an intermediate acid according to the HSAB. The log K1
for [Zn(PDAM)]2+
complex is supposed to be higher than the [Ni(PDAM)]2+
due to the larger
ionic radius of zinc. The UV/Vis absorbance spectra for Zn(II) additions with PDAM are shown
in Figures 25 and 26. A plot of the corrected absorbance values versus log of the concentration of
Zinc(II) is shown in Figure 27. From the selected wavelengths of 315, 289, 282, 248, 235, 217,
204 nm a log K1 of 3.77 was calculated using Equations 2-7 from the data using the process as
described above. Table 8 summarizes the solutions of each parameter that was changed by
SOLVER.
The spectra did not show any isosbestic points, however there is a slight shift in
wavelength which indicates the complex did form. Another analysis as shown in Figure 26, was
performed under the same concentrations, however, the solutions for PDAM and the aqueous
metal were acidified to a pH of 4 to ensure that the amides on the ligand were not hydrolyzed.
There were no changes between the two spectra shows that there was no hydrolysis on the
amides of the ligand.
51
Figure 25. UV/Vis spectra of PDAM (2x10⁻⁵
M) and Zn (0.3333 M) with 0.1 M NaClO4 present.
Initial pH at 5.31.
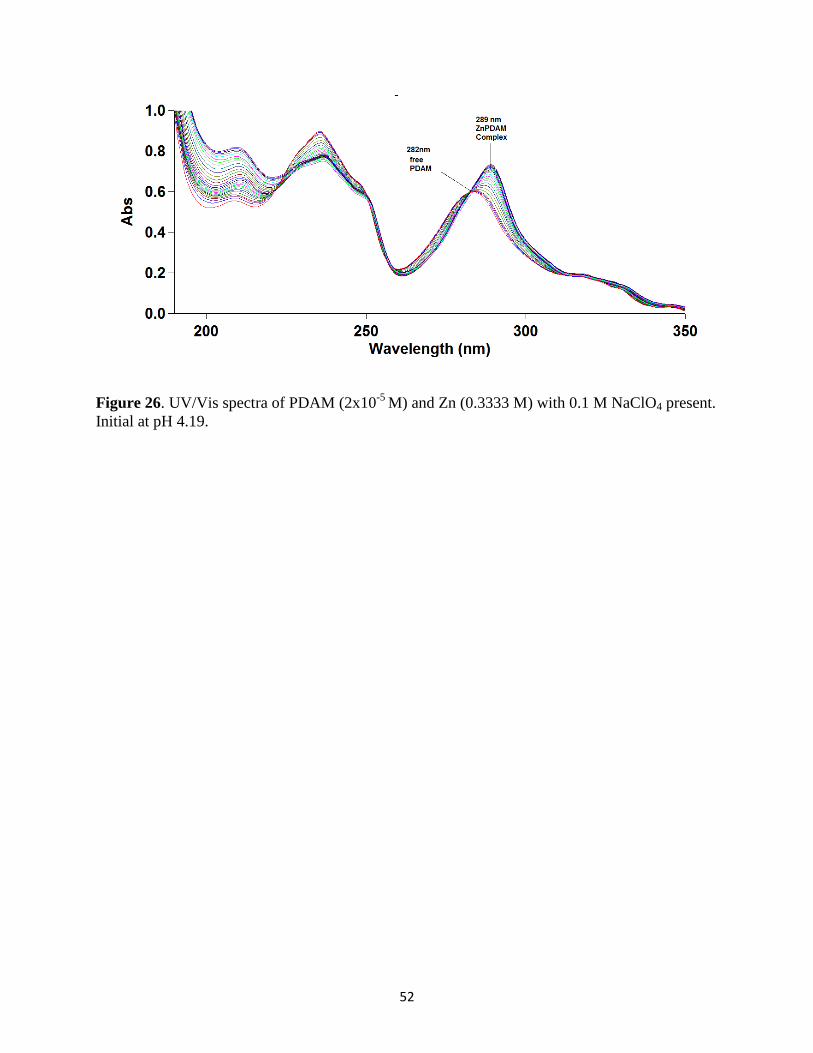
52
Figure 26. UV/Vis spectra of PDAM (2x10⁻⁵
M) and Zn (0.3333 M) with 0.1 M NaClO4 present.
Initial at pH 4.19.
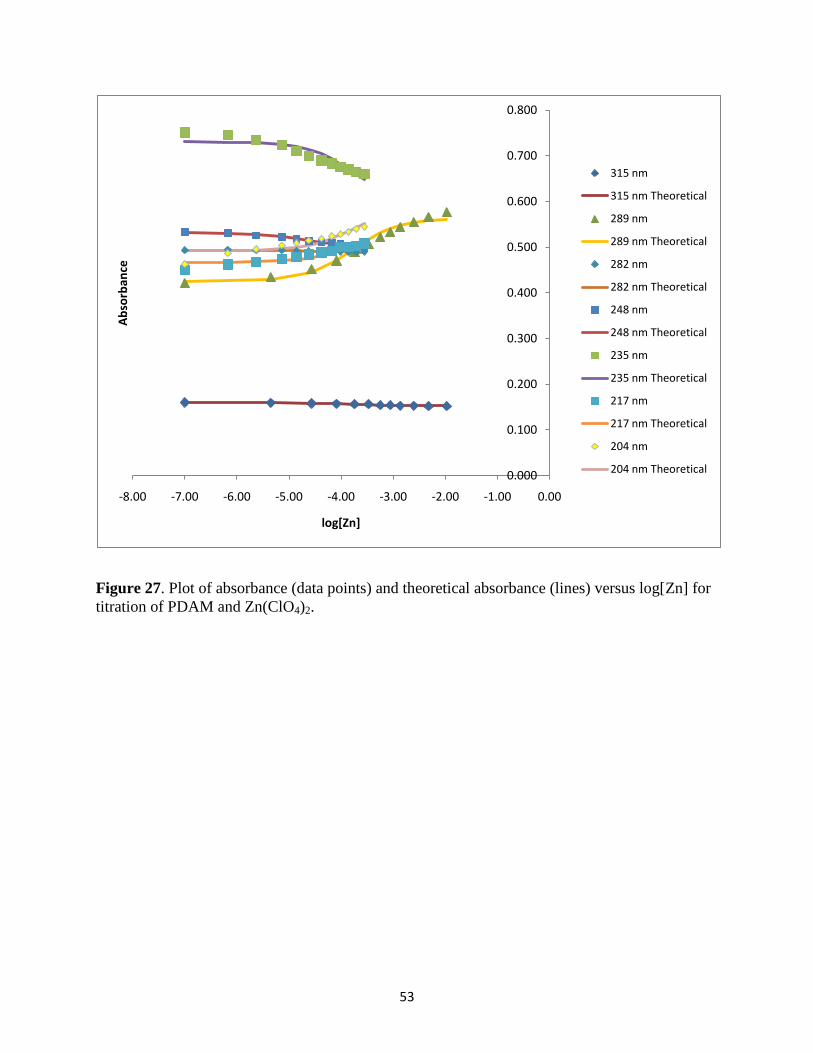
53
Figure 27. Plot of absorbance (data points) and theoretical absorbance (lines) versus log[Zn] for
titration of PDAM and Zn(ClO4)2.
0.000
0.100
0.200
0.300
0.400
0.500
0.600
0.700
0.800
-8.00 -7.00 -6.00 -5.00 -4.00 -3.00 -2.00 -1.00 0.00
Ab
sorb
ance
log[Zn]
315 nm
315 nm Theoretical
289 nm
289 nm Theoretical
282 nm
282 nm Theoretical
248 nm
248 nm Theoretical
235 nm
235 nm Theoretical
217 nm
217 nm Theoretical
204 nm
204 nm Theoretical
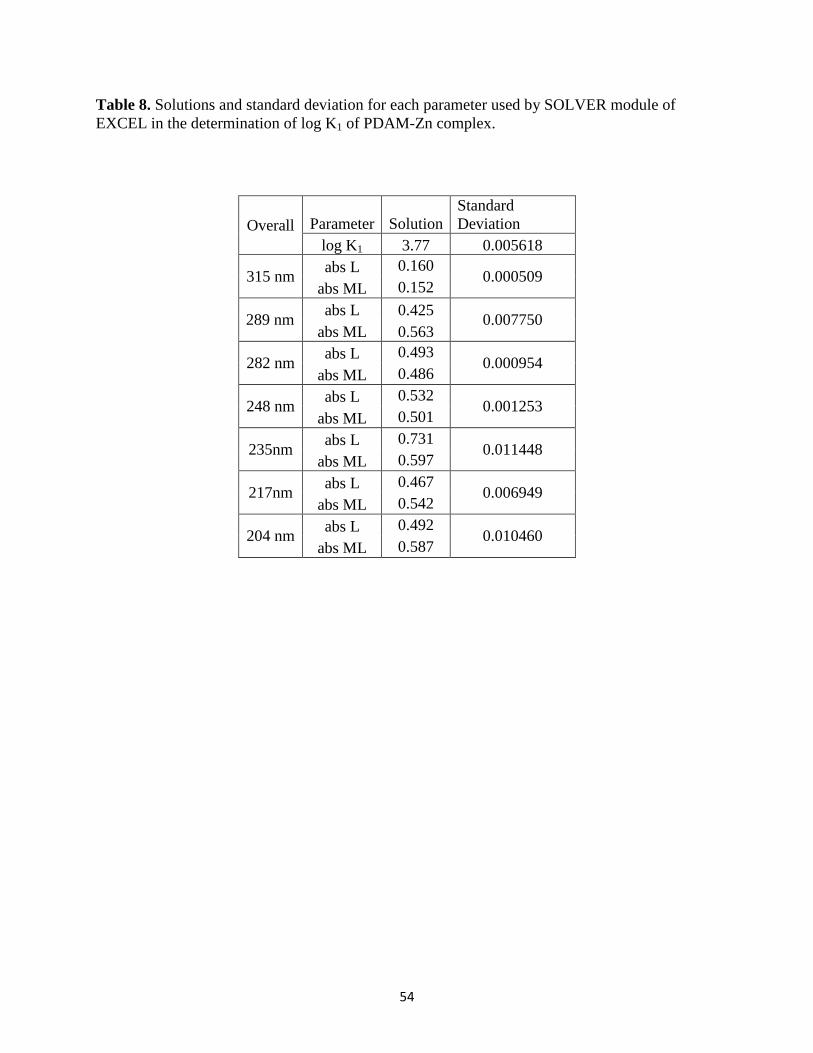
54
Table 8. Solutions and standard deviation for each parameter used by SOLVER module of
EXCEL in the determination of log K1 of PDAM-Zn complex.
Overall Parameter Solution
Standard
Deviation
log K1 3.77 0.005618
315 nm abs L 0.160
0.000509 abs ML 0.152
289 nm abs L 0.425
0.007750 abs ML 0.563
282 nm abs L 0.493
0.000954 abs ML 0.486
248 nm abs L 0.532
0.001253 abs ML 0.501
235nm abs L 0.731
0.011448 abs ML 0.597
217nm abs L 0.467
0.006949 abs ML 0.542
204 nm abs L 0.492
0.010460 abs ML 0.587
55
Scandium(III) Results
Scandium has an ionic radius of 0.75Å and is classified as a hard acid, which is closer to
the ideal 1.0 Å ionic radius for the complexation of the nitrogen and oxygen donor atoms of
PDAM. A solution of 3.36 x 10⁻³
M Sc(ClO4)3 was added to 2x10⁻⁵
M PDAM with 0.1M
NaClO4. The UV/Vis spectra plotting absorbance versus log of the concentration of Sc(ClO4)3
are shown in Figure 28. The spectra of the complexation of PDAM with Sc(III) shows evidence
of the formation of the complex by the multiple isosbestic points located throughout the spectra.
Absorbances were recorded at 297, 284, 256, and 235 nm because these wavelengths exhibited
the largest change in absorbances. The theoretical and measured absorbances were plotted for
every wavelength by minimizing the sum of the squares as shown in Figure 29. SOLVER was
used to minimize the standard deviation so that a more accurate log K1 value can be calculated.
Table 9 outlines the solutions of each parameter that was varied using SOLVER along with the
standard deviation of each variable. The log K1 was calculated to be 4.55 by using Equations 2-7
mentioned above. The increase in ionic radii allows the complexation Sc(III) to become easier
and require less energy as compared to the Ni(II) and Zn(II) as shown by the smaller values in
log K1.
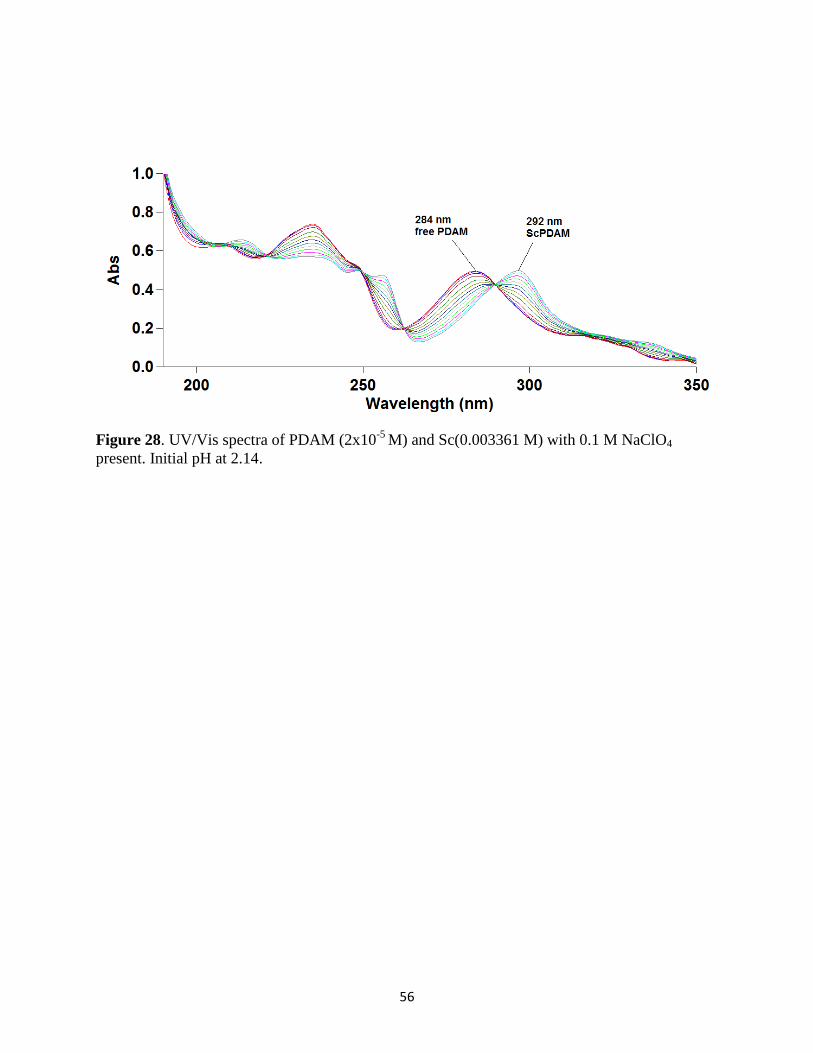
56
Figure 28. UV/Vis spectra of PDAM (2x10⁻⁵
M) and Sc(0.003361 M) with 0.1 M NaClO4
present. Initial pH at 2.14.
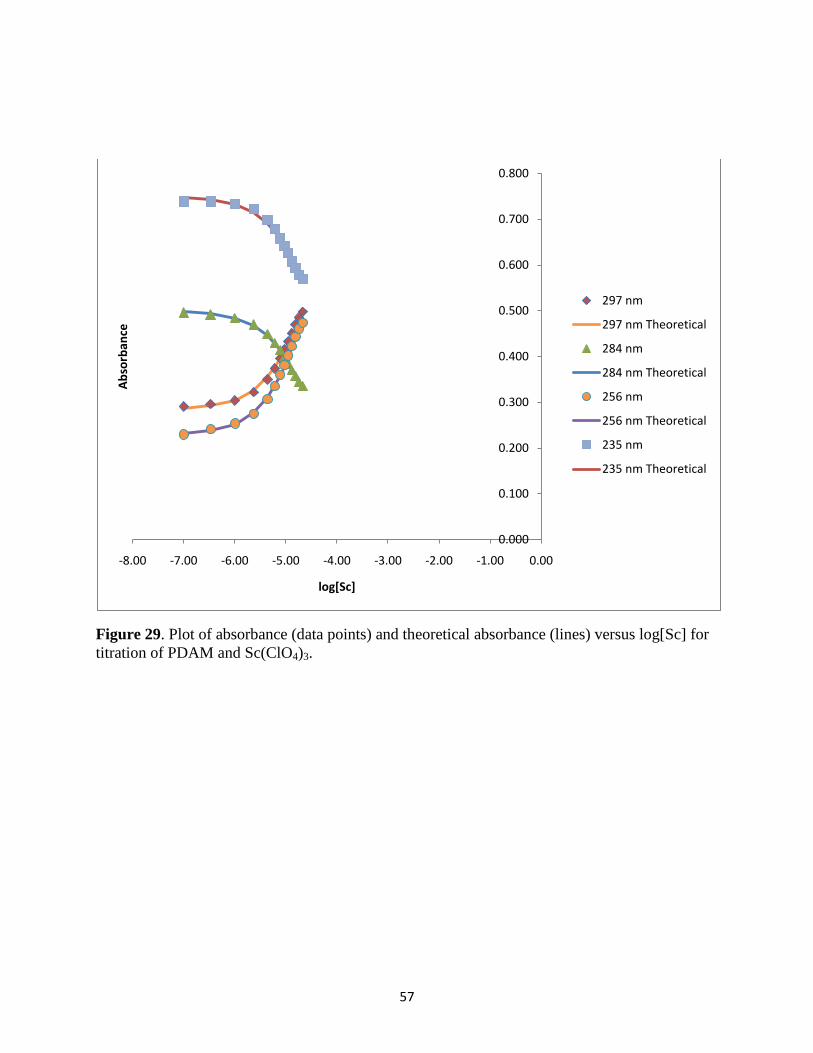
57
Figure 29. Plot of absorbance (data points) and theoretical absorbance (lines) versus log[Sc] for
titration of PDAM and Sc(ClO4)3.
0.000
0.100
0.200
0.300
0.400
0.500
0.600
0.700
0.800
-8.00 -7.00 -6.00 -5.00 -4.00 -3.00 -2.00 -1.00 0.00
Ab
sorb
ance
log[Sc]
297 nm
297 nm Theoretical
284 nm
284 nm Theoretical
256 nm
256 nm Theoretical
235 nm
235 nm Theoretical
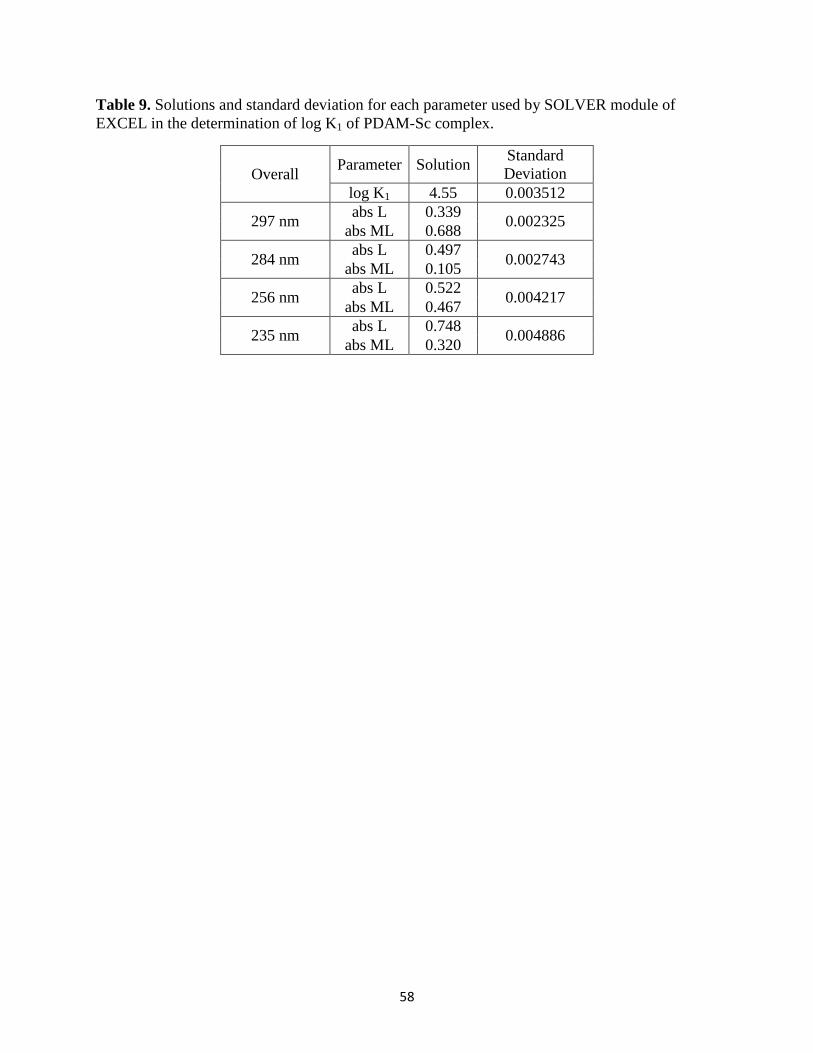
58
Table 9. Solutions and standard deviation for each parameter used by SOLVER module of
EXCEL in the determination of log K1 of PDAM-Sc complex.
Overall Parameter Solution
Standard
Deviation
log K1 4.55 0.003512
297 nm abs L 0.339
0.002325 abs ML 0.688
284 nm abs L 0.497
0.002743 abs ML 0.105
256 nm abs L 0.522
0.004217 abs ML 0.467
235 nm abs L 0.748
0.004886 abs ML 0.320
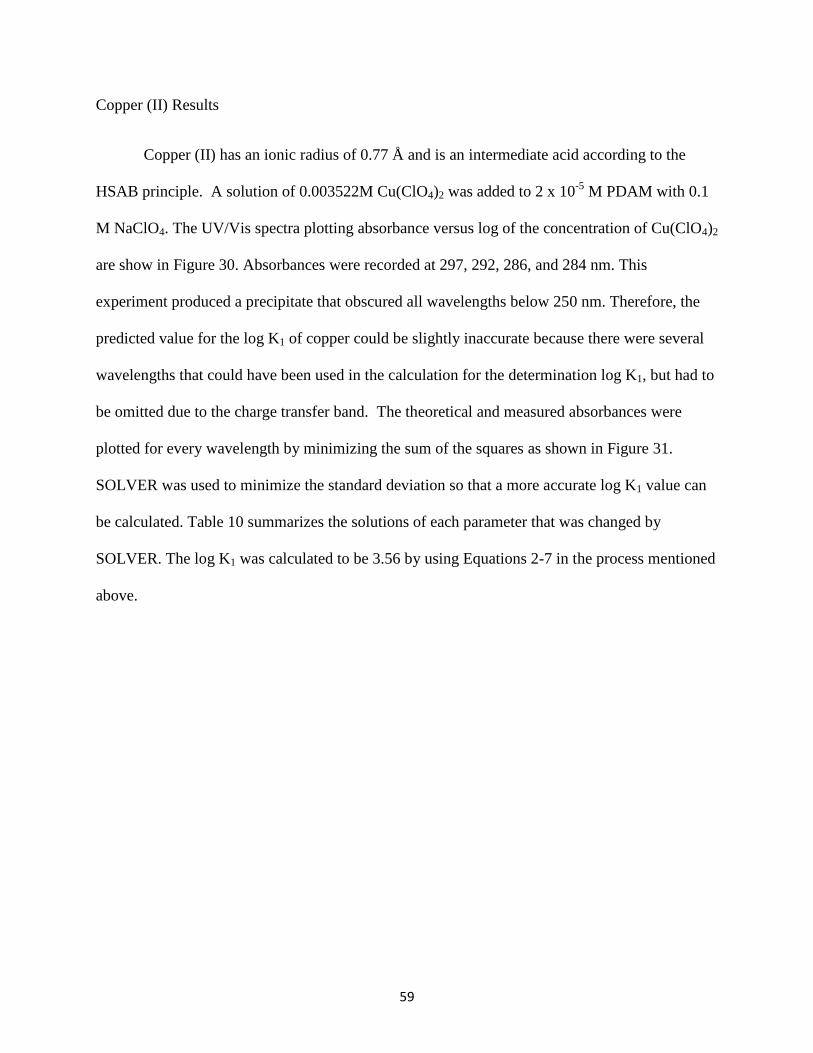
59
Copper (II) Results
Copper (II) has an ionic radius of 0.77 Å and is an intermediate acid according to the
HSAB principle. A solution of 0.003522M Cu(ClO4)2 was added to 2 x 10⁻⁵
M PDAM with 0.1
M NaClO4. The UV/Vis spectra plotting absorbance versus log of the concentration of Cu(ClO4)2
are show in Figure 30. Absorbances were recorded at 297, 292, 286, and 284 nm. This
experiment produced a precipitate that obscured all wavelengths below 250 nm. Therefore, the
predicted value for the log K1 of copper could be slightly inaccurate because there were several
wavelengths that could have been used in the calculation for the determination log K1, but had to
be omitted due to the charge transfer band. The theoretical and measured absorbances were
plotted for every wavelength by minimizing the sum of the squares as shown in Figure 31.
SOLVER was used to minimize the standard deviation so that a more accurate log K1 value can
be calculated. Table 10 summarizes the solutions of each parameter that was changed by
SOLVER. The log K1 was calculated to be 3.56 by using Equations 2-7 in the process mentioned
above.
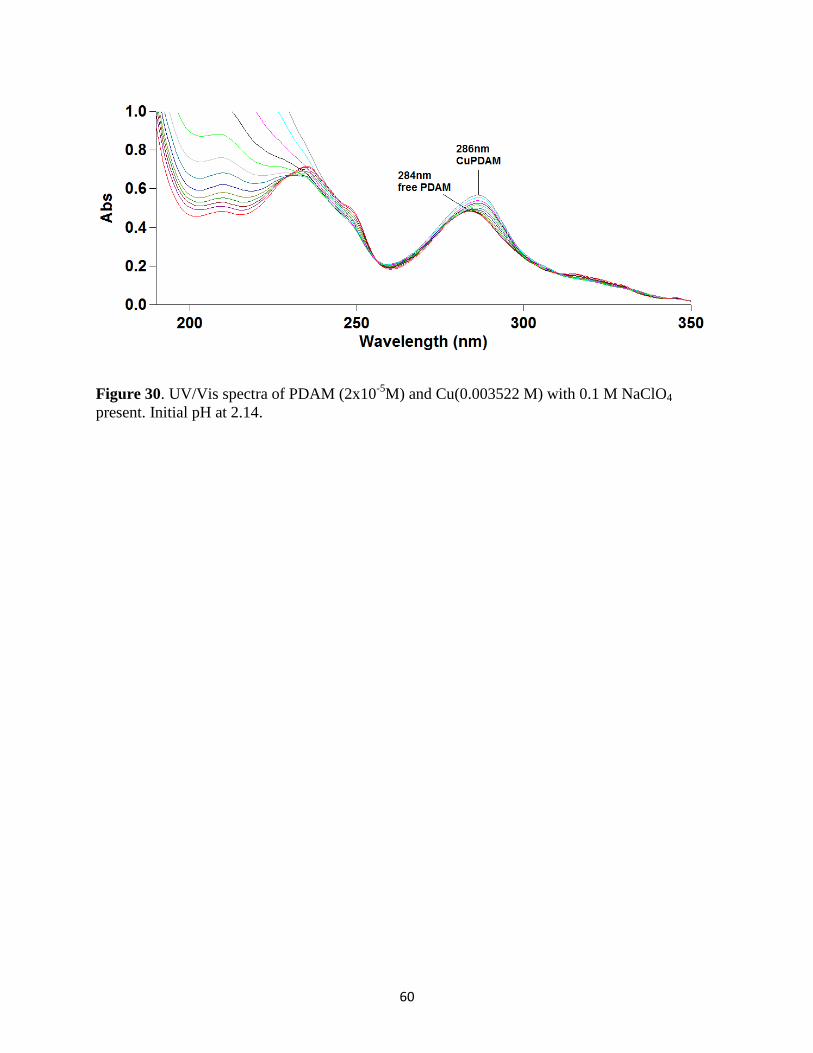
60
Figure 30. UV/Vis spectra of PDAM (2x10⁻⁵
M) and Cu(0.003522 M) with 0.1 M NaClO4
present. Initial pH at 2.14.
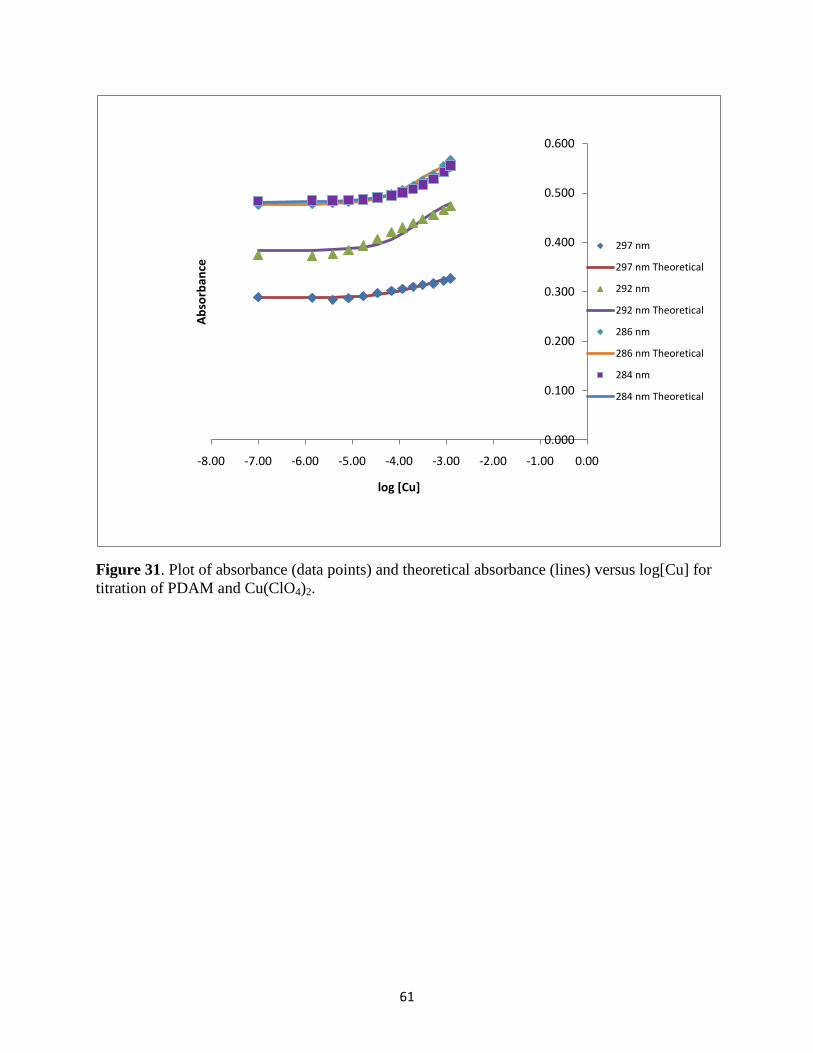
61
Figure 31. Plot of absorbance (data points) and theoretical absorbance (lines) versus log[Cu] for
titration of PDAM and Cu(ClO4)2.
0.000
0.100
0.200
0.300
0.400
0.500
0.600
-8.00 -7.00 -6.00 -5.00 -4.00 -3.00 -2.00 -1.00 0.00
Ab
sorb
ance
log [Cu]
297 nm
297 nm Theoretical
292 nm
292 nm Theoretical
286 nm
286 nm Theoretical
284 nm
284 nm Theoretical
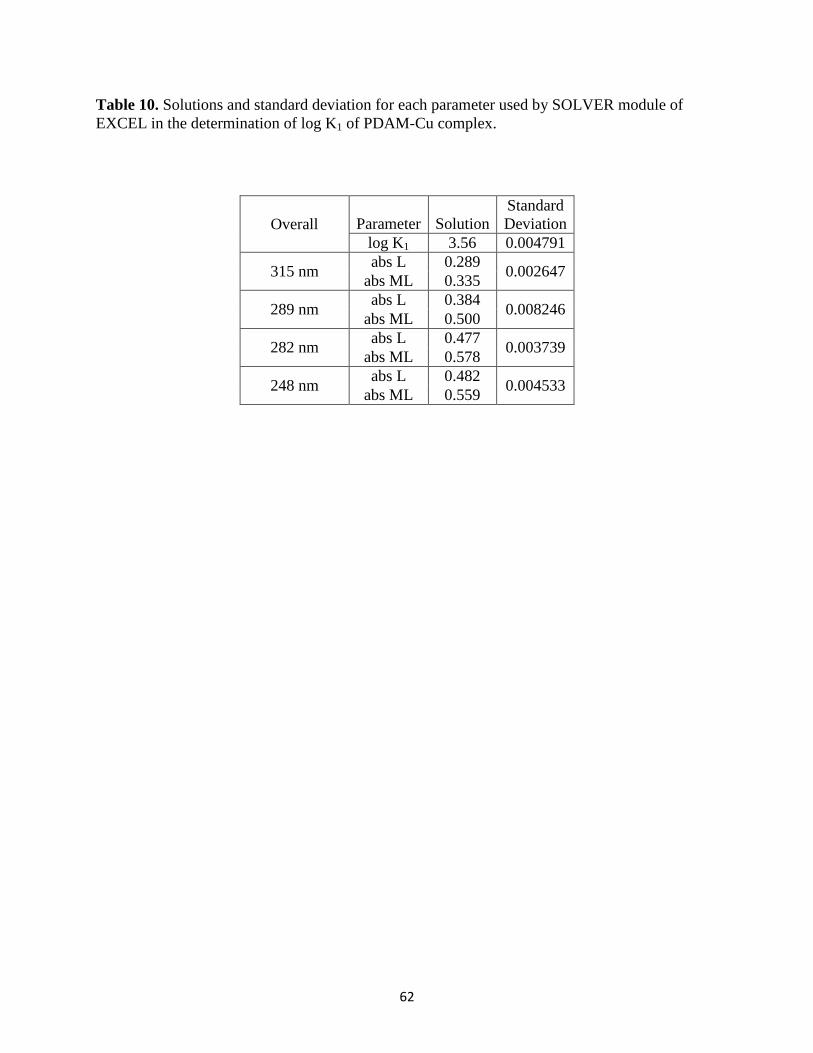
62
Table 10. Solutions and standard deviation for each parameter used by SOLVER module of
EXCEL in the determination of log K1 of PDAM-Cu complex.
Overall Parameter Solution
Standard
Deviation
log K1 3.56 0.004791
315 nm abs L 0.289
0.002647 abs ML 0.335
289 nm abs L 0.384
0.008246 abs ML 0.500
282 nm abs L 0.477
0.003739 abs ML 0.578
248 nm abs L 0.482
0.004533 abs ML 0.559
63
Indium (III) Results
Indium has an ionic radius of 0.80Å and is classified as an intermediate acid according to
the HSAB rules. This is an ideal metal ion because it binds preferably with nitrogen donors as
shown with the log K1 NH3 = 4.0. Another reason for the dramatic increase in log K1 value of
indium is shown by the sharp band that is formed at 250 nm. This sharp band is due to the π-π*
transition which in the free ligand is coupled to vibrations of the ligand that broaden the band.
When indium coordinates to PDAM to form a complex, the rigidity of PDAM in its complex
with indium increases greatly and these vibrations are no longer coupled to the electronic
transition which sharpens the appearance of that band. The presence of five-membered chelate
rings when forming a complex allows PDAM to be more selective to metal-ligand bond lengths
closer to 1.0Å which includes In(III). Indium binds so well with PDAM that metal addition
would not be able to accurately determine the log K1 value of indium with PDAM. Therefore, a
competition reaction with TETREN was used to determine a more accurate value of log K1. This
experiment was conducted by using 50.0 mL solution of 1:1:1 PDAM: In(ClO4)3:TETREN at
2.00x10⁻⁵
M and was acidified to an initial pH of 2.07. This was titrated with 0.10 M NaOH
solution to a final pH of 7.31. The UV/Vis spectra plotting absorbance versus wavelength is
shown in Figure 32. Absorbances were recorded at 294, 284, 253, and 237 nm because these
wavelengths exhibited the largest change in absorbances. A log K1 of 9.43 was calculated from
the absorbance data using the process as described above. Theoretical and measured absorbances
were plotted shown in Figure 33 for each wavelength by minimizing the sum of the squares
using SOLVER. Table 11 summarizes the solutions of each parameter that was changed by
SOLVER. The program was also used to minimize all standard deviations in order to determine
the best possible log K1 value.
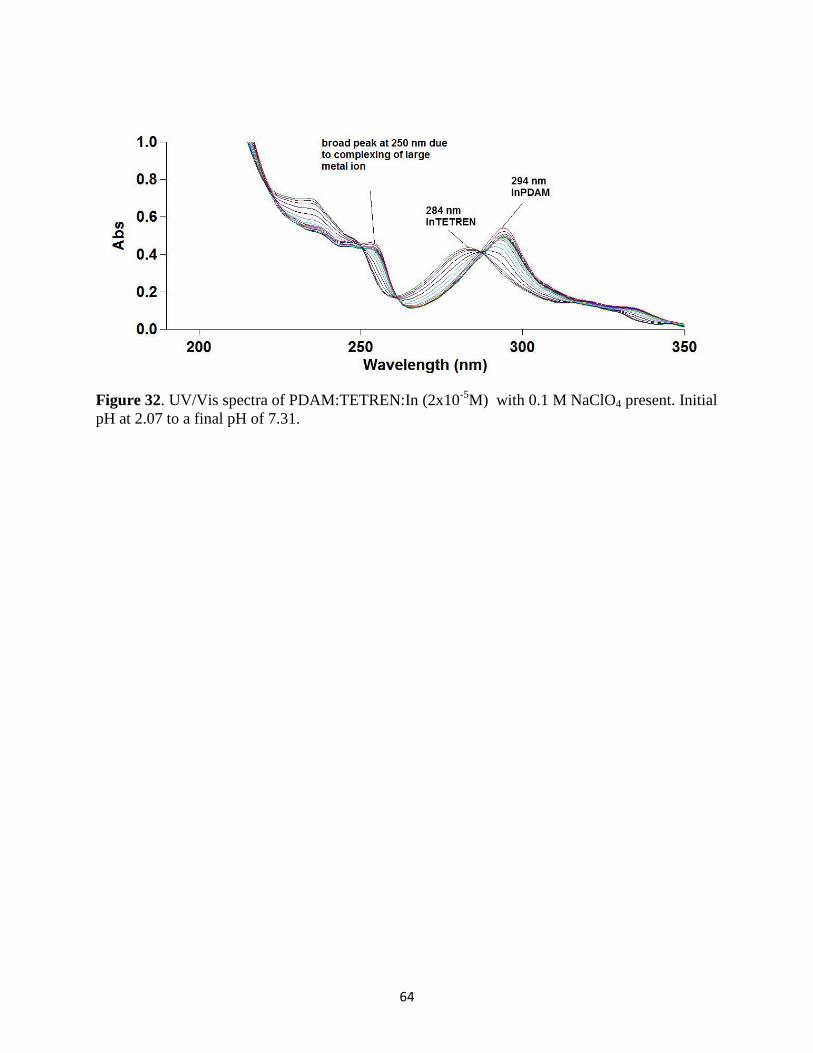
64
Figure 32. UV/Vis spectra of PDAM:TETREN:In (2x10⁻⁵
M) with 0.1 M NaClO4 present. Initial
pH at 2.07 to a final pH of 7.31.
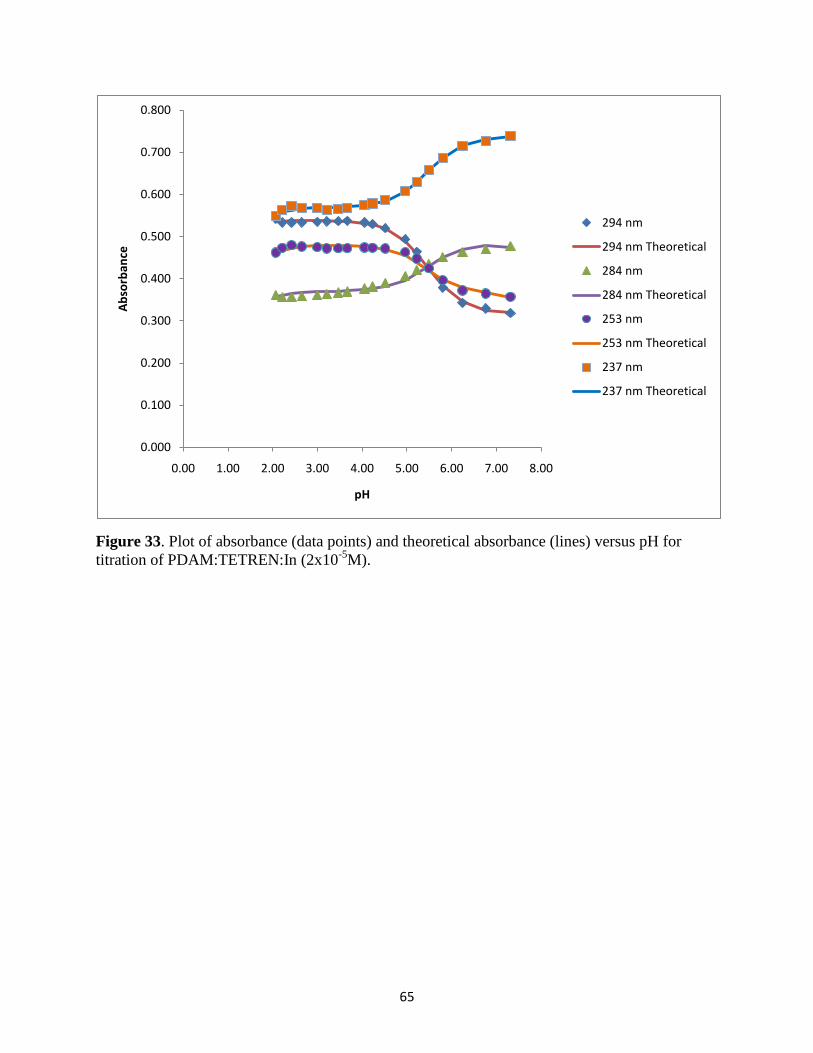
65
Figure 33. Plot of absorbance (data points) and theoretical absorbance (lines) versus pH for
titration of PDAM:TETREN:In (2x10⁻⁵
M).
0.000
0.100
0.200
0.300
0.400
0.500
0.600
0.700
0.800
0.00 1.00 2.00 3.00 4.00 5.00 6.00 7.00 8.00
Ab
sorb
ance
pH
294 nm
294 nm Theoretical
284 nm
284 nm Theoretical
253 nm
253 nm Theoretical
237 nm
237 nm Theoretical
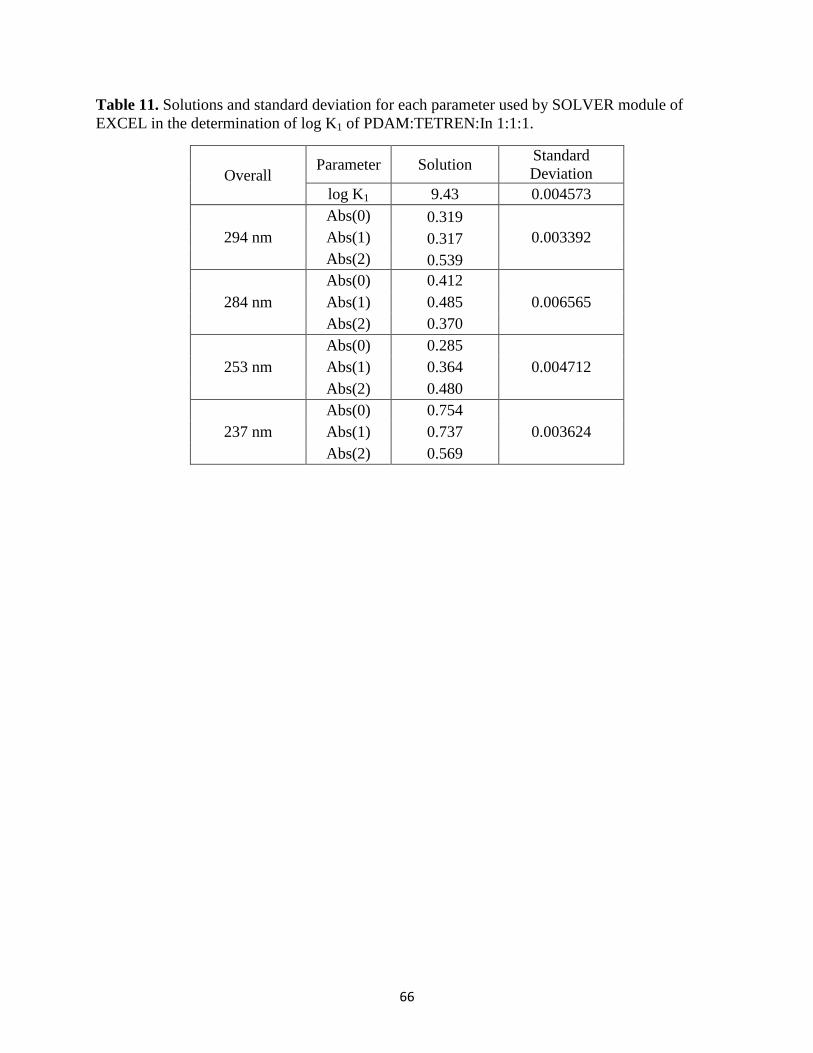
66
Table 11. Solutions and standard deviation for each parameter used by SOLVER module of
EXCEL in the determination of log K1 of PDAM:TETREN:In 1:1:1.
Overall Parameter Solution
Standard
Deviation
log K1 9.43 0.004573
294 nm
Abs(0) 0.319
0.003392 Abs(1) 0.317
Abs(2) 0.539
284 nm
Abs(0) 0.412
0.006565 Abs(1) 0.485
Abs(2) 0.370
253 nm
Abs(0) 0.285
0.004712 Abs(1) 0.364
Abs(2) 0.480
237 nm
Abs(0) 0.754
0.003624 Abs(1) 0.737
Abs(2) 0.569
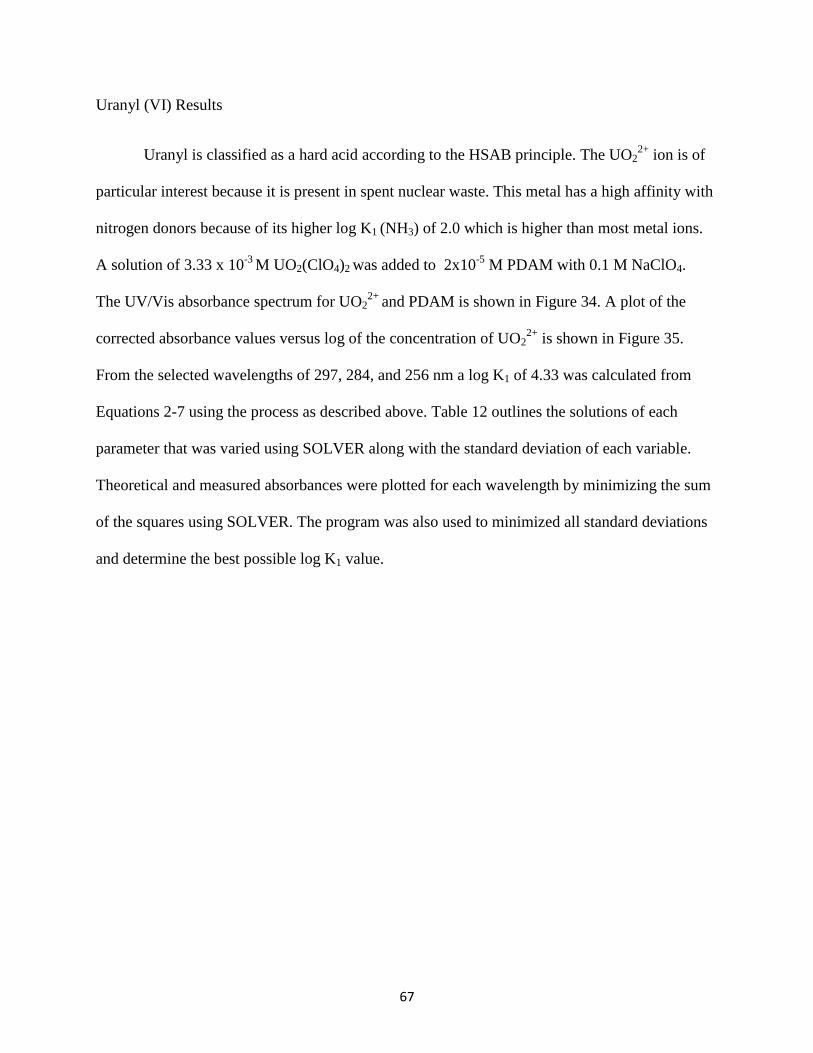
67
Uranyl (VI) Results
Uranyl is classified as a hard acid according to the HSAB principle. The UO22+
ion is of
particular interest because it is present in spent nuclear waste. This metal has a high affinity with
nitrogen donors because of its higher log K1 (NH3) of 2.0 which is higher than most metal ions.
A solution of 3.33 x 10⁻³
M UO2(ClO4)2 was added to 2x10⁻⁵
M PDAM with 0.1 M NaClO4.
The UV/Vis absorbance spectrum for UO22+
and PDAM is shown in Figure 34. A plot of the
corrected absorbance values versus log of the concentration of UO22+
is shown in Figure 35.
From the selected wavelengths of 297, 284, and 256 nm a log K1 of 4.33 was calculated from
Equations 2-7 using the process as described above. Table 12 outlines the solutions of each
parameter that was varied using SOLVER along with the standard deviation of each variable.
Theoretical and measured absorbances were plotted for each wavelength by minimizing the sum
of the squares using SOLVER. The program was also used to minimized all standard deviations
and determine the best possible log K1 value.
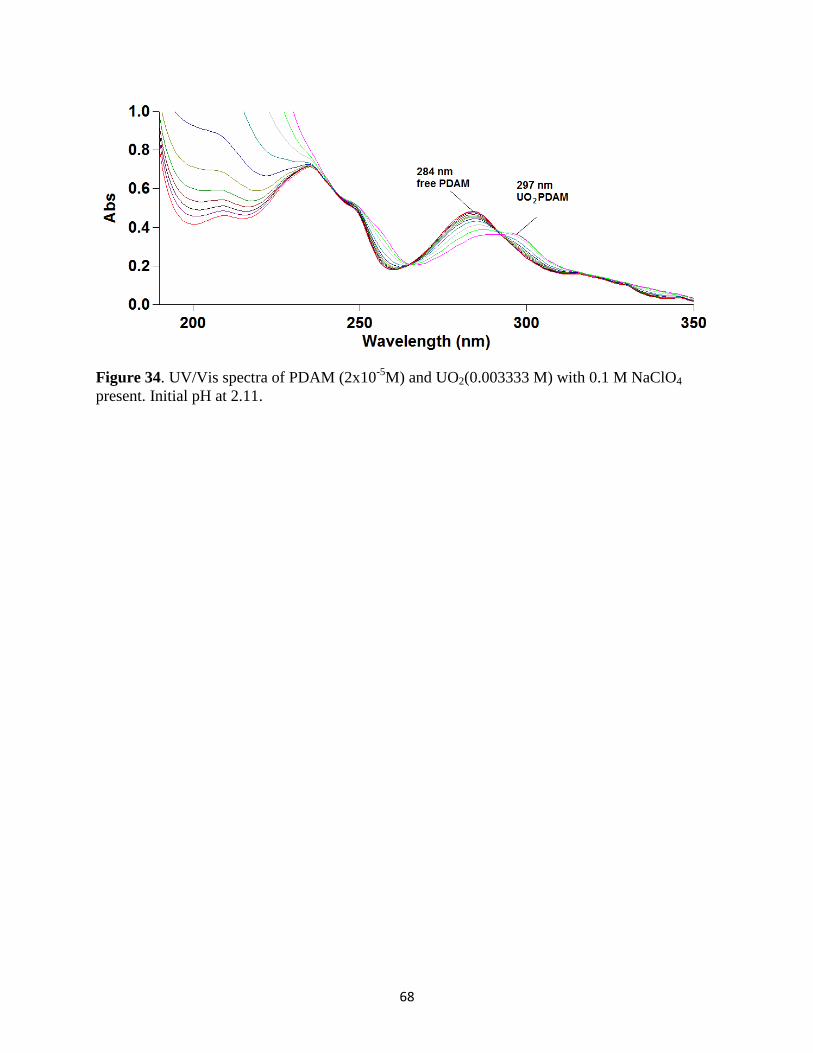
68
Figure 34. UV/Vis spectra of PDAM (2x10⁻⁵
M) and UO2(0.003333 M) with 0.1 M NaClO4
present. Initial pH at 2.11.
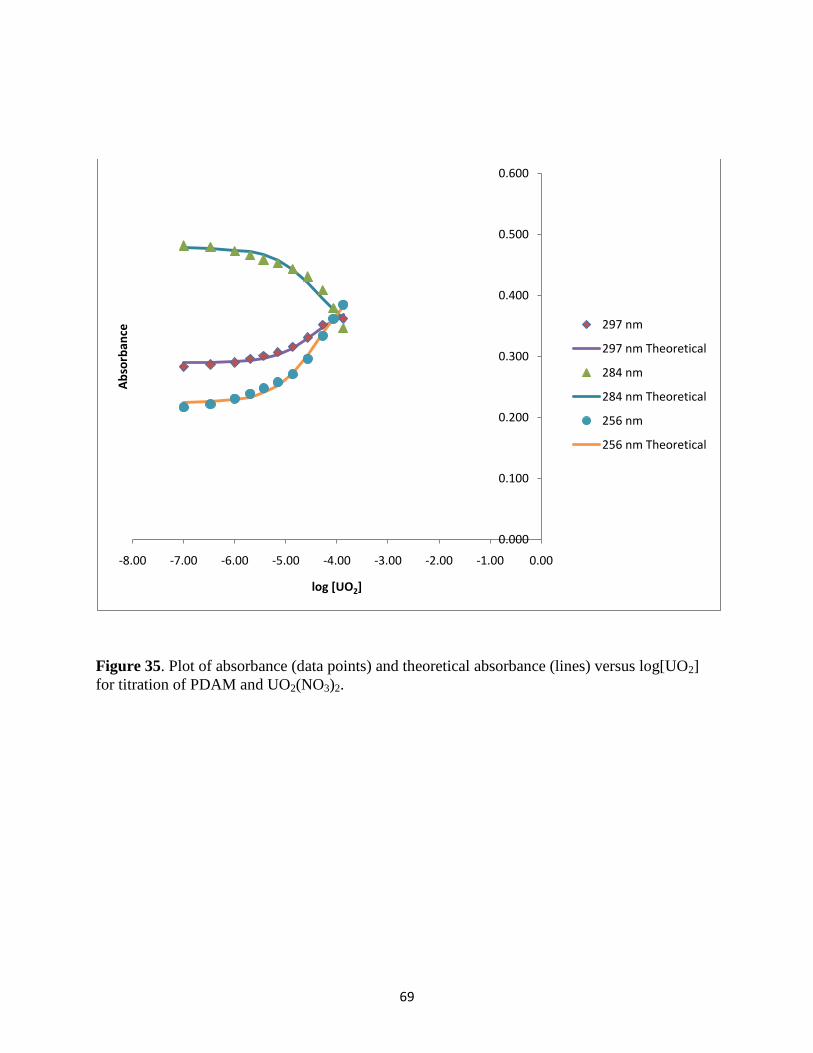
69
Figure 35. Plot of absorbance (data points) and theoretical absorbance (lines) versus log[UO2]
for titration of PDAM and UO2(NO3)2.
0.000
0.100
0.200
0.300
0.400
0.500
0.600
-8.00 -7.00 -6.00 -5.00 -4.00 -3.00 -2.00 -1.00 0.00
Ab
sorb
ance
log [UO2]
297 nm
297 nm Theoretical
284 nm
284 nm Theoretical
256 nm
256 nm Theoretical
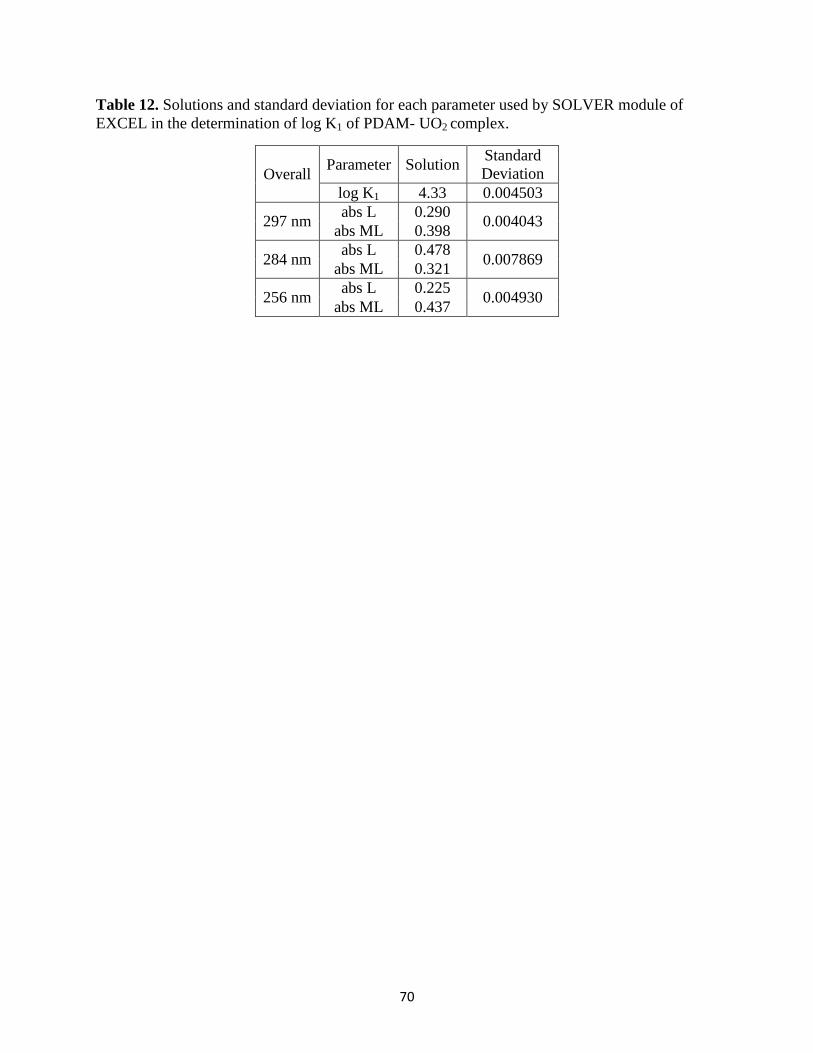
70
Table 12. Solutions and standard deviation for each parameter used by SOLVER module of
EXCEL in the determination of log K1 of PDAM- UO2 complex.
Overall Parameter Solution
Standard
Deviation
log K1 4.33 0.004503
297 nm abs L 0.290
0.004043 abs ML 0.398
284 nm abs L 0.478
0.007869 abs ML 0.321
256 nm abs L 0.225
0.004930 abs ML 0.437
71
Yttrium (III) Results
Yttrium (III) has an ionic radius of 0.90 Å which is close to the ideal 1.00 Å ionic radius
for the complexation of PDAM. Yttrium is classified according to the HSAB principle as a hard
acid. Although Y3+
is close to the ideal size for complexation with PDAM, the affinity with N-
donors with Y3+
are rather unfavorable as seen with the log K1 with NH3 to be 0.4.[16] A
solution of 0.003333 M Y(NO3)3 was added to 2 x 10⁻⁵
M PDAM with 0.1 M NaClO4. The
UV/Vis spectra plotting absorbance versus log of the concentration of Y(NO3)3 are show in
Figure 36. Absorbances were recorded at 297, 292, 284 nm. This experiment produced a
precipitate that obscured all wavelengths below 250 nm. Therefore, the predicted value for the
log K1 of yttrium could be slightly inaccurate because there were several wavelengths that could
have been used in the calculation for the determination log K1, but had to be omitted due to this
precipitate. Although there were few wavelengths that were recorded, the spectra produced an
isosbestic point which clearly indicates that the complex did indeed form from the metal addition
experiment. The theoretical and measured absorbances were plotted for every wavelength by
minimizing the sum of the squares as shown in Figure 37. SOLVER was used to minimize the
standard deviation so that a more accurate log K1 value can be calculated. Table 13 summarizes
the solutions of each parameter that was changed by SOLVER. The log K1 was calculated to be
3.45 by using Equations 2-7 in the process mentioned above.
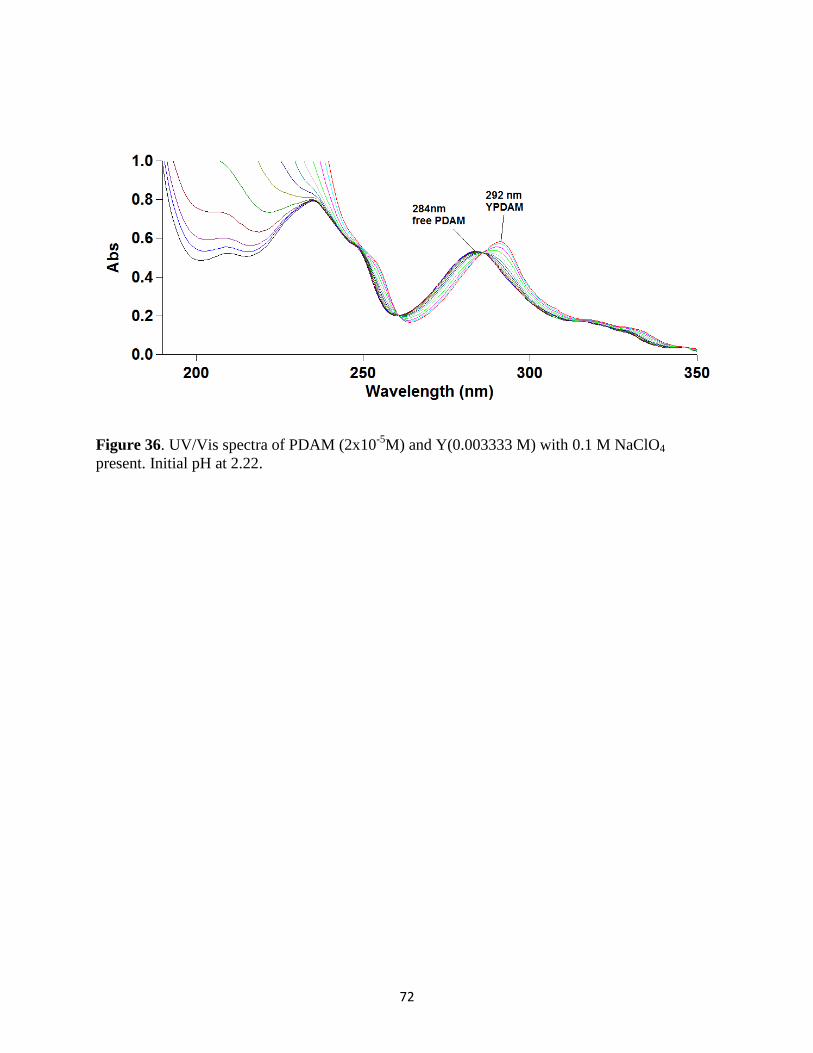
72
Figure 36. UV/Vis spectra of PDAM (2x10⁻⁵
M) and Y(0.003333 M) with 0.1 M NaClO4
present. Initial pH at 2.22.
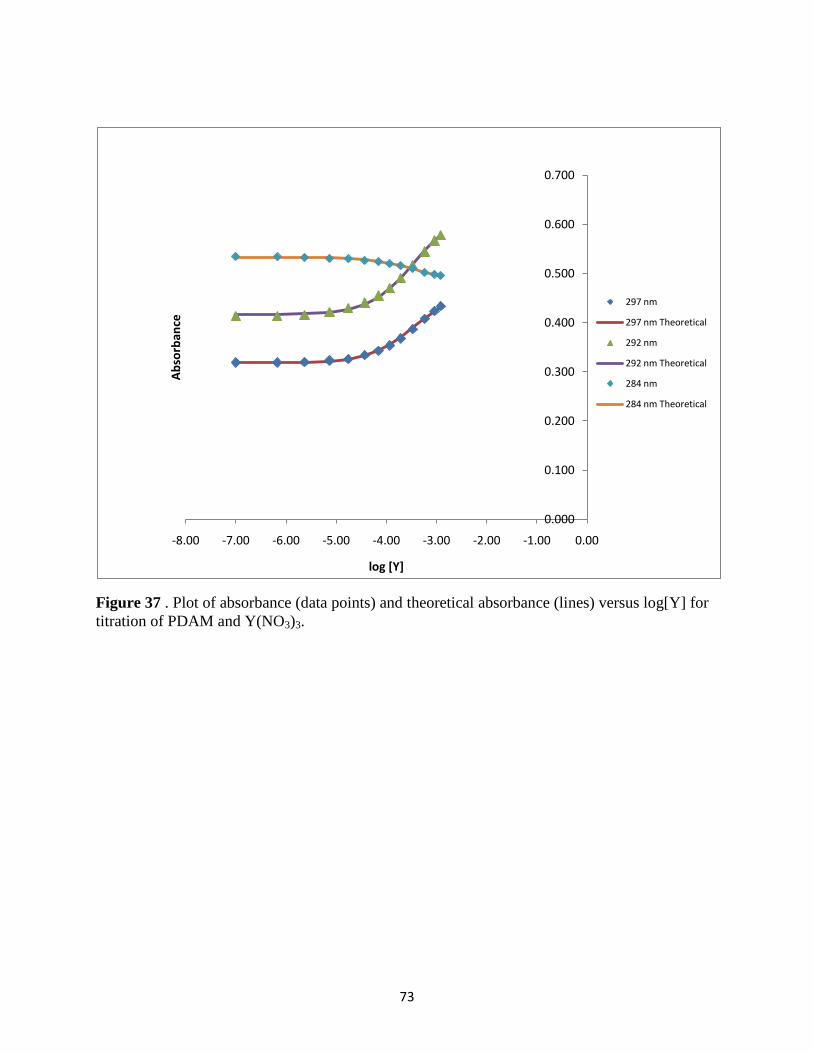
73
Figure 37 . Plot of absorbance (data points) and theoretical absorbance (lines) versus log[Y] for
titration of PDAM and Y(NO3)3.
0.000
0.100
0.200
0.300
0.400
0.500
0.600
0.700
-8.00 -7.00 -6.00 -5.00 -4.00 -3.00 -2.00 -1.00 0.00
Ab
sorb
ance
log [Y]
297 nm
297 nm Theoretical
292 nm
292 nm Theoretical
284 nm
284 nm Theoretical
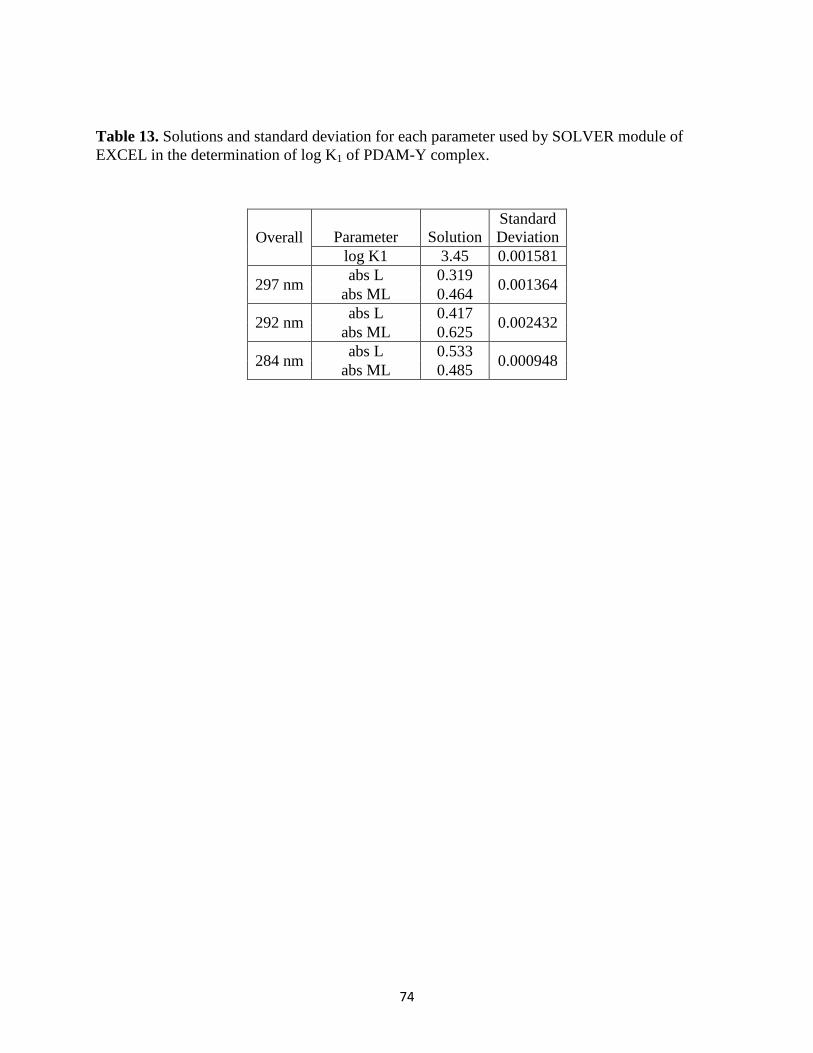
74
Table 13. Solutions and standard deviation for each parameter used by SOLVER module of
EXCEL in the determination of log K1 of PDAM-Y complex.
Overall Parameter Solution
Standard
Deviation
log K1 3.45 0.001581
297 nm abs L 0.319
0.001364 abs ML 0.464
292 nm abs L 0.417
0.002432 abs ML 0.625
284 nm abs L 0.533
0.000948 abs ML 0.485
75
Thorium (IV) results
Thorium (IV) has an ionic radius of 0.94 Å which is slightly smaller than the 1.0 Å
favored by PDAM. Thorium has a log K1 (NH3) of only 0.1 which means that thorium has a low
affinity for N-donors. The value of the stability constant for thorium is of particular interest
because it was only other actinide besides uranyl for which a log K1 could be calculated.
Thorium is classified as a hard acid in the HSAB rules. The UV absorbance spectrum for
0.003488 M thorium (IV) additions with PDAM at 2.00 x 10⁻⁵
M is show in Figure 38 below.
Absorbances were recorded at 297, 284, and 256 nm because wavelengths experienced the
largest change in absorbances. The spectra also produced three very distinct isosbestic points
which are indicative of complexation of the [Th(PDAM)]4+
complex. The theoretical and
measured absorbances were plotted for every wavelength by minimizing the sum of the squares
as shown in Figure 39. SOLVER was used to minimize the standard deviation so that a more
accurate log K1 value can be calculated. Table 14 summarizes the solutions of each parameter
that was changed by SOLVER. The log K1 was calculated to be 5.01 by using Equations 2-7 in
the process mentioned above. Because there is a slightly higher log K1 value than expected with
PDAM this could be explained for the slightly higher cationic charge on thorium which makes
up for its lack of affinity for nitrogen donors.
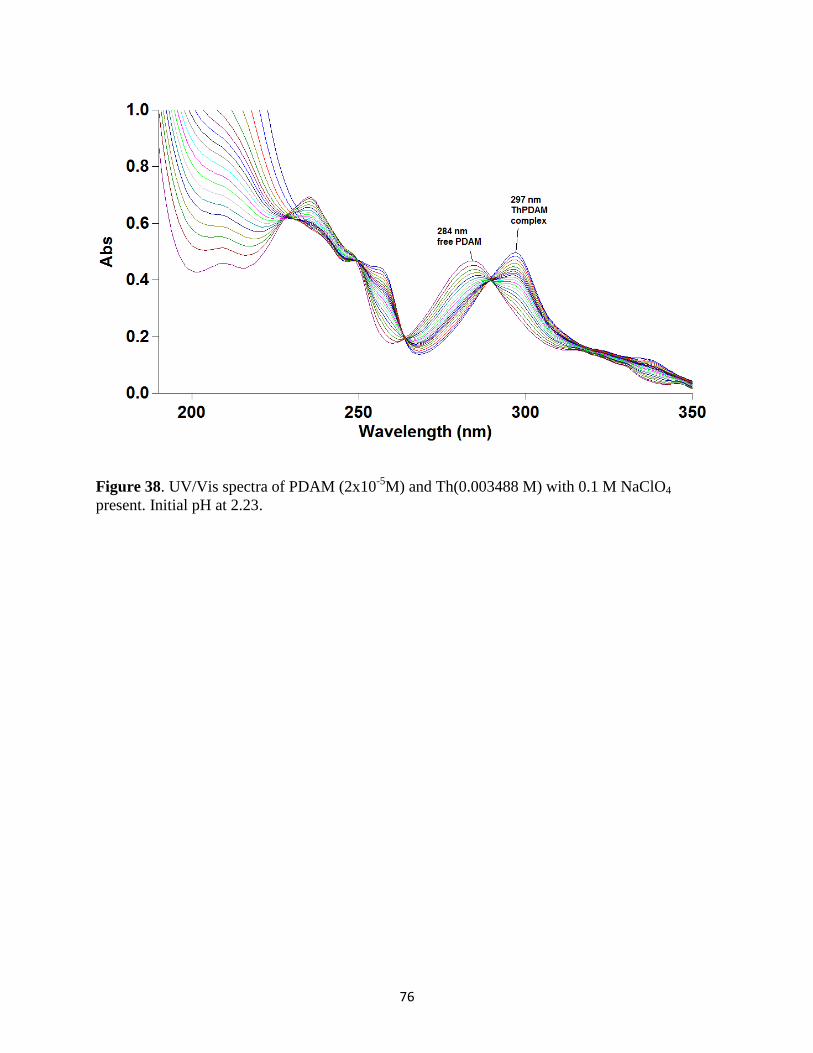
76
Figure 38. UV/Vis spectra of PDAM (2x10⁻⁵
M) and Th(0.003488 M) with 0.1 M NaClO4
present. Initial pH at 2.23.
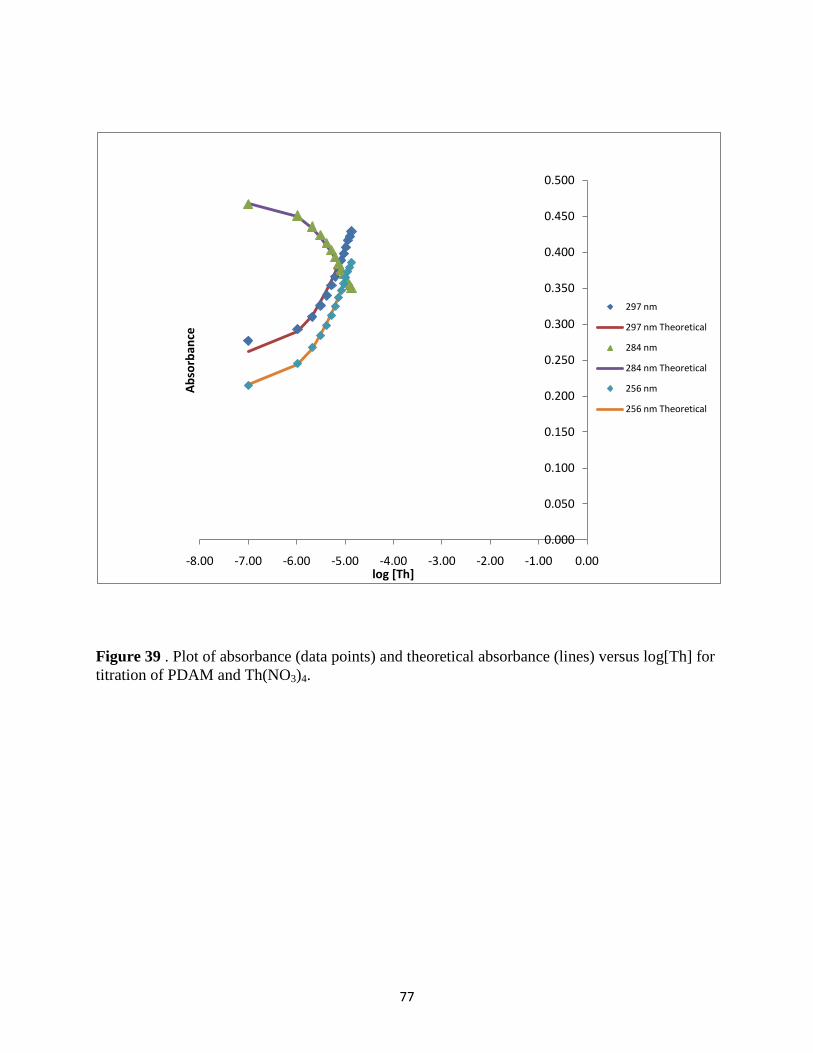
77
Figure 39 . Plot of absorbance (data points) and theoretical absorbance (lines) versus log[Th] for
titration of PDAM and Th(NO3)4.
0.000
0.050
0.100
0.150
0.200
0.250
0.300
0.350
0.400
0.450
0.500
-8.00 -7.00 -6.00 -5.00 -4.00 -3.00 -2.00 -1.00 0.00
Ab
sorb
ance
log [Th]
297 nm
297 nm Theoretical
284 nm
284 nm Theoretical
256 nm
256 nm Theoretical
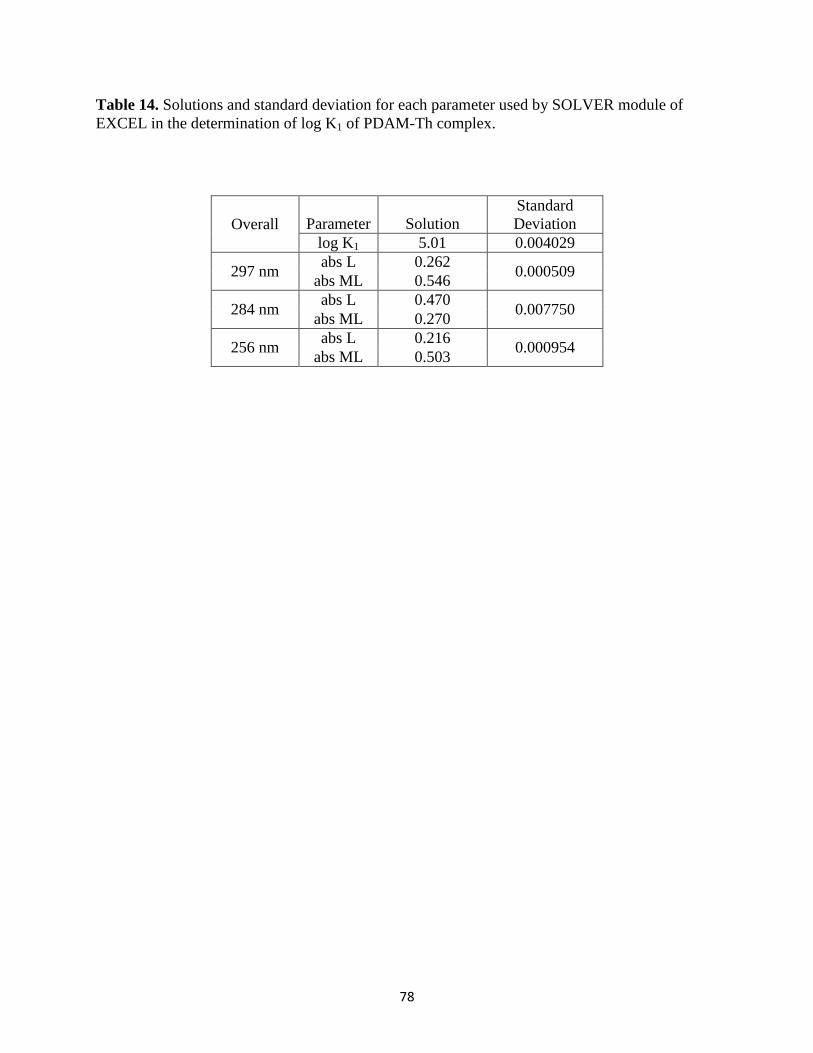
78
Table 14. Solutions and standard deviation for each parameter used by SOLVER module of
EXCEL in the determination of log K1 of PDAM-Th complex.
Overall Parameter Solution
Standard
Deviation
log K1 5.01 0.004029
297 nm abs L 0.262
0.000509 abs ML 0.546
284 nm abs L 0.470
0.007750 abs ML 0.270
256 nm abs L 0.216
0.000954 abs ML 0.503
79
Cadmium (II) Results
Cadmium has an ionic radius of 0.95Å and is classified as a soft acid. PDAM found to be
very selective for cadmium because of its ideal size. A solution of 2.00x10⁻⁵
M PDAM solution
was prepared and 0.003333 M of Cd(ClO4)2 was added to the solution. This analysis as shown in
Figure 40 was unable to give an accurate log K1 because very little Cd(ClO4)2 was needed to
form the complex. A second experiment shown in Figure 41 was conducted by using 50.0 mL
solution of 1:1:1 PDAM: Cd(ClO4)2:EDTA at 2.00x10⁻⁵
M and was acidified to an initial pH of
2.20. This was titrated with 0.10 M NaOH solution to a final pH of 7.39. The UV/Vis spectra
plotting absorbance versus wavelength is shown in Figure 43. Absorbances were recorded at
330, 316, 287, 261, and 250 nm because these wavelengths exhibited the largest change in
absorbances. A log K1 of 7.05 was calculated from the absorbance data using the process as
described above. Theoretical and measured absorbances were plotted for each wavelength by
minimizing the sum of the squares using SOLVER. Table 15 summarizes the solutions of each
parameter that was changed by SOLVER. The program was also used to minimized all standard
deviations and determine the best possible log K1 value.
Cadmium has higher stability with PDAM than most of the other metal ions analyzed.
The reasoning for its high log K1 value is that it is at an ideal size and can bind to all four donor
atoms unlike 1, 10-phenanthroline with a log K1 of 5.66. However, denticity and preorganization
are the primary factors for the high stability of the [Cd(PDAM)]2+
complex.
To further justify the log K1 of cadmium with PDAM another experiment shown in
Figure 42 and 44 was performed in competition with TETREN. Table 16 summarizes the
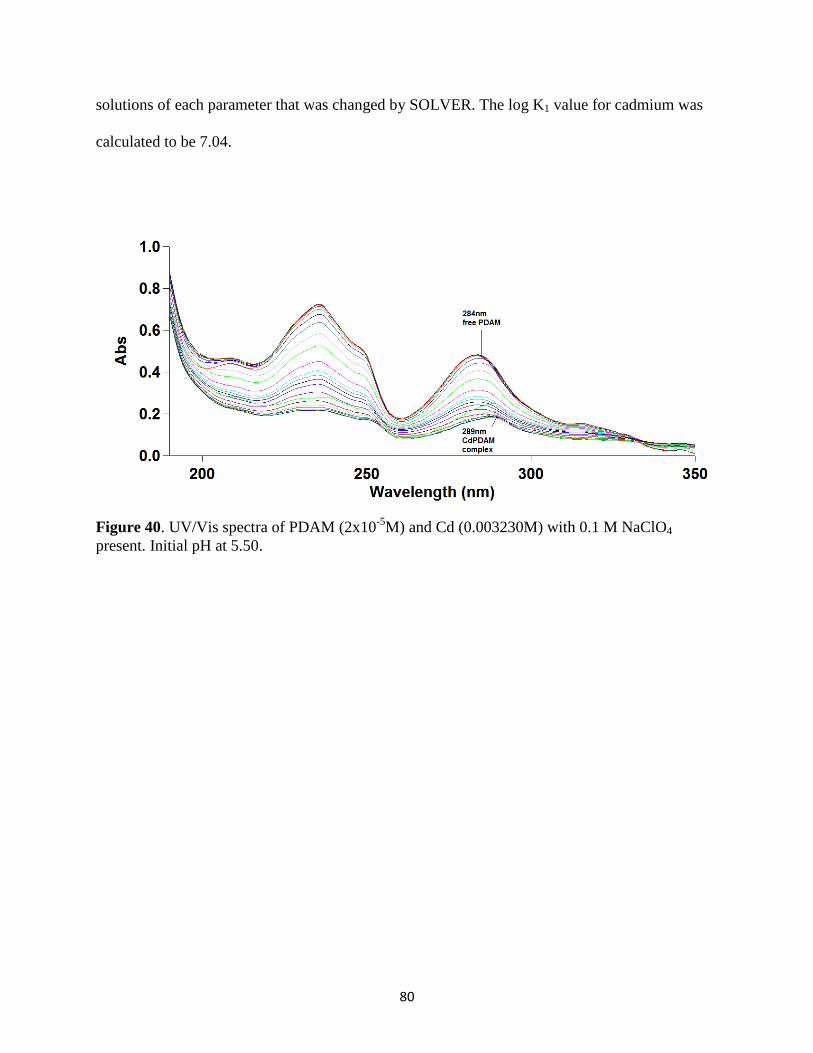
80
solutions of each parameter that was changed by SOLVER. The log K1 value for cadmium was
calculated to be 7.04.
Figure 40. UV/Vis spectra of PDAM (2x10⁻⁵
M) and Cd (0.003230M) with 0.1 M NaClO4
present. Initial pH at 5.50.
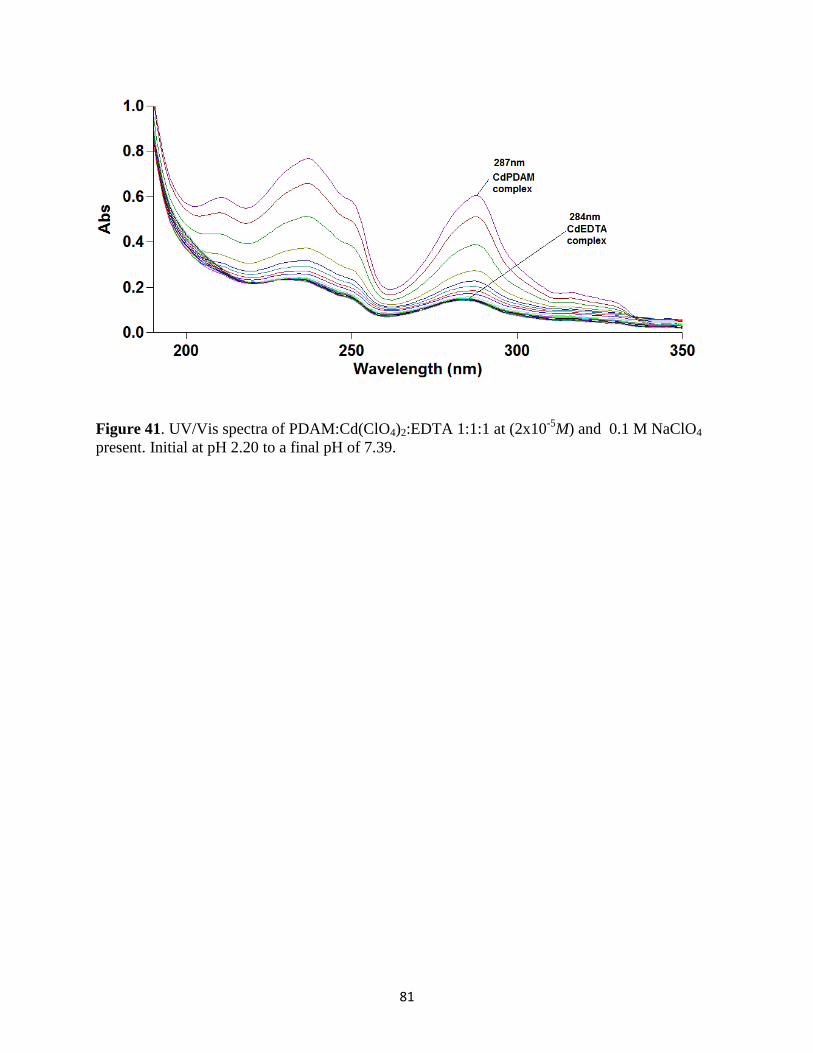
81
Figure 41. UV/Vis spectra of PDAM:Cd(ClO4)2:EDTA 1:1:1 at (2x10⁻⁵
M) and 0.1 M NaClO4
present. Initial at pH 2.20 to a final pH of 7.39.
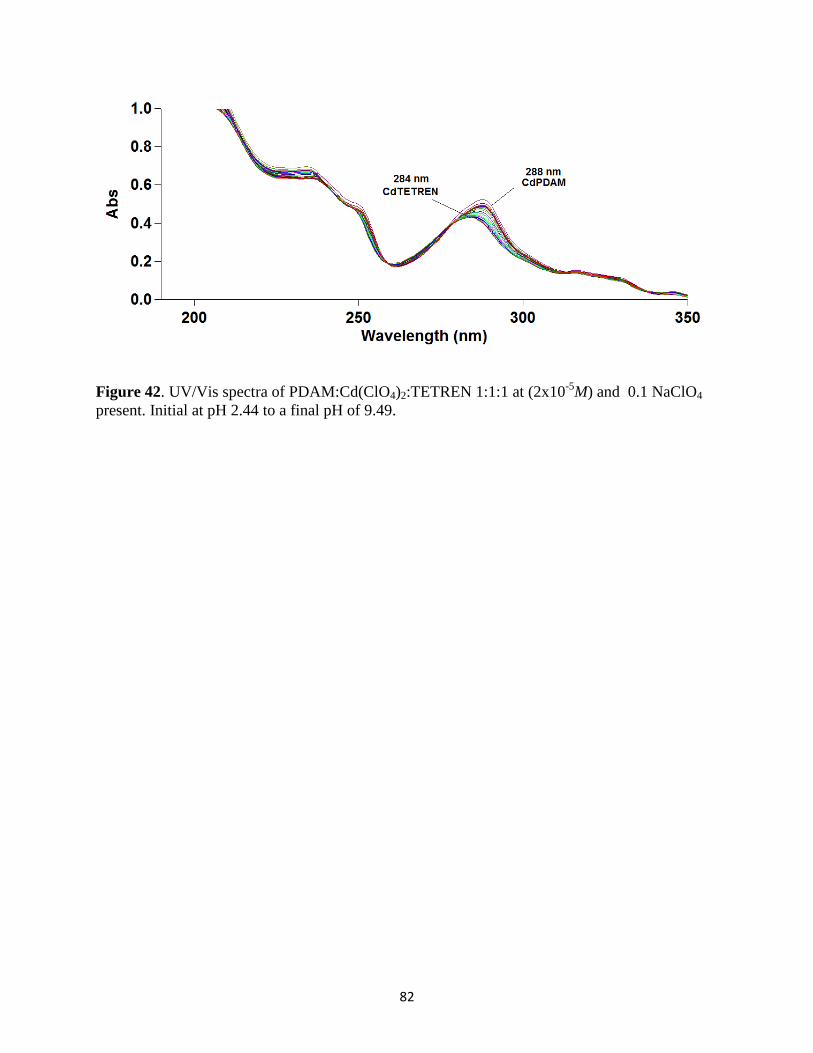
82
Figure 42. UV/Vis spectra of PDAM:Cd(ClO4)2:TETREN 1:1:1 at (2x10⁻⁵
M) and 0.1 NaClO4
present. Initial at pH 2.44 to a final pH of 9.49.
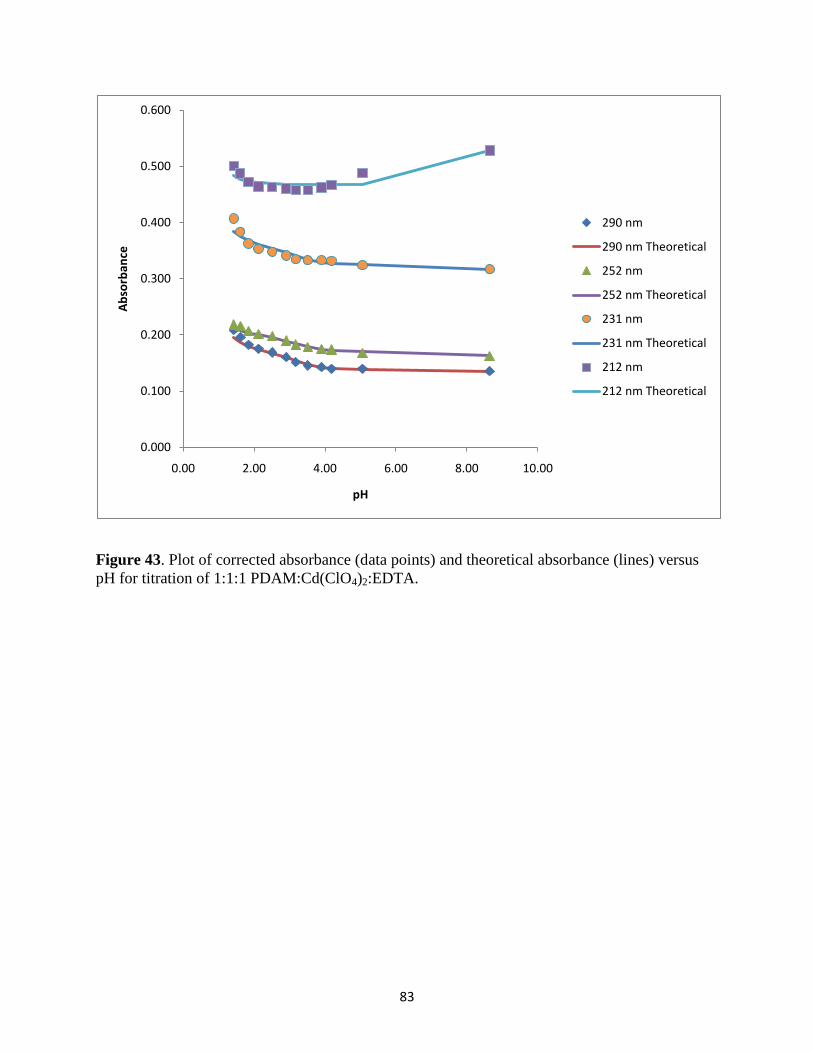
83
Figure 43. Plot of corrected absorbance (data points) and theoretical absorbance (lines) versus
pH for titration of 1:1:1 PDAM:Cd(ClO4)2:EDTA.
0.000
0.100
0.200
0.300
0.400
0.500
0.600
0.00 2.00 4.00 6.00 8.00 10.00
Ab
sorb
ance
pH
290 nm
290 nm Theoretical
252 nm
252 nm Theoretical
231 nm
231 nm Theoretical
212 nm
212 nm Theoretical
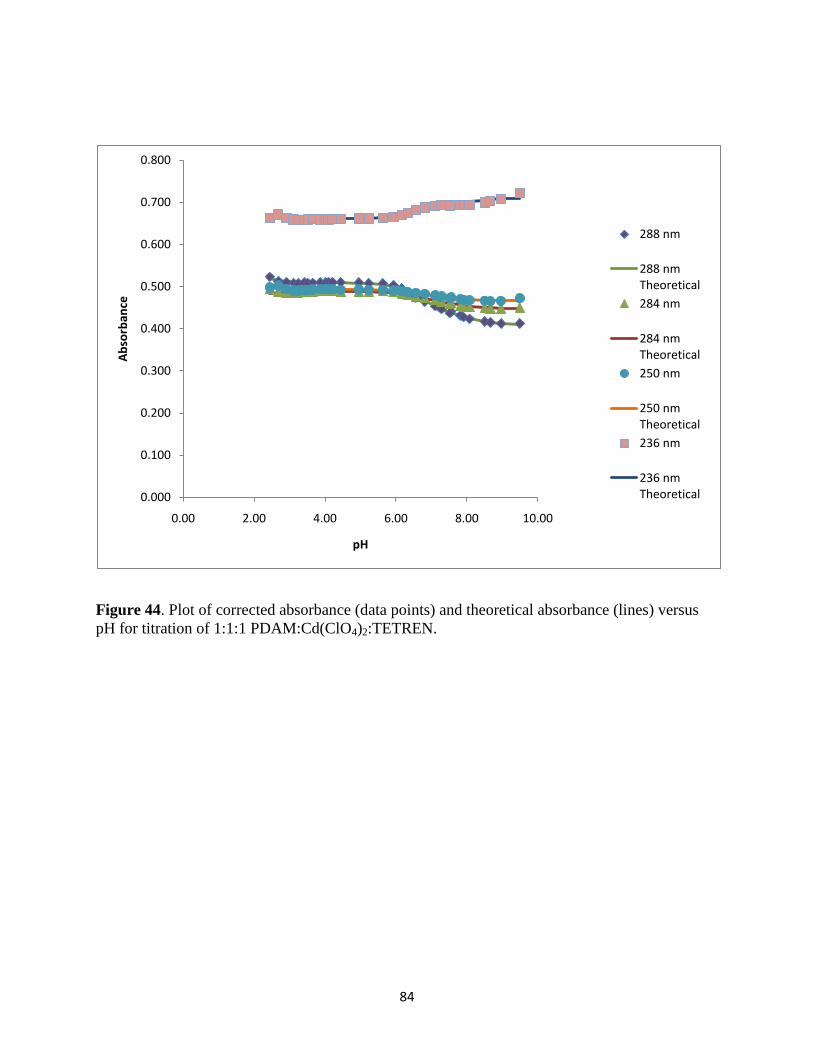
84
Figure 44. Plot of corrected absorbance (data points) and theoretical absorbance (lines) versus
pH for titration of 1:1:1 PDAM:Cd(ClO4)2:TETREN.
0.000
0.100
0.200
0.300
0.400
0.500
0.600
0.700
0.800
0.00 2.00 4.00 6.00 8.00 10.00
Ab
sorb
ance
pH
288 nm
288 nm Theoretical
284 nm
284 nm Theoretical
250 nm
250 nm Theoretical
236 nm
236 nm Theoretical
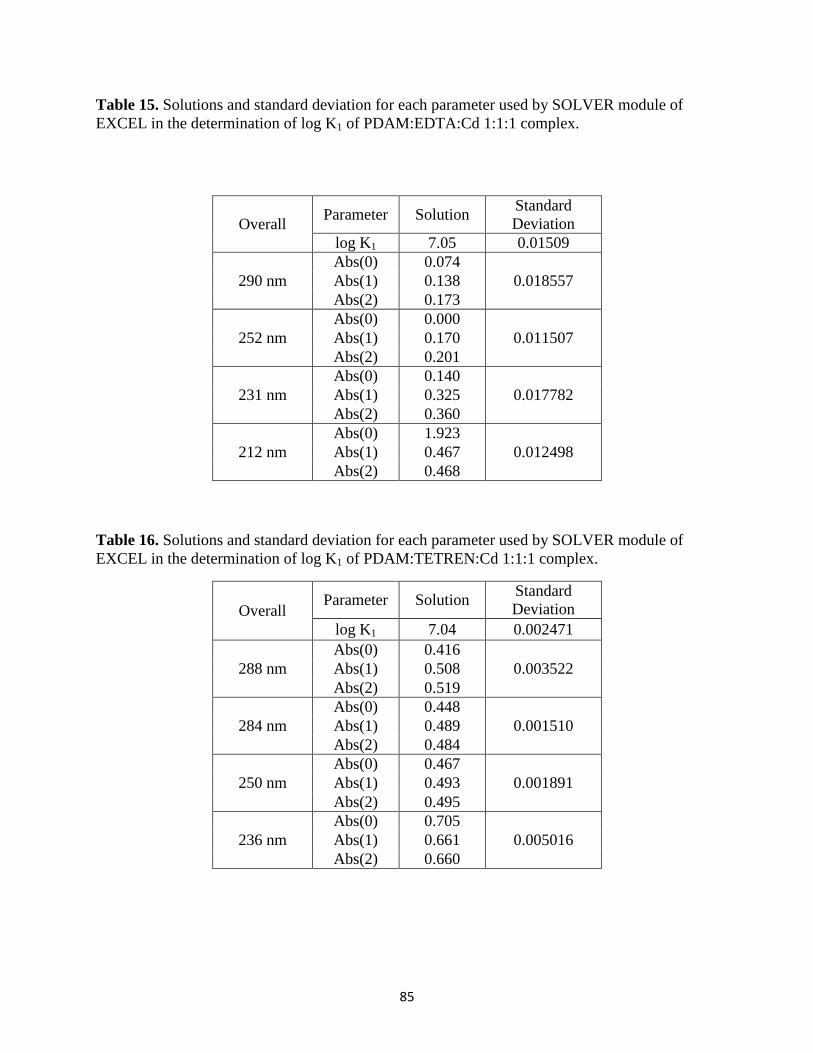
85
Table 15. Solutions and standard deviation for each parameter used by SOLVER module of
EXCEL in the determination of log K1 of PDAM:EDTA:Cd 1:1:1 complex.
Overall Parameter Solution
Standard
Deviation
log K1 7.05 0.01509
290 nm
Abs(0) 0.074
0.018557 Abs(1) 0.138
Abs(2) 0.173
252 nm
Abs(0) 0.000
0.011507 Abs(1) 0.170
Abs(2) 0.201
231 nm
Abs(0) 0.140
0.017782 Abs(1) 0.325
Abs(2) 0.360
212 nm
Abs(0) 1.923
0.012498 Abs(1) 0.467
Abs(2) 0.468
Table 16. Solutions and standard deviation for each parameter used by SOLVER module of
EXCEL in the determination of log K1 of PDAM:TETREN:Cd 1:1:1 complex.
Overall Parameter Solution
Standard
Deviation
log K1 7.04 0.002471
288 nm
Abs(0) 0.416
0.003522 Abs(1) 0.508
Abs(2) 0.519
284 nm
Abs(0) 0.448
0.001510 Abs(1) 0.489
Abs(2) 0.484
250 nm
Abs(0) 0.467
0.001891 Abs(1) 0.493
Abs(2) 0.495
236 nm
Abs(0) 0.705
0.005016 Abs(1) 0.661
Abs(2) 0.660
86
Calcium(II)-PDAM results
Calcium has an ionic radius of 1.00 Å which is the most ideal size for PDAM. Calcium is
classified according to the HSAB principle as a hard acid. Although calcium possesses the
correct ionic radius for the complexation of PDAM, previous studies [11,17-19,22] have shown
calcium to have low affinity for nitrogen donors. A solution of 1.0 M Ca(ClO4)2 was added to
2 x 10⁻⁵
M PDAM with 0.1M NaClO4. The UV/Vis spectra plotting absorbance versus log of the
concentration of Ca(ClO4)2 are show in Figure 45. Absorbances were recorded at 316, 287, 283,
251, 248, 235, 209 nm. The theoretical and measured absorbances were plotted for every
wavelength by minimizing the sum of the squares as shown in Figure 46. SOLVER was used to
minimize the standard deviation so that a more accurate log K1 value can be calculated. Table 17
summarizes the solutions of each parameter that was changed by SOLVER. The log K1 was
calculated to be 1.94 by using Equations 2-7 in the process mentioned above.
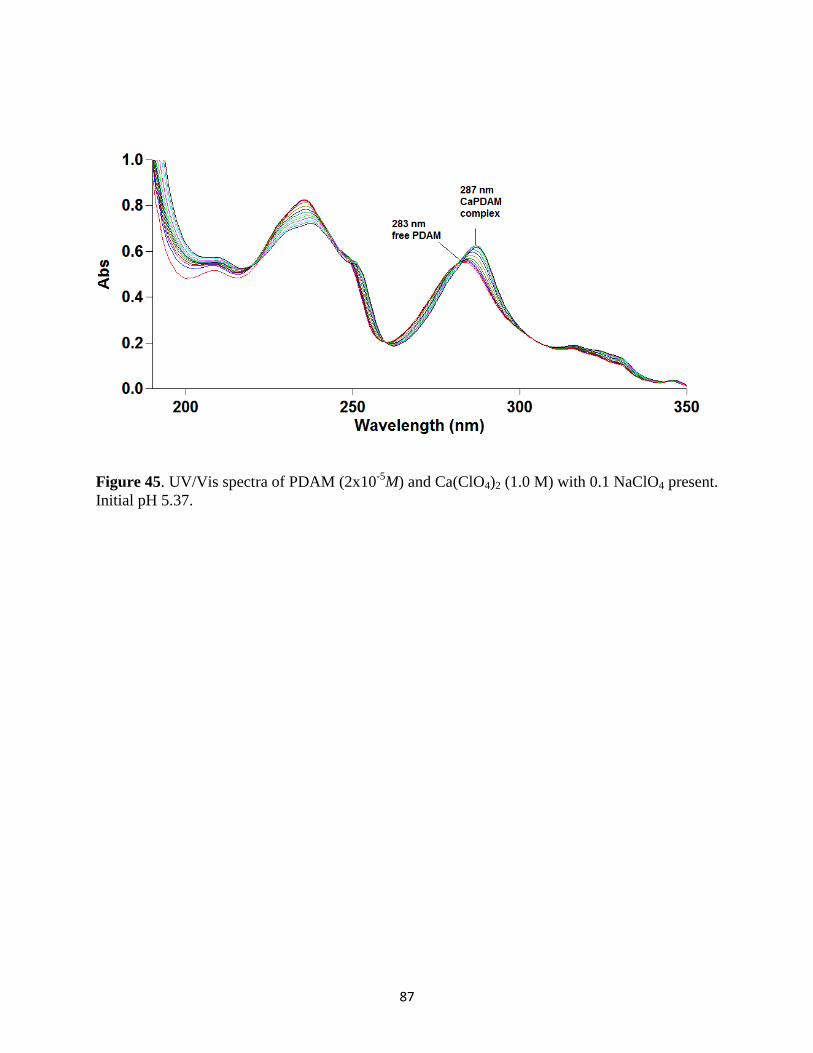
87
Figure 45. UV/Vis spectra of PDAM (2x10⁻⁵
M) and Ca(ClO4)2 (1.0 M) with 0.1 NaClO4 present.
Initial pH 5.37.
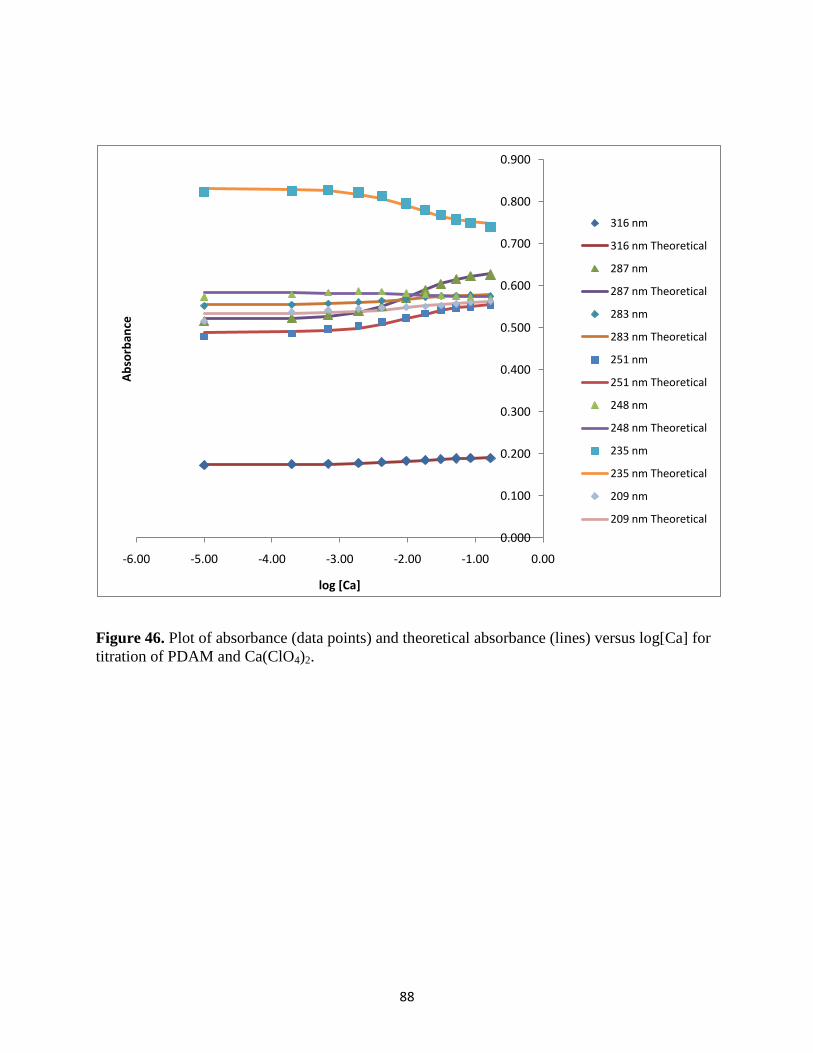
88
Figure 46. Plot of absorbance (data points) and theoretical absorbance (lines) versus log[Ca] for
titration of PDAM and Ca(ClO4)2.
0.000
0.100
0.200
0.300
0.400
0.500
0.600
0.700
0.800
0.900
-6.00 -5.00 -4.00 -3.00 -2.00 -1.00 0.00
Ab
sorb
ance
log [Ca]
316 nm
316 nm Theoretical
287 nm
287 nm Theoretical
283 nm
283 nm Theoretical
251 nm
251 nm Theoretical
248 nm
248 nm Theoretical
235 nm
235 nm Theoretical
209 nm
209 nm Theoretical
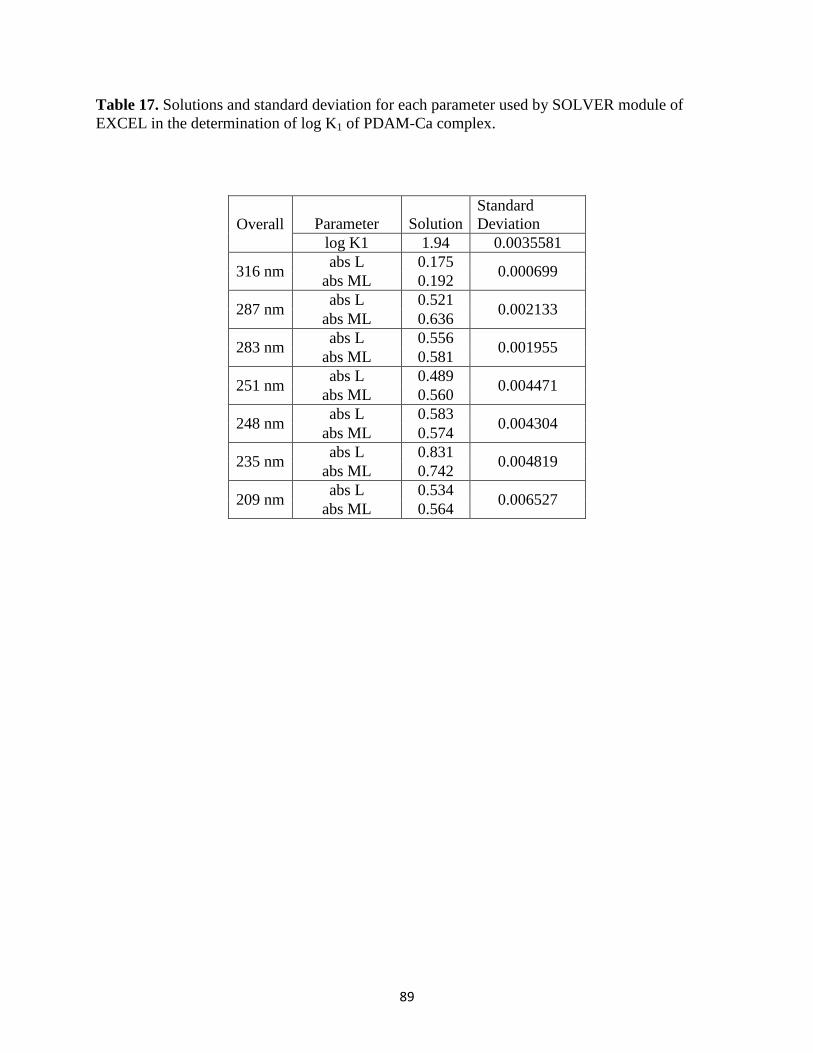
89
Table 17. Solutions and standard deviation for each parameter used by SOLVER module of
EXCEL in the determination of log K1 of PDAM-Ca complex.
Overall Parameter Solution
Standard
Deviation
log K1 1.94 0.0035581
316 nm abs L 0.175
0.000699 abs ML 0.192
287 nm abs L 0.521
0.002133 abs ML 0.636
283 nm abs L 0.556
0.001955 abs ML 0.581
251 nm abs L 0.489
0.004471 abs ML 0.560
248 nm abs L 0.583
0.004304 abs ML 0.574
235 nm abs L 0.831
0.004819 abs ML 0.742
209 nm abs L 0.534
0.006527 abs ML 0.564
90
Bismuth (III) Results
Bismuth has an ionic radius of 1.03Å and is classified as an intermediate acid according
to the HSAB principle. This is an ideal metal ion because it has a high affinity with nitrogen
donors. Bismuth also contains a large peak sharpening at 250 nm which is characteristic of
PDAM forming a complex with large metal ions. Because the metal ion binds so well with
PDAM, that like indium, metal addition would not be able to accurately determine the log K1
value of bismuth with PDAM. Therefore, a competition reaction with TETREN was used to
determine a more accurate value of log K1. This experiment was conducted by using 50.0 mL
solution of 1:1:1 PDAM: Bi(NO3)3:TETREN at 2.00x10⁻⁵
M and was acidified to an initial pH of
2.10. This was titrated with 0.10 M NaOH solution to a final pH of 7.11. The UV/Vis spectra
plotting absorbance versus wavelength is shown in Figure 47. Absorbances were recorded at
298, 284, and 255 nm because these wavelengths exhibited the largest change in absorbances.
The theoretical and measured absorbances were plotted for every wavelength by minimizing the
sum of the squares as shown in Figure 48. A log K1 of 9.44 was calculated from the absorbance
data using the process as described above. Table 18 summarizes the solutions of each parameter
that was changed by SOLVER. The program was also used to minimized all standard deviations
and determine the best possible log K1 value.
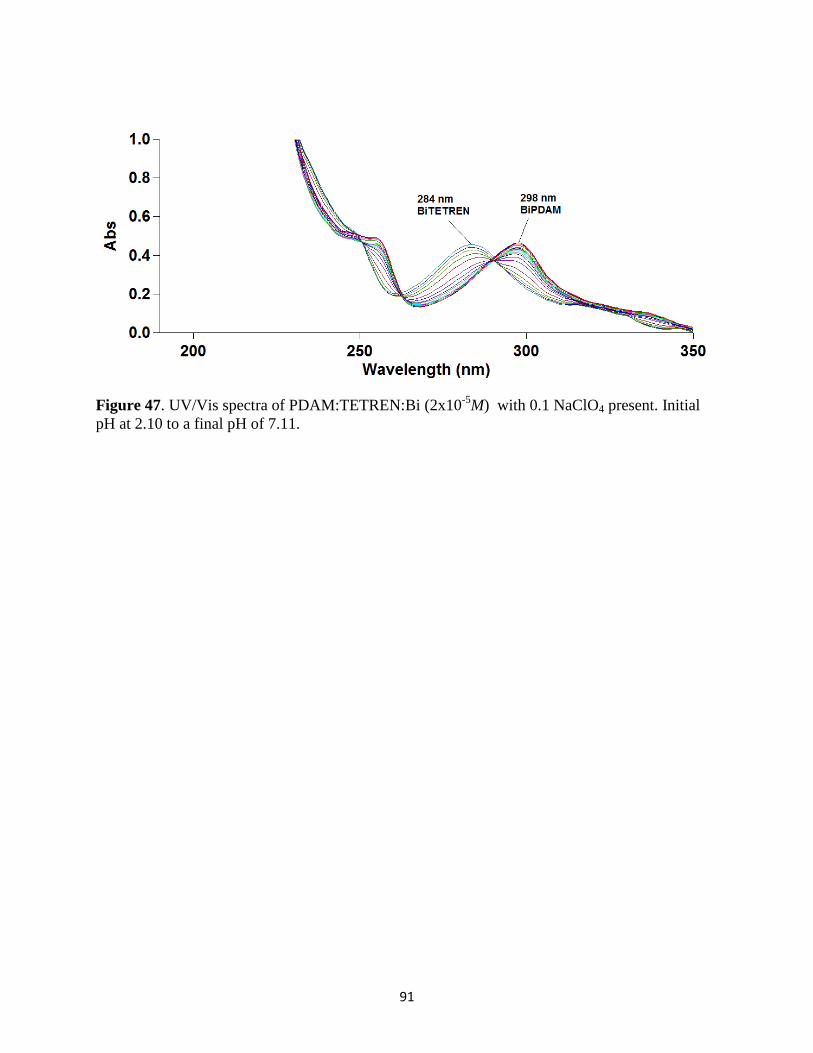
91
Figure 47. UV/Vis spectra of PDAM:TETREN:Bi (2x10⁻⁵
M) with 0.1 NaClO4 present. Initial
pH at 2.10 to a final pH of 7.11.
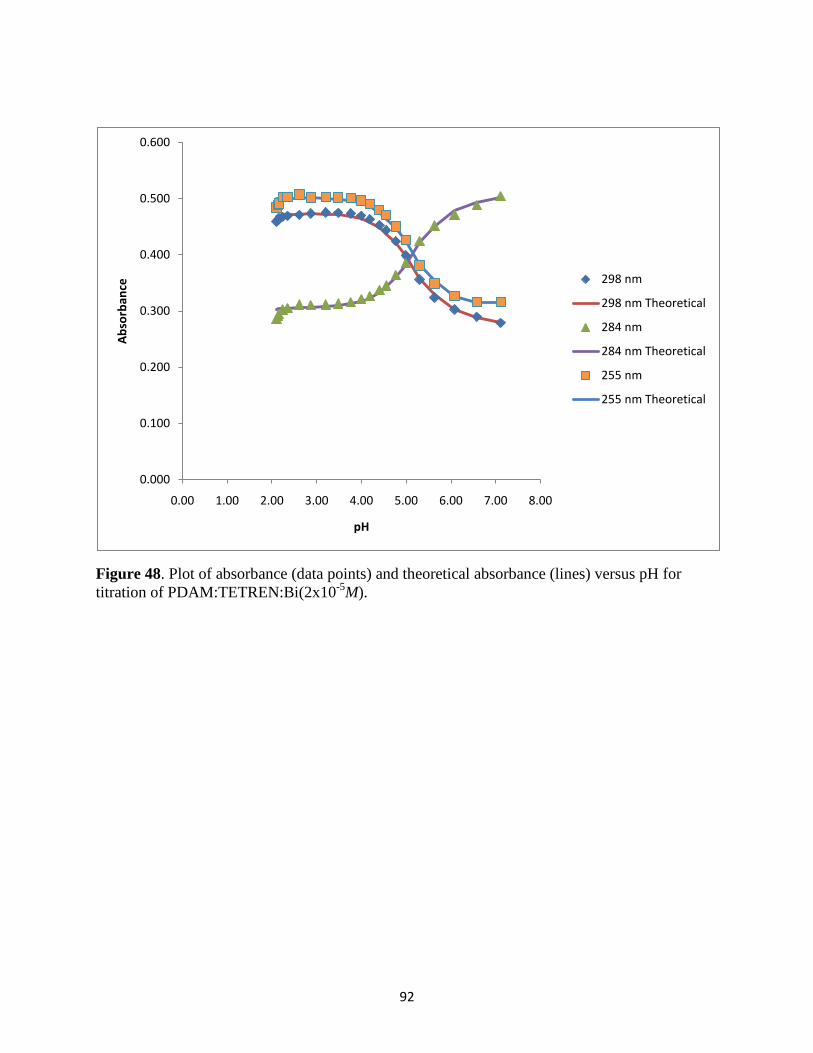
92
Figure 48. Plot of absorbance (data points) and theoretical absorbance (lines) versus pH for
titration of PDAM:TETREN:Bi(2x10⁻⁵
M).
0.000
0.100
0.200
0.300
0.400
0.500
0.600
0.00 1.00 2.00 3.00 4.00 5.00 6.00 7.00 8.00
Ab
sorb
ance
pH
298 nm
298 nm Theoretical
284 nm
284 nm Theoretical
255 nm
255 nm Theoretical
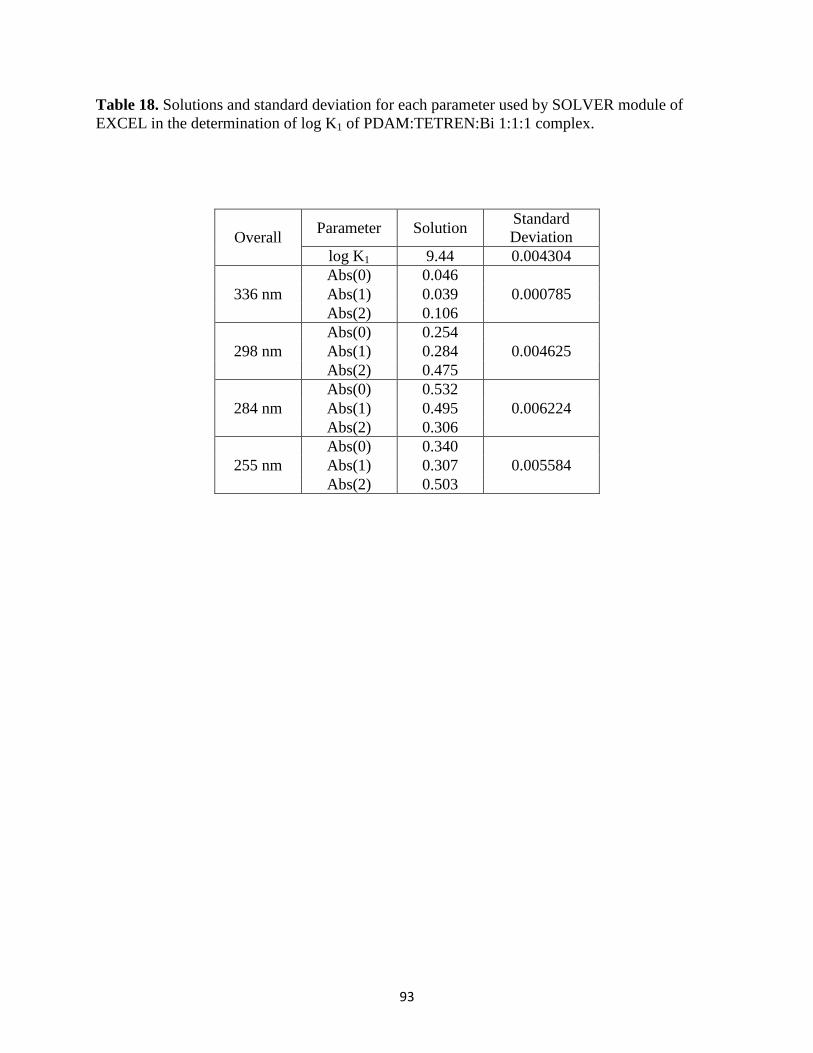
93
Table 18. Solutions and standard deviation for each parameter used by SOLVER module of
EXCEL in the determination of log K1 of PDAM:TETREN:Bi 1:1:1 complex.
Overall Parameter Solution
Standard
Deviation
log K1 9.44 0.004304
336 nm
Abs(0) 0.046
0.000785 Abs(1) 0.039
Abs(2) 0.106
298 nm
Abs(0) 0.254
0.004625 Abs(1) 0.284
Abs(2) 0.475
284 nm
Abs(0) 0.532
0.006224 Abs(1) 0.495
Abs(2) 0.306
255 nm
Abs(0) 0.340
0.005584 Abs(1) 0.307
Abs(2) 0.503
94
Lead (II) results
Lead has an ionic radius of 1.19Å and is the largest metal ion studied with PDAM. Lead
is an intermediate acid according to the HSAB principle. Intermediate acids are expected to bind
preferably well with nitrogen donor groups. The first metal addition study showed that a very
dilute addition of Pb(ClO4)2 to PDAM complexed almost immediately to form [Pb(PDAM)]2+
complex. Therefore, another experiment was needed in order to accurately calculate the log K1 of
lead with PDAM. A competition reaction with TETREN was performed with PDAM and lead at
a ratio of 1:1:1. A solution of PDAM, TETREN, and Pb(ClO4)2 was titrated with 0.1 M NaOH
from an initial pH=2.27 to a final pH=8.11. The UV/Vis spectra plotting absorbance versus
wavelength is shown in Figure 49. Absorbances were recorded at 292, 284, 249, and 237 nm
because these wavelengths displayed the largest change in absorbances. The theoretical and
measured absorbances were plotted for these wavelengths mentioned above simultaneously by
minimized the standard deviation using SOLVER to determine a more accurate log K1 value as
shown in Figure 50. Table 19 summarizes the solutions of each parameter that was changed by
SOLVER. The log K1 was calculated to be 5.82 by using Equations 2-7 in the process
mentioned above. Although PDAM is selective for large metal ions around 1.00 Å, lead(II) as
shown in this experiment was too large to form a stable complex. This could be due to steric
hindrance with the amides which causes the conditions for complexation to become unfavorable.
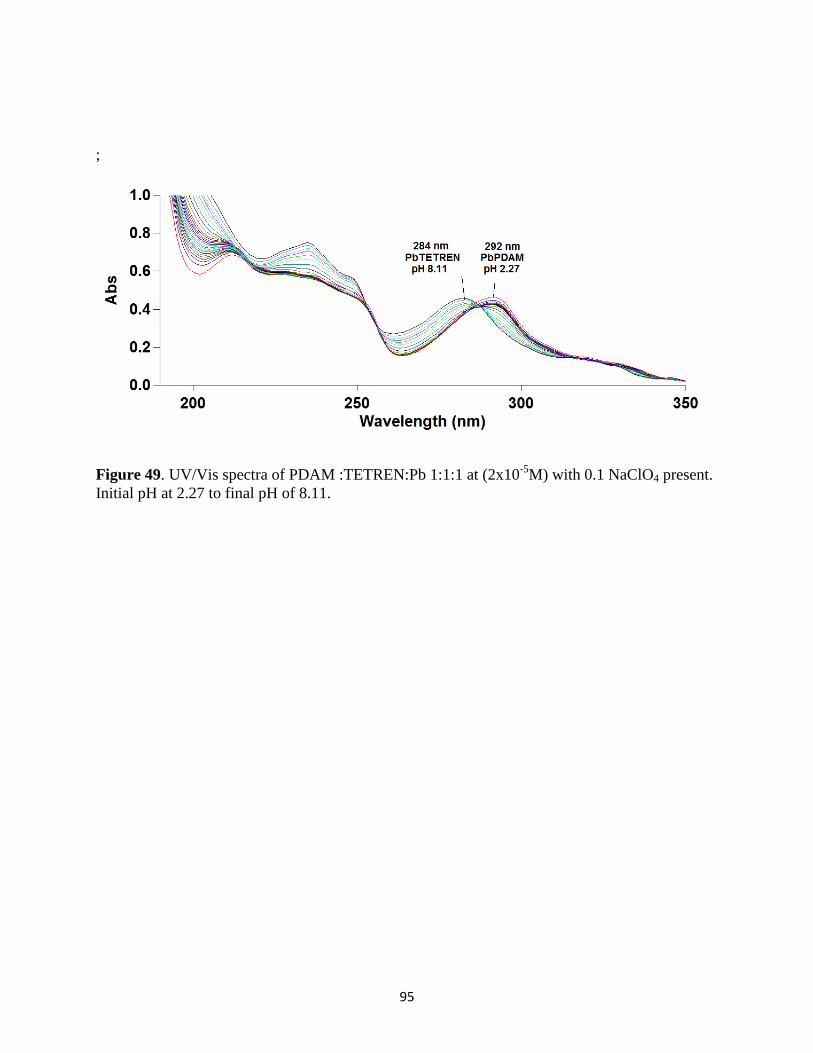
95
;
Figure 49. UV/Vis spectra of PDAM :TETREN:Pb 1:1:1 at (2x10⁻⁵
M) with 0.1 NaClO4 present.
Initial pH at 2.27 to final pH of 8.11.
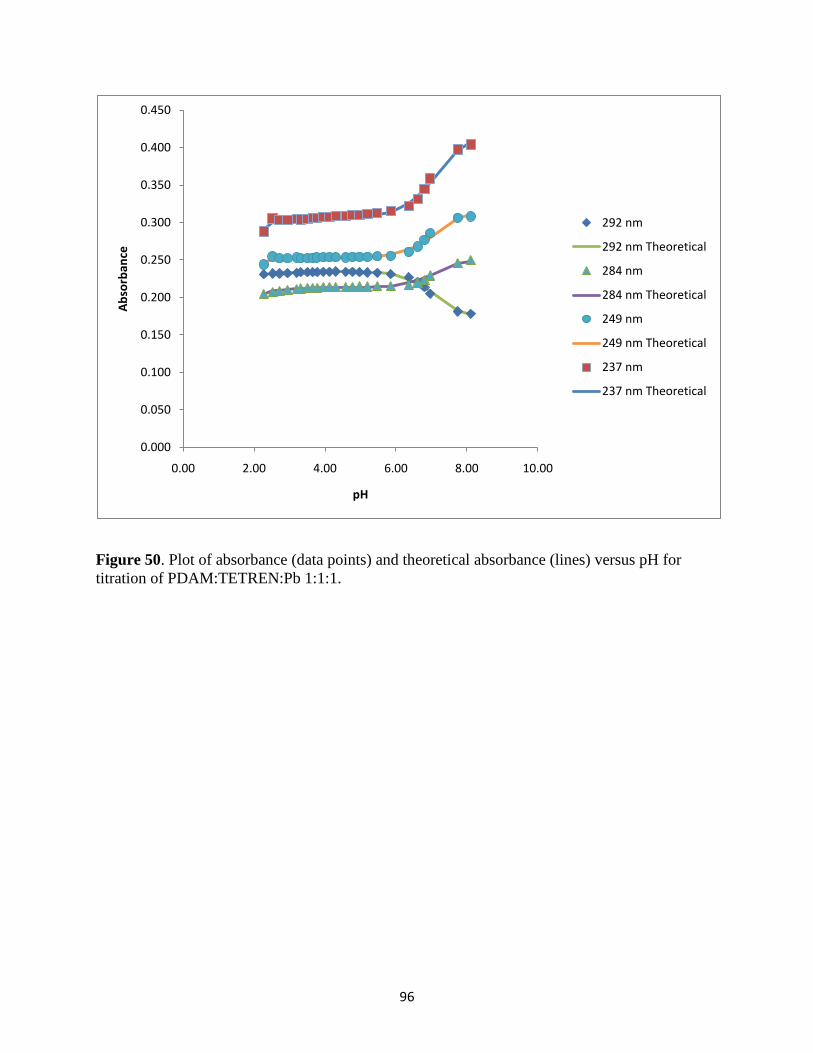
96
Figure 50. Plot of absorbance (data points) and theoretical absorbance (lines) versus pH for
titration of PDAM:TETREN:Pb 1:1:1.
0.000
0.050
0.100
0.150
0.200
0.250
0.300
0.350
0.400
0.450
0.00 2.00 4.00 6.00 8.00 10.00
Ab
sorb
ance
pH
292 nm
292 nm Theoretical
284 nm
284 nm Theoretical
249 nm
249 nm Theoretical
237 nm
237 nm Theoretical
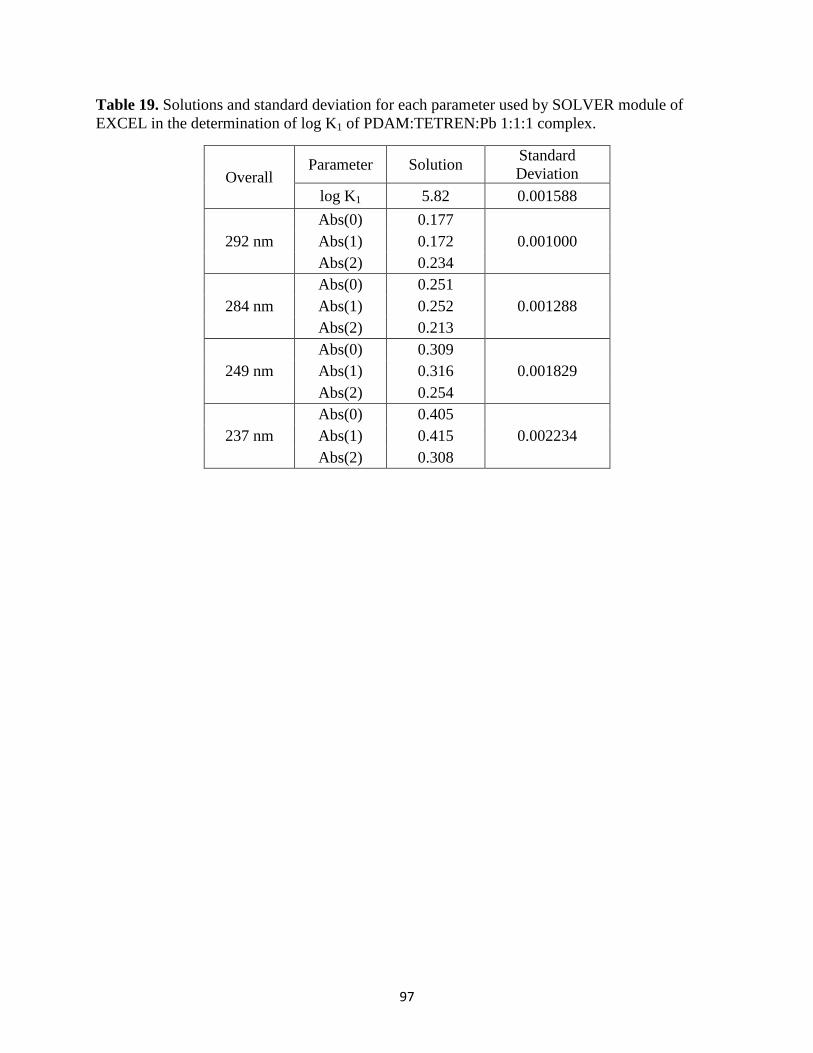
97
Table 19. Solutions and standard deviation for each parameter used by SOLVER module of
EXCEL in the determination of log K1 of PDAM:TETREN:Pb 1:1:1 complex.
Overall Parameter Solution
Standard
Deviation
log K1 5.82 0.001588
292 nm
Abs(0) 0.177
0.001000 Abs(1) 0.172
Abs(2) 0.234
284 nm
Abs(0) 0.251
0.001288 Abs(1) 0.252
Abs(2) 0.213
249 nm
Abs(0) 0.309
0.001829 Abs(1) 0.316
Abs(2) 0.254
237 nm
Abs(0) 0.405
0.002234 Abs(1) 0.415
Abs(2) 0.308
98
Lanthanide Results
In Figures 54-67 are the spectra of the lanthanide series except for promethium because it
is radioactive and cannot be experimented at this facility. The preparation of the lanthanides
consisted of 2 x 10⁻⁵
M PDAM solution in 0.1 M NaClO4 with the addition of 3x10⁻³
M of Ln3+
concentration held at their initial pH which ranged from 2-5 to prevent hydrolysis. These spectra
have clear isosbestic points which indicate the formation of the [Ln(PDAM)]3+
complex at a
single equilibrium. In Figures 68-81 show the variation of absorbance as a function of the
logarithm of the Ln(III) concentration at several wavelengths because these wavelengths
displayed the largest change in absorbances. The midpoints in the inflections of these curves give
the value of the log K1 of PDAM. The calculated theoretical and measured absorbances were
fitted for these wavelengths mentioned above simultaneously. This fit was performed to
minimize the standard deviation using SOLVER to determine a more accurate log K1 value.
Tables 21-34 summarize the solutions of each parameter in the lanthanide series that was
changed by SOLVER. The UV spectrum of PDAM and its response to the formation of
complexes with metal ions is quite similar to that of PDA[11,17,27]. The lanthanide series of
PDAM was analyzed and compared to PDA’s log K1 values. By comparing log K1 values of the
lanthanide metals a similarity arose in that when a formation of a complex occurred with a large
metal ion of an ionic radius close to 1.0 Å a sharp peak appears. This occurred with PDAM at
253 nm, and for PDA it occurred at 247 nm. These sharp peaks that appears upon the formation
of the complex has been suggested [17,27] to be due to the vibrations coupled to the π-π*
transitions of the ligand.
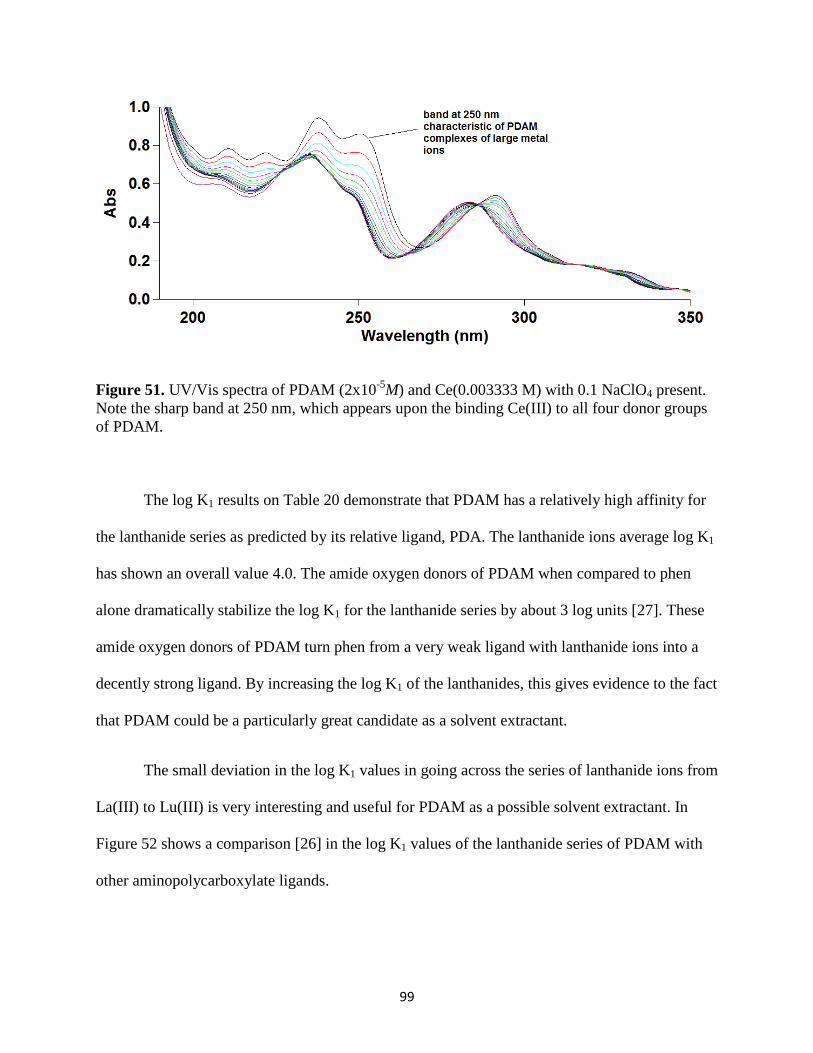
99
Figure 51. UV/Vis spectra of PDAM (2x10⁻⁵
M) and Ce(0.003333 M) with 0.1 NaClO4 present.
Note the sharp band at 250 nm, which appears upon the binding Ce(III) to all four donor groups
of PDAM.
The log K1 results on Table 20 demonstrate that PDAM has a relatively high affinity for
the lanthanide series as predicted by its relative ligand, PDA. The lanthanide ions average log K1
has shown an overall value 4.0. The amide oxygen donors of PDAM when compared to phen
alone dramatically stabilize the log K1 for the lanthanide series by about 3 log units [27]. These
amide oxygen donors of PDAM turn phen from a very weak ligand with lanthanide ions into a
decently strong ligand. By increasing the log K1 of the lanthanides, this gives evidence to the fact
that PDAM could be a particularly great candidate as a solvent extractant.
The small deviation in the log K1 values in going across the series of lanthanide ions from
La(III) to Lu(III) is very interesting and useful for PDAM as a possible solvent extractant. In
Figure 52 shows a comparison [26] in the log K1 values of the lanthanide series of PDAM with
other aminopolycarboxylate ligands.
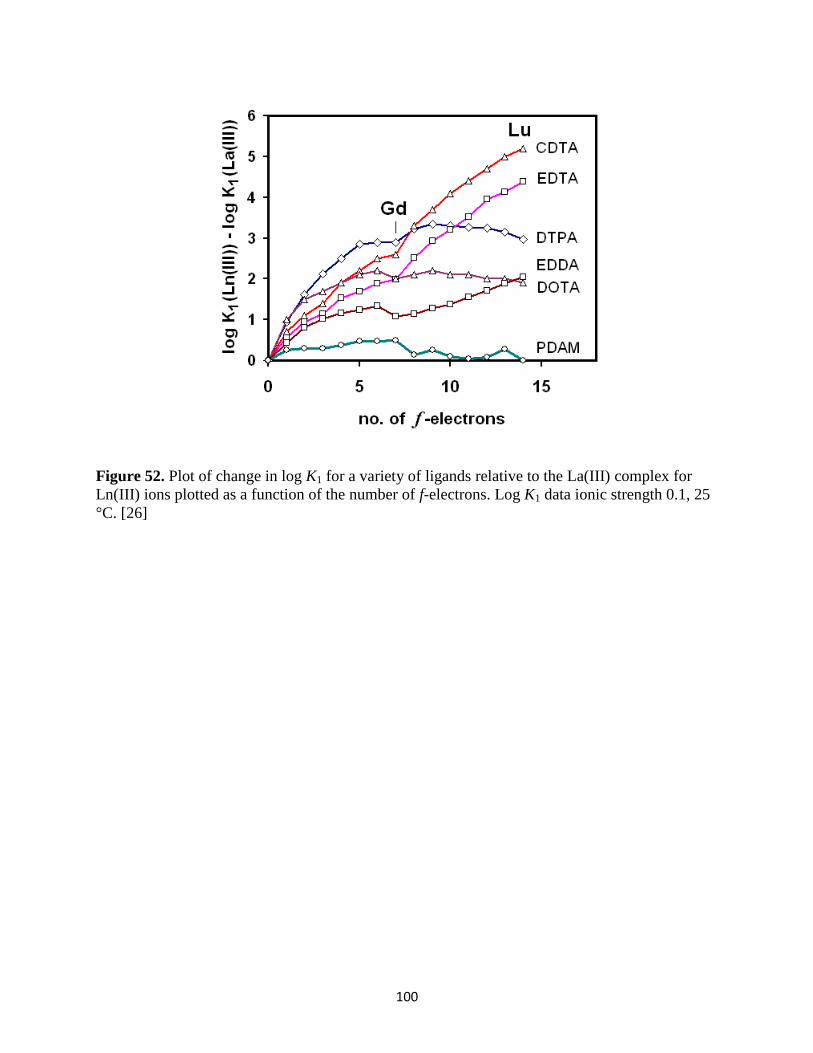
100
Figure 52. Plot of change in log K1 for a variety of ligands relative to the La(III) complex for
Ln(III) ions plotted as a function of the number of f-electrons. Log K1 data ionic strength 0.1, 25
°C. [26]
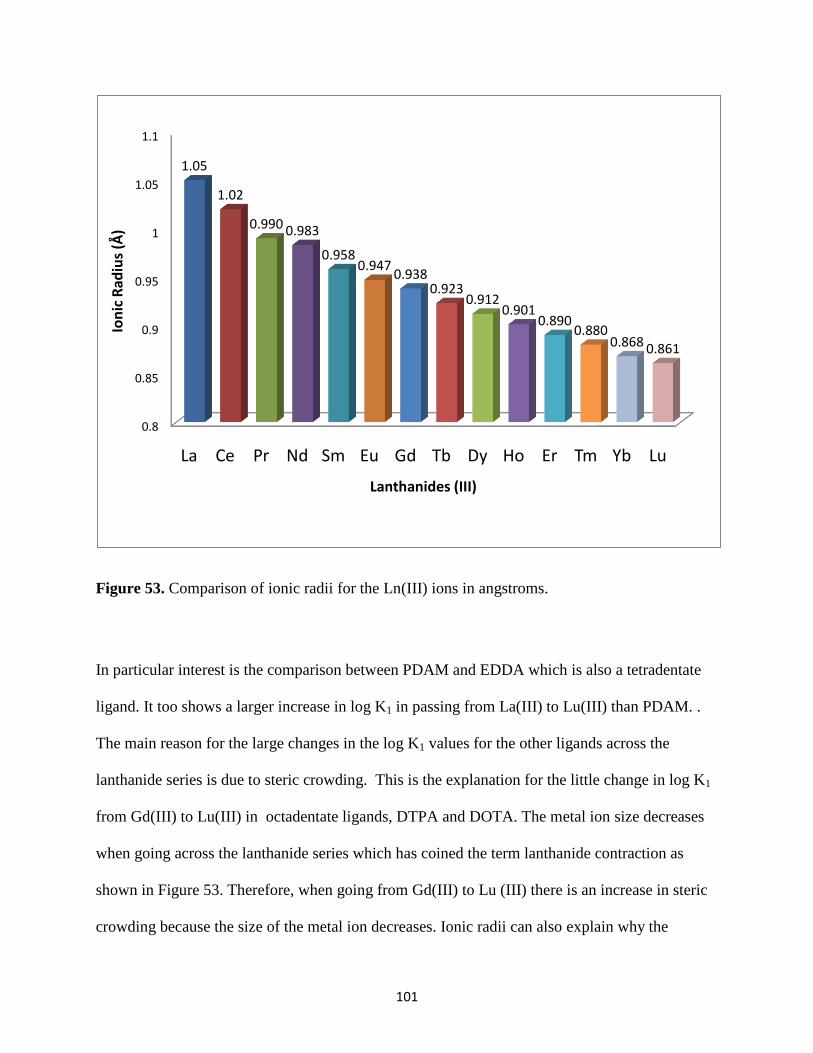
101
Figure 53. Comparison of ionic radii for the Ln(III) ions in angstroms.
In particular interest is the comparison between PDAM and EDDA which is also a tetradentate
ligand. It too shows a larger increase in log K1 in passing from La(III) to Lu(III) than PDAM. .
The main reason for the large changes in the log K1 values for the other ligands across the
lanthanide series is due to steric crowding. This is the explanation for the little change in log K1
from Gd(III) to Lu(III) in octadentate ligands, DTPA and DOTA. The metal ion size decreases
when going across the lanthanide series which has coined the term lanthanide contraction as
shown in Figure 53. Therefore, when going from Gd(III) to Lu (III) there is an increase in steric
crowding because the size of the metal ion decreases. Ionic radii can also explain why the
0.8
0.85
0.9
0.95
1
1.05
1.1
La Ce Pr Nd Sm Eu Gd Tb Dy Ho Er Tm Yb Lu
1.05
1.02
0.990 0.983
0.9580.947
0.9380.923
0.9120.901
0.8900.880
0.868 0.861
Ion
ic R
adiu
s (Å
)
Lanthanides (III)
102
hexadentate CDTA and EDTA have a sharp rise in log K1 from Gd(III) to Lu(III) because there
is less steric crowding during the complexation.
For PDAM, the factor governing complex stability is the affinity of the neutral oxygen
donor[13] has for larger metal ions. In this case, the larger metal ions in the lanthanide series
profit the most from the presence of the neutral oxygen donors, which in turn offsets the ability
of the smaller lanthanide ions to form stronger bonds with the nitrogen donors in PDAM.
Nitrogen donors are also an important aspect in determining the affinity of metal ions have on a
ligand. To determine which ions have the most affinity to nitrogen donors the log K1 (NH3)
values were predicted [16] from DFT calculations on Table 2. These calculations show that
there is a great affinity with the actinide cations Am3+
, Pu4+
, and the UO22+
cation for NH3 which
is related to the affinity of the nitrogen donor atom. Predicting which metal ions have strong
affinities for nitrogen donors can prove to be a useful tool in designing ligands for metal ion
separations.
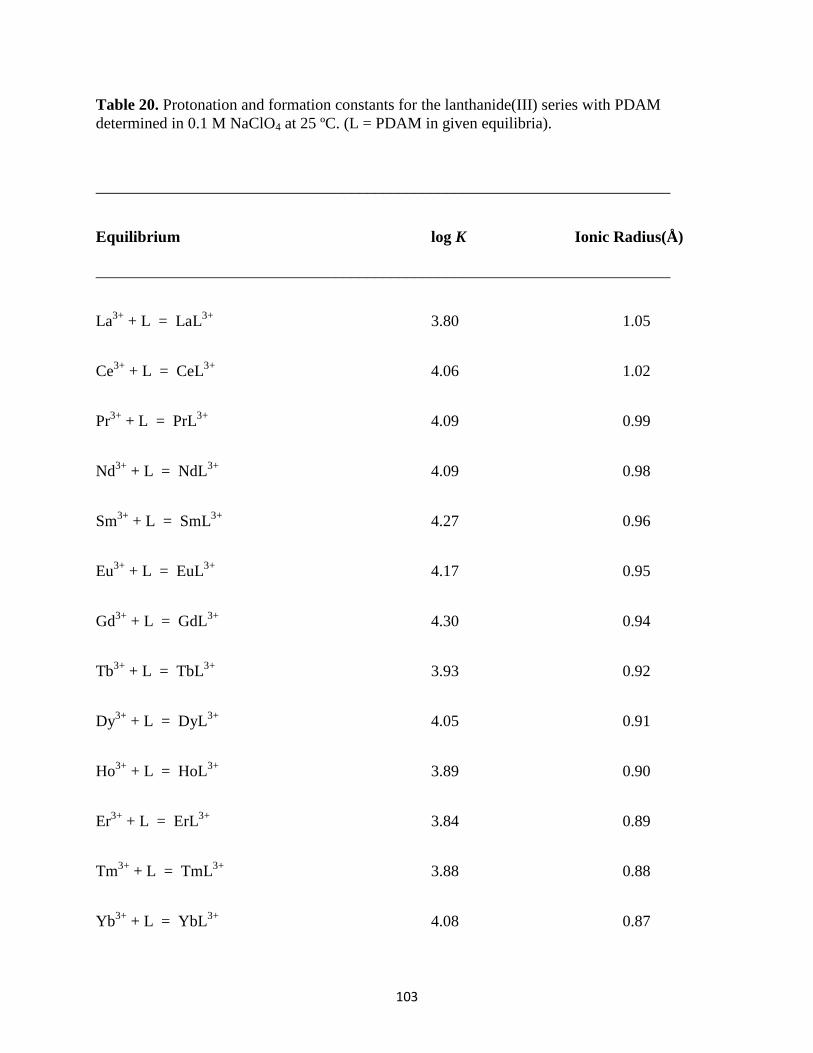
103
Table 20. Protonation and formation constants for the lanthanide(III) series with PDAM
determined in 0.1 M NaClO4 at 25 ºC. (L = PDAM in given equilibria).
________________________________________________________________________
Equilibrium log K Ionic Radius(Å)
________________________________________________________________________
La3+
+ L = LaL3+
3.80 1.05
Ce3+
+ L = CeL3+
4.06 1.02
Pr3+
+ L = PrL3+
4.09 0.99
Nd3+
+ L = NdL3+
4.09 0.98
Sm3+
+ L = SmL3+
4.27 0.96
Eu3+
+ L = EuL3+
4.17 0.95
Gd3+
+ L = GdL3+
4.30 0.94
Tb3+
+ L = TbL3+
3.93 0.92
Dy3+
+ L = DyL3+
4.05 0.91
Ho3+
+ L = HoL3+
3.89 0.90
Er3+
+ L = ErL3+
3.84 0.89
Tm3+
+ L = TmL3+
3.88 0.88
Yb3+
+ L = YbL3+
4.08 0.87
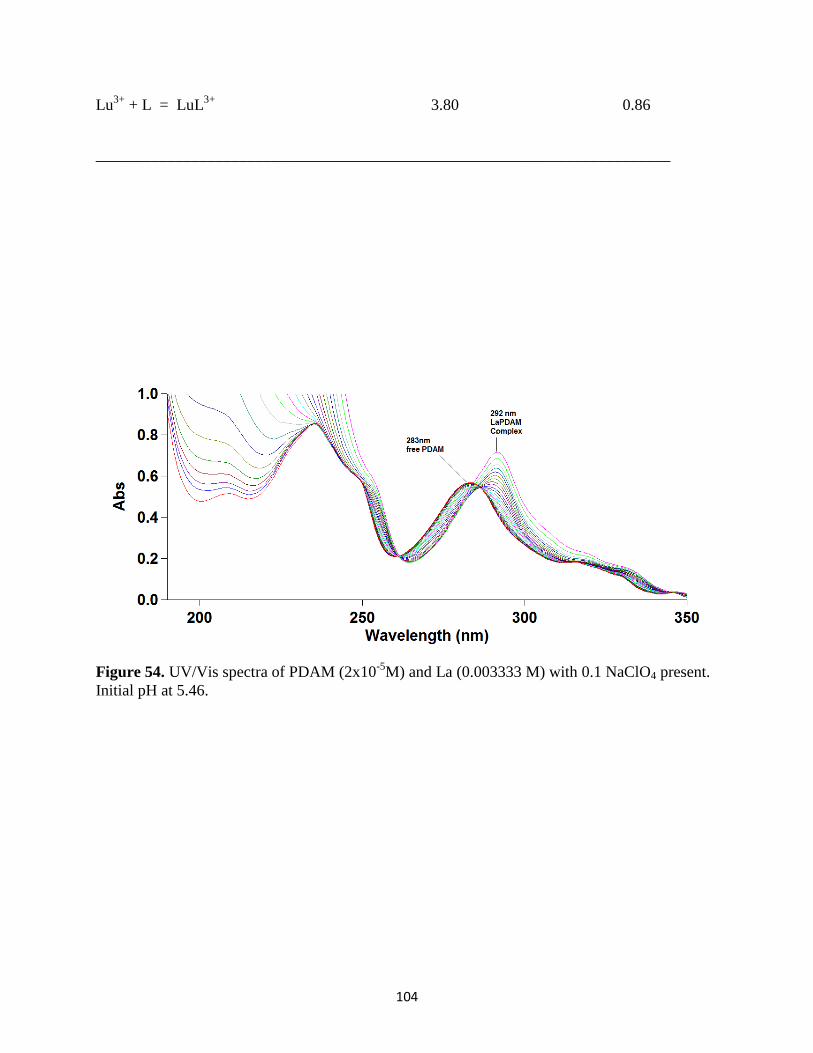
104
Lu3+
+ L = LuL3+
3.80 0.86
________________________________________________________________________
Figure 54. UV/Vis spectra of PDAM (2x10⁻⁵
M) and La (0.003333 M) with 0.1 NaClO4 present.
Initial pH at 5.46.
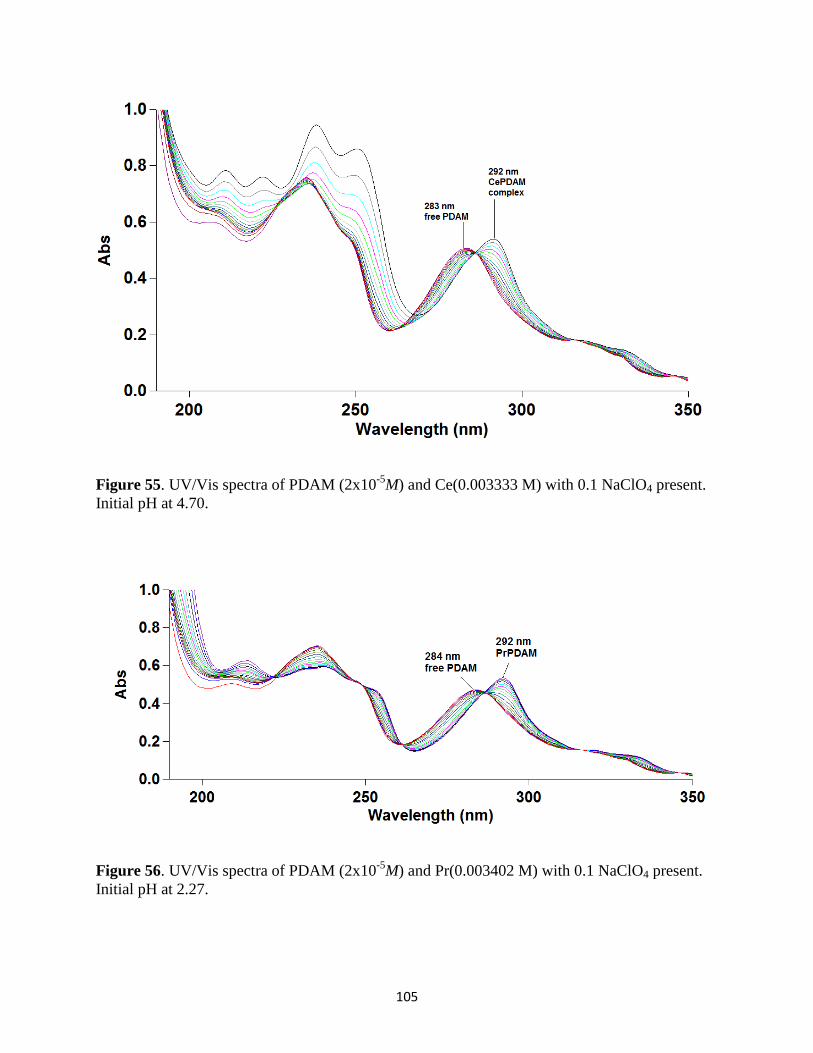
105
Figure 55. UV/Vis spectra of PDAM (2x10⁻⁵
M) and Ce(0.003333 M) with 0.1 NaClO4 present.
Initial pH at 4.70.
Figure 56. UV/Vis spectra of PDAM (2x10⁻⁵
M) and Pr(0.003402 M) with 0.1 NaClO4 present.
Initial pH at 2.27.
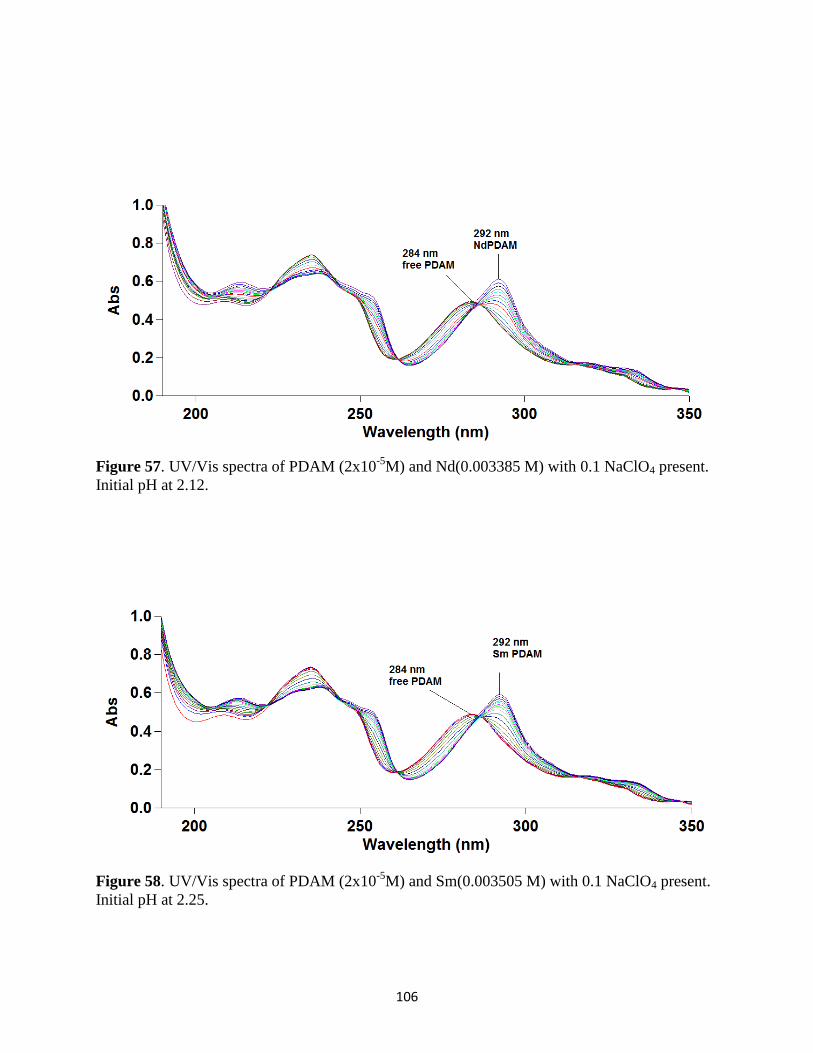
106
Figure 57. UV/Vis spectra of PDAM (2x10⁻⁵
M) and Nd(0.003385 M) with 0.1 NaClO4 present.
Initial pH at 2.12.
Figure 58. UV/Vis spectra of PDAM (2x10⁻⁵
M) and Sm(0.003505 M) with 0.1 NaClO4 present.
Initial pH at 2.25.
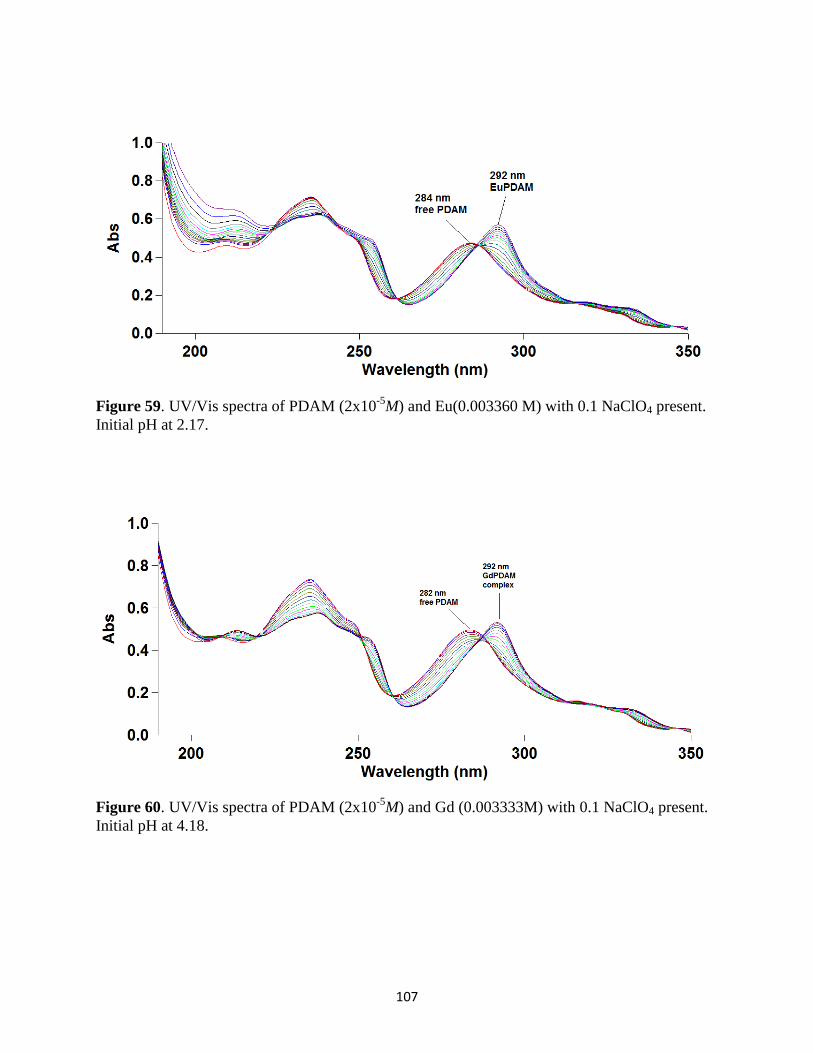
107
Figure 59. UV/Vis spectra of PDAM (2x10⁻⁵
M) and Eu(0.003360 M) with 0.1 NaClO4 present.
Initial pH at 2.17.
Figure 60. UV/Vis spectra of PDAM (2x10⁻⁵
M) and Gd (0.003333M) with 0.1 NaClO4 present.
Initial pH at 4.18.
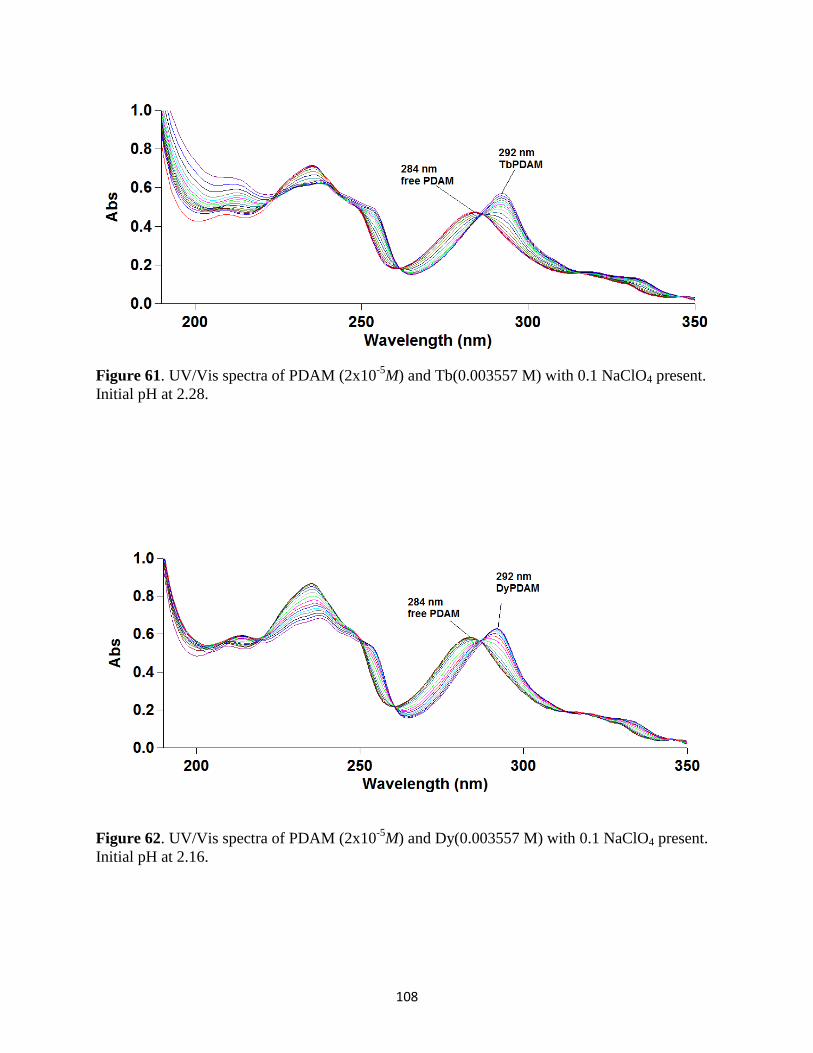
108
Figure 61. UV/Vis spectra of PDAM (2x10⁻⁵
M) and Tb(0.003557 M) with 0.1 NaClO4 present.
Initial pH at 2.28.
Figure 62. UV/Vis spectra of PDAM (2x10⁻⁵
M) and Dy(0.003557 M) with 0.1 NaClO4 present.
Initial pH at 2.16.
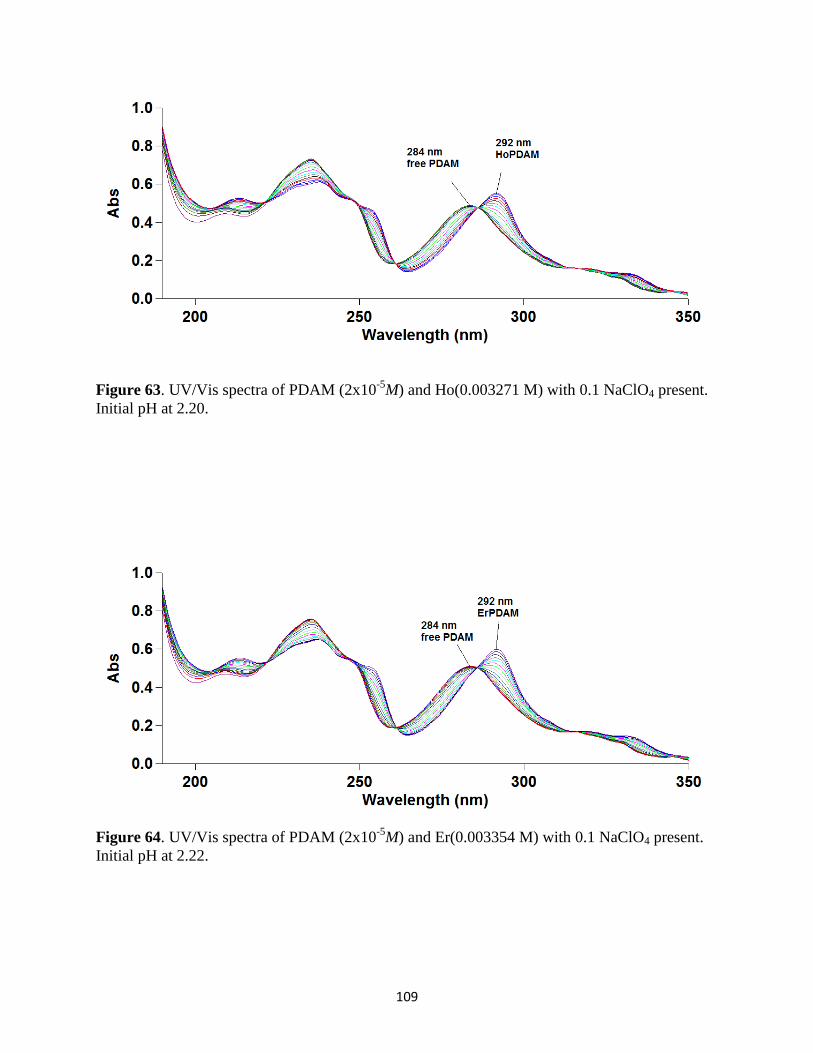
109
Figure 63. UV/Vis spectra of PDAM (2x10⁻⁵
M) and Ho(0.003271 M) with 0.1 NaClO4 present.
Initial pH at 2.20.
Figure 64. UV/Vis spectra of PDAM (2x10⁻⁵
M) and Er(0.003354 M) with 0.1 NaClO4 present.
Initial pH at 2.22.
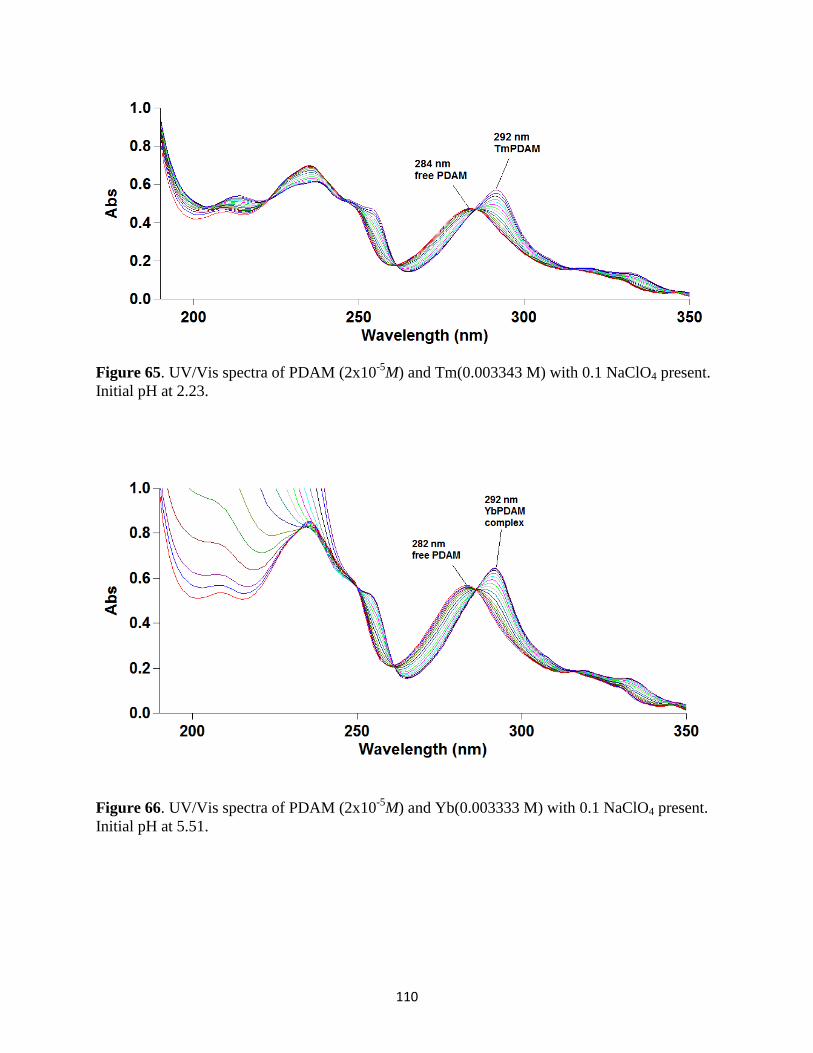
110
Figure 65. UV/Vis spectra of PDAM (2x10⁻⁵
M) and Tm(0.003343 M) with 0.1 NaClO4 present.
Initial pH at 2.23.
Figure 66. UV/Vis spectra of PDAM (2x10⁻⁵
M) and Yb(0.003333 M) with 0.1 NaClO4 present.
Initial pH at 5.51.
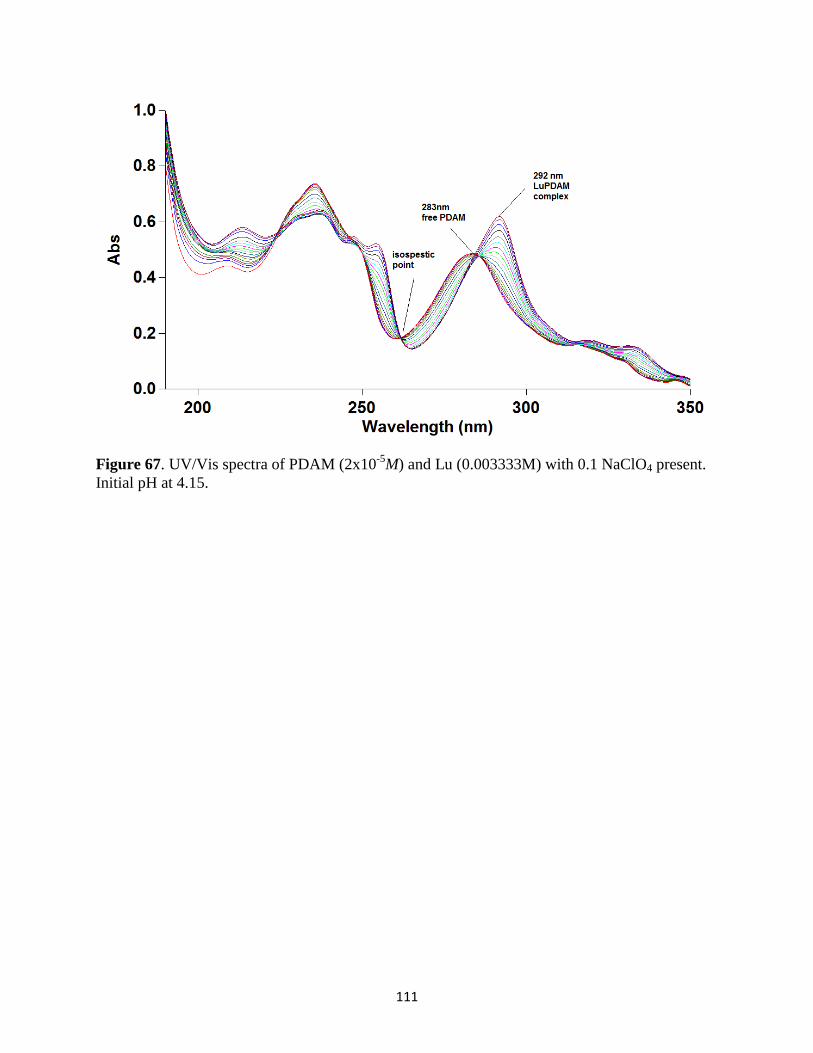
111
Figure 67. UV/Vis spectra of PDAM (2x10⁻⁵
M) and Lu (0.003333M) with 0.1 NaClO4 present.
Initial pH at 4.15.
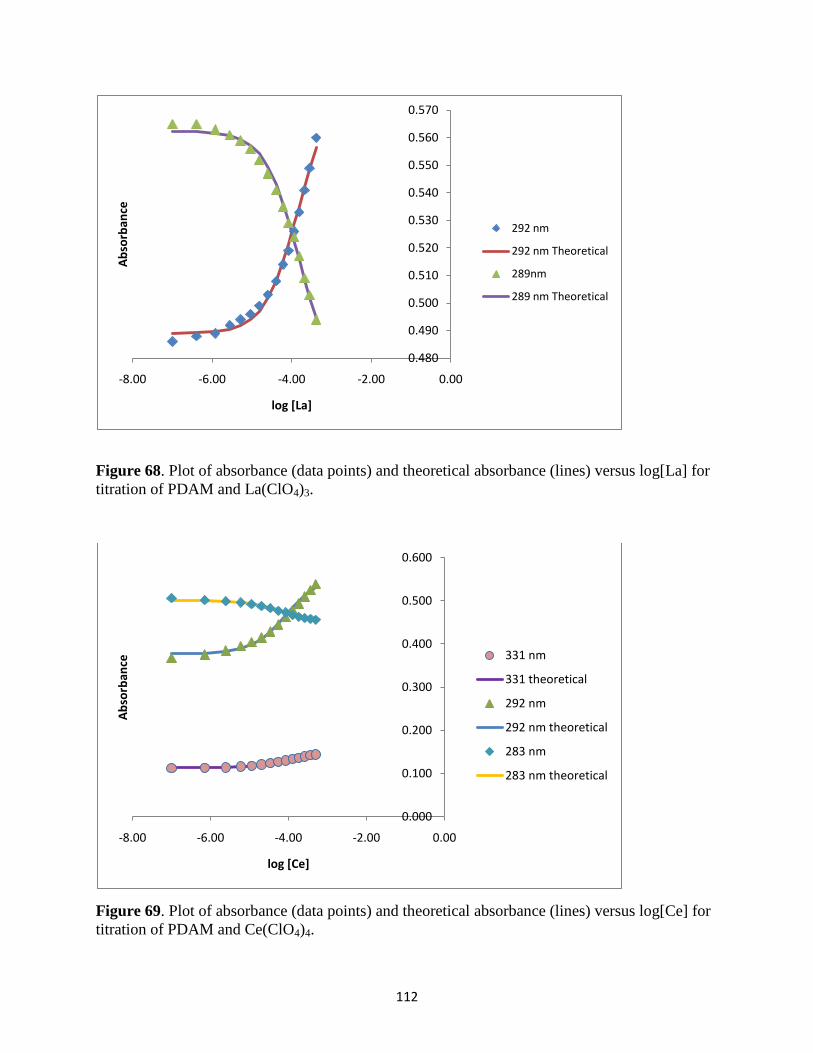
112
Figure 68. Plot of absorbance (data points) and theoretical absorbance (lines) versus log[La] for
titration of PDAM and La(ClO4)3.
Figure 69. Plot of absorbance (data points) and theoretical absorbance (lines) versus log[Ce] for
titration of PDAM and Ce(ClO4)4.
0.480
0.490
0.500
0.510
0.520
0.530
0.540
0.550
0.560
0.570
-8.00 -6.00 -4.00 -2.00 0.00
Ab
sorb
ance
log [La]
292 nm
292 nm Theoretical
289nm
289 nm Theoretical
0.000
0.100
0.200
0.300
0.400
0.500
0.600
-8.00 -6.00 -4.00 -2.00 0.00
Ab
sorb
ance
log [Ce]
331 nm
331 theoretical
292 nm
292 nm theoretical
283 nm
283 nm theoretical
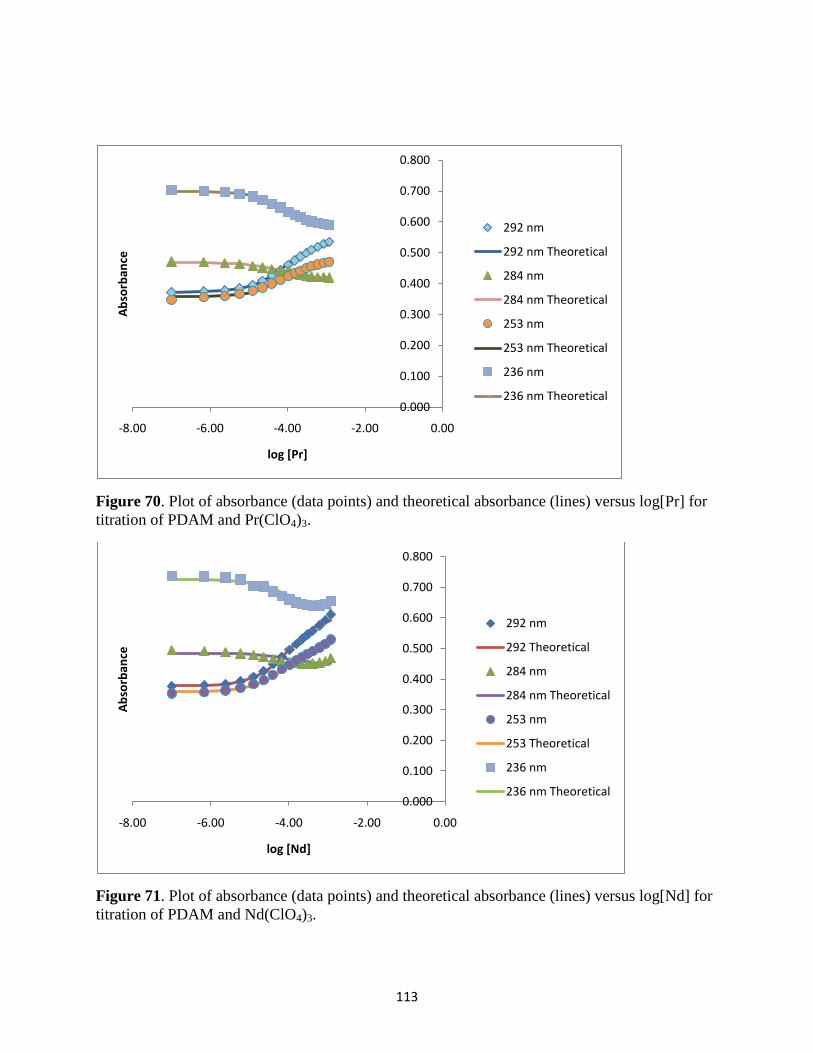
113
Figure 70. Plot of absorbance (data points) and theoretical absorbance (lines) versus log[Pr] for
titration of PDAM and Pr(ClO4)3.
Figure 71. Plot of absorbance (data points) and theoretical absorbance (lines) versus log[Nd] for
titration of PDAM and Nd(ClO4)3.
0.000
0.100
0.200
0.300
0.400
0.500
0.600
0.700
0.800
-8.00 -6.00 -4.00 -2.00 0.00
Ab
sorb
ance
log [Pr]
292 nm
292 nm Theoretical
284 nm
284 nm Theoretical
253 nm
253 nm Theoretical
236 nm
236 nm Theoretical
0.000
0.100
0.200
0.300
0.400
0.500
0.600
0.700
0.800
-8.00 -6.00 -4.00 -2.00 0.00
Ab
sorb
ance
log [Nd]
292 nm
292 Theoretical
284 nm
284 nm Theoretical
253 nm
253 Theoretical
236 nm
236 nm Theoretical
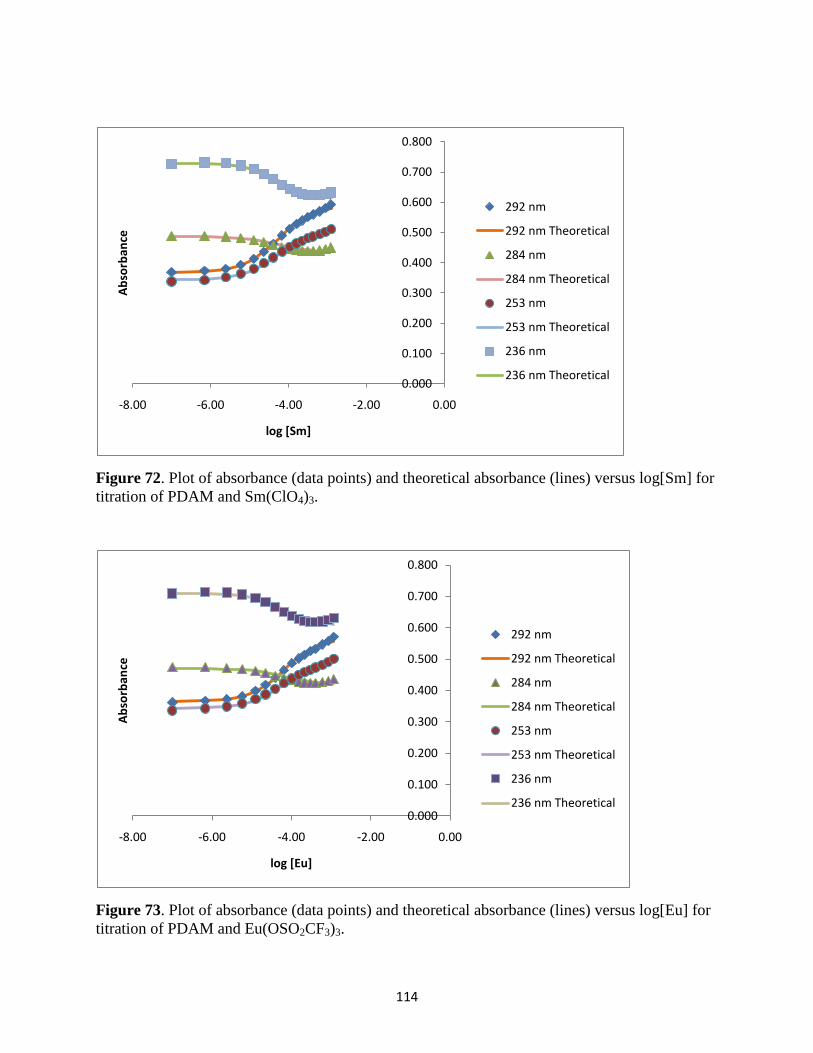
114
Figure 72. Plot of absorbance (data points) and theoretical absorbance (lines) versus log[Sm] for
titration of PDAM and Sm(ClO4)3.
Figure 73. Plot of absorbance (data points) and theoretical absorbance (lines) versus log[Eu] for
titration of PDAM and Eu(OSO2CF3)3.
0.000
0.100
0.200
0.300
0.400
0.500
0.600
0.700
0.800
-8.00 -6.00 -4.00 -2.00 0.00
Ab
sorb
ance
log [Sm]
292 nm
292 nm Theoretical
284 nm
284 nm Theoretical
253 nm
253 nm Theoretical
236 nm
236 nm Theoretical
0.000
0.100
0.200
0.300
0.400
0.500
0.600
0.700
0.800
-8.00 -6.00 -4.00 -2.00 0.00
Ab
sorb
ance
log [Eu]
292 nm
292 nm Theoretical
284 nm
284 nm Theoretical
253 nm
253 nm Theoretical
236 nm
236 nm Theoretical
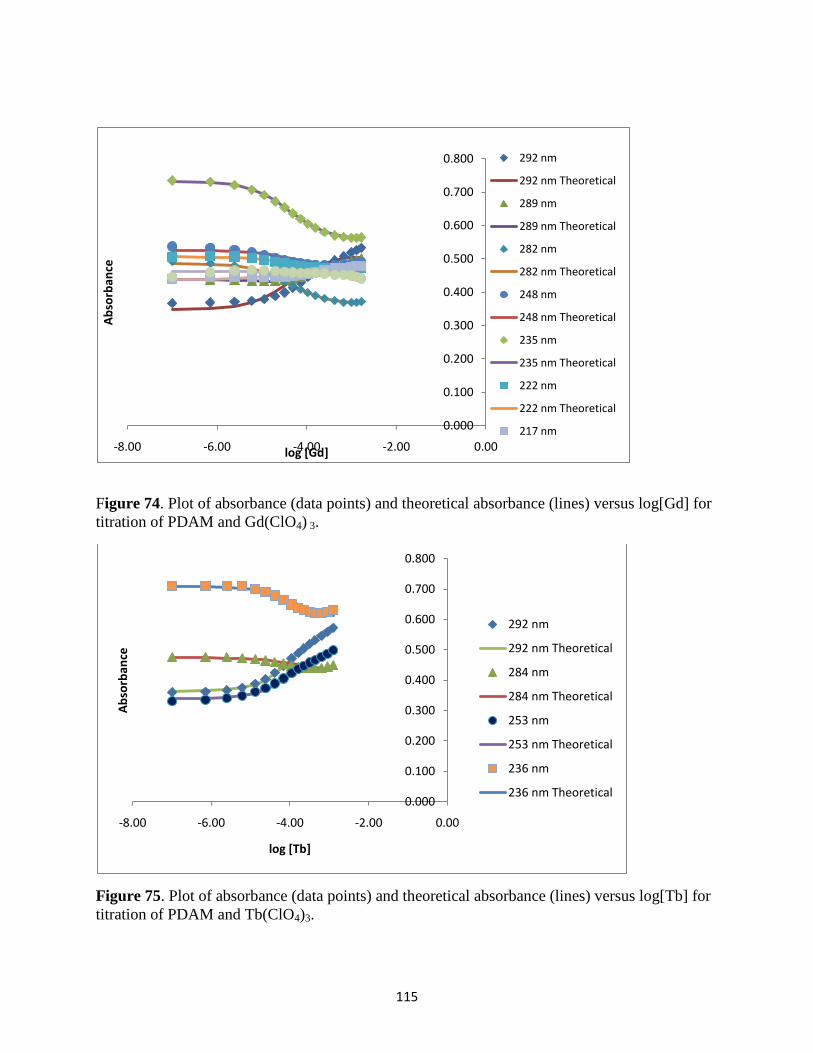
115
Figure 74. Plot of absorbance (data points) and theoretical absorbance (lines) versus log[Gd] for
titration of PDAM and Gd(ClO4) 3.
Figure 75. Plot of absorbance (data points) and theoretical absorbance (lines) versus log[Tb] for
titration of PDAM and Tb(ClO4)3.
0.000
0.100
0.200
0.300
0.400
0.500
0.600
0.700
0.800
-8.00 -6.00 -4.00 -2.00 0.00
Ab
sorb
ance
log [Gd]
292 nm
292 nm Theoretical
289 nm
289 nm Theoretical
282 nm
282 nm Theoretical
248 nm
248 nm Theoretical
235 nm
235 nm Theoretical
222 nm
222 nm Theoretical
217 nm
0.000
0.100
0.200
0.300
0.400
0.500
0.600
0.700
0.800
-8.00 -6.00 -4.00 -2.00 0.00
Ab
sorb
ance
log [Tb]
292 nm
292 nm Theoretical
284 nm
284 nm Theoretical
253 nm
253 nm Theoretical
236 nm
236 nm Theoretical
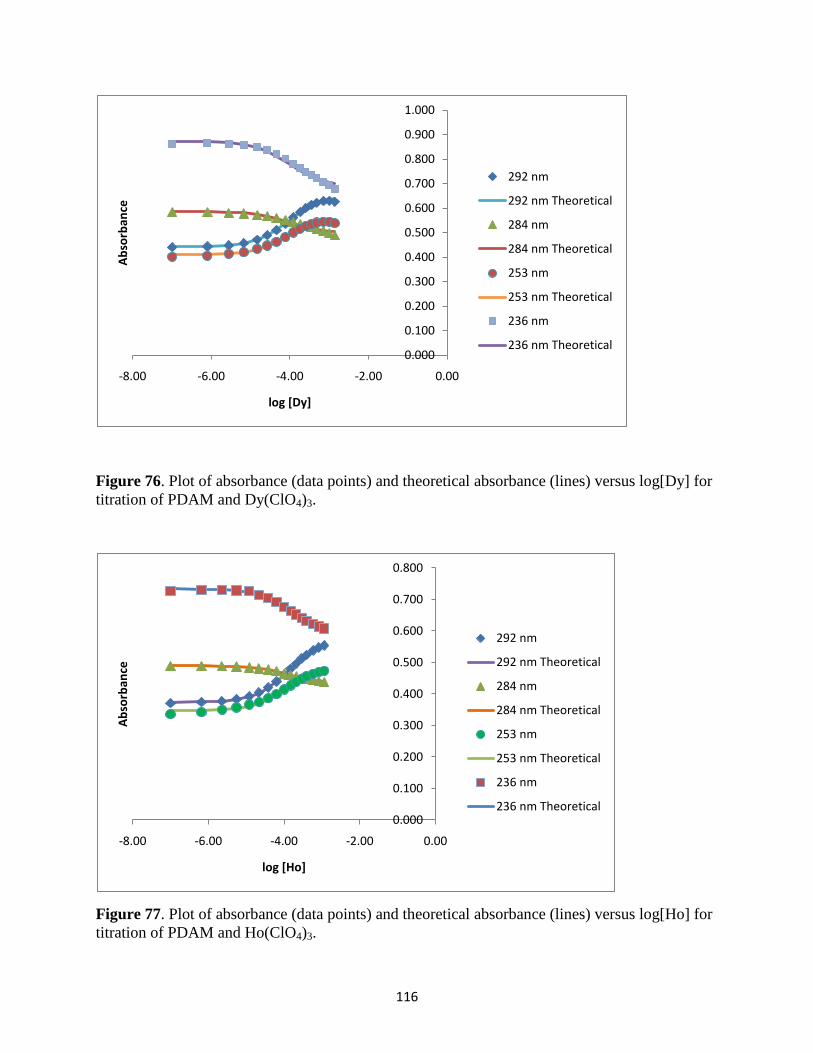
116
Figure 76. Plot of absorbance (data points) and theoretical absorbance (lines) versus log[Dy] for
titration of PDAM and Dy(ClO4)3.
Figure 77. Plot of absorbance (data points) and theoretical absorbance (lines) versus log[Ho] for
titration of PDAM and Ho(ClO4)3.
0.000
0.100
0.200
0.300
0.400
0.500
0.600
0.700
0.800
0.900
1.000
-8.00 -6.00 -4.00 -2.00 0.00
Ab
sorb
ance
log [Dy]
292 nm
292 nm Theoretical
284 nm
284 nm Theoretical
253 nm
253 nm Theoretical
236 nm
236 nm Theoretical
0.000
0.100
0.200
0.300
0.400
0.500
0.600
0.700
0.800
-8.00 -6.00 -4.00 -2.00 0.00
Ab
sorb
ance
log [Ho]
292 nm
292 nm Theoretical
284 nm
284 nm Theoretical
253 nm
253 nm Theoretical
236 nm
236 nm Theoretical
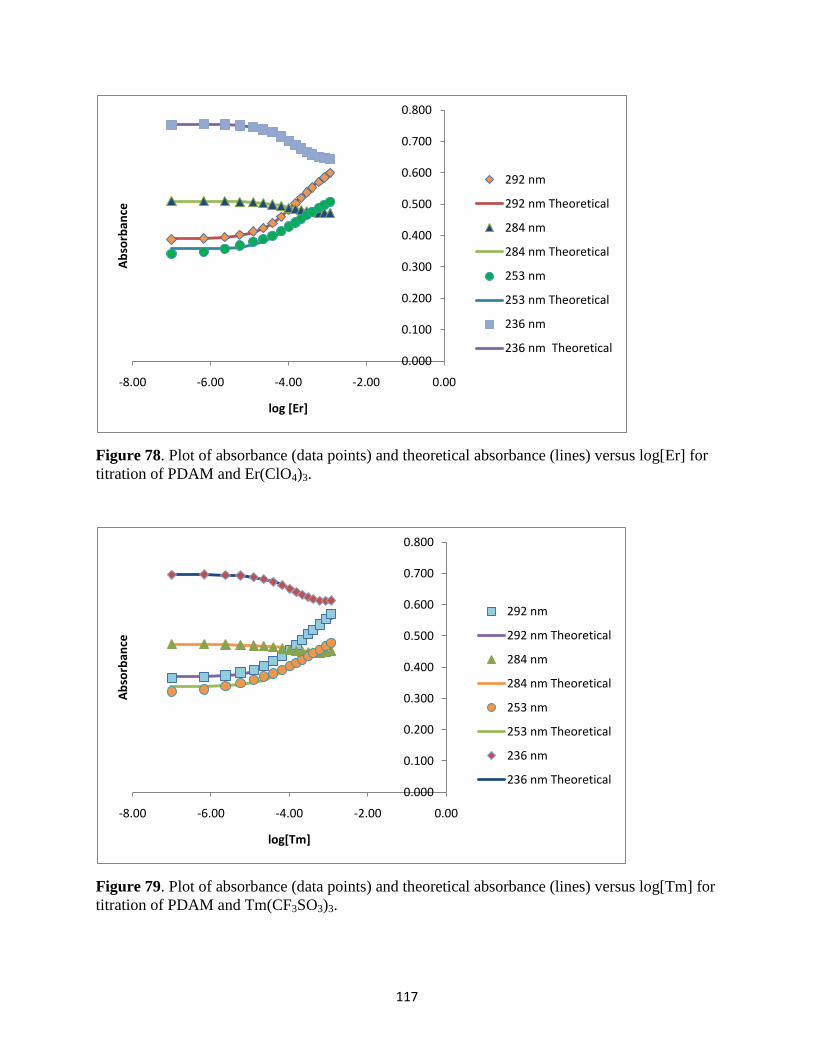
117
Figure 78. Plot of absorbance (data points) and theoretical absorbance (lines) versus log[Er] for
titration of PDAM and Er(ClO4)3.
Figure 79. Plot of absorbance (data points) and theoretical absorbance (lines) versus log[Tm] for
titration of PDAM and Tm(CF3SO3)3.
0.000
0.100
0.200
0.300
0.400
0.500
0.600
0.700
0.800
-8.00 -6.00 -4.00 -2.00 0.00
Ab
sorb
ance
log [Er]
292 nm
292 nm Theoretical
284 nm
284 nm Theoretical
253 nm
253 nm Theoretical
236 nm
236 nm Theoretical
0.000
0.100
0.200
0.300
0.400
0.500
0.600
0.700
0.800
-8.00 -6.00 -4.00 -2.00 0.00
Ab
sorb
ance
log[Tm]
292 nm
292 nm Theoretical
284 nm
284 nm Theoretical
253 nm
253 nm Theoretical
236 nm
236 nm Theoretical
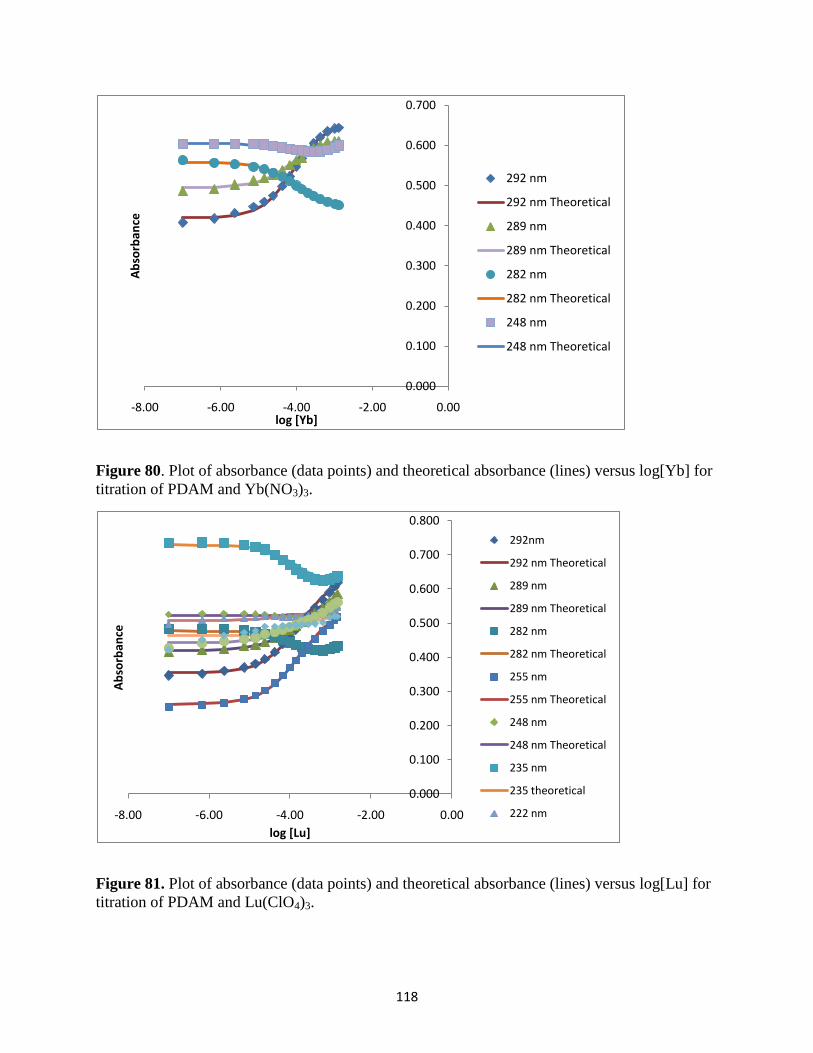
118
Figure 80. Plot of absorbance (data points) and theoretical absorbance (lines) versus log[Yb] for
titration of PDAM and Yb(NO3)3.
Figure 81. Plot of absorbance (data points) and theoretical absorbance (lines) versus log[Lu] for
titration of PDAM and Lu(ClO4)3.
0.000
0.100
0.200
0.300
0.400
0.500
0.600
0.700
-8.00 -6.00 -4.00 -2.00 0.00
Ab
sorb
ance
log [Yb]
292 nm
292 nm Theoretical
289 nm
289 nm Theoretical
282 nm
282 nm Theoretical
248 nm
248 nm Theoretical
0.000
0.100
0.200
0.300
0.400
0.500
0.600
0.700
0.800
-8.00 -6.00 -4.00 -2.00 0.00
Ab
sorb
ance
log [Lu]
292nm
292 nm Theoretical
289 nm
289 nm Theoretical
282 nm
282 nm Theoretical
255 nm
255 nm Theoretical
248 nm
248 nm Theoretical
235 nm
235 theoretical
222 nm
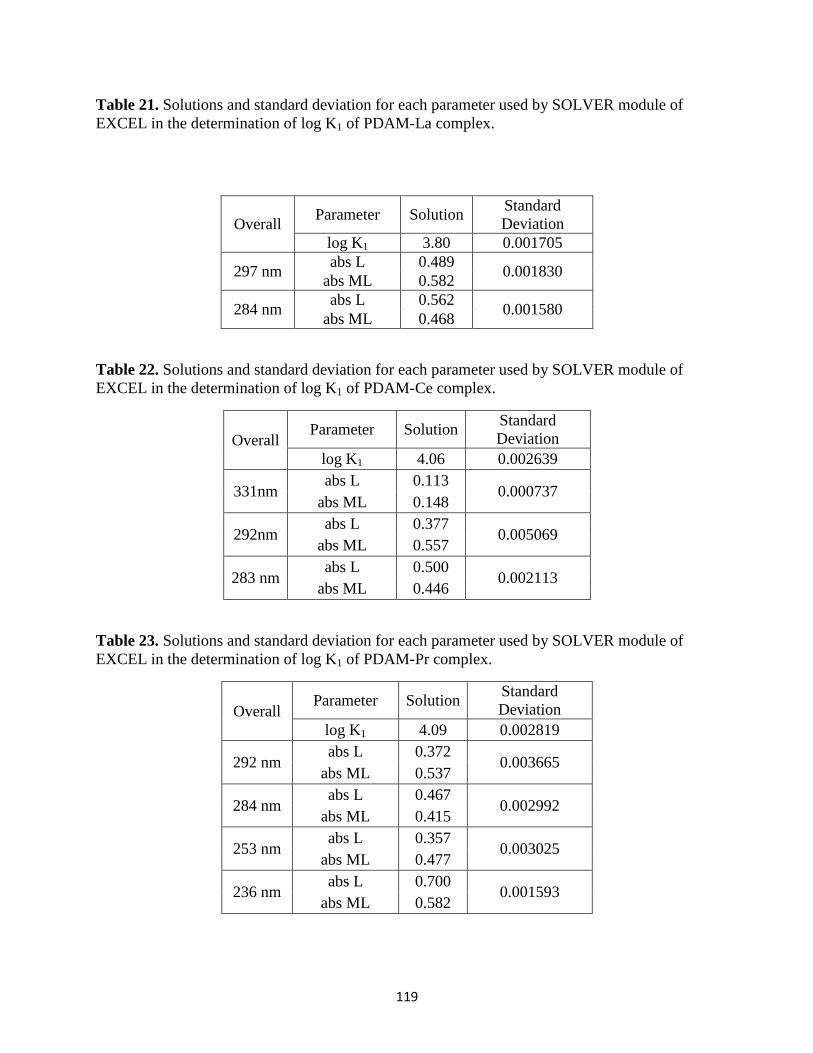
119
Table 21. Solutions and standard deviation for each parameter used by SOLVER module of
EXCEL in the determination of log K1 of PDAM-La complex.
Overall Parameter Solution
Standard
Deviation
log K1 3.80 0.001705
297 nm abs L 0.489
0.001830 abs ML 0.582
284 nm abs L 0.562
0.001580 abs ML 0.468
Table 22. Solutions and standard deviation for each parameter used by SOLVER module of
EXCEL in the determination of log K1 of PDAM-Ce complex.
Overall Parameter Solution
Standard
Deviation
log K1 4.06 0.002639
331nm abs L 0.113
0.000737 abs ML 0.148
292nm abs L 0.377
0.005069 abs ML 0.557
283 nm abs L 0.500
0.002113 abs ML 0.446
Table 23. Solutions and standard deviation for each parameter used by SOLVER module of
EXCEL in the determination of log K1 of PDAM-Pr complex.
Overall Parameter Solution
Standard
Deviation
log K1 4.09 0.002819
292 nm abs L 0.372
0.003665 abs ML 0.537
284 nm abs L 0.467
0.002992 abs ML 0.415
253 nm abs L 0.357
0.003025 abs ML 0.477
236 nm abs L 0.700
0.001593 abs ML 0.582
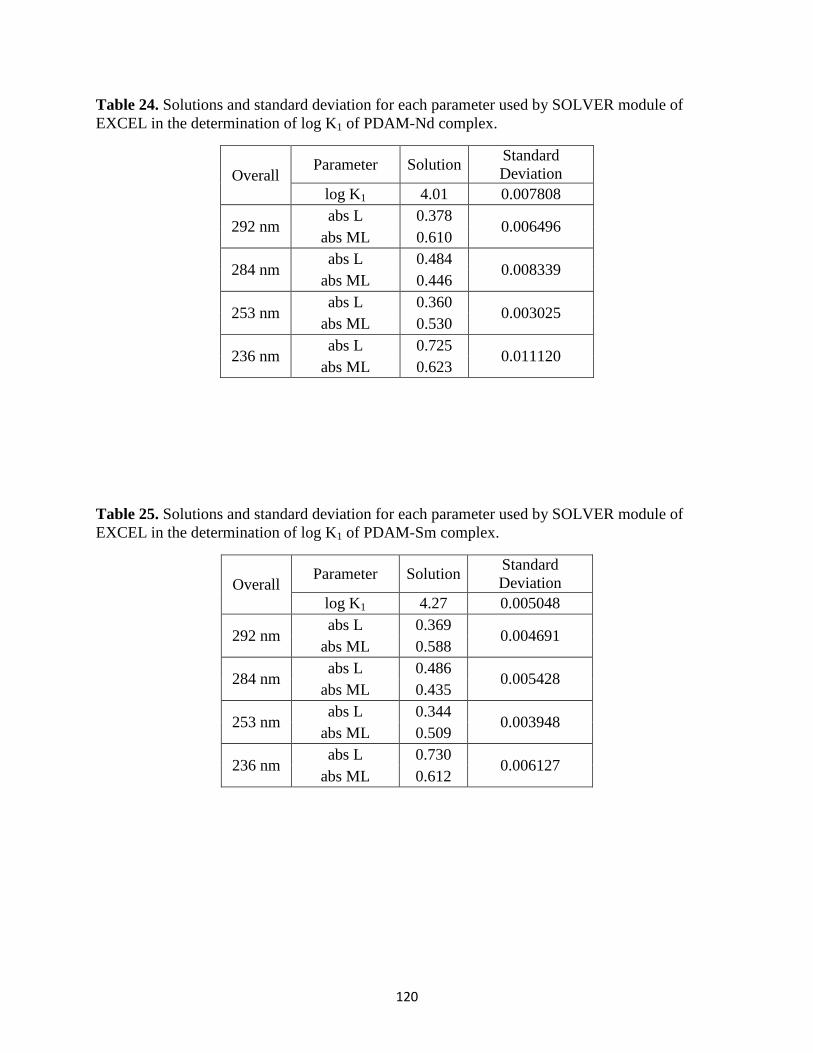
120
Table 24. Solutions and standard deviation for each parameter used by SOLVER module of
EXCEL in the determination of log K1 of PDAM-Nd complex.
Overall Parameter Solution
Standard
Deviation
log K1 4.01 0.007808
292 nm abs L 0.378
0.006496 abs ML 0.610
284 nm abs L 0.484
0.008339 abs ML 0.446
253 nm abs L 0.360
0.003025 abs ML 0.530
236 nm abs L 0.725
0.011120 abs ML 0.623
Table 25. Solutions and standard deviation for each parameter used by SOLVER module of
EXCEL in the determination of log K1 of PDAM-Sm complex.
Overall Parameter Solution
Standard
Deviation
log K1 4.27 0.005048
292 nm abs L 0.369
0.004691 abs ML 0.588
284 nm abs L 0.486
0.005428 abs ML 0.435
253 nm abs L 0.344
0.003948 abs ML 0.509
236 nm abs L 0.730
0.006127 abs ML 0.612
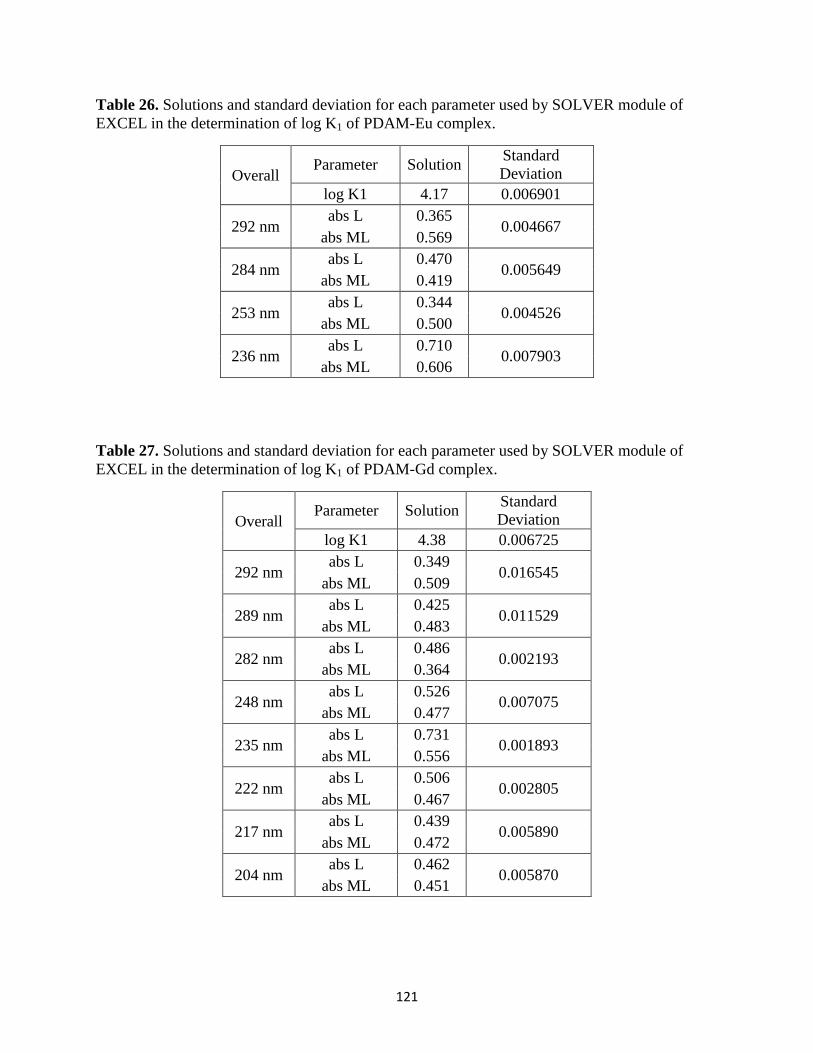
121
Table 26. Solutions and standard deviation for each parameter used by SOLVER module of
EXCEL in the determination of log K1 of PDAM-Eu complex.
Overall Parameter Solution
Standard
Deviation
log K1 4.17 0.006901
292 nm abs L 0.365
0.004667 abs ML 0.569
284 nm abs L 0.470
0.005649 abs ML 0.419
253 nm abs L 0.344
0.004526 abs ML 0.500
236 nm abs L 0.710
0.007903 abs ML 0.606
Table 27. Solutions and standard deviation for each parameter used by SOLVER module of
EXCEL in the determination of log K1 of PDAM-Gd complex.
Overall Parameter Solution
Standard
Deviation
log K1 4.38 0.006725
292 nm abs L 0.349
0.016545 abs ML 0.509
289 nm abs L 0.425
0.011529 abs ML 0.483
282 nm abs L 0.486
0.002193 abs ML 0.364
248 nm abs L 0.526
0.007075 abs ML 0.477
235 nm abs L 0.731
0.001893 abs ML 0.556
222 nm abs L 0.506
0.002805 abs ML 0.467
217 nm abs L 0.439
0.005890 abs ML 0.472
204 nm abs L 0.462
0.005870 abs ML 0.451
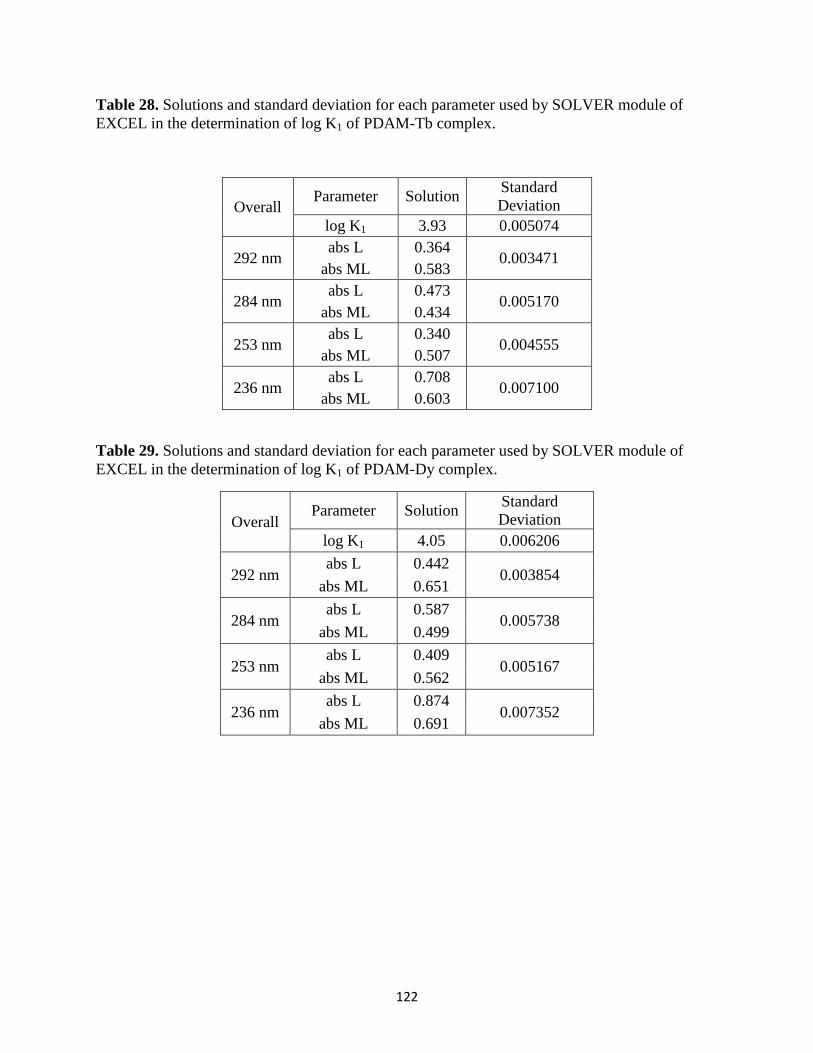
122
Table 28. Solutions and standard deviation for each parameter used by SOLVER module of
EXCEL in the determination of log K1 of PDAM-Tb complex.
Overall Parameter Solution
Standard
Deviation
log K1 3.93 0.005074
292 nm abs L 0.364
0.003471 abs ML 0.583
284 nm abs L 0.473
0.005170 abs ML 0.434
253 nm abs L 0.340
0.004555 abs ML 0.507
236 nm abs L 0.708
0.007100 abs ML 0.603
Table 29. Solutions and standard deviation for each parameter used by SOLVER module of
EXCEL in the determination of log K1 of PDAM-Dy complex.
Overall Parameter Solution
Standard
Deviation
log K1 4.05 0.006206
292 nm abs L 0.442
0.003854 abs ML 0.651
284 nm abs L 0.587
0.005738 abs ML 0.499
253 nm abs L 0.409
0.005167 abs ML 0.562
236 nm abs L 0.874
0.007352 abs ML 0.691
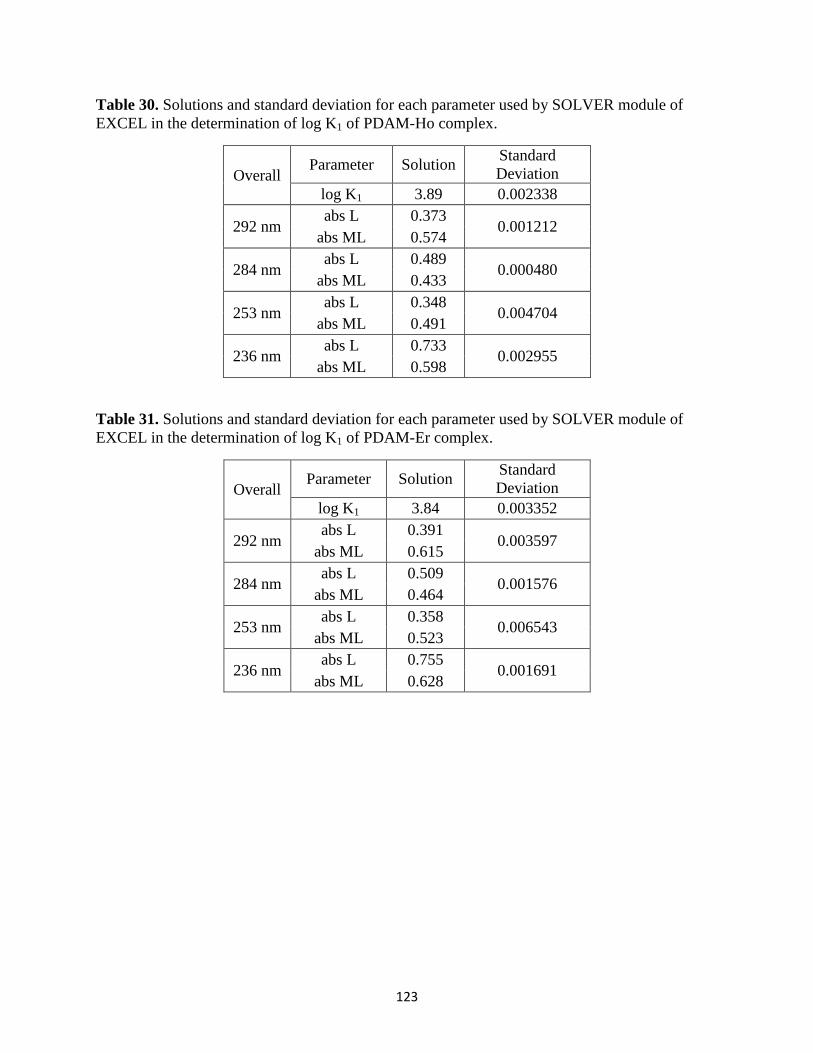
123
Table 30. Solutions and standard deviation for each parameter used by SOLVER module of
EXCEL in the determination of log K1 of PDAM-Ho complex.
Overall Parameter Solution
Standard
Deviation
log K1 3.89 0.002338
292 nm abs L 0.373
0.001212 abs ML 0.574
284 nm abs L 0.489
0.000480 abs ML 0.433
253 nm abs L 0.348
0.004704 abs ML 0.491
236 nm abs L 0.733
0.002955 abs ML 0.598
Table 31. Solutions and standard deviation for each parameter used by SOLVER module of
EXCEL in the determination of log K1 of PDAM-Er complex.
Overall Parameter Solution
Standard
Deviation
log K1 3.84 0.003352
292 nm abs L 0.391
0.003597 abs ML 0.615
284 nm abs L 0.509
0.001576 abs ML 0.464
253 nm abs L 0.358
0.006543 abs ML 0.523
236 nm abs L 0.755
0.001691 abs ML 0.628
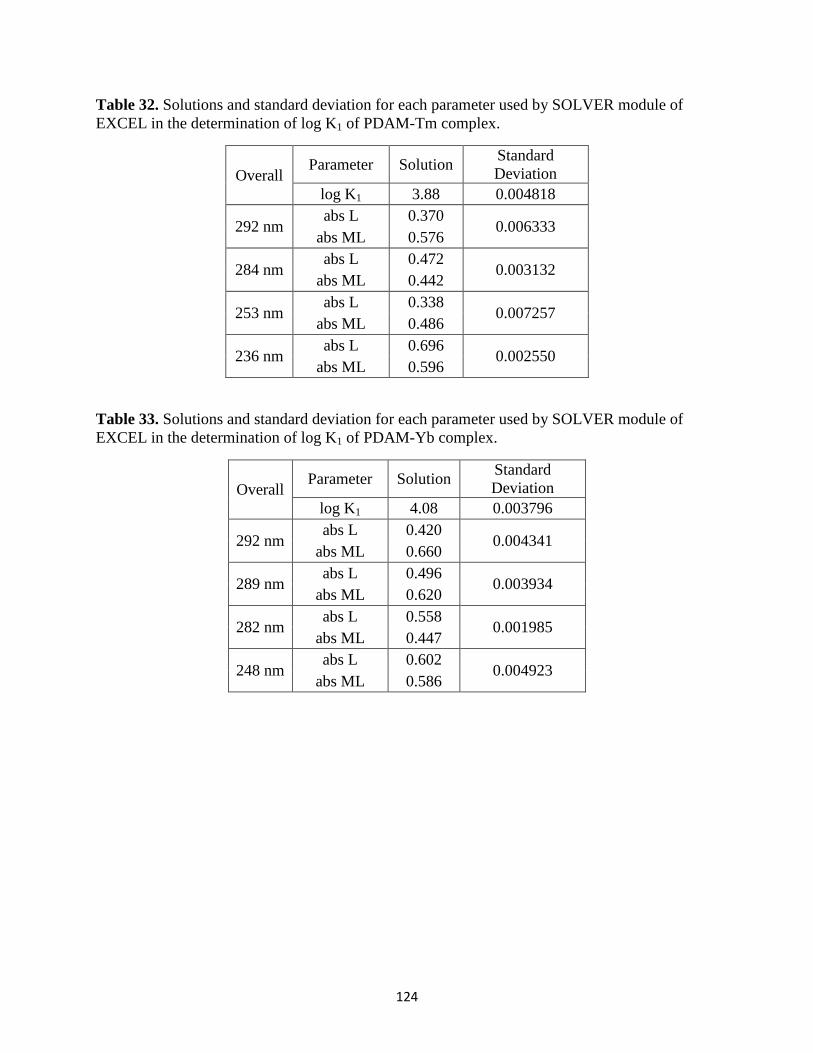
124
Table 32. Solutions and standard deviation for each parameter used by SOLVER module of
EXCEL in the determination of log K1 of PDAM-Tm complex.
Overall Parameter Solution
Standard
Deviation
log K1 3.88 0.004818
292 nm abs L 0.370
0.006333 abs ML 0.576
284 nm abs L 0.472
0.003132 abs ML 0.442
253 nm abs L 0.338
0.007257 abs ML 0.486
236 nm abs L 0.696
0.002550 abs ML 0.596
Table 33. Solutions and standard deviation for each parameter used by SOLVER module of
EXCEL in the determination of log K1 of PDAM-Yb complex.
Overall Parameter Solution
Standard
Deviation
log K1 4.08 0.003796
292 nm abs L 0.420
0.004341 abs ML 0.660
289 nm abs L 0.496
0.003934 abs ML 0.620
282 nm abs L 0.558
0.001985 abs ML 0.447
248 nm abs L 0.602
0.004923 abs ML 0.586
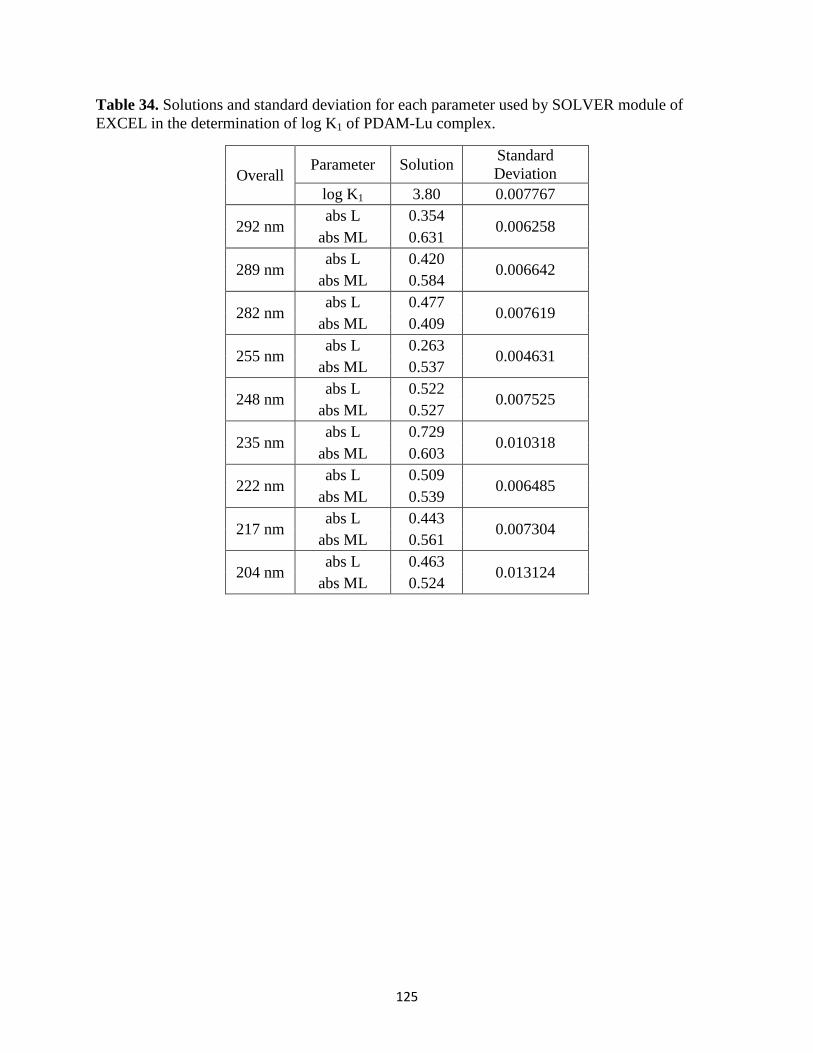
125
Table 34. Solutions and standard deviation for each parameter used by SOLVER module of
EXCEL in the determination of log K1 of PDAM-Lu complex.
Overall Parameter Solution
Standard
Deviation
log K1 3.80 0.007767
292 nm abs L 0.354
0.006258 abs ML 0.631
289 nm abs L 0.420
0.006642 abs ML 0.584
282 nm abs L 0.477
0.007619 abs ML 0.409
255 nm abs L 0.263
0.004631 abs ML 0.537
248 nm abs L 0.522
0.007525 abs ML 0.527
235 nm abs L 0.729
0.010318 abs ML 0.603
222 nm abs L 0.509
0.006485 abs ML 0.539
217 nm abs L 0.443
0.007304 abs ML 0.561
204 nm abs L 0.463
0.013124 abs ML 0.524
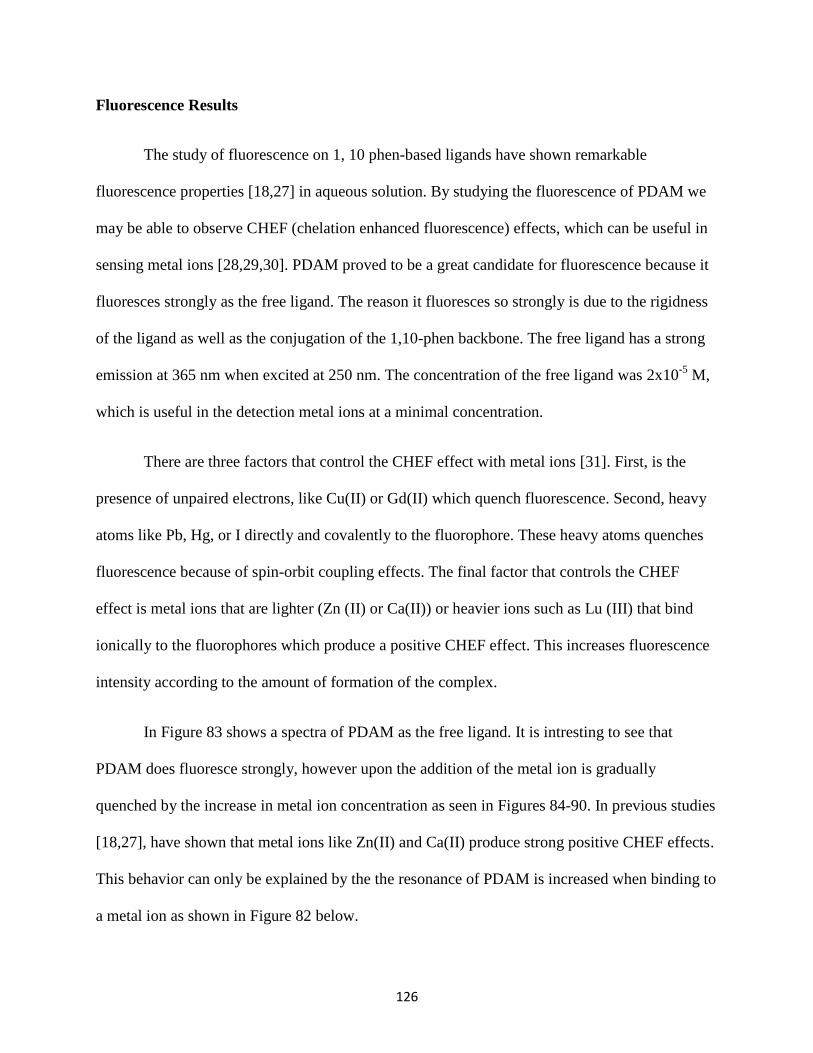
126
Fluorescence Results
The study of fluorescence on 1, 10 phen-based ligands have shown remarkable
fluorescence properties [18,27] in aqueous solution. By studying the fluorescence of PDAM we
may be able to observe CHEF (chelation enhanced fluorescence) effects, which can be useful in
sensing metal ions [28,29,30]. PDAM proved to be a great candidate for fluorescence because it
fluoresces strongly as the free ligand. The reason it fluoresces so strongly is due to the rigidness
of the ligand as well as the conjugation of the 1,10-phen backbone. The free ligand has a strong
emission at 365 nm when excited at 250 nm. The concentration of the free ligand was 2x10⁻⁵
M,
which is useful in the detection metal ions at a minimal concentration.
There are three factors that control the CHEF effect with metal ions [31]. First, is the
presence of unpaired electrons, like Cu(II) or Gd(II) which quench fluorescence. Second, heavy
atoms like Pb, Hg, or I directly and covalently to the fluorophore. These heavy atoms quenches
fluorescence because of spin-orbit coupling effects. The final factor that controls the CHEF
effect is metal ions that are lighter (Zn (II) or Ca(II)) or heavier ions such as Lu (III) that bind
ionically to the fluorophores which produce a positive CHEF effect. This increases fluorescence
intensity according to the amount of formation of the complex.
In Figure 83 shows a spectra of PDAM as the free ligand. It is intresting to see that
PDAM does fluoresce strongly, however upon the addition of the metal ion is gradually
quenched by the increase in metal ion concentration as seen in Figures 84-90. In previous studies
[18,27], have shown that metal ions like Zn(II) and Ca(II) produce strong positive CHEF effects.
This behavior can only be explained by the the resonance of PDAM is increased when binding to
a metal ion as shown in Figure 82 below.
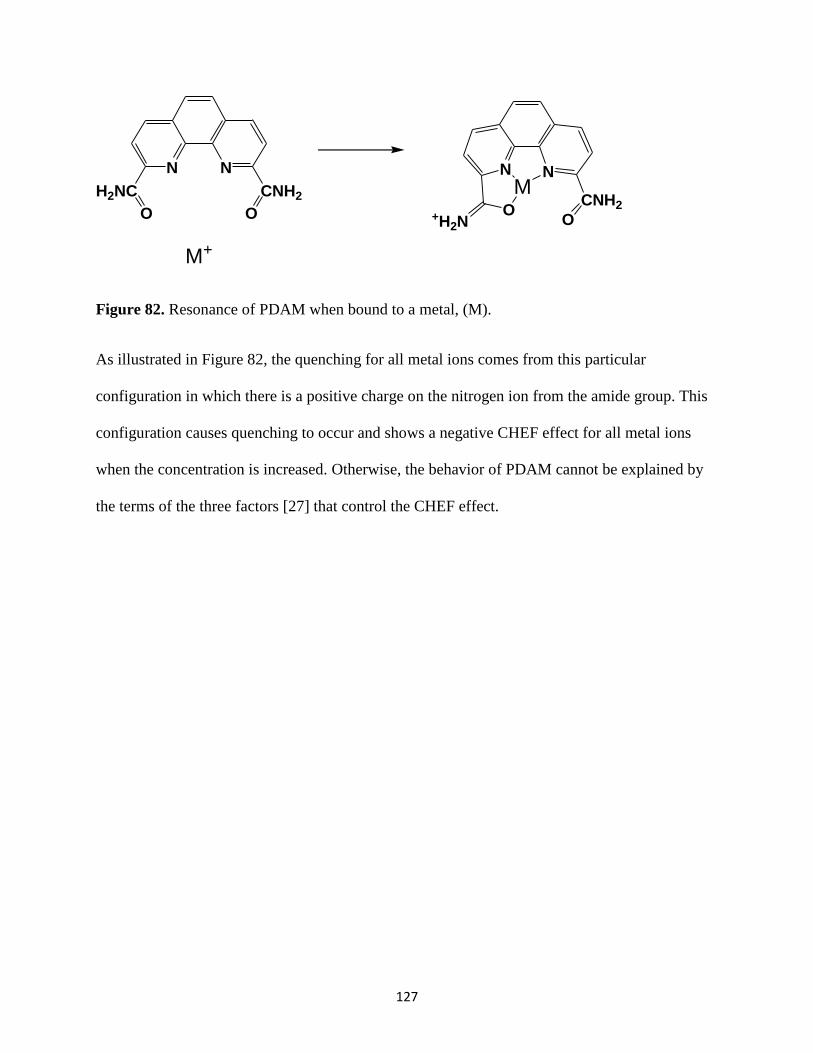
127
NN
H2NC CNH2
O O
NN
CNH2OO
M+
M
+H2N
Figure 82. Resonance of PDAM when bound to a metal, (M).
As illustrated in Figure 82, the quenching for all metal ions comes from this particular
configuration in which there is a positive charge on the nitrogen ion from the amide group. This
configuration causes quenching to occur and shows a negative CHEF effect for all metal ions
when the concentration is increased. Otherwise, the behavior of PDAM cannot be explained by
the terms of the three factors [27] that control the CHEF effect.
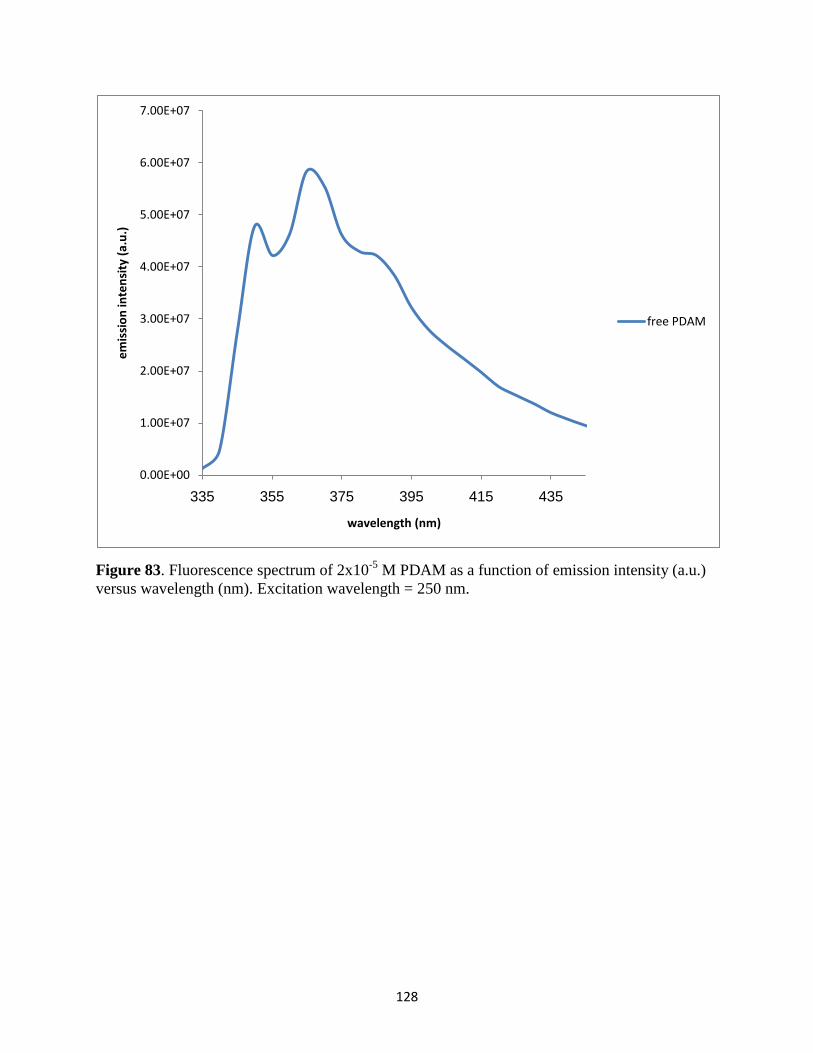
128
Figure 83. Fluorescence spectrum of 2x10⁻⁵
M PDAM as a function of emission intensity (a.u.)
versus wavelength (nm). Excitation wavelength = 250 nm.
0.00E+00
1.00E+07
2.00E+07
3.00E+07
4.00E+07
5.00E+07
6.00E+07
7.00E+07
335 355 375 395 415 435
em
issi
on
inte
nsi
ty (
a.u
.)
wavelength (nm)
free PDAM
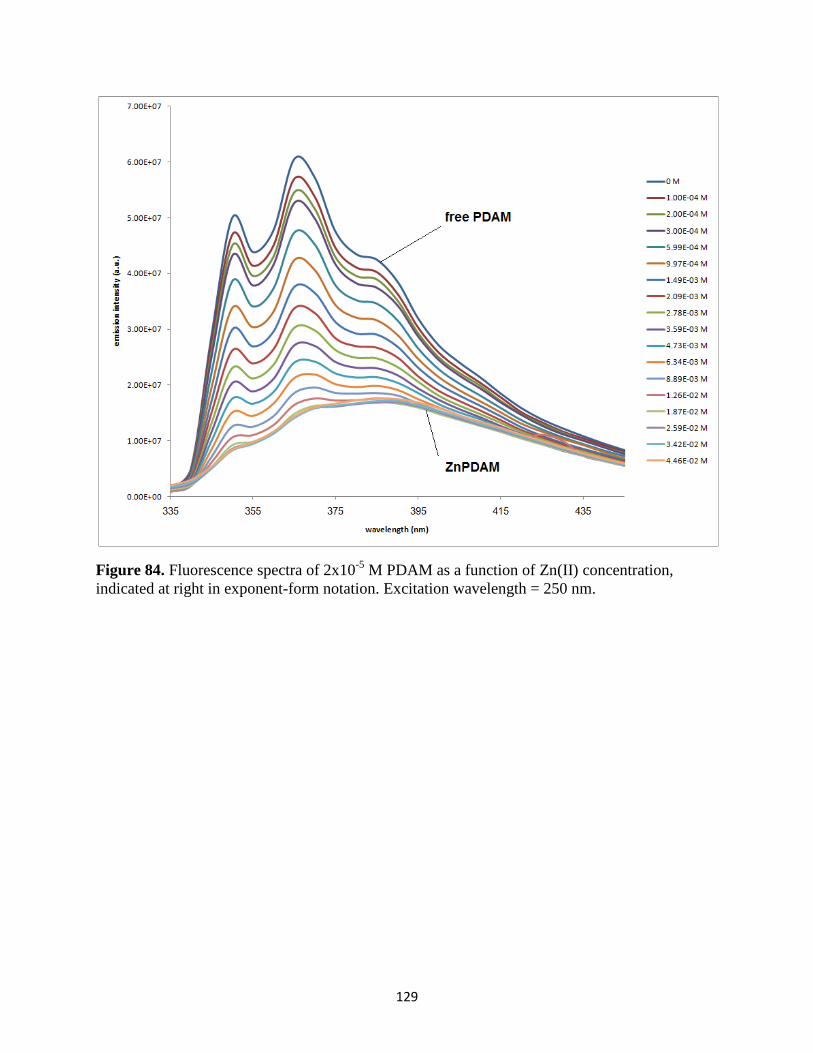
129
Figure 84. Fluorescence spectra of 2x10⁻⁵
M PDAM as a function of Zn(II) concentration,
indicated at right in exponent-form notation. Excitation wavelength = 250 nm.
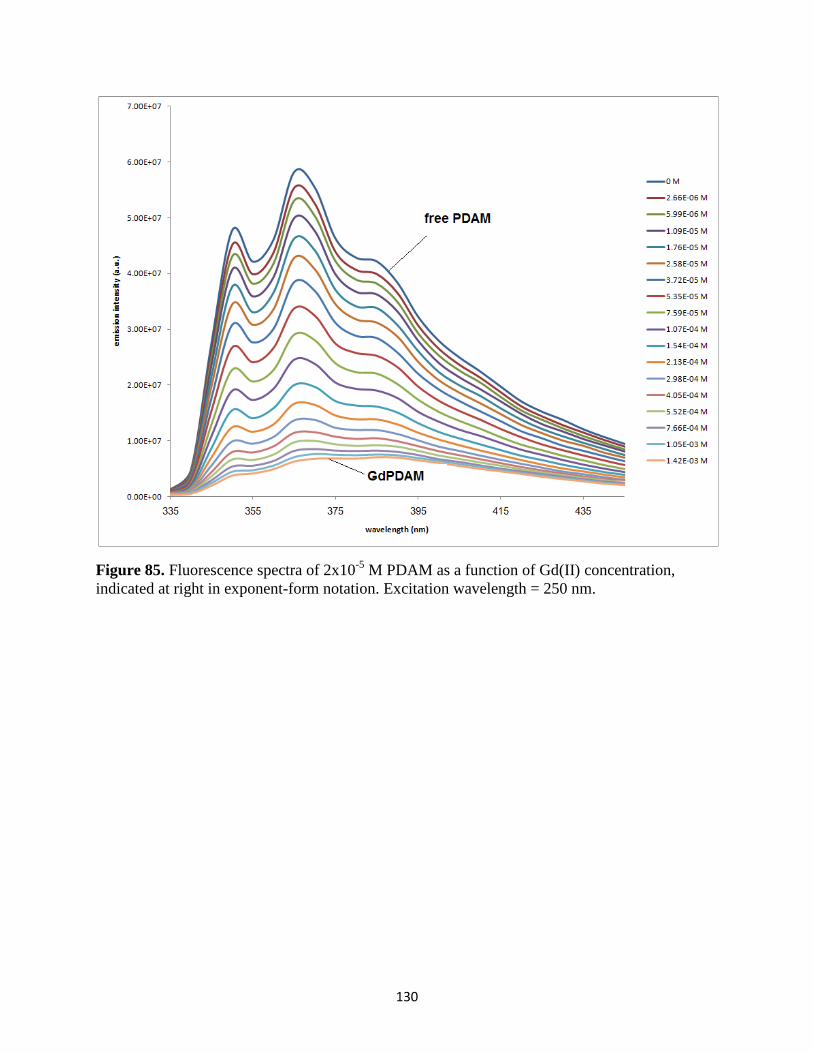
130
Figure 85. Fluorescence spectra of 2x10⁻⁵
M PDAM as a function of Gd(II) concentration,
indicated at right in exponent-form notation. Excitation wavelength = 250 nm.
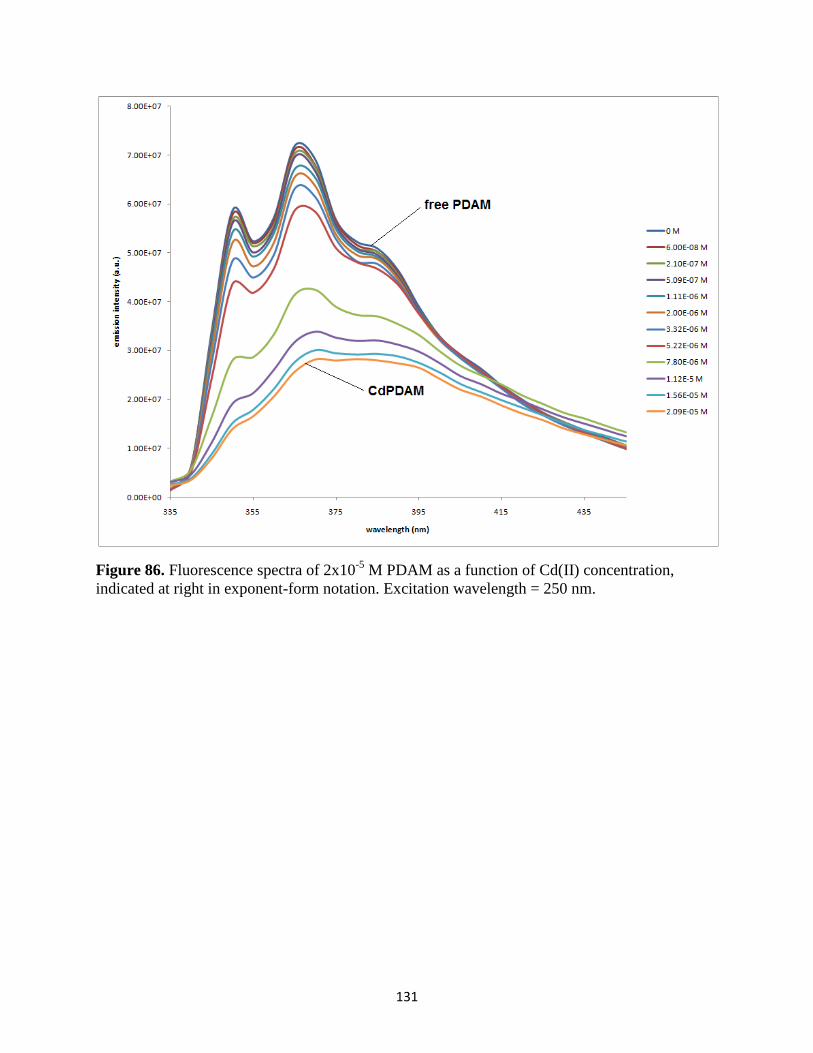
131
Figure 86. Fluorescence spectra of 2x10⁻⁵
M PDAM as a function of Cd(II) concentration,
indicated at right in exponent-form notation. Excitation wavelength = 250 nm.
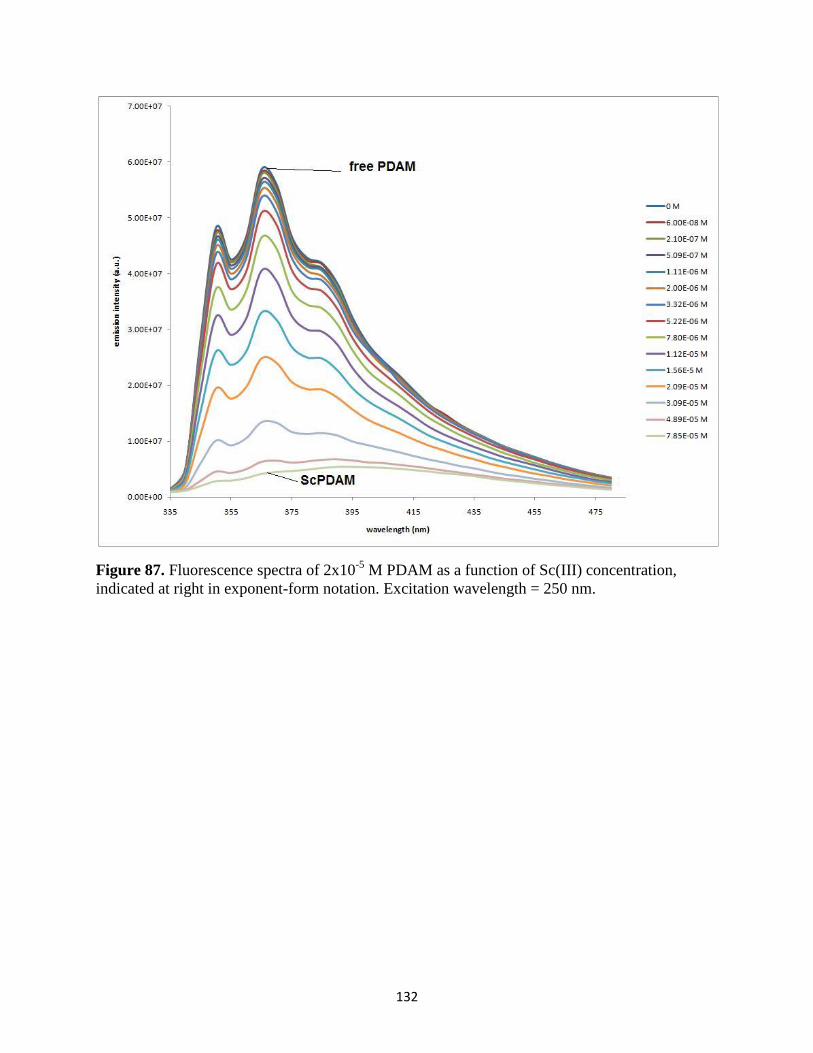
132
Figure 87. Fluorescence spectra of 2x10⁻⁵
M PDAM as a function of Sc(III) concentration,
indicated at right in exponent-form notation. Excitation wavelength = 250 nm.
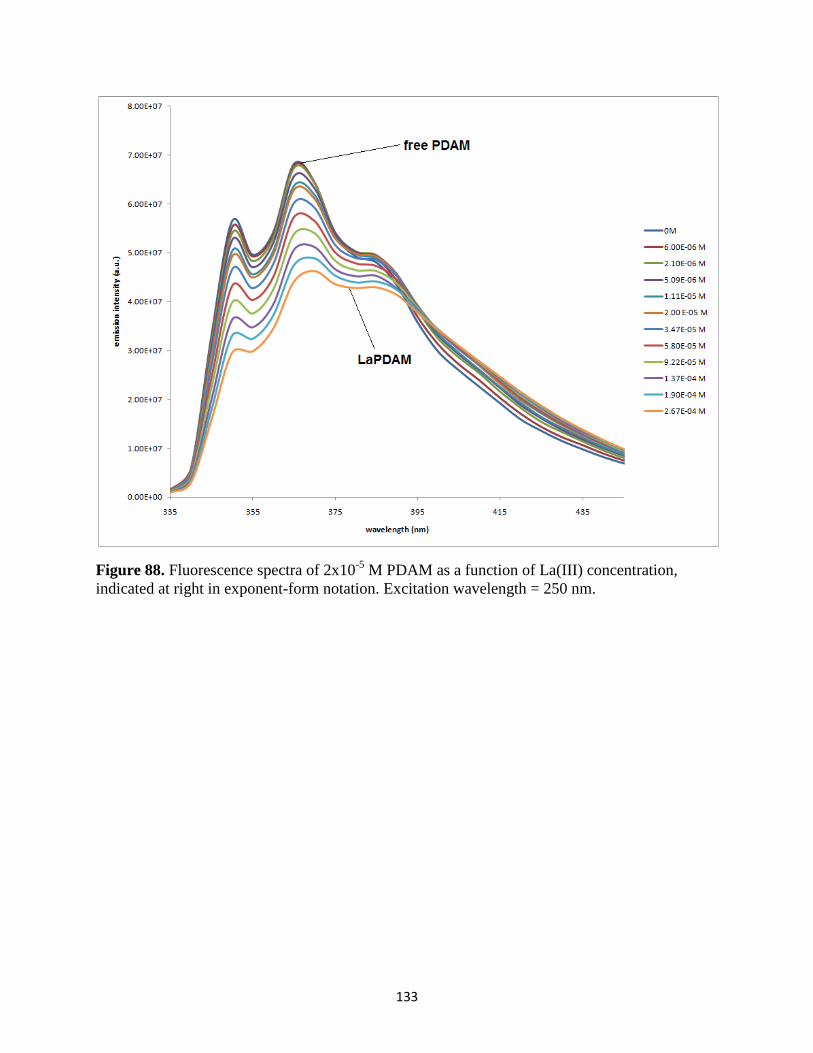
133
Figure 88. Fluorescence spectra of 2x10⁻⁵
M PDAM as a function of La(III) concentration,
indicated at right in exponent-form notation. Excitation wavelength = 250 nm.
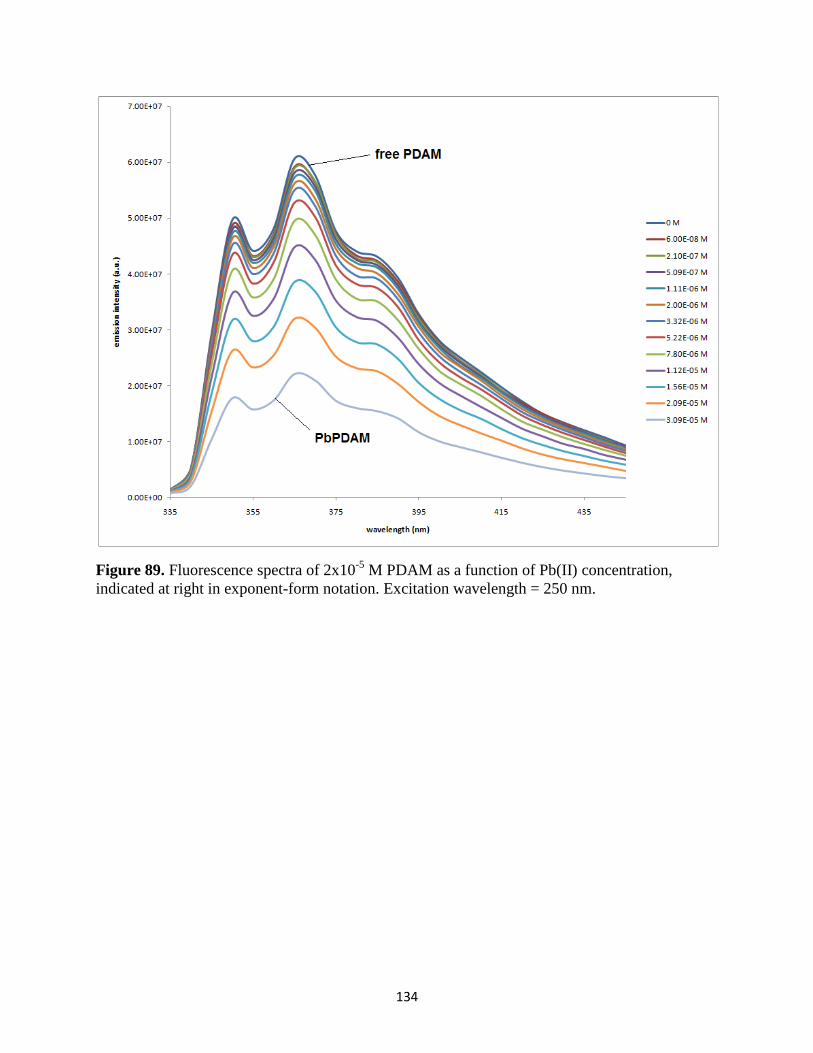
134
Figure 89. Fluorescence spectra of 2x10⁻⁵
M PDAM as a function of Pb(II) concentration,
indicated at right in exponent-form notation. Excitation wavelength = 250 nm.
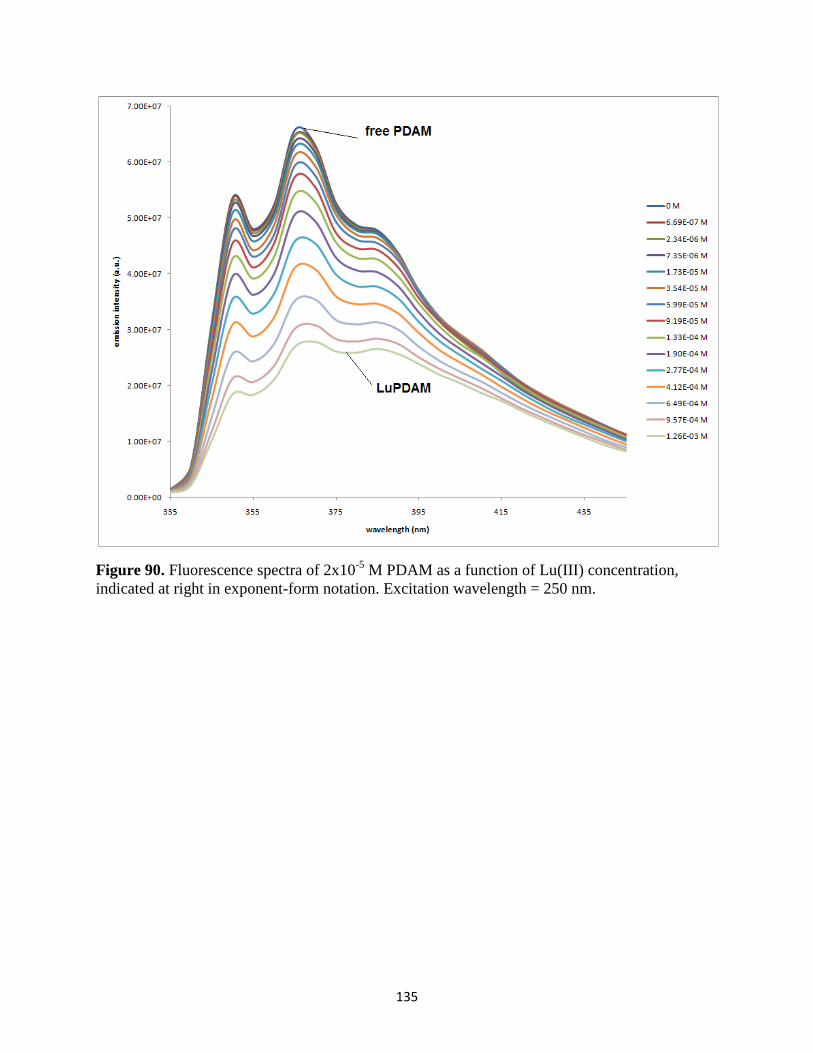
135
Figure 90. Fluorescence spectra of 2x10⁻⁵
M PDAM as a function of Lu(III) concentration,
indicated at right in exponent-form notation. Excitation wavelength = 250 nm.
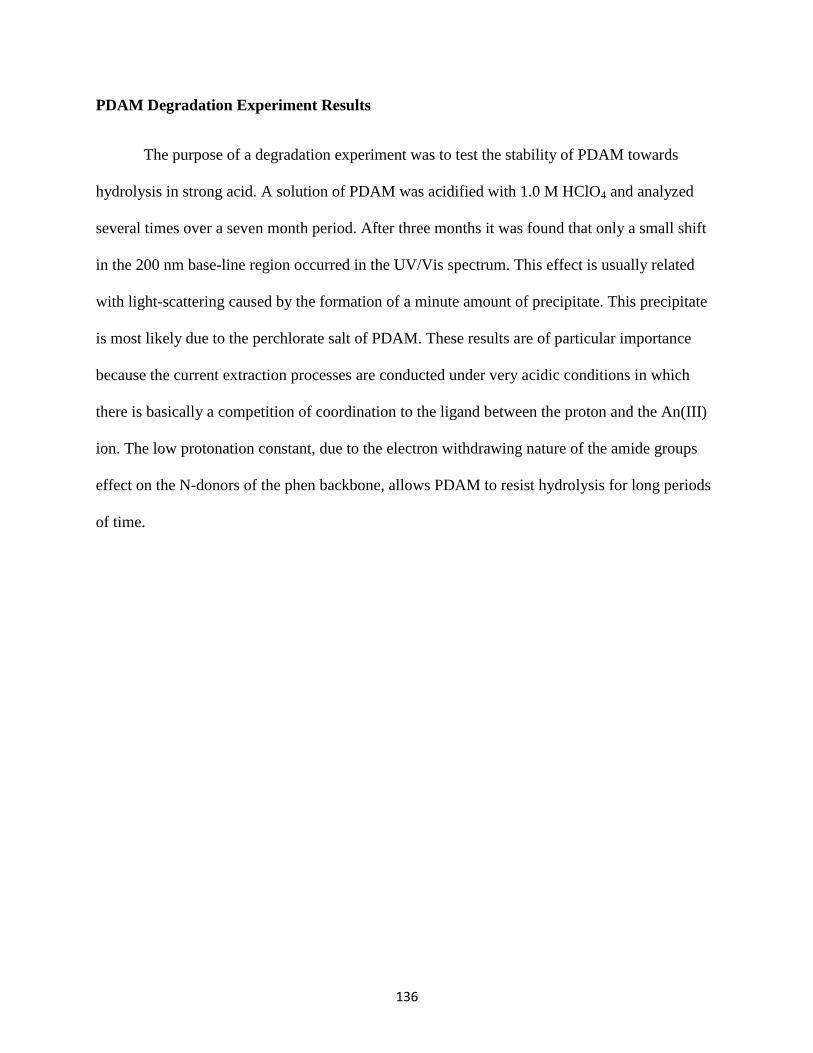
136
PDAM Degradation Experiment Results
The purpose of a degradation experiment was to test the stability of PDAM towards
hydrolysis in strong acid. A solution of PDAM was acidified with 1.0 M HClO4 and analyzed
several times over a seven month period. After three months it was found that only a small shift
in the 200 nm base-line region occurred in the UV/Vis spectrum. This effect is usually related
with light-scattering caused by the formation of a minute amount of precipitate. This precipitate
is most likely due to the perchlorate salt of PDAM. These results are of particular importance
because the current extraction processes are conducted under very acidic conditions in which
there is basically a competition of coordination to the ligand between the proton and the An(III)
ion. The low protonation constant, due to the electron withdrawing nature of the amide groups
effect on the N-donors of the phen backbone, allows PDAM to resist hydrolysis for long periods
of time.
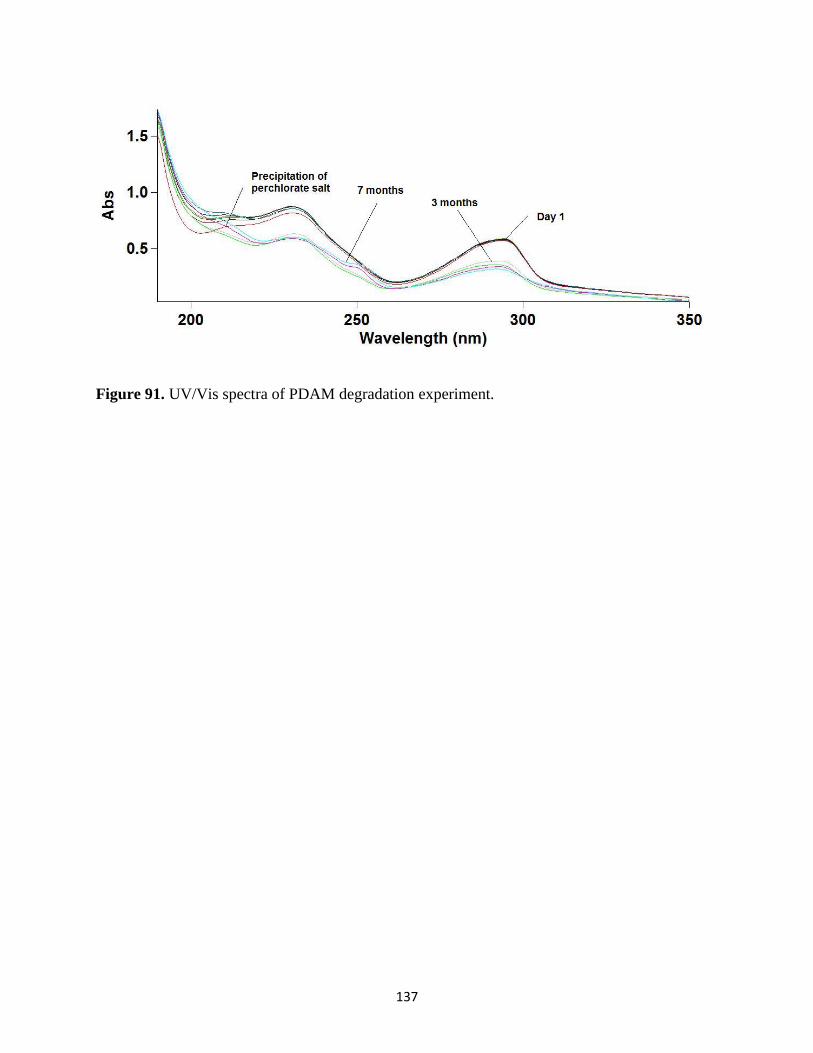
137
Figure 91. UV/Vis spectra of PDAM degradation experiment.
138
Molecular Mechanics Calculations
The best-fit size of metal ions for the coordination to PDAM was analyzed by using MM
calculations. The M–N and M–O bond lengths were varied systematically in 0.1 Å increments
between M–N values of 2.0 to 3.0 Å while keeping the M–N force constant at a value of 0.7
mdyne/Å. The ideal M–O bond length was put at a constant 0.05 Å shorter that the M–N bond
length to achieve the ideal M–O bond length for each point in the calculation. This difference of
0.05 Å is due to the difference in size between the N and O atoms. The curve of U (strain energy)
versus M–N length was produced by MM for the complex [M(PDAM)(H2O)2]3+
is seen in Figure
92. The polynomial equation in Figure 92 determines the best-fit size of the metal ion by
calculating the M–N bond length that produced the minimum strain energy of the curve. The
minimum in U for these complexes occurs with M–N= 2.52 Å, which is equal to the best-fit size
of metal ion for the coordination with PDAM. This would allow selectivity against metal ions
that that cannot achieve M–O lengths of close to half this distance which would be 2.41 Å. The
structure of [Y(PDAM)(NO3)3] was predicted as seen in Figure 93.
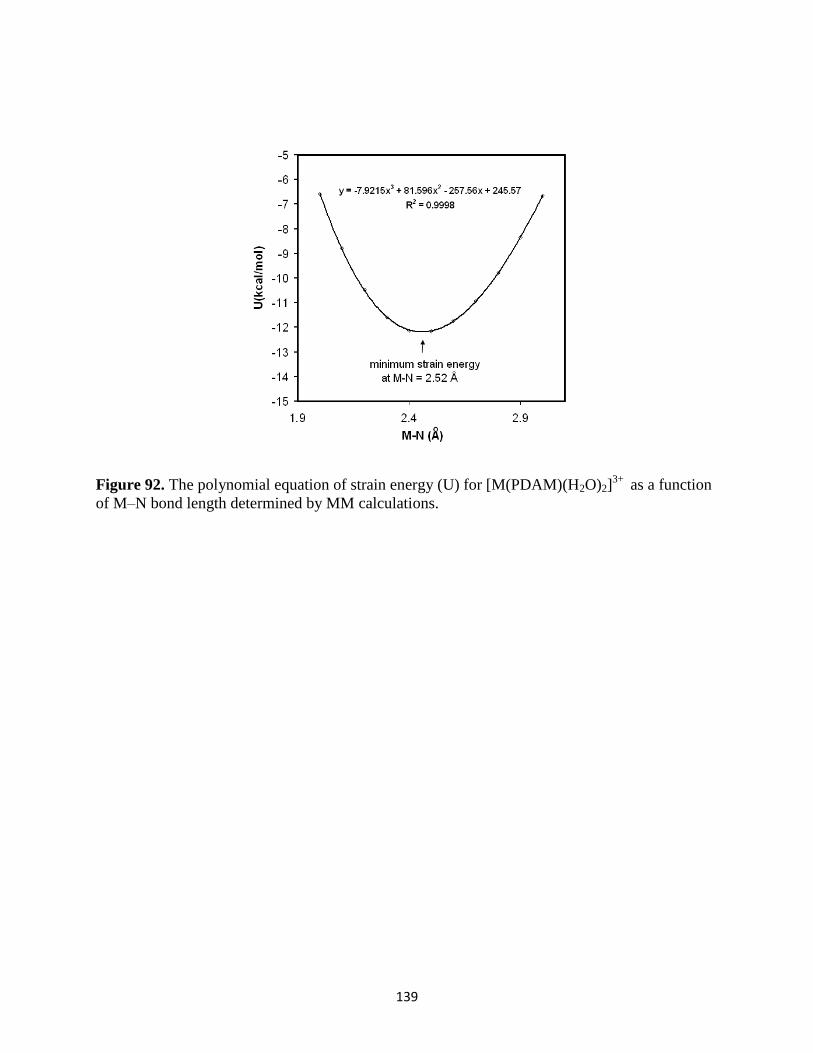
139
Figure 92. The polynomial equation of strain energy (U) for [M(PDAM)(H2O)2]3+
as a function
of M–N bond length determined by MM calculations.
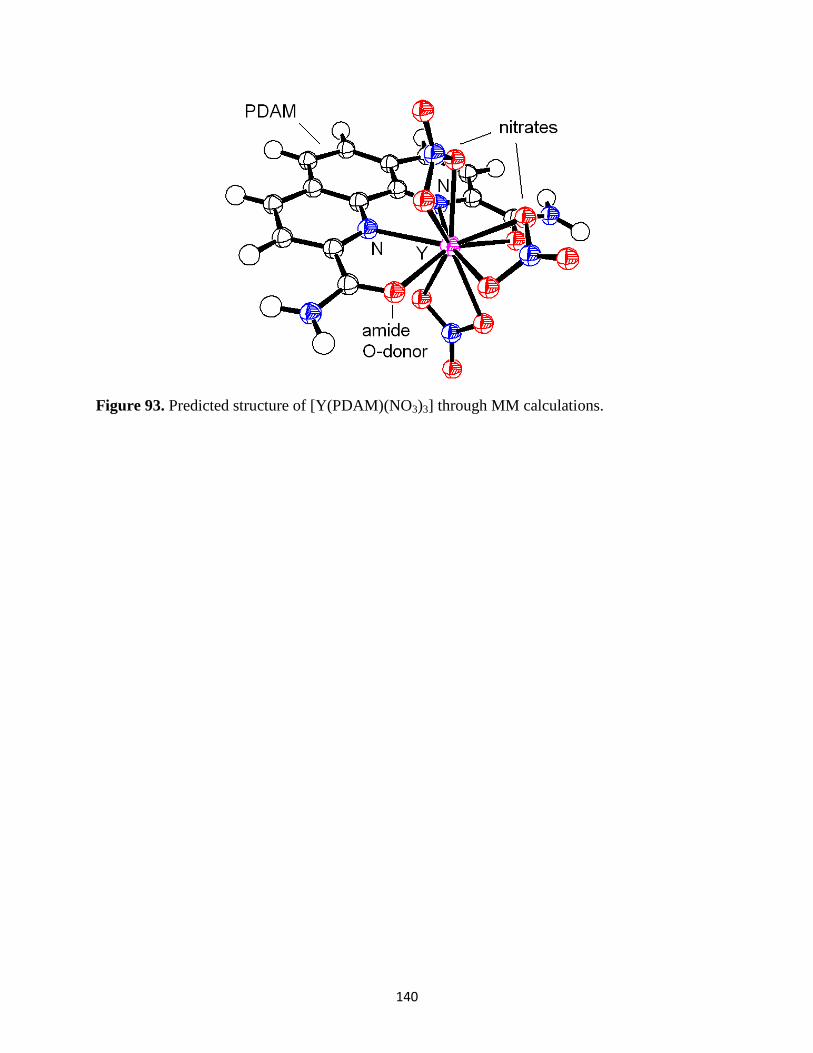
140
Figure 93. Predicted structure of [Y(PDAM)(NO3)3] through MM calculations.
141
CONCLUSIONS
The ligand 1,10-phenanthroline-2,9-dicarboxamide, (PDAM) shows great promise as an
solvent extractant for the separation of spent nuclear waste. The method of ligand design as a
means to create a highly selective ligand has proven to be successful. This ability to have
PDAM selectively bind to a specific metal ion in solution is of great importance in nuclear
industry. The qualities in ligand design such as the strong 1,10 phen backbone to aid in
preorganization, chelate rings size, amide groups which aid in donor atom selection, and rigidity
all facilitate in the complexation of a metal ion that possesses a large ionic radius and higher
charge.
PDAM was synthesized according to the literature method with moderate changes in
overall reaction times. This ligand was confirmed by the characterization of NMR and IR and
UV spectroscopy. By the utilization of the UV/Vis absorption spectroscopy the detection of the
complexation of metals in solution as a function of concentration was concluded to be a
successful method.
PDAM shows a reasonably strong size-based selectivity in that the log K1 values of the
PDAM complexes of Ni(II) and Zn(II) are small values with log K1=3.06 and 3.77 respectively.
The somewhat larger metal ions like In(III), Bi(III), and Cd(II) all have a very high log K1
values. The sharp band at 250 nm in the electronic spectra of the PDAM complexes appears to be
a good indicator of whether the metal is able to coordinate with all four donor atoms of PDAM
simultaneously.
PDAM complexes of the lanthanides have shown to have a small deviation in log K1 in
passing from La(III) to Lu(III) averaging a log K1 = 4.0. The small change in formation constants
142
is explained in terms of the idea that neutral O-donors stabilize the complexes of the large La(III)
ion more than the smaller Lu(III) ion, offsetting the greater affinity of Lu(III) than La(III) for N-
donor ligands.
The very low proton affinity of PDAM is also an important factor in extracting metal ions
from acidic solutions as shown in the degradation experiment. The fluorescent properties of
PDAM may also prove to be useful in monitoring metal ion extraction.
143
REFERENCES
1) Nash, K. L.; Madic, C.; Mathur, J. N.; Lacquement, J. in The chemistry of the actinide
and transactinide elements, 3rd ed. Eds. Morss, L.R.; Edelstein, N.M.; Fuger, J.
Springer: Netherlands. 2006, 4, 2622.
2) Anderson, C. L. “Single Cycle Irradiated Fuel Reprocessing.” Patent 3,350,782. 15
December 1965.
3) Diamond, R. M.; Street, K.; Seaborg, G. T. J. Amer. Chem. Soc. 1954, 76, 1461.
4) L.Petit, C. ADamo and P. Madivi, Inorg. Chem. 2006, 45, 8517.
5) Morss, L. R., Rogers, R. D.: Inorg. Chim. Acta. 1997, 255, 193.
6) Ensor, D. D.: Jarvinen, G.D., Smith, B. F.: Solvent Extr. Ion Exch. 1988, 6, 439.
7) Musikas, C.: Inorg. Chim. Acta. 1987, 140, 197.
8) Madic, C., Judson, M.J.: Reprot EUR 18038 EN, 1998.
9) Hudson, M. J., Boucher, C.E., Braekers, D., Desreux, J.F., Drew, M. G. B., Foreman,
M.R., Harwood, L. M. St. J., Hill, C., Madic, C., Marken, F. New J. Chem. 2006, 30,
1171.
10) Foreman, M.R.S., Hudson, M.J., Drew, M.G.B., Hill, C., Madic, C. Dalton Trans. 2006,
45, 1645.
11) Melton, D. L.; VanDerveer, D. G.; Hancock, R. D. Inorg. Chem. 2006, 45, 9306.
12) Hancock, Robert D. Chelate ring size and metal ion selection. Journal of Chemical
Education. 1992, 69, 615-620.
13) Hancock, R. D.; Martell, A.E. Chem. Rev. 1989, 89, 1875.
14) Pearson, Ralph G. Hard and soft acids and bases. J. Am. Chem. Soc. 1963, 85, 3533-
3539.
15) Hancock R. D., Martell, A.E.: Chem. Rev. 1989, 89, 1875.
16) Martell, Arthur E., and Hancock Robert D. Metal Complexes in Aqueous Solutions. New
York and London: Plenum Press, 1996.
17) Dean, N. E.; Hancock, R. D.; Cahill, C. L.; Frisch, M. Inorg. Chem. 2008, 47, 2000.
18) Cockrell, G. M.; Zhang, G.; VanDerveer, D. G.; Thummel, R. P.; Hancock, R. D. J.
Amer. Chem. Soc. 2008, 130, 1420.
19) Raymond T. Gephart III, Neil J. Williams, Joseph H. Reibenspies, Alvaro S. De Sousa,
and Robert D. Hancock, Inorg. Chem., in the press.
20) Cram, D. J., Kaneda, T., Helgeson, R. C., Brown, S.B., Knobler, C.B., Maverick, E.,
Trueblood, K.N.: J. Amer. Chem. Soc. 1985, 107, 3645.
21) Marita Makela, Lian Zhang, Krister Zetterberg, Sverker Hansson. Synthetic
Communications. 1992, 2811-2814.
22) Christopher J. Chandler, Leslie W. Deady, James A. Reiss. Heterocyclic Chem. 1981, 18,
599.
23) Hancock, R. D., Melton, D. L., Harrington, J. M., McDonald, F. C., Gephart, R. T.,
Boone, L. L., Jones, S. B., Dean, N. E., Whitehead, J. R., Cockrell, G. M.: Coord. Chem.
Rev. 2007, 251, 1678.
24) FluorEssence program, version 2.1, HORIBA Jobin Yvon, Inc., 3880 Park Avenue,
Edison, NJ, 08820-3012, United States of America.
25) HyperChem program, version 7.5, Hypercube, Inc., 419 Philip Street, Waterloo, Ontario,
N2L 3X2, Canada.
144
26) Martell, A. E., Smith, R. M.: Critical Stability Constant Database, No. 46, National
Institute of Science and Technology (NIST): Gaithersburg, MD, USA, 2003.
27) Williams, N. J., Dean, N. E., VanDerveer, D. G., Luckay, R. C., Hancock, R. D.: Inorg.
Chem. 2009, 48, 7853.
28) Burdette, S. C., Lippard, S. J. Coord. Chem. Rev. 2001, 333, 216-217.
29) Thompson, R. B., Bozym, R. A., Cramer, M. L., Stoddard, A. K., Westerberg, N. M.,
Fierke, C. A. Fluoresc. Sens. Biosens. 2006, 107.
30) Gephart, R. T. III, Williams, N. J., Reibenspies, J. H., De Sousa, A. S., Hancock, R. D.:
Inorg. Chem. 2009, 48, 8201.
31) ORTEP-3 for Windows, Version 1.08, Farrugia, L. J.: J. Appl. Crst. 1997, 30, 565.