Embed Size (px)
Citation preview
Turk J Chem30 (2006) , 361 – 382.c© TUBITAK
Metal Complexes of Schiff Bases: Preparation,
Characterization, and Biological Activity
Gehad Geindy MOHAMED, Mohamed Mohamed OMAR∗,Ahmed Mohamed HINDY
Cairo University, Department of Chemistry, Faculty of Science, Giza-EGYPTe-mail:[email protected]
Received 24.05.2005
Metal complexes of Schiff bases derived from 2-furancarboxaldehyde and o-phenylenediamine (L1),
and 2-thiophenecarboxaldehyde and 2-aminothiophenol (HL2) are reported and characterized based on
elemental analyses, IR 1H NMR, solid reflectance, magnetic moment, molar conductance, and thermal
analysis (TGA). The ligand dissociation, as well as the metal-ligand stability constants were calcu-
lated, pH-metrically, at 25 ◦C and ionic strength μ = 0.1 (1 M NaCl). The complexes are found to
have the formulae [M(L1)(H2O)2](Cl)n·yH2O (where M = Fe(III), Ni(II), Cu(II); n = 2-3, y = 2-4);
[M(L1)](X)2·yH2O (where M = Co(II), Zn(II), UO2(II), X = Cl, AcO or NO3, y = 1-3); [M(L2)2]·yH2O
(where M = Co(II), Ni(II), Cu(II); X = Cl; y = 0-2 and Zn(II); X = AcO, y = 0); and [Fe(L2)2]Cl·2H2O
and [UO2(HL2)2](NO3)2. The molar conductance data reveal that all the metal chelates of the L1 ligand,
and Fe(III) and UO2(II) chelates of HL2 are electrolytes, while Co(II), Ni(II), Cu(II), and Zn(II) chelates
of HL2 are non-electrolytes. IR spectra show that L1 is coordinated to the metal ions in a tetradentate
manner, with ONNO donor sites of azomethine–N and furan-O, whereas the HL2 ligand is coordinated
to the metal ions in a terdentate manner with SNS donor sites of azomethine–N , thiophene-S, and
thiol-S. From the magnetic and solid reflectance spectra, it is found that the geometrical structures of
these complexes are octahedral and tetrahedral. The thermal behavior of these chelates shows that the
hydrated complexes lose water molecules of hydration in the first step and is immediately followed by de-
composition of the anions and ligand molecules in the subsequent steps. The activation thermodynamic
parameters, such as E*, ΔH*, ΔS*, and ΔG*, are calculated from the DrTG curves using the Coats-
Redfern method. The synthesized ligands, in comparison to their metal complexes, were also screened
for their antibacterial activity against bacterial species, Escherichia coli, Pseudomonas aeruginosa, and
Staphylococcus Pyogones, as well as fungi (Candida). The activity data show the metal complexes to be
more potent antibacterials than the parent Schiff base ligand against one or more bacterial species.
Key Words: 2-thiophenecarboxaldehyde, 2-furancarboxaldehyde, 2-aminothiophenol, o-phenylenediamine,
transition metal complexes, stability constants, IR, 1H NMR, conductance, solid reflectance, magnetic
moment, thermal analysis, biological activity.
∗Corresponding author
361
Metal Complexes of Schiff Bases:..., G. G. MOHAMED, et al.,
Introduction
A large number of Schiff bases and their complexes have been studied for their interesting and important
properties, e.g., their ability to reversibly bind oxygen1, catalytic activity in hydrogenation of olefins2 and
transfer of an amino group3, photochromic properties4 , and complexing ability towards some toxic metals5.The high affinity for the chelation of the Schiff bases towards the transition metal ions is utilized in preparingtheir solid complexes.
Schiff base derived from the reaction of 2,5-thiophenedicarboxaldehyde and o-amino-benzenethiol gives
2,5-bis(benzothiazolidin-2-yl)thiophene(I). Schiff base reacted as a neutral ligand with Pb(II) and a dianion
with Cu(II), Ag(I), Cd(II), Pb(II), and Zn(II). The behavior of (I) with Hg(II), Ru(II), Pt(II), Rh(III), and
Ni(II) involved the opening of the thiazoline rings of the ligand6.
The condensation of o-aminothiophenol with 2-thiophenecarboxaldehyde yields 2-thiazolin-2-ylthiop-hene, rather than the expected Schiff base. However, upon reaction with metal ions, the thiazoline rearranged
to the expected thiolate Schiff base. Complexes of Schiff base with Ni(II),Cu(II), Zn(II), Cd(II), Pb(II),
Ag(I), and Pd(II) were isolated and characterized7 .
MLL1 (M = Cu(II), Ni(II); HL = salicylideneamine; HL1 = 1-(2-hydroxyphenyl)ethyliden-eamine),
ML1L2(HL2 = 2-hydroxy-1-naphthylmethyleneamine), and MLL2reacted with 2-amino-benzenethiol to give
Cu2L32 (H2L3 = N-(2-mercaptophenyl)salicylaldimine (SMAH), N-(2-mercaptophenyl)-2-hydroxy-1- naph-
thylmethyleneamine (NMAH), NiL3(AMA) (AMAH = N-(2-mercaptophenyl)-1-(2-hydroxyphenyl)ethylide-
neamine) and Ni(SMA)(NMA). The complexes were characterized by IR, reflectance spectra, and TGA8.
Schiff base9 derived from the reaction of the aldehydes, 3-hydroxybenzaldehyde and
5-nitrosalicylaldehyde, with the amines, aniline and o-aminothiophenol, and their complexes with
VO(II), Co(II), and Ni(II), were prepared and characterized by elemental analyses, magnetic measurement,
and electronic absorption data.
Complexes of Ni(II), Co(II), Cu(II), Zn(II), Pd(II), and Pb(II) with Schiff base derived from isatin with
2-aminothiophenol (HIATP) were synthesized and characterized by elemental analyses, molar conductance,
magnetic moments, 1H NMR, IR, and electronic spectra studies10.
Spectroscopic investigation of some thio-Schiff bases of 2-aminothiophenol with benzaldehyde deriva-
tives has been described11 . Chemical shifts of the different types of protons in the NMR spectra of theprepared Schiff bases were also reported.
Schiff bases derived from 5-nitrosalicylaldehyde and the amines, o- and p-aminophenols, o-aminothiop-henol, and sulfanilic acid were prepared and their complexes were characterized by IR, electronic absorption,
ESR spectra, and magnetic and conductance measurements12 . The complexes were tested for antibacterialactivity against common pathogenic organisms and showed mild to moderate activity.
Schiff bases derived from ethylene-2,2‘-(dioxydibenzenaldehyde) and 2-aminothiophenol and its com-
plexes with Ni(II), Cu(II), and Cd(II) were synthesized and characterized by elemental analyses, IR, UV/VIS
spectra, and conductance measurements13.
Synthesis, spectroscopic characterization, redox, and biological screening studies of some Schiff
bases transition metal(II) complexes derived from salicylidene-4-aminoantipyrine and 2-aminophenol, 2-
aminothiophenol were studied by Raman et al.14.
Schiff bases, 2,5-bis[formyl(2-hydroxyethylamine)]thiophene (H2L) and 2,5-bis[formyl] (2-mercaptoani-
362
Metal Complexes of Schiff Bases:..., G. G. MOHAMED, et al.,
line)thiophene (H2L‘) were prepared and their Cu(II) complexes were also prepared and characterized by
elemental analyses, IR, 1H NMR, and conductance and magnetic susceptibility15.
Experimental
Materials and Reagents
All chemicals used were of analytical reagent grade (AR) and of the highest purity available. They in-
cluded 2-thiophenecarboxaldehyde (Sigma), 2-furancarboxaldehyde (Sigma), o-phenylenediamine (Aldrich),
2-aminothiophenol (Sigma), copper(II) acetate dihydrate (Prolabo), cobalt(II) and nickel(II) chloride hex-
ahydrates (BDH), zinc acetate dihydrate (Ubichem), uranyl nitrate hexahydrate (Sigma), ferric chloride
hexahydrate (Prolabo), zinc oxide, disodium salt of ethylenediaminetetraacetic acid (EDTA) (Analar), am-
monia solution (33% v/v), and ammonium chloride (El-Nasr Pharm. Chem. Co., Egypt). The organic
solvents used included absolute ethyl alcohol, diethylether, and dimethylformamide (DMF). These solvents
were either spectroscopically pure from BDH or purified by the recommended methods16 and tested fortheir spectral purity. In addition, hydrogen peroxide, sodium chloride, sodium carbonate, sodium hydrox-
ide (A.R.), and hydrochloric and nitric acids (Merck) were used. De-ionized water collected from all-glass
equipment was normally used in all preparations.
Solutions
Fresh stock solutions of 1 x 10⁻³M ligands, L1 and HL2, were prepared by dissolving the accurately weighed
amount of L1 (0.264 g/L) and HL2 (0.219 g/L) in the appropriate volume of absolute ethanol. Then 1 x
10−3M stock solutions of the metal salts (Fe(III), 0.271 g/L; Co(II), 0.238 g/L; Ni(II), 0.238 g/L; Cu(II),
0.218 g/L; Zn(II), 0.219 g/L; UO2(II), 0.50 g/L) were prepared by dissolving accurately weighed amounts
of the metal salts in appropriate volumes of de-ionized water. The metal salt solutions were standardized
by the recommended procedures17 . Dilute solutions of the metal ions and Schiff bases under study of 2.5 x
10−6 M, 1 x 10⁻⁶ M, 2.5 x 10⁻⁵M, 1 x 10⁻⁵ M, and 1 x 10⁻⁴ M were prepared with accurate dilution.
For potentiometric studies, all solutions of the metal ions were prepared by dissolving the calculatedamount of their salts in the least amount of water possible; then ethanol was added to the appropriatevolume. Standard 0.1 N sodium carbonate solution was prepared from dried sodium carbonate. 0.10 Nhydrochloric acid was prepared and standardized using sodium carbonate. 1.00 M sodium chloride solutionwas also prepared. A 1:1 sodium hydroxide solution was prepared from A.R. product and stored in a wellsteamed, waxed tall glass cylinder for several days, with occasional shaking to obtain a carbonate-free sodium
hydroxide solution. The clear solution was filtered through a sintered glass funnel (G4). Solutions of required
molarity were prepared by dilution and then standardized by the recommended procedure17 .
Instruments
The spectrophotometric measurements in solution were carried out using an automated spectrophotometer
UV/VIS Perkin-Elmer Model Lambda 20, and ranged from 200 to 900 nm. pH measurements were per-
formed using a Metrohm 716 DMS Titrino connected to a Metrohm 728 Stirrer. The molar conductance of
solid complexes in DMF was measured using a Sybron-Barnstead conductometer (Meter-PM.6, E = 3406).
363
Metal Complexes of Schiff Bases:..., G. G. MOHAMED, et al.,
Elemental microanalyses of the separated solid chelates for C, H, N, and S were performed in the Micro-analytical Center, Cairo University. The analyses were repeated twice to check the accuracy of the data.Infrared spectra were recorded on a Perkin-Elmer FT-IR type 1650 spectrophotometer in wavenumber region
4000-200 cm−1. The spectra were recorded as KBr pellets. The solid reflectance spectra were measured on aShimadzu 3101pc spectrophotometer. The molar magnetic susceptibility was measured on powdered samples
using the Faraday method. The diamagnetic corrections were made by Pascal’s constant and Hg[Co(SCN)4]
was used as the calibrant. The thermogravimetric analysis (TGA and DrTGA) was carried out in a dynamic
nitrogen atmosphere (20 mL.min−1), with a heating rate of 10 ◦C min−1 using Shimadzu TGA-50H thermal
analyzers. The mass spectra were recorded by the EI technique at 70 eV wıth a Hewlett-Packard MS-5988
GS-MS instrument in the Microanalytical Center of Cairo University. The 1H NMR spectra were recordedusing 300 MHz Varian-Oxford Mercury.
Procedures
Potentiometric Measurements
The potentiometric measurements were obtained at 25 ◦C and ionic strength μ = 0.1 by addition ofappropriate amounts of 1 M sodium chloride solution. The pH-meter was calibrated before each titration
using standard buffers. The ionization constants of the investigated Schiff base (HL2) and the stability
constants of its metal chelates with Fe(III), Co(II), Ni(II), Cu(II), Zn(II), and UO2(II) ions were determined
potentiometrically as described by Sarin and Munshi18. For this purpose, 3 solution mixtures of 50 mL wereprepared. Thus,
A) 3 mL of standard HCl (around 0.10 M) + 5 mL 1 M NaCl + 25 mL ethanol, and the volume was
completed up to 50 mL with distilled water.
B) 3 mL of 0.10 M HCl + 5 mL 1 M NaCl + 20 mL 0.001 M of ethanolic solution of the Schiff base (HL2),
and the volume was completed up to 50 mL with distilled water.
C) 3 mL of 0.10 M HCl + 5 mL 1 M NaCl + 20 mL 0.001 M of ethanolic solution of the Schiff base + 5
mL 0.001 M metal ion solution, and the volume being completed to 50 mL with distilled water.
The above 3 mixtures were titrated potentiometrically against standard sodium hydroxide solution
(0.10 M). The molarities of HCl and NaOH were checked every day before the titrations. The appropriate
volume of ethanol was added so as to keep a constant 50% ratio (v/v), ethanol/water, to ensure the complete
solubility of the Schiff bases during the titration. The 3 curves obtained are referred to as: (A) acid titration
curve, (B) ligand titration curve, and (C) complex titration curve.
Synthesis of Schiff base (L1)19
A hot solution (60 ◦C) of o-phenylenediamine (1.08 g, 10 mmol) was mixed with a hot solution (60 ◦C) of
2-furancarboxaldehyde (1.92 g, 20 mmol) in 50 mL of ethanol. The resulting mixture was left under reflux
for 2 h and the solid product formed was separated by filtration, purified by crystallization from ethanol,washed with diethyl ether, and then dried in a vacuum over anhydrous calcium chloride. The yellow product
is produced in 80% yield.
364
Metal Complexes of Schiff Bases:..., G. G. MOHAMED, et al.,
Synthesis of Schiff base (HL2) 20,21
A hot solution (60 ◦C) of 2-aminothiophenol (2.50 g, 10 mmol) in 25 mL of ethanol was mixed with a
hot solution (60 ◦C) of 2-thiophenecarboxaldehyde (2.24 g, 10 mmol) in the same solvent and the reaction
mixture was left under reflux for 2 h. The solid product formed was separated by filtration, purified bycrystallization from ethanol, washed with diethyl ether, and then dried in a vacuum over anhydrous calcium
chloride. The yellow Schiff base product, HL2, is produced in 80% yield.
Synthesis of metal complexes
The metal complexes of the Schiff bases, L1 and HL2, were prepared by the addition of a hot solution (60◦C) of the appropriate metal chloride, nitrate, or acetate (1 mmol) in an ethanol-water mixture (1:1, 25 mL)
to the hot solution (60 ◦C) of the Schiff bases (0.264 g L1 and 0.219 g HL2, 2 mmol) in the same solvent (25
mL). The resulting mixture was stirred under reflux for 1 h whereupon the complexes precipitated. They
were collected by filtration, washed with a 1:1 ethanol-water mixture and diethyl ether. The analytical datafor C, H, N, and S were repeated twice.
Biological Activity
A 0.5 mL spore suspension (10−6-10−7 spore/mL) of each of the investigated organisms was added to a
sterile agar medium just before solidification, then poured into sterile petri dishes (9 cm in diameter) and
left to solidify. Using a sterile cork borer (6 mm in diameter), 3 holes (wells) were made in each dish, and
then 0.1 mL of the tested compounds, dissolved in DMF (100 μg/mL), was poured into these holes. Finally,
the dishes were incubated at 37 ◦C for 48 h. Then clear or inhibition zones were detected around each hole.DMF alone (0.1 mL) was used as a control under the same condition for each organism, and, by subtracting
the diameter of inhibition zone resulting with DMF from that obtained in each case, both antibacterial
activities were calculated as a mean of 3 replicates22,23.
Results and Discussion
Schiff bases characterization
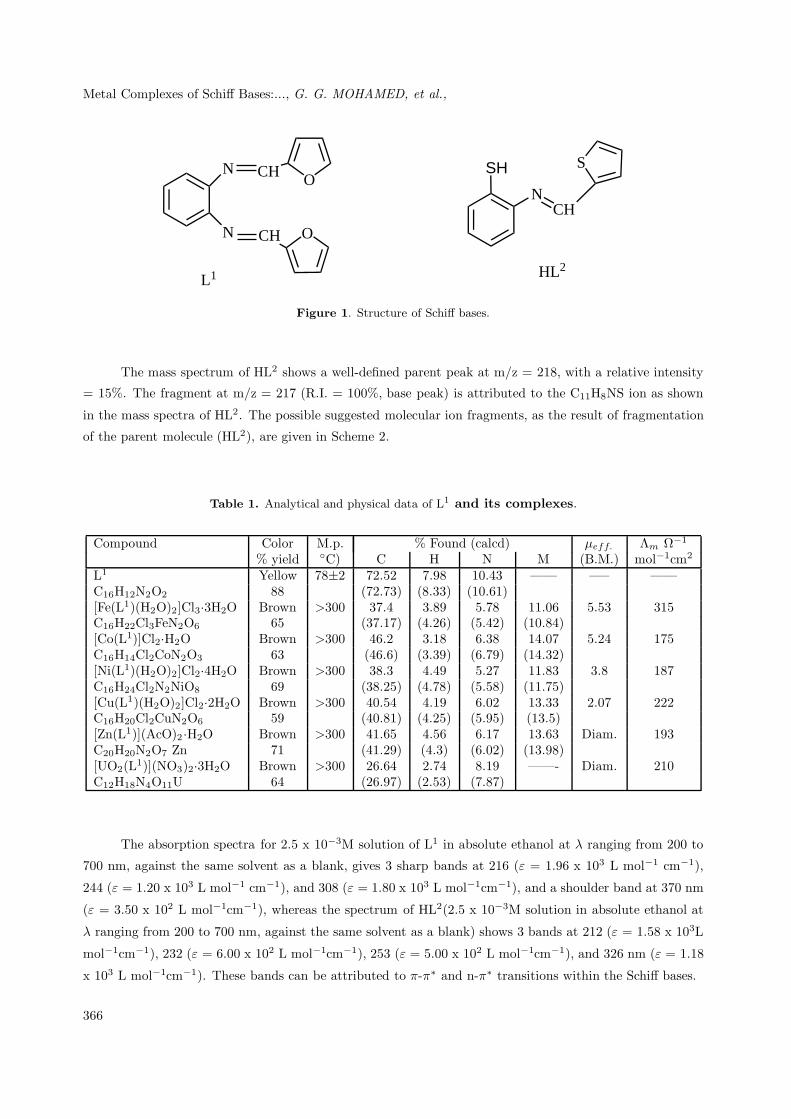
The Schiff bases, L1 and HL2, are subjected to elemental analyses. The results of elemental analyses (C, H,
N, S) with molecular formulae and the melting points are presented in Tables 1 and 2. The results obtained
are in good agreement with those calculated for the suggested formulae and the melting points are sharp,indicating the purity of the prepared Schiff bases. The structures of the Schiff bases under study are given
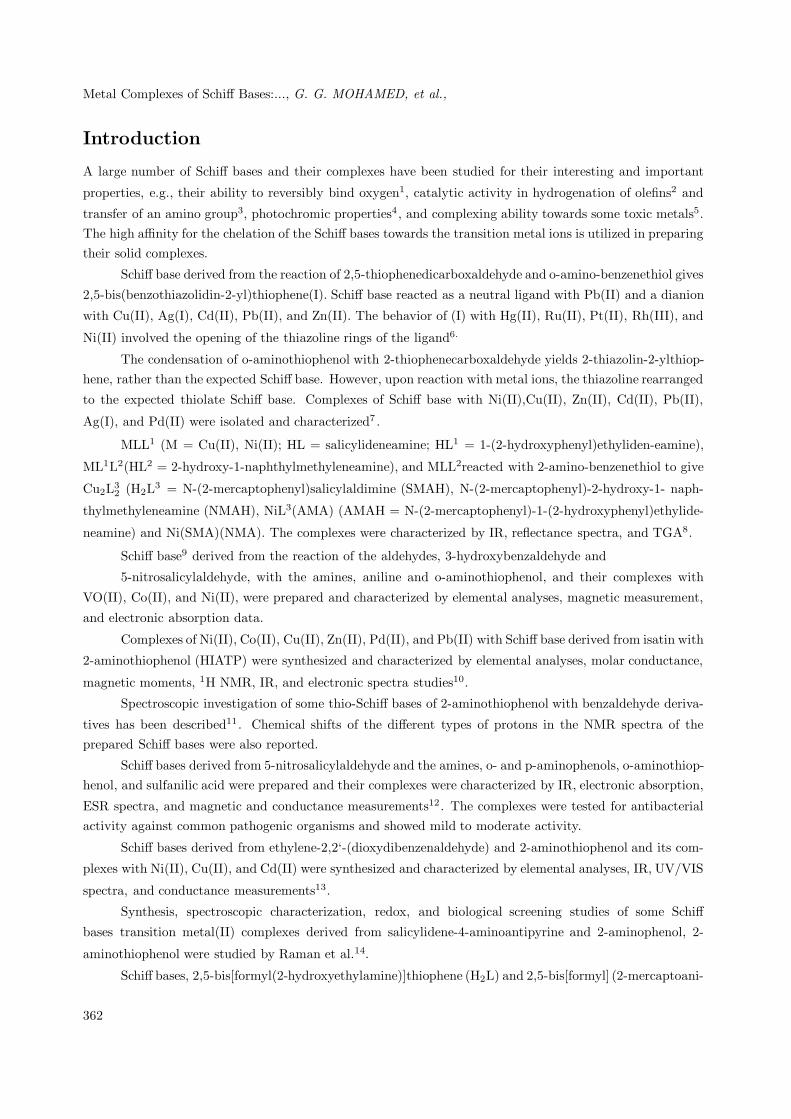
below (Figure 1).
The structure of these Schiff bases is also confirmed by IR and 1H NMR spectra, which will bediscussed in a detailed manner, along with metal complexes, later. The electron impact mass spectra of
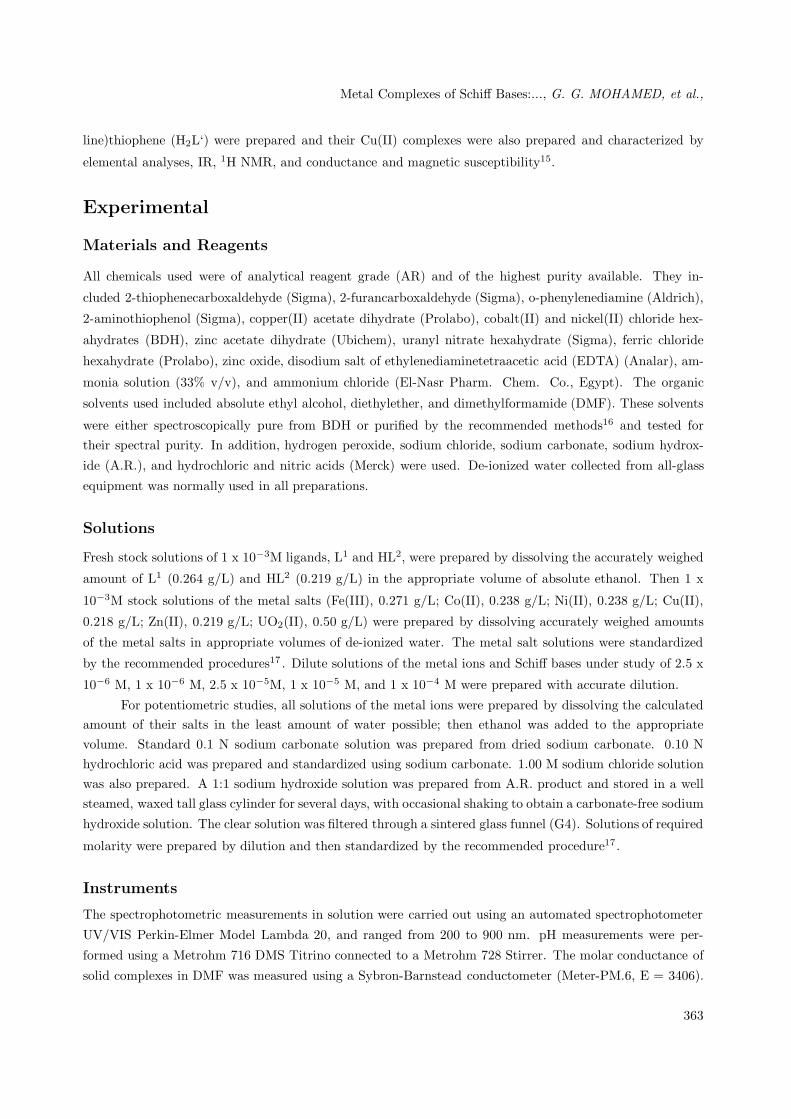
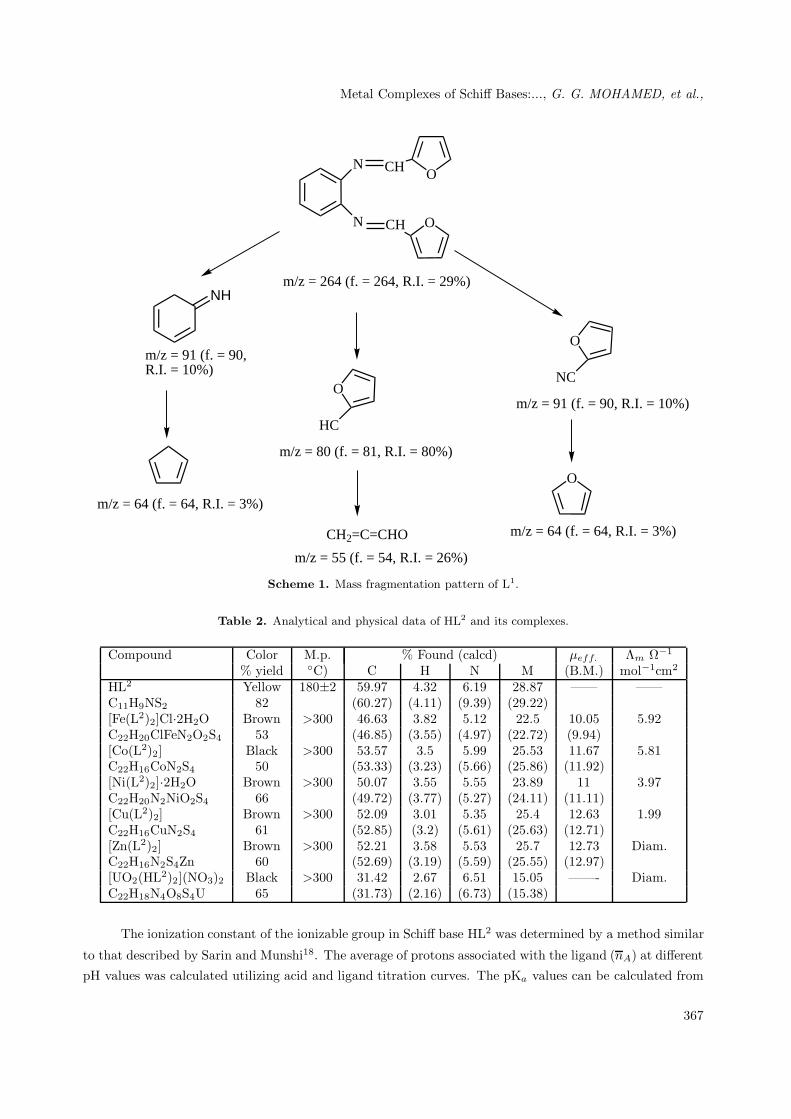
L1 and HL2were recorded and investigated at 70 eV of electron energy. The mass spectrum of L1 shows
a well-defined parent peak at m/z = 264 (M+), with a relative intensity = 29%. The parent ion and the
fragments obtained by cleavage in different positions in the L1 molecule are shown in Scheme 1.
365
Metal Complexes of Schiff Bases:..., G. G. MOHAMED, et al.,
N
N OCH
OCH
N
SH
CH
S
L1 HL2
Figure 1. Structure of Schiff bases.
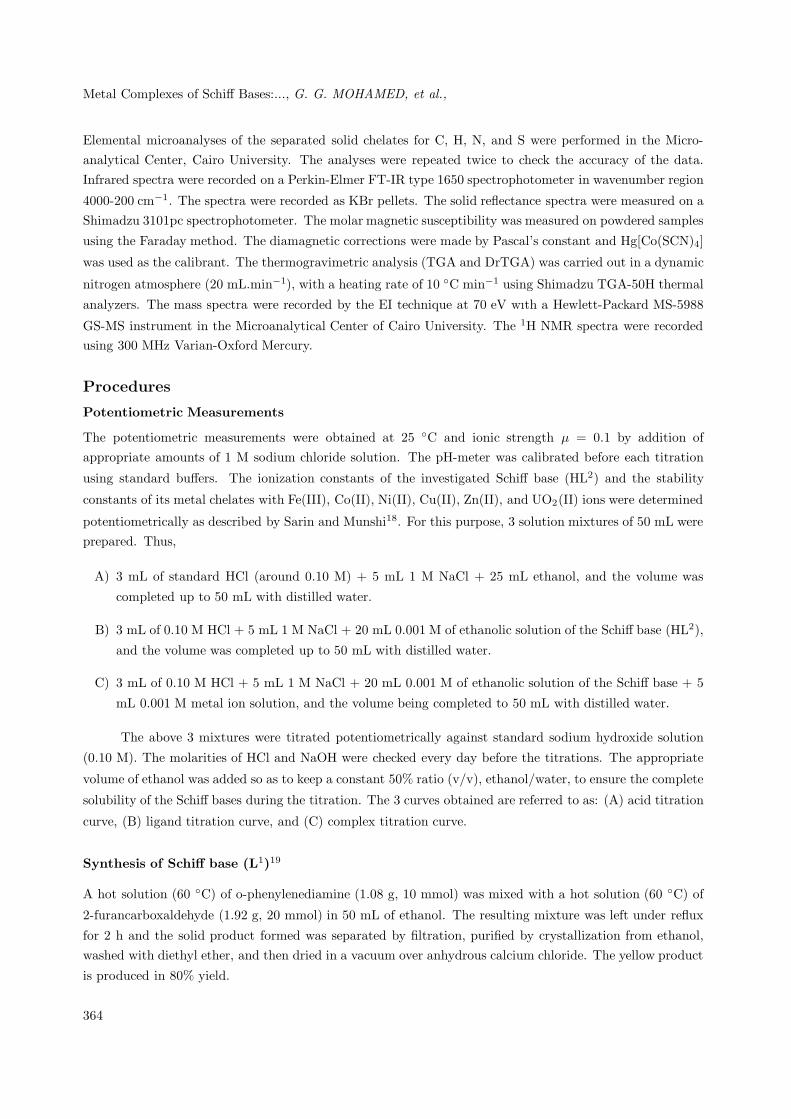
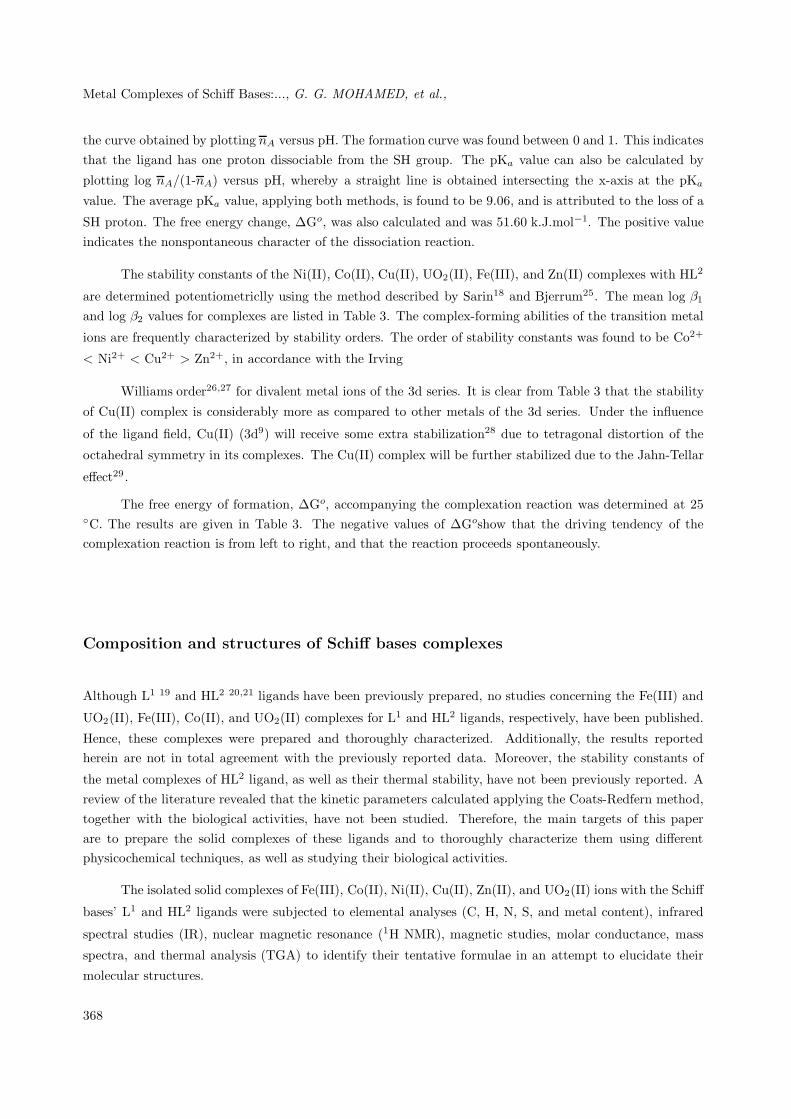
The mass spectrum of HL2 shows a well-defined parent peak at m/z = 218, with a relative intensity
= 15%. The fragment at m/z = 217 (R.I. = 100%, base peak) is attributed to the C11H8NS ion as shown
in the mass spectra of HL2. The possible suggested molecular ion fragments, as the result of fragmentation
of the parent molecule (HL2), are given in Scheme 2.
Table 1. Analytical and physical data of L1 and its complexes.
Compound Color M.p. % Found (calcd) μeff. Λm Ω−1
% yield ◦C) C H N M (B.M.) mol−1cm2
L1 Yellow 78±2 72.52 7.98 10.43 —— —– ——C16H12N2O2 88 (72.73) (8.33) (10.61)[Fe(L1)(H2O)2]Cl3·3H2O Brown >300 37.4 3.89 5.78 11.06 5.53 315C16H22Cl3FeN2O6 65 (37.17) (4.26) (5.42) (10.84)[Co(L1)]Cl2·H2O Brown >300 46.2 3.18 6.38 14.07 5.24 175C16H14Cl2CoN2O3 63 (46.6) (3.39) (6.79) (14.32)[Ni(L1)(H2O)2]Cl2·4H2O Brown >300 38.3 4.49 5.27 11.83 3.8 187C16H24Cl2N2NiO8 69 (38.25) (4.78) (5.58) (11.75)[Cu(L1)(H2O)2]Cl2·2H2O Brown >300 40.54 4.19 6.02 13.33 2.07 222C16H20Cl2CuN2O6 59 (40.81) (4.25) (5.95) (13.5)[Zn(L1)](AcO)2 ·H2O Brown >300 41.65 4.56 6.17 13.63 Diam. 193C20H20N2O7 Zn 71 (41.29) (4.3) (6.02) (13.98)[UO2(L1)](NO3)2·3H2O Brown >300 26.64 2.74 8.19 ——- Diam. 210C12H18N4O11U 64 (26.97) (2.53) (7.87)
The absorption spectra for 2.5 x 10⁻³M solution of L1 in absolute ethanol at λ ranging from 200 to
700 nm, against the same solvent as a blank, gives 3 sharp bands at 216 (ε = 1.96 x 10³ L mol−1 cm−1),
244 (ε = 1.20 x 10³ L mol−1 cm−1), and 308 (ε = 1.80 x 10³ L mol−1cm−1), and a shoulder band at 370 nm
(ε = 3.50 x 10² L mol−1cm−1), whereas the spectrum of HL2(2.5 x 10⁻³M solution in absolute ethanol at
λ ranging from 200 to 700 nm, against the same solvent as a blank) shows 3 bands at 212 (ε = 1.58 x 10³L
mol−1cm−1), 232 (ε = 6.00 x 10² L mol−1cm−1), 253 (ε = 5.00 x 10² L mol−1cm−1), and 326 nm (ε = 1.18
x 103 L mol−1cm−1). These bands can be attributed to π-π∗ and n-π∗ transitions within the Schiff bases.
366
Metal Complexes of Schiff Bases:..., G. G. MOHAMED, et al.,
N
N OCH
OCH
NH
O
NC
O
O
HC
m/z = 64 (f. = 64, R.I. = 3%)
m/z = 91 (f. = 90, R.I. = 10%)
m/z = 264 (f. = 264, R.I. = 29%)
m/z = 91 (f. = 90, R.I. = 10%)
m/z = 64 (f. = 64, R.I. = 3%)CH2=C=CHO
m/z = 55 (f. = 54, R.I. = 26%)
m/z = 80 (f. = 81, R.I. = 80%)
Scheme 1. Mass fragmentation pattern of L1.
Table 2. Analytical and physical data of HL2 and its complexes.
Compound Color M.p. % Found (calcd) μeff. Λm Ω−1
% yield ◦C) C H N M (B.M.) mol−1cm2
HL2 Yellow 180±2 59.97 4.32 6.19 28.87 —— ——C11H9NS2 82 (60.27) (4.11) (9.39) (29.22)[Fe(L2)2]Cl·2H2O Brown >300 46.63 3.82 5.12 22.5 10.05 5.92C22H20ClFeN2O2S4 53 (46.85) (3.55) (4.97) (22.72) (9.94)[Co(L2)2] Black >300 53.57 3.5 5.99 25.53 11.67 5.81C22H16CoN2S4 50 (53.33) (3.23) (5.66) (25.86) (11.92)[Ni(L2)2]·2H2O Brown >300 50.07 3.55 5.55 23.89 11 3.97C22H20N2NiO2S4 66 (49.72) (3.77) (5.27) (24.11) (11.11)[Cu(L2)2] Brown >300 52.09 3.01 5.35 25.4 12.63 1.99C22H16CuN2S4 61 (52.85) (3.2) (5.61) (25.63) (12.71)[Zn(L2)2] Brown >300 52.21 3.58 5.53 25.7 12.73 Diam.C22H16N2S4Zn 60 (52.69) (3.19) (5.59) (25.55) (12.97)[UO2(HL2)2](NO3)2 Black >300 31.42 2.67 6.51 15.05 ——- Diam.C22H18N4O8S4U 65 (31.73) (2.16) (6.73) (15.38)
The ionization constant of the ionizable group in Schiff base HL2 was determined by a method similar
to that described by Sarin and Munshi18. The average of protons associated with the ligand (nA) at different
pH values was calculated utilizing acid and ligand titration curves. The pKa values can be calculated from
367
Metal Complexes of Schiff Bases:..., G. G. MOHAMED, et al.,
the curve obtained by plotting nA versus pH. The formation curve was found between 0 and 1. This indicatesthat the ligand has one proton dissociable from the SH group. The pKa value can also be calculated by
plotting log nA/(1-nA) versus pH, whereby a straight line is obtained intersecting the x-axis at the pKa
value. The average pKa value, applying both methods, is found to be 9.06, and is attributed to the loss of a
SH proton. The free energy change, ΔGo, was also calculated and was 51.60 k.J.mol−1. The positive valueindicates the nonspontaneous character of the dissociation reaction.
The stability constants of the Ni(II), Co(II), Cu(II), UO2(II), Fe(III), and Zn(II) complexes with HL2
are determined potentiometriclly using the method described by Sarin18 and Bjerrum25. The mean log β1
and log β2 values for complexes are listed in Table 3. The complex-forming abilities of the transition metal
ions are frequently characterized by stability orders. The order of stability constants was found to be Co2+
< Ni2+ < Cu2+ > Zn2+, in accordance with the Irving
Williams order26,27 for divalent metal ions of the 3d series. It is clear from Table 3 that the stability
of Cu(II) complex is considerably more as compared to other metals of the 3d series. Under the influence
of the ligand field, Cu(II) (3d9) will receive some extra stabilization28 due to tetragonal distortion of the
octahedral symmetry in its complexes. The Cu(II) complex will be further stabilized due to the Jahn-Tellar
effect29 .
The free energy of formation, ΔGo, accompanying the complexation reaction was determined at 25◦C. The results are given in Table 3. The negative values of ΔGoshow that the driving tendency of thecomplexation reaction is from left to right, and that the reaction proceeds spontaneously.
Composition and structures of Schiff bases complexes
Although L1 19 and HL2 20,21 ligands have been previously prepared, no studies concerning the Fe(III) and
UO2(II), Fe(III), Co(II), and UO2(II) complexes for L1 and HL2 ligands, respectively, have been published.
Hence, these complexes were prepared and thoroughly characterized. Additionally, the results reportedherein are not in total agreement with the previously reported data. Moreover, the stability constants of
the metal complexes of HL2 ligand, as well as their thermal stability, have not been previously reported. Areview of the literature revealed that the kinetic parameters calculated applying the Coats-Redfern method,together with the biological activities, have not been studied. Therefore, the main targets of this paperare to prepare the solid complexes of these ligands and to thoroughly characterize them using differentphysicochemical techniques, as well as studying their biological activities.
The isolated solid complexes of Fe(III), Co(II), Ni(II), Cu(II), Zn(II), and UO2(II) ions with the Schiff
bases’ L1 and HL2 ligands were subjected to elemental analyses (C, H, N, S, and metal content), infrared
spectral studies (IR), nuclear magnetic resonance (1H NMR), magnetic studies, molar conductance, mass
spectra, and thermal analysis (TGA) to identify their tentative formulae in an attempt to elucidate their
molecular structures.
368

Metal Complexes of Schiff Bases:..., G. G. MOHAMED, et al.,
N
SH
CH
S
NC
S
S S
NCH
S S
NCH
S SCH
m/z = 109 (f. = 108, R.I. = 15%)
m/z = 219 (f. = 218, R.I. = 18%)
m/z = 83 (f. = 82, R.I. = 11%)
SC=CH-N=CH-CS
m/z = 128 (f. = 129, R.I. = 1%)
m/z = 75 (f. = 75, R.I. = 3%)
m/z = 218 (f. = 217,R.I. = 100%)
m/z = 190 (f. = 190, R.I. = 2%)
m/z = 58 (f. = 58, R.I. = 3%)
m/z = 108 (f. = 108, R.I. = 15%)
N=CH-CS
m/z = 71 (f. = 71, R.I. = 1%)
CH2=CS
Scheme 2. Mass fragmentation pattern of HL2.
Elemental analyses of the complexes
The results of elemental analyses, as shown in Tables 1 and 2, are in good agreement with those required bythe proposed formulae. The formation of these complexes may proceed according to the following equationsgiven below.
369
Metal Complexes of Schiff Bases:..., G. G. MOHAMED, et al.,
Table 3. Cumalative data of log β1 and log β2 values for complexes of HL2 with Fe(III), UO2(II), Co(II), Ni(II),
Cu(II), and Zn(II).
Logβ1 -ΔG◦ Logβ2 -ΔG◦
Ion (kJ.mol−1) Logβ2 (kJ.mol−1)A B C M A B C M
Fe(III) 10.20 10.05 9.90 10.05 57.32 18.91 18.80 19.80 19.10 108.9UO2(II) 10.23 10.22 10.10 10.18 58.06 19.14 19.10 20.20 19.70 112.4Co(II) 10.20 10.03 9.90 10.04 57.26 18.60 18.60 19.80 19.00 108.4Ni(II) 10.32 10.62 9.900 10.28 58.63 19.34 19.30 19.80 19.60 111.8Cu(II) 10.50 11.00 10.10 10.53 60.05 19.67 19.60 20.20 19.70 112.4Zn(II) 10.40 10.68 9.99 10.35 59.03 19.36 19.30 19.90 19.40 110.6
Where (A) Interpolation at half values method. (B) Correction-term method. (C) Mid-point method. (M) Mean.
For L1 ligand: MCln + L1 + 2H2O + yH2O → [M (L1)(H2O)2](Cl)n·yH2O
M = Fe(III), Ni(II), Cu(II); n = 2-3, y = 2-4.
MX2 + L1 + yH2O → [M(L1)](X)2·yH2O
M = Co(II), Zn(II), UO2(II), X = Cl, AcO or NO3, y = 1-3.
For HL2 ligand: MX2 + 2HL2 + yH2O → [M(L2)2]·yH2O + 2HX
M = Co(II), Ni(II), Cu(II); X = Cl; y = 0-2.
M = Zn(II); X = AcO, y = 0.
FeCl3 + 2HL2 + 2H2O → [Fe(L2)2]Cl·2H2O + 2HCl
UO2(NO3)2 + 2HL2 → [UO2(HL2)2](NO3)2
Molar conductivity measurements
By using the relation Λm= K/C, the molar conductance of the complexes (Λm) can be calculated, where
C is the molar concentration of the metal complex solutions. The chelates were dissolved in DMF and the
molar conductivities of 10−3 M of their solutions at 25 ± 2 ◦C were measured. Tables 1 and 2 show themolar conductance values of the complexes. It is concluded from the results that Fe(III) chelates of the L1
and HL2ligands are found to have molar conductance values of 315 and 98 Ω−1 mol−1 cm2, respectively,indicating the ionic nature of these complexes. Furthermore, it indicates the non-bonding of the chloride
anions to Fe(III). Consequently, the Fe(III) chelates are considered as 3:1 and 1:1 electrolytes with the L1
and HL2ligands, respectively. On the other hand, the molar conductivity values of Co(II), Ni(II), Cu(II),
and Zn(II) chelates with the L1 ligand under investigation are in the range of 175 - 235 Ω−1 mol−1 cm2,
respectively. It is obvious from these data that these chelates are ionic in nature and they are of the type 2:1
electrolytes. The molar conductivity values of the metal chelates of HL2 ligand (Λm = 8.97 -17.17 Ω−1 mol−1
cm2) indicate that these complexes are non-electrolytes. UO2(II) complexes of the L1 and HL2 ligands have
molar conductivity values in the range of 193-217 Ω−1mol−1cm2 (Tables 1 and 2). Based on these data, it
is clear that these chelates are considered as 2:1 electrolytes, indicating the ionic nature of the bonding of
the nitrate group to the cationic complex nucleus. According to previous data reported by Feng et al.19,
the Co(II), Ni(II), and Cu(II) complexes of L1 ligand are non-electrolytes, but the data listed in Table 1
indicate the electrolytic nature of these complexes.
370
Metal Complexes of Schiff Bases:..., G. G. MOHAMED, et al.,
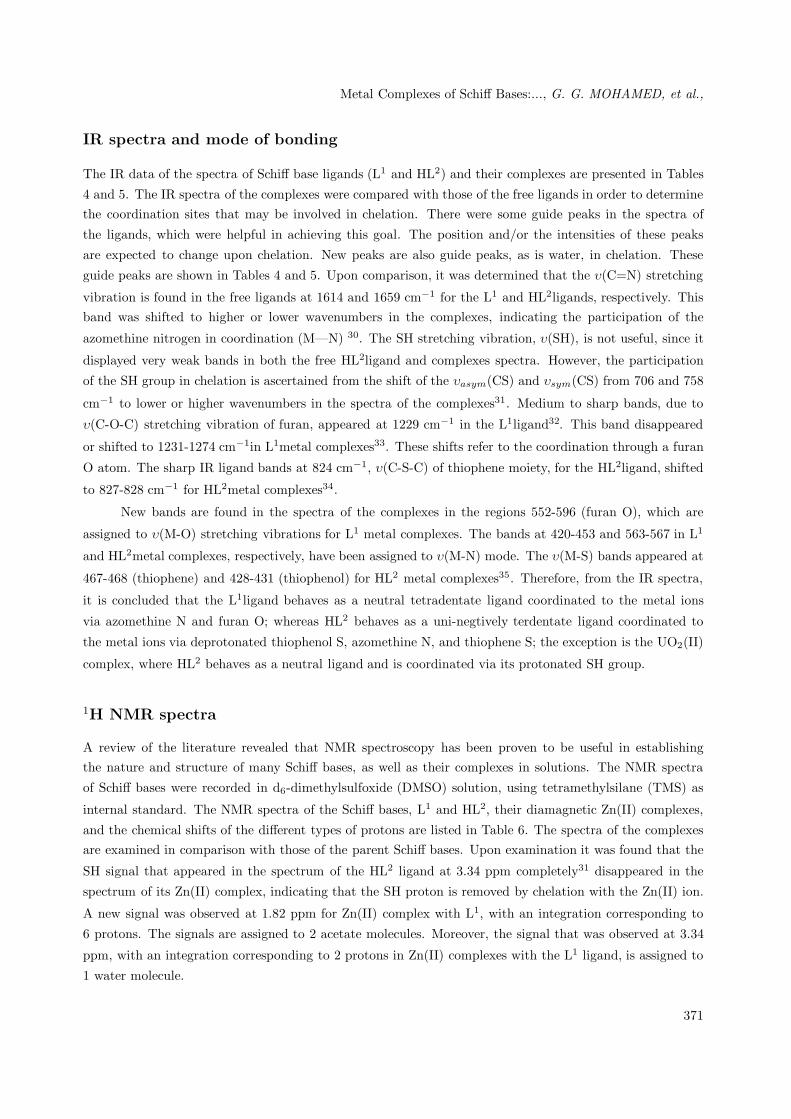
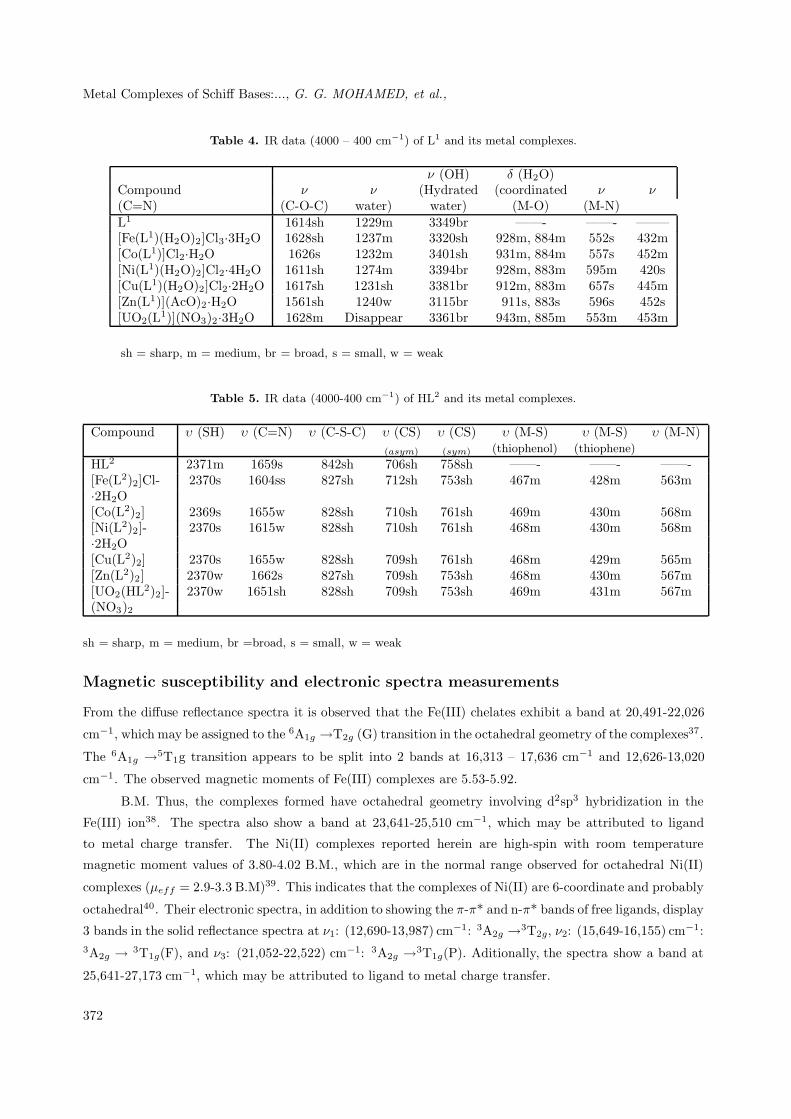
IR spectra and mode of bonding
The IR data of the spectra of Schiff base ligands (L1 and HL2) and their complexes are presented in Tables
4 and 5. The IR spectra of the complexes were compared with those of the free ligands in order to determinethe coordination sites that may be involved in chelation. There were some guide peaks in the spectra of
the ligands, which were helpful in achieving this goal. The position and/or the intensities of these peaks
are expected to change upon chelation. New peaks are also guide peaks, as is water, in chelation. These
guide peaks are shown in Tables 4 and 5. Upon comparison, it was determined that the υ(C=N) stretching
vibration is found in the free ligands at 1614 and 1659 cm−1 for the L1 and HL2ligands, respectively. Thisband was shifted to higher or lower wavenumbers in the complexes, indicating the participation of the
azomethine nitrogen in coordination (M—N) 30. The SH stretching vibration, υ(SH), is not useful, since it
displayed very weak bands in both the free HL2ligand and complexes spectra. However, the participation
of the SH group in chelation is ascertained from the shift of the υasym(CS) and υsym(CS) from 706 and 758
cm−1 to lower or higher wavenumbers in the spectra of the complexes31. Medium to sharp bands, due to
υ(C-O-C) stretching vibration of furan, appeared at 1229 cm−1 in the L1ligand32. This band disappeared
or shifted to 1231-1274 cm−1in L1metal complexes33. These shifts refer to the coordination through a furan
O atom. The sharp IR ligand bands at 824 cm−1, υ(C-S-C) of thiophene moiety, for the HL2ligand, shifted
to 827-828 cm−1 for HL2metal complexes34.
New bands are found in the spectra of the complexes in the regions 552-596 (furan O), which are
assigned to υ(M-O) stretching vibrations for L1 metal complexes. The bands at 420-453 and 563-567 in L1
and HL2metal complexes, respectively, have been assigned to υ(M-N) mode. The υ(M-S) bands appeared at
467-468 (thiophene) and 428-431 (thiophenol) for HL2 metal complexes35. Therefore, from the IR spectra,
it is concluded that the L1ligand behaves as a neutral tetradentate ligand coordinated to the metal ions
via azomethine N and furan O; whereas HL2 behaves as a uni-negtively terdentate ligand coordinated to
the metal ions via deprotonated thiophenol S, azomethine N, and thiophene S; the exception is the UO2(II)
complex, where HL2 behaves as a neutral ligand and is coordinated via its protonated SH group.
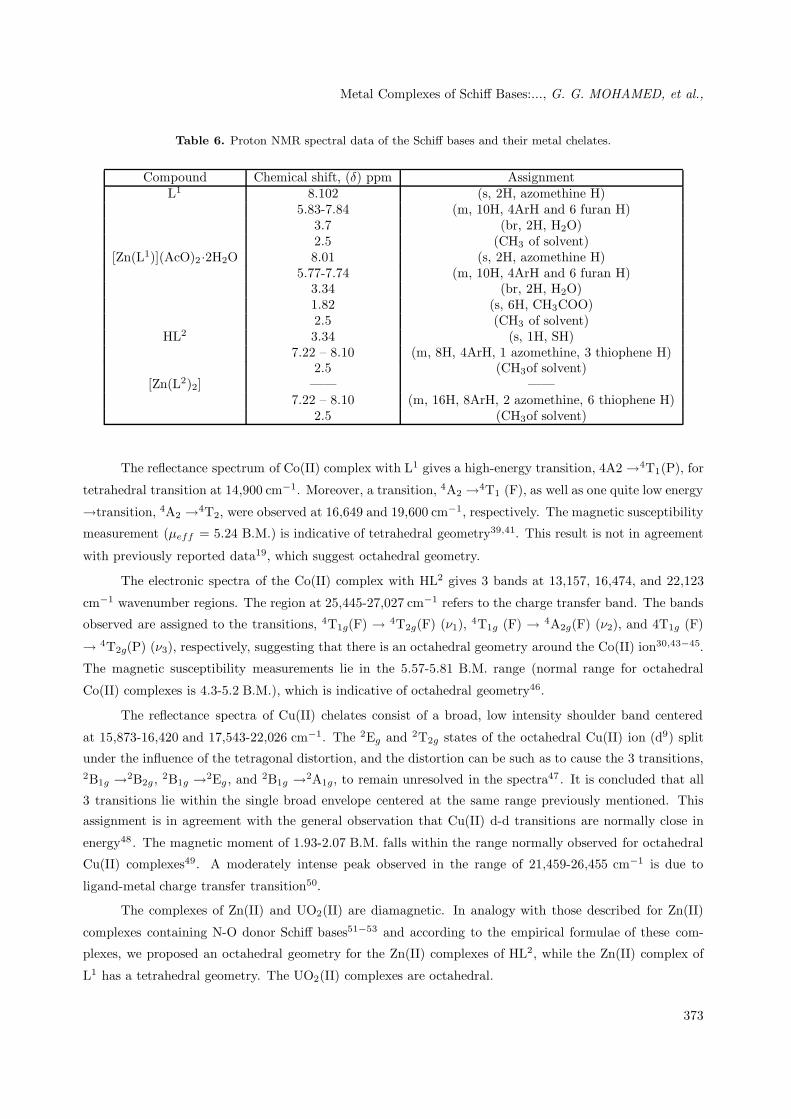
1H NMR spectra
A review of the literature revealed that NMR spectroscopy has been proven to be useful in establishingthe nature and structure of many Schiff bases, as well as their complexes in solutions. The NMR spectra
of Schiff bases were recorded in d6-dimethylsulfoxide (DMSO) solution, using tetramethylsilane (TMS) as
internal standard. The NMR spectra of the Schiff bases, L1 and HL2, their diamagnetic Zn(II) complexes,
and the chemical shifts of the different types of protons are listed in Table 6. The spectra of the complexesare examined in comparison with those of the parent Schiff bases. Upon examination it was found that the
SH signal that appeared in the spectrum of the HL2 ligand at 3.34 ppm completely31 disappeared in the
spectrum of its Zn(II) complex, indicating that the SH proton is removed by chelation with the Zn(II) ion.
A new signal was observed at 1.82 ppm for Zn(II) complex with L1, with an integration corresponding to
6 protons. The signals are assigned to 2 acetate molecules. Moreover, the signal that was observed at 3.34
ppm, with an integration corresponding to 2 protons in Zn(II) complexes with the L1 ligand, is assigned to
1 water molecule.
371
Metal Complexes of Schiff Bases:..., G. G. MOHAMED, et al.,
Table 4. IR data (4000 – 400 cm−1) of L1 and its metal complexes.
ν (OH) δ (H2O)Compound ν ν (Hydrated (coordinated ν ν(C=N) (C-O-C) water) water) (M-O) (M-N)L1 1614sh 1229m 3349br ——- ——- ——–[Fe(L1)(H2O)2]Cl3·3H2O 1628sh 1237m 3320sh 928m, 884m 552s 432m[Co(L1)]Cl2·H2O 1626s 1232m 3401sh 931m, 884m 557s 452m[Ni(L1)(H2O)2]Cl2·4H2O 1611sh 1274m 3394br 928m, 883m 595m 420s[Cu(L1)(H2O)2]Cl2·2H2O 1617sh 1231sh 3381br 912m, 883m 657s 445m[Zn(L1)](AcO)2·H2O 1561sh 1240w 3115br 911s, 883s 596s 452s[UO2(L1)](NO3)2·3H2O 1628m Disappear 3361br 943m, 885m 553m 453m
sh = sharp, m = medium, br = broad, s = small, w = weak
Table 5. IR data (4000-400 cm−1) of HL2 and its metal complexes.
Compound υ (SH) υ (C=N) υ (C-S-C) υ (CS) υ (CS) υ (M-S) υ (M-S) υ (M-N)(asym) (sym) (thiophenol) (thiophene)
HL2 2371m 1659s 842sh 706sh 758sh ——- ——- ——-[Fe(L2)2]Cl- 2370s 1604ss 827sh 712sh 753sh 467m 428m 563m·2H2O[Co(L2)2] 2369s 1655w 828sh 710sh 761sh 469m 430m 568m[Ni(L2)2]- 2370s 1615w 828sh 710sh 761sh 468m 430m 568m·2H2O[Cu(L2)2] 2370s 1655w 828sh 709sh 761sh 468m 429m 565m[Zn(L2)2] 2370w 1662s 827sh 709sh 753sh 468m 430m 567m[UO2(HL2)2]- 2370w 1651sh 828sh 709sh 753sh 469m 431m 567m(NO3)2
sh = sharp, m = medium, br =broad, s = small, w = weak
Magnetic susceptibility and electronic spectra measurements
From the diffuse reflectance spectra it is observed that the Fe(III) chelates exhibit a band at 20,491-22,026
cm−1, which may be assigned to the 6A1g →T2g (G) transition in the octahedral geometry of the complexes37.
The 6A1g →5T1g transition appears to be split into 2 bands at 16,313 – 17,636 cm−1 and 12,626-13,020
cm−1. The observed magnetic moments of Fe(III) complexes are 5.53-5.92.
B.M. Thus, the complexes formed have octahedral geometry involving d2sp3 hybridization in the
Fe(III) ion38. The spectra also show a band at 23,641-25,510 cm−1, which may be attributed to ligand
to metal charge transfer. The Ni(II) complexes reported herein are high-spin with room temperature
magnetic moment values of 3.80-4.02 B.M., which are in the normal range observed for octahedral Ni(II)
complexes (μeff = 2.9-3.3 B.M)39. This indicates that the complexes of Ni(II) are 6-coordinate and probably
octahedral40. Their electronic spectra, in addition to showing the π-π* and n-π* bands of free ligands, display
3 bands in the solid reflectance spectra at ν1: (12,690-13,987) cm−1: 3A2g →3T2g, ν2: (15,649-16,155) cm−1:3A2g → 3T1g(F), and ν3: (21,052-22,522) cm−1: 3A2g →3T1g(P). Aditionally, the spectra show a band at
25,641-27,173 cm−1, which may be attributed to ligand to metal charge transfer.
372
Metal Complexes of Schiff Bases:..., G. G. MOHAMED, et al.,
Table 6. Proton NMR spectral data of the Schiff bases and their metal chelates.
Compound Chemical shift, (δ) ppm AssignmentL1 8.102 (s, 2H, azomethine H)
5.83-7.84 (m, 10H, 4ArH and 6 furan H)3.7 (br, 2H, H2O)2.5 (CH3 of solvent)
[Zn(L1)](AcO)2 ·2H2O 8.01 (s, 2H, azomethine H)5.77-7.74 (m, 10H, 4ArH and 6 furan H)3.34 (br, 2H, H2O)1.82 (s, 6H, CH3COO)2.5 (CH3 of solvent)
HL2 3.34 (s, 1H, SH)7.22 – 8.10 (m, 8H, 4ArH, 1 azomethine, 3 thiophene H)
2.5 (CH3of solvent)[Zn(L2)2] —— ——
7.22 – 8.10 (m, 16H, 8ArH, 2 azomethine, 6 thiophene H)2.5 (CH3of solvent)
The reflectance spectrum of Co(II) complex with L1 gives a high-energy transition, 4A2→4T1(P), for
tetrahedral transition at 14,900 cm−1. Moreover, a transition, 4A2 →4T1 (F), as well as one quite low energy
→transition, 4A2 →4T2, were observed at 16,649 and 19,600 cm−1, respectively. The magnetic susceptibility
measurement (μeff = 5.24 B.M.) is indicative of tetrahedral geometry39,41. This result is not in agreement
with previously reported data19, which suggest octahedral geometry.
The electronic spectra of the Co(II) complex with HL2 gives 3 bands at 13,157, 16,474, and 22,123
cm−1 wavenumber regions. The region at 25,445-27,027 cm−1 refers to the charge transfer band. The bands
observed are assigned to the transitions, 4T1g(F) → 4T2g(F) (ν1), 4T1g (F) → 4A2g(F) (ν2), and 4T1g (F)
→ 4T2g(P) (ν3), respectively, suggesting that there is an octahedral geometry around the Co(II) ion30,43−45.
The magnetic susceptibility measurements lie in the 5.57-5.81 B.M. range (normal range for octahedral
Co(II) complexes is 4.3-5.2 B.M.), which is indicative of octahedral geometry46.
The reflectance spectra of Cu(II) chelates consist of a broad, low intensity shoulder band centered
at 15,873-16,420 and 17,543-22,026 cm−1. The 2Eg and 2T2g states of the octahedral Cu(II) ion (d9) split
under the influence of the tetragonal distortion, and the distortion can be such as to cause the 3 transitions,2B1g →2B2g , 2B1g →2Eg , and 2B1g →2A1g, to remain unresolved in the spectra47 . It is concluded that all
3 transitions lie within the single broad envelope centered at the same range previously mentioned. This
assignment is in agreement with the general observation that Cu(II) d-d transitions are normally close in
energy48 . The magnetic moment of 1.93-2.07 B.M. falls within the range normally observed for octahedral
Cu(II) complexes49. A moderately intense peak observed in the range of 21,459-26,455 cm−1 is due to
ligand-metal charge transfer transition50.
The complexes of Zn(II) and UO2(II) are diamagnetic. In analogy with those described for Zn(II)
complexes containing N-O donor Schiff bases51−53 and according to the empirical formulae of these com-
plexes, we proposed an octahedral geometry for the Zn(II) complexes of HL2, while the Zn(II) complex of
L1 has a tetrahedral geometry. The UO2(II) complexes are octahedral.
373
Metal Complexes of Schiff Bases:..., G. G. MOHAMED, et al.,
Thermal analyses (TGA and DrTG)
Thermogravimetric analyses (TGA and DrTA) of the Schiff base ligands, L1 and HL2, and their chelates are
used to: (i) get information about the thermal stability of these new complexes, (ii) decide whether the water
molecules (if present) are inside or outside the inner coordination sphere of the central metal ion, and (iii)
suggest a general scheme for thermal decomposition of these chelates. In the present investigation, heating
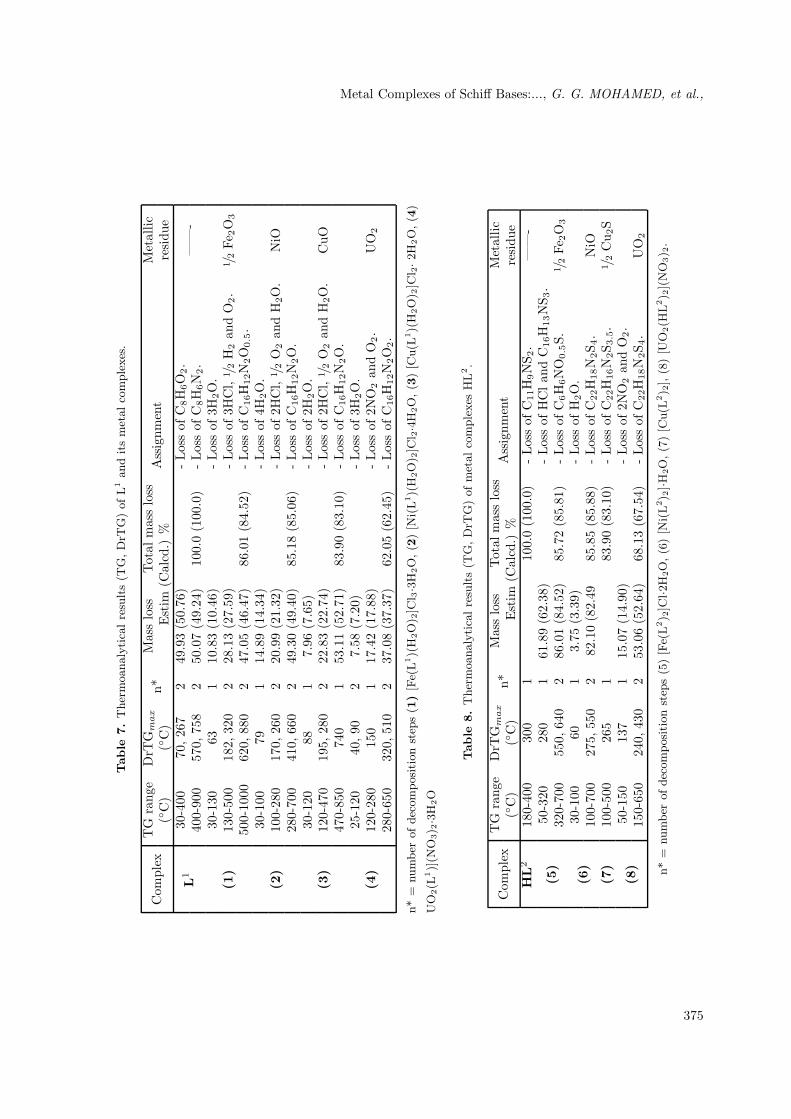
rates were suitably controlled at 10 ◦C min−1 under nitrogen atmosphere, and the weight loss was measuredfrom the ambient temperature up to ∼= 1000 ◦C. The data are provided in Tables 7 and 8. The weight lossfor each chelate was calculated within the corresponding temperature ranges. The TGA curve of Schiff base
L1exhibits a first estimated mass loss of 49.93% (calcd: 50.76%) at 30-400 ◦C, which may be attributed to the
liberation of C8H6O2 as gases. In the 3rd and 4th stages within the temperature range 400-900 ◦C, L1 loses
the remaining part with an estimated mass loss of 50.07% (calcd: 49.24% ) with a complete decomposition as
CO, CO2, NO, NO2, etc. gases. The TGA curve of Schiff base HL2 showed that this ligand decomposed in
one step, from 180 to 400 ◦C. This step corresponds to the complete decomposition of HL2 as deduced from
mass loss calculation (found mass loss = 100.0%, calcd. mass loss = 100.0%). Tables 7 and 8 show the TGA
and DrTGA results of thermal decomposition of the Schiff base chelates. The thermogram of the Fe(III)-HL2
chelate shows 3 decomposition steps within the temperature range 25-700 ◦C, whereas the Fe(III)-L1 chelate
shows 5 decomposition steps within the temperature range 30-1000 ◦C. The first 2 steps of decompositionwithin the temperature range 25-500 ◦C correspond to the loss of water molecules of hydration and HCl,
H2, and O2 gases, with a mass loss of 28.13% (calcd: 27.59%) for the Fe(III)-L1 chelate, while the first step
in the Fe(III)-L2 chelate occurs within the temperature range 50-320 ◦C, which corresponds to the removal
of HCl and C16H13NS3, with a mass loss of 61.89% (calcd: 62.38%). The subsequent steps (280-1000 ◦C)
correspond to the removal of the organic part of the ligands, leaving metal oxide as a residue. The overall
weight loss amounts to 86.01% (calcd: 84.52%) and 85.72% (calcd: 85.81%) for the Fe(III) chelates with L1
and HL2 ligands, respectively.
The TGA curves of the Ni(II)-chelates, show 3 to 5 stages of decomposition within the temperature
range of 30-900 ◦C. The first stage, at 30-120 ◦C, corresponds to the loss of water molecules of hydration,
while the subsequent (2nd, 3rd, 4th, and 5th) stages involve the loss of HCl, H2O, 1/2O2, and ligand molecules.
The overall weight loss amounts to 85.18% (calcd: 85.06%) and 85.85% (calcd: 85.88%) for the Ni(II) chelate
with L1 and HL2 ligands, respectively. On the other hand, [Cu(L1)(H2O)2]Cl2·2H2O and [Cu(L2)2] chelates
exhibit 1 to 4 decomposition steps. For the Cu(II)-L1 chelate, the first step is in the temperature range
30-120 ◦C (mass loss = 7.96%; calcd for 2H2O: 7.65%), which may account for the loss of water molecules
of hydration. As shown in Tables 7 and 8, the mass losses of the remaining decomposition steps amount to
22.85% (calcd: 22.74%) and correspond to the removal of HCl, H2O, 1/2 O2, L1 molecules, leaving CuO as
a residue. [Cu(L2)2] complex undergoes 1 step of decomposition within the temperature range 100-500 ◦C,
with an estimated mass loss of 83.09% (calcd: 83.01%). This mass loss corresponds to the pyrolysis of the
2 ligand molecules leaving 1/2 Cu2S as a residue.
374
Metal Complexes of Schiff Bases:..., G. G. MOHAMED, et al.,
Table
7.
Ther
moanaly
tica
lre
sult
s(T
G,
DrT
G)
of
L1
and
its
met
al
com
ple
xes
.
Complex
TGrange
DrTG
max
n*Massloss
Totalmassloss
Assignment
Metallic
(◦C)
(◦C)
Estim(Calcd.)%
residue
L1
30-400
70,267
249.93(50.76)
-LossofC
8H
6O
2.
——-
400-900
570,758
250.07(49.24)
100.0(100.0)
-LossofC
8H
6N
2.
30-130
631
10.83(10.46)
-Lossof3H
2O.
(1)
130-500
182,320
228.13(27.59)
-Lossof3HCl,
1 /2H
2andO
2.
1 /2Fe
2O
3
500-1000
620,880
247.05(46.47)
86.01(84.52)
-LossofC
16H
12N
2O
0.5.
30-100
791
14.89(14.34)
-Lossof4H
2O.
(2)
100-280
170,260
220.99(21.32)
-Lossof2HCl,
1 /2O
2andH
2O.
NiO
280-700
410,660
249.30(49.40)
85.18(85.06)
-LossofC
16H
12N
2O.
30-120
881
7.96(7.65)
-Lossof2H
2O.
(3)
120-470
195,280
222.83(22.74)
-Lossof2HCl,
1 /2O
2andH
2O.
CuO
470-850
740
153.11(52.71)
83.90(83.10)
-LossofC
16H
12N
2O.
25-120
40,90
27.58(7.20)
-Lossof3H
2O.
(4)
120-280
150
117.42(17.88)
-Lossof2NO
2andO
2.
UO
2
280-650
320,510
237.08(37.37)
62.05(62.45)
-LossofC
16H
12N
2O
2.
n*
=num
ber
of
dec
om
posi
tion
step
s(1
)[F
e(L
1)(
H2O
) 2]C
l 3·3H
2O
,(2
)[N
i(L
1)(
H2O
) 2]C
l 2·4H
2O
,(3
)[C
u(L
1)(
H2O
) 2]C
l 2·2
H2O
,(4
)
UO
2(L
1)]
(NO
3) 2·3H
2O
Table
8.
Ther
moanaly
tica
lre
sult
s(T
G,
DrT
G)
of
met
al
com
ple
xes
HL
2.
Complex
TGrange
DrTG
max
n*Massloss
Totalmassloss
Assignment
Metallic
(◦C)
(◦C)
Estim(Calcd.)%
residue
HL
2180-400
300
1100.0(100.0)
-LossofC
11H
9NS 2.
——-
(5)
50-320
280
161.89(62.38)
-LossofHClandC
16H
13NS 3.
320-700
550,640
286.01(84.52)
85.72(85.81)
-LossofC
6H
6NO
0.5S.
1 /2Fe
2O
3
(6)
30-100
601
3.75(3.39)
-LossofH
2O.
100-700
275,550
282.10(82.49
85.85(85.88)
-LossofC
22H
18N
2S 4.
NiO
(7)
100-500
265
183.90(83.10)
-LossofC
22H
16N
2S 3
.5.
1 /2Cu 2S
(8)
50-150
137
115.07(14.90)
-Lossof2NO
2andO
2.
150-650
240,430
253.06(52.64)
68.13(67.54)
-LossofC
22H
18N
2S 4.
UO
2
n*
=num
ber
of
dec
om
posi
tion
step
s(5
)[F
e(L
2) 2
]Cl·2
H2O
,(6
)[N
i(L
2) 2
]·H2O
,(7
)[C
u(L
2) 2
],(8
)[U
O2(H
L2) 2
](N
O3) 2
.
375
Metal Complexes of Schiff Bases:..., G. G. MOHAMED, et al.,
The TGA curves of the UO2(II) chelates represent 3 to 5 decomposition steps, as shown in Tables
7 and 8. For the UO2(II)-L1 chelate, the first step of decomposition within the temperature range 25-120◦C corresponds to the loss of hydrated water molecules, with a mass loss of 7.58% (calcd for 3H2O: 7.20%),
while the first step of decomposition for the UO2(II)-L2 complex corresponds to the loss of 2 nitrate moieties
into 2NO2 and O2 gases, within the temperature range 50-150 ◦C (mass loss: 15.07%; calcd: 14.90%). The
remaining steps of decomposition within the temperature range 120-800 ◦C correspond to the removal of
these ligands as gases. The overall weight losses amount to 62.05% (calcd: 62.45%) and 68.13% (calcd:
67.54%) for UO2(II)-L1 and UO2(II)-L2 chelates, respectively.
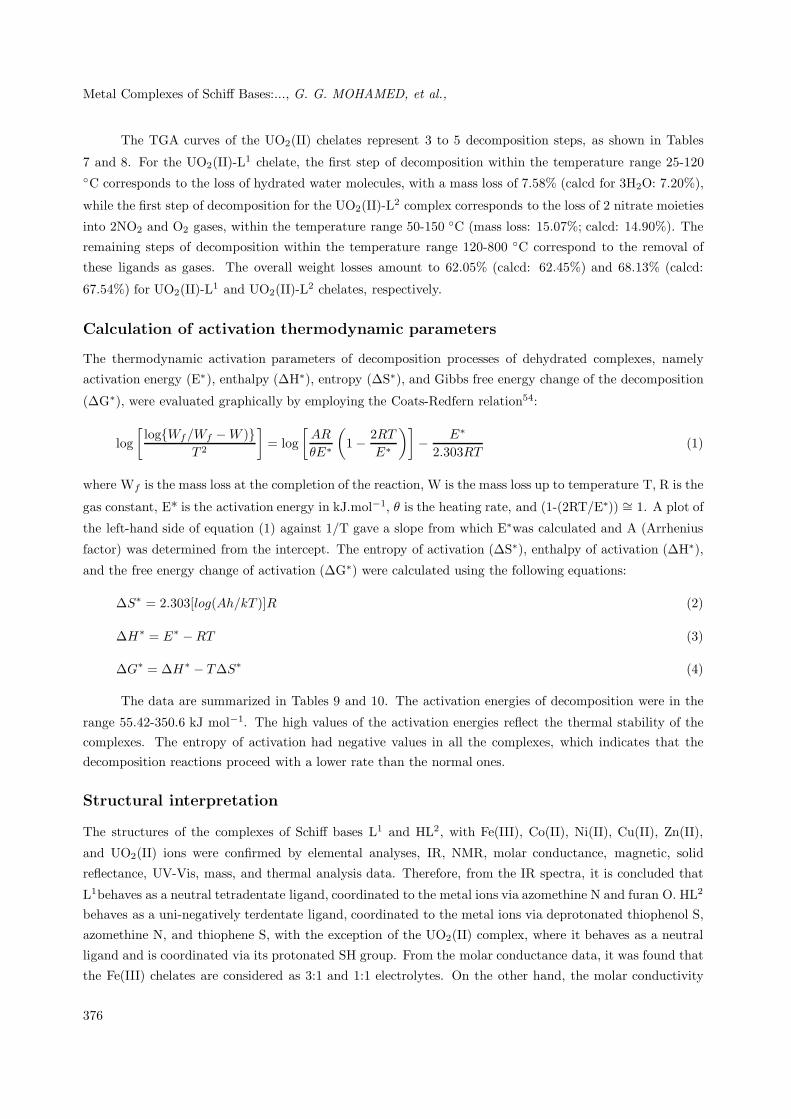
Calculation of activation thermodynamic parameters
The thermodynamic activation parameters of decomposition processes of dehydrated complexes, namely
activation energy (E∗), enthalpy (ΔH∗), entropy (ΔS∗), and Gibbs free energy change of the decomposition
(ΔG∗), were evaluated graphically by employing the Coats-Redfern relation54:
log[log{Wf/Wf − W )}
T 2
]= log
[AR
θE∗
(1− 2RT
E∗
)]− E∗
2.303RT(1)
where Wf is the mass loss at the completion of the reaction, W is the mass loss up to temperature T, R is the
gas constant, E* is the activation energy in kJ.mol−1, θ is the heating rate, and (1-(2RT/E∗)) ∼= 1. A plot ofthe left-hand side of equation (1) against 1/T gave a slope from which E∗was calculated and A (Arrhenius
factor) was determined from the intercept. The entropy of activation (ΔS∗), enthalpy of activation (ΔH∗),
and the free energy change of activation (ΔG∗) were calculated using the following equations:
ΔS∗ = 2.303[log(Ah/kT )]R (2)
ΔH∗ = E∗ − RT (3)
ΔG∗ = ΔH∗ − TΔS∗ (4)
The data are summarized in Tables 9 and 10. The activation energies of decomposition were in the
range 55.42-350.6 kJ mol−1. The high values of the activation energies reflect the thermal stability of thecomplexes. The entropy of activation had negative values in all the complexes, which indicates that thedecomposition reactions proceed with a lower rate than the normal ones.
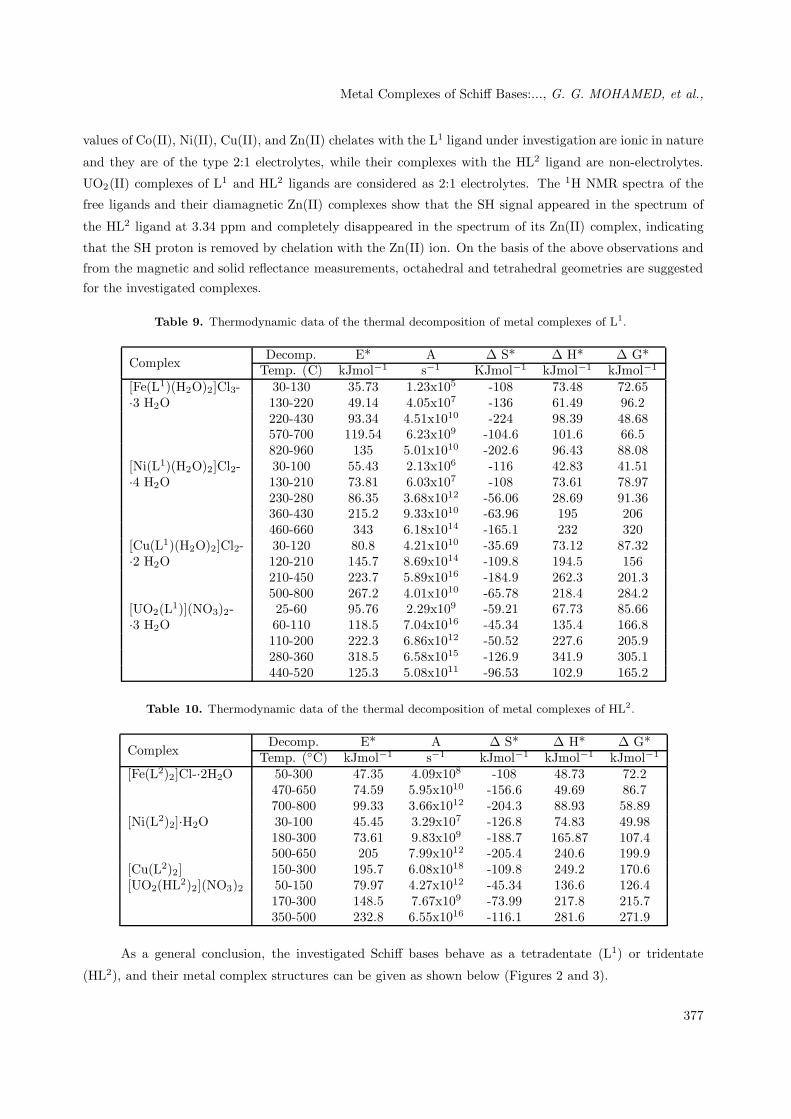
Structural interpretation
The structures of the complexes of Schiff bases L1 and HL2, with Fe(III), Co(II), Ni(II), Cu(II), Zn(II),
and UO2(II) ions were confirmed by elemental analyses, IR, NMR, molar conductance, magnetic, solid
reflectance, UV-Vis, mass, and thermal analysis data. Therefore, from the IR spectra, it is concluded that
L1behaves as a neutral tetradentate ligand, coordinated to the metal ions via azomethine N and furan O. HL2
behaves as a uni-negatively terdentate ligand, coordinated to the metal ions via deprotonated thiophenol S,
azomethine N, and thiophene S, with the exception of the UO2(II) complex, where it behaves as a neutral
ligand and is coordinated via its protonated SH group. From the molar conductance data, it was found that
the Fe(III) chelates are considered as 3:1 and 1:1 electrolytes. On the other hand, the molar conductivity
376
Metal Complexes of Schiff Bases:..., G. G. MOHAMED, et al.,
values of Co(II), Ni(II), Cu(II), and Zn(II) chelates with the L1 ligand under investigation are ionic in nature
and they are of the type 2:1 electrolytes, while their complexes with the HL2 ligand are non-electrolytes.
UO2(II) complexes of L1 and HL2 ligands are considered as 2:1 electrolytes. The 1H NMR spectra of the
free ligands and their diamagnetic Zn(II) complexes show that the SH signal appeared in the spectrum of
the HL2 ligand at 3.34 ppm and completely disappeared in the spectrum of its Zn(II) complex, indicating
that the SH proton is removed by chelation with the Zn(II) ion. On the basis of the above observations and
from the magnetic and solid reflectance measurements, octahedral and tetrahedral geometries are suggestedfor the investigated complexes.
Table 9. Thermodynamic data of the thermal decomposition of metal complexes of L1.
ComplexDecomp. E* A Δ S* Δ H* Δ G*Temp. (C) kJmol−1 s−1 KJmol−1 kJmol−1 kJmol−1
[Fe(L1)(H2O)2]Cl3- 30-130 35.73 1.23x10⁵ -108 73.48 72.65·3 H2O 130-220 49.14 4.05x10⁷ -136 61.49 96.2
220-430 93.34 4.51x10¹⁰ -224 98.39 48.68570-700 119.54 6.23x10⁹ -104.6 101.6 66.5820-960 135 5.01x10¹⁰ -202.6 96.43 88.08
[Ni(L1)(H2O)2]Cl2- 30-100 55.43 2.13x10⁶ -116 42.83 41.51·4 H2O 130-210 73.81 6.03x10⁷ -108 73.61 78.97
230-280 86.35 3.68x10¹² -56.06 28.69 91.36360-430 215.2 9.33x10¹⁰ -63.96 195 206460-660 343 6.18x10¹⁴ -165.1 232 320
[Cu(L1)(H2O)2]Cl2- 30-120 80.8 4.21x10¹⁰ -35.69 73.12 87.32·2 H2O 120-210 145.7 8.69x10¹⁴ -109.8 194.5 156
210-450 223.7 5.89x10¹⁶ -184.9 262.3 201.3500-800 267.2 4.01x10¹⁰ -65.78 218.4 284.2
[UO2(L1)](NO3)2- 25-60 95.76 2.29x10⁹ -59.21 67.73 85.66·3 H2O 60-110 118.5 7.04x10¹⁶ -45.34 135.4 166.8
110-200 222.3 6.86x10¹² -50.52 227.6 205.9280-360 318.5 6.58x10¹⁵ -126.9 341.9 305.1440-520 125.3 5.08x10¹¹ -96.53 102.9 165.2
Table 10. Thermodynamic data of the thermal decomposition of metal complexes of HL2.
ComplexDecomp. E* A Δ S* Δ H* Δ G*Temp. (◦C) kJmol−1 s−1 kJmol−1 kJmol−1 kJmol−1
[Fe(L2)2]Cl-·2H2O 50-300 47.35 4.09x10⁸ -108 48.73 72.2470-650 74.59 5.95x10¹⁰ -156.6 49.69 86.7700-800 99.33 3.66x10¹² -204.3 88.93 58.89
[Ni(L2)2]·H2O 30-100 45.45 3.29x10⁷ -126.8 74.83 49.98180-300 73.61 9.83x10⁹ -188.7 165.87 107.4500-650 205 7.99x10¹² -205.4 240.6 199.9
[Cu(L2)2] 150-300 195.7 6.08x10¹⁸ -109.8 249.2 170.6[UO2(HL2)2](NO3)2 50-150 79.97 4.27x10¹² -45.34 136.6 126.4
170-300 148.5 7.67x10⁹ -73.99 217.8 215.7350-500 232.8 6.55x10¹⁶ -116.1 281.6 271.9
As a general conclusion, the investigated Schiff bases behave as a tetradentate (L1) or tridentate
(HL2), and their metal complex structures can be given as shown below (Figures 2 and 3).
377
Metal Complexes of Schiff Bases:..., G. G. MOHAMED, et al.,
N
N
O
O
M
H2O
H2O
N
N
O
O
Co
N
N
O
O
U
O
O
.Xm.yH2O
M = Fe(III), X = Cl, m = 3, y = 3. Ni(II), X = Cl, m = 2, y = 4. Cu(II), X = Cl, m = 2, y = 2. Zn(II), X = AcO, m = 2, y = 1.
.(NO3)2.3H2O.Cl2.H2O
Figure 2. Structural formulae of L1 metal complexes.
N
S
S
N
M
S
S
N
S
S
N
UO O
HS
SH
N
S
S
N
S
S
.(NO3)2
M = Co(II), y = 0. Ni(II), y = 2. Cu(II), y = 0. Zn(II), y = 0.
.yH2O.Cl.2H2O Fe
Figure 3. Structural formulae of HL2 metal complexes.
Biological Activity
In testing the antibacterial activity of these compounds we used more than one test organism to increasethe chance of detecting the antibiotic potential of the tested materials. The sensitivity of a microorganismto antibiotics and other antimicrobial agents was determined by the assay plates, which were incubated at
28 ◦C for 2 days (for yeasts) and at 37 ◦C for 1 day (for bacteria). All of the tested compounds showed
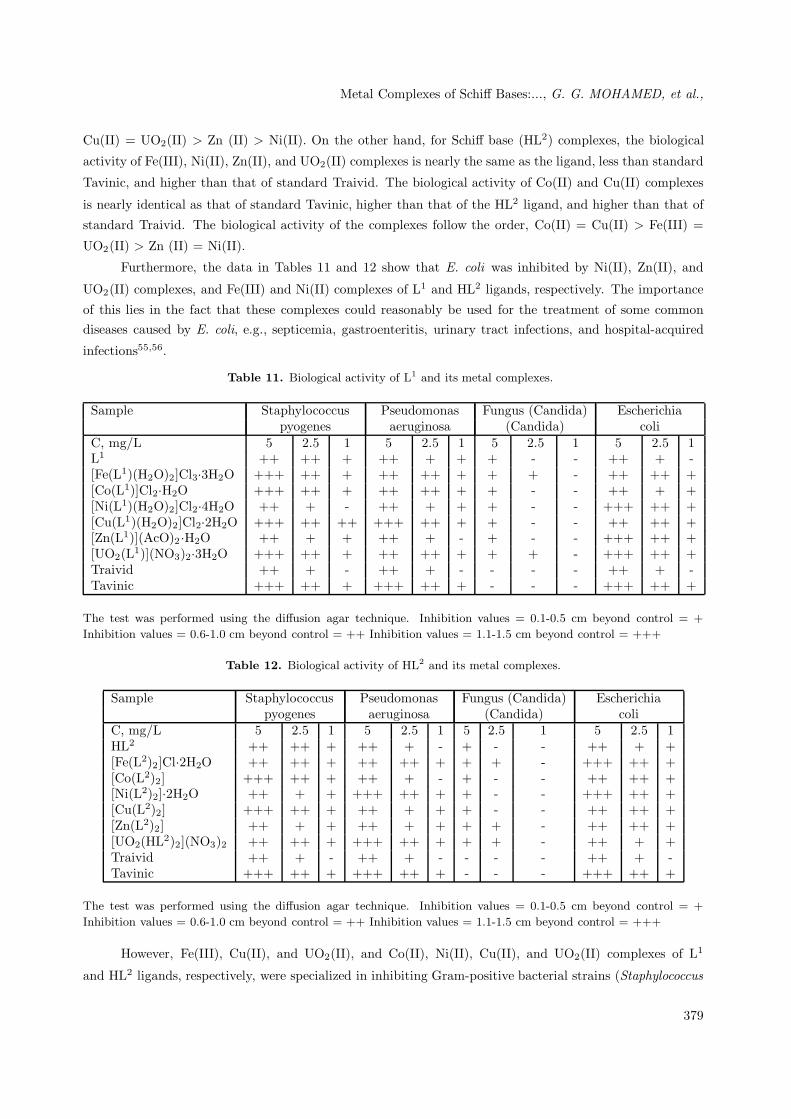
a remarkable biological activity against different types of Gram-positive and Gram-negative bacteria. Thedata are listed in Tables 11 and 12. Upon comparison of the biological activity of the Schiff bases and
their metal complexes with the standard (Traivid and Tavinic), it is seen that the biological activity of the
Schiff bases increases in the order HL2 > L1. The biological activity of L1 and HL2 are less than that of
Tavinic, but higher than that of Traivid. For Schiff base (L1) complexes, the biological activity of Fe(III),
Co(II), Cu(II), and UO2(II) complexes is higher than that of the ligand and Traivid, while their activity
is comparable with that of standard Tavinic. For Ni(II) and Zn(II) complexes, their biological activity is
nearly the same as that of L1. The biological activity of the complexes follow the order Fe(III) = Co(II) =
378
Metal Complexes of Schiff Bases:..., G. G. MOHAMED, et al.,
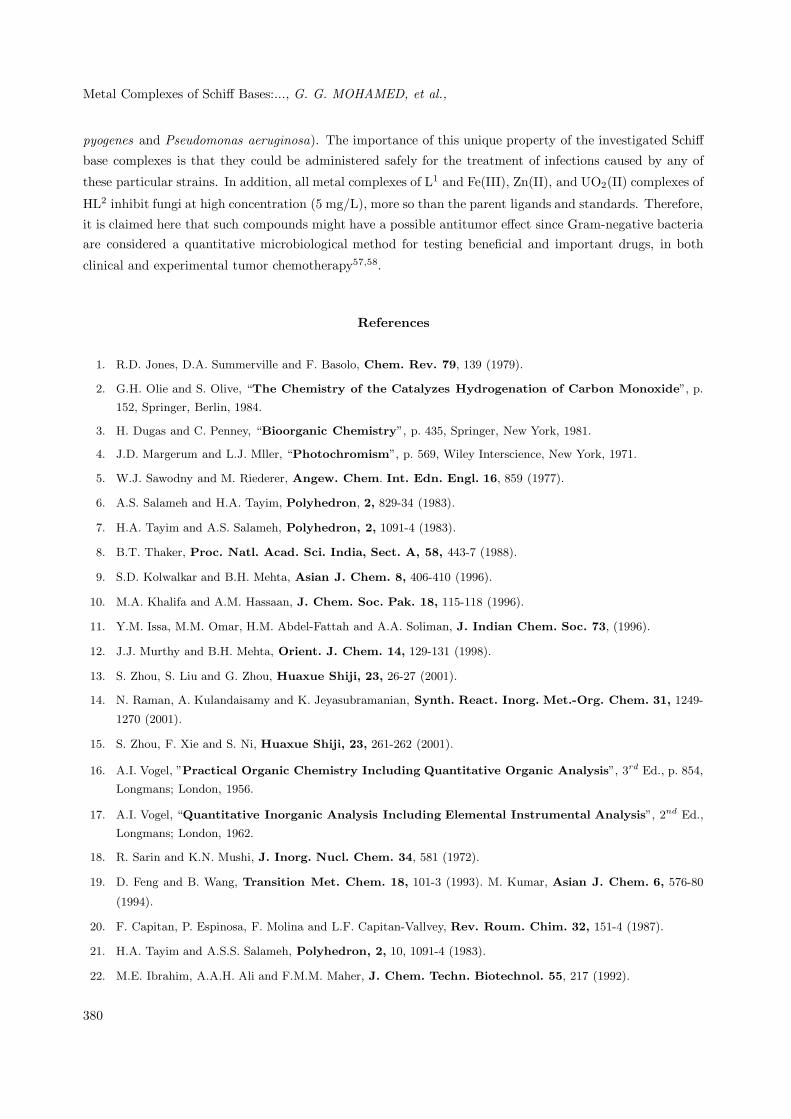
Cu(II) = UO2(II) > Zn (II) > Ni(II). On the other hand, for Schiff base (HL2) complexes, the biological
activity of Fe(III), Ni(II), Zn(II), and UO2(II) complexes is nearly the same as the ligand, less than standard
Tavinic, and higher than that of standard Traivid. The biological activity of Co(II) and Cu(II) complexes
is nearly identical as that of standard Tavinic, higher than that of the HL2 ligand, and higher than that of
standard Traivid. The biological activity of the complexes follow the order, Co(II) = Cu(II) > Fe(III) =
UO2(II) > Zn (II) = Ni(II).
Furthermore, the data in Tables 11 and 12 show that E. coli was inhibited by Ni(II), Zn(II), and
UO2(II) complexes, and Fe(III) and Ni(II) complexes of L1 and HL2 ligands, respectively. The importance
of this lies in the fact that these complexes could reasonably be used for the treatment of some commondiseases caused by E. coli, e.g., septicemia, gastroenteritis, urinary tract infections, and hospital-acquired
infections55,56.
Table 11. Biological activity of L1 and its metal complexes.
Sample Staphylococcus Pseudomonas Fungus (Candida) Escherichiapyogenes aeruginosa (Candida) coli
C, mg/L 5 2.5 1 5 2.5 1 5 2.5 1 5 2.5 1L1 ++ ++ + ++ + + + - - ++ + -[Fe(L1)(H2O)2]Cl3·3H2O +++ ++ + ++ ++ + + + - ++ ++ +[Co(L1)]Cl2·H2O +++ ++ + ++ ++ + + - - ++ + +[Ni(L1)(H2O)2]Cl2·4H2O ++ + - ++ + + + - - +++ ++ +[Cu(L1)(H2O)2]Cl2·2H2O +++ ++ ++ +++ ++ + + - - ++ ++ +[Zn(L1)](AcO)2 ·H2O ++ + + ++ + - + - - +++ ++ +[UO2(L1)](NO3)2·3H2O +++ ++ + ++ ++ + + + - +++ ++ +Traivid ++ + - ++ + - - - - ++ + -Tavinic +++ ++ + +++ ++ + - - - +++ ++ +
The test was performed using the diffusion agar technique. Inhibition values = 0.1-0.5 cm beyond control = +
Inhibition values = 0.6-1.0 cm beyond control = ++ Inhibition values = 1.1-1.5 cm beyond control = +++
Table 12. Biological activity of HL2 and its metal complexes.
Sample Staphylococcus Pseudomonas Fungus (Candida) Escherichiapyogenes aeruginosa (Candida) coli
C, mg/L 5 2.5 1 5 2.5 1 5 2.5 1 5 2.5 1HL2 ++ ++ + ++ + - + - - ++ + +[Fe(L2)2]Cl·2H2O ++ ++ + ++ ++ + + + - +++ ++ +[Co(L2)2] +++ ++ + ++ + - + - - ++ ++ +[Ni(L2)2]·2H2O ++ + + +++ ++ + + - - +++ ++ +[Cu(L2)2] +++ ++ + ++ + + + - - ++ ++ +[Zn(L2)2] ++ + + ++ + + + + - ++ ++ +[UO2(HL2)2](NO3)2 ++ ++ + +++ ++ + + + - ++ + +Traivid ++ + - ++ + - - - - ++ + -Tavinic +++ ++ + +++ ++ + - - - +++ ++ +
The test was performed using the diffusion agar technique. Inhibition values = 0.1-0.5 cm beyond control = +
Inhibition values = 0.6-1.0 cm beyond control = ++ Inhibition values = 1.1-1.5 cm beyond control = +++
However, Fe(III), Cu(II), and UO2(II), and Co(II), Ni(II), Cu(II), and UO2(II) complexes of L1
and HL2 ligands, respectively, were specialized in inhibiting Gram-positive bacterial strains (Staphylococcus
379
Metal Complexes of Schiff Bases:..., G. G. MOHAMED, et al.,
pyogenes and Pseudomonas aeruginosa). The importance of this unique property of the investigated Schiff
base complexes is that they could be administered safely for the treatment of infections caused by any of
these particular strains. In addition, all metal complexes of L1 and Fe(III), Zn(II), and UO2(II) complexes of
HL2 inhibit fungi at high concentration (5 mg/L), more so than the parent ligands and standards. Therefore,
it is claimed here that such compounds might have a possible antitumor effect since Gram-negative bacteriaare considered a quantitative microbiological method for testing beneficial and important drugs, in both
clinical and experimental tumor chemotherapy57,58.
References
1. R.D. Jones, D.A. Summerville and F. Basolo, Chem. Rev. 79, 139 (1979).
2. G.H. Olie and S. Olive, “The Chemistry of the Catalyzes Hydrogenation of Carbon Monoxide”, p.
152, Springer, Berlin, 1984.
3. H. Dugas and C. Penney, “Bioorganic Chemistry”, p. 435, Springer, New York, 1981.
4. J.D. Margerum and L.J. Mller, “Photochromism”, p. 569, Wiley Interscience, New York, 1971.
5. W.J. Sawodny and M. Riederer, Angew. Chem. Int. Edn. Engl. 16, 859 (1977).
6. A.S. Salameh and H.A. Tayim, Polyhedron, 2, 829-34 (1983).
7. H.A. Tayim and A.S. Salameh, Polyhedron, 2, 1091-4 (1983).
8. B.T. Thaker, Proc. Natl. Acad. Sci. India, Sect. A, 58, 443-7 (1988).
9. S.D. Kolwalkar and B.H. Mehta, Asian J. Chem. 8, 406-410 (1996).
10. M.A. Khalifa and A.M. Hassaan, J. Chem. Soc. Pak. 18, 115-118 (1996).
11. Y.M. Issa, M.M. Omar, H.M. Abdel-Fattah and A.A. Soliman, J. Indian Chem. Soc. 73, (1996).
12. J.J. Murthy and B.H. Mehta, Orient. J. Chem. 14, 129-131 (1998).
13. S. Zhou, S. Liu and G. Zhou, Huaxue Shiji, 23, 26-27 (2001).
14. N. Raman, A. Kulandaisamy and K. Jeyasubramanian, Synth. React. Inorg. Met.-Org. Chem. 31, 1249-
1270 (2001).
15. S. Zhou, F. Xie and S. Ni, Huaxue Shiji, 23, 261-262 (2001).
16. A.I. Vogel, ”Practical Organic Chemistry Including Quantitative Organic Analysis”, 3rd Ed., p. 854,
Longmans; London, 1956.
17. A.I. Vogel, “Quantitative Inorganic Analysis Including Elemental Instrumental Analysis”, 2nd Ed.,
Longmans; London, 1962.
18. R. Sarin and K.N. Mushi, J. Inorg. Nucl. Chem. 34, 581 (1972).
19. D. Feng and B. Wang, Transition Met. Chem. 18, 101-3 (1993). M. Kumar, Asian J. Chem. 6, 576-80
(1994).
20. F. Capitan, P. Espinosa, F. Molina and L.F. Capitan-Vallvey, Rev. Roum. Chim. 32, 151-4 (1987).
21. H.A. Tayim and A.S.S. Salameh, Polyhedron, 2, 10, 1091-4 (1983).
22. M.E. Ibrahim, A.A.H. Ali and F.M.M. Maher, J. Chem. Techn. Biotechnol. 55, 217 (1992).
380
Metal Complexes of Schiff Bases:..., G. G. MOHAMED, et al.,
23. N. Sari, S. Arslan, E. Logoglu and I. Sakiyan, J. of Sci. 16, 283 (2003).
24. J. Bjerrum, “Metal Amine Formation in Aqueous Solution”, Haase, Copenhagen, 1941.
25. H. Irving and R.J.P. Williams, Nature, 162, 746 (1948).
26. H. Irving and R.J.P. Williams, J. Chem. Soc. 3192 (1953).
27. R.D. Jones, D.A. Summerville and F. Basolo, Chem. Rev. 79, 139 (1979).
28. L.E. Orgel, “An Introduction to Transition Metal Chemistry Ligand Field Theory”, p.55, Methuen,
1966.
29. G.G. Mohamed, Zeinb H.Abd El.Wahwb, J. Thermal Anal. 73, 347-359 (2003).
30. A.A. Soliman and W. Linert, Thermochimica Acta, 333, 67-75 (1999).
31. A.P. Mishra, J. Indian Chem. Soc. 76, 35-37 (1999).
32. A. Kriza, M. Voiculescu and A. Nicolae, Analele Universitatii Bucuresti. Chimie, 11, 197- 201 (2002).
33. J.K. Nag, D. Das, B.B. De and C. Sinha, J. Indian Chem. Soc. 75, 496-498 (1998).
34. M. Hossain, S.K. Chattopadhyay and S. Ghosh, Polyhedron, 16, 1793-1802 (1997).
35. M.M. Moustafa, J. Thermal Anal. 50, 463-471 (1997).
36. G.G. Mohamed, Nadia E.A. El-Gamel and F.A. Nour El-Dien, Synth. React. Inorg. Met.- Org. Chem.
31, 347-358 (2001).
37. F.A. Cotton, G. Wilkinson, C.A. Murillo and M. Bochmann, “Advanced Inorganic Chemistry”, 6th ed.,
Wiley, New York, 1999.
38. D.R. Zhu, Y. Song, Y. Xu, Y. Zhang, S.S.S. Raj, H.K. Fun and X.Z. You, Polyhedron, 19, 2019- 2025 (2000).
39. R. Prasad, P.P. Thankachan, M.T. Thomas and R. Pathak, J. Ind. Chem. Soc. 78, 28-31 (2001).
40. M.S. Masoud, A.M. Hindawy and A.S. Soayed, Trans. Met. Chem. 16, 372-376 (1991).
41. N.K. Gaur, R. Sharma and R.S. Sindhu, J. Ind. Chem. Soc. 78, 26-27 (2001).
42. M.M. Omar and Gehad G. Mohamed, Spectrochimica Acta, Part A, 61, 929-936 (2005).
43. N. Mondal, D.K. Dey, S. Mitra and K.M. Abdul Malik, Polyhedron, 19, 2707-2711 (2000).
44. J. Kohout, M. Hvastijova, J. Kozisek, J.G. Diaz, M. Valko, L. Jager and I. Svoboda, Inorg Chim. Acta 287,
186-192 (1999).
45. A. Bury, A.E. Underhill, D.R. Kemp, N.J. O’Shea, J.P. Smith, P.S. Gomm and F. Hallway, Inorg. Chim.
Acta, 138, 85-89 (1987).
46. N.R.S. Kumar, M. Nethiji and K.C. Patil, Polyhedron, 10, 365-371 (1991).
47. J. Manonmani, R. Thirumurugan, M. Kandaswamy, M. Kuppayee, S.S.S. Raj, M.N. Ponnuswamy, G. Shan-
mugam and H.K. Fun, Polyhedron, 19, 2011-2018 (2000).
48. J. Sanmartin, M.R. Bermejo, A.M.G. Deibe, M. Maneiro, C. Lage and A.J.C. Filho, Polyhedron, 19, 185-192
(2000).
49. V.P. Krzyminiewska, H. Litkowska and W.R. Paryzek, Monatshefte Fur Chemie, 130, 243-247 (1999).
50. K.Bertoncello, G.D. Fallon, K.S. Murray and E.R.T. Tiekink, Inorg. Chem. 30, 3562 (1991).
51. A.W. Coats and J.P. Redfern, Nature, 20, 68 (1964).
381
Metal Complexes of Schiff Bases:..., G. G. MOHAMED, et al.,
52. D.C. Shanson, “Microbiology in Clinical Practice”, Wright PSG, Bristol, London, Boston, 1982.
53. E. Jawetz, J.L. Melnick and E.A. Adelberg, “Review of Medical Microbiology”, Lang Medical Publications,
Los Angeles, California, 16th ed., 1979.
54. A.M.S. El-Sharief, M.S. Ammar, Y.A. Ammar and M.E. Zak, Ind. J. Chem. 22B, 700-704 (1983).
55. A.M.S. El-Sharief, M.S. Ammar and Y.A. Mohammed, Egypt. J. Chem. 27, 535-546 (1984).
382

![Calixarene-based receptors for molecular recognitionjournals.tubitak.gov.tr/chem/issues/kim-13-37-4/kim-37-4-8-1303-5.pdf · YILMAZ and ERDEM_IR/Turk J Chem calix[6]arene, and calix[8]arene](https://img.pdfslide.us/doc/110x75/5afee8f27f8b9a444f8f7968/calixarene-based-receptors-for-molecular-and-erdemirturk-j-chem-calix6arene.jpg)