Embed Size (px)
Citation preview

B. Mitschang et al. (Hrsg.): Datenbanksysteme für Business, Technologie und Web (BTW 2017),
Lecture Notes in Informatics (LNI), Gesellschaft für Informatik, Bonn 2017 175
Metadata Management for Data Integration
in Medical Sciences
- Experiences from the LIFE Study -
Toralf Kirsten1,2, Alexander Kiel2, Mathias Rühle2, Jonas Wagner2
Abstract: Clinical and epidemiological studies are commonly used in medical sciences. They typicallycollect data by using different input forms and information systems. Metadata describing input forms,database schemas and input systems are used for data integration but are typically distributed overdifferent software tools; each uses portions of metadata, such as for loading (ETL), data presentationand analysis. In this paper, we describe an approach managing metadata centrally and consistently ina dedicated Metadata Repository (MDR). Metadata can be provided to different tools. Moreover, theMDR includes a matching component creating schema mappings as a prerequisite to integrate capturedmedical data. We describe the approach, the MDR infrastructure and provide algorithms for creatingschema mappings. Finally, we show selected evaluation results. The MDR is fully operational andused to integrate data from a multitude of input forms and systems in the epidemiological study LIFE.
Keywords: Data Integration, Schema Matching, Schema Merging, Metadata Repository
1 Introduction
Clinical and epidemiological studies and other health related surveys are often used in
evidence-based medical sciences. Clinical studies investigate specific biological and medical
phenomena and their implications from the clinical point of view. For instance, they evaluate
new therapy procedures according to specific diseases, test the application of new drugs or
drug doses under various circumstances by comparing the results (e.g., survival rate for
cancer) to previous therapy procedures accepted in the medical community. Epidemiological
studies and other health surveys usually study the development of prevalences (ratio of
infected to all persons) for specific diseases and health imbalances by determining a
population in a geographical region of interest. The increasing prevalence rate of obesity in
industrial countries (in contrast to development countries) is a finding of such studies; the
goal is to find specific explanations for this increase, e.g., changes of life style or nutrition
habits, in order to show trends and impacts (also for health care policy). In both, clinical and
epidemiological studies, it is quite common to determine a set of participants by different
investigations, so called assessments, in which data are captured about the participant and
need to be integrated before a comprehensive data analysis can start.
LIFE [Qu12, Lo15] is a large epidemiological study at the University of Leipzig in the
described context. The goal of LIFE is to determine the causes of common civilization
1 Interdisciplinary Centre for Bioinformatics, Univ. of Leipzig, Härtelstr. 16-18, 04107 Leipzig2 LIFE Research Centre for Civilization Diseases, Univ. of Leipzig, Philipp-Rosenthal-Str. 27, 04103 Leipzig
[email protected], akiel,mruehle,[email protected]

176 Toralf Kirsten, Alexander Kiel, Mathias Rühle, Jonas Wagner
Fig. 1: Exemplified Evolution of Assessment “Anthropometry” with multiple Input Forms
diseases including adiposity (obesity), depression, dementia, diabetes melitus, allergy,
cardiovascular disease and heart attack. By now, more than 23,000 participants who mostly
are Leipzig (Germany) inhabitants have been examined. Each selected and invited person
is associated to a special investigation program consisting of different assessment types
including questionnaires, interviews, physical examinations and sample extraction (e.g.,
blood and urine samples). An assessment specifies how (the procedure) and which data
are captured. Each assessment is implemented by a number of input forms; each form by
a specfic input system. Such input systems are web-based systems, desktop systems, or
spreadsheet systems allowing online and subsequent data input which is often manually and
directly carried out by the ambulance staff or the participant. Furthermore, medical devices
producing data by a measurement process (during a physical examination) often need a
special “reading” process and pre-processing to derive and extract data from proprietary
formats, such as images, 3D models etc.
Fig. 1 (left) shows a portion of a single input form implementing the Anthropometry
assessment. The form consists of different data items (e.g., questions of questionnaires),
such as body height and weight, for which data can be captured. Multiple items can be
grouped into item groups, i.e., they form a group of input fields on the input form. In LIFE,
input forms and other data sources can change over time, a fact that makes the integration
effort much more challenging. There are several reasons for that. Misspellings in data
items text and wrong or missing validation rules of input forms should be corrected. Other
input forms need to be adapted to meet specific requirements at the investigation time or
extended research questions, e.g., by adding or deleting data items to/from an input form.
These changes do not necessarily result in structural changes, in particular correction of
misspellings. However, the input systems used in LIFE allow to change every input form
until it is activated for data input. Further changes result in designing and activating a new
input form while the previous form can be deactivated to prevent further data capturing
with this form. Each input form is associated with a data table (database or spreadsheet) in
which the captured data are stored. Using multiple input forms per assessment results in
multiple data tables.

Metadata Management for Data Integration in Medical Sciences 177
Fig. 1 shows the evolution of the assessment Anthropometry using three input forms. While
the text of data items weight and height changes from form 1 to 2, the item identifier F43
moves to F33 due to rearrangements of questions in version 3. New items are introduced
in form 2 and 3. Moreover, the codes of the answer lists (so called code lists in trial
management) are numeric in version 3; they were alphabetic in forms 1 and 2. Similarly, the
schema of generated data heavily depends on the used software (and version), such that
schema changes are the normal case. A data analysis, however, should run on integrated
data for each assessment instead of multiple input forms. In LIFE , there are currently more
than 900 assessments with more than 52,000 items (in total) which are associated with more
then 1,700 input forms (approx. 120,000 items). A manual integration connecting input
forms with assessment is, therefore, very resource-intensive and error-prone. To reduce this
manual effort we designed and implemented an integration approach which we introduce in
this paper. In particular, we make the following contributions.
• Our integration approach uses current schema matching and merging techniques to
generate mappings to harmonize the schema of input forms and other data sources as
well as code lists of data items. The advantage is twofold. First, the target schema
can be automatically derived and generated. Secondly, data can be transformed and
transfered by an automatic process using the generated mappings. We introduce the
applied matching techniques and provide algorithms.
• All metadata is collected and managed by a separate Metadata Repository (MDR)
which is implemented by a service-based infrastructure. The MDR is fully operational
and is used for several years in LIFE for data integration. We introduce the system
architecture and show an overview of its database schema.
• Taking the available and validated mapping data from the productive instance, we
evaluate the quality of our mapping-based approach and discuss the results.
The rest of the paper is organized as follows. In Sect. 2, we introduce some basic models
and definitions that we use throughout the paper. Sect. 3 explains the schema matching
process we have implemented and shows algorithms allowing to find corresponding schema
elements. We sketch the match infrastructure in Sect. 4, show selected evaluation results in
Sect. 5 and discuss related work in Sect. 6 before we conclude in Sect. 7.
2 Preliminaries and Models
An input form F = (G, I, RF ) consists of a non-empty set of items I (e.g., questions in
questionnaires and interviews). Items are organized as ordered set (i.e., list) into item groups
G. The input form structure RF ⊂ G × I specifies which group contains which items.
Therefore, an input form is organized as tree with F as root, groups as inner nodes and items
as leaves. Input forms as well as item groups and items are described by a non-empty set of
attributes. Input forms and item groups normally have a title, whereas items are primarily
described by an item identifier and a description, i.e., the question text in a questionnaire
and the measurement parameter name in physical investigations. Further item attributes
depend on the utilized input system, such as the item representation on the web page (radio
button, check box, short text field etc.). Furthermore, categorial data items are associated

178 Toralf Kirsten, Alexander Kiel, Mathias Rühle, Jonas Wagner
with a predefined list of instances (i.e., categories subsumed as code list) to restrict the set
of answers. Each code list element is represented by a code and a label. While the label is
shown on the input web-page or used as label when analysis results are presented, the code
is directly represented within data and, hence, only “internally” used.
Throughout the paper, we use the term input form and its above definition for forms that are
interactively used by study participants and study staff to manually capture data but also for
forms which are “automatically filled”, e.g., when devices produce data. Forms of the latter
case only exist “virtually”; they are used to specify metadata since database schemas of
device software installations or data exports (e.g., spreadsheets) typically don’t provide item
descriptions and code lists. Moreover, we add the input system IS and a version number
v (linear versioning schema per input system) as index to each input form FIS,v allowing
us to differentiate and to address a single input form of an assessment. Note, there can be
multiple input forms simultaneously used at the same time, e.g., input forms of the same or
different input systems.
Every input form FIS,v is associated to a schema SIS,v = (E, RS) which is used by an input
system to internally store and manage captured data of the input form FIS,v . In this paper,
we focus on relational schemas consisting of tables and columns (generalized as set of
schema elements E and their relationships RS ⊂ E × E). We assume that every input form
can be represented as single table or single denormalized view on multiple tables. In cases
in which data are not represented in a relational schema, we apply a transformation step and
import the data into a relational schema. The mapping MFI S,v,SI S,v= (FIS,v, SIS,v,CF,S)
explicitly represents the interrelation between FIS,v and SIS,v; the set CF,S consists of
correspondences specifying which schema element of SIS,v is associated to which data
item of input form FIS,v . Note, an input form can contain data items which have no
correspondence to any schema element; typically, they show derived data, e.g., special text
paragraphs or computations (e.g., body mass index) that are dynamically created based on
data of other data items for which data have been captured. Furthermore, there are data
items which are closely related. For instance, there are questions in questionnaires and
interviews associated with a multiple choice behavior. There, each element of the code list is
represented by a check box on the input form; each check box can be enabled independently
from the other. Therefore, the relational schema contains an element (column) for each code
list element (check box). Mostly, the mapping MFI S,v,SI S,vis inherently generated by the
input systems we use in LIFE; only for spreadsheets and exported data files from medical
devices we generate a mapping manually by creating (virtual) input forms for a specified
relational schema after importing data into the database. For simplicity, we skip the input
system as index in the rest of the paper and denote an input form F (source schema S) in
version v by Fv (Sv) instead of FIS,v (SIS,v).
The goal of the schema matching process is to find semantic meaningful correspondences
between elements of two distinct schemas, say Si and Sj . The resulting correspondence set
CSi,S jbuilds a mapping MSi,S j
= (Si, Sj,CS). A special schema is the target schema T . In
our case, T represents the schema of the so called research database managing data from all
input forms in a harmonized manner. Hence, we are finally interested in schema mappings
MSi,T between schemas of input forms Si and the target schema T .
Metadata Management for Data Integration in Medical Sciences 179
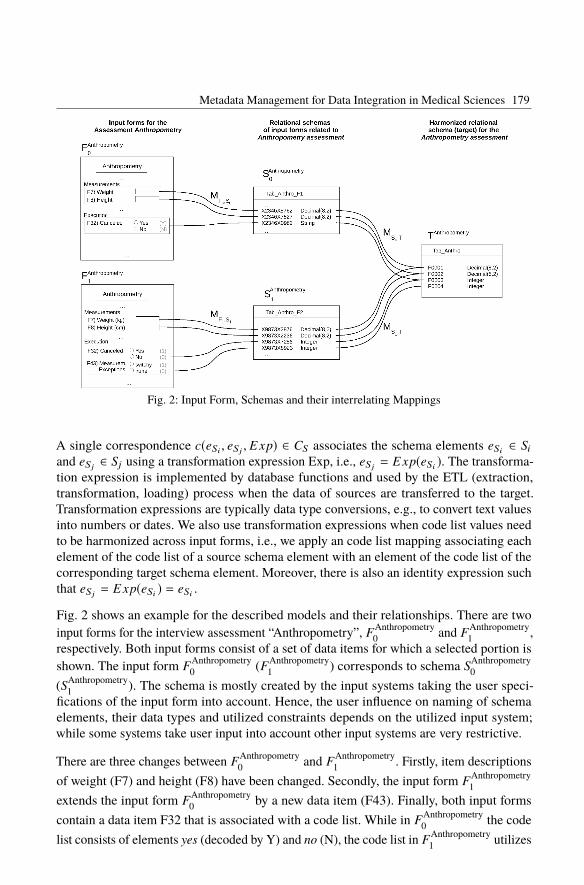
Fig. 2: Input Form, Schemas and their interrelating Mappings
A single correspondence c(eSi , eS j, E xp) ∈ CS associates the schema elements eSi ∈ Si
and eS j∈ Sj using a transformation expression Exp, i.e., eS j
= E xp(eSi ). The transforma-
tion expression is implemented by database functions and used by the ETL (extraction,
transformation, loading) process when the data of sources are transferred to the target.
Transformation expressions are typically data type conversions, e.g., to convert text values
into numbers or dates. We also use transformation expressions when code list values need
to be harmonized across input forms, i.e., we apply an code list mapping associating each
element of the code list of a source schema element with an element of the code list of the
corresponding target schema element. Moreover, there is also an identity expression such
that eS j= E xp(eSi ) = eSi .
Fig. 2 shows an example for the described models and their relationships. There are two
input forms for the interview assessment “Anthropometry”, FAnthropometry
0and F
Anthropometry
1,
respectively. Both input forms consist of a set of data items for which a selected portion is
shown. The input form FAnthropometry
0(F
Anthropometry
1) corresponds to schema S
Anthropometry
0
(SAnthropometry
1). The schema is mostly created by the input systems taking the user speci-
fications of the input form into account. Hence, the user influence on naming of schema
elements, their data types and utilized constraints depends on the utilized input system;
while some systems take user input into account other input systems are very restrictive.
There are three changes between FAnthropometry
0and F
Anthropometry
1. Firstly, item descriptions
of weight (F7) and height (F8) have been changed. Secondly, the input form FAnthropometry
1
extends the input form FAnthropometry
0by a new data item (F43). Finally, both input forms
contain a data item F32 that is associated with a code list. While in FAnthropometry
0the code
list consists of elements yes (decoded by Y) and no (N), the code list in FAnthropometry
1utilizes
180 Toralf Kirsten, Alexander Kiel, Mathias Rühle, Jonas Wagner
numeric codes 0 (no) and 1 (yes) instead of alphabetic codes. The changed item descriptions
(for items weight and height) have no effect on the schema SAnthropometry
1. However, schema
SAnthropometry
1has an additional schema element storing values of the new data item F43.
The changed code lists also result in a numeric data type for data item F32 in comparison
to SAnthropometry
0(String). Finally, both schemas need to be associated to the target schema
TAnthropometry to harmonize data within the ETL process. For this reason, we generate and
use mappings MS
Anthropometry
0,TAnthropometry and M
SAnthropometry
1,TAnthropometry , respectively.
3 Matching and Merging Schemas
We firstly describe processes generating and verifying schema mappings. Finally, we
introduce the utilized matching techniques and algorithms.
3.1 The overall Schema Matching Process
The goal of our schema matching process is to find correspondences between the elements
of a source schema and the target schema. We utilize the generated mappings to transfer
the data from each source to the target. Moreover, we use schema mappings to answer
data provenance questions, i.e., to exactly specify from which input form (and item) the
data come from when looking on the target schema and data. However, schema matching
is challenging for two reasons. First, we don’t use a predefined target schema for each
assessment; defining the target schema apriori and adapt this schema with potentially each
schema corrensponding to an input form is too resource intensive. Secondly, most source
schemas are generated by input systems. In some cases the form creator has no influence
on the naming of schema elements; names are concatenated internal identifiers (e.g., form
id + group id + item id). Hence, creating schema mappings by taking (only) schemas as
input is not sufficient. Addressing these two challenges, our approach consists of two steps.
The first step generates the target schema taking a selected input form into account. The
second step creates schema mappings between each source schema and the generated target
schema by transforming the schema matching task to a form matching task producing
mappings between different input forms belonging to the same assessment. Due to the
duality between forms and schemas, the resulting form mappings can be used to derive
required schema mappings. Fig. 3 shows both processes, the generation of the target schema
for a selected input form and the creation of schema mappings for further input forms of the
same assessment.
The mapping process starts when a new input form is created and utilized to capture data.
At first, metadata about the input form and its corresponding schema is imported into the
centralized Metadata Repository (MDR, see also Sect. 4). Then, the schema element table
is associated with the input form metadata, i.e., name and description of the input form
are related to the corresponding table element of the relational schema. Columns of this
table are associated to data items of the input form and, therefore, each column is related
to an item text (i.e., question/parameter text). To keep this import process simple and to
reduce the implementation effort, we import the source schema and its annotation directly
from the input systems managing input forms. For all other cases, e.g., data exports of

Metadata Management for Data Integration in Medical Sciences 181
Fig. 3: Mapping Generation and Verification Processes
medical devices, this metadata are specified in a spreadsheet by responsible users that can
be imported into the MDR.
By selecting an input form for which the corresponding source schema and additional form
metadata are available in the MDR, we can derive the target schema for an assessment
(part “first form mapping” in Fig. 3). Typically, we select the first input form that have
been chronologically created and used to load and access harmonized data to/of the target
database. The constructed target schema consists of a column for each source column (1:1
mapping). The schema mapping is inherently created and persisted within the MDR. The
names of the target schema (table and column name) are automatically created following
a global notation. The user can later (in the verification process) specify an alias for each
column to associate a semantic meaningful name. According to the source schema, the
generated correspondences of the schema mapping consists of a transformation expression.
There is a predefined set of conversion functions to transform values w.r.t. their data type
since the used input systems in LIFE mostly utilize VARCHAR or TEXT (CLOB) as
standard data type which are typically not the preferred type in the target schema. Therefore,
data values are parsed during the process to recognize the data type (numeric or date).
Since most items (questions) in questionnaires and interviews utilize predefined code lists
which have mostly not more than 10 answers, this task is not very resource intensive. Only
for open questions (no predefined code list) we parse the first 100 values. Special value
transformations, such as from feet to centimeter, are not recognized; they can be added and
set on demand by manual interaction in the verification process.

182 Toralf Kirsten, Alexander Kiel, Mathias Rühle, Jonas Wagner
Note, that the target finally contains tables for each assessment. There is (currently) no
target table that is associated with input forms of multiple assessments. The reason for this
is that the structure should be harmonized first to overcome the heterogeneity of different
input forms of potentially multiple input systems. In additional steps, the target tables can
then be joined on demand to meet the data requirements of diverse analysis projects. That
allows us to automatically derive and adopt the target schema from the source schemas
during the schema matching process instead of creating it manually and a priori.
Once the target schema has been created for a selected input form, we generate mappings
between source schema and the generated target schema for all further input forms at the
time they are created and productively used (part “non-first form mapping” in Fig. 3). Since
names of schema elements are typically generated by input systems, they can’t be used to
successfully generate schema mappings. Therefore, the central idea is to move the schema
match problem to a matching between input forms, firstly. We select two input forms Fi and
Fj as input for this match process. For one of these input forms, say Fi , a schema mapping
MSi,T for its corresponding source schema Si already exists whereas for Sj (corresponding
to Fj) there is no mapping MS j,T available. To derive the mapping MS j,T , we generate the
mapping MFi,Fjand compose the result with the mappings MFi,Si and MFj,S j
between
forms and its corresponding schema. Hence, the composition generates the intermediate
mapping M ′S j,T
by
M ′S j,T
:= (MFj,S j)−1 ◦ (MFi,Fj
)−1 ◦ MFi,Si ◦ MSi,T
The inverse of a given mapping MX,Y is defined as (MX,Y )−1= ((MY,X )
−1)−1= MY,X .
Deleted items, i.e., all items present in Fi but not in Fj , have no correspondence in MFi,Fj.
Similarly, added items, i.e., all items present in Fj but not in Fi , also have no correspondence
in MFi,Fj. Only the latter case is of interest for M ′
S j,Tbecause there are potentially schema
elements in Sj (new data items) with missing correspondences. Therefore, we generate a
new schema element in T and inherently new correspondences for each schema element in
Sj which has no counterpart in T as defined by M ′S j,T
. This generated correspondence set is
added to M ′S j,T
and builds the final MS j,T . Note, we do not differentiate between new items
in Fj and those for which the match process does not bring out a correspondence in MFi,Fj,
e.g., due to low similarity of questions texts.
This approach has several advantages. We reuse the mapping MSi,T . This mapping is
manualy checked (see below) and, thus, has a good quality. The mappings MFi,Si and MFj,S j
are inherently given when a new input form together with its schema is imported into the
MDR. Hence, the quality of M ′S j,T
is mainly driven by the quality of the computed mapping
MFi,Fj. Moreover, transformation expressions specified for schema correspondences of
MSi,T can be reused. For example, a schema correspondence associates a text column of Sicontaining date values that are transformed into dates using a special conversion expression,
then we expect that the schema element in Sj for the same target item comprises also date
values and the conversion expression can be applied again.
In a separate process (part “user-based mapping verification and correction” in Fig. 3), we
allow users to modify the automatically generated mapping. The user feedback is important

Metadata Management for Data Integration in Medical Sciences 183
to correct the current mapping but also has implications to future mappings since it is reused
in the next match process. We allow the user to change the target schema but also the mapping
itself. The former includes data type changes and aliasing of target columns. We also allow
the user to modify the code and label of predefined answers since we have experienced
different codes and labels of such answers over different input form versions. Mapping
modifications occur when the user replaces the automatically determined transformation
expression or decide to split a target column, e.g., when the predefined answer set for items
using the same (question) text/description in two consecutive input form versions differ
significantly. This decision can not be automatically derived but needs human interaction.
We currently use a spreadsheet to verify and modify a mapping. The spreadsheet is protected
in some area to show as much information as possible and to modify as much information
as necessary. Once a mapping is verified it can be imported and updated in the central MDR.
This verification process on a single mapping can be iteratively executed to continually
improve schema mappings. In the near future, we will work on a web-based user interface
allowing selected users to verify and modify mappings online.
3.2 Schema Matching Techniques and Algorithms
In the following, we introduce selected algorithms computing the mapping for all input
forms F0 < Fi ≤ Fn of non-first input forms; the generation of the schema mapping MS0,T
for the first input form F0 is simple as described in the previous subsection. The Algorithm 1
shows the overall matching process generating mappings MSi,T for non-first forms Fi (i > 0);
this process has been introduced in the previous subsection. Algorithm 2 and Algorithm 3
show the process of aligning two selected input forms Fi−1 and Fi in more detail. We use a
blocking strategy in the match process determining the form mapping construction. The
overall idea of blocking is to limit the search space and, thus, to reduce the number of
Algorithm 1 Non-First-Form Match
Require: Input Forms Fi−1, Fi , mappings MFi−1,Si−1, MFi,Si , target schema T , schema mapping
MSi−1,T
Ensure: Schema mapping MSi,T
1: MFi−1,Fi:= match-form(Fi−1, Fi)
2: MSi,Fi−1:= compose(inverse(MFi,Si ), inverse(MFi−1,Fi
))
3: MSi,Si−1:= compose(MSi,Fi−1
, MFi−1,Si−1)
4: M ′Si,T
:= compose(MSi,Si−1, MSi−1,T )
5: Snon-matchedi
:= Si\ domain(M ′Si,T
)
6: create schema mapping M ′′Snon-matchedi
,Twith empty correspondence set
7: for eSi ∈ Snon-matchedi
do
8: create new schema element (column) et in target schema T
9: create new correspondence c(eSi , et, 1) → M ′′Snon-matchedi
,T
10: end for
11: MSi,T := union(M ′Si,T
, M ′′Snon-matchedi
,T)
12: return MSi,T

184 Toralf Kirsten, Alexander Kiel, Mathias Rühle, Jonas Wagner
Algorithm 2 Match-Form
Require: Input Forms Fi−1, Fi , threshold t
Ensure: Form mapping MFi−1,Fi
1: for gFi−1∈ GFi−1
do
2: for gFi∈ GFi
do
3: if gFi−1.title = gFi
.title then
4: MFi−1,Fi:= union(MFi−1,Fi
, match-block(gFi−1, gFi
, t)
5: end if
6: end for
7: end for
8: return filterBest(MFi−1,Fi)
element comparisons. A block consists of all items belonging to a predefined item group.
Each block is identified by the group title; there are no two groups within a single input form
using the same group title. We also expect that the group title does not change over time and
is the same in forms of different input systems. The reason for this is that new input forms
are mainly created by modifying the most recent input form. The applied change operations
consist in add (e.g., adding new items), delete (e.g., deletion of existing items), and change.
The latter operation is mostly applied to re-arrange items in a single item group, e.g., by
changing the rank order of items or by manipulating the item text to correct misspellings or
misunderstandings. Moreover, using the group title as block identifier simplifies the block
construction. Therefore, a separate block construction in a pre-processing can be avoided
saving runtime and main memory consumption.
The data items of two blocks are only compared when their corresponding block identifier
is identical. The reason for this is twofold. Firstly, in some cases there are a lot of very
similar group titles within a single input form, such as questions 1, questions 2, . . . or
medication 1, medication 2, . . . etc. which makes it challenging to find the most similar
group. Secondly, some input forms contain recurring items, i.e., a defined list of items
(questions) occurring on several pages. In such cases, the participant gives information to an
Algorithm 3 Match-Block
Require: Blocks gFi−1, gFi
, threshold t
Ensure: Block-based schema mapping MgFi−1,gFi
1: create MgFi−1,gFi
with empty correspodence set
2: for itemFi−1∈ gFi−1
.items do
3: for itemFi∈ gFi
.items do
4: s := similarity(itemFi−1, itemFi
, t)
5: if s ≥ t then
6: create correspondence c(itemFi−1, itemFi
, s) → MgFi−1,gFi
7: end if
8: end for
9: end for
10: return MgFi−1,gFi
Metadata Management for Data Integration in Medical Sciences 185
Algorithm 4 filterBest
Require: Form mapping MFi−1,Fi
Ensure: Filtered form mapping MFi,Fi−1
1: SetI temDomain
:= ∅, SetI temRange
:= ∅
2: Csorted := sort C of MFi,Fi−1order by descending similarity
3: for c ∈ Csorted do
4: if domain(c)∈ SetI temDomain
OR range(c) ∈ SetI temRange
then
5: remove c from MFi,Fi−1
6: else
7: domain(c) → SetI temDomain
8: range(c) → SetI temrange
9: end if
10: end for
11: return MFi−1,Fi
undefined number of medications, diseases in the past, children etc.; mostly this undefined
number is a priori limited by the number of groups that the form designer created. However,
such group replications result in multiple correspondences between data items and it is
hard to automatically decide which element of form Fi−1 refers to which element in form Fi
when the group information is ignored.
We utilize two specific matchers to decide whether two data items are equivalent. Both
matchers take two items as input and return the calculated similarity between them. The
first matcher computes the trigram similarity of concatenated item code and text (e.g.,
question text). The second matcher compares two items by the overlap of their corresponding
pre-defined code lists. The reason is that two items using similar question text but mainly
differ in their code lists should not be merged since a merge of two items also implies the
merge of their code lists. Finally, a correspondence between both items is created and added
to the resulting form mapping when the averaged similarity of both matcher exceeds a given
threshold t.
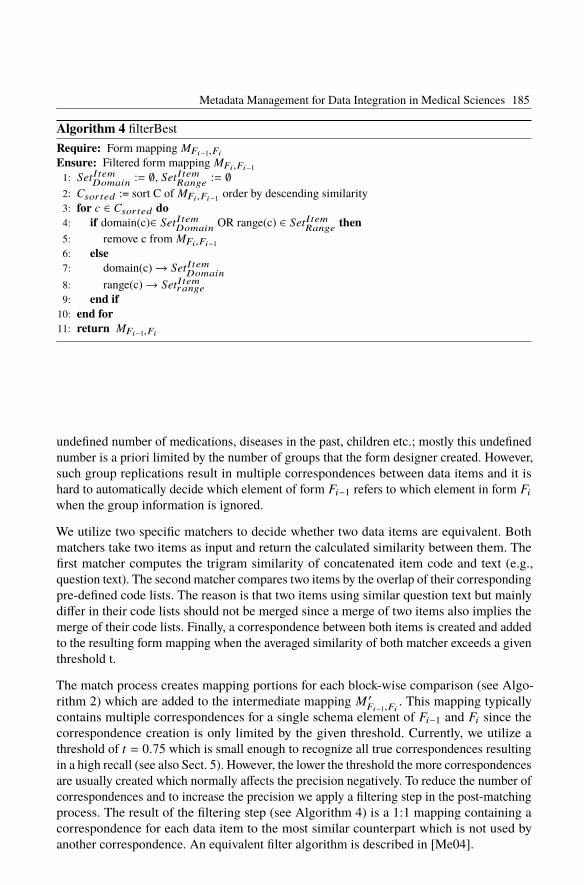
The match process creates mapping portions for each block-wise comparison (see Algo-
rithm 2) which are added to the intermediate mapping M ′Fi−1,Fi
. This mapping typically
contains multiple correspondences for a single schema element of Fi−1 and Fi since the
correspondence creation is only limited by the given threshold. Currently, we utilize a
threshold of t = 0.75 which is small enough to recognize all true correspondences resulting
in a high recall (see also Sect. 5). However, the lower the threshold the more correspondences
are usually created which normally affects the precision negatively. To reduce the number of
correspondences and to increase the precision we apply a filtering step in the post-matching
process. The result of the filtering step (see Algorithm 4) is a 1:1 mapping containing a
correspondence for each data item to the most similar counterpart which is not used by
another correspondence. An equivalent filter algorithm is described in [Me04].

186 Toralf Kirsten, Alexander Kiel, Mathias Rühle, Jonas Wagner
3.3 Schema Merging
Mapping the schema of a second input form to the same target table implies that the associated
target schema needs to be adapted. Following our concept, there are two situations in which
the target schema is adapted. First, schema elements of the new source schema for which no
counterpart in the current target schema could be found are associated with new schema
elements that are added to the target schema. The target schema increases since only table
columns can be added; we avoid column deletions in the mapping generation process
because they would result in loosing data. Other possible schema modifications, such as
data type transformations, are reported to and solved in the user-based mapping validation,
the second process in which the target schema can be adapted. In this process, the user
can verify and refine the created mapping. Column deletions would result when the user
maps a new column of the source schema for which the mapping process has not found a
counterpart and, thus, a new target column has been created. Since the validation process is
necessary before the target schema is implemented and data is loaded to the target schema,
the deletion of schema elements is only an intermediate step. In case the mappings to a
single target table needs to be completely reorganized, we firstly remove and recreate the
target table and then load relevant data from source systems afterwards.
4 Schema Matching Infrastructure
We utilize a service-based infrastructure to manage source schemas including corresponding
metadata of input forms. Fig. 4 shows an overview of the infrastructure consisting of different
input systems, the MDR and the Research Database. There are two types of input systems
differentiated by their functionality to use and provide metadata of input forms. We use
LimeSurvey [Li16] as online input system which is currently the only system providing
metadata and data. The commercial system Teleform is used to design paper-based input
forms which can be automatically scanned and converted (OCR) after they have been filled
with data by study participants. Although, Teleform system manages metadata about the
designed input form, we were unable to use them since form designers in LIFE used the
graphical mode to design forms which brings out no utilizable metadata. Therefore, we
manually created metadata according to the designed input forms. There is a large amount
of external sources including laboratory data and those generated by medical devices and/or
provided in spreadsheets etc. The MDR imports metadata about input forms and schema
directly from the API of the LimeSurvey system. The metadata of other input systems are
specified using a spreadsheet template. All collected metadata data are accessible by a
comprehensive REST-ful web-service interface. We use a web-based application to import
metadata as well as creating and managing mappings. Mappings can be downloaded and
distributed to research groups who have provided input forms of an assessment. They
validate and correct mappings; mappings within the repository are updated when mapping
spreadsheets are returned and uploaded. We will work on a web-application allowing to
adapt mappings directly instead of using spreadsheets.
A fundamental part of the MDR infrastructure is the central repository. Fig. 5 shows the
high-level relational schema of this repository. It consists of two main parts for managing
schemas, code lists and their mappings. For the first part, the schema and mapping portion,

Metadata Management for Data Integration in Medical Sciences 187
Fig. 4: Data Flows of scientific Data and Metadata - Use of the MDR
we explicitly differentiate between source and target schemas (see repository tables holding
source and target table and column metadata). Unlike target schema, source schemas contain
selected descriptions of the corresponding input form, i.e., information about the form,
groups and items. This schema portion is denormalized but simplifies the import and
querying and will never updated since source schemas of input forms will never change.
Each imported source schema and created target schema is associated with a source (table
Source). We additionally describe sources by connection information allowing to access
sources, e.g., when the target schema is manipulated and when the data are extracted,
transformed and loaded from sources to the target.
Code lists and transformation expressions are managed in the second portion of the repository
schema. We differentiate between code lists of sources and target. Source code lists are
defined when the input forms and their corresponding schema is imported whereas target
code lists are created and adopted by the match process. Target code lists can be adapted by
users when the corresponding schema mapping is validated to modify codes and labels,
e.g., to replace alphanumeric with numeric codes. During the mapping generation process a
mapping is created interrelating source and target code lists. The code list mapping is then
used in the ETL process when data need to be transformed.
There are columns in source and target schemas which are not associated with code lists
(e.g., text input such as comments or numeric values). To transform values of such columns
we define and implement database functions on demand. For example, we implemented
general functions converting values between different data types but also specific functions,
such as transforming values from pounds to kilograms. Moreover, we also experienced
the requirement to transform only specific values. Such values are typically expressions

188 Toralf Kirsten, Alexander Kiel, Mathias Rühle, Jonas Wagner
Fig. 5: High-level Database Schema of the Metadata Repository
for a special state, e.g., to express that a value could not be measured etc. Such “default”
values can be differently defined by several groups designing the input forms but should
be harmonized when the data are transferred to the target. Therefore, we pre-define value
mappings (table Single Value Transformation) defining which source value is transformed
into which target value. Transformations are associated to column mappings and, thus, are
not globally executed per default.
Each source and target column is associated with the data type it is implemented. However,
different database management systems including MySQL, MSSQL, and Oracle provide
similar data types which differ at least in their name (MySQL: VARCHAR → Oracle:
VARCHAR2). While data types of a source schema column are associated (table Data
Type) in the import process, we provide a predefined data type mapping to construct the
target schema using the correct data type. Unlike other mappings, the data type mappings
do not map two equivalent data types but associate data type patterns to concrete target
data types. A data type pattern represents multiple data types using the same type (e.g.,
VARCHAR, NUMERIC) but varying in their length and precision; length and precision are
restricted by an upper and lower bound. Using data type patterns instead of concrete data
types necessitates only few predefined data type mappings to address type differences of
several database management systems. All these kinds of transformations can be specified
for a single correspondence (table Column Mapping) and influences the target schema
creation or adoption as well as data transformation processes.
5 Evaluation
In this section, we first give an overview about metadata and then discuss selected results.

Metadata Management for Data Integration in Medical Sciences 189
5.1 Evaluation Data and Setup
System and matcher evaluation is typically difficult in the absence of a gold standard of an
at least similar scenario. We use metadata and available mappings for the evaluation. This
data has been collected over the last five years (since 2011). Mappings are verified by a
small set of persons who have been qualified by special internal trainings. Therefore, we
use these available mappings as gold standard for the evaluation. Tab. 1 shows an overview
of the assessment and input form quantity structure per input systems and examination
type. Most assessments has been implemented by input forms in LimeSurvey. The Teleform
system is mainly used for questionnaires. Laboratory Data and input forms for process
documentation is captured by our in-house LIMS (Laboratory Information Management
System). All other data sources, i.e., spreadsheets, desktop databases etc. are subsumed by
“External Sources”. Especially in LimeSurvey and Teleform, there are 2 to 4 input forms
per assessment. Assessments of the LIMS and of external sources are mainly implemented
by a single input form. These forms are typically “virtual” forms, i.e., they are created to
capture data generated by laboratory devices (within the wet lab) or are extracted, prepared,
and imported from medical devices into an import schema. An exception includes physical
examination forms (no laboratory results) of the LIMS. These forms are input forms to
document specimen extraction processes. The complexity of assessments (measured by
average number of items per form) differs widely. It ranges from 10 items (input forms for
laboratory processes) to approx. 170 items used in interviews and, thus, does not depend on
the input system but on the examination type. We also see that complex assessments are
mainly implemented in multiple input forms. Hence, a manual mapping generation is a very
resource-intensive task.
Data
SourceExamination Type
|Assess-
ments||Forms|
avg (|Forms per
Assessment|)
avg (|Items
per Form|),
(min - max)
LimeSurvey
Interview 88 195 2.2133.43
(19 - 844)
Questionnaire 287 568 1.953.44
(13 - 728)
Phys. Examination 218 438 2.074.20
(13 - 789)
TeleformQuestionnaire 59 194 3.3
86.51(37 - 411)
Phys. Examination 1 4 4.036.75
(36 - 37)
LIMSLaboratory Data 121 123 1.0
20.56(14 - 191)
Phys. Examination 57 89 1.610.63
(8 - 17)
External
Sources
Interview 3 3 1.0105.00
(18 - 206)
Laboratory Data 1 1 1.025.00
(25 - 25)
Questionnaire 18 18 1.039.17
(16 - 153)
Phys. Examination 71 74 1.148.35
(6 - 276)
Tab. 1: Quatity Structure of Input Forms and Items per Examination Type and Input System

190 Toralf Kirsten, Alexander Kiel, Mathias Rühle, Jonas Wagner
|Mappings| |Assessments|avg (|Items per
Assessment|)
min - max(|Items
per Assessment|)
1 528 47.5 6 - 789
2 138 78.9 6 - 844
3 62 59.7 9 - 279
4 37 101.9 19 - 637
5 31 73.6 16 - 463
6 22 74.6 19 - 411
7 22 58.9 17 - 425
8 12 83.6 20 - 467
9 2 65.6 27 - 197
10 1 102.9 83 - 119
Tab. 2: Mapping Quantity
The idea of Tab. 2 is to show the number and complexity of generated mappings. In
particular, it counts assessments (target schemas) in column 2 which are associated with a
given number of input forms (= |source schema| = |mappings|) in column 1. For example,
there are 538 assessments interrelated with only a single input form, 138 assessments which
are associated with two input forms and so on. Hence, more than the half of available
assessments are associated with a single input form for which the match generation process
has not been applied. This set includes old input forms which are used as a test form but
also new input forms which haven’t changed so far. The number of assessments decreases
for an increasing number of mappings. There is only one assessment available which is
associated to 10 input forms, each contains on average 103 items.
5.2 Quality Evaluation
The goal of this evaluation is to analyze the quality of the match generation process. The
evaluation utilizes the available and manually checked mappings from the productive
instance as gold standard; we only include assessments to which two or more input forms
are associated (see Tab. 2 column 1). We created mappings by varying the distance measure
and the threshold. We implemented different trigram distance measures and the Levenshtein
distance; distances are converted into similarities 0 ≤ sim(x, y) ≤ 1 ⊂ R. The similarity
value 0 means that x and y are maximal distant and the value 1 stands for equality of x
and y. Fig. 6 consists of three charts showing precision, recall and F-measure for the for
different distance measures and threshold values ranging from 0.5 to 1.0 (stepwidth 0.1).
All utilized distance measures have a higher precision than 95%; TrigramJaccard shows
the best precision over all measured thresholds while Levenshtein distance measure result
in smallest precision values but with a small offset to TrigramJaccard. In constrast to
precision, Levenshtein’s recall values are on the high end while those of TrigramJaccard are
on the lower end. The lowest recall (63%) obtain all distance measures for the threshold 1.0.
Except TrigramJaccard all used distance measures achieve an F-measure higher than 92%
using a threshold from 0.5 to 0.9. The lowest F-measure (77%) for all distance measures is
obtained for threshold 1.0. This means that there are only minimal changes in question texts

Metadata Management for Data Integration in Medical Sciences 191
●
●
●
●
●
●●
●●
●
●
●
● ●●
●
●
●
Precision Recall
F−measure
98.5%
99.0%
99.5%
100.0%
70%
80%
90%
80%
85%
90%
95%
0.5 0.6 0.7 0.8 0.9 1.0 0.5 0.6 0.7 0.8 0.9 1.0
0.5 0.6 0.7 0.8 0.9 1.0
Confidence Threshold
Distance Measure
● Levenshtein
TrigramCosine
TrigramDice
TrigramJaccard
Fig. 6: Quality Evaluation Results using Precision, Recall and F-Measure
of corresponding data items between different input forms. Larger text changes normally
result in a shifted meaning of data item and, thus, are also mapped to a new target column.
However, diving into the results shows that our approach doesn’t recognize negations, i.e.,
data items using nearly the same question text and same code lists but the meaning is turned
around. The word “not” is too short to influence the distance measures. Moreover, there
is also a small set of data items which utilize images instead of question text. The MDR
doesn’t import images, i.e., the item description (question text) for such data items is empty.
Hence, mappings between such items are typically false positive by chance.
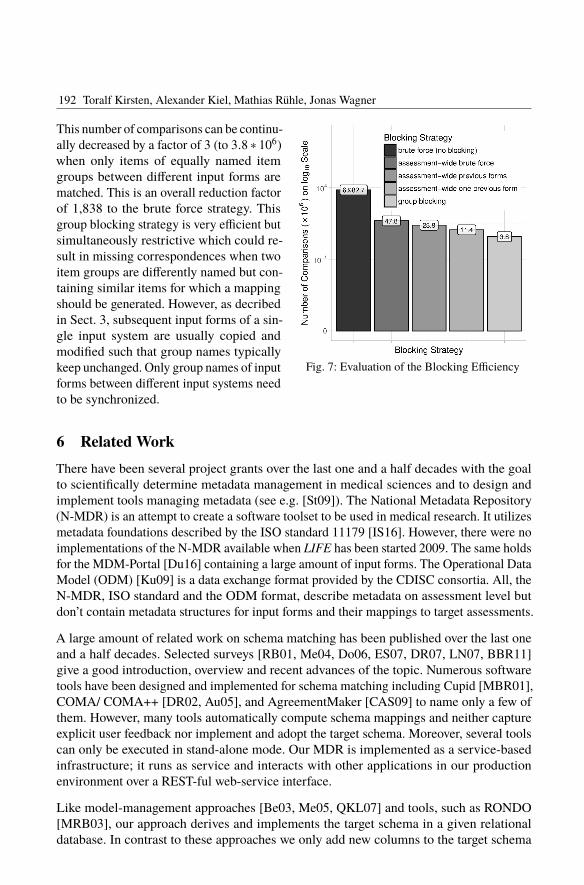
5.3 Blocking Evaluation
The goal of this evaluation is to analyze the efficiency of the blocking strategy used by our
approach. There are different other potential blocking strategies; Fig. 7 shows the number
of comparisons (during mapping generation process) using these blocking strategies. Note,
a matching is only executed when there are multiple input forms per assessment available
(see Tab. 2). A brute force strategy doesn’t take a blocking into account and, thus, compares
each items of each assessment with each other item (independently from the assessment).
The resulting high number (6, 982.7 ∗ 106) of item comparisons can be decreased by a factor
of 146 (to 47.8 ∗ 106 comparisons) when generating the cross product of items of input
forms belonging to the same assessment (target). We call this strategy assessment-wide
brute force. Next, this number of comparisons can be halved (to 23.9 ∗ 106 comparisons)
when a matching is only executed between items of unmatched and already matched input
forms. Computing correspondence similarities of items of a single unmapped input form
with items of a single but already matched input form, e.g., the previous form as described
above, results in, again, the half number of correspondences (11.4 ∗ 106 comparisons).
192 Toralf Kirsten, Alexander Kiel, Mathias Rühle, Jonas Wagner
Fig. 7: Evaluation of the Blocking Efficiency
This number of comparisons can be continu-
ally decreased by a factor of 3 (to 3.8 ∗ 106)
when only items of equally named item
groups between different input forms are
matched. This is an overall reduction factor
of 1,838 to the brute force strategy. This
group blocking strategy is very efficient but
simultaneously restrictive which could re-
sult in missing correspondences when two
item groups are differently named but con-
taining similar items for which a mapping
should be generated. However, as decribed
in Sect. 3, subsequent input forms of a sin-
gle input system are usually copied and
modified such that group names typically
keep unchanged. Only group names of input
forms between different input systems need
to be synchronized.
6 Related Work
There have been several project grants over the last one and a half decades with the goal
to scientifically determine metadata management in medical sciences and to design and
implement tools managing metadata (see e.g. [St09]). The National Metadata Repository
(N-MDR) is an attempt to create a software toolset to be used in medical research. It utilizes
metadata foundations described by the ISO standard 11179 [IS16]. However, there were no
implementations of the N-MDR available when LIFE has been started 2009. The same holds
for the MDM-Portal [Du16] containing a large amount of input forms. The Operational Data
Model (ODM) [Ku09] is a data exchange format provided by the CDISC consortia. All, the
N-MDR, ISO standard and the ODM format, describe metadata on assessment level but
don’t contain metadata structures for input forms and their mappings to target assessments.
A large amount of related work on schema matching has been published over the last one
and a half decades. Selected surveys [RB01, Me04, Do06, ES07, DR07, LN07, BBR11]
give a good introduction, overview and recent advances of the topic. Numerous software
tools have been designed and implemented for schema matching including Cupid [MBR01],
COMA/ COMA++ [DR02, Au05], and AgreementMaker [CAS09] to name only a few of
them. However, many tools automatically compute schema mappings and neither capture
explicit user feedback nor implement and adopt the target schema. Moreover, several tools
can only be executed in stand-alone mode. Our MDR is implemented as a service-based
infrastructure; it runs as service and interacts with other applications in our production
environment over a REST-ful web-service interface.
Like model-management approaches [Be03, Me05, QKL07] and tools, such as RONDO
[MRB03], our approach derives and implements the target schema in a given relational
database. In contrast to these approaches we only add new columns to the target schema

Metadata Management for Data Integration in Medical Sciences 193
and recreate the target schema or portions of it when other operations (attribute changes
or deletions) are required. This strategy is simple but does not require powerful model-
management-operators as introduced in [Me04].
7 Conclusion
In this paper, we presented an approach to manage metadata for data integration in medical
sciences. The data are captured by different input forms and systems. Potentially, there
are multiple input forms per assessment. They belong to different input systems but also
structurally change over time. Metadata about input forms and schemas are collected and
centrally managed by a Metadata Repository (MDR). Based on these metadata, the MDR
automatically generates target schemas and schema mappings in a two step process. The
first step derives the target schema from a schema of a selected input form. The second
step iteratively creates mappings between schemas of input forms and the target schema by
mapping data items of input forms. Target schema and schema mappings are extensively
used by the ETL process to transfer data from data source to the research database. Moreover,
the metadata are used to automatically create quality reports and to generate annotated
schema forms.
Our approach is completely implemented using a service-based infrastructure running in a
production environment of the large bio-medical research project LIFE. It has been applied
for many input forms resulting in a target database with more than 900 assessments (target
tables). We evaluated the schema matching approach by using manually verified mappings.
In the future, we will associate data items of the target schema with public ontologies and
terminologies as prerequisite to exchange and compare data with other studies on item level.
Acknowledgment
This publication is supported by LIFE - Leipzig Research Center for Civilization Diseases,
Universität Leipzig. LIFE is funded by means of the European Union, by the European
Regional Development Fund (ERDF) and by means of the Free State of Saxony within the
framework of the excellence initiative.
References
[Au05] Aumüller, David; Do, Hong-Hai; Massmann, Sabine; Rahm, Erhard: Schema and ontologymatching with COMA++. In: Proc. of the SIGMOD Conference. 2005.
[BBR11] Bellahsene, Zohra; Bonifati, Angela; Rahm, Erhard: Schema Matching and Mapping.Springer Verlag, 2011.
[Be03] Bernstein, Phil A.: Applying Model Management to Classical Meta Data Problems. In:Proc. of the CIDR. 2003.
[CAS09] Cruz, I.; Antonelli, F.; Stroe, C.: AgreementMaker: Efficient Matching for Large Real-WorldSchemas and Ontologies. In: Proc. of the VLDB. 2009.
[Do06] Do, Hong-Hai: Schema Matching and Mapping-based Data Integration. Verlag Dr. Müller(VDM), 2006.

194 Toralf Kirsten, Alexander Kiel, Mathias Rühle, Jonas Wagner
[DR02] Do, Hong-Hai; Rahm, Erhard: COMA - A System for Flexible Combination of SchemaMatching Approaches. In: Proc. of the VLDB. 2002.
[DR07] Do, Hong-Hai; Rahm, Erhard: Matching large schemas: Approaches and evaluation.Information Systems, 2007.
[Du16] Dugas, Martin; Neuhaus, Philipp; Meidt, Alexandra; Doods, Justin; Storck, Michael; Bru-land, Philipp; Varghese, Julian: Portal of Medical Data Models: Information Infrastructurefor Medical Research and Healthcare. Database, 2016, 2016.
[ES07] Euzenat, Jérôme; Shvaiko, Pavel: Ontology Matching. Springer Verlag, 2007.
[IS16] ISO 11179. http://metadata-standards.org/11179, Last online access, October,02 2016.
[Ku09] Kuchinke, W.; Aerts, J.; Semler, S. C.; Ohmann, C.: CDISC Standard-based ElectronicArchiving of Clinical Trials. Methods of Information in Medicine, 48(5):408 – 413, 2009.
[Li16] LimeSurvey - The Open Source Survey Application. http://www.limesurvey.org,Last online access, October, 02 2016.
[LN07] Legler, F.; Naumann, Felix: A Classification of Schema Mappings and Analysis of MappingTools. In: Proc. of the 12th BTW Conference. 2007.
[Lo15] Loeffler, Markus; Engel, Christoph; Ahnert, Peter et al.: The LIFE-Adult-Study: Objectivesand Design of a population-based Cohort Study with 10,000 deeply Phenotyped Adults inGermany. BMC Public Health, 15, 2015.
[MBR01] Madhavan, Jayant; Bernstein, Phil A.; Rahm, Erhard: Generic Schema Matching WithCupid. In: Proc. of the VLDB. 2001.
[Me04] Melnik, Sergey: Generic Model Management: Concepts and Algorithms, volume 2967 ofLNCS. Springer Verlag, 2004.
[Me05] Melnik, Sergey; Bernstein, Phil A.; Halevy, Alon; Rahm, Erhard: Supporting ExecutableMappings in Model Management. In: Proc. of the SIGMOD Conference. 2005.
[MRB03] Melnik, Sergey; Rahm, Erhard; Bernstein, Phil A.: Rondo: A Programming Platform forGeneric Model Management. In: Proc. of the SIGMOD Conference. 2003.
[QKL07] Quix, Christoph; Kensche, D.; Li, X.: Generic Schema Merging. In: Proc. of the CAISE.2007.
[Qu12] Quante, Mirja; Hesse, Maria; Döhnert, Mirko; Fuchs, Michael; Hirsch, Christian; Sergeyev,Elena; Casprzig, Nora; Geserick, Mandy; Naumann, Stephanie; Koch, Christiane; Sabin,MA; Hiemisch, Andreas; Körner, Antke; Kiess, Wieland: The LIFE Child Study: a LifeCourse Approach to Disease and Health. BMC Public Health, 12(1):1021, 2012.
[RB01] Rahm, Erhard; Bernstein, Phil A.: A Survey of Approaches to Automatic Schema Matching.VLDB Journal, 2001.
[St09] Stausberg, Jürgen; Löbe, Matthias; Verplancke, Philippe; Drepper, Johannes; Herre,Heinrich; Löffler, Markus: Foundations of a Metadata Repository for Databases ofRegisters and Trials. In: MIE. pp. 409–413, 2009.