Embed Size (px)
Citation preview
Metabolism of Tac (IL2Rcx): Physiology of Cell Surface Shedding and Renal Catabolism, and Suppression of Catabolism by Antibody Binding By R.RJunghans* and T. A.Waldmann*
From the *Division of Hematology-Oncology, Harvard Medical School, Biotherapeutics Development Lab, New England Deaconess Hospital, Boston, Massachusetts 022 I5; and the *Metabolism Branch, National Cancer Institute, National Institutes of Health, Bethesda, Maryland 20892
Summary The interleukin 2 receptor 0t (IL2Rcl; CD25; Tac) is the prototypic model for soluble receptor studies. It exists in vivo as a transmembrane complete molecule (TM-Tac) on cell surfaces and as a truncated soluble form (sTac; slL2Rot), sTac has been used as a serum marker o f T cell acti- vation in immune disorders and of tumor burden in Tac-expressing malignancies. In vivo, serum levels o f all soluble proteins depend on the balance between production and catabolism, but lit- tle is known about the metabolic features o f this class o f molecules. We have developed a model for Tac metabolism that incorporates new insights in its production and catabolism. Tac was shed from the surface o f malignant and activated human T cells with a modal half-life (tl/2) o f 2-6 h, but which was prolonged under certain circumstances. The rate o f shedding is first order overall and nonsaturable over a two order o f magnitude range o f substrate (TM-Tac) expres- sion. Once shed from cells, sTac is subject to catabolic activities in the host. In vivo studies in mice showed that 90% ofsTac was catabolized by the kidney with a h/2 of 1 h and a filtration fraction o f 0.11 relative to creatinine. The remaining 10% of catabolism was mediated by other tissues with a tl/2 of 10 h. Approximately 1-3% ofsTac is excreted intact as proteinuria with the remaining 97-99% catabolized to amino acids. Antibody to the receptor induced a marked de- lay in sTac catabolism by preventing filtration o f the smaller protein through the renal glomeru- lus and additionally suppressing other nonrenal catabolic mechanisms. A discrepancy between the catabolic rates for Tac and anti-Tac in the same complex was interpreted as a previously un- recognized differential catabolic mechanism, suggesting features o f the Brambell hypothesis and immunoglobul in G transport and catabolism, in which the antigen-in-complex in intracel- lular vesicles is relatively less protected from catabolism than the associated antibody. In light o f the pivotal role played by the kidney in sTac catabolism and the impact of administered anti- body, the serum concentration o f Tac in the settings o f renal dysfunction or antibody therapy is not a suitable surrogate o f activated T cells or o f the body burden o f tumor. These results pro- vide parameters for assessing soluble receptor-ligand interactions generally.
C ell surface receptors, adhesion molecules, and their shed soluble forms are increasingly the subject of bio-
logical and clinical investigations (1, 2). They are widely evaluated for diagnosis and prognosis in human disease (3), and as treatment targets or as therapeutic agents themselves (4, 5). The array o f surface structures generating soluble forms is very large, tallied at 43 in a 1991 review (6), with further molecules described since that time. Yet there is lit- tle data on the generation, distribution, and pharmacology of soluble receptors in general.
The prototypic model for these receptors is the IL2R ot chain. It was among the first to be recognized as having a soluble form, and has additionally been the subject o f di- verse laboratory and clinical investigations. The full IL2R
plays a central role in lymphocyte activation and prolifera- tion. It is comprised of at least three chains (or, [~, ~/), o f which the ot chain (IL2Rot; CD25), termed "Tac ''1 for T
1Abbreviations used in his paper: ATL, adult T cell leukemia; CEA, carcino- embryonic antigen; GFR, glomerular filtration rate; S, substrate surface TM-Tac; ss, steady state; sTac, soluble Tac; TM-Tac, transmembrane Tac; constants: k, Tac shedding rate constant; kmet, Tac metabolic rate constant; k,, renal component of kmet; knr, nonrenal component of kmet; k~e, kev, rate constants for vascular-to-extravascular and extravascular-to- vascular transport, respectively; q, Tac production rate constant; chemical species: A, anti-Tac; B, sTac; AB, monosaturated anti-Tac ] Tac complex; AB 2, bisaturated anti-Tac { Tac2 complex; A*, B*, AB ~, A'B, A'B2, AB2*, radioactive components and their complexes.
1587 j. Exp. Med. �9 The Rockefeller University Press �9 0022-1007/96/04/1587/16 $2.00 Volume 183 April 1996 1587-1602
activation antigen, is the most subject to regulation. Tac is not expressed on resting lymphocytes but is markedly up- regulated with activation o f T, B, and N K cells, and mac- rophages. As such, it has been used as a target for antibodies and other immunodirected therapies that selectively attack activated or malignant Tac-expressing cells while sparing the normal resting T cell repertoire (7). The expression o f this molecule has been extensively investigated from the perspective of sigualing events, promoter regulation, m R N A transcription, and protein synthesis (8).
The efferent part o f Tac regulation--its catabolism--has been less well characterized. Similar to other shed molecules, little is known except that the soluble form o f Tac (sTac) is generated in an active proteolytic process against the mem- brane-bound form (9). sTac levels have been suggested as surrogates o f T cell activation in autoimmune and allograft settings and as a measure o f tumor burden in Tac-express- ing malignancies (10-15). sTac can accumulate to present a significant antigen load that binds administered antibody or IL2 toxin in anti-IL21L therapies, paralleling reports in anti- body therapies directed against lymphomas expressing B cell idiotypes (16), melanomas and neuroendocrine tumors ex- pressing gangliosides GD2 and GD3 (17, 18), and carcino- mas expressing carcinoembryonic antigen (CEA) (19).
The serum level o f sTac, as with all proteins, reflects a balance between the rate o f synthesis and release from cells and the fractional rate o f catabolism. To interpret soluble receptor levels in disease as a measure o f cellular synthesis, one must equally understand the pathophysiological factors that regulate synthesis and that alter the catabolism of the protein. Similarly, the interaction with antibodies or other antireceptor molecules has the potential to perturb this in vivo balance. Accordingly, several aspects o f the regulation o f soluble receptor were examined, sTac production was measured from Tac-expressing human cells in culture to infer mechanisms of soluble receptor generation. Metabolic evaluations were performed in mice to derive pharmacoki- netic parameters and to assess the role o f the kidney in ca- tabolism. Finally, reciprocal studies examined the impact o f soluble receptor-antibody interactions on catabolism to antic- ipate the iatrogenic impact o f such therapeutic interventions.
Materials and Methods
Cells and Cell Lines
Malignant cells from patients were harvested from blood on Ficoll-Hypaque. 2 • 106 cells were dispensed in 24-well plates in 2 ml RPMI 1640 + 5% human AB serum. Tac-expressing T cell line HUT102 was maintained in RPMI + 10% FCS.
Surface Tac (Transmembrane-Tac) and s Tac
Viability was monitored by Trypan blue exclusion. Trans- membrane (TM)-Tac was quantitated by 3H-anti-Tac antibody (gift of R. Kozak, NIH, Bethesda, MD) binding modified from earlier methods (20). sTac was determined by ELISA (21) by a commercial laboratory (Hazleton Labs, Vienna, VA). The unit definition for sTac was "~ pg or 0.13 fmol. One evaluation era-
ployed T cell activation data from Jacques et al. (22) in an assay closely parallel to our own.
Derivation of Tac Production Rate and SuoCace tl/2
sTac (B) production is modeled as a first order process that is proportional to "substrate" surface TM-Tac expression (S):
dB/dt = kS (Eq. 1)
For fixed cell numbers and changing TM-Tac (primary malignant cells), solution yields:
AB = 1/2kAt(S + So) (Eq. 2)
Where TM-Tac is constant and cell number is changing (cell line HUT102), then
AB = (k/c) S O (N 1 - No) (Eq. 3)
in which c = In (N1/N0)/At. Where cell number and Tac/cell were varying (activated T cells), these methods were combined in a numerical solution (not shown).
Proteins and Radiolabeling
Recombinant human sTac (gift ofJ. Hakimi, Hoffmann-La Roche, Nutley, NJ) was >95% pure by HPLC and SDS-PAGE (not shown). Nonspecific murine antibody UPC (IgG2a, K) was obtained from Cappell Laboratories (Cochranville, PA). Proteins were labeled with 131I or 1251 to ~1-3 IxCi/Ixg as described (20). Antibody bindability was assayed as described (20).
Mice Nu/nu mice (Charles River Laboratories, Wilmington, MA) at
12-16 wk of age maintained on thyroid-blocking doses of KI were injected with radioproteins by tail vein or intraperitoneally in 0.2 ml of 1% BSA in PBS. Other animals were administered radioactivity in continuous infusions with 7-d microosmotic pumps (Alzet, Palo Alto, CA) implanted subcutaneously.
Assay of Protein Survival For rapidly catabolized proteins, or with any protein in ne-
phrectomized or ureter-ligated animals that cannot eliminate cat- abolic products, it is essential to assay protein-bound radioactivity instead of total radioactivity for pharmacokinetics. Methods were modified from Wochner et al. (23). Blood samples were collected in heparinized glass capillaries via tail vein, counted, and cor- rected for protein-bound counts by TCA precipitation or by ex- clusion chromatography of representative samples. For whole body catabolism, carcasses were individually homogenized and al- iquots TCA-precipitated and processed.
Pharmacokinetic Modeling
Blood die-away curves of protein-associated counts were ana- lyzed as two compartment models (Schema 1) using numerical in- tegration by pcNONLIN 4.0 (SCI Software, Lexington, KY), ex- cept as noted. For nephrectomized or ureter-ligated animals, the gradual impact of uremia made it possible only to do el-phase modeling, approximated as a first order system over the first 4--8 h
1588 Metabolism of Tac
of the assay. Nonstandard nomenclature is used to avoid confu- sion with other constants in the exposition.
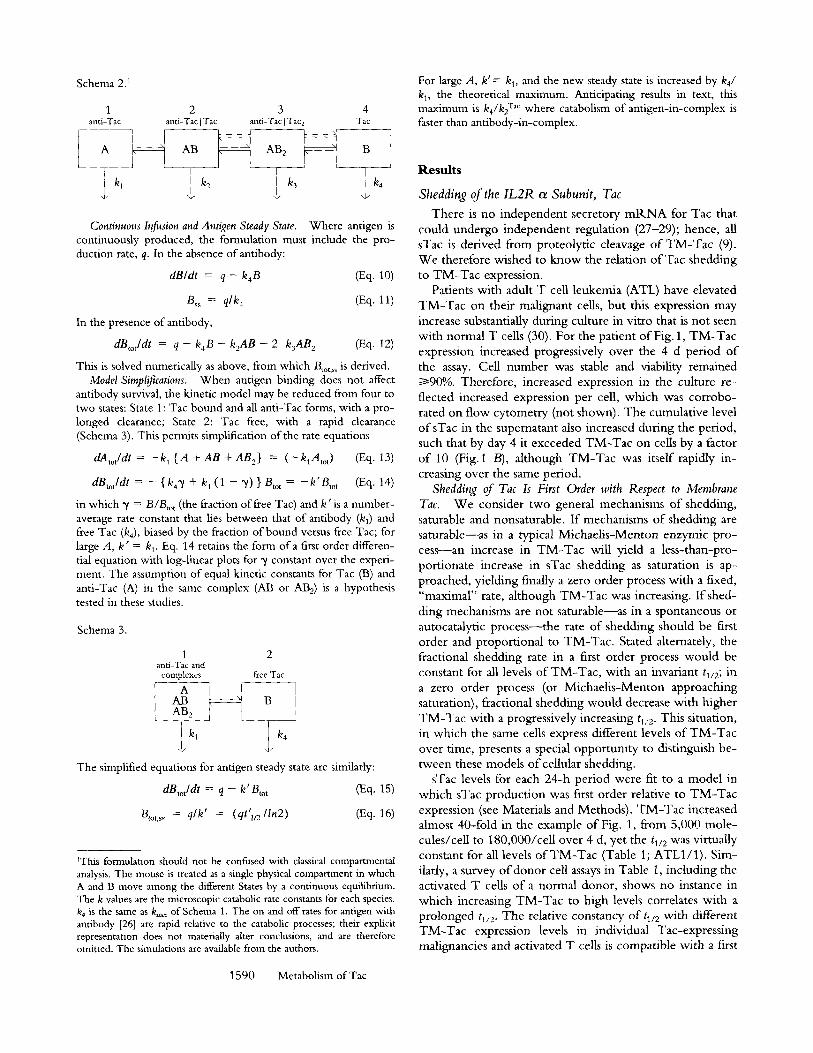
Schema 1.
vascular ~ kmet
inject ', ~ metabolism
kve key
extravascular
Relation of Renal Function to s Tac Levels
sTac (B) concentration in vivo is modeled by zero order pro- duction (q) and first order loss (k~,~t) constants:
dBIdt = q - kmetB (Eq. 4)
kme t is composed of renal (k~) and nonrenal (knr) terms:
krnet = k r + kr~ (Eq. 5)
At steady state (ss), dB/dt = 0, and
Bss ~- q/kme t --~ q/(k r -~- knr ) (Eq. 6)
When renal filtration ofsTac is changed to a , the fraction of nor- mal glomerular filtration rate (GFR), then the new steady state Tac level, Bff, is increased by the fraction:
Bss'/Bss = 1 + (1 - (x) /[ci + kffk,~] (Eq. 7)
= 1 + ([3 - 1 ) / [ 1 + [3kr/knr ] (Eq. 8)
in which [3, the serum creatinine, is inversely related to GFR. The filtration ratio is the ratio of Tac relative to creatinine filtered through the glomeruhis:
FR = k~ * ValGFR (Eq. 9)
G F R for mice is ~0.1 ml /min and the plasma volume is N1 inl, which is taken as the volume of distribution, Va, during the early time ([3-reduced) extrapolation (24).
Experimental Model for Effect of Antibody on Catabolism
Intravenous Bolus. tLadiolabeled Tac (B*) or anti-Tac (A*) was administered alone or with excess unlabeled antibody or antigen. Radiolabeled UPC, an isotype-matched, irrelevant mAb, was in-
cluded as an internal control. Five mice were used in each group. The design of Expt. A2 ensures that antibody will saturate labeled Tac throughout the experiment, but the excess of Tac in Expt. A4 saturates labeled anti-Tac only to 60 h by a two-compartment simulation (not shown). Accordingly, no statistics are reported for A4, which are derived in a more rigorous design in which unla- beled Tac was repeatedly injected intraperitoneally to maintain continuous excess of antigen over antibody. I.p. injection of Tac regenerates the 4-5-h tl/2 of the serum and whole body [3-phase kinetics after i.v. injection, while avoiding the large (x-phase loss that accompanies i.v. dosing. This strategy follows that pursued by Chang et al. (25) to prolong IL2 survival. Tests of plasma con- firmed >90% saturation of anti-Tac through the experiment, whereas anti-Tac before administration was >90% bioactive (bindable). Five mice were used in each group.
Labeled Labeled Unlabeled Expt. Form protein protein protein, i.p.
A3a A* 13q-anti-Tac 125I-UPC
(0.15 ~g; 1 pmol)
A4a A*B 2 131I-anti-Tac 12sI-UPC Tac
(0.15 I~g; 1 pmol) (50 Izg; 2,000 pmol)*
*Administered every 12-24 h
Continuous infusion. Animals were implanted subcutaneously with pumps secreting 131I Tac (B*), then injected with i2si anti- Tac (A) or nonspecific IgG. Two or three mice were used in each group.
Continuously infused Bolus injected Expt. Form Labeled protein Labeled protein
B1 B* 131I-Tac 125I-UPC
(2.6 I-~g; 80 pmol) (200 p,g; 670 pmol) B2 AB* 13aI-Tac 125I-anti-Tac
(2.6 Ixg; 80 pmol) (200 p,g; 670 pmol)
Labeled Labeled Unlabeled Expt. Form protein protein protein
A1 B* 13q-Tac 12sI-UPC
(0.3 p,g; 10 pmol) A2 AB* I31I-Tac 125I-UPC
(0.3 p,g; 10 pmol) A3 A* 13q-anti-Tac 125I-UPC
(0.15 Ixg; 1 pmol) A4 A*B 2 a3q-anti-Tac 125I-UPC
(0.15 Izg; 1 pmol)
anti-Tac
(100 ~g; 670 pmol)
Tac (100 l~g; 4,000 pmol)
Derivation of Equations for Survival Kinetics and Ant i - Tac [ Tac Interaction
Bolus Intravenous Dosing. The net clearance ofant i -Tac (A) is modeled as the sum of the separate first order clearances of the three States of A (1-3) in chemical equilibrium (Schema 2). Clearance of sTac (B) is similarly modeled by three States (2-4), in which two are shared with anti-Tac as complexes and the last is occupied by free sTac. (AB is similarly related to B as shown for AB 2, as indicated by dashed lines.) The interacting kinetics and equilibria were solved numerically (not shown) for the time- dependent concentrations of A, B, AB, and AB 2.
1589 Junghans and Waldmann
Schema 2.1
1 2 3 4 anti-Tac anti-Tac I Tac anti-Tac I Tac2 Tac
Continuous Infusion and Antigen Steady State. Where antigen is continuously produced, the formulation must include the pro- duction rate, q. In the absence of antibody:
dB/dt = q - k4B (Eq. 10)
Bss = q/k 4 (Eq. 11)
In the presence of antibody,
dBtot/dt = q - kaB - k2AB - 2 k3AB 2 (Eq, 12)
This is solved numerically as above, from which Btot,ss is derived. Model Simplifications. When antigen binding does not affect
antibody survival, the kinetic model may be reduced from four to two states: State 1: Tac bound and all anti-Tac forms, with a pro- longed clearance; State 2: Tac free, with a rapid clearance (Schema 3). This permits simplification of the rate equations
dAtot/dt = - k 1 { A + AB + AB2} = (-klAtot) (Eq. 13)
dBtotldt = - {k4" Y + k 1 (1 - ",/) } Bto t = - k ' B t o t (Eq. 14)
in which ~ = B/Btot (the fraction of free Tac) and k ' is a number- average rate constant that lies between that of antibody (kl) and free Tac (k4), biased by the fraction of bound versus free Tac; for large A, k ' = k 1. Eq. 14 retains the form of a first order differen- tial equation with log-linear plots for ~/constant over the experi- ment. The assumption of equal kinetic constants for Tac 03) and anti-Tac (A) in the santo complex (AB or AB2) is a hypothesis tested in these studies.
Schema 3.
1 2 anti-Tac and
complexes free Tac
The simplified equations for antigen steady state are similarly:
dBtot/dt = q - k'Bto t (Eq. 15)
Btot,~ = q/k' = (qt'v2/ln2) (Eq. 16)
1This formulat ion should not be confused wi th classical compartmental analysis. The mouse is treated as a single physical compartment in which A and B move among the different States by a continuous equilibrium. The k values are the microscopic catabolic rate constants for each species. k4 is the same as km~ of Schema 1. The on and off rates for antigen with antibody [26] are rapid relative to the catabolic processes; their explicit representation does not materially alter conclusions, and are therefore omitted. The simulations are available from the authors.
For large A, k '= k 1, and the new steady state is increased by k4/ k 1, the theoretical maximum. Anticipating results in text, this maximum is k4/k2 Tac where catabolism of antigen-in-complex is faster than antibody-in-complex.
R e s u l t s
Shedding of the I L 2 R ct Subunit, Tac
There is no independent secretory m R N A for Tac that could undergo independent regulation (27-29); hence, all sTac is derived from proteolytic cleavage o f T M - T a c (9). W e therefore wished to know the relation of Tac shedding to T M - T a c expression.
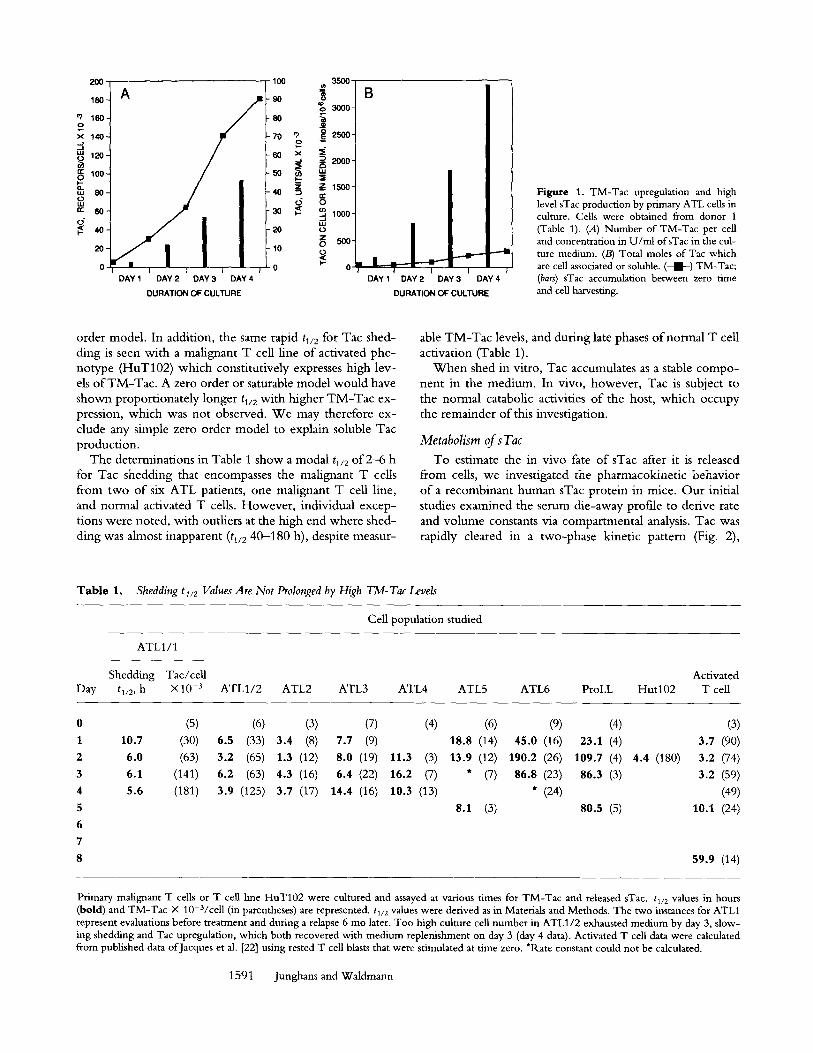
Patients with adult T cell leukemia (ATL) have elevated T M - T a c on their malignant cells, but this expression may increase substantially during culture in vitro that is not seen with normal T cells (30). For the patient o f Fig. 1, T M - T a c expression increased progressively over the 4 d per iod o f the assay. Cell number was stable and viability remained 1>90%. Therefore, increased expression in the culture re- flected increased expression per cell, which was corrobo- rated on flow cytometry (not shown). The cumulative level o fsTac in the supernatant also increased during the period, such that by day 4 it exceeded T M - T a c on cells by a factor o f 10 (Fig. 1 B), although T M - T a c was itself rapidly in- creasing over the same period.
Shedding of Tac Is First Order with Respect to Membrane Tac. W e consider two general mechanisms o f shedding, saturable and nonsaturable. I f mechanisms o f shedding are saturable--as in a typical Michael is -Menton enzymic p ro - cess - -an increase in T M - T a c will yield a less-than-pro- port ionate increase in sTac shedding as saturation is ap- proached, yielding finally a zero order process with a fixed, "maximal" rate, although T M - T a c was increasing. I f shed- ding mechanisms are not saturable--as in a spontaneous or autocatalytic p rocess - - the rate o f shedding should be first order and proport ional to TM-Tac . Stated alternately, the fractional shedding rate in a first order process would be constant for all levels o f T M - T a c , wi th an invariant tl/2; in a zero order process (or Michael is -Menton approaching saturation), fractional shedding would decrease with higher T M - T a c with a progressively increasing b/2. This situation, in which the same cells express different levels o f T M - T a c over time, presents a special opportuni ty to distinguish be- tween these models o f cellular shedding.
sTac levels for each 24-h per iod were fit to a model in which sTac product ion was first order relative to T M - T a c expression (see Materials and Methods). T M - T a c increased almost 40-fold in the example o f Fig. 1, from 5,000 mole- cules/cell to 180,000/cei1 over 4 d, yet the tl/2 was virtually constant for all levels of T M - T a c (Table 1; ATL1/1) . Sim- ilarly, a survey o f donor cell assays in Table 1, including the activated T cells o f a normal donor, shows no instance in which increasing T M - T a c to high levels correlates wi th a prolonged q/2. The relative constancy o f tl/2 with different T M - T a c expression levels in individual Tac-expressing malignancies and activated T cells is compatible with a first
1590 Metabolism of Tac
20O
180'
=? 160- o x 140-
120--
r 100 2
2 0 -
I I I t I DAY 1 DAY 2 DAY 3 DAY 4
DURATION OF CULTURE
IO0 35O0
- 90 o 3000-
70 o
- 6 0 • ~
-40 ~ _Z 1500- d 8
-3o ~ ~ lO00-
- 2 0 o
soo-
0 I.-- 0
B
I I DAY 1
. . - - - I ...-..41-"
DAY 2 DAY 3 DAY 4
DURATION OF CULTURE
Figure 1. TM-Tac upregulation and high level sTac production by primary ATL cells in culture. Cells were obtained from donor 1 (Table 1)_ (A) Number of TM-Tac per cell and concentration in U/ml ofsTac in the cul- ture medium. (/3) Total moles of Tac which are cell associated or soluble. (-D--) TM-Tac; (bars) sTac accumulation between zero time and cell harvesting.
order model. In addition, the same rapid tl/2 for Tac shed- ding is seen with a malignant T cell line of activated phe- notype (HUT102) which constitutively expresses high lev- els of TM-Tac. A zero order or saturable model would have shown proportionately longer tl/2 with higher TM-Tac ex- pression, which was not observed. W e may therefore ex- clude any simple zero order model to explain soluble Tac production.
The determinations in Table 1 show a modal tl/2 of 2--6 h for Tac shedding that encompasses the malignant T cells from two of six ATL patients, one malignant T cell line, and normal activated T cells. However, individual excep- tions were noted, with outliers at the high end where shed- ding was almost inapparent (tl/2 40--180 h), despite measur-
able TM-Tac levels, and during late phases of normal T cell activation (Table 1).
W h e n shed in vitro, Tac accumulates as a stable compo- nent in the medium. In vivo, however, Tac is subject to the normal catabolic activities of the host, which occupy the remainder of this investigation.
Metabolism of s Tac
To estimate the in vivo fate of sTac after it is released from cells, we investigated the pharmacokinetic behavior of a recombinant human sTac protein in mice. Our initial studies examined the serum die-away profile to derive rate and volume constants via compartmental analysis. Tac was rapidly cleared in a two-phase kinetic pattern (Fig. 2),
Table 1. Shedding tl/2 Values Are Not Prolonged by High TM-Tac Levels
Cell population studied
ATL 1 / 1
Shedding Tac/cell Activated Day tl/2, h • 10 -3 ATL1/2 ATL2 ATL3 ATL4 ATL5 ATL6 ProLL Hut102 T cell
0 (5) (6) (3) (7) (4) (6) (9) (4) (3) 1 10.7 (30) 6.5 (33) 3.4 (8) 7.7 (9) 18.8 (14) 45.0 (16) 23.1 (4) 3.7 (90) 2 6.0 (63) 3.2 (65) 1.3 (12) 8.0 (19) 11.3 (3) 13.9 (12) 190.2 (26) 109.7 (4) 4.4 (180) 3.2 (74) 3 6.1 (141) 6.2 (63) 4.3 (16) 6.4 (22) 16.2 (7) * (7) 86.8 (23) 86.3 (3) 3.2 (59) 4 5.6 (181) 3.9 (125) 3.7 (17) 14.4 (16) 10.3 (13) * (24) (49) 5 8.1 (3) 80.5 (5) 10.1 (24) 6 7
8 59.9 (14)
Primary malignant T cells or T cell line HUT102 were cultured and assayed at various times for TM-Tac and released sTac. tl/2 values in hours (bold) and TM-Tac • 10-3/cell (in parentheses) are represented, tl/2 values were derived as in Materials and Methods. The two instances for ATL1 represent evaluations before treatment and during a relapse 6 mo later. Too high culture cell number in ATL1/2 exhausted medium by day 3, slow- ing shedding and Tac upregulation, which both recovered with medium replenishment on day 3 (day 4 data). Activated T cell data were calculated from published data of Jacques et al. [22] using rested T cell blasts that were stimulated at time zero. *Rate constant could not be calculated.
159 t Junghans and Waldmann
100-
10-
1 "'"-.............~
0.1 I 0 5
I I I I I 10 15 20 25 30 TIME, HRS
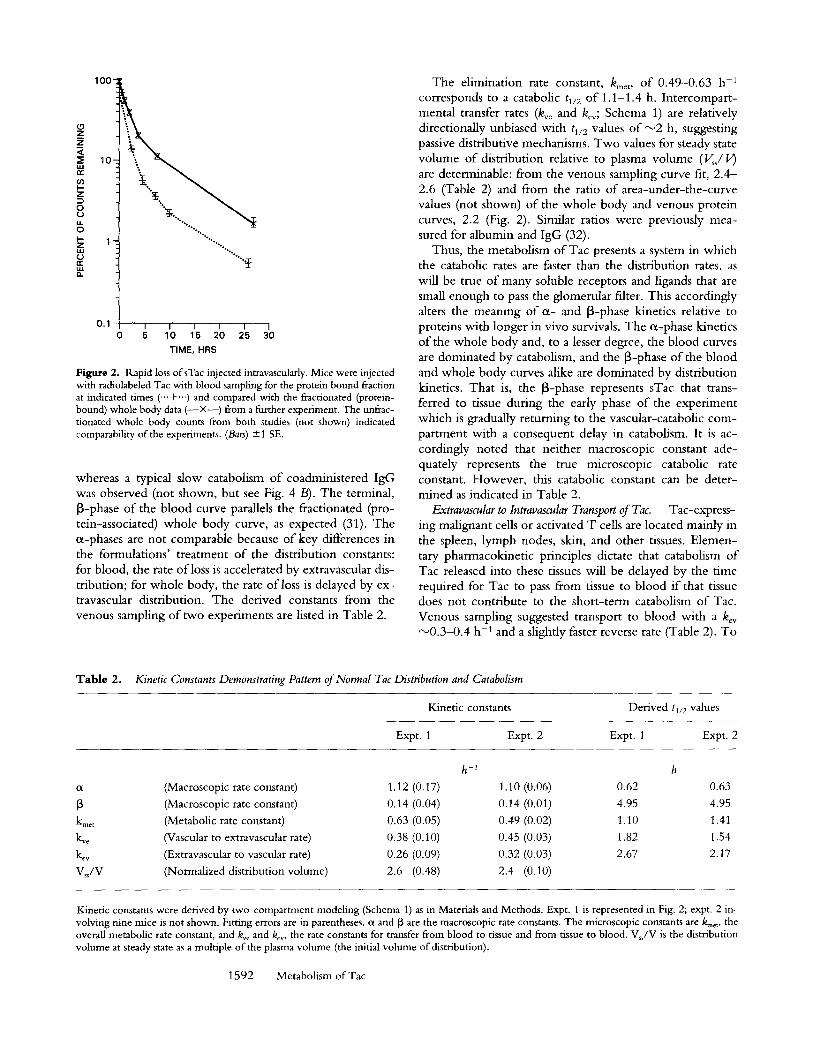
Figure 2. Rapid loss ofsTac injected intravascularly. Mice were injected with radiolabeled Tac with blood sampling for the protein bound fraction at indicated times ('"+'") and compared with the fractionated (protein- bound) whole body data ( - - • from a further experiment. The unfrac- tionated whole body counts from both studies (not shown) indicated comparability of the experiments. (Bars) + 1 SE.
whereas a typical slow catabolism o f coadministered IgG was observed (not shown, but see Fig. 4 B). The terminal, [3-phase o f the blood curve parallels the fractionated (pro- tein-associated) whole body curve, as expected (31). The or-phases are not comparable because o f key differences in the formulations' t reatment o f the distribution constants: for blood, the rate o f loss is accelerated by extravascular dis- tribution; for whole body, the rate o f loss is delayed by ex- travascular distribution. The derived constants from the venous sampling o f two experiments are listed in Table 2.
The elimination rate constant, kmet, o f 0.49-0.63 h -1 corresponds to a catabolic ti/2 of 1.1-1.4 h. Intercompart- mental transfer rates (k~ e and key; Schema 1) are relatively directionally unbiased with tl/2 values o f ~ 2 h, suggesting passive distributive mechanisms. Two values for steady state volume o f distribution relative to plasma volume ( ~ / V ) are determinable: from the venous sampling curve fit, 2 .4 - 2.6 (Table 2) and from the ratio o f area-under- the-curve values (not shown) o f the whole body and venous protein curves, 2.2 (Fig. 2). Similar ratios were previously mea- sured for albumin and IgG (32).
Thus, the metabolism of Tac presents a system in which the catabolic rates are faster than the distribution rates, as will be true o f many soluble receptors and ligands that are small enough to pass the glomerular filter. This accordingly alters the meaning o f or- and [3-phase kinetics relative to proteins with longer in vivo survivals. The or-phase kinetics o f the whole body and, to a lesser degree, the blood curves are dominated by catabolism, and the J3-phase o f the blood and whole body curves alike are dominated by distribution kinetics. That is, the J3-phase represents sTac that trans- ferred to tissue during the early phase o f the experiment which is gradually returning to the vascular-catabolic com- partment with a consequent delay in catabolism. It is ac- cordingly noted that nei ther macroscopic constant ade- quately represents the true microscopic catabolic rate constant. However , this catabolic constant can be deter- mined as indicated in Table 2.
Extravascular to Intravascular Transport of Tac. Tac-express- ing malignant cells or activated T cells are located mainly in the spleen, lymph nodes, skin, and other tissues. E lemen- tary pharmacokinetic principles dictate that catabolism of Tac released into these tissues will be delayed by the time required for Tac to pass from tissue to blood i f that tissue does not contribute to the short- term catabolism o f Tac. Venous sampling suggested transport to b lood with a kcv "~0.3-0.4 h -1 and a slightly faster reverse rate (Table 2). To
Table 2. Kinetic Constants Demonstrating Pattern of Normal Tac Distribution and Catabolism
Kinetic constants Der ived tl/2 values
Expt. 1 Expt. 2 Expt. 1 Expt. 2
h -I h
ot (Macroscopic rate constant) 1.12 (0.17) 1.10 (0.06) 0.62 0.63
[3 (Macroscopic rate constant) 0.14 (0.04) 0.14 (0.01) 4.95 4.95
k .... (Metabolic rate constant) 0.63 (0.05) 0.49 (0.02) 1.10 1.41
k~e (Vascular to extravascular rate) 0.38 (0.10) 0.45 (0.03) 1.82 1.54
key (Extravascular to vascular rate) 0.26 (0.09) 0.32 (0.03) 2.67 2.17
V J V (Normalized distributionvolume) 2.6 (0.48) 2.4 (0.10)
Kinetic constants were derived by two-compartment modeling (Schema 1) as in Materials and Methods. Expt. l is represented in Fig. 2; expt. 2 in- volving nine mice is not shown. Fitting errors are in parentheses, ct and ~3 are the macroscopic rate constants. The microscopic constants are kmet, the overall metabolic rate constant, and/eve and key, the rate constants for transfer from blood to tissue and from tissue to blood. Vss/V is the distribution volume at steady state as a multiple of the plasma volume (the initial volume of distribution).
1592 Metabolism of Tac
mimic this in vivo situation more directly, we investigated the peri toneum as an extravascular site for Tac adminis- tration.
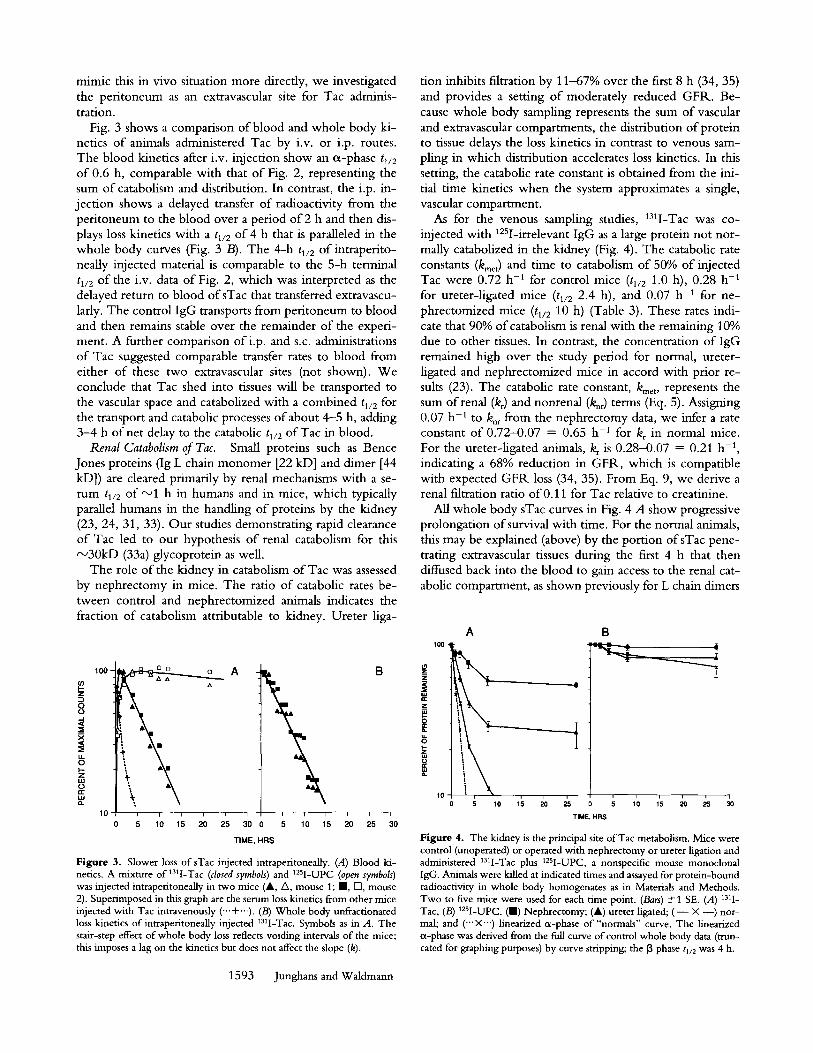
Fig. 3 shows a comparison o f blood and whole body ki- netics o f animals administered Tac by i.v. or i.p. routes. The blood kinetics after i.v. injection show an c~-phase tl/2 of 0.6 h, comparable with that o f Fig. 2, representing the sum o f catabolism and distribution. In contrast, the i.p. in- jection shows a delayed transfer o f radioactivity from the peri toneum to the blood over a period o f 2 h and then dis- plays loss kinetics with a tl/2 of 4 h that is paralleled in the whole body curves (Fig. 3 B). The 4-h tl/2 of intraperito- neaUy injected material is comparable to the 5-h terminal tl/2 of the i.v. data o f Fig. 2, which was interpreted as the delayed return to blood of sTac that transferred extravascu- lady. The control IgG transports from peri toneum to blood and then remains stable over the remainder o f the experi- ment. A further comparison ofi .p, and s.c. administrations o f Tac suggested comparable transfer rates to blood from either o f these two extravascular sites (not shown). We conclude that Tac shed into tissues will be transported to the vascular space and catabolized with a combined t~/2 for the transport and catabolic processes o f about 4-5 h, adding 3-4 h o f net delay to the catabolic tl/2 of Tac in blood.
Renal Catabolism of Tac. Small proteins such as Bence Jones proteins (Ig L chain monomer [22 kD] and dimer [44 kD]) are cleared primarily by renal mechanisms with a se- r u m tl/2 of ~ 1 h in humans and in mice, which typically parallel humans in the handling o f proteins by the kidney (23, 24, 31, 33). Our studies demonstrating rapid clearance o f Tac led to our hypothesis o f renal catabolism for this ~ 3 0 k D (33a) glycoprotein as well.
The role o f the kidney in catabolism o f Tac was assessed by nephrectomy in mice. The ratio o f catabolic rates be- tween control and nephrectomized animals indicates the fraction o f catabolism attributable to kidney. Ureter liga-
100 -
z
0 0
x <C
I,- z
n -
10 i i i i i
0 5 10 15 20 25
A
tion inhibits filtration by 11-67% over the first 8 h (34, 35) and provides a setting o f moderately reduced GFR. Be- cause whole body sampling represents the sum of vascular and extravascular compartments, the distribution o f protein to tissue delays the loss kinetics in contrast to venous sam- pling in which distribution accelerates loss kinetics. In this setting, the catabolic rate constant is obtained from the ini- tial time kinetics when the system approximates a single, vascular compartment.
As for the venous sampling studies, 131I-Tac was co- injected with 125I-irrelevant IgG as a large protein not nor- mally catabolized in the kidney (Fig. 4). The catabolic rate constants (kmet) and time to catabolism o f 50% of injected Tac were 0.72 h -1 for control mice (tl/2 1.0 h), 0.28 h -1 for ureter-ligated mice (tl/2 2.4 h), and 0.07 h -1 for ne- phrectomized mice (tl/2 10 h) (Table 3). These rates indi- cate that 90% o f catabolism is renal with the remaining 10% due to other tissues. In contrast, the concentration o f IgG remained high over the study period for normal, ureter- ligated and nephrectomized mice in accord with prior re- sults (23). The catabolic rate constant, kmet, represents the sum of renal (kr) and nonrenal (k,r) terms (Eq. 5). Assigning 0.07 h -1 to k~ from the nephrectomy data, we infer a rate constant o f 0.72-0.07 = 0.65 h -1 for kr in normal mice. For the ureter-ligated animals, kr is 0.28-0.07 = 0.21 h -1, indicating a 68% reduction in GFR, which is compatible with expected G F R loss (34, 35). From Eq. 9, we derive a renal filtration ratio of0.11 for Tac relative to creatinine.
All whole body sTac curves in Fig. 4 A show progressive prolongation o f survival with time. For the normal animals, this may be explained (above) by the portion ofsTac pene- trating extravascular tissues during the first 4 h that then diffused back into the blood to gain access to the renal cat- abolic compartment, as shown previously for L chain dimers
A l O 0
10 5 10 15 20 ~.5
I I I t i t ~ T I M E
30 0 5 10 15 20 25 30
T IME, HRS
Figure 3. Slower loss of sTac injected intraperitoneally. (A) Blood ki- netics. A mixture of 131I-Tac (closed symbols) and 12sI-UPC (open symbols) was injected intraperitoneaUy in two mice (&, A, mouse 1; II, IS], mouse 2). Superimposed in this graph are the serum loss kinetics from other mice injected with Tac intravenously (-..+...). (B) Whole body unfractionated loss kinetics of intraperitoneally injected I3q-Tac. Symbols as in A. The stair-step effect of whole body loss reflects voiding intervals of the mice; this imposes a lag on the kinetics but does not affect the slope (k).
B
HRS
Figure 4. The kidney is the principal site of Tac metabolism. Mice were control (unoperated) or operated with nephrectomy or ureter ligation and administered 13q-Tac plus 125I-UPC, a nonspecific mouse monoclonal IgG. Animals were killed at indicated times and assayed for protein-bound radioactivity in whole body homogenates as in Materials and Methods. Two to five mice were used for each time point. (Bars) +1 SE. (A) 131I- Tac, (B) 125I-UPC. (HI) Nephrectomy; (A) ureter ligated; ( - • --) nor- mal; and ('"• linearized a-phase of "normals" curve. The linearized a-phase was derived from the full curve of control whole body data (trun- cated for graphing purposes) by curve stripping; the 13 phase tl/2 was 4 h.
1593 Junghans and Waldmann
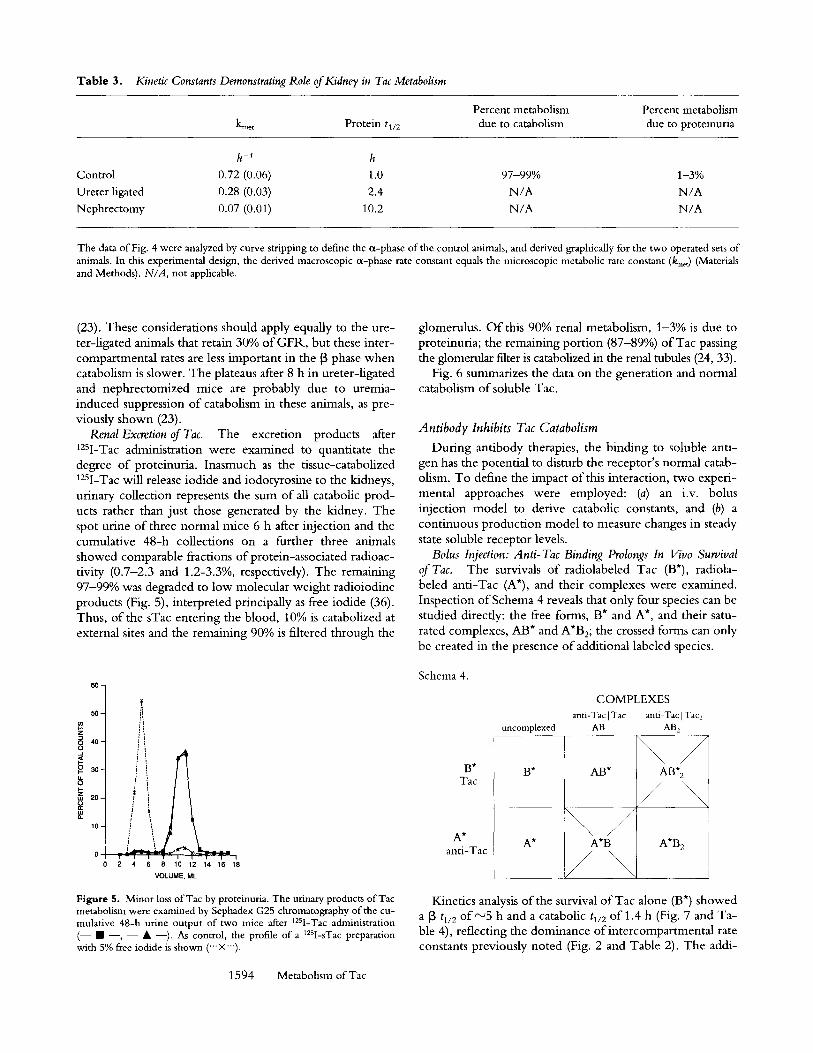
Table 3. Kinetic Constants Demonstrating Role of Kidney in Tac Metabolism
Percent metabolism Percent metabolism kme t P r o t e i n tl/2 due to catabolism due to proteinuria
h -1 h Control 0.72 (0.06) 1.0 97-99% 1-3% Ureter ligated 0.28 (0.03) 2.4 N/A N/A Nephrectomy 0.07 (0.01) 10.2 N/A N/A
The data of Fig. 4 were analyzed by curve stripping to define the ~x-phase of the control animals, and derived graphically for the two operated sets of animals. In this experimental design, the derived macroscopic ~x-phase rate constant equals the microscopic metabolic rate constant (kmet) (Materials and Methods). N/A, not applicable.
(23). These considerations should apply equally to the ure- ter-ligated animals that retain 30% of GFR, but these inter- compartmental rates are less important in the [3 phase when catabolism is slower. The plateaus after 8 h in ureter-ligated and nephrectomized mice are probably due to uremia- induced suppression of catabolism in these animals, as pre- viously shown (23).
Renal Excretion of Tac. The excretion products after 125I-Tac administration were examined to quantitate the degree o f proteinuria. Inasmuch as the tissue-catabolized 125I-Tac will release iodide and iodotyrosine to the kidneys, urinary collection represents the sum of all catabolic prod- ucts rather than just those generated by the kidney. The spot urine o f three normal mice 6 h after injection and the cumulative 48-h collections on a further three animals showed comparable fractions o f protein-associated radioac- tivity (0.7-2.3 and 1.2-3.3%, respectively). The remaining 97-99% was degraded to low molecular weight radioiodine products (Fig. 5), interpreted principally as free iodide (36). Thus, o f the sTac entering the blood, 10% is catabolized at external sites and the remaining 90% is filtered through the
6 0 -
5 0 -
z
8 4 0 -
3 0 -
8 ,,.u 2 0 -
1 0 -
0 I t - I I t ! I " ' T i I 2 4 6 8 10 "12 14 16 18
VOLUME, ML
Figure 5. Minor loss of Tac by proteinuria. The urinary products of Tac metabolism were examined by Sephadex G25 chromatography of the cu- mulative 48-h urine output of two mice after t2SI-Tac administration (-- �9 --, - - �9 --). As control, the profile of a 12SI-sTac preparation with 5% free iodide is shown ("" •
1594 Metabolism of Tac
glomerulus. O f this 90% renal metabolism, 1-3% is due to proteinuria; the remaining portion (87-89%) o f Tac passing the glomemlar filter is catabolized in the renal tubules (24, 33).
Fig. 6 summarizes the data on the generation and normal catabolism o f soluble Tac.
Antibody Inhibits Tac Catabolism
During antibody therapies, the binding to soluble anti- gen has the potential to disturb the receptor's normal catab- olism. To define the impact o f this interaction, two experi- mental approaches were employed: (a) an i.v. bolus injection model to derive catabolic constants, and (b) a continuous production model to measure changes in steady state soluble receptor levels.
Bolus Injection: Anti-Tac Binding Prolongs In Vivo Survival of Tac. The survivals o f radiolabeled Tac (B*), radiola- beled anti-Tac (A*), and their complexes were examined. Inspection o f Schema 4 reveals that only four species can be studied directly: the free forms, B* and A*, and their satu- rated complexes, AB* and A'B2; the crossed forms can only be created in the presence o f additional labeled species.
Schema 4.
B* Tac
A* anti-Tac
COMPLEXES anti-Tac I Tac anti-Tac I Tac2
uncomptexed AB AB 2
B*
A*
\ / "\ / / AB* AB* 2
\ \ \ /
A*B A*B 2
Kinetics analysis o f the survival o f Tac alone (B*) showed a [3 tl/2 of"- '5 h and a catabolic tl/2 o f l . 4 h (Fig. 7 and Ta- ble 4), reflecting the dominance ofintercompartmental rate constants previously noted (Fig. 2 and Table 2). The addi-
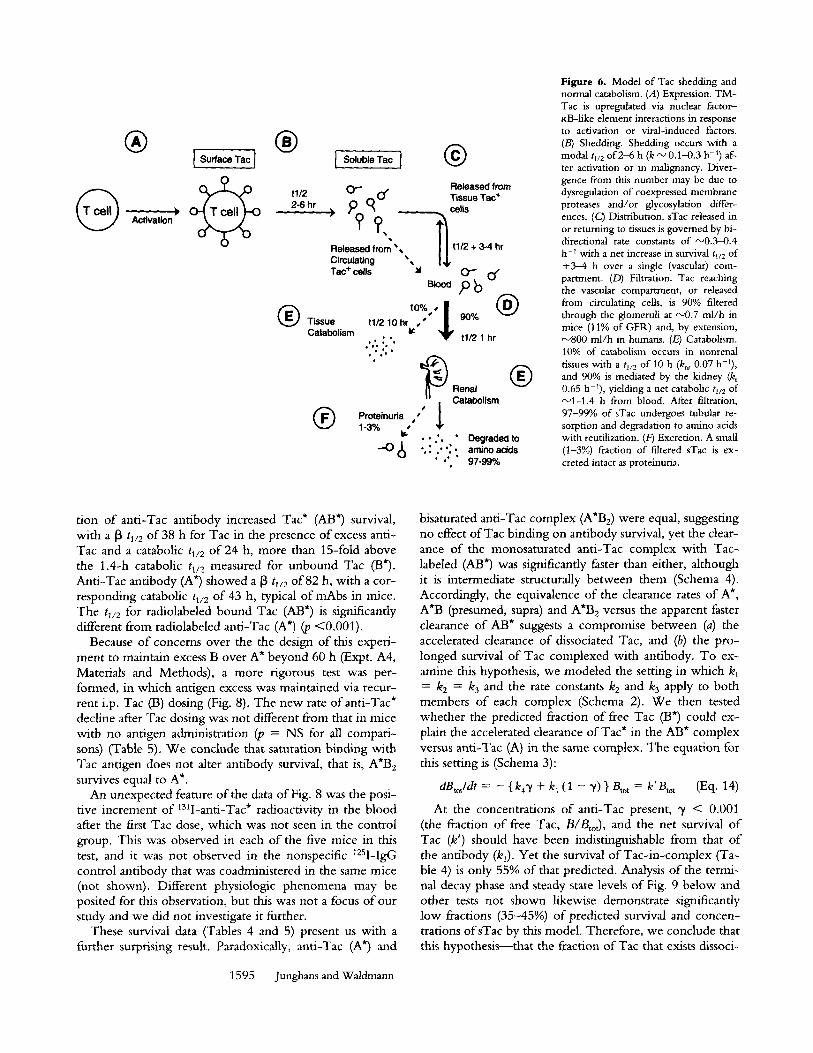
G
|
) Activation
I Surface Tac ] |
Soluble Tac I �9 t112 2-6 hr
o-- o"
??, Released from �9149 Circulating �9 Tac + cells
10%, I ~ Tissue t11210hrr $
Catabolism ,, : ', " : . . ; .
Proteinuda ,"" l 1-3% bf . . . ' .
-o 8
Released from Tissue Tac + cells ~ t1/2 + 3-4 hr
o-- o, Pb O:o
t1/2 1 hr
| Renal Catabolism
�9 Degraded to �9 . : ." ' : . amino acids
�9 "" " 97-99%
Figure 6. Model of Tac shedding and normal catabolism. (A) Expression. T M - Tac is upregulated via nuclear factor- KB-like element interactions in response to activation or viral-induced factors. (/3) Shedding. Shedding occurs with a modal tl/2 of 2-6 h (k ~ 0.1-0.3 h -1) af- ter activation or in malignancy. Diver- gence from this number may be due to dysregulation of coexpressed membrane proteases and/or glycosylation differ- ences. (C) Distribution. sTac released in or returning to tissues is governed by bi- directional rate constants of "-~0.3-0.4 h - t with a net increase in survival t~/2 of +3--4 h over a single (vascular) com- partment. (D) Filtration. Tac reaching the vascular compartment, or released from circulating cells, is 90% filtered through the glorneruli at '- '0.7 rnl/h in mice (11% of GFI~) and, by extension, ~800 ml /h in humans. (E) Catabolism. 10% of catabolism occurs in nonrenal tissues with a tl/2 of 10 h (knr 0.07 h-I), and 90% is mediated by the kidney (k) 0.65 h-~), yielding a net catabolic tl/2 of ,'--'1-1.4 h from blood. After filtration, 97-99% of sTac undergoes tubular re- sorption and degradation to amino acids with reutilization. (Fr3 Excretion. A small (1-3%) fraction o f filtered sTac is ex- creted intact as proteinuria.
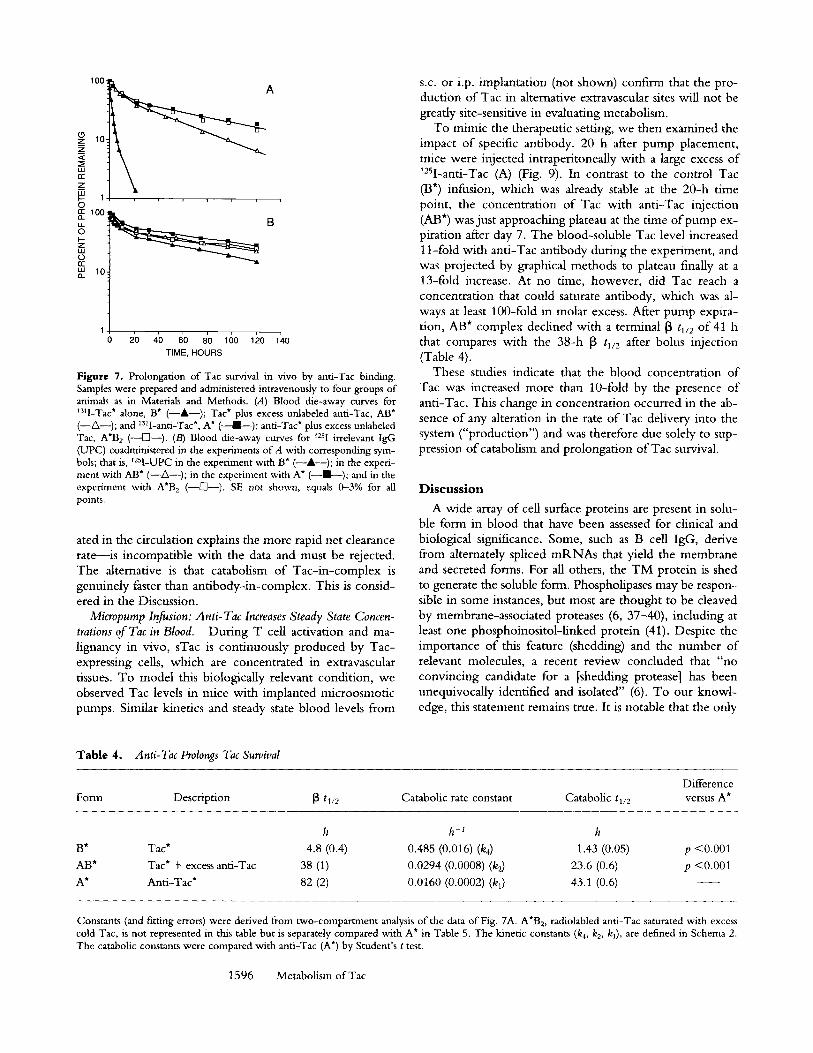
tion of anti-Tac antibody increased Tac* (AB*) survival, with a 13 tv2 of 38 h for Tac in the presence of excess anti- Tac and a catabolic tl/2 of 24 h, more than 15-fold above the 1.4-h catabolic t~/2 measured for unbound Tac (B*). Anti-Tac antibody (A*) showed a 13 tt/2 of 82 h, with a cor- responding catabolic tl/2 of 43 h, typical of mAbs in mice. The tl/2 for radiolabeled bound Tac (AB*) is significantly different from radiolabeled anti-Tac (A*) (p < 0 . 0 0 1 ) .
Because of concerns over the the design of this experi- ment to maintain excess B over A* beyond 60 h (Expt. A4, Materials and Methods), a more rigorous test was per- formed, in which antigen excess was maintained via recur- rent i.p. Tac (I3) dosing (Fig. 8). The new rate ofanti-Tac* decline after Tac dosing was not different from that in mice with no antigen administration (p = NS for all compari- sons) (Table 5). We conclude that saturation binding with Tac antigen does not alter antibody survival, that is, A*B 2 survives equal to A*.
An unexpected feature of the data of Fig. 8 was the posi- tive increment of ~3q-anti-Tac* radioactivity in the blood after the first Tac dose, which was not seen in the control group. This was observed in each of the five mice in this test, and it was not observed in the nonspecific 125I-IgG control antibody that was coadministered in the same mice (not shown). Different physiologic phenomena may be posited for this observation, but this was not a focus of our study and we did not investigate it further.
These survival data (Tables 4 and 5) present us with a further surprising result. Paradoxically, anti-Tac (A*) and
1595 Junghans and Waldmann
bisaturated anti-Tac complex (A'Be) were equal, suggesting no effect of Tac binding on antibody survival, yet the clear- ance of the monosaturated anti-Tac complex with Tac- labeled (AB*) was significantly faster than either, although it is intermediate structurally between them (Schema 4). Accordingly, the equivalence of the clearance rates of A*, A*B (presumed, supra) and A*B 2 versus the apparent faster clearance of AB* suggests a compromise between (a) the accelerated clearance of dissociated Tac, and (b) the pro- longed survival of Tac complexed with antibody. To ex- amine this hypothesis, we modeled the setting in which kl = k 2 = k 3 and the rate c o n s t a n t s k 2 and k 3 apply to both members of each complex (Schema 2). We then tested whether the predicted fraction of free Tac (t3") could ex- plain the accelerated clearance of Tac* in the AB* complex versus anti-Tac (A) in the same complex. The equation for this setting is (Schema 3):
aBtotldt = - {k4~ / + k~ (1 - "t) } Btot = k'Btot (Eq. 14)
At the concentrations of anti-Tac present, ~ < 0.001 (the fraction of free Tac, B/BtoO, and the net survival of Tac (k') should have been indistinguishable from that of the antibody (kl). Yet the survival of Tac-in-complex (Ta- ble 4) is only 55% of that predicted. Analysis of the termi- nal decay phase and steady state levels of Fig. 9 below and other tests not shown likewise demonstrate significantly low fractions (35-45%) of predicted survival and concen- trations ofsTac by this model. Therefore, we conclude that this hypothesis--that the fraction of Tac that exists dissoci-
180
!~z 10 ~ A
P 1 , 0 100
~ a
LU 10. Q_
2'0 4b g0 8'0 160 1~0 1~0 TIME, HOURS
Figure 7. Prolongation of Tac survival in vivo by anti-Tac binding. Samples were prepared and administered intravenously to four groups of animals as in Materials and Methods. (A) Blood die-away curves for ~3q-Tac* alone, B* (--&--); Tac* plus excess unlabeled anti-Tac, AB* (--A--); and 13~l-anti-Tac*, A* ( ~ ) ; anti-Tac* plus excess unlabeled Tac, A*B 2 (--[]--). (B) Blood die-away curves for 125I irrelevant IgG (UPC) coadministered in the experiments of A with corresponding sym- bols; that is, t2sI-UPC in the experiment with B* (--A--); in the experi- ment with AB* (--Z~--); in the experiment with A* ( - - I - - ) ; and in the experiment with A*B 2 (--[]--). SE not shown, equals 0-3% for all points.
ated in the circulation explains the more rapid net clearance rate--is incompatible with the data and must be rejected. The alternative is that catabolism o f Tac-in-complex is genuinely faster than antibody-in-complex. This is consid- ered in the Discussion.
Micropump Infusion: Anti-Tac Increases Steady State Concen- trations of Tac in Blood. During T cell activation and ma- lignancy in vivo, sTac is continuously produced by Tac- expressing cells, which are concentrated in extravascular tissues. To model this biologically relevant condition, we observed Tac levels in mice with implanted microosmotic pumps. Similar kinetics and steady state blood levels from
s.c. or i.p. implantation (not shown) confirm that the pro- duction of Tac in alternative extravascular sites will not be greatly site-sensitive in evaluating metabolism.
To mimic the therapeutic setting, we then examined the impact of specific antibody. 20 h after pump placement, mice were injected intraperitoneally with a large excess o f t2SI-anti-Tac (A) (Fig. 9). In contrast to the control Tac (B*) infusion, which was already stable at the 20-h time point, the concentration o f Tac with anti-Tac injection (AB*) was just approaching plateau at the time o f pump ex- piration after day 7. The blood-soluble Tac level increased 11-fold with anti-Tac antibody during the experiment, and was projected by graphical methods to plateau finally at a 13-fold increase. At no time, however, did Tac reach a concentration that could saturate antibody, which was al- ways at least 100-fold in molar excess. After pump expira- tion, AB* complex declined with a terminal ~ tl/2 of 41 h that compares with the 38-h [3 h/2 after bolus injection (Table 4).
These studies indicate that the blood concentration o f Tac was increased more than 10-fold by the presence o f anti-Tac. This change in concentration occurred in the ab- sence o f any alteration in the rate o f Tac delivery into the system ("production") and was therefore due solely to sup- pression o f catabolism and prolongation o f Tac survival.
Discuss ion
A wide array o f cell surface proteins are present in solu- ble form in blood that have been assessed for clinical and biological significance. Some, such as B cell IgG, derive from alternately spliced m R N A s that yield the membrane and secreted forms. For all others, the T M protein is shed to generate the soluble form. Phospholipases may be respon- sible in some instances, but most are thought to be cleaved by membrane-associated proteases (6, 37-40), including at least one phosphoinositol-linked protein (41). Despite the importance o f this feature (shedding) and the number o f relevant molecules, a recent review concluded that "no convincing candidate for a [shedding protease] has been unequivocally identified and isolated" (6). To our knowl- edge, this statement remains true. It is notable that the only
Table 4. Anti-Tac Prolongs Tac Survival
Difference Fore1 Description ~ t~/2 Catabolic rate constant Catabolic tl/2 versus A*
h h -1 h
B* Tac* 4.8 (0.4) 0.485 (0.016) (k4) 1.43 (0.05) p <0.001 AB* Tac* + excess anti-Tac 38 (1) 0.0294 (0.0008) (kz) 23.6 (0.6) p <0.001 A* Anti-Tac* 82 (2) 0.0160 (0.0002) (k 0 43.1 (0.6)
Constants (and fitting errors) were derived from two-compartment analysis of the data of Fig. 7A. A*B 2, radiolabled anti-Tac saturated with excess cold Tac, is not represented in this table but is separately compared with A* in Table 5. The kinetic constants (k4, k2, k0, are defined in Schema 2. The catabolic constants were compared with anti-Tac (A*) by Student's t test.
1596 Metabolism of Tac
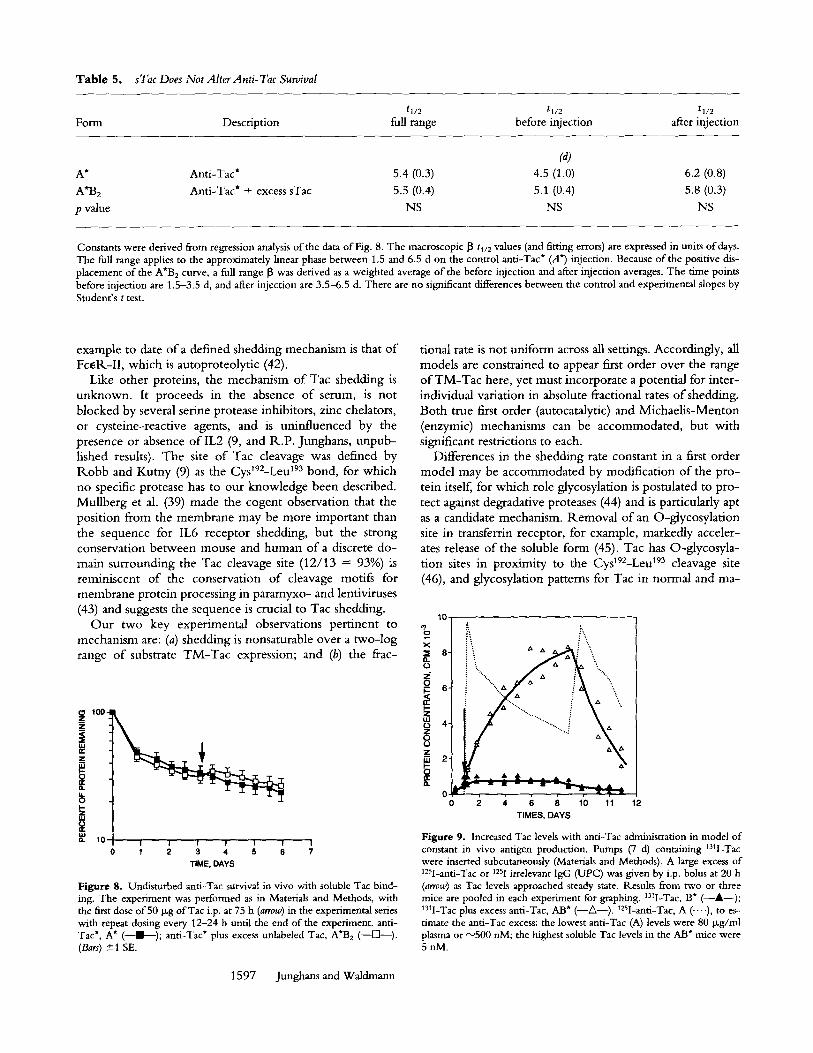
Table 5. sTac Does Not Alter Anti- Tac Survival
t1/2 tl/2 tl/2 Form Description full range before injection after injection
(a) A* Anti-Tac* 5.4 (0.3) 4.5 (1.0) 6.2 (0.8)
A'B2 Anti-Tac* + excess sTac 5.5 (0.4) 5.1 (0.4) 5.8 (0.3)
p value NS NS NS
Constants were derived from regression analysis of the data of Fig. 8. The macroscopic 13 tl/2 values (and fitting errors) are expressed in units of days. The full range applies to the approximately linear phase between 1.5 and 6.5 d on the control anti-Tac* (A*) injection. Because of the positive dis- placement of the A*B 2 curve, a full range 13 was derived as a weighted average of the before injection and after injection averages. The time points before injection are 1.5-3.5 d, and after injection are 3.5-6.5 d. There are no significant differences between the control and experimental slopes by Student's t test.
example to date o f a defined shedding mechanism is that o f Fc~R-II , which is autoproteolyt ic (42).
Like other proteins, the mechanism o f Tac shedding is unknown. It proceeds in the absence o f serum, is not blocked by several serine protease inhibitors, zinc chelators, or cysteine-reactive agents, and is uninfluenced by the presence or absence o f IL2 (9, and R.P . Junghans, unpub- lished results). The site o f Tac cleavage was defined by R.obb and Kutny (9) as the Cyst92-Leu 193 bond, for which no specific protease has to our knowledge been described. Mul lberg et al. (39) made the cogent observation that the posit ion from the membrane may be more important than the sequence for IL6 receptor shedding, but the strong conservation between mouse and human o f a discrete do- main surrounding the Tac cleavage site (12/13 = 93%) is reminiscent o f the conservation o f cleavage motiE for membrane protein processing in paramyxo- and lentiviruses
tional rate is not uniform across all settings. Accordingly, all models are constrained to appear first order over the range o f T M - T a c here, yet must incorporate a potential for inter- individual variation in absolute fractional rates o f shedding. Both true first order (autocatalytic) and Michael i s -Menton (enzymic) mechanisms can be accommodated, but with significant restrictions to each.
Differences in the shedding rate constant in a first order model may be accommodated by modification o f the p ro - tein itself, for which role glycosylation is postulated to p ro - tect against degradative proteases (44) and is particularly apt as a candidate mechanism. Remova l o f an O-glycosylat ion site in transferrin receptor, for example, markedly acceler- ates release o f the soluble form (45). Tac has O-glycosyla- t ion sites in proximi ty to the Cys192-Leu 193 cleavage site (46), and glycosylation patterns for Tac in normal and ma-
(43) and suggests the sequence is crucial to Tac shedding. 10-
O u r two key experimental observations pert inent to ~o ~ i \ mechanism are: (a) shedding is nonsaturable over a two- log ~ s i " '~ ,= ~ f - range o f substrate T M - T a c expression; and (b) the frac- Pa
. . . . .,. ~
u.I 0 re"
10 I | I I i ! I 1 2 3 4 5 6 7
T IME, DAYS
Figure 8. Undisturbed anti-Tac survival in vivo with soluble Tac bind- ing. The experiment was performed as in Materials and Methods, with the first dose of 50 p~g ofTac i.p. at 75 h (arrow) in the experimental series with repeat dosing every 12-24 h until the end of the experiment, anti- Tac*, A* (--I---); anti-Tac* plus excess unlabeled Tac, A*B 2 (--IS]---). (Bars) ---+1 SE.
T I M E S , D A Y S
Figure 9. Increased Tac levels with anti-Tac administration in model of constant m vivo antigen production. Pumps (7 d) containing 13q-Tac were inserted subcutaneously (Materials and Methods). A large excess of 125I-anti-Tac or 1251 irrelevant IgG (UPC) was given by i.p. bolus at 20 h (arrow) as Tac levels approached steady state. Results from two or three mice are pooled in each experiment for graphing. 13q-Tac, B* (--&--); 13q-Tac plus excess anti-Tac, AB* (--A--). ~25I-anti-Tac, A (...-), to es- timate the anti-Tac excess: the lowest anti-Tac (A) levels were 80 Ixg/ml plasma or "~500 nM; the highest soluble Tac levels in the AB* mice were 5nM.
1597 Junghans and Waldmann
lignant T cells show variation by gel mobilities o f extracted proteins (28, 47). Whether this pattern also changes during T cell activation and downregulation of Tac is, to our knowledge, unknown.
O n the other hand, this variation in shedding rates is what most suggests a separately regulated protease. If such a "shedding protease" is present, it appears to be membrane bound because (a) shedding proceeds in serum-free me- dium, and (b) early and late rates of shedding are cons tan t - - med ium accumulation of a secreted protease would be ex- pected to progressively accelerate shedding. A recently de- scribed matrix metalloenzyme is such a membrane protease (48). The unusual character of the Tac cleavage site and the resistance of Tac shedding to several protease inhibitors ar- gue against a range of nonspecific proteases, but the activity must be widespread, including lymphoid and nonlymphoid cell lines of human and nonhuman origin, since all such cells shed eflficiently when transfected with human T M - T a c (29; and R.P. Junghans, unpublished results). "Widespread expression" is expected for an autocatalytic model. Finally, it can be shown that the first order kinetic pattern imposes a high Km on such a protease, or it implies compensating substrate modification by altered glycosylation at high T M - T a c levels and/or coordinate regulation o f the pro- tease. Protein kinase C has been implicated as an activator for a putative shedding protease in one case (37).
Whichever mechanism underlies the shedding process, shedding could have as its normal role to increase receptor release with activation with subsequent return to baseline activity once the activation stimulus is removed. This would promote rapid downregulation of Tac expression and IL-2 responsiveness with withdrawal of the activating stimulus, at a time when maintaining the activated state would be counterproductive to the host.
Once Tac is shed as a soluble protein, it is subject to the catabolic activities o f the host. W e studied exogenously ad- ministered human sTac in a mouse model, which typically parallels humans in metabolic handling of proteins, sTac was rapidly cleared after i.v. injection with a nominal tl/2 of 1 h that increased to 10 h in nephrectomized mice. W e conclude that Tac is 90% catabolized by the kidney, with a filtration fraction of 0.11, and the remaining 10% of catab- olism is accounted for by nonrenal tissues (Fig. 6). After fil- tration, all protein is either absorbed in the tubules and catabolized to amino acids with reutilization, or excreted as proteinuria (24), documented as 1-3% in our experiments. Extrapolating to humans, with a normal mean serum sTac of 175 U / m l , a creatinine clearance of 180 liters per day, and an 11% of G F R filtration ratio for Tac from our result in mice, we estimate a daily filtration of 3.5 • 106 U of Tac and production (and total metabolism) of 4 • 106 U of Tac (12 Ixg). Urinary clearance (proteinuria) ofsTac in hu- mans was measured at 1.1 • 10 s U per 24 h (13), f rom which we estimate a mean normal proteinuric rate of 3% relative to total catabolism, which corresponds closely with our result in mice (1-3%) and with L chain proteinuria in humans (~1%) (33). In all respects, these data with sTac parallel the metabolic fate of Bence-Jones proteins and iso-
1598 Metabolism of Tac
lated L chain in mice and in humans (23, 24, 33). This clearance pattern is likely to be shared by all shed molecules of a size small enough to pass the renal filter (< ~ 5 0 kD).
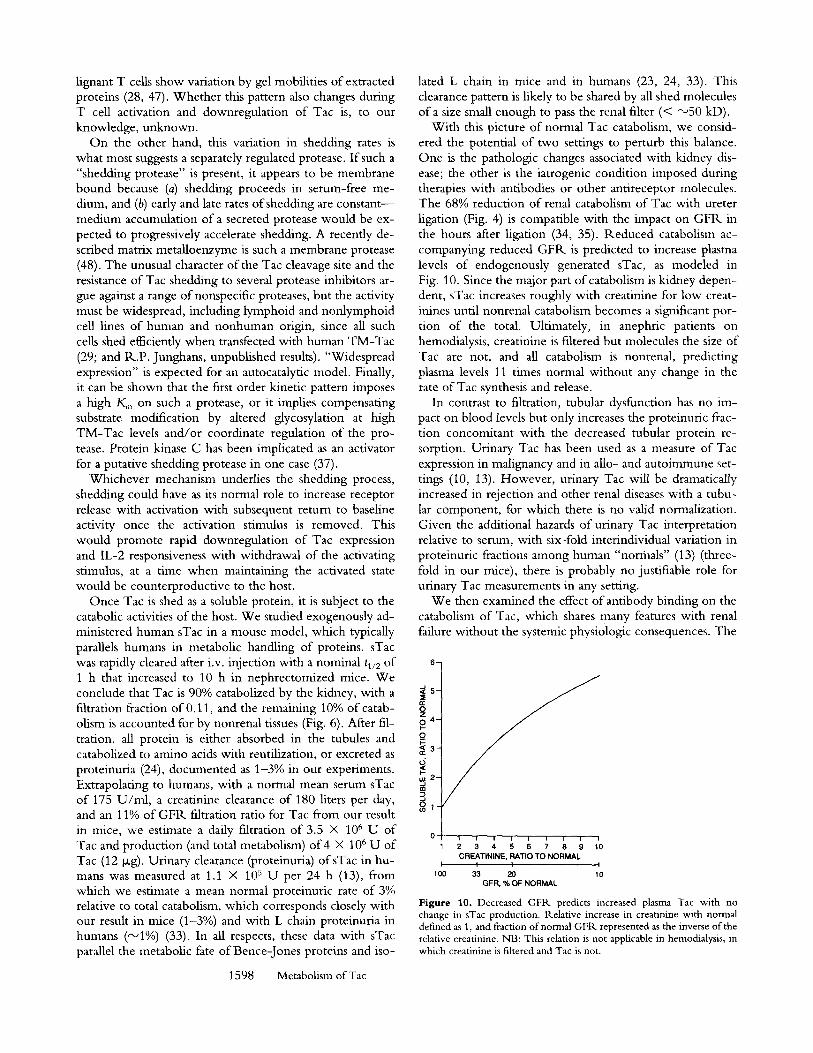
With this picture of normal Tac catabolism, we consid- ered the potential of two settings to perturb this balance. One is the pathologic changes associated with kidney dis- ease; the other is the iatrogenic condition imposed during therapies with antibodies or other antireceptor molecules. The 68% reduction of renal catabolism of Tac with ureter ligation (Fig. 4) is compatible with the impact on G F R in the hours after ligation (34, 35). Reduced catabolism ac- companying reduced G F R is predicted to increase plasma levels of endogenously generated sTac, as modeled in Fig. 10. Since the major part o f catabolism is kidney depen- dent, sTac increases roughly with creatinine for low creat- inines until nonrenal catabolism becomes a significant por- tion of the total. Ultimately, in anephric patients on hemodialysis, creatinine is filtered but molecules the size of Tac are not, and all catabolism is nonrenal, predicting plasma levels 11 times normal without any change in the rate of Tac synthesis and release.
In contrast to filtration, tubular dysfunction has no im- pact on blood levels but only increases the proteinuric frac- tion concomitant with the decreased tubular protein re- sorption. Urinary Tac has been used as a measure of Tac expression in malignancy and in allo- and autoimmune set- tings (10, 13). However , urinary Tac will be dramatically increased in rejection and other renal diseases with a tubu- lar component , for which there is no valid normalization. Given the additional hazards of urinary Tac interpretation relative to serum, with six-fold interindividual variation in proteinuric fractions among human "norriaals" (13) (three- fold in our mice), there is probably no justifiable role for urinary Tac measurements in any setting.
W e then examined the effect o f antibody binding on the catabolism of Tac, which shares many features with renal failure without the systemic physiologic consequences. The
6-
0
0
r
w 2 -
c~
I 100
I I I I I I I I 110 2 3 4 5 6 7 8 9 CREATININE, RATIO TO NORMAL
I I 33 20 110
GFR, % OF NORMAL
Figure 10. Decreased GFtk predicts increased plasma Tac with no change in sTac production. Relative increase in creatinine with normal defined as 1, and fraction of normal GFR represented as the inverse of the relative creatinine. NB: This relation is not applicable in hemodialysis, in which creatinine is filtered and Tac is not.
combination of molecules with different native catabolic rates will have different outcomes, depending upon the mechanisms of clearance. For example, when antidigitoxin Fab antibodies were administered to neutralize digitoxin, the abbreviated survival of the Fab fragment was imposed on the slow tl/2 of free drug, leading to a marked accelera- tion in drug clearance (49). When complete IgG antibodies are themselves the target of antibody-mediated immune re- actions, their clearance is usually also greatly accelerated by specific host mechanisms (16). Rapidly catabolized compo- nents may alternately have their catabolism delayed by anti- body reaction, as first shown for anti-insulin antibodies by Berson and Yalow (50). Similarly, we show that a biologi- cally and clinically important target antigen in soluble form can have its survival markedly prolonged by the interaction with antibody. In contrast, we noted that antibody survival was unaffected by antigen binding.
When antibody elicits antiglobulin responses in vivo, ev- ery epitope is repeated twice in IgG (10 times in IgM), and the polyclonality of the response ensures that many epitopes will be targeted, yielding large aggregates that present mul- tivalent Fc to the FcR of the monocyte-macrophage sys- tem, and leading to rapid systemic clearance. That anti-Tac survival is unaffected by antigen binding is probably due to the fact that Tac is monomeric and presents a single bind- ing epitope to antibody, which is itself monospecific, thereby avoiding formation of higher aggregates. This should also be generally true for other mAbs targeting monomeric soluble proteins. Furthermore, the size of the antibody was not greatly increased by reaction with anti- gen. The fully saturated anti-TacITac 2 complex (AB2) is ~220 versus 160 kD for antibody alone, far below that of other serum proteins such as IgM and complement compo- nent C1 (each 900--1,000 kD). The tl/2 of lgM in humans is 5 d (31), and greater size alone is insufficient to accelerate clearance.
In contrast, Tac survival increased more than 15-fold with antibody binding, from a nominal 1.4-h catabolic tl/2 to 24 h for i.v. injected material. The failure of Tac to pass the glomerular filter when bound to antibody is presumed to be the cause of prolonged Tac survival in the present studies, yielding the equivalent of total renal failure for Tac metabolism. Yet the survival of Tac-in-complex is also much longer than measured for nonrenal catabolism (cata- bolic tl/2 ~" 10 h), and antibody evidently protects Tac from this catabolism as well.
To mimic the in vivo setting of human therapies, we ap- plied a continuous production model in mice using im- plantable microosmotic pumps. As a concomitant o f pro- longed survival, this model showed increased steady state levels of Tac in the presence of antibody. The steady state concentration (B~s) is a simple function of the rate of pro- duction times the catabolic tl/2 (not the [3 tl/2; See Materials and Methods):
Bss = qlk = q tl1211n2 (Eq. 10)
If the tl/2 is changed by antibody, then the new steady
state for the sum of all B forms, B'tot .... is related to the former steady state by the ratio of the net tl/2 values:
B ! ~ Y tot,ss/Btot,ss t 1/2/tl/2 (Eq. 11) We measured the tl/2 for Tac complexed with anti-Tac as 23.6 h versus a value of 1.4 h for Tac alone (Table 4), pre- dicting a final steady state increase of 16.5-fold. This is comparable with the projected ratio of 13 from our data (Fig. 9), within the uncertainties of this system.
A further consequence of prolonged Tac survival due to any cause (renal failure or antibody binding) will be to alter the normal spatial distributions of Tac in the body. For sTac generated extravascularly, the rapidity of the renal clearance mechanisms in contact with the vascular com- partment will generate a steep gradient in the unperturbed setting, with substantially higher levels in the extravascular compartment versus that in blood. With the longer sur- vival, however, this gradient of Tac concentration in vivo is substantially flattened, yielding a marked increase in the normally low physiologic ratio of Tac in serum to Tac body burden.
An unexpected outcome of these studies of Tac metabo- lism was the apparent faster catabolism of Tac-in-complex versus antibody-in-complex. Our analysis (see Results) eliminated the hypothesis that the shorter tl/2 was due to the rapid clearance of the dissociated, free portion of Tac (13") in the equilibrium. This left us with the more surpris- ing second alternative: that catabolic activities may attack one part of the anti-TaclTac complex, Tac, while sparing the other part, anti-Tac. One speculation may be war- ranted on the nature of such a process which can selectively "extract" Tac from this high affinity complex. This phe- nomenon suggests features shared by normal IgG catabo- lism and intestinal and placental IgG transport (51-53). To explain the acceleration of IgG catabolism with higher se- rum IgG, Brambell et al. (51) proposed that IgG taken into pinocytic vacuoles is bound to specific tgG receptors (FcR) that redirect its transport to the circulation. Once the puta- tive "protection receptors" are saturated, the remainder of the IgG is subject to unrestricted lysosomal catabolism for a net acceleration at high serum concentrations.
The Brambell hypothesis may be adapted to the present setting. We propose that anti-Tac]Tac complexes are in- ternalized to acidified vesicles as normal IgG. Anti-Tac bound to the protection FcR is returned to circulation, whereas Tac released from the complex in the vesicle is catabolized, thus yielding faster net catabolic rates for circu- lating antigen-in-complex than antibody-in-complex. That vesicles may be thus topologically "divided" was demon- strated with transferrin and horseradish peroxidase (HR.P): both colocalize in early endosomes, but transferrin returns to the surface bound to its receptor whereas HRP proceeds to the late endosomes and lysosomes (54). Endosomes are characterized by reduced pH that is thought to promote ligand-receptor dissociation (54), whereas the relevant Fc- FcR interactions are acid enhanced (53, 55), thereby plau- sibly enabling IgG recycling to the surface via bound FcR,
1599 Jungham and Waldmann
free o f antigen. Other data suggest that antigen may even be "chewed" out o f antibody by endosomal proteases (56). Normal IgG catabolism appears to be widespread, with highest relative activity in liver and spleen (20, 57). Because these sites are rich in cells bearing FcR (including a major nonhematopoietic FcR [55]), this catabolic mechanism has plausibility in the context o f these other data. The new fea- ture o f this proposal is that it joins these recent in vitro concepts to bulk metabolic observations in whole animals. In any case, the metabolism of Tac in the presence o f anti- body may introduce a new, slower catabolic route for the antigen which supplants preexisting renal and nonrenal mechanisms. Other monomeric antigen-antibody complexes may be expected to experience similar fates.
It is a necessary consequence o f these kinetic studies that prolongation o f antigen survival will result in increased steady state sTac levels during antibody therapy unless the mechanisms o f Tac production are directly and rapidly sup- pressed by the therapy itsels W e know from other work that Tac production can persist at high levels for at least several days into therapy, even in patients who ultimately undergo complete remission, during which serum Tac lev- els may increase 10-fold or more (our unpublished results). In the case o f anti-Tac, the antibody blocks IL-2 binding by Tac, and higher Tac levels due to antibody complexing will not increase its ability to capture ligand. Moreover, the affinity for IL2 by Tac in isolation is so low (/~ 108 M -l) that it would require Tac concentrations o f the order o f 10 p~M to compete 50% with high affinity receptor (o~/ ) , an inconceivable concentration since the highest antibody concentration in therapy would probably not exceed 0.3 I~M (50 p~g/ml). (The highest serum sTac level we have observed is 0.05 p~M; our unpublished results.) There is ac- cordingly no evidence to suggest an independent regula- tory role for the soluble form of this molecule in vitro or in vivo. O n the other hand, other cytokines or cytokine re- ceptors to which therapy might be directed could lead to increased biologic activity in vivo if the active site is not also blocked by the antibody, as recently most convincingly
shown for anti-IL3, anti-IL4, and anti-IL7 antibodies that cap- ture and stabilize these proteins in active configurations (58).
The role o f sTac and other soluble molecules as a surro- gate for body burden of tumor or activated T cells can be interpreted in the context o f these results. Among ATL pa- tients, there is a general correspondence between disease volume and sTac levels (our unpublished results), as also observed for hairy cell leukemia, another Tac-expressing malignancies (15). Higher sTac levels should correlate with more shedding, but where individuals differ in Tac expres- sion or shedding rate, as noted here, this correlation weak- ens at the level o f estimating numbers o f Tac-expressing cells. Donor 1 in Table 1 underwent remission during her treatment with antibody directed at TM-Tac on the surface o f her malignant cells. Subsequently, she experienced a re- lapse o f her disease, at which time her cells exhibited a nearly identical pattern o f Tac expression and shedding. For this individual, the in vitro results suggest that serum sTac could reasonably be used as a measure o f her disease. sTac may thus be useful as a serum marker for many pa- tients in the same sense that elevated CEA concentrations are a marker for recurrence in colon cancer and other ma- lignancies, but in which individuals are known to differ in the relative expression of the marker (59).
Although the plasma level o f the soluble form o f Tac and other cell surface molecules is a reasonable correlate o f physiologic condition or disease expression, its use must be tempered with knowledge o f the biology o f the protein. We showed that antibody binding markedly inhibits the metabolism o f sTac with a corresponding increase in the serum concentration. In addition, as is true for other small molecules, Tac is catabolized chiefly by the kidney. Thus, it is concluded that serum concentrations o f soluble antigen in renal failure or during antibody therapy cannot be used as a surrogate measure o f tumor burden or T cell activation because receptor levels will both increase and differentially redistribute as a consequence o f prolonged survival, in the absence o f changes in soluble antigen production.
We thank Mr. Donald Dobbs for his excellent assistance in the animal surgeries and related procedures. We also thank Ms. Shilpa Mhatre, and Drs. Xiang-yang Tan, Gang Zheng, and Gillian Kingsbury for their assis- tance. We gratefully acknowledge supply of human Tac protein from Dr. John Hakimi of Hoffmann-La Roche, Inc. We also thank Dr. Diane Mould of Hoffmann-La Roche, Inc. for introducing one of us (R.P. Junghans) to pcNONLIN, for advice on aspects of its application, and for early review of the manuscript; and we thank Hot~ann-La Roche, Inc. for providing a purchase donation of the pcNONLIN software. We also thank Drs. Clark Anderson, Ira Mellman, and Victor Ghetie for their comments on our data regard- ing differential catabolism mechanisms; and Drs. Patricio Silva and Robert Stanton for discussions on the re- nal implications of these studies.
This work was supported in part by grants to R.P. Junghans from the Milheim Foundation for Cancer Re- search and a Clinical Oncology Career Development Award from the American Cancer Society.
Address correspondence to: Dr. R.P. Junghans, New England Deaconess Hospital, 99 Brookline Avenue, Room 301, Boston, MA 02215.
Received for publication 9 August 1995; and in revised form 6 December 1995.
1600 Metabolism of Tac
Note added in proof" The receptors for lgG protection (FcRp) [51,53] and intestinal transport (FclLn) [52,53,55], both described by Brambell, were recently shown to be identical using mice knocked-out for the receptor light chain (Junghans, R.P. and C.L. Anderson, manuscript submitted for publication). In such mice, IgG protection and differential catabolism were both lost, yielding clearance of antibody- and antigen- in-complex at the same accelerated rate as albumin. This confirms the central role of the FcRp to the differ- ential catabolism mechanism, as postulated in this article.
References 1. Femandez-Botran, lL. 1991. Soluble cytokine receptors: their
role in immunoregulation. FASEB (Fed, Am. Soc. Exp. Biol.) J. 5:2567-2574.
2. Gearing, A.J.H., and W. Newman. 1993. Circulating adhe- sion molecules in disease. Immunol Today. 14:506-509.
3. Schwartz, M.K. 1993. Cancer markers. In Cancer: Principles and Practice of Oncology. 4th ed. V.T. Devita, S. Hellman, and S.A. lLosenberg, editors. Lippincott, Philadelphia. 531- 542.
4. Arend, W.P,.. 1995. Inhibiting the effects of cytokines in hu- man disease. Adv. Intern. Med. 40:365-394.
5. Junghans, IL.P., G. Sgouros, and D.B. Scheinberg. 1996. An- tibody-based immunotherapies in cancer. In Cancer Chemo- therapy and Biotherapy: Principles and Practice. B.A. Chabner and D.L. Longo, eds. Lippincott-lLaven Publ., Philadelphia. 655-689.
6. Ehlers, M.IL.W., andJ.F. Riordan. 1991. Membrane proteins with soluble counterparts: role ofproteolysis in the release of transmembrane proteins. Biochemistry. 30:10065-10074.
7. Waldmann, T.A., I.H. Pastan, O.A. Gansow and R.P. Jung- hans. 1992. The multichain interleukin-2 receptor: a target for immunotherapy. Ann. Intern. Med. 116:148-160.
8. Greene, W.C., W.J. Leonard, J.M. Depper, D.L. Nelson, and T.A. Waldmann. 1986. The human interleukin-2 receptor: normal and abnormal expression in T cells and in leukernias induced by the human T-lymphotropic retroviruses. Ann. In- tern. Med. 105:560-572.
9. Robb, R.J., and lL.M. Kutny. 1987. Structure-function rela- tionships for the IL2-receptor system. J. Immunol. 139:855- 862.
10. Simpson, M.A., P.N. Madras, A.J. Cornaby, T. Etienne, R.A. Dempsey, G.H. Clowes, and A.P. Monaco. 1989. Se- quential determinations of urinary cytology and plasma and urinary lymphokines in the management of renal allograft re- cipients. Transplantation (Baltimore). 47:218-223.
1 I. Lawrence, E.C., V.A. Holland, J,B. Young, and N.T. Wind- sor. 1989. Dynamic changes in soluble interleukin-2 receptor levels after lung or heart-lung transplantation. Am. Rev. Respir. Dis. 140:789-796.
12. Semenzato, G., L.M. Bambara, D. Biasi, A. Frigo, F. Vi- nante, B. Zuppini, L. Trentin, C. Feruglio, M. Chilosi, and G. Pizzolo. 1988. Increased serum levels of soluble interleu- kin-2 receptor in patients with systemic lupus erythematosus and rheumatoid arthritis._/. Clin. Immunol. 8:447-452.
13. Marcon, L., M.E. Fritz, C.C. Kurman, J.C. Jensen, and D.L. Nelson. 1988. Soluble Tac peptide is present in the urine of normal individuals and at elevated levels in patients with adult T cell leukemia (ATL). Clin. Exp. Immunol. 73:29-33.
14. Rubin, L.A., G.S. Hekzema, D.L. Nelson, W.C. Greene, and G. Jay. 1987. R.econstitution of a functional interleukin 2 receptor in a nonlymphoid cell.J. Immunol. 139:2355-2360.
15. Ambrosetti, A., G. Semenzato, M. Prior, M. Chilosi, F. Vi- nante, C. Vincenzi, lL. Zanotti, L. Trentin, A. Portuese, F.
1601 Junghans and Wa/dmann
Menestrina, et al. 1989. Serum levels of soluble interleukin-2 receptor in hairy cell leukemia: a reliable marker of neoplastic bulk. Br.J. Haematol. 73:181-186.
16. Meeker, T.C., D.G. Maloney, R..A. Miller, K. Thielmans, lL. Wamke, and R. Levy. 1985. A clinical trial of anti-idio- type therapy for B cell malignancy. Blood. 65:1349-1363.
17. Schulz, G., D.A. Cheresh, N.M. Varki, A. Yu, L.K. Stafftleno, and lL.A. Reisfeld. 1984. Detection of ganglioside GD2 in tumor tissues and sera of neuroblastoma patients. Cancer Res. 44:5914-5920.
18. Sela, B.-A., D. Iliopoulos, D. Ghuerry, D. Herlyn, and H. Koprowski. 1989. Levels of disialogangliosides in sera of mel- anoma patients monitored by sensitive thin layer chromatog- raphy and immunostaining. J. Natl. Cancer Inst. 81:1489- 1492.
19. Sharkey, R.M., D.M. Goldenberg, H. Goldenberg, lL.E. Lee, C. Ballance, K.D. Pawly, D. Varga, and H.J. Hansen. 1990. Murine monoclonal antibodies against carcinoembry- onic antigen; immunological, pharmacokinetic, and targeting properties in humans. Cancer Res. 50:2823-2831.
20. Junghans, R.P., D. Dobbs, M.W. Brechbiel, S. Mirzadeh, A.A. lLaubitschek, O.A. Gansow, and T.A. Waldmann. 1993. Pharmacokinetics and bioactivity of DOTA-Bismuth conjugated anti-Tac antibody for alpha emitter (212Bi) radio- immunotherapy. Cancer Res. 53:5683-5689.
21. Nelson, D.L. 1986. Expression of a soluble form of the inter- leukin-2 receptor in normal and neoplastic states. The human interleukin-2 receptor: normal and abnormal expression in cells and in leukemias induced by the human T-lymphotro- pic retroviruses. Ann. Intern. Med. 105:560-572.
22. Jacques, Y., B. LeMauff, F. Boeffard, A. Godard, and J.P. Soulillou. 1987. A soluble interleukin 2 receptor produced by a normal alloreactive human T cell clone binds interleukin 2 with low affinity.J, lmmunol. 139:2308-2316.
23. Wochner, lL.D., W. Strober, and T.A. Waldmann. 1967. The role of the kidney in the catabolism of Bence Jones pro- teins and immunoglobulin fragments. J. Exp. Med. 126:207- 221.
24. Mogielnicki, P.IL., T.A. Waldmann, and W. Strober. 1971. Renal handling of molecular weight proteins. I. L-chain me- tabolism in experimental renal disease.J. Clin. Invest. 50:901- 909.
25. Chang, A.E., C.L. Hyatt, and S.A. lLosenberg. 1984. Sys- ternic administration of recombinant human interleukin 2 in mice.J. Biol. Response Modif 3:561-572.
26. Depper, J.M., W.J. Leonard, M. Kronke, P.D. Noguchi, lL.E. Cunningham, T.A. Waldmann, and W.C. Greene. 1984. Regulation ofinterleukin 2 receptor expression: effects ofphorbal diester, phospholipase C, and reexposure to lectin or antigen. J. Immunol. 133:3054-3061.
27. Leonard, W.J., J.M. Depper, G.lL. Crabtree, S. lLudikot~, J. Pumphrey, lL.J. Robb, M. Kronke, P.B. Svedik, N.J. Peffer, T.A. Waldmann, and W.C. Greene. 1984. Molecular cloning
and expression ofcDNAs for the human interleukin-2 recep- tor. Nature (Lond.). 311:626-631.
28. Leonard, W.J., M. Kronke, N.J. Peffer, J.M. Depper, and W.C. Greene. 1985. Interleukin-2 receptor gene expression in normal human T lymphocytes. Proc. Natl. Acad, Sci. USA. 82:6281-6285.
29. Cullen, B.1L., F.J. Podlaski, N.J. Peffer, J.B. Hosking, and W.C. Greene. 1988. Sequence requirements for ligand bind- ing and cell surface expression of the Tac antigen, a human interleukin-2 receptor.J. Biol. Chem. 263:4900-4906.
30. Uchiyama, T., T. Hori, M. Tsudo, Y. Wano, H. Umadome, S. Tamori, J. Yodoi, M. Maeda, H. Sawami, and H. Uchino. 1985. Interleukin-2 receptor (Tac antigen) expressed on adult T cell leukemia cells.J. Clin. Invest. 76:446-453.
31. Waldmann, T.A., and W. Strober. 1969. Metabolism of im- munoglobulins. Prog. Allergy. 13:1-110.
32. Humphrey, J.H., and J.L. Fahey. 1961. The metabolism of normal plasma proteins and gamma-myeloma protein in mice bearing plasma-cell tumors.J. Clin. Invest. 40:1696-1705.
33. Waldmann, T.A., W. Strober, and P.R. Mogielnicki. 1972. The renal handling of low molecular weight proteins. II. Dis- orders of serum protein catabolism in patients with tubular proteinuria, the nephrotic syndrome, or uremia. J. Clin. In- vest. 51:2162-2174.
33a.Junghans, R.P., A.L. Stone, and M.S. Lewis. 1996. Bio- physical characterization of a recombinant soluble interleu- kin 2 receptor (Tac): evidence for a monomeric structure. J. Biol. Chem. In press.
34. Dal Canton, A., IZ. Stanziale, A. Corradi, E. Vittorio, A. Migone, and L. Migone. 1977. Effects of acute ureteral ob- struction on glomerular hemodynamics in rat kidney. Kidney Int. 12:403-411.
35. Harris, P,.H., andJ.M. Gill. 1981. Changes in glomerular fil- tration rate during complete ureteral obstruction in rats. Kid- ney Int. 19:603-608.
36. Lewellan, C.G., M. Berman, andJ.E. P,-all. 1959. Studies of iodoalbumin metabolism. I. A mathmatical approach to the kinetics.J. Clin. Invest. 38:66-87.
37. Harrison, D., J.H. Phillips, and L.L. Lanier. 1991. Involve- ment of a metalloproteinase in spontaneous and phorbol es- ter-induced release of natural killer cell-associated Fc~,RIII (CD16-II).J. Immunol. 147:3459-3465.
38. Gearing, A.J.H., P. Beckett, M. Christodoulou, M. Churchill, J. Clements, A.H. Davidson, A.H. Drummond, R. Gilbert, J.L. Gordon, T.M. Leber. 1994. Processing oftumour necro- sis factor-ix precursor by metalloproteinases. Nature (Lond.). 370:555-557.
39. Mullberg, J., W. Oberthur, F. Lottspeich, E. Mehl, E. Dit- trich, L. Graeve, P.C. Heinrich, and S. Rose-John. 1994. The soluble human IL6 receptor: mutational characterization of the proteolytic cleavage site. J. Immunol. 152:4958-4968.
40. Zhang, L., and B.B. Aggarwal. 1994. Role of sulfhydryl groups in induction of cell surface down-modulation and shedding of extracellular domain of human TNF receptors in human histiocytic lymphoma U937 cells. J. Immunol. 153: 3745-3754.
41. Bazil, V. andJ.L. Strominger. 1991. Shedding as a mechanism of down-modulation of CD14 on stimulated human mono- cytes.J, lmmunol. 147:1567-1574.
42. Letellier, M., T. Nakajima, G. Pulido-Cejudo, H. Hofstetter, and G. Delepesse. 1990. Mechanism of formation of human IgE-binding factors (soluble CD23): III. Evidence for a re-
ceptor (Fc~R.II)-associated proteolytic activity. J. Exp. Med. 172:693-700.
43. Morrison, T.G. 1988. Structure, function and intracellular processing of paramyxovirus membrane proteins. Virus Res. 10:113-136.
44. Paulson, J.C. 1990. Glycoproteins: what are the sugar chains for? In Proteins: Form and Function. R..A. Bradshaw and M. Purton, eds. Elsevier Trends Journals, Cambridge. p. 272-276.
45. Rutledge. E.A., B.J. Root, J.J. Lucas, and C.A. Enns. 1994. Elimination of O-linked glycosylation site at Thr 104 results in the generation of a soluble human transferrin receptor. Blood. 83:580-586.
46. Miedel, M.C., J.O. Hulmes, D.V. Weber, P. Bailon, and Y.E. Pan. 1988. Structural analysis of recombinant soluble human interleukin-2 receptor. Biochem. Biophys. Res. Com- mun. 154:372-379.
47. Wano, Y., T. Uchiyama, J. Yodoi, and H. Uchino. 1985. Biosynthetic processing of human interleukin-2 receptor (Tac antigen). Microbiol. Immunol. 29:451-466.
48. Sato, H., T. Takino, Y. Okada, J. Cao, A. Shinagawa, E. Yamamoto, and M. Seiki. 1994. A matrix metalloproteinase expressed on the surface of invasive tumour cells. Nature (Lond.) 370:61-65.
49. Ochs, H.IL., and T.W. Smith. 1977. Reversal of advanced digitoxin toxicity and modification of pharmacokinetics by specific antibodies and Fab fragments. J. Clin. Invest. 60: 1303-1313.
50. Berson, S.A., I<.S. Yalow, A. Bauman, M.A. Rothschild, and K. Newerly. 1956. Insulin-131I metabolism in human sub- jects: demonstration of insufin binding globulin in the circu- lation of insulin-treated subjects. J. Clin. Invest. 35:170-190.
51. Brambell, F.W.R., W.A. Hemming's, and I.G. Morris. 1964. A theoretical model of'y-globulin catabolism. Nature (Lond.). 203:1352-1355.
52. Brambell, F.W.R. 1966. The transmission of immunity from mother to young and the catabolism of immunoglobulins. Lancet. 2:1087-1093.
53. Waldmann, T.A., and E.A. Jones. 1977. The role of cell-sur- face receptors in the transport and catabolism of immuno- globulins. In Protein Turnover, CIBA Found. Syrup. 9:5-18.
54. Schmid, S.L., 1<. Fuchs, P. Male, and I. Mellman. 1988. Two distinct subpopulations of endosomes involved in membrane recycfing and transport to lysosomes. Cell. 52:73-83.
55. Story, C.M.,J.E. Mikulska, and N.E. Simister. 1994. A major histocompatibility complex class I-like Fc receptor cloned from human placenta: possible role in transfer ofimmunoglob- ulin G from mother to fetus.J. Exp. Med. 180:2377-2381.
56. West, M.A., J.M. Lucoca, and C. Watts. 1994. Antigen pro- cessing and class II MHC peptide-loading compartments in human B-lymphoblastoid cells. Nature (Lond.). 369:147-149.
57. Henderson, L.A., J.W. Baynes, and S.P,. Thorpe. 1982. Identification of sites of IgG catabolism in the rat. Arch. Bio- chem. Biophys. 215:1-11.
58. Finkelman, F.D., K.B. Madden, S.C. Morris, J.M. Holmes, N. Boiani, I.M. Katona, and C.Ik. Maliszewski. 1993. Anti- cytokine antibodies as carrier proteins.J, lmmunol. 151:1235- 1244.
59. Goldenberg, D.M., A. Neville, A. Carter, V.L. Go, E.D. Holyoke, K.J. Isselbacher, P.S. Schein, and M. Schwartz. 1981. CEA (carcinoembryonic antigen): Its role as a marker in the management of cancer. J. Cancer Res. Clin. Oncol. 101: 239-242.
1602 Metabolism of Tac