Embed Size (px)
Citation preview
Diabetes & Metabolic Syndrome: Clinical Research & Reviews 5 (2011) 201–206
Original article
Metabolic syndrome in first degree relatives of patients with type 2 diabetes:Incidence and risk factors
Mohsen Janghorbani a,b,*, Masoud Amini b
a Department of Epidemiology and Biostatistics, School of Public Health, Isfahan University of Medical Sciences, Isfahan, Iranb Isfahan Endocrine and Metabolism Research Center, Isfahan University of Medical Sciences, Isfahan, Iran
A R T I C L E I N F O
Keywords:
First degree relatives
Metabolic syndrome
Risk factors
Incidence
A B S T R A C T
Aims: First degree relatives (FDRs) of people with type 2 diabetes are at greater cardiovascular and
diabetes risk. It is not known whether they are also at greater risk of metabolic syndrome (MetS). The
objectives of present study were to assess the incidence of and risk factors for the development of MetS in
FDRs of patients with type 2 diabetes.
Methods: A total of 3217 (842 men and 2375 women) FDRs of consecutive patients with type 2 diabetes
aged 30–70 years in 2003–2005 were followed through 2010. At baseline participants underwent a
standard 75 g 2-h standard OGTT and HbA1c measurements. MetS was defined by the NCEP-ATP III. The
study group consisted of 734 participants without MetS and history of known diabetes at baseline and
had at least one subsequent review in mean (SD) follow-up period of 5.5 (1.2) years.
Results: The prevalence of MetS was 35.8% (95% CI: 34.2, 37.5). The incidence of MetS was 4.3% (95% CI:
3.7, 4.9) (4.6% men and 4.2% women) per year. Multivariate analysis revealed that impaired glucose
tolerance (IGT) (RR 1.89 (95% CI: 1.28, 2.79)), impaired fasting glucose (IFG) (RR 1.39 (95% CI: 1.10, 1.73))
and lower HDL (RR 1.34 (95% CI: 1.12, 1.60)) were associated with MetS.
Conclusions: The findings of this study illustrate for the first time the incidence of MetS in FDRs of
patients with type 2 diabetes in Iran. Risk of MetS may increases with IGT, IFG and lower HDL.
� 2012 Diabetes India. Published by Elsevier Ltd. All rights reserved.
Contents lists available at SciVerse ScienceDirect
Diabetes & Metabolic Syndrome: Clinical Research &Reviews
jo ur n al h o mep ag e: www .e lsev ier . c om / loc ate /d s x
1. Introduction
Metabolic syndrome (MetS) is an important public healthproblem worldwide, and its prevalence is increasing [1]. Patientswith MetS are at greater risk of cardiovascular disease and type 2diabetes [2]. This is particularly relevant in first degree relatives(FDRs) of people with type 2 diabetes, who are at even greatercardiovascular and diabetes risk [3,4].
Despite abundant epidemiological research that has beenpublished on MetS, there are few prospective data on the incidenceof MetS and none in Iran. At present, no data exist about theincidence and risk factors associated with MetS in FDRs of peoplewith type 2 diabetes.
With the increasing prevalence of diabetes and obesityworldwide [1,2,5] and the number of first degree relatives (FDRs)of people with type 2 diabetes, and thus an increased risk ofdeveloping MetS, will also increase. Identifying risk factorsassociated with susceptibility to MetS becomes increasingly
* Corresponding author at: Department of Epidemiology and Biostatistics, School
of Public Health, Isfahan University of Medical Sciences, Isfahan, Iran.
Tel.: +98 311 2334893; fax: +98 311 6682509.
E-mail address: [email protected] (M. Janghorbani).
1871-4021/$ – see front matter � 2012 Diabetes India. Published by Elsevier Ltd. All r
doi:10.1016/j.dsx.2012.02.010
important. Accurate information regarding the incidence of MetSand associated risk factors in FDRs of people with diabetes isimportant to get a better understanding of the etiology and possiblyto prevent or delay its development and complications of disease inthis population. However, based on the high prevalence and highincidence of obesity and type 2 diabetes in the FDRs of people withtype 2 diabetes [3,4], one can expect that the inheritance patternmay play an essential role in the development of MetS.
The objective of this study was therefore to estimate theincidence of MetS in FDRs of patients with type 2 diabetes and toidentify its risk factors.
2. Subjects and methods
2.1. Participants and data collection
The Isfahan Diabetes Prevention Study (IDPS) is beingconducted in Isfahan, a very large urban area situated in centralIran, located on 1590 m height above sea level, between latitudes30 and 34 degrees north of the equator and longitude 49–558 east,with a population of almost four and half million (4,559,256 in2006 (men 2,335,399, women 2,223,857)). The IDPS is an ongoingcohort study to assess the efficacy of diet and intensive exercise toprevent or delay the onset of type 2 diabetes in FDRs of patients with
ights reserved.

M. Janghorbani, M. Amini / Diabetes & Metabolic Syndrome: Clinical Research & Reviews 5 (2011) 201–206202
type 2 diabetes. The study participants were recruited and theirbaseline data were collected between 2003 and 2005 when 3217(842 men and 2375 women) FDRs of a consecutive sample ofpatients with type 2 diabetes attending clinics at Isfahan Endocrineand Metabolism Research Center were included in the study. Theparticipants completed laboratory tests including standard 75 g 2-horal glucose tolerance test (OGTT), glycosylated hemoglobin (HbA1c)and a questionnaire on their health status and on various potentialrisk factors for diabetes and MetS. Participants received follow-uptests according to a medical care standard in diabetes [6] to updateinformation on demographic, anthropometric, and lifestyle factorsand on newly diagnosed diabetes and MetS. Accordingly, if OGTTwas normal at baseline, repeated testing was carried out at least at 3-year intervals. Otherwise, repeat testing was carried out annually.The IDPS baseline methods have been described in detail elsewhere[3,4]. The participants included siblings and children. Institutionalreview board of the Isfahan University of Medical Sciences approvedthis study (approval no. 189135 dated 13 April 2010), and aninformed consent form was signed by each participant.
2.2. Ascertainment of MetS
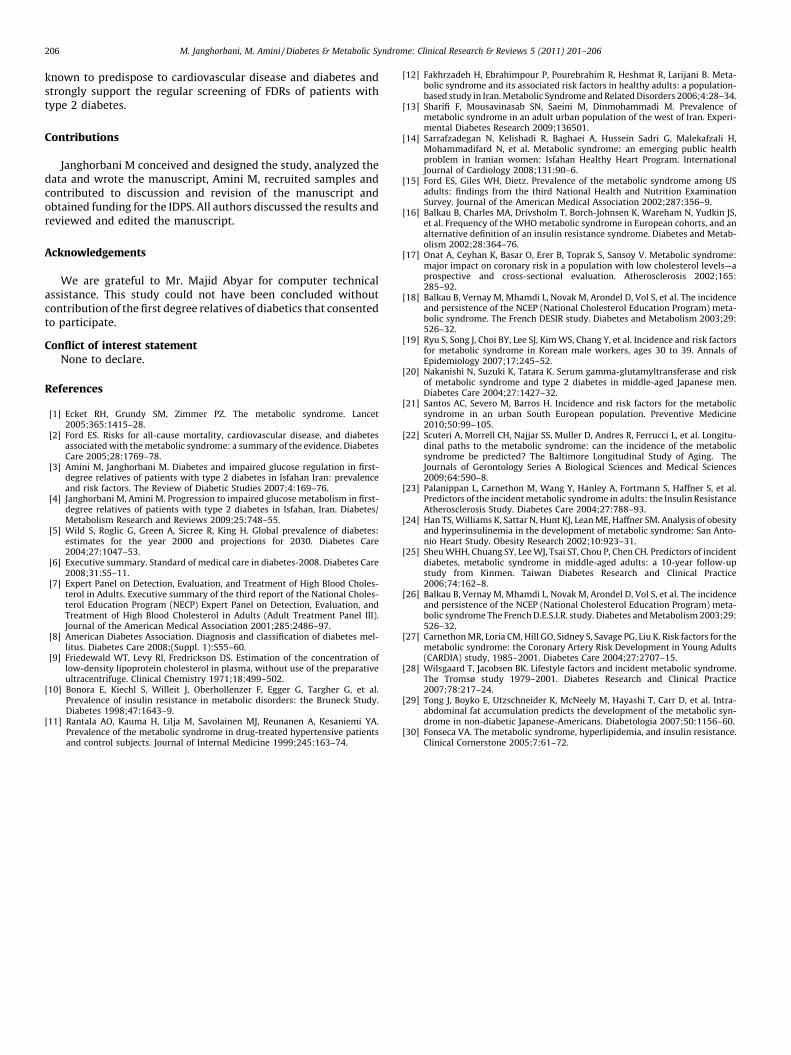
Cases of MetS were identified according to the Third report ofthe National Cholesterol Education Program Adult Treatment PanelIII (NCEP-ATP III) [7]. It was considered present when at least threeof the following characteristics were observed: waist circumfer-ence �102 cm in men and �88 cm in women; triglycerides�150 mg/dl; high density lipoprotein (HDL) cholesterol <40 mg/dlin men and <50 mg/dl in women; blood pressure (BP) �130/85 mm Hg; and fasting glucose �100 mg/dl. Pregnant womenwere excluded. This study used data of 734 FDRs (195 men and 539women) who were free of MetS at registration and without historyof known diabetes mellitus and had at least one subsequent reviewin mean (standard deviation [SD]) follow-up period of 5.5 (1.2)years and who were aged 30 years and over (Fig. 1).
2.3. Variables measured
Subjects were asked to abstain from vigorous exercise in theevening before and in the morning of the investigations. Smokerswere encouraged to abstain from smoking in the morning of theinvestigations. On arrival in the clinic the information given by theFDRs in the questionnaire on family history was first verified. Thenheight and weight were measured with subjects in light clothes andwithout shoes using standard apparatus. Weight was measured tothe nearest 0.1 kg on a calibrated beam scale. Height, waist and hipcircumference were measured to the nearest 0.5 cm with ameasuring tape. Waist was measured midway between the lowerrib margin and the iliac-crest at the end of a gentle expiration. Hipcircumference was measured over the greater trochanters directly
393Total cohort N=3,217
Incident Metabolic syndrome N=175: IGT N=55 IFG N=23 NGT N=97
Studied subjects N=734: IGT N=177 IFG N=91 NGT N=466
Excluded (N=2,483): Prevalent Metabolic Syndrome N=1,152 No subsequent review N= 1,331
Fig. 1. Schematic diagram of the study population.
over the underwear. Body mass index (BMI) (weight/height2 [kg/m2]) is recognized as the measure of overall obesity. Normal BMI wasdefined as BMI <25, overweight as BMI 25–29.99, and obesity as BMI�30. A waist-to-hip ratio (WHR) of <0.80 in women and <0.95 inmen was considered normal. Resting blood pressure (BP) wasmeasured after subjects had been seated for 10 min by using amercury sphygmomanometer and appropriately sized cuffs, usingstandard techniques. Subjects with fasting plasma glucose (FPG)<126 mg/dl underwent a standard OGTT (75 g glucose 2-h)according to the American Diabetes Association criteria [8]. Venousblood was sampled 30, 60, and 120 min after oral glucoseadministration. Plasma samples obtained after centrifugation wereanalyzed the same day.
HbA1c (measured by ion-exchange chromatography), totalcholesterol, triglyceride, HDL (measured using standardizedprocedures), and low-density lipoprotein (LDL) cholesterol (calcu-lated by the Friedewald equation [9] provided total triglyceridesdid not exceed 400 mg/dl) were assessed. Assay of blood sampleswere performed in the central laboratory of the Isfahan Endocrineand Metabolism Research Center using enzyme-linked method.
2.4. Definitions
Impaired glucose tolerance (IGT) was defined as FPG <126 mg/dl, but the 2-h plasma glucose concentration �140 and <200 mg/dl. If the FPG was in the range of 100–126 mg/dl and the 2-h plasmaglucose was <140 mg/dl, it was considered as impaired fastingglucose (IFG); whereas, if the FPG was below 100 mg/dl and the 2-hplasma glucose <140 mg/dl, it was considered a sign of normalglucose tolerance (NGT) [8].
2.5. Determination of MetS incidence
Incidence of MetS was expressed as the number of cases of MetSper 100 person-years of follow-up. As the relevant period wasconsidered the date of completion of the baseline examinationbetween 2003 and 2005 until the either (i) occurrence of MetS, (ii)the date of the last completed follow-up, (iii) death, or (iv) end offollow-up on December 31, 2010, whichever came first. For ease ofinterpretability, we report the incidence rates in terms of percentper year.
2.6. Statistical analysis
Statistical methods used included Student’s t-test; Chi squaredtest, analysis of variance or Kruskal–Wallis tests for normally or non-normally distributed continuous variables respectively and Cox’sproportional hazards model. Univariate and multivariate Cox’sproportional hazards models were fitted to identify predictors ofnew-onset MetS using SPSS version 18 for Windows (SPSS Inc.,Chicago, IL, USA). All the significant baseline variables in thebivariate analysis were included as independent variables in themultivariate-adjusted analyses. Variables age, gender, BMI, waistcircumference, triglyceride, LDL, HDL, total cholesterol, glucoseintolerance and BP were entered in the multivariate-adjustedanalyses as categorical variables. Age-adjusted means werecalculated and compared using general linear models. All tests forstatistical significance were two-tailed, confidence intervals (CI)were set at 95% and P < 0.05 was considered significant.
3. Results
3.1. Subject characteristics
The age-adjusted characteristics of the FDRs who completed thebaseline study (n = 3217), non-attendees (n = 2483), and the

Table 1Age and age-adjusted means (SE) and proportion of selected characteristics of the baseline, non-attendees and attendees at follow-up samples.
Characteristics Baseline
N = 3217
Excluded
N = 2483
Attendees at follow-up
N = 734
Age (year) 43.3 (0.12) 43.7 (0.14) 42.0 (0.25)*
Height (cm) 159.7 (0.15) 159.7 (0.17) 159.4 (0.31)
Weight (kg) 73.9 (0.22) 75.0 (0.25) 70.2 (0.46)*
Body mass index (kg/m2) 29.0 (0.08) 29.4 (0.09) 27.7 (0.16)*
Waist circumference (cm) 89.3 (0.17) 90.2 (0.20) 86.1 (0.36)*
Hip circumference (cm) 107.7 (0.16) 108.4 (0.18) 105.4 (0.34)*
Waist-to-hip ratio 0.83 (0.001) 0.83 (0.001) 0.82 (0.003)*
Fasting glucose baseline (mg/dl) 101.1 (0.51) 103.6 (0.58) 92.7 (1.06)*
Plasma glucose 30 min (mg/dl) 149.4 (0.80) 152.0 (0.92) 141.2 (1.64)*
Plasma glucose 60 min (mg/dl) 156.4 (1.03) 160.2 (1.18) 144.0 (2.12)*
Plasma glucose 120 min (mg/dl) 126.8 (0.96) 129.8 (1.10) 117.0 (2.00)*
HbA1c (%) 5.2 (0.02) 5.3 (0.02) 5.0 (0.05)*
Cholesterol (mg/dl) 198.7 (0.71) 201.7 (0.81) 188.6 (1.50)*
LDL-cholesterol (mg/dl) 120.4 (0.63) 122.2 (0.72) 114.4 (1.35)*
HDL-cholesterol (mg/dl) 45.8 (0.22) 45.3 (0.25) 47.5 (0.47)*
Triglyceride (mg/dl) 168.5 (1.86) 177.0 (2.11) 139.4 (3.91)*
Systolic BP (mm Hg) 115.5 (0.29) 116.9 (0.33) 110.5 (0.61)*
Diastolic BP (mm Hg) 75.0 (0.22) 76.2 (0.25) 71.0 (0.46)*
Characteristics Baseline
N = 3217
Excluded
N = 2483
Attendees at follow-up
N = 734
% % %
Men 26.2 26.2 26.5
Obesity 36.4 40.3 22.9*
Normal glucose tolerance 51.9 48.6 63.1*
Impaired fasting glucose 18.3 20.0 12.5*
Impaired glucose tolerance 20.6 19.5 24.3*
Diabetes mellitus 9.2 11.9 –
Age-adjusted means were calculated using general linear models. The difference in the mean or percentage of the variables between excluded and attendees at follow-up.* P < 0.001.
M. Janghorbani, M. Amini / Diabetes & Metabolic Syndrome: Clinical Research & Reviews 5 (2011) 201–206 203
attendees at follow-up (n = 734) are shown in Table 1. As expected,attendees at the follow-up visit differ significantly from non-attendees regarding most baseline characteristics: age, weight,BMI, WC, hip circumference, waist-to-hip ratio (WHR) and levels ofplasma glucose, HbA1c, cholesterol, LDL, HDL, triglyceride, BP andobesity.
3.2. Prevalence
Of the 3217 FDRs of people with type 2 diabetes (842 men and2375 women), 1152 had MetS. Overall prevalence of MetS was35.8% (95% CI: 34.2, 37.5). Prevalence of MetS was higher in women(37.5%; 95% CI: 35.5, 39.4) than men (31.3%; 95% CI: 28.1, 34.4). Asexpected, there was a statistically increasing prevalence of MetSwith increasing age.
3.3. Incidence
Of the 734 non-diabetic FDRs of patients with type 2 diabeteswithout MetS, 175 (23.8%) (49 men and 126 women) developedMetS in 4065 (1064 men and 3001 women) person-years offollow-up. The overall incidence of subsequent MetS was 4.3%(95% CI: 3.7, 4.9) per year. Incidence rates were slightly higher inmen (4.6% (95% CI: 3.4, 6.1) per year) than women (4.2% (95% CI:3.5, 5.0)). This difference was not statistically significant. Of the177 FDRs of patients with type 2 diabetes who had IGT at initialregistration, 55 subsequently developed MetS, giving an inci-dence of 5.9% (95% CI: 4.5, 7.6) per year. This was higher than theincidence rates seen for NGT, 3.6% per year (95% CI: 2.9, 4.4)(P < 0.05). Of the 91 FDRs who had IFG at initial registration, 23subsequently developed MetS, giving an incidence of 5.1% (95% CI:3.3, 7.5) per year.
3.4. Risk factors
Table 2 shows the group means (SE) and proportions for thoseFDRs who did and did not develop MetS. As expected, those whodeveloped MetS were older and had higher systolic BP, weight,BMI, WC, WHR, FPG, plasma glucose at 30, 60 and 120 min, HbA1c,triglyceride and number of follow-up visit and have lower HDL, buthave higher proportion of IGT and obesity at baseline.
A univariate analysis (Table 3) showed that FPG, HbA1c,triglyceride, BMI, abdominal obesity (WHR or WC criteria), andIGT were significantly associated with the risk of developing MetS.Although, there was a crude association of MetS with general andabdominal obesity, this effect did not remain significant afteradjustment.
The incidence of MetS was also analyzed with multivariatemodel. Cox’s proportional hazards model showed that IGT, IFG andlower HDL at baseline significantly predicted the onset of MetSafter mean 5.5 years. No other variables were significant (Table 3).
4. Discussion
This is the first follow-up study among the FDRs of patients withtype 2 diabetes that reports the incidence of MetS and relative riskfor progression to MetS according to the NCEP-ATP III proposedcriteria in Iran. In this follow-up study of 734 FDRs of patients withtype 2 diabetes, the incidence of MetS was 4.3% per year (175patients) over an average follow-up of 5.5 years. The incidencerates were 3.6% per year in FDRs with NGT, 5.9% in IGT, and 5.1% inIFG. It seems that the NGT and higher HDL level at baseline lowerthe risk of progression to MetS. Incidence and prevalence rates ofMetS in general populations in various studies from around theworld show considerable variation [10,11]. Estimates of incidence

Table 2Age and age-adjusted means (SE) and proportions of selected baseline characteristics between 175 first-degree relatives of patients with type 2 diabetes who did and 559 who
did not developed metabolic syndrome (MetS).
Variables Developed MetS Not developed MetS Difference (95% CI)
Mean (SE) Mean (SE)
Age (year) 43.1 (0.48) 41.6 (0.27) 1.5 (0.42, 2.58)**
Follow-up (year) 5.6 (0.09) 5.5 (0.05) 0.1 (�0.11, 0.31)
Number of follow-up visit 2.9 (0.08) 2.7 (0.05) 0.2 (0.01, 0.39)*
Height (cm) 159.8 (0.62) 159.5 (0.34) 0.3 (�1.20, 1.60)
Weight (kg) 73.9 (0.79) 69.2 (0.43) 4.7 (2.84, 6.36)***
BMI (kg/m2) 29.0 (0.27) 27.2 (0.15) 1.8 (1.19, 2.41)***
Waist circumference (cm) 89.7 (0.61) 84.7 (0.34) 5.0 (3.91, 6.69)***
Waist-to-hip ratio 0.83 (0.005) 0.81 (0.003) 0.02 (0.02, 0.04)***
Systolic BP (mm Hg) 111.3 (1.01) 109.3 (0.56) 2.0 (0.29, 4.91)*
Diastolic BP (mm Hg) 72.8 (0.80) 70.5 (0.45) 2.3 (�0.21, 3.41)
Baseline fasting glucose (mg/dl) 94.3 (0.84) 91.5 (0.47) 2.8 (1.31, 5.09)**
Plasma glucose 30 min (mg/dl) 149.5 (2.34) 137.5 (1.31) 12.0 (7.50, 18.10)***
Plasma glucose 60 min (mg/dl) 155.2 (3.06) 138.1 (1.72) 17.1 (11.6, 25.4)***
Plasma glucose 120 min (mg/dl) 123.8 (2.46) 113.5 (1.38) 10.3 (5.17, 16.20)***
HbA1c (%) 5.2 (0.07) 4.9 (0.04) 0.3 (0.15, 0.44)**
Triglyceride (mg/dl) 163.2 (6.47) 130.8 (3.51) 32.4 (18.7, 47.5)***
Cholesterol (mg/dl) 189.8 (2.94) 186.8 (1.60) 3.0 (�2.16, 11.5)
HDL cholesterol (mg/dl) 45.1 (0.97) 48.0 (0.52) �2.9 (�4.95, �0.65)**
LDL cholesterol (mg/dl) 112.6 (2.74) 113.7 (1.47) �1.1 (�5.89, 6.49)
Variables Developed MetS Not developed MetS Difference (95% CI)
% %
Men 28.0 26.1 1.9 (�5.7, 9.5)
Obesity (BMI �30) 34.1 19.4 14.7 (6.8, 22.6)***
Normal glucose tolerance 54.6 65.5 �10.9 (�19.3, 2.5)*
Impaired fasting glucose 13.2 12.2 1.0 (�4.7, 6.7)
Impaired glucose tolerance 31.6 21.9 9.7 (1.9, 17.4)*
Smoking
Never-smoker 94.4 87.5 6.9 (�19.8, 5.9)
Current-smoker 5.6 12.5 –
Education
Primary or below 56.7 48.3 8.4 (�0.07, 17.0)
Secondary 28.7 34.3 �5.6 9�13.5, 2.2)
Matriculation or above 14.6 17.4 �2.8 (�9.0, 3.4)
CI = confidence interval. The difference in the mean or percentage of the variables between diabetes and no diabetes.* P < 0.05.** P < 0.01.*** P < 0.001.
M. Janghorbani, M. Amini / Diabetes & Metabolic Syndrome: Clinical Research & Reviews 5 (2011) 201–206204
and prevalence of MetS will depend upon the methodologicalfactors, the definition of the MetS used, and the composition of thecommunity examined by age and gender, making comparisonsbetween studies limited. Several cross-sectional studies conductedat different moments and in different populations and suggestedvaried prevalence. The prevalence of MetS in FDRs of patients withtype 2 diabetes is higher than the general population in Iranranging from 10.7% to 35.1% for men and women over 20 years[12–14]. In the National Health and Nutritional ExaminationSurvey III, the MetS prevalence was 23.7% which varied from 19.9%to 35.6% according to race and gender [15]. In European societies,the prevalence of MetS in people 40–55 years is 7–36.3% in menand 5–22% in women, using the WHO definition [16]. Theprevalence of MetS in Turkey is approximately 32.2% in menand 45% in women [17]. The prevalence of MetS in FDRs of peoplewith type 2 diabetes of 35.8% as reported in this study is higherthan the general population and requires serious considerationsince patients with MetS are at greater risk of cardiovasculardisease and type 2 diabetes.
Consistent with prior studies [3,4,6–9,15], the present studyfound similarly higher prevalence of MetS in women. The reason(s)for this gender difference in MetS has not been explored, but somestudies suggest that female sex hormones may contribute [10–13,18] while others failed to see an effect on glucose metabolism[9,13,15].
The incidence of MetS that we report in this study is lower thanthat reported in Korean male workers [19]. Longitudinal study of
Korean male workers ages 30–39 reported that incidence of MetSwas 7.7% per year. But this was higher than that reported inJapanese men ages 35–59 which was 3.6% per year [20]. Almostsimilar to our findings, another study from an urban area ofPortugal reported an incidence of 4.7% per year, similar in men andwomen [21]. Baltimore Longitudinal Study of Aging reported anincidence of 25.5% (5.5% per year) in men and 14.8% (2.7% per year)in women after an average follow-up of 6-years [22]. The InsulinResistance Atherosclerosis Study reported an incidence of 17.1%(4.7% per year) in men and 20.9% (4.8% per year) in women after afollow-up period of 5-years [23]. The San Antonio Heart Studyshowed a 15% incidence of MetS in men (2.0% per year) and a 17%(2.3% per year) in women after 8 years of follow-up [24].
The role of gender as a risk factor for MetS remains unsettled.There have been conflicting reports about the relationshipbetween gender and MetS incidence; in some studies MetSincidence was higher in women [23–25]; whereas in other studiesMetS incidence was higher in men [22,26–28]. Similar to ourresults, some other cohorts from different ethnic backgroundreported no significant differences regarding gender [21,29].
The excess risk of MetS associated with FDRs of patients withtype 2 diabetes was amplified in the presence of IFG, IGT and lowHDL. The FDRs of people with type 2 diabetes who were IFG or IGTat baseline were at higher risk of MetS than NGT relatives. Thissuggests that genetic factors beside lifestyle, obesity, anddyslipidemia may be a part of the risk factors for MetS. Diet withhigh trans unsaturated fat could lower HDL cholesterol levels,

Table 3Incidence rates and relative risks (RR) for metabolic syndrome by baseline variables.
Variables At risk (no.) Cases (no.) Person-year Incidence/100
person-year
Crude RR (95% CI) Multiple-adjusted RR
(95% CI)a
All 734 175 4065 4.3 – –
Gender
Men 195 49 1064 4.6 1.00 1.00
Women 539 126 3001 4.2 0.91 (0.66, 1.26) 0.97 (0.78, 1.19)
Age (year)
<40 288 62 1629 3.8 1.00 1.00
40–49 335 81 1852 4.4 1.15 (0.83, 1.59) 1.14 (0.96, 1.36)
�50 108 32 568 5.6 1.47 (0.98, 2.24) 1.14 (0.88, 1.46)
Fasting glucose (mg/dl)
<100 570 129 3239 4.0 1.00 1.00
�100 160 45 800 5.6 1.40 (1.01, 1.97)* 1.05 (0.77, 1.42)
HbA1c (%)
<6.5 534 115 2821 4.1 1.00 1.00
�6.5 16 8 92 8.7 2.12 (1.07, 4.24)* 0.90 (0.62, 1.29)
Systolic BP (mm Hg)
<130 654 150 3592 4.2 1.00 1.00
�130 50 16 282 5.7 1.36 (0.82, 2.24) 1.05 (0.71, 1.555)
Diastolic BP (mm Hg)
<85 651 146 3562 4.1 1.00 1.00
�85 53 20 312 6.4 1.56 (0.99, 2.46) 0.86 (0.59, 1.28)
Cholesterol (mg/dl)
<200 453 99 2524 3.9 1.00 1.00
200–219 132 33 714 4.6 1.18 (0.80, 1.72) 0.88 (0.69, 1.12)
>220 114 27 611 4.4 1.13 (0.74, 1.71) 0.99 (0.77, 1.28)
HDL (mg/dl)
Men �40 and women �50 323 63 1677 3.8 1.00 1.00
Men <40 and women <50 343 85 1949 4.4 1.16 (0.84, 1.60) 1.34 (1.12, 1.60)***
LDL (mg/dl)
<100 221 49 1225 4.0 1.00 1.00
�100 426 96 2287 4.2 1.05 (0.75, 1.47) 1.04 (0.85, 1.26)
Triglyceride (mg/dl)
<150 509 102 2789 3.7 1.00 1.00
�150 185 56 1023 5.5 1.49 (1.09, 2.06)** 1.00 (0.81, 1.23)
BMI (kg/m2)
<25 158 14 861 1.6 1.00 1.00
25–29.9 400 96 2216 4.3 2.69 (1.53, 4.64)*** 1.00 (0.82, 1.23)
�30 165 57 919 6.2 3.88 (2.14, 6.79)*** 1.01 (0.75, 1.35)
Abdominal obesity (WC)
No 584 112 3217 3.5 1.00 1.00
Yes 140 57 785 7.3 2.09 (1.53, 2.84)*** 0.81 (0.60, 1.09)
Abdominal obesity (WHR)
No 455 80 2552 3.1 1.00 1.00
Yes 222 76 1195 6.4 2.06 (1.49, 2.76)*** 1.22 (0.99, 1.51)
OGTT
Normal glucose tolerance 459 95 2642 3.6 1.00 1.00
IGT 177 55 931 5.9 1.64 (1.19, 2.27)* 1.89 (1.28, 2.79)**
IFG 91 23 452 5.1 1.42 (0.91, 2.21) 1.39 (1.10, 1.73)**
Total number of person-years and at risk is not the same for each variable because of missing values. Abdominal obesity was defined as waist circumference �102 cm in men
and �88 cm in women or waist-to-hip ration �0.95 in men and �0.8 in women. CI, confidence interval; RR, relative risk; WC, waist circumference; WHR, waist-to-hip ratio;
BP, blood pressure; HDL, high density lipoprotein cholesterol; LDL low density lipoprotein cholesterol; OGTT, oral glucose tolerance test; IGT, impaired glucose tolerance; IFG,
impaired fasting glucose.* P < 0.05.** P < 0.01.*** P < 0.001.a Relative risks (with 95% CI) calculated by Cox’s proportional hazards model.
M. Janghorbani, M. Amini / Diabetes & Metabolic Syndrome: Clinical Research & Reviews 5 (2011) 201–206 205
increase triglyceride levels, and impede metabolism of fatty acids.These results stress the importance of both low HDL and impairedglucose levels in the occurrence of this clinical entity [30].
The strengths of the present study include the prospectivecohort design, the sample consisting of both men and women of awide age range from an Iranian population, diagnosis of MetSbased on repeat measurement. The multiple examinations makethe progression rates very accurate. Anthropometric variablescollected by using direct measurement rather than self-report.Selection and information bias is considered unlikely by virtue ofthe prospective design. Loses to follow-up are the major source ofbias in longitudinal studies. This is an ongoing cohort, and duringthis average 5.5 year follow-up period 41.0% of the participantsthat attended the baseline survey had not been yet contacted for
this re-evaluation. This may have some impact on our findings.However, when assessing baseline status of the componentfeatures of MetS, gender, age, and education, no significantdifferences observed between those included in the study andthose who were not yet contacted for this longitudinal analysis.Despite the above limitations, the findings here add to ourunderstanding of the prevalence, incidence and risk factors of MetSin FDRs of people with type 2 diabetes in Iran. Furthermore, thisstudy provides new data from Iran, a developing country that hasbeen underrepresented in past studies.
In summary, the findings of this study illustrate for the firsttime the incidence of MetS in FDRs of patients with type 2 diabetesin Iran. These findings may prove useful in identifying a specificsubset of the population at particular risk of developing MetS
M. Janghorbani, M. Amini / Diabetes & Metabolic Syndrome: Clinical Research & Reviews 5 (2011) 201–206206
known to predispose to cardiovascular disease and diabetes andstrongly support the regular screening of FDRs of patients withtype 2 diabetes.
Contributions
Janghorbani M conceived and designed the study, analyzed thedata and wrote the manuscript, Amini M, recruited samples andcontributed to discussion and revision of the manuscript andobtained funding for the IDPS. All authors discussed the results andreviewed and edited the manuscript.
Acknowledgements
We are grateful to Mr. Majid Abyar for computer technicalassistance. This study could not have been concluded withoutcontribution of the first degree relatives of diabetics that consentedto participate.
Conflict of interest statementNone to declare.
References
[1] Ecket RH, Grundy SM, Zimmer PZ. The metabolic syndrome. Lancet2005;365:1415–28.
[2] Ford ES. Risks for all-cause mortality, cardiovascular disease, and diabetesassociated with the metabolic syndrome: a summary of the evidence. DiabetesCare 2005;28:1769–78.
[3] Amini M, Janghorbani M. Diabetes and impaired glucose regulation in first-degree relatives of patients with type 2 diabetes in Isfahan Iran: prevalenceand risk factors. The Review of Diabetic Studies 2007;4:169–76.
[4] Janghorbani M, Amini M. Progression to impaired glucose metabolism in first-degree relatives of patients with type 2 diabetes in Isfahan, Iran. Diabetes/Metabolism Research and Reviews 2009;25:748–55.
[5] Wild S, Roglic G, Green A, Sicree R, King H. Global prevalence of diabetes:estimates for the year 2000 and projections for 2030. Diabetes Care2004;27:1047–53.
[6] Executive summary. Standard of medical care in diabetes-2008. Diabetes Care2008;31:S5–11.
[7] Expert Panel on Detection, Evaluation, and Treatment of High Blood Choles-terol in Adults. Executive summary of the third report of the National Choles-terol Education Program (NECP) Expert Panel on Detection, Evaluation, andTreatment of High Blood Cholesterol in Adults (Adult Treatment Panel III).Journal of the American Medical Association 2001;285:2486–97.
[8] American Diabetes Association. Diagnosis and classification of diabetes mel-litus. Diabetes Care 2008;(Suppl. 1):S55–60.
[9] Friedewald WT, Levy RI, Fredrickson DS. Estimation of the concentration oflow-density lipoprotein cholesterol in plasma, without use of the preparativeultracentrifuge. Clinical Chemistry 1971;18:499–502.
[10] Bonora E, Kiechl S, Willeit J, Oberhollenzer F, Egger G, Targher G, et al.Prevalence of insulin resistance in metabolic disorders: the Bruneck Study.Diabetes 1998;47:1643–9.
[11] Rantala AO, Kauma H, Lilja M, Savolainen MJ, Reunanen A, Kesaniemi YA.Prevalence of the metabolic syndrome in drug-treated hypertensive patientsand control subjects. Journal of Internal Medicine 1999;245:163–74.
[12] Fakhrzadeh H, Ebrahimpour P, Pourebrahim R, Heshmat R, Larijani B. Meta-bolic syndrome and its associated risk factors in healthy adults: a population-based study in Iran. Metabolic Syndrome and Related Disorders 2006;4:28–34.
[13] Sharifi F, Mousavinasab SN, Saeini M, Dinmohammadi M. Prevalence ofmetabolic syndrome in an adult urban population of the west of Iran. Experi-mental Diabetes Research 2009;136501.
[14] Sarrafzadegan N, Kelishadi R, Baghaei A, Hussein Sadri G, Malekafzali H,Mohammadifard N, et al. Metabolic syndrome: an emerging public healthproblem in Iranian women: Isfahan Healthy Heart Program. InternationalJournal of Cardiology 2008;131:90–6.
[15] Ford ES, Giles WH, Dietz. Prevalence of the metabolic syndrome among USadults: findings from the third National Health and Nutrition ExaminationSurvey. Journal of the American Medical Association 2002;287:356–9.
[16] Balkau B, Charles MA, Drivsholm T, Borch-Johnsen K, Wareham N, Yudkin JS,et al. Frequency of the WHO metabolic syndrome in European cohorts, and analternative definition of an insulin resistance syndrome. Diabetes and Metab-olism 2002;28:364–76.
[17] Onat A, Ceyhan K, Basar O, Erer B, Toprak S, Sansoy V. Metabolic syndrome:major impact on coronary risk in a population with low cholesterol levels—aprospective and cross-sectional evaluation. Atherosclerosis 2002;165:285–92.
[18] Balkau B, Vernay M, Mhamdi L, Novak M, Arondel D, Vol S, et al. The incidenceand persistence of the NCEP (National Cholesterol Education Program) meta-bolic syndrome. The French DESIR study. Diabetes and Metabolism 2003;29:526–32.
[19] Ryu S, Song J, Choi BY, Lee SJ, Kim WS, Chang Y, et al. Incidence and risk factorsfor metabolic syndrome in Korean male workers, ages 30 to 39. Annals ofEpidemiology 2007;17:245–52.
[20] Nakanishi N, Suzuki K, Tatara K. Serum gamma-glutamyltransferase and riskof metabolic syndrome and type 2 diabetes in middle-aged Japanese men.Diabetes Care 2004;27:1427–32.
[21] Santos AC, Severo M, Barros H. Incidence and risk factors for the metabolicsyndrome in an urban South European population. Preventive Medicine2010;50:99–105.
[22] Scuteri A, Morrell CH, Najjar SS, Muller D, Andres R, Ferrucci L, et al. Longitu-dinal paths to the metabolic syndrome: can the incidence of the metabolicsyndrome be predicted? The Baltimore Longitudinal Study of Aging. TheJournals of Gerontology Series A Biological Sciences and Medical Sciences2009;64:590–8.
[23] Palanippan L, Carnethon M, Wang Y, Hanley A, Fortmann S, Haffner S, et al.Predictors of the incident metabolic syndrome in adults: the Insulin ResistanceAtherosclerosis Study. Diabetes Care 2004;27:788–93.
[24] Han TS, Williams K, Sattar N, Hunt KJ, Lean ME, Haffner SM. Analysis of obesityand hyperinsulinemia in the development of metabolic syndrome: San Anto-nio Heart Study. Obesity Research 2002;10:923–31.
[25] Sheu WHH, Chuang SY, Lee WJ, Tsai ST, Chou P, Chen CH. Predictors of incidentdiabetes, metabolic syndrome in middle-aged adults: a 10-year follow-upstudy from Kinmen. Taiwan Diabetes Research and Clinical Practice2006;74:162–8.
[26] Balkau B, Vernay M, Mhamdi L, Novak M, Arondel D, Vol S, et al. The incidenceand persistence of the NCEP (National Cholesterol Education Program) meta-bolic syndrome The French D.E.S.I.R. study. Diabetes and Metabolism 2003;29:526–32.
[27] Carnethon MR, Loria CM, Hill GO, Sidney S, Savage PG, Liu K. Risk factors for themetabolic syndrome: the Coronary Artery Risk Development in Young Adults(CARDIA) study, 1985–2001. Diabetes Care 2004;27:2707–15.
[28] Wilsgaard T, Jacobsen BK. Lifestyle factors and incident metabolic syndrome.The Tromsø study 1979–2001. Diabetes Research and Clinical Practice2007;78:217–24.
[29] Tong J, Boyko E, Utzschneider K, McNeely M, Hayashi T, Carr D, et al. Intra-abdominal fat accumulation predicts the development of the metabolic syn-drome in non-diabetic Japanese-Americans. Diabetologia 2007;50:1156–60.
[30] Fonseca VA. The metabolic syndrome, hyperlipidemia, and insulin resistance.Clinical Cornerstone 2005;7:61–72.