Embed Size (px)
Citation preview
Metabolic Switching and Stochasticity in E. coli
Dr. Mukund Thattai, KITP & MIT (KITP Bio Net 3/17/03) 1
Metabolic Switching inEscherichia coli
Mukund Thattai
ITP
3.17.03
1. Phase diagram of thelac operon
Metabolic Switching and Stochasticity in E. coli
Dr. Mukund Thattai, KITP & MIT (KITP Bio Net 3/17/03) 2
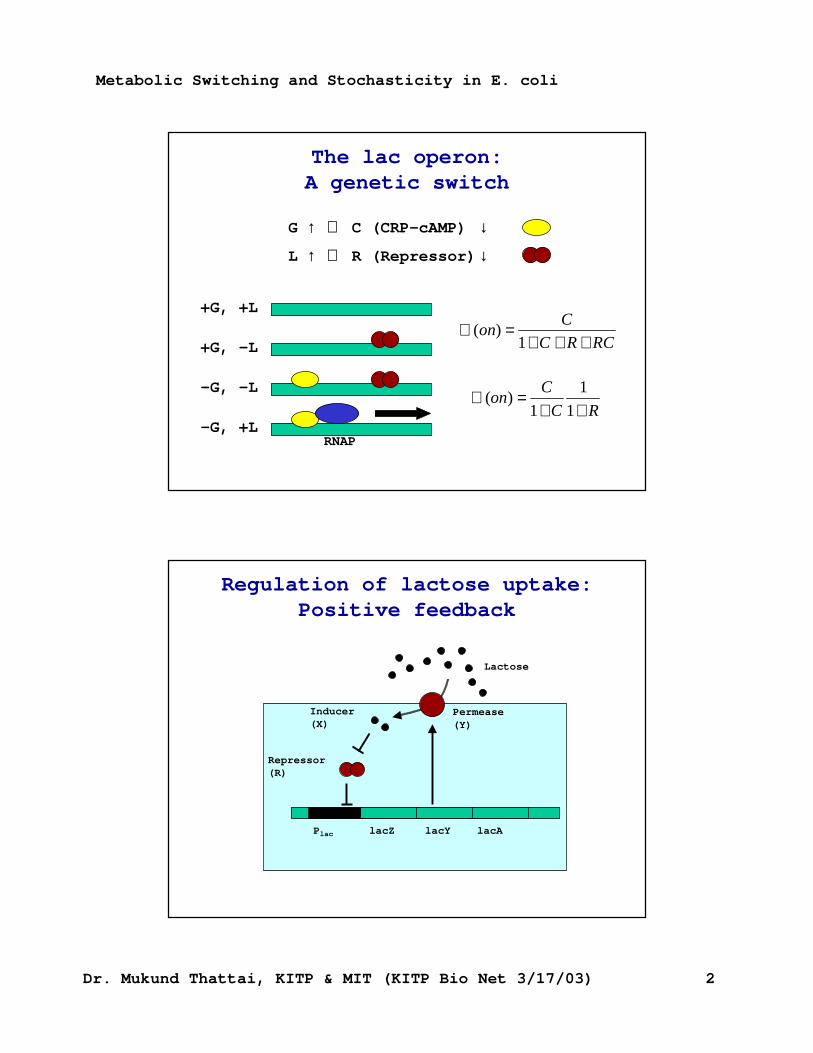
The lac operon: A genetic switch
G ↑↑ ⇒⇒ C (CRP-cAMP) ↓↓
L ↑↑ ⇒⇒ R (Repressor) ↓↓
RNAP
+G, +L
+G, -L
-G, -L
-G, +L
RCRC
Con
+++=℘
1)(
RC
Con
++=℘
1
1
1)(
Regulation of lactose uptake: Positive feedback
Plac lacZ lacY lacA
Permease(Y)
Lactose
Inducer(X)
Repressor (R)
Metabolic Switching and Stochasticity in E. coli
Dr. Mukund Thattai, KITP & MIT (KITP Bio Net 3/17/03) 3
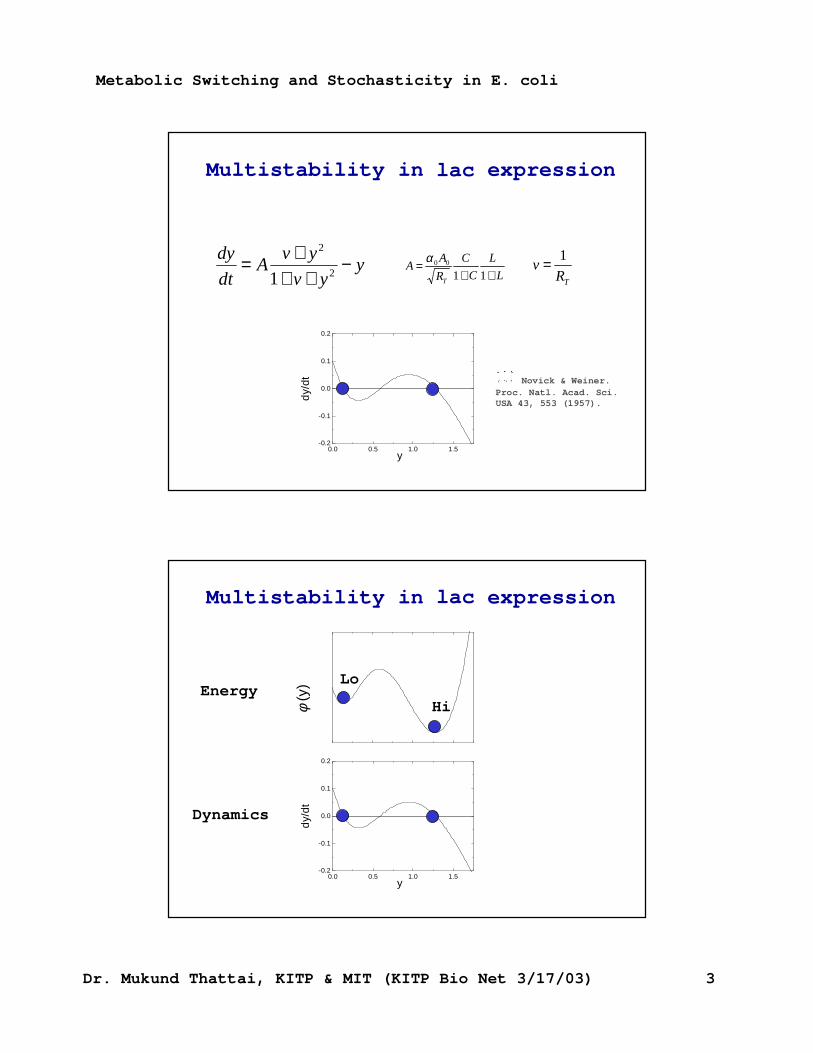
yyv
yvA
dt
dy −++
+=2
2
1 L
L
C
C
R
AA
T ++=
1100α
TRv
1=
Multistability in lac expression
�Novick & Weiner.
Proc. Natl. Acad. Sci. USA 43, 553 (1957).
0.0 0.5 1.0 1.5-0.2
-0.1
0.0
0.1
0.2
dy/
dt
y
0.0 0.5 1.0 1.5-0.2
-0.1
0.0
0.1
0.2
dy/
dt
y
φ (y
)
Hi
LoEnergy
Dynamics
Multistability in lac expression
Metabolic Switching and Stochasticity in E. coli
Dr. Mukund Thattai, KITP & MIT (KITP Bio Net 3/17/03) 4
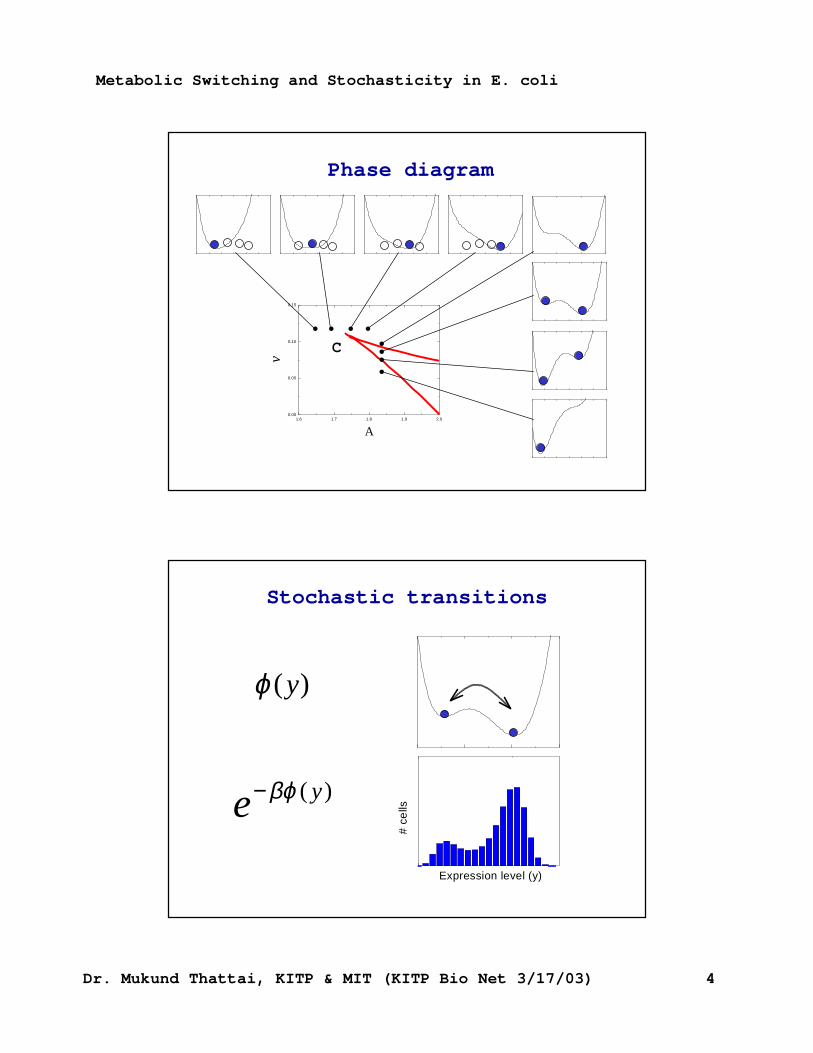
Phase diagram
1.6 1.7 1.8 1.9 2.00.00
0.05
0.10
0.15
v
A
C
Stochastic transitions
# c
ells
Expression level (y)
)(yϕ
)( ye βϕ−
Metabolic Switching and Stochasticity in E. coli
Dr. Mukund Thattai, KITP & MIT (KITP Bio Net 3/17/03) 5
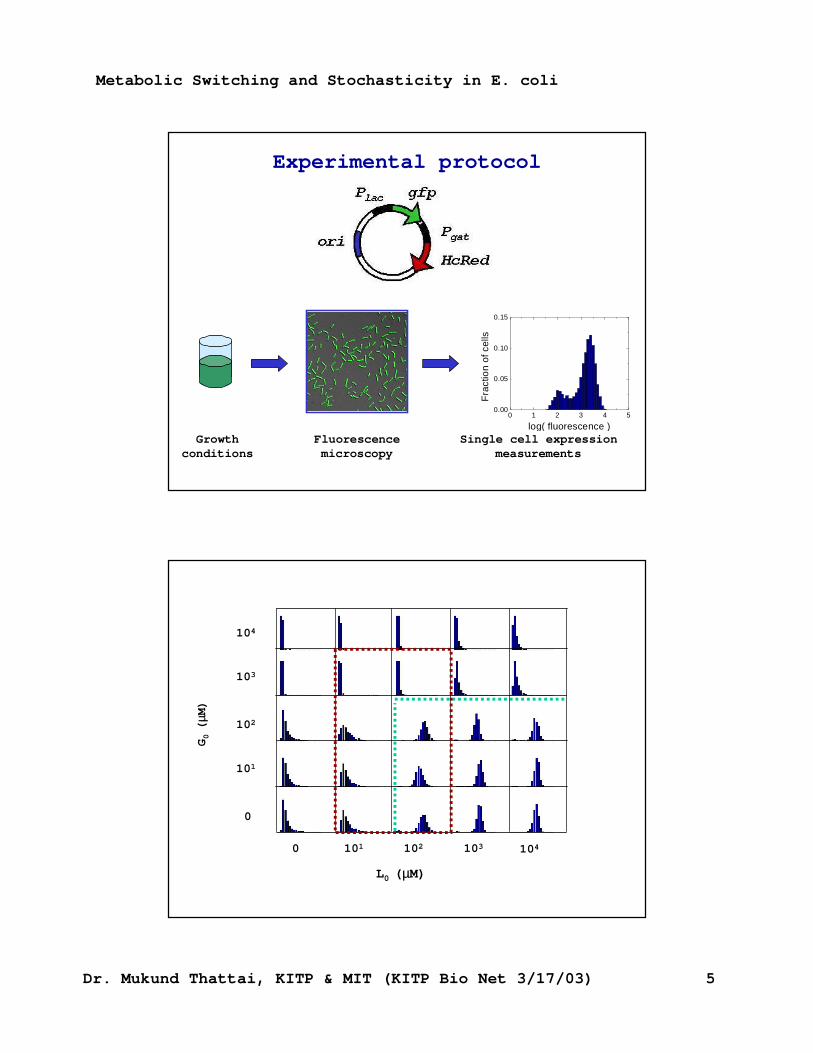
Experimental protocol
Growth conditions
Fluorescence microscopy
Single cell expression measurements
0 1 2 3 4 50.00
0.05
0.10
0.15
Fra
ctio
n of
cel
ls
log( fluorescence )
L0 (µµM)
0
101
102
103
104
0 101 102 103 104
G0 (
µµM)
Metabolic Switching and Stochasticity in E. coli
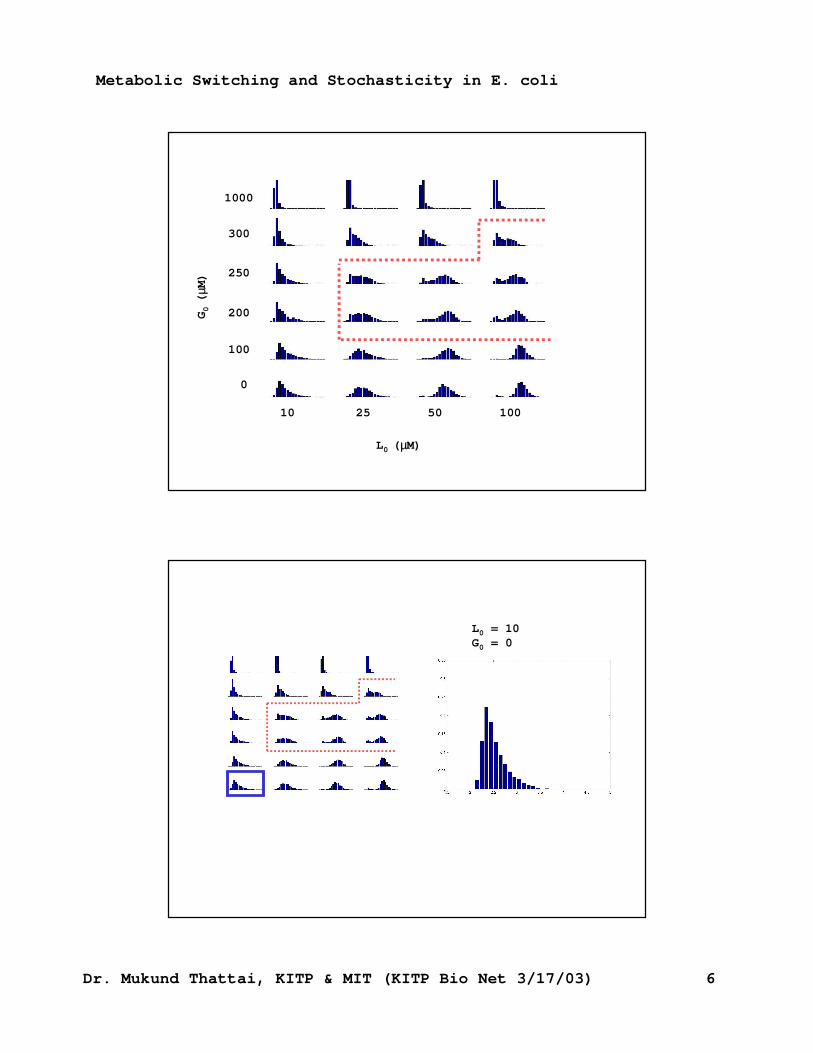
Dr. Mukund Thattai, KITP & MIT (KITP Bio Net 3/17/03) 6
L0 (µµM)
G0 (
µµM)
10 25 50 100
0
1000
300
250
100
200
L0 = 10G0 = 0
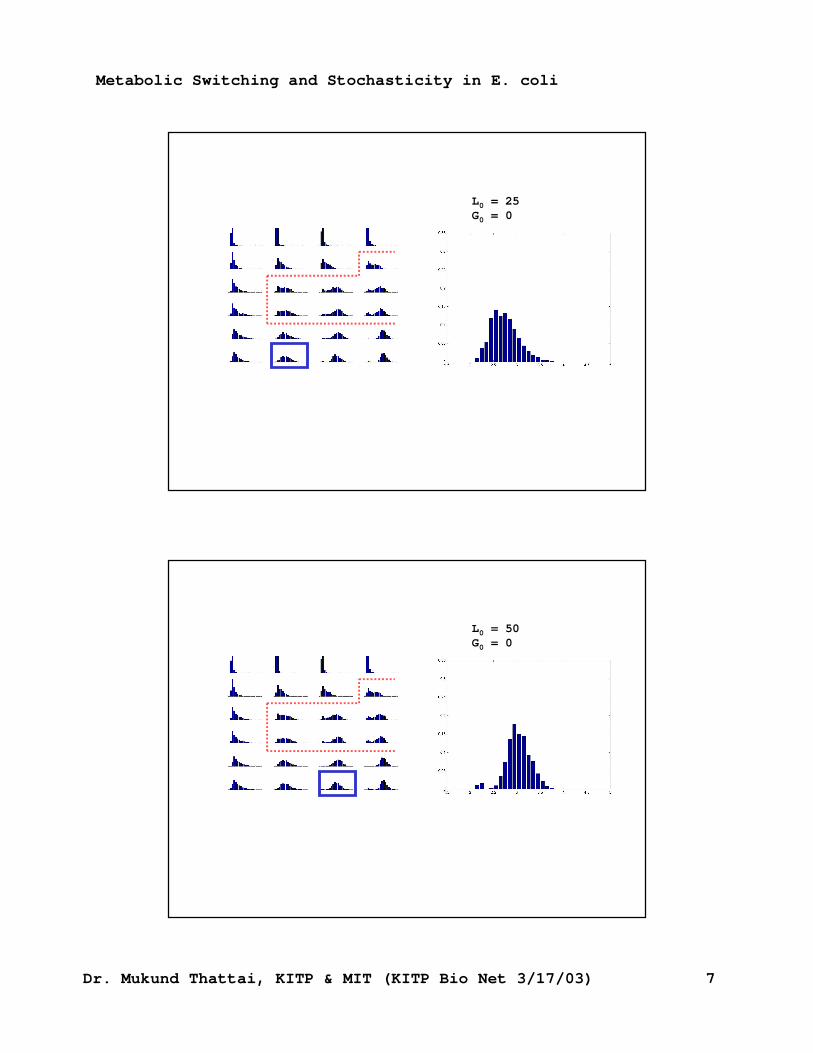
Metabolic Switching and Stochasticity in E. coli
Dr. Mukund Thattai, KITP & MIT (KITP Bio Net 3/17/03) 7
L0 = 25G0 = 0
L0 = 50G0 = 0
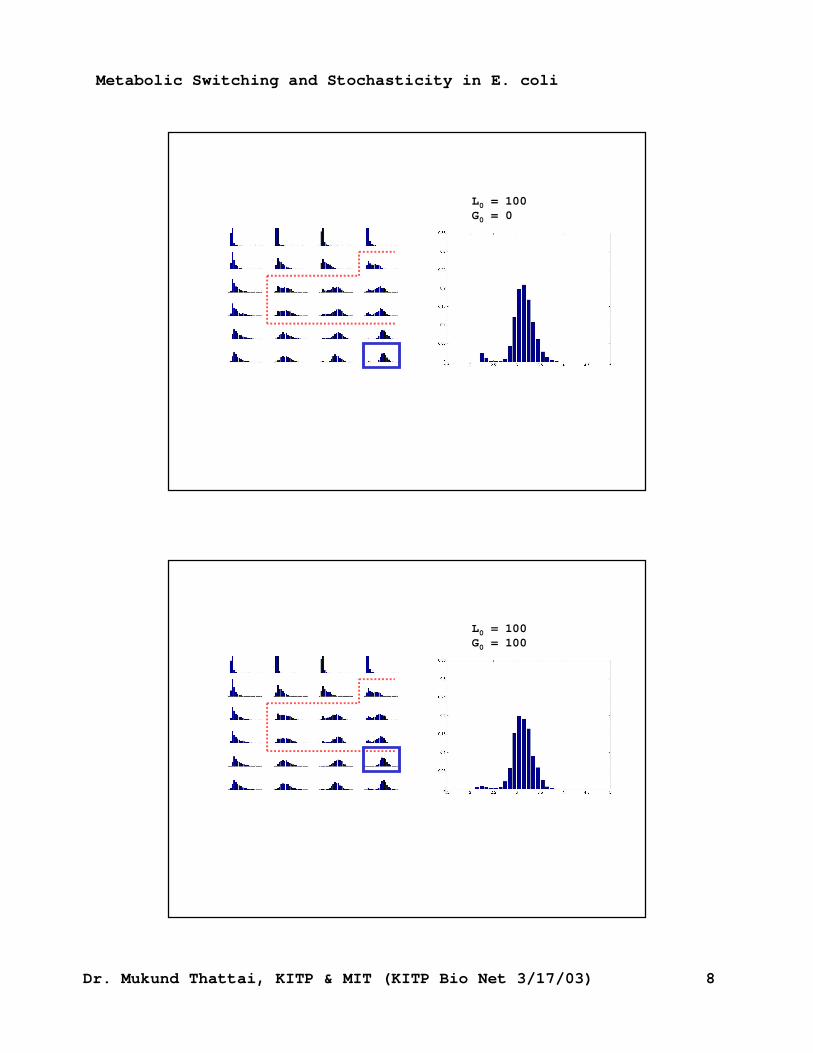
Metabolic Switching and Stochasticity in E. coli
Dr. Mukund Thattai, KITP & MIT (KITP Bio Net 3/17/03) 8
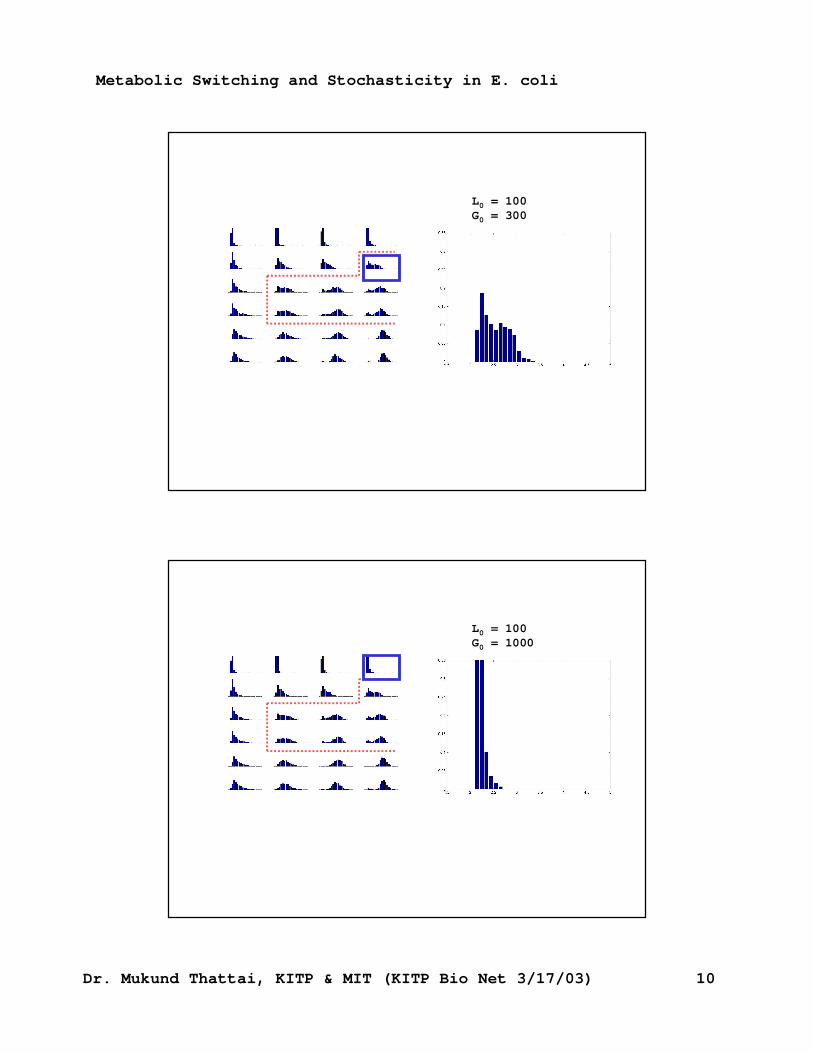
L0 = 100G0 = 0
L0 = 100G0 = 100
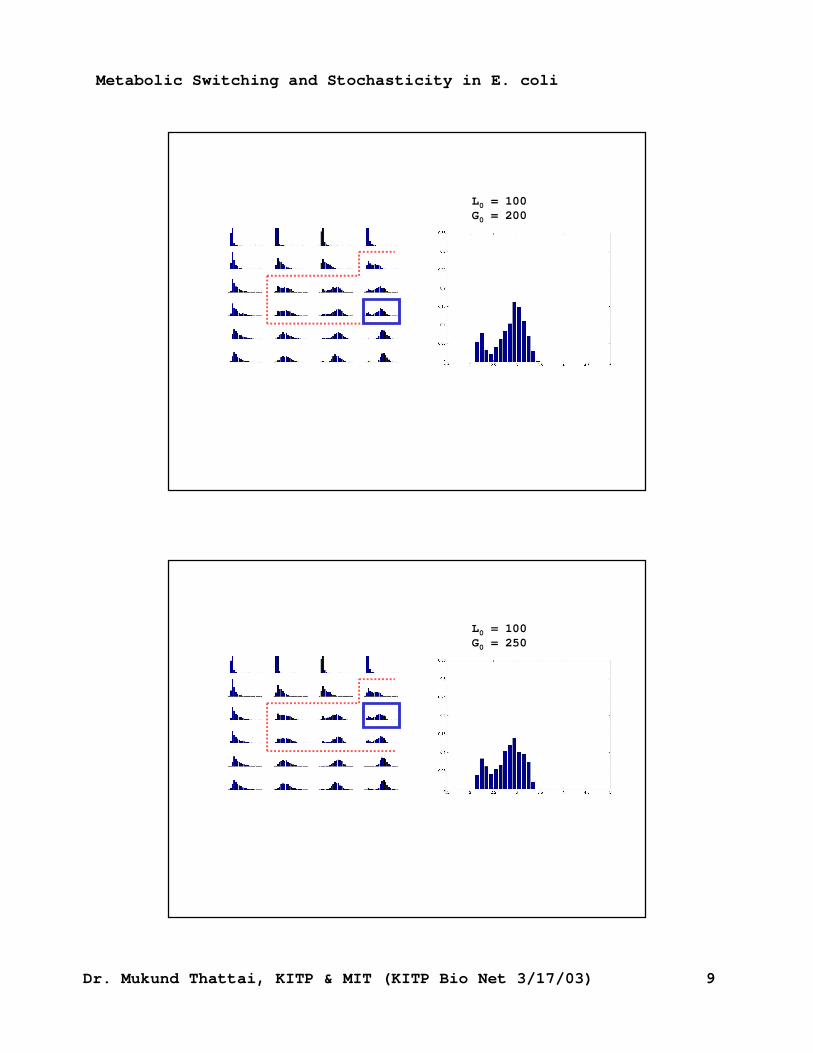
Metabolic Switching and Stochasticity in E. coli
Dr. Mukund Thattai, KITP & MIT (KITP Bio Net 3/17/03) 9
L0 = 100G0 = 200
L0 = 100G0 = 250
Metabolic Switching and Stochasticity in E. coli
Dr. Mukund Thattai, KITP & MIT (KITP Bio Net 3/17/03) 10
L0 = 100G0 = 300
L0 = 100G0 = 1000
Metabolic Switching and Stochasticity in E. coli
Dr. Mukund Thattai, KITP & MIT (KITP Bio Net 3/17/03) 11
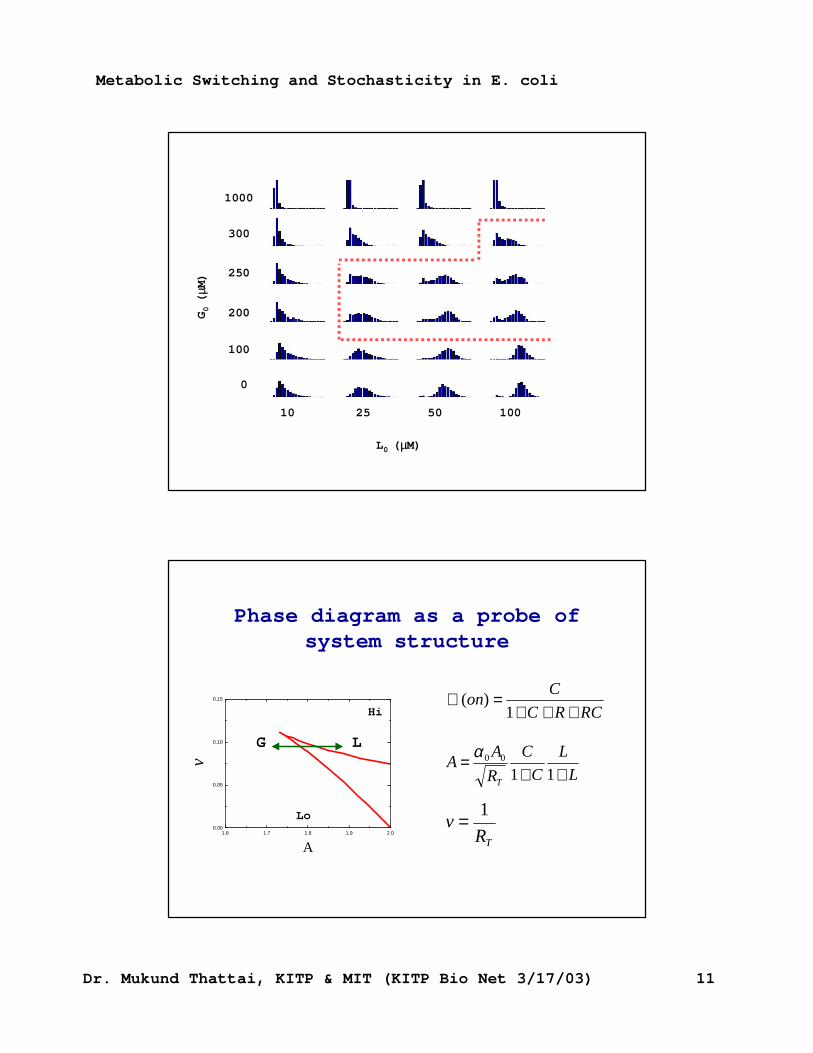
L0 (µµM)
G0 (
µµM)
10 25 50 100
0
1000
300
250
100
200
Phase diagram as a probe of system structure
1.6 1.7 1.8 1.9 2.00.00
0.05
0.10
0.15
v
A
L
L
C
C
R
AA
T ++=
1100α
TRv
1=
RCRC
Con
+++=℘
1)(
LG
Hi
Lo
Metabolic Switching and Stochasticity in E. coli
Dr. Mukund Thattai, KITP & MIT (KITP Bio Net 3/17/03) 12
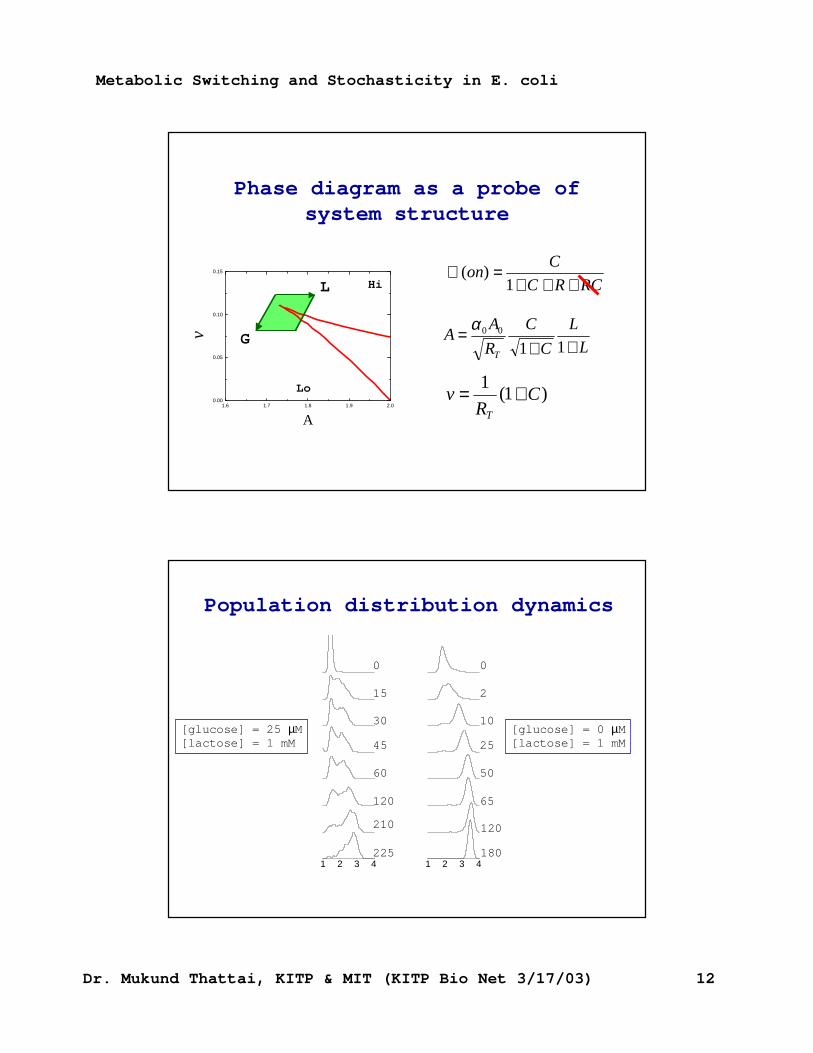
1.6 1.7 1.8 1.9 2.00.00
0.05
0.10
0.15
v
A
L
L
C
C
R
AA
T ++=
1100α
)1(1
CR
vT
+=
L
G
Hi
Lo
RCRC
Con
+++=℘
1)(
Phase diagram as a probe of system structure
1 2 3 4
1 2 3 4
0
15
30
45
60
120
210
225
[glucose] = 25 µM[lactose] = 1 mM
0
2
10
25
50
65
120
180
[glucose] = 0 µM[lactose] = 1 mM
Population distribution dynamics
Metabolic Switching and Stochasticity in E. coli
Dr. Mukund Thattai, KITP & MIT (KITP Bio Net 3/17/03) 13
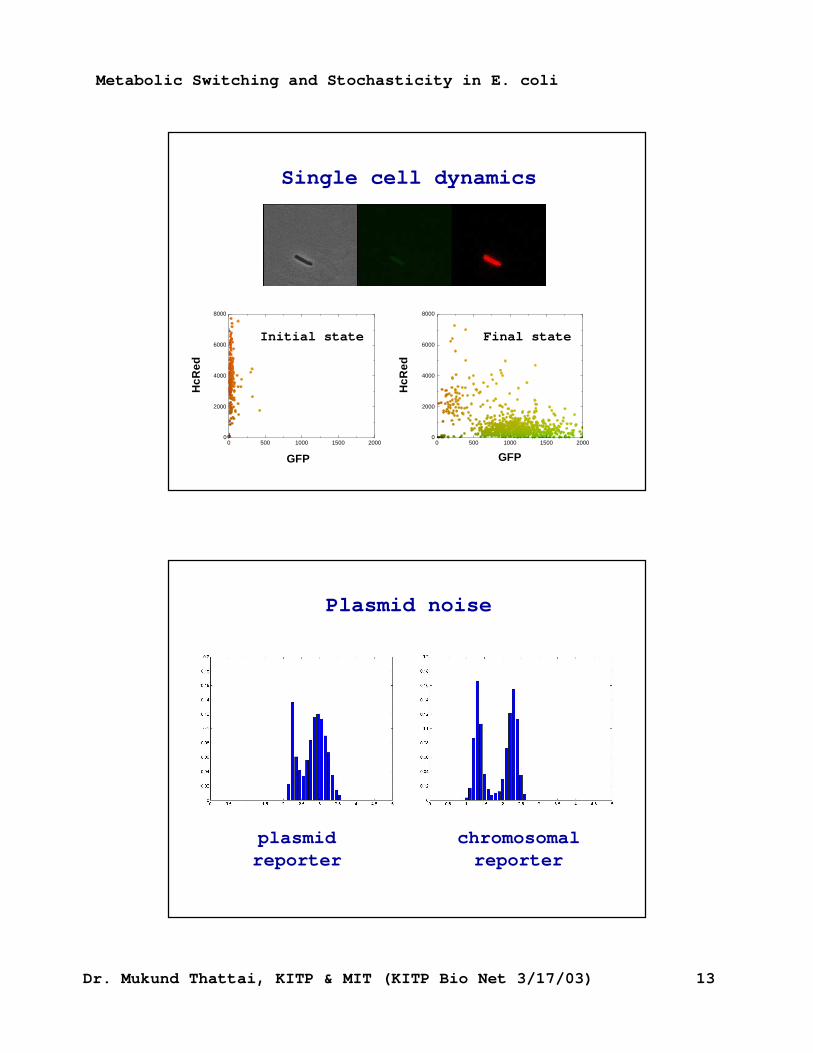
0 500 1000 1500 20000
2000
4000
6000
8000
HcR
ed
GFP
0 500 1000 1500 20000
2000
4000
6000
8000
HcR
ed
GFP
Initial state Final state
Single cell dynamics
Plasmid noise
plasmidreporter
chromosomal reporter
Metabolic Switching and Stochasticity in E. coli
Dr. Mukund Thattai, KITP & MIT (KITP Bio Net 3/17/03) 14
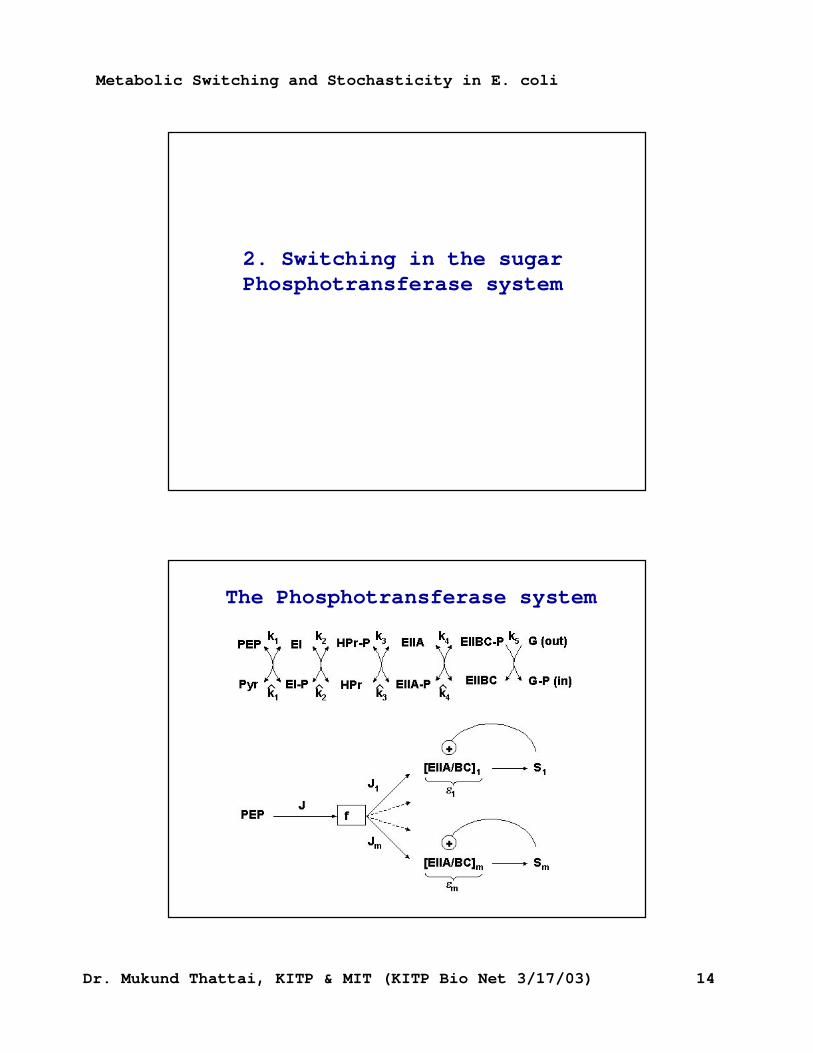
2. Switching in the sugarPhosphotransferase system
The Phosphotransferase system
Metabolic Switching and Stochasticity in E. coli
Dr. Mukund Thattai, KITP & MIT (KITP Bio Net 3/17/03) 15
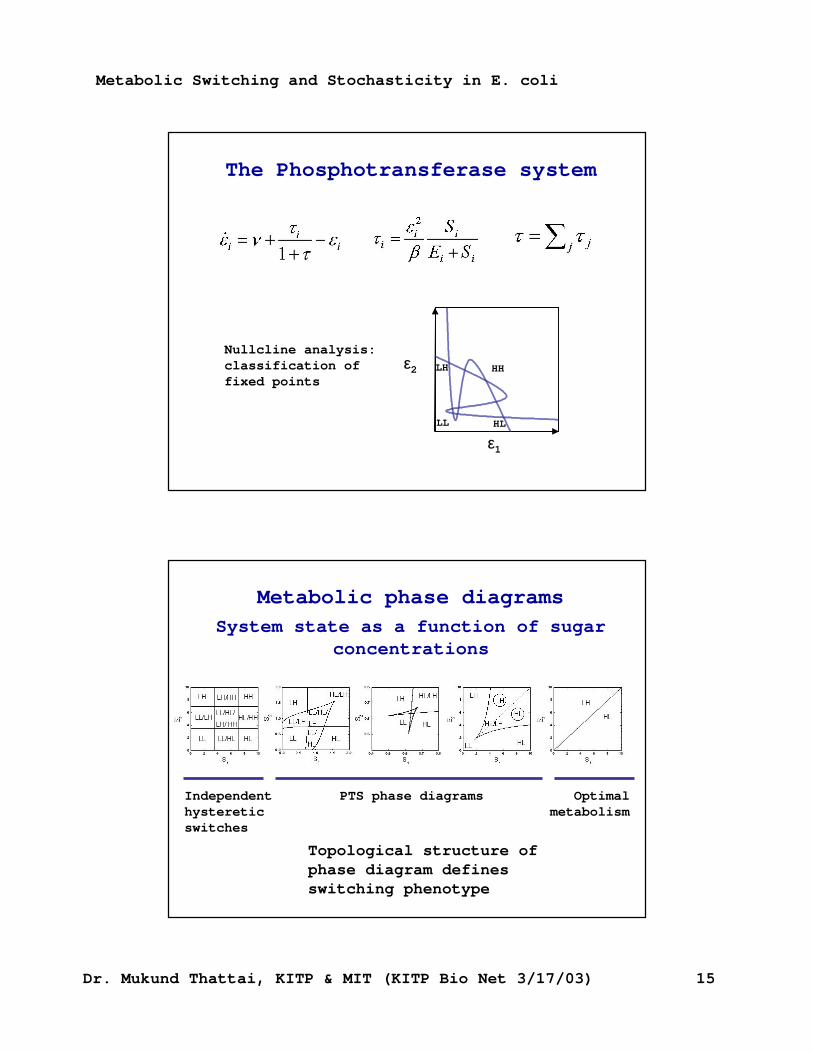
The Phosphotransferase system
εε1
εε2
HL
LH
LL
HH
Nullcline analysis: classification of fixed points
Metabolic phase diagrams
System state as a function of sugar concentrations
Independent hysteretic switches
PTS phase diagrams Optimal metabolism
Topological structure of phase diagram defines switching phenotype
Metabolic Switching and Stochasticity in E. coli
Dr. Mukund Thattai, KITP & MIT (KITP Bio Net 3/17/03) 16
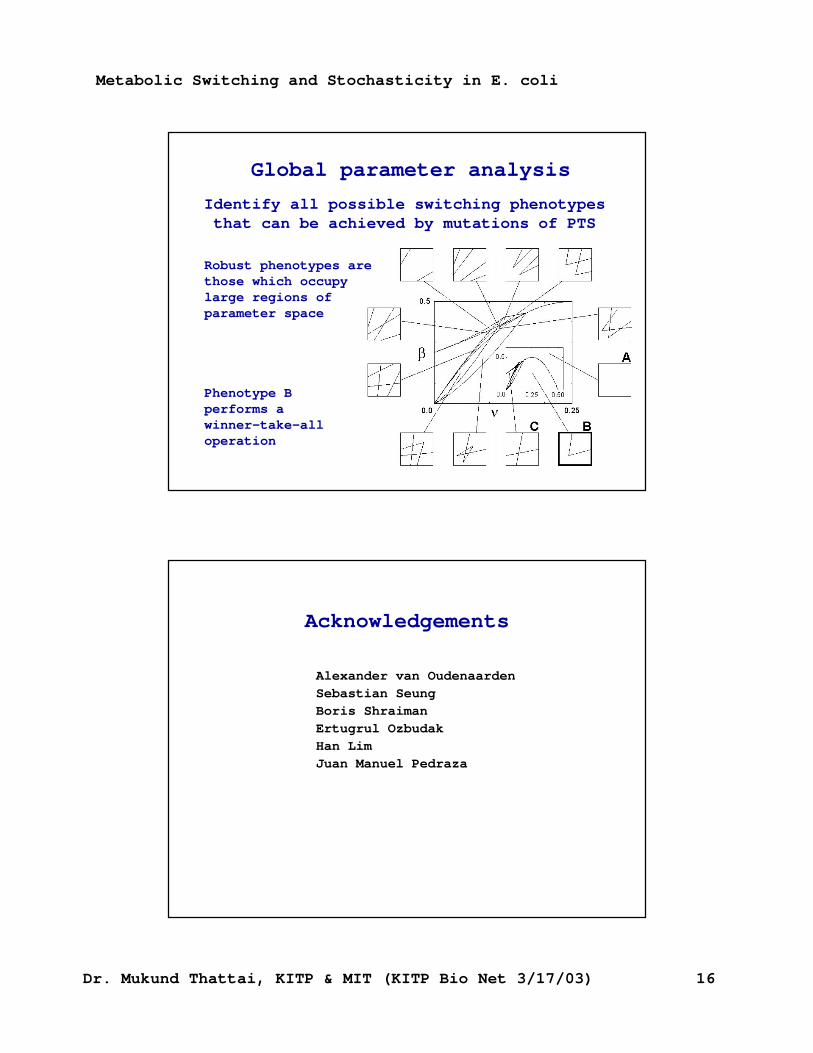
Global parameter analysis
Identify all possible switching phenotypes that can be achieved by mutations of PTS
Robust phenotypes are those which occupy large regions of parameter space
Phenotype B performs a winner-take-all operation
Acknowledgements
Alexander van OudenaardenSebastian SeungBoris ShraimanErtugrul OzbudakHan Lim Juan Manuel Pedraza