Embed Size (px)
Citation preview
Metabolic Pathway Analysis: Principles, Examples and Application
Zhen Chen Institute of Bioprocess and Biosystems Engineering
Hamburg University of Technology, Germany
Hongjuan Liu, Jianan Zhang Institute of Nuclear and New Energy Technology
Tsinghua University, China
Dehua Liu Institute of Applied Chemistry, Department of Chemical Engineering
Tsinghua University, China
1 Introduction
For the further understanding of the metabolic systems functionality, the structure, pathways and flux distributions analysis in metabolic networks has become an important approach (Stefan et al., 2012; Trang et al., 2012; Kurata et al., 2007; Chen et al. 2009). The ever-increasing genome sequencing has exposed us to a large amount of information (Ostrander & Beale, 2012; Wajid & Serpedin, 2012; Bras et al., 2012). These genomic information are the basis for our systematic understanding on the cellular be-havior and helpful for the further modification of genome sequences for various applications, such as metabolic engineering of strains for bioprocesses and therapeutics, bioremediation, etc. Clarification of the linkage between genotype and phenotype, however, is highly complicated because of various interac-tions between metabolites and proteins, metabolic pathways and cellular regulations. Direct modeling of cellular kinetics at genomic level is still highly challenging based on current techniques.
In view of the complicated interactions, metabolic pathway analysis (MPA) has provided a simpli-fied approach for analyzing functionality and regulation of metabolic networks. Based on the stoichio-metric rather than kinetic properties of metabolic networks, MPA aims to discover and analyze meaning-ful routes involved in the metabolic networks, linking the cellular behavior with its inherent metabolic network structure (Kremling et al., 2000; Covert et al., 2001).
MPA can be used to study the functionality of metabolic networks, the flexibility/redundancy of metabolic pathways (Papin et al., 2002; Stellling et al., 2002). The futile cycles and optimal pathways with respect to product/biomass yield also can be easily identified (Schuster et al., 2000), thus enabling the search of promising targets of genetic manipulations for industrial strain development (Wiechert et al., 2002). Furthermore, MPA is useful in metabolic flux analysis, considering that all of the flux distri-butions are the linear combinations of elementary flux modes (Klamt et al., 2002).
In MPA, two approaches, called as elementary flux modes and extreme pathways, have mostly been used for the study of the pathway structure in biochemical networks. These two approaches are very similar, and thus they are often difficult to be differentiated and implemented properly. In this chapter, the method of MPA is introduced. The elementary flux modes and extreme pathways are described and compared. Furthermore, the detailed examples are also illustrated for the practical application of elemen-tary flux analysis.
2 Theoretical Aspects of Metabolic Pathway Analysis
2.1 Network Structure and Pathway Analysis
A well-built metabolic network is the base of MPA, which can be the biochemically defined maps or re-constructed network derived from genome annotation. It should be mentioned that the structure of meta-bolic network directly affects the results of MPA. On the other hand, the results of MPA can also be used to evaluate the rationality of the network.
For a given metabolic network, the system boundaries should be defined firstly. The metabolites outside the system boundary are ‘external metabolites’, such as nutrients, excreted products. The ‘internal metabolites’ are located inside the cell and participate in the biochemical reactions of the metabolic net-work. The metabolite fluxes across system boundaries, connecting external metabolites and internal me-
tabolites through enzymatic reactions or transport process, are called as exchange fluxes. For an internal metabolite Xi, following equation is given based on the mass balance:
dXi
dt= S
i, jv
jj∑
(1)
where vj and Si,j are the metabolic flux of reaction j and stoichiometric coefficient of metabolite Xi in re-action j, respectively. Si,j is negative when Xi is consumed and positive when Xi is produced. At steady state, the concentrations of all internal metabolites are constant dXi / dt = 0.The mass balance of the sys-tems can be simplified as linear equations:
Sv = 0 (2)
where S is an m×n stoichiometric matrix and vj is the metabolic fluxes. The rows of S correspond to the
internal metabolites in a reaction network and the columns of S correspond to the stoichiometric coeffi-cients of internal metabolites in the associated reactions. The stoichiometric matrix S contains all of the information about how substances are linked through reactions within the network and thus it indicates the topological structure and architecture of the network. All of the possible solutions of Equation (2) within the null space represent the capabilities of a given metabolic genotype. Exploring the null space thus allows us to predict several inherently important properties of a metabolic network, such as the criti-cal links of two metabolites in the network, the efficiency of energy extraction and material conversion for a given substrate, the potential substrate and building blocks that cell can use or manufacture (Schil-ling et al., 1999).
With the further consideration of inequality constraints on the irreversible reactions (reversible re-actions can be decomposed as irreversible forward and backward reactions),
v
i≥ 0
(3)
Equation 2 can be described as a high-dimensional cone that is located in a space where each axis corre-sponds to a reaction flux (Figure 1). The solution space with the shape of a convex polyhedral cone has a finite number of edges. The edges of the cone are unique for a given metabolic network and correspond to biochemically feasible pathways, called as extreme pathways. Any vector within the cone can be rep-resented as a nonnegative linear combination of the extreme pathways:
v = α
kf
kk∑ ,α
k≥ 0
(4)
where fk is fluxes of extreme pathways.
2.2 Extreme Pathways
As mentioned above, the extreme pathways (EPs) correspond to the edges of the high-dimensional con-vex solution space of a biochemical network. Extreme pathways (EPs) share three important properties. Firstly, EPs are unique for a given metabolic network which means that EPs are invariant property of the network. Furthermore, each EP consists of the minimum set of enzymes (or reactions) that needs to build as a functional unit. Finally and most importantly, EPs are the systemically independent flux modes. No
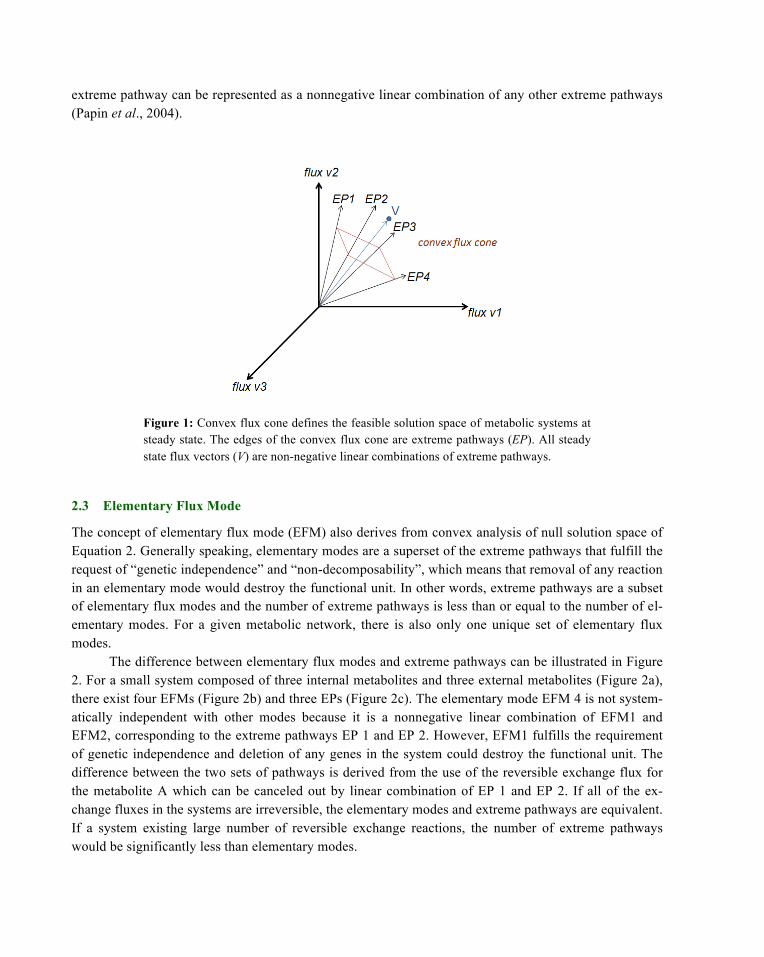
extreme pathway can be represented as a nonnegative linear combination of any other extreme pathways (Papin et al., 2004).
Figure 1: Convex flux cone defines the feasible solution space of metabolic systems at steady state. The edges of the convex flux cone are extreme pathways (EP). All steady state flux vectors (V) are non-negative linear combinations of extreme pathways.
2.3 Elementary Flux Mode
The concept of elementary flux mode (EFM) also derives from convex analysis of null solution space of Equation 2. Generally speaking, elementary modes are a superset of the extreme pathways that fulfill the request of “genetic independence” and “non-decomposability”, which means that removal of any reaction in an elementary mode would destroy the functional unit. In other words, extreme pathways are a subset of elementary flux modes and the number of extreme pathways is less than or equal to the number of el-ementary modes. For a given metabolic network, there is also only one unique set of elementary flux modes.
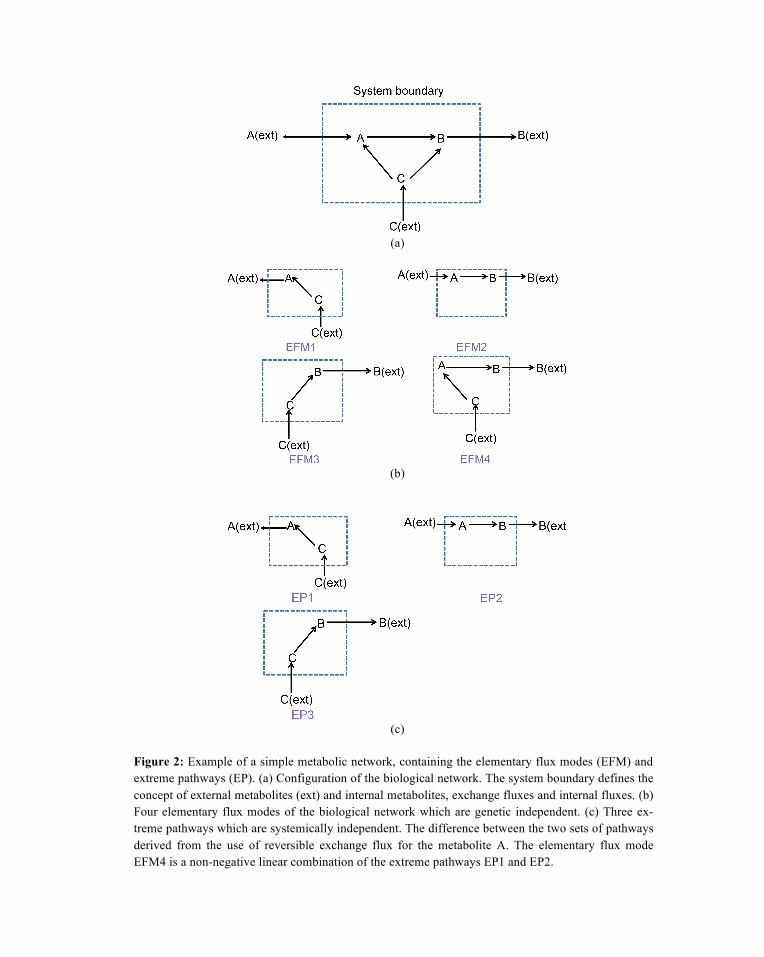
The difference between elementary flux modes and extreme pathways can be illustrated in Figure 2. For a small system composed of three internal metabolites and three external metabolites (Figure 2a), there exist four EFMs (Figure 2b) and three EPs (Figure 2c). The elementary mode EFM 4 is not system-atically independent with other modes because it is a nonnegative linear combination of EFM1 and EFM2, corresponding to the extreme pathways EP 1 and EP 2. However, EFM1 fulfills the requirement of genetic independence and deletion of any genes in the system could destroy the functional unit. The difference between the two sets of pathways is derived from the use of the reversible exchange flux for the metabolite A which can be canceled out by linear combination of EP 1 and EP 2. If all of the ex-change fluxes in the systems are irreversible, the elementary modes and extreme pathways are equivalent. If a system existing large number of reversible exchange reactions, the number of extreme pathways would be significantly less than elementary modes.
(a)
(b)
(c)
Figure 2: Example of a simple metabolic network, containing the elementary flux modes (EFM) and extreme pathways (EP). (a) Configuration of the biological network. The system boundary defines the concept of external metabolites (ext) and internal metabolites, exchange fluxes and internal fluxes. (b) Four elementary flux modes of the biological network which are genetic independent. (c) Three ex-treme pathways which are systemically independent. The difference between the two sets of pathways derived from the use of reversible exchange flux for the metabolite A. The elementary flux mode EFM4 is a non-negative linear combination of the extreme pathways EP1 and EP2.
Since the calculation of extreme pathways would potentially eliminate the reversible exchange fluxes, application of extreme pathways for the interpretation of system properties should be carefully used. Therefore, elementary mode analysis is more generally used for the full evaluation of network properties. However, it should be noted that the number of elementary flux modes exponentially in-creased with the enhancement of network complexity. Although the algorithm has been optimized during the past years, it is still impossible to calculate all elementary modes in genome-wide networks.
3 Example-elementary Flux Mode Analysis of Glycerol Metabolic Net-work
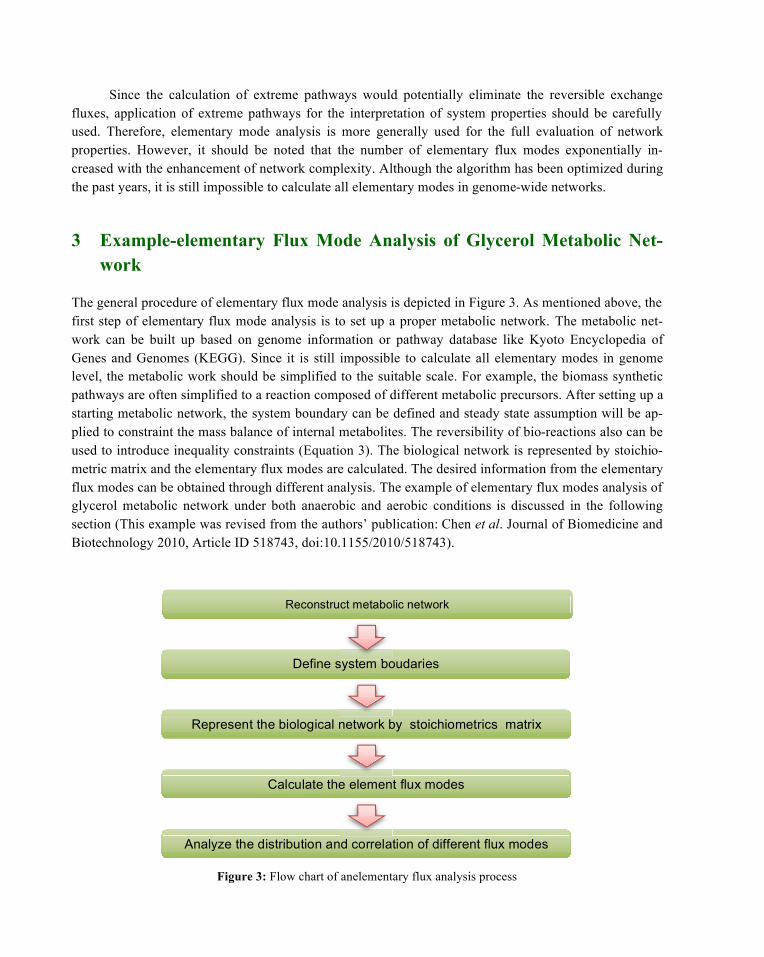
The general procedure of elementary flux mode analysis is depicted in Figure 3. As mentioned above, the first step of elementary flux mode analysis is to set up a proper metabolic network. The metabolic net-work can be built up based on genome information or pathway database like Kyoto Encyclopedia of Genes and Genomes (KEGG). Since it is still impossible to calculate all elementary modes in genome level, the metabolic work should be simplified to the suitable scale. For example, the biomass synthetic pathways are often simplified to a reaction composed of different metabolic precursors. After setting up a starting metabolic network, the system boundary can be defined and steady state assumption will be ap-plied to constraint the mass balance of internal metabolites. The reversibility of bio-reactions also can be used to introduce inequality constraints (Equation 3). The biological network is represented by stoichio-metric matrix and the elementary flux modes are calculated. The desired information from the elementary flux modes can be obtained through different analysis. The example of elementary flux modes analysis of glycerol metabolic network under both anaerobic and aerobic conditions is discussed in the following section (This example was revised from the authors’ publication: Chen et al. Journal of Biomedicine and Biotechnology 2010, Article ID 518743, doi:10.1155/2010/518743).
Figure 3: Flow chart of anelementary flux analysis process
Reconstruct metabolic network
Define system boudaries
internal and external metabolites, reversibility of bioreactions
Represent the biological network by stoichiometrics matrix
Calculate the element flux modes
Analyze the distribution and correlation of different flux modes
Define system boudaries
!
!
3.1 Glycerol Metabolism
Glycerol has aroused people’s attention due to its low price as the byproduct of biodiesel production and can be turned to high value added products (Yazdani & Gonzalez, 2007; Yang & Turon, 2012; Abad et al. 2012; Liu et al. 2007; Xu et al., 2009). Succinate is traditionally produced from sugars under anaero-bic conditions. This process, however, is not optimal succinate production due to the limited availability of reducing equivalents (Zeikus & Jain, 1999; Litsanov et al., 2012a; Litsanov et al., 2011). The byprod-uct glycerol is a potential substrate for the succinate production because glycerol has a higher reduced state compared with glucose and several microorganisms such as E. coli can transform glycerol into suc-cinate (Booth et al., 2005). However, no industrially competitive organisms can effectively produce suc-cinate from glycerol so far. Based on the technology of metabolic engineering, E. coli can be developed to utilize glycerol for succinate production effectively for its clear inheritance background (Lin et al., 2005; Litsanov et al. 2012b; Litsanov et al., 2012c; Kang et al., 2011).
In E.coli, glycerol is firstly phosphorylated into glycerol 3-phophate (G3P) by ATP-dependent glycerol kinase encodedby glpK gene, and then glycerol 3-phophate is converted into dihydroxyacetone phosphate (DHAP) by aerobic G3Pdehydrogenase encoded by glpD gene (Figure 4) under aerobic condi-tion (Freedberg & Lin, 1973; Sweet et al. 1990). The anaerobic fermentative pathway of glycerol has just been clarified in recent years (Dharmadi et al., 2006; Murarka et al., 2008) although the aerobic dissimi-lation of glycerol by E.coli has already been known for a long time. In this pathway, glycerol is convert-ed to dihydroxyacetone (DHA) by NAD+ linked glycerol dehydrogenase (GDH), and the DHA is phos-phorylated to DHAP via the ATP-dependent or phosphoenolpyruvate (PEP)-dependent DHA kinase (DHAK). DHAP is then reduced into 1,2-propanediol or enter glycolysis (Altarasn & Camerond, 1999).
E. coli can utilize glycerol in both aerobic and anaerobic conditions, the potential and the feasibil-ity of engineered E. coli for the succinate production in aerobic and anaerobic condition can be analyzed through elementary flux analysis. The rational strain development strategy also can be put forward based on the elementary flux analysis.
3.2 Metabolic Network Construction of Glycerol Metabolism in Escherichia coli
The glycerol metabolic network of E. coli was constructed1 (Fig. 4) containing glycerol dissimilation pathways, glycolysis pathway (EMP), pentose phosphate pathway (PPP), tricarboxylic acid (TCA) cycle, biosynthesis pathway, anaplerosis, and respiratory chain based on some literatures (Zhang & Xiu, 2009; Sauer et al., 2004; Carlson & Srienc, 2004; Edwards & Palsson, 2000).
Under aerobic condition, glycerol is firstly phosphorylated into G3P by ATP-dependent glycerol kinase and then G3P is transferred into DHAP by NAD+-dependent G3P dehydrogenase (Freedberg & Lin, 1973; Sweet et al., 1990). The 1, 2-propanediol pathway is assumed to be inactive. Pyruvate oxidase is active under aerobic condition which will transfer pyruvate into acetate. The detailed description of the model is listed in Appendices A1 and A3.
Under anaerobic condition, glycerol is assumed to be dissimilated into DHA by NAD+-dependent glycerol dehydrogenase and then DHA is phosphorylated into DHAP by ATP-dependent or PEP-dependent DHA kinase (Dharmadi et al., 2006; Murarka et al., 2008). The pathway from DHAP to 1,2-propanediol is considered to be active under anaerobic condition (Dharmadi et al., 2006). The pyruvate
1 http://www.genome.jp/kegg/metabolism.html
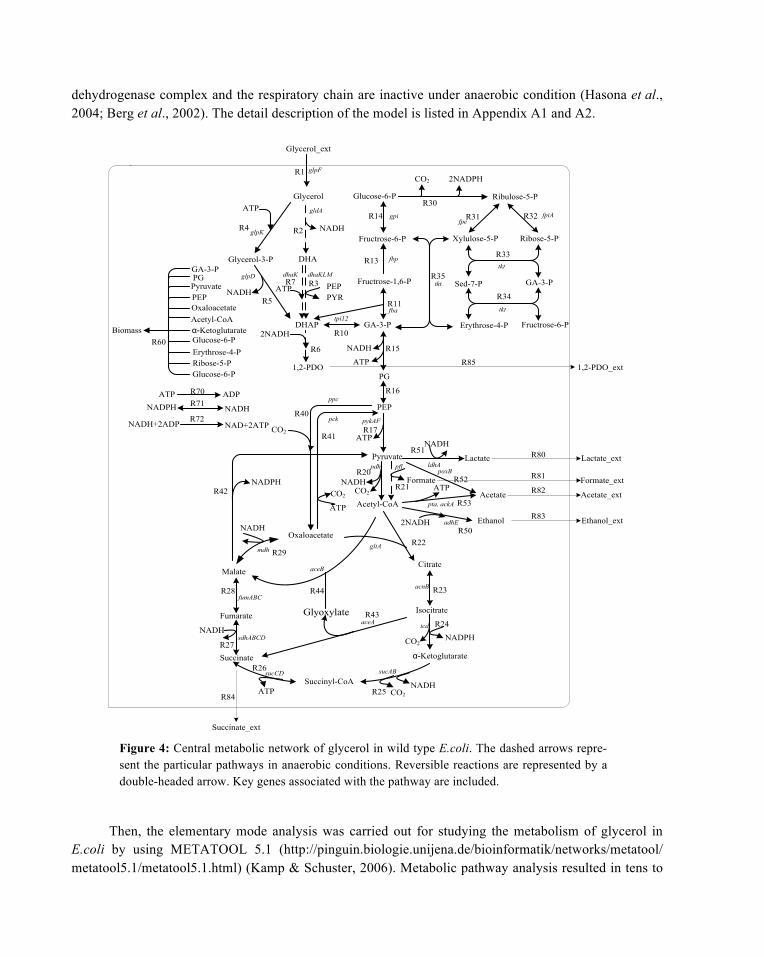
dehydrogenase complex and the respiratory chain are inactive under anaerobic condition (Hasona et al., 2004; Berg et al., 2002). The detail description of the model is listed in Appendix A1 and A2.
Glycerol
GA-3-P
Fructrose-6-P
Glucose-6-P
Ribose-5-P
Sed-7-P
Erythrose-4-P
2NADPHCO2
NADH
PG
NADH
PEP
ATP
Pyruvate
Oxaloacetate
CO2
Acetyl-CoA
Formate
Ethanol
AcetateATP
Lactate
DHA
DHAP
Ribulose-5-P
Xylulose-5-P
Glycerol-3-P
Fructrose-6-P
Fructrose-1,6-P
GA-3-P
Glycerol_ext
ATP
NADHPEPPYR
NADHATP
NADHCO2
2NADH
Citrate
Isocitrate
α-Ketoglutarate
Succinyl-CoA
Succinate
Fumarate
Malate
Glyoxylate
NADPHCO2
NADHCO2
NADH
NADH
Biomass
PyruvatePEPOxaloacetate
α-KetoglutarateAcetyl-CoA
Erythrose-4-PRibose-5-PGlucose-6-P
NADH+2ADP NAD+2ATP
ATP ADP
NADHNADPH
Lactate_ext
Succinate_ext
Formate_ext
Acetate_ext
Ethanol_ext
glpF
gldA
dhaKLM
glpK
glpD
tpi12
pflpdh
ppc
pck pykAF
ldhA
gltA
acnB
icd
sucABsucCD
sdhABCD
fumABC
mdh
aceA
aceB
adhE
pta, ackA
poxB
CO2
ATP
ATP
R1
R2
R3
R4
R5
R10
R15
R16
R20
R17
R21
R22
R23
R24
R25
R26
R27
R28
R29
R11
R13
R14
1,2-PDO
2NADH
R30
R31 R32
R33
R34
R35
R40
R41
R42
R43
R44
R51
R52
R53
R50
R60
R70R71
R72
R80
R81
R82
R83
R84
R6
NADPH
Glucose-6-P
GA-3-PPG
1,2-PDO_extR85
ATP
dhaKR7
fbp
gpi
fba
fpefpiA
tkt
tkt
tkt
Figure 4: Central metabolic network of glycerol in wild type E.coli. The dashed arrows repre-sent the particular pathways in anaerobic conditions. Reversible reactions are represented by a double-headed arrow. Key genes associated with the pathway are included.
Then, the elementary mode analysis was carried out for studying the metabolism of glycerol in E.coli by using METATOOL 5.1 (http://pinguin.biologie.unijena.de/bioinformatik/networks/metatool/ metatool5.1/metatool5.1.html) (Kamp & Schuster, 2006). Metabolic pathway analysis resulted in tens to
hundreds of elementary flux modes for each situation investigated. The fluxes were calculated as relative molar values normalized to the glycerol uptake rate and were defined as mol/mol (glycerol).
3.3 Elementary Mode Analysis of Glycerol Metabolism under Aerobic Condition
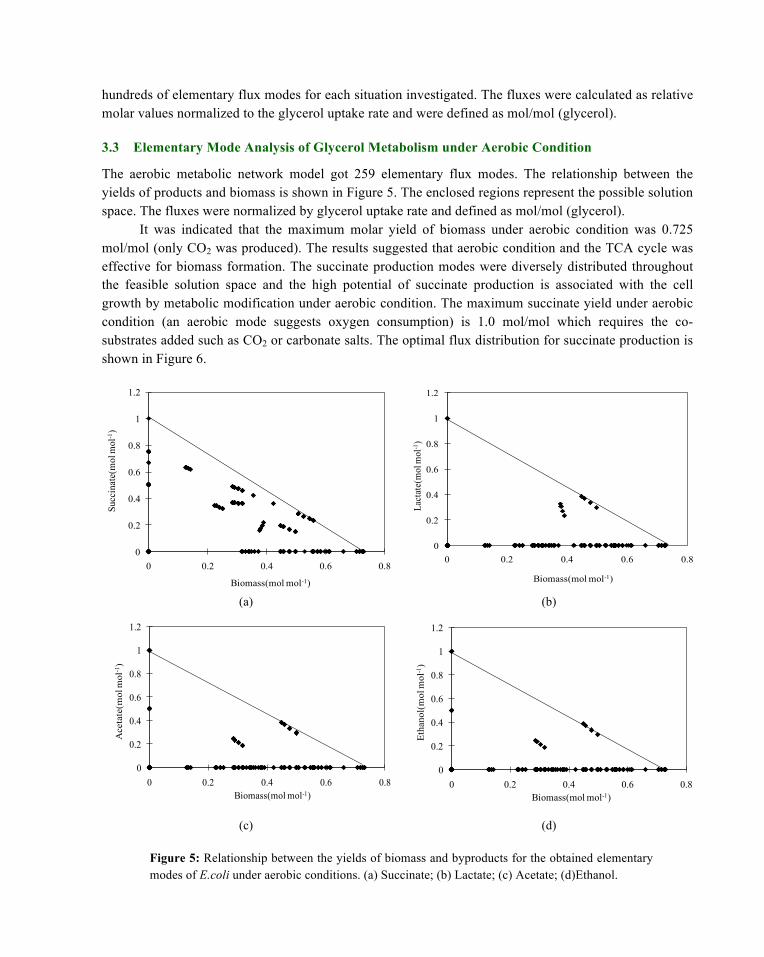
The aerobic metabolic network model got 259 elementary flux modes. The relationship between the yields of products and biomass is shown in Figure 5. The enclosed regions represent the possible solution space. The fluxes were normalized by glycerol uptake rate and defined as mol/mol (glycerol).
It was indicated that the maximum molar yield of biomass under aerobic condition was 0.725 mol/mol (only CO2 was produced). The results suggested that aerobic condition and the TCA cycle was effective for biomass formation. The succinate production modes were diversely distributed throughout the feasible solution space and the high potential of succinate production is associated with the cell growth by metabolic modification under aerobic condition. The maximum succinate yield under aerobic condition (an aerobic mode suggests oxygen consumption) is 1.0 mol/mol which requires the co-substrates added such as CO2 or carbonate salts. The optimal flux distribution for succinate production is shown in Figure 6.
(a)
(b)
(c)
(d)
Figure 5: Relationship between the yields of biomass and byproducts for the obtained elementary modes of E.coli under aerobic conditions. (a) Succinate; (b) Lactate; (c) Acetate; (d)Ethanol.
0
0.2
0.4
0.6
0.8
1
1.2
0 0.2 0.4 0.6 0.8
Succinate(molmol-1)
Biomass(molmol-1)
0
0.2
0.4
0.6
0.8
1
1.2
0 0.2 0.4 0.6 0.8
Lactate(molmol-1)
Biomass(molmol-1)
0
0.2
0.4
0.6
0.8
1
1.2
0 0.2 0.4 0.6 0.8
Acetate(molmol-1)
Biomass(molmol-1)
0
0.2
0.4
0.6
0.8
1
1.2
0 0.2 0.4 0.6 0.8
Ethanol(molmol-1)
Biomass(molmol-1)
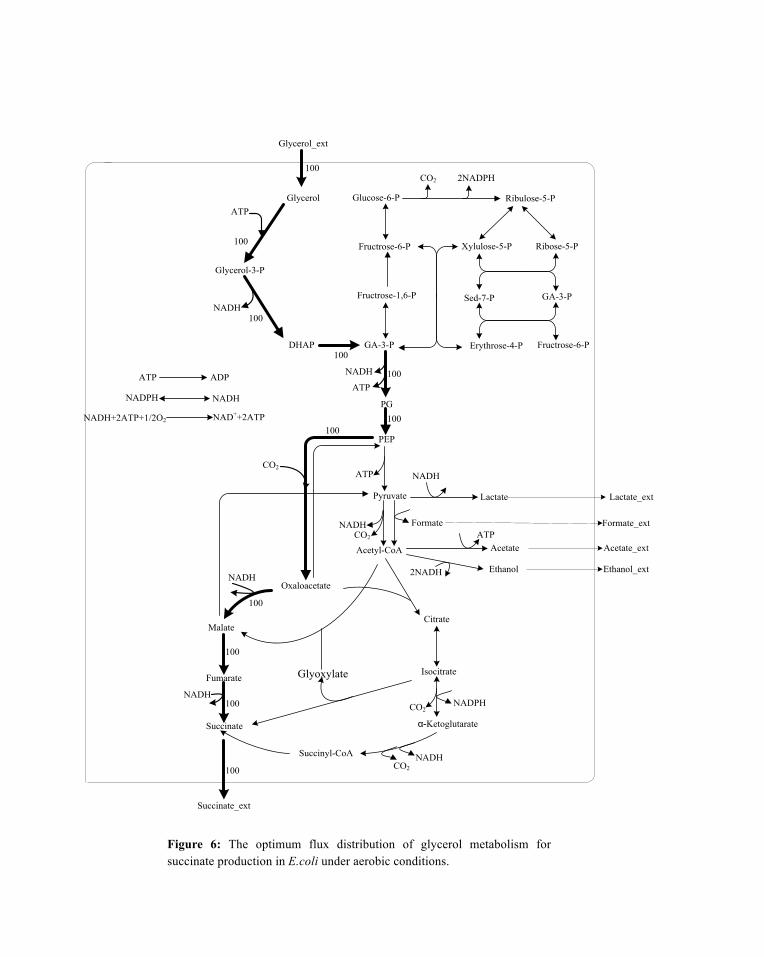
Figure 6: The optimum flux distribution of glycerol metabolism for succinate production in E.coli under aerobic conditions.
Glycerol
GA-3-P
Fructrose-6-P
Glucose-6-P
Ribose-5-P
Sed-7-P
Erythrose-4-P
2NADPHCO2
NADH
PG
PEP
ATP
Pyruvate
Oxaloacetate
CO2
Acetyl-CoA
Formate
Ethanol
AcetateATP
Lactate
DHAP
Ribulose-5-P
Xylulose-5-P
Glycerol-3-P
Fructrose-6-P
Fructrose-1,6-P
GA-3-P
Glycerol_ext
ATP
NADH
ATP
NADHCO2
2NADH
Citrate
Isocitrate
α-Ketoglutarate
Succinyl-CoA
Succinate
Fumarate
Malate
Glyoxylate
NADPHCO2
NADHCO2
NADH
NADH
NADH+2ATP+1/2O2 NAD++2ATP
ATP ADP
NADHNADPH
Lactate_ext
Succinate_ext
Formate_ext
Acetate_ext
Ethanol_ext
100
100
100
100
100
100100
100
100
100
100
NADH
Under the optimal flux distribution mode, PEP was totally carboxylated into oxaloacetate by PEP
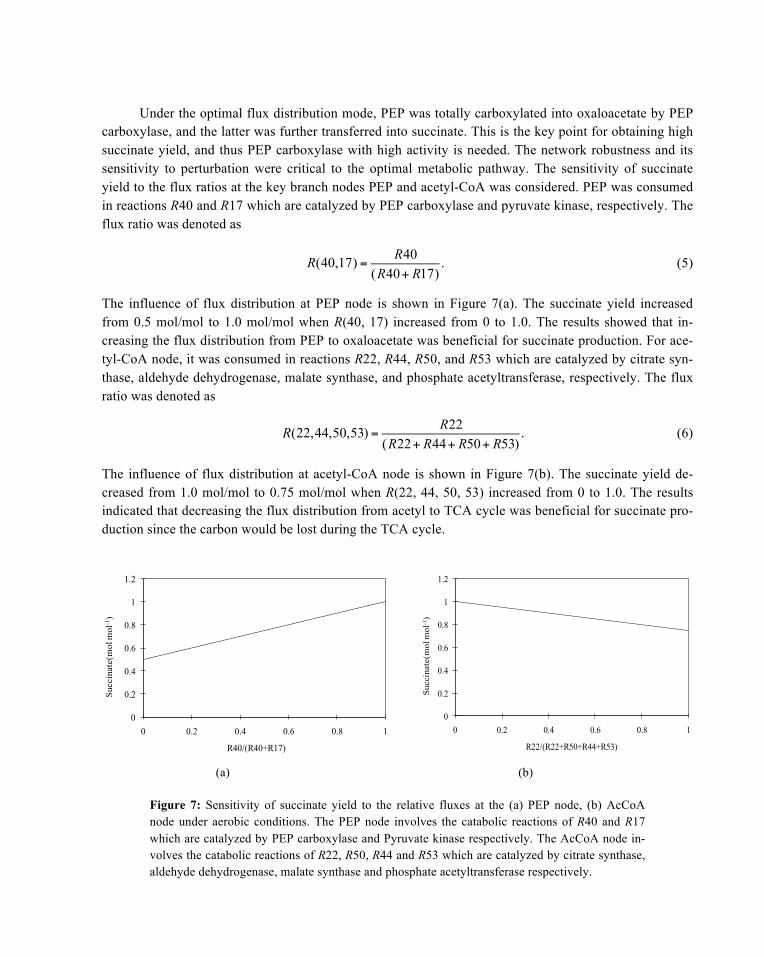
carboxylase, and the latter was further transferred into succinate. This is the key point for obtaining high succinate yield, and thus PEP carboxylase with high activity is needed. The network robustness and its sensitivity to perturbation were critical to the optimal metabolic pathway. The sensitivity of succinate yield to the flux ratios at the key branch nodes PEP and acetyl-CoA was considered. PEP was consumed in reactions R40 and R17 which are catalyzed by PEP carboxylase and pyruvate kinase, respectively. The flux ratio was denoted as
R(40,17) = R40
(R40+ R17).
(5)
The influence of flux distribution at PEP node is shown in Figure 7(a). The succinate yield increased from 0.5 mol/mol to 1.0 mol/mol when R(40, 17) increased from 0 to 1.0. The results showed that in-creasing the flux distribution from PEP to oxaloacetate was beneficial for succinate production. For ace-tyl-CoA node, it was consumed in reactions R22, R44, R50, and R53 which are catalyzed by citrate syn-thase, aldehyde dehydrogenase, malate synthase, and phosphate acetyltransferase, respectively. The flux ratio was denoted as
R(22,44,50,53) = R22
(R22+ R44+ R50+ R53).
(6)
The influence of flux distribution at acetyl-CoA node is shown in Figure 7(b). The succinate yield de-creased from 1.0 mol/mol to 0.75 mol/mol when R(22, 44, 50, 53) increased from 0 to 1.0. The results indicated that decreasing the flux distribution from acetyl to TCA cycle was beneficial for succinate pro-duction since the carbon would be lost during the TCA cycle.
(a)
(b)
Figure 7: Sensitivity of succinate yield to the relative fluxes at the (a) PEP node, (b) AcCoA node under aerobic conditions. The PEP node involves the catabolic reactions of R40 and R17 which are catalyzed by PEP carboxylase and Pyruvate kinase respectively. The AcCoA node in-volves the catabolic reactions of R22, R50, R44 and R53 which are catalyzed by citrate synthase, aldehyde dehydrogenase, malate synthase and phosphate acetyltransferase respectively.
0
0.2
0.4
0.6
0.8
1
1.2
0 0.2 0.4 0.6 0.8 1
Succinate(molmol-1)
R40/(R40+R17)
0
0.2
0.4
0.6
0.8
1
1.2
0 0.2 0.4 0.6 0.8 1
Succinate(molmol-1)
R22/(R22+R50+R44+R53)
3.4 Elementary Mode Analysis of Glycerol Metabolism under Anaerobic Condition
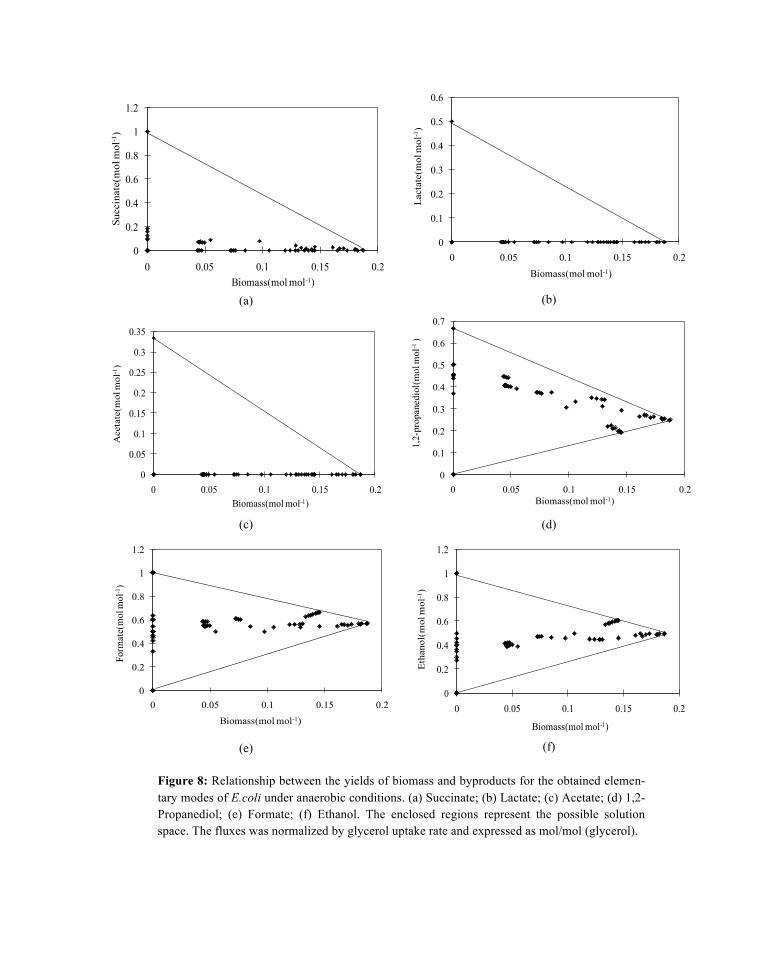
55 elementary flux modes were obtained under anaerobic condition. The relationship between the yields of products and biomass was shown in Figure 8. The production of 1,2-propanediol, ethanol and formate was necessary for the biomass synthesis because the cell growth was always associated with the produc-tion of 1,2-propandediol, ethanol and formate.
The maximum molar yield of biomass under anaerobic condition is 0.187 mol/mol with the re-spective yields of 1,2-propanediol, ethanol and formate were 0.248 mol/mol, 0.495 mol/mol, 0.57 mol/mol. Under this condition, no succinate, acetate and lactate were produced. The biomass synthesis process consumes ATP and produces reducing equivalents (NADH). Both ATP and NAD need to be re-generated through the production of other byproducts (the biomass synthesis equation in Appendix A2).
The maximum succinate yield under anaerobic condition is 1.0 mol/mol when CO2 or carbonate salts are added as co-substrates and the optimal flux distribution for succinate production was shown in Figure 9.
In this case, there were no production of biomass and other byproducts. The key points for this mode were that the phosphorylation of DHA was only catalyzed by ATP-dependent DHA kinase and PEP was totally carboxylated into oxaloacetate by PEP carboxylase and the latter was further transferred into succinate. This required a very high activity of ATP-dependent DHA kinase and PEP carboxylase. However, it was reported that the PEP-dependent DHA kinase plays the main role in E.coli which dra-matically reduced the yield of succinate. With single PEP-dependent DHA kinase function, there will be no succinate production (Murarkaet al. 2008). Thus the PEP-dependent DHA kinase is the bottleneck of succinate production under anaerobic condition.
Comparing the results of elementary flux mode analysis above, the aerobic condition seemed to be more favorable for succinate production although the maximum succinate yields were the same (1.0mol/mol) under both anaerobic and aerobic conditions.Under anaerobic conditions, the cell grows slowly and the cell growth is associated with the 1,2-propanediol, ethanol and formateproduction. That inhibitsthe practical application of succinate production from glycerol(Trinh and Srienc, 2009).
3.5 The strategy for enhancing succinate production based on elementary flux analysis
The maximum succinate yields were 1.0 mol/mol under aerobic condition from the above results of ele-mentary flux mode analysis. The possible design for the improving succinate producer to enhance the butanol yield could be overexpressing the PEP carboxylase or expressing pyruvate carboxylase. Knock-ing down of the isocitratedehydrogenase gene (icd) also would enhance the succinate production because the flux flowed from isocitrate to alpha-ketoglutarate and succinyl-CoA would result in the carbon lost. Since acetate is the main byproduct under aerobic condition (Lina et al., 2005), knocking out the py-ruvate oxidase gene (poxB) and phosphate acetyltransferase gene (pta) also is expected to increase the succinate yield.
Under anaerobic condition, overexpressing the PEP carboxylase and substitution of PEP-dependent DHA kinase into ATP-dependent DHA kinase would be prior consideration. An alternative choice is to express the heterogeneous pyruvate carboxylase in E.coli. The overexpression of pyruvate carboxylase could redistribute the flux of pyruvate into oxaloacetate for succinate production. The opti-mal flux distribution for succinate production in such case could also reach 1.0 mol/mol.
(a)
(b)
(c)
(d)
(e)
(f)
Figure 8: Relationship between the yields of biomass and byproducts for the obtained elemen-tary modes of E.coli under anaerobic conditions. (a) Succinate; (b) Lactate; (c) Acetate; (d) 1,2-Propanediol; (e) Formate; (f) Ethanol. The enclosed regions represent the possible solution space. The fluxes was normalized by glycerol uptake rate and expressed as mol/mol (glycerol).
0
0.2
0.4
0.6
0.8
1
1.2
0 0.05 0.1 0.15 0.2
Succinate(molmol-1)
Biomass(molmol-1)
0
0.1
0.2
0.3
0.4
0.5
0.6
0 0.05 0.1 0.15 0.2
Lactate(molmol-1)
Biomass(molmol-1)
0
0.05
0.1
0.15
0.2
0.25
0.3
0.35
0 0.05 0.1 0.15 0.2
Acetate(molmol-1)
Biomass(molmol-1)
0
0.1
0.2
0.3
0.4
0.5
0.6
0.7
0 0.05 0.1 0.15 0.2
1,2-propanediol(molmol-1)
Biomass(molmol-1)
0
0.2
0.4
0.6
0.8
1
1.2
0 0.05 0.1 0.15 0.2
Formate(molmol-1)
Biomass(molmol-1)
0
0.2
0.4
0.6
0.8
1
1.2
0 0.05 0.1 0.15 0.2
Ethanol(molmol-1)
Biomass(molmol-1)
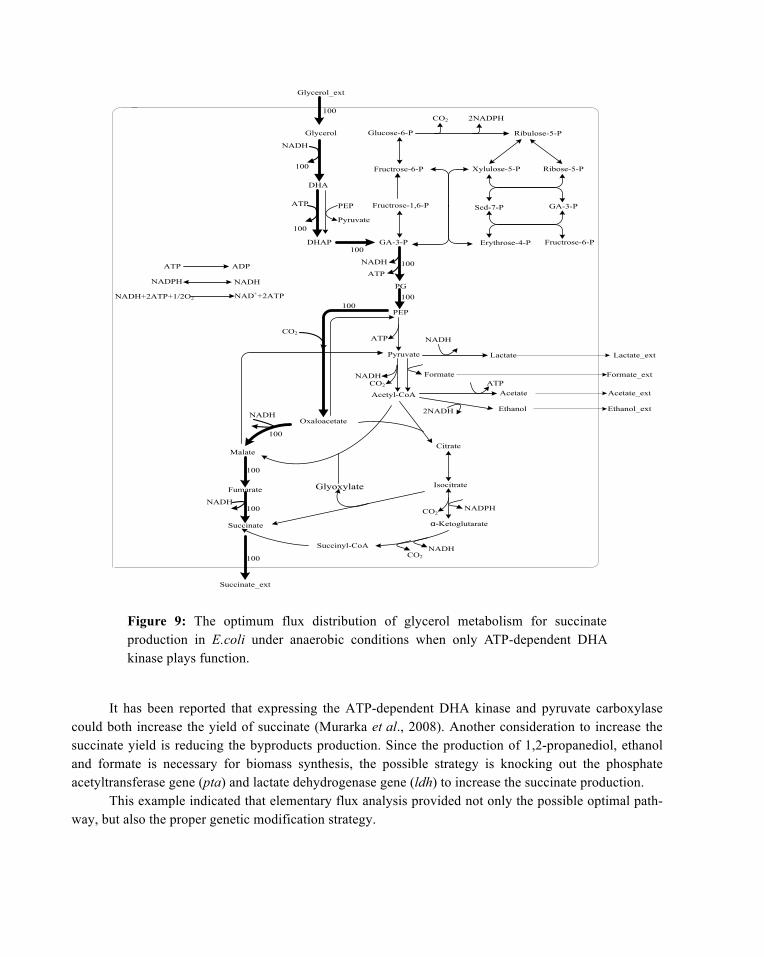
Figure 9: The optimum flux distribution of glycerol metabolism for succinate production in E.coli under anaerobic conditions when only ATP-dependent DHA kinase plays function.
It has been reported that expressing the ATP-dependent DHA kinase and pyruvate carboxylase could both increase the yield of succinate (Murarka et al., 2008). Another consideration to increase the succinate yield is reducing the byproducts production. Since the production of 1,2-propanediol, ethanol and formate is necessary for biomass synthesis, the possible strategy is knocking out the phosphate acetyltransferase gene (pta) and lactate dehydrogenase gene (ldh) to increase the succinate production.
This example indicated that elementary flux analysis provided not only the possible optimal path-way, but also the proper genetic modification strategy.
Glycerol
GA-3-P
Fructrose-6-P
Glucose-6-P
Ribose-5-P
Sed-7-P
Erythrose-4-P
2NADPHCO2
NADH
PG
PEP
ATP
Pyruvate
Oxaloacetate
CO2
Acetyl-CoA
Formate
Ethanol
AcetateATP
Lactate
DHAP
Ribulose-5-P
Xylulose-5-P
DHA
Fructrose-6-P
Fructrose-1,6-P
GA-3-P
Glycerol_ext
ATP
NADH
ATP
NADHCO2
2NADH
Citrate
Isocitrate
α-Ketoglutarate
Succinyl-CoA
Succinate
Fumarate
Malate
Glyoxylate
NADPHCO2
NADHCO2
NADH
NADH
NADH+2ATP+1/2O2 NAD++2ATP
ATP ADP
NADHNADPH
Lactate_ext
Succinate_ext
Formate_ext
Acetate_ext
Ethanol_ext
100
100
100
100
100
100100
100
100
100
100
NADH
PEP
Pyruvate
4 Other Applications of Metabolic Pathway Analysis in Systems Biolo-gy and Metabolic Engineering
4.1 Calculation of Optimal Conversion Yield for Guiding Metabolic Engineering
As discussed above, MPA can be used to determine the overall capacity ortheoretical maximum yield of a cellular system and study the effects of strain genetic modification. Knowledge of the theoretical max-imum yield allows estimating the potential economic efficiency of a process. Moreover, rational design can be obtained for the efficient production and genetic modification. Liao et al. (Liao et al., 1996) re-ported utilizing MPA for the development of high-efficiency producer of aromatic amino acids for the first time. By examining all of the optimal and suboptimal flux distributions and elementary modes di-recting carbon flow to the pathways for targeted metabolites, an E. coli strain that channeled substrates to the aromatic pathway at theoretical yields have been constructed successfully. Recently, elementary flux mode analysis also has been used for genome scale metabolic studies dealing with, for example, the ra-tional design of methionine production in E. coli and C. glutamicum (Krömer et al., 2006), and the pro-duction of polyhydroxybutanoate in yeast (Carlson et al., 2002).
It should be mentioned that there are other approaches which could also be utilized to calculate theoretical maximum yield, such as flux balance analysis. However, these methods are often based on different sets of constraints for getting the optimal solution under a given condition. MPA, however, can predict all of the possible solution space and give correlation of different fluxes variants. This significant-ly enlarges the application scope of MPA.
4.2 Evaluation of the Constructed Network from Genomic Data
As mentioned above, the results of MPA is significantly dependent on the initially constructed metabolic network. Thus it is important to have confidence in the functional assignments of the genome. Any errors exist in this functional assignment or annotation of genes would change the structure metabolic network and result in different sets of elementary flux pathways. On the other hand, the results of pathway analy-sis can be used to evaluate the genome annotation of an organism. For example, if the pathway analysis shows that the organism is unable to synthesize an experimentally proved molecule, and then a functional assignment maybe concluded being missing.
5 Concluding Remarks
In this chapter, the basic principles of metabolic pathway analysis are introduced. The differences be-tween extreme pathway and elementary flux mode are compared. With the increase of genome data and reconstructed metabolic network, metabolic pathway analysis would have more applications for explor-ing the inherent properties of metabolic systems, helping us for further understanding of the cellular be-havior and designing more efficient cell factories. The scaling up of elementary flux mode analysis in genome scale would be the future directions for metabolic pathway analysis.
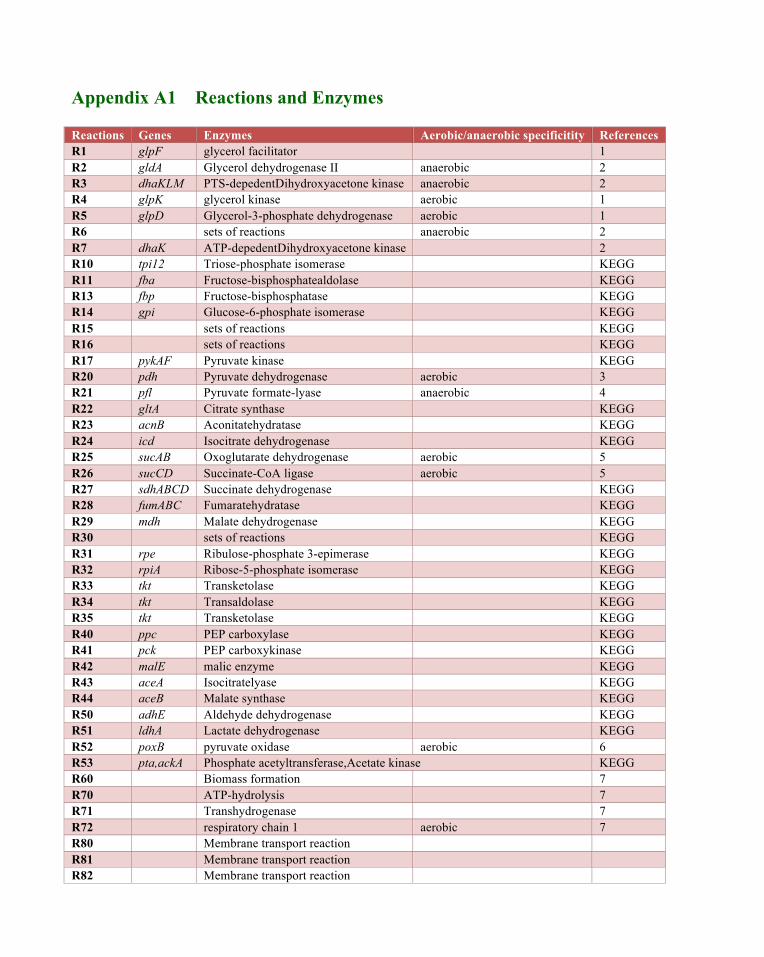
Appendix A1 Reactions and Enzymes
Reactions Genes Enzymes Aerobic/anaerobic specificitity References R1 glpF glycerol facilitator 1 R2 gldA Glycerol dehydrogenase II anaerobic 2 R3 dhaKLM PTS-depedentDihydroxyacetone kinase anaerobic 2 R4 glpK glycerol kinase aerobic 1 R5 glpD Glycerol-3-phosphate dehydrogenase aerobic 1 R6 sets of reactions anaerobic 2 R7 dhaK ATP-depedentDihydroxyacetone kinase 2 R10 tpi12 Triose-phosphate isomerase KEGG R11 fba Fructose-bisphosphatealdolase KEGG R13 fbp Fructose-bisphosphatase KEGG R14 gpi Glucose-6-phosphate isomerase KEGG R15 sets of reactions KEGG R16 sets of reactions KEGG R17 pykAF Pyruvate kinase KEGG R20 pdh Pyruvate dehydrogenase aerobic 3 R21 pfl Pyruvate formate-lyase anaerobic 4 R22 gltA Citrate synthase KEGG R23 acnB Aconitatehydratase KEGG R24 icd Isocitrate dehydrogenase KEGG R25 sucAB Oxoglutarate dehydrogenase aerobic 5 R26 sucCD Succinate-CoA ligase aerobic 5 R27 sdhABCD Succinate dehydrogenase KEGG R28 fumABC Fumaratehydratase KEGG R29 mdh Malate dehydrogenase KEGG R30 sets of reactions KEGG R31 rpe Ribulose-phosphate 3-epimerase KEGG R32 rpiA Ribose-5-phosphate isomerase KEGG R33 tkt Transketolase KEGG R34 tkt Transaldolase KEGG R35 tkt Transketolase KEGG R40 ppc PEP carboxylase KEGG R41 pck PEP carboxykinase KEGG R42 malE malic enzyme KEGG R43 aceA Isocitratelyase KEGG R44 aceB Malate synthase KEGG R50 adhE Aldehyde dehydrogenase KEGG R51 ldhA Lactate dehydrogenase KEGG R52 poxB pyruvate oxidase aerobic 6 R53 pta,ackA Phosphate acetyltransferase,Acetate kinase KEGG R60 Biomass formation 7 R70 ATP-hydrolysis 7 R71 Transhydrogenase 7 R72 respiratory chain 1 aerobic 7 R80 Membrane transport reaction R81 Membrane transport reaction R82 Membrane transport reaction
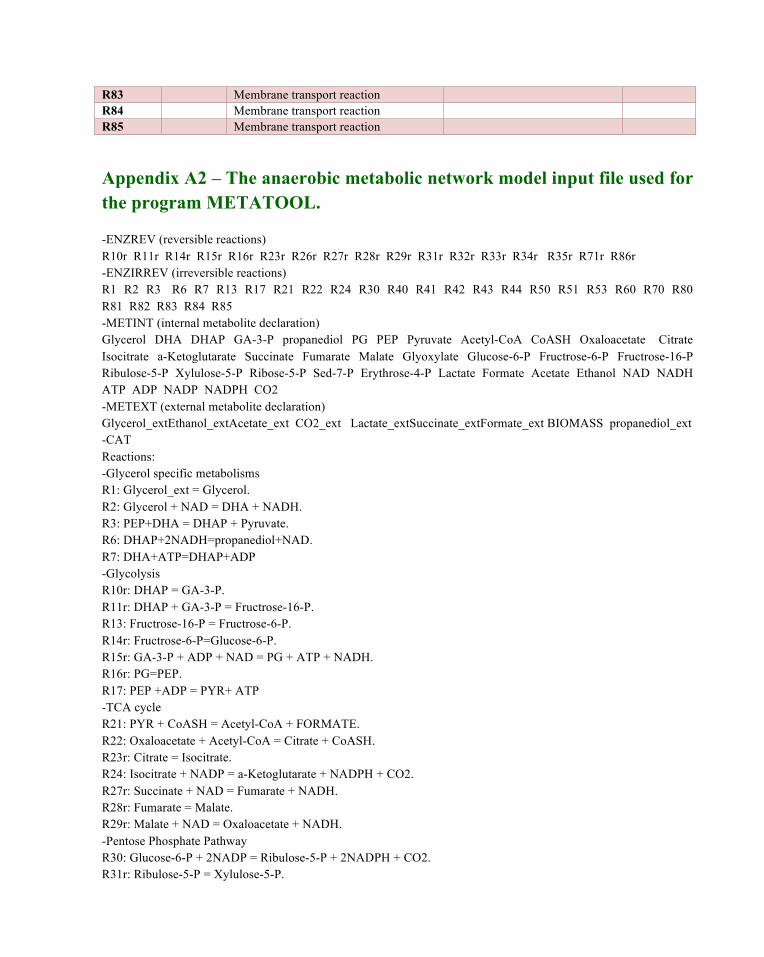
R83 Membrane transport reaction R84 Membrane transport reaction R85 Membrane transport reaction
Appendix A2 – The anaerobic metabolic network model input file used for the program METATOOL.
-ENZREV (reversible reactions) R10r R11r R14r R15r R16r R23r R26r R27r R28r R29r R31r R32r R33r R34r R35r R71r R86r -ENZIRREV (irreversible reactions) R1 R2 R3 R6 R7 R13 R17 R21 R22 R24 R30 R40 R41 R42 R43 R44 R50 R51 R53 R60 R70 R80 R81 R82 R83 R84 R85 -METINT (internal metabolite declaration) Glycerol DHA DHAP GA-3-P propanediol PG PEP Pyruvate Acetyl-CoA CoASH Oxaloacetate Citrate Isocitrate a-Ketoglutarate Succinate Fumarate Malate Glyoxylate Glucose-6-P Fructrose-6-P Fructrose-16-P Ribulose-5-P Xylulose-5-P Ribose-5-P Sed-7-P Erythrose-4-P Lactate Formate Acetate Ethanol NAD NADH ATP ADP NADP NADPH CO2 -METEXT (external metabolite declaration) Glycerol_extEthanol_extAcetate_ext CO2_ext Lactate_extSuccinate_extFormate_ext BIOMASS propanediol_ext -CAT Reactions: -Glycerol specific metabolisms R1: Glycerol_ext = Glycerol. R2: Glycerol + NAD = DHA + NADH. R3: PEP+DHA = DHAP + Pyruvate. R6: DHAP+2NADH=propanediol+NAD. R7: DHA+ATP=DHAP+ADP -Glycolysis R10r: DHAP = GA-3-P. R11r: DHAP + GA-3-P = Fructrose-16-P. R13: Fructrose-16-P = Fructrose-6-P. R14r: Fructrose-6-P=Glucose-6-P. R15r: GA-3-P + ADP + NAD = PG + ATP + NADH. R16r: PG=PEP. R17: PEP +ADP = PYR+ ATP -TCA cycle R21: PYR + CoASH = Acetyl-CoA + FORMATE. R22: Oxaloacetate + Acetyl-CoA = Citrate + CoASH. R23r: Citrate = Isocitrate. R24: Isocitrate + NADP = a-Ketoglutarate + NADPH + CO2. R27r: Succinate + NAD = Fumarate + NADH. R28r: Fumarate = Malate. R29r: Malate + NAD = Oxaloacetate + NADH. -Pentose Phosphate Pathway R30: Glucose-6-P + 2NADP = Ribulose-5-P + 2NADPH + CO2. R31r: Ribulose-5-P = Xylulose-5-P.
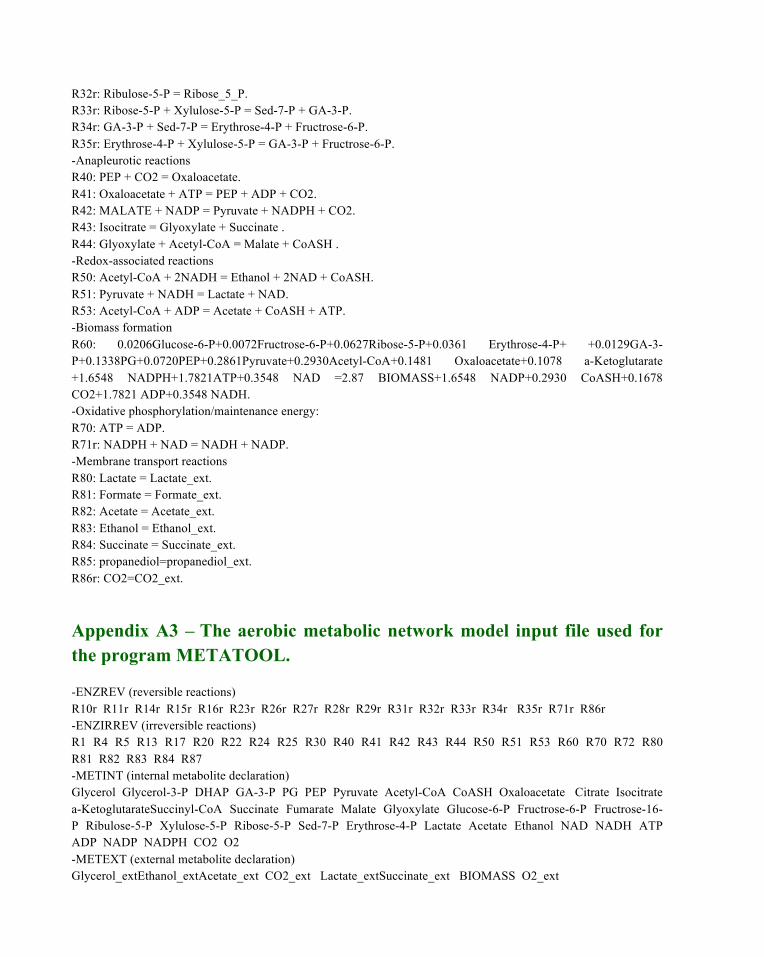
R32r: Ribulose-5-P = Ribose_5_P. R33r: Ribose-5-P + Xylulose-5-P = Sed-7-P + GA-3-P. R34r: GA-3-P + Sed-7-P = Erythrose-4-P + Fructrose-6-P. R35r: Erythrose-4-P + Xylulose-5-P = GA-3-P + Fructrose-6-P. -Anapleurotic reactions R40: PEP + CO2 = Oxaloacetate. R41: Oxaloacetate + ATP = PEP + ADP + CO2. R42: MALATE + NADP = Pyruvate + NADPH + CO2. R43: Isocitrate = Glyoxylate + Succinate . R44: Glyoxylate + Acetyl-CoA = Malate + CoASH . -Redox-associated reactions R50: Acetyl-CoA + 2NADH = Ethanol + 2NAD + CoASH. R51: Pyruvate + NADH = Lactate + NAD. R53: Acetyl-CoA + ADP = Acetate + CoASH + ATP. -Biomass formation R60: 0.0206Glucose-6-P+0.0072Fructrose-6-P+0.0627Ribose-5-P+0.0361 Erythrose-4-P+ +0.0129GA-3-P+0.1338PG+0.0720PEP+0.2861Pyruvate+0.2930Acetyl-CoA+0.1481 Oxaloacetate+0.1078 a-Ketoglutarate +1.6548 NADPH+1.7821ATP+0.3548 NAD =2.87 BIOMASS+1.6548 NADP+0.2930 CoASH+0.1678 CO2+1.7821 ADP+0.3548 NADH. -Oxidative phosphorylation/maintenance energy: R70: ATP = ADP. R71r: NADPH + NAD = NADH + NADP. -Membrane transport reactions R80: Lactate = Lactate_ext. R81: Formate = Formate_ext. R82: Acetate = Acetate_ext. R83: Ethanol = Ethanol_ext. R84: Succinate = Succinate_ext. R85: propanediol=propanediol_ext. R86r: CO2=CO2_ext.
Appendix A3 – The aerobic metabolic network model input file used for the program METATOOL.
-ENZREV (reversible reactions) R10r R11r R14r R15r R16r R23r R26r R27r R28r R29r R31r R32r R33r R34r R35r R71r R86r -ENZIRREV (irreversible reactions) R1 R4 R5 R13 R17 R20 R22 R24 R25 R30 R40 R41 R42 R43 R44 R50 R51 R53 R60 R70 R72 R80 R81 R82 R83 R84 R87 -METINT (internal metabolite declaration) Glycerol Glycerol-3-P DHAP GA-3-P PG PEP Pyruvate Acetyl-CoA CoASH Oxaloacetate Citrate Isocitrate a-KetoglutarateSuccinyl-CoA Succinate Fumarate Malate Glyoxylate Glucose-6-P Fructrose-6-P Fructrose-16-P Ribulose-5-P Xylulose-5-P Ribose-5-P Sed-7-P Erythrose-4-P Lactate Acetate Ethanol NAD NADH ATP ADP NADP NADPH CO2 O2 -METEXT (external metabolite declaration) Glycerol_extEthanol_extAcetate_ext CO2_ext Lactate_extSuccinate_ext BIOMASS O2_ext
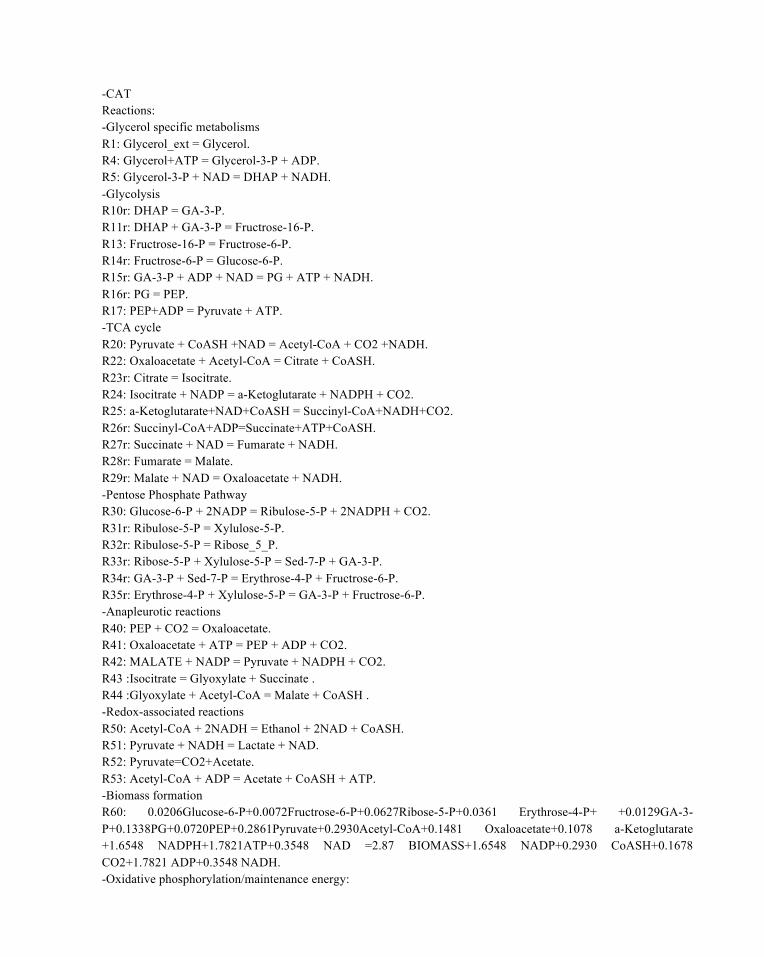
-CAT Reactions: -Glycerol specific metabolisms R1: Glycerol_ext = Glycerol. R4: Glycerol+ATP = Glycerol-3-P + ADP. R5: Glycerol-3-P + NAD = DHAP + NADH. -Glycolysis R10r: DHAP = GA-3-P. R11r: DHAP + GA-3-P = Fructrose-16-P. R13: Fructrose-16-P = Fructrose-6-P. R14r: Fructrose-6-P = Glucose-6-P. R15r: GA-3-P + ADP + NAD = PG + ATP + NADH. R16r: PG = PEP. R17: PEP+ADP = Pyruvate + ATP. -TCA cycle R20: Pyruvate + CoASH +NAD = Acetyl-CoA + CO2 +NADH. R22: Oxaloacetate + Acetyl-CoA = Citrate + CoASH. R23r: Citrate = Isocitrate. R24: Isocitrate + NADP = a-Ketoglutarate + NADPH + CO2. R25: a-Ketoglutarate+NAD+CoASH = Succinyl-CoA+NADH+CO2. R26r: Succinyl-CoA+ADP=Succinate+ATP+CoASH. R27r: Succinate + NAD = Fumarate + NADH. R28r: Fumarate = Malate. R29r: Malate + NAD = Oxaloacetate + NADH. -Pentose Phosphate Pathway R30: Glucose-6-P + 2NADP = Ribulose-5-P + 2NADPH + CO2. R31r: Ribulose-5-P = Xylulose-5-P. R32r: Ribulose-5-P = Ribose_5_P. R33r: Ribose-5-P + Xylulose-5-P = Sed-7-P + GA-3-P. R34r: GA-3-P + Sed-7-P = Erythrose-4-P + Fructrose-6-P. R35r: Erythrose-4-P + Xylulose-5-P = GA-3-P + Fructrose-6-P. -Anapleurotic reactions R40: PEP + CO2 = Oxaloacetate. R41: Oxaloacetate + ATP = PEP + ADP + CO2. R42: MALATE + NADP = Pyruvate + NADPH + CO2. R43 :Isocitrate = Glyoxylate + Succinate . R44 :Glyoxylate + Acetyl-CoA = Malate + CoASH . -Redox-associated reactions R50: Acetyl-CoA + 2NADH = Ethanol + 2NAD + CoASH. R51: Pyruvate + NADH = Lactate + NAD. R52: Pyruvate=CO2+Acetate. R53: Acetyl-CoA + ADP = Acetate + CoASH + ATP. -Biomass formation R60: 0.0206Glucose-6-P+0.0072Fructrose-6-P+0.0627Ribose-5-P+0.0361 Erythrose-4-P+ +0.0129GA-3-P+0.1338PG+0.0720PEP+0.2861Pyruvate+0.2930Acetyl-CoA+0.1481 Oxaloacetate+0.1078 a-Ketoglutarate +1.6548 NADPH+1.7821ATP+0.3548 NAD =2.87 BIOMASS+1.6548 NADP+0.2930 CoASH+0.1678 CO2+1.7821 ADP+0.3548 NADH. -Oxidative phosphorylation/maintenance energy:
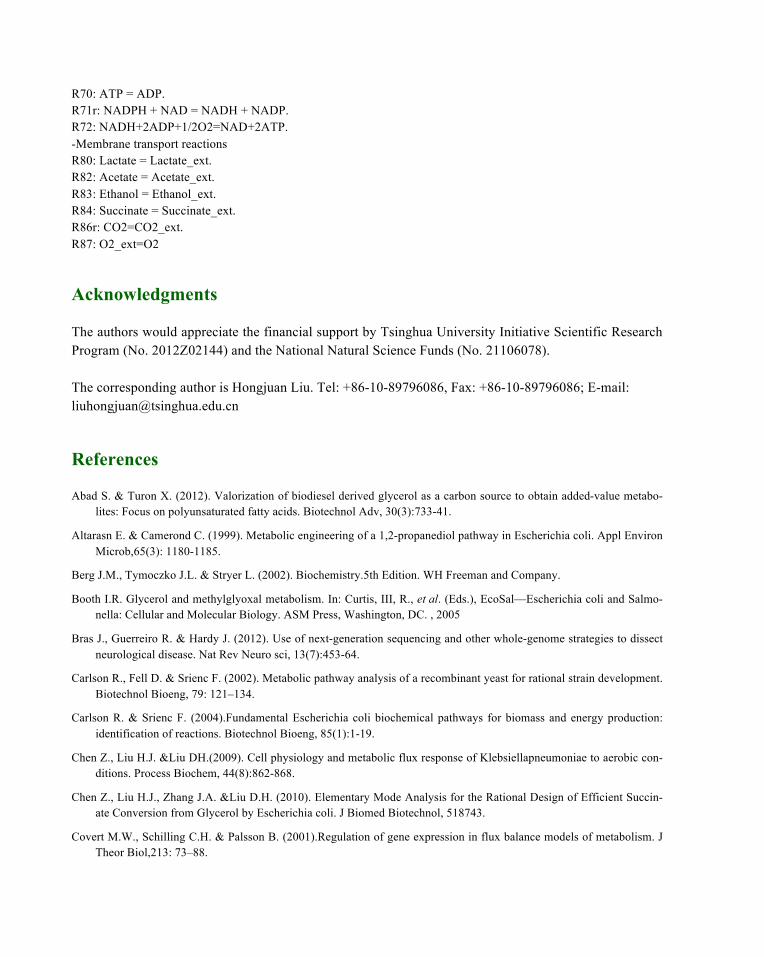
R70: ATP = ADP. R71r: NADPH + NAD = NADH + NADP. R72: NADH+2ADP+1/2O2=NAD+2ATP. -Membrane transport reactions R80: Lactate = Lactate_ext. R82: Acetate = Acetate_ext. R83: Ethanol = Ethanol_ext. R84: Succinate = Succinate_ext. R86r: CO2=CO2_ext. R87: O2_ext=O2
Acknowledgments
The authors would appreciate the financial support by Tsinghua University Initiative Scientific Research Program (No. 2012Z02144) and the National Natural Science Funds (No. 21106078). The corresponding author is Hongjuan Liu. Tel: +86-10-89796086, Fax: +86-10-89796086; E-mail: [email protected]
References
Abad S. & Turon X. (2012). Valorization of biodiesel derived glycerol as a carbon source to obtain added-value metabo-lites: Focus on polyunsaturated fatty acids. Biotechnol Adv, 30(3):733-41.
Altarasn E. & Camerond C. (1999). Metabolic engineering of a 1,2-propanediol pathway in Escherichia coli. Appl Environ Microb,65(3): 1180-1185.
Berg J.M., Tymoczko J.L. & Stryer L. (2002). Biochemistry.5th Edition. WH Freeman and Company.
Booth I.R. Glycerol and methylglyoxal metabolism. In: Curtis, III, R., et al. (Eds.), EcoSal—Escherichia coli and Salmo-nella: Cellular and Molecular Biology. ASM Press, Washington, DC. , 2005
Bras J., Guerreiro R. & Hardy J. (2012). Use of next-generation sequencing and other whole-genome strategies to dissect neurological disease. Nat Rev Neuro sci, 13(7):453-64.
Carlson R., Fell D. & Srienc F. (2002). Metabolic pathway analysis of a recombinant yeast for rational strain development. Biotechnol Bioeng, 79: 121–134.
Carlson R. & Srienc F. (2004).Fundamental Escherichia coli biochemical pathways for biomass and energy production: identification of reactions. Biotechnol Bioeng, 85(1):1-19.
Chen Z., Liu H.J. &Liu DH.(2009). Cell physiology and metabolic flux response of Klebsiellapneumoniae to aerobic con-ditions. Process Biochem, 44(8):862-868.
Chen Z., Liu H.J., Zhang J.A. &Liu D.H. (2010). Elementary Mode Analysis for the Rational Design of Efficient Succin-ate Conversion from Glycerol by Escherichia coli. J Biomed Biotechnol, 518743.
Covert M.W., Schilling C.H. & Palsson B. (2001).Regulation of gene expression in flux balance models of metabolism. J Theor Biol,213: 73–88.
Dharmadi Y., Murarka A. & Gonzalez R. (2006).Anaerobic fermentation of glycerol by Escherichia coli: a new platform for metabolic engineering. Biotechnol Bioeng,94(5):821-829.
Edwards J.S. & Palsson B.O. (2000). Metabolic flux balance analysis and the in silico analysis of Escherichia coli K-12 gene deletions. BMC Bioinformatics,1:1.
Freedberg W.B. & Lin E.C.C. (1973). Three kinds of controls affecting the expression of the glpregulon in Escherichia coli. J Bacteriol, 115(3):816-823.
Hasona A., Kim Y., Healy F.G., Ingram L.O. & Shanmugam K.T. (2004). Pyruvate formatelyase and acetate kinase are essential for anaerobic growth of Escherichia coli on xylose. J Bacteriol, 186(22):7593-7600.
Jol S.J., Kümmel A., Terzer M., Stelling J. & Heinemann M. System-Level Insights into Yeast Metabolism by Thermody-namic Analysis of Elementary Flux Modes. PLoS Comput Biol. 2012,8(3): e1002415.
Kamp A.V. &Schuster S. (2006). Metatool 5.0: fast and flexible elementary modes analysis. Bioinformatics,22:1930-1931.
Kang Z., Du L., Kang J., Wang Y., Wang Q., Liang Q. & Qi Q. (2011). Production of succinate and polyhydroxyalkanoate from substrate mixture by metabolically engineered Escherichia coli. Bioresour Technol, 102(11):6600-6604.
Klamt S., Schuster S. & Gilles E.D. (2002). Calculability analysis in underdetermined metabolic networks illustrated by a model of the central metabolism in purple nonsulfur bacteria. Biotechnol Bioeng, 77: 734–751.
Klamt S., Stelling J., Ginkel M. & Gilles E.D. (2003). Flux Analyzer: exploring structure, pathways, and flux distributions in metabolic networks on interactive flux maps. Bioinformatics, 19:261-269.
Klamt S. & Stelling J. (2003).Two approaches for metabolic pathway analysis? Trends Biotechnol,21:64-69.
Kremling A., Jahreis K., Lengeler J.W.& Gilles E.D. (2000). The organization of metabolic reaction networks: a signal-oriented approach to cellular models. MetabEng, 2: 190–200.
Krömer J.O., Wittmann C., Schröder H. & Heinzle E. (2006). Metabolic pathway analysis for rational design of L-methionine production by Escherichia coli and Corynebacterium glutamicum. MetabEng, 8:353–369.
Kurata H., Zhao Q.Y., Okuda R.C. & Shimizu K. (2007). Integration of enzyme activities into metabolic flux distributions by elementary mode analysis. BMC Syst Biol, 1: 31.
Liao J.C., Hou S.Y. & Chao Y.P. (1996). Pathway analysis, engineering, and physiological considerations for redirecting central metabolism. Biotechnol Bioeng, 52: 129-140.
Lin H., Bennett G.N. &San K.Y. (2005). Metabolic engineering of aerobic succinate production systems in Escherichia coli to improve process productivity and achieve the maximum theoretical succinate yield. Metab Eng, 7(2):116-27.
Litsanov B., Brocker M. & Bott M.(2012a). Toward homosuccinate fermentation: metabolic engineering of Corynebacte-rium glutamicum for anaerobic production of succinate from glucose and formate. Appl Environ Microbiol, 78(9):3325-3337.
Litsanov B., Kabus A., Brocker M. & Bott M. (2012b). Efficient aerobic succinate production from glucose in minimal medium with Corynebacterium glutamicum. Microb Biotechnol, 5(1):116-28.
Litsanov B., Brocker M. & Bott M. (2012c). Glycerol as a substrate for aerobic succinate production in minimal medium with Corynebacterium glutamicum. M icrob Biotechnol, doi: 10.1111/j.1751-7915.
Liu H.J., Du W. & Liu D.H. (2007). Progress of the biodiesel and 1,3-Propanediol Integrated Production. Progr Chem, 19: 1185-1189.
Murarka A., Dharmadi Y., Yazdani S.S., Gonzalez R. (2008). Fermentative utilization of glycerol by Escherichia coli and its implications for the production of fuels and chemicals.Appl Environ Microb,74(4):1124-1135.
Ostrander E.A. & Beale H. (2012). Leading the way: finding genes for neurologic disease in dogs using genome-wide mRNA sequencing. BMC Genet, 13(1):56.
Papin J.A., Price N.D. & Palsson B.O. (2002). Extreme pathway lengths and reaction participation in genome-scale meta-bolic networks. Genome Res,12:1889–1900.
Papin J.A., Stelling J., Price N.D., Klamt S., Schuster S. & Palsson B.O. (2004). Comparison of network-based pathway analysis methods. Trends Biotechnol, 22:400-405.
Sauer U., Canonaco F., Heri S., Perrenoud A. & Fischer E. (2004). The soluble and membrane-bound transhydrogenas-esudha and pntab have divergent functions in nadph metabolism of E. coli. J Bio Chem,279(8):6613–6619.
Schilling C.H., Schuster S., Palsson B.O. & Heinrich R. (1999).Metabolic pathway analysis: basic concepts and scientific applications in the post-genomic era. Biotechnol Prog, 15:296-303.
Schuster S., Dandekar T. & Fell D.A. Detection of elementary flux modes in biochemical networks: a promising tool for pathway analysis and metabolic engineering. Trends Biotechnol. 1999,17:53-60.
Schuster S., Fell D.A. & Dandekar T. (2000). A general definition of metabolic pathways useful for systematic organiza-tion and analysis of complex metabolic networks. Nat. Biotechnol,18:326-332.
Stelling J., Klamt S., Bettenbrock K., Schuster S. & Gilles E.D. (2002). Metabolic network structure determines key as-pects of functionality and regulation. Nature, 420:190–193.
Sweet G., Gandor C., Voegele R., Wittekindt N., Beuerle J., Truniger V., Lin E.E.C. & Boos W. (1990). Glycerol facilita-tor of Escherichia coli: cloning of glpF and identification of the glpF product. J Bacteriol,172(1):424-430.
Trinh C.T. & Srienc F. (2009). Metabolic engineering of Escherichia coli for efficient conversion of glycerol into etha-nol.Appl Environ Microb, 75(21):6696-6705.
Vu T.T., Stolyar S.M., Pinchuk G.E., Hill E.A., Kucek L.A., Brown R.N., Lipton M.S., Osterman A., Fredrickson J.K., Konopka A.E., Beliaev A.S.& Reed J.L. (2012). Genome-Scale Modeling of Light-Driven Reductant Partitioning and Carbon Fluxes in Diazotrophic Unicellular Cyanobacterium Cyanothece sp. ATCC 51142. PLoS ComputBiol, 8(4): e1002460.
Wajid B. & Serpedin E. (2012). Review of general algorithmic features for genome assemblers for next generation se-quencers. Genomics Proteomics & Bioinfor, 10(2):58-73.
Wang J., Zhu J.F., Bennett G.N. & San K.Y. (2011). Succinate production from different carbon sources under anaerobic conditions by metabolic engineered Escherichia coli strains. Metab Eng, 13:328–335.
Wiechert., W. (2002). Modeling and simulation: tools for metabolic engineering. J Biotechnol, 94: 37–64.
Xu Y.Z., Liu H.J., Du W. & Liu D.H. (2009). Integrated production for biodiesel and 1,3-propanediol with lipase-catalyzed transesterification and fermentation. Biotechnol Lett,31(9):1335-1341.
Yang F., Hanna M.A. & Sun R. (2012). Value-added uses for crude glycerol--a byproduct of biodiesel produc-tion.Biotechnol Biofuels,14(5):13.
Yazdani S.S. & Gonzalez R. (2007). Anaerobic fermentation of glycerol: a path to economic viability for the biofuels in-dustry. CurrOpin Biol, 18 (3):213–219.
Zeikus J.G., Jain M.K. & Elankovan P. (1999). Biotechnology of succinic acid production and markets for derived indus-trial products. Appl Microbiol Biotechnol,51: 545-552.
Zhang Q.R. & Xiu Z.L. (2009). Metabolic pathway analysis of glycerol metabolism in Klebsiellapneumoniae incorporat-ing oxygen regulatory system. Biotechnol Progr,25(1):103-115.