Embed Size (px)
Citation preview
Metabolic Engineering of Cyanobacteria for Increased Product Formation
By
Adeola Oluyemisi Adebiyi
Thesis
Submitted to the Faculty of the
Graduate School of Vanderbilt University
in partial fulfillment of the requirements
for the degree of
MASTER OF SCIENCE
in
Chemical Engineering
August, 2015
Nashville, Tennessee
Approved:
Jamey D. Young, Ph.D.
Scott Guelcher, Ph.D.

ACKNOWLEDGEMENTS
I would first like to thank the Lord for bringing me to this city and university and for
allowing me to experience so much and to mature during my time here.
I would like to acknowledge my department and former and current department heads Peter
Pintauro and Kane Jennings for allowing me the opportunity to pursue a higher degree. I wish to
express my appreciation for and to my advisor Jamey Young for his guidance. Your breadth of
knowledge and continuous hunger for learning is inspiring. I recognize my lab mates, especially
Lara Jazmin, and our research assistant Irina Trenary for all of their help, and give special thanks
to my undergraduate student, Victoria Potter. Your enthusiasm and desire to help were invaluable.
I would like to recognize members of my thesis committee, Scott Guelcher and Clare
McCabe and Carl Johnson of Biological Sciences. I would like to further thank Dr. Johnson and
members of his lab, Drs. Tetsuya Mori, Yao Xu, and Peijun Ma, for all of their assistance and
expertise with cyanobacteria. Thank you, Dr. Johnson, for your inquisitive and frank nature.
Special thanks go to both my natural family and my Nashville family. Thank you all for
your support and continued encouragement throughout my endeavors. I would like to mention my
sister AdeDoyin Adebiyi for pretending to understand my research as well as Martha Wall, her
little ones, and Courtney A. Mitchell for their proofing help and constant support.
I end with acknowledgement of my funding sources: the U.S. Department of Education’s
Graduate Assistance in Areas of National Need award (P200A090323), Vanderbilt’s Provost
Graduate Fellowship, and for the project, the U.S. Department of Energy Award DE-SC008118.
And finally, Anchor Down.
iii
TABLE OF CONTENTS
Page
ACKNOWLEDGEMENTS ............................................................................................................ ii LIST OF TABLES ......................................................................................................................... iv LIST OF FIGURES ........................................................................................................................ v
Chapter
I. INTRODUCTION ....................................................................................................................... 1
II. LITERATURE REVIEW ........................................................................................................... 4
MFA in Cyanobacteria ............................................................................................................ 4
Optimization of Pyruvate-derived Products in Cyanobacteria ............................................. 14
III. SIMULATION STUDY OF METABOLIC FLUX ANALYSIS ........................................... 24
Introduction ........................................................................................................................... 24
Method .................................................................................................................................. 28 Results and Discussion ......................................................................................................... 30 Conclusion ............................................................................................................................ 34
IV. ENGINEERING OF CYANOBACTERIA FOR INCREASED ALDEHYDE ..................... 35
PRODUCTION
Introduction ........................................................................................................................... 35
Method .................................................................................................................................. 39 Results and Discussion ......................................................................................................... 42 Conclusions ........................................................................................................................... 46
V. CONCLUSION ........................................................................................................................ 48
Summary ............................................................................................................................... 48 Recommended Future Works................................................................................................ 49 Conclusion ............................................................................................................................ 50
Appendix
A. SUPPLEMENTAL DATA ...................................................................................................... 51
Minimal Data Set for INST-MFA ......................................................................................... 51 Light-dependent Growth Rate ............................................................................................... 53
B. PROTOCOLS........................................................................................................................... 56 REFERENCES ............................................................................................................................. 69
iv
LIST OF TABLES
Table Page
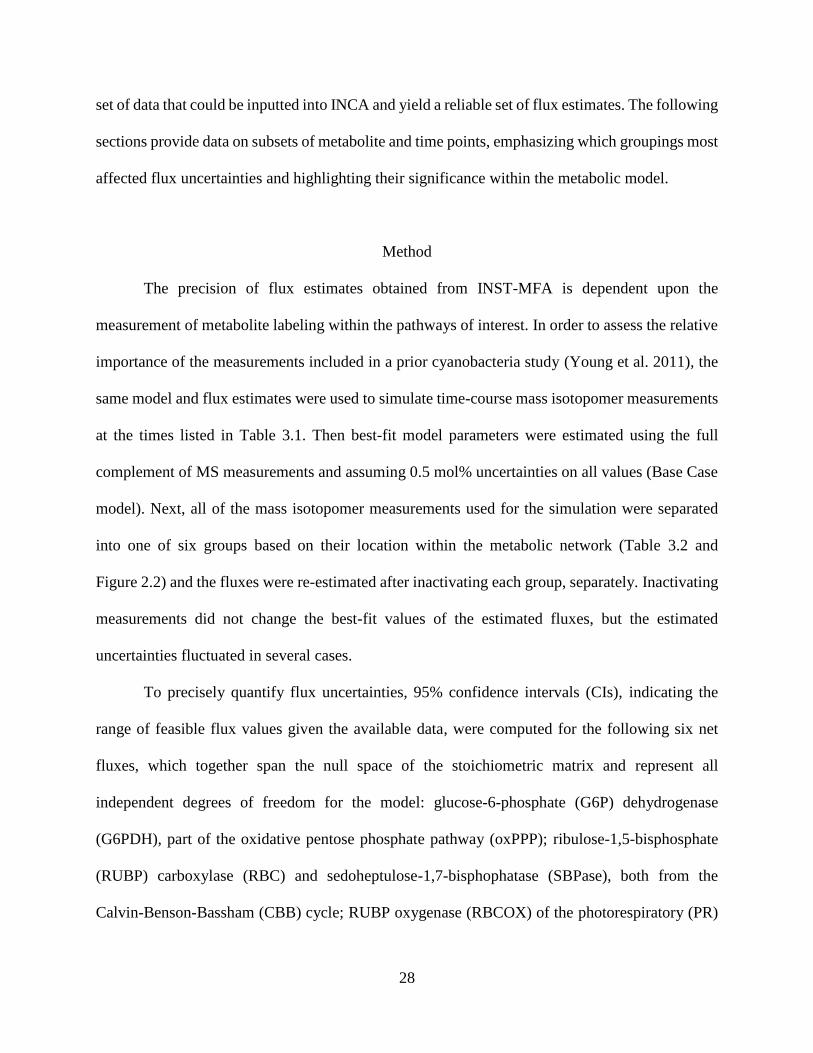
3.1 Simulated time points for mass isotopomer measurements. ....................................................29
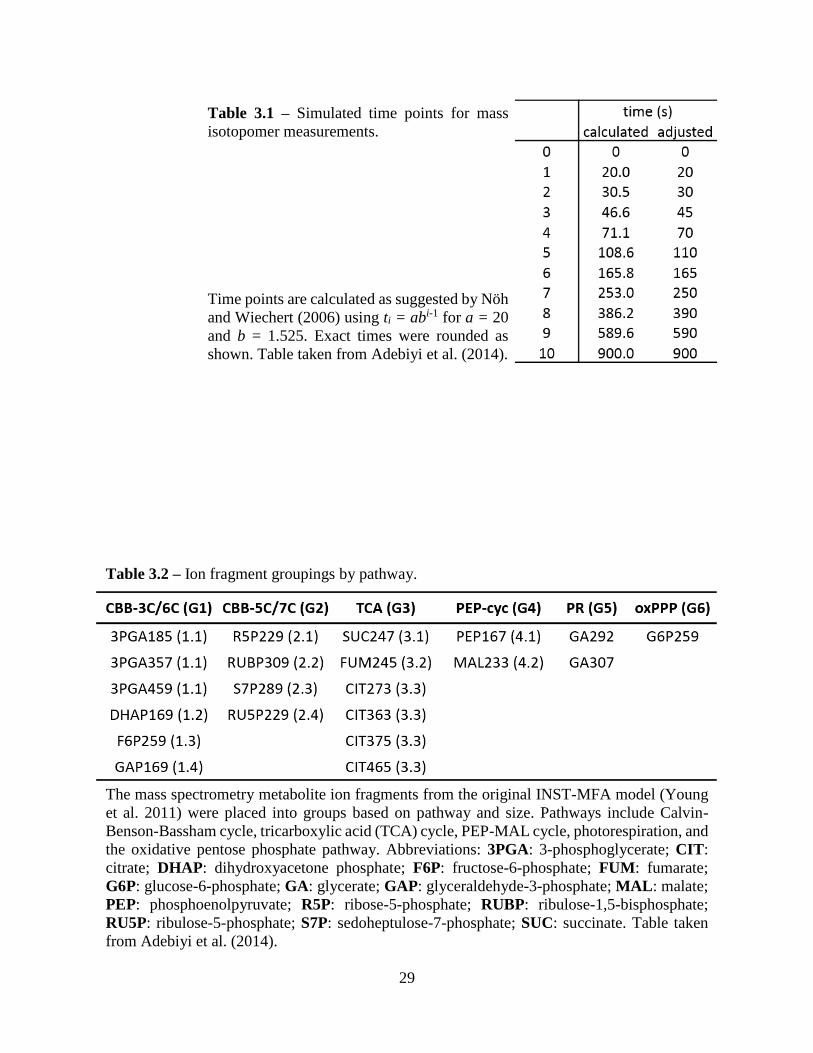
3.2 Ion fragment groupings by pathway ........................................................................................29
4.1 Strain list ..................................................................................................................................40
A.1 Minimal subset of metabolites for INST-MFA.......................................................................52
v
LIST OF FIGURES
Figure Page
2.1 Two primary 13C MFA approaches applied to cyanobacteria ....................................................5
2.2 Model for INST-MFA analysis of central carbon metabolism ................................................10
2.3 Biosynthetic metabolism of cyanobacteria ..............................................................................15
3.1 Workflow of INST-MFA in cyanobacteria..............................................................................27
3.2 Effect of removing measurements on flux uncertainties .........................................................31
3.3 Changes in flux uncertainties following time point inactivation .............................................33
4.1 Overview of the metabolic pathway of the IBA-producing strain ...........................................36
4.2 Comparison of flux into pyruvate ............................................................................................38
4.3 Effect of strain engineering on growth ....................................................................................43
4.4 Effect of enzyme overexpression on aldehyde production ......................................................45
4.5 Intracellular pool sizes of pyruvate derivatives .......................................................................45
A.1 Minimal subset of time points for INST-MFA .......................................................................52
A.2 INST-MFA fluxes calculated using a minimal subset of inputs .............................................53
A.3 Comparison of growth rates during different segments of cell exponential growth ...............55
B.1 Aldehyde trap set up ................................................................................................................63
1
CHAPTER I
INTRODUCTION
Cyanobacteria have recently garnered attention as a renewable production source for fuels
and chemicals. Manipulation of endogenous metabolic pathways has yielded hydrogen (Dutta et
al. 2005; Masukawa et al. 2010), ethanol (Deng and Coleman 1999), higher alcohols (Oliver et al.
2013; Varman et al. 2013), fatty acids and fatty alcohols (Liu et al. 2011; Yao et al. 2014), and
several other products (Ducat et al. 2011; Quintana et al. 2011). The appeal of these prokaryotes
as “mini factories” lies in their ability to capture CO2 from the atmosphere. This decreases the
feedstock cost and provides a secondary level of environmental benefit (Kumar et al. 2011).
A primary limitation of industrial use of cyanobacteria is the high cost of culture vessels.
Open raceway ponds are a low-cost option. The ponds are supplied with nutrients and water either
continuously or in batch. However, the open-atmosphere design leaves the culture susceptible to
contamination, and the cost of biomass harvesting and product separation is often high. This design
remains useful for strains of microalgae with high growth rates or requiring selective growth
media, such as high alkalinity or salinity (Hu and Richmond 2013). Ponds may be used for products
requiring little further separation, for example, Spirulina, an edible alga (Earthrise®). In this case,
the whole cell is dried and pelleted, avoiding the cost of lysing cells and separating the extracted
metabolites.
Another system for industrial production of cyanobacteria is the photobioreactor (Sharma
et al. 2013). Specific styles differ, but common features include (i) a barrier to prevent outside
contamination and provide better control of conditions, (ii) continuous feed of nutrients, including
2
CO2 and pH adjusters, and (iii) a light source, either directly from the sun or from artificial lights.
While these allow for greater control than open raceway ponds, the tradeoff is the higher costs in
purchase and maintenance of these specialized reactors.
Other drawbacks limiting the industrial implementation of cyanobacteria are low
production titers and cell biomass production, especially when compared to other industrial
microbes, such as Escherichia coli and yeast. For example, a 2,3-butanediol production pathway
was introduced into both E. coli and a strain of cyanobacteria, Synechococcus elongatus sp.
PCC 7942. Yield in E. coli peaked at 13.8 g L-1 over 40 hours whereas S. elongatus yield peaked
at 2.38 g L-1 over a longer period of 21 days, a difference of almost two orders of magnitude in
daily productivity (8.28 g L-1 day-1 versus 0.11 g L-1 day-1) (Oliver et al. 2013). Most of the tools
used to address these drawbacks have been adapted from E. coli. This causes progress in the
industrial application of cyanobacteria to lag further behind the existing platform microbes.
Through metabolic engineering, the cyanobacterial genome can be manipulated to address
low cell productivity. Metabolic engineering is an emerging field that emphasizes rational
alterations of organismal metabolism through iterative synthesis and analysis steps
(Stephanopoulos et al. 1998). Synthesis may involve the overexpression, knockdown, or knockout
of an existing gene or the introduction of an exogenous gene into the host of interest to facilitate
product formation. These new pathways are introduced to cellular metabolism through
recombinant DNA technology. Analysis involves characterizing the strains of interest. The
characterized strains are compared to a control strain to determine how to engineer the cells for
further improvement.
Strain characterization often includes observing rates of (i) substrate consumption,
(ii) growth, and (iii) product formation to compare the effects of genetic alterations. In terms of
3
carbon flux or flow through the system, substrate consumption is the amount of carbon intake.
Growth rate is a measure of carbon metabolized into biomass production. Product formation
reflects carbon flux into the desired sink. Additional measurements may be collected to
characterize each strain further. Large-scale sets of data used to compare phenotypic responses at
various subcellular levels are labeled with the suffix ‘-omics’. These include data that span broad
ranges of cellular metabolism and track changes at the gene, protein, metabolite, or flux levels to
observe bulk response to stimuli. The information compiled during characterization is used to
identify specific gene targets for further engineering to improve product formation. Further
manipulation may include altering the specific genes introduced or removing competing pathways
within the cells to further increase productivity.
This project applies metabolic engineering to cyanobacteria. Chapter 2 of this thesis
reviews previous work on cyanobacteria using the analytical method of metabolic flux analysis
and also the synthesis of two products from the major precursor pyruvate. Chapter 3 probes an
analytical model of central carbon metabolism previously applied to cyanobacteria. This study
highlights key experimental data for reliable estimation of carbon flux through these critical
pathways. One of the key findings from the previous analysis has been applied to a specific strain
of aldehyde-producing cyanobacteria in Chapter 4. Strains overexpressing the genes of interest are
characterized and compared to determine a new target for further gene engineering to optimize
product formation. Chapter 5 provides a conclusion of the work performed for this thesis and
suggestions for future direction of this project based on results.
4
CHAPTER II
LITERATURE REVIEW
MFA in Cyanobacteria
Metabolic flux analysis (MFA) is a useful analysis tool for metabolic engineering. This
computational tool has allowed for observation of flux in several platform organisms. MFA is
commonly supplemented with labeling experiments to broaden the range of fluxes feasibly
estimated and to increase the certainty of the calculations. Following introduction of stable
isotopically labeled substrates to cells, the resultant labeling of downstream metabolites provides
information used to quantify intracellular fluxes in pathways of interest. Due to recent advances,
MFA can be conducted either at metabolic (quasi)steady state or in a more dynamic state of
metabolism (Leighty and Antoniewicz 2011). Further, labeling may be measured once the atom
labeling has been fully incorporated, in steady-state MFA (Wiechert 2001), or during the transient
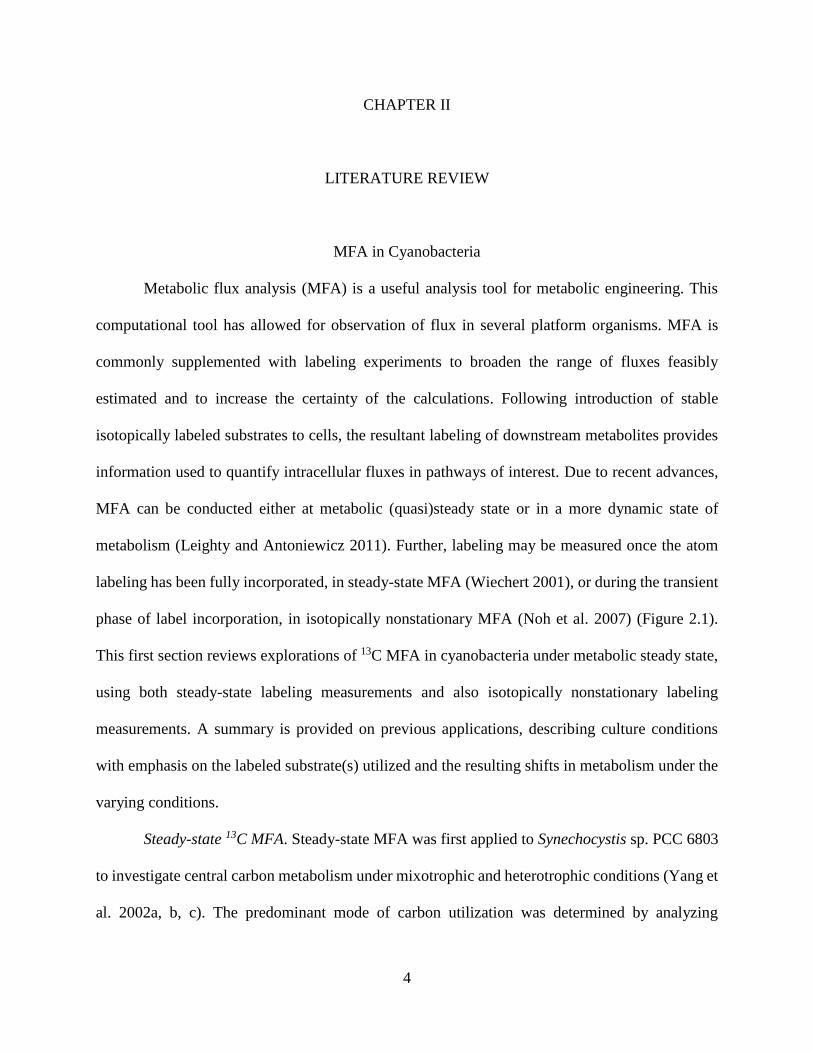
phase of label incorporation, in isotopically nonstationary MFA (Noh et al. 2007) (Figure 2.1).
This first section reviews explorations of 13C MFA in cyanobacteria under metabolic steady state,
using both steady-state labeling measurements and also isotopically nonstationary labeling
measurements. A summary is provided on previous applications, describing culture conditions
with emphasis on the labeled substrate(s) utilized and the resulting shifts in metabolism under the
varying conditions.
Steady-state 13C MFA. Steady-state MFA was first applied to Synechocystis sp. PCC 6803
to investigate central carbon metabolism under mixotrophic and heterotrophic conditions (Yang et
al. 2002a, b, c). The predominant mode of carbon utilization was determined by analyzing
5
Fig
ure
2.1
– T
wo
pri
ma
ry1
3C
MF
A a
pp
roach
es a
pp
lied
to c
yan
ob
act
eria
. M
FA
beg
ins
wit
h a
set
of
mas
s b
alan
ces
des
crib
ing a
cel
l cu
lture
at
met
aboli
c st
eady
sta
te.
Fee
din
g a
13C
tra
cer
and m
easu
ring i
soto
pom
er a
bundan
ces
of
intr
acel
lula
r m
etab
oli
tes
pro
vid
es a
ddit
ional
info
rmat
ion t
o c
onst
rain
the
flux s
olu
tion.
This
involv
es l
east
-squar
es
regre
ssio
n b
ased
on a
n e
xpan
ded
model
that
incl
udes
both
mas
s an
d i
soto
pom
er b
alan
ces.
Het
erotr
ophic
cult
ure
s ar
e
anal
yze
d b
y p
erfo
rmin
g s
tead
y-s
tate
MF
A w
ith l
abel
ing m
easu
rem
ents
obta
ined
fro
m 1
3C
-lab
eled
glu
cose
or
gly
cero
l
trac
ers.
A
uto
trophic
cu
lture
s re
quir
e tr
ansi
ent
13C
la
bel
ing
exper
imen
ts
foll
ow
ed
by
INS
T-M
FA
.
Abbre
via
tions:
S:
stoic
hio
met
ric
mat
rix; v:
flu
x v
ecto
r. F
igure
tak
en f
rom
Adeb
iyi
et a
l. (
2014).
6
metabolite labeling using a mixed feed of 90% unlabeled glucose and 10% fully-labeled
[U-13C6] glucose. Heterotrophic cells were found to utilize the oxidative pentose phosphate
pathway (oxPPP) almost exclusively for energy production, with more than 90% of the incoming
glucose metabolized through this pathway to produce NADPH for growth and respiration. The
coupling of NADPH production to oxidative phosphorylation represents a unique respiratory
pathway found in cyanobacteria and is believed to compensate for the lack of an intact
cyanobacterial TCA cycle (Pelroy et al. 1972). Under mixotrophic conditions, CBB cycle flux was
approximately two-fold higher than glucose uptake, fueled by NADPH and ATP production from
photosynthetic light reactions. However, flux through RUBP carboxylase/oxygenase (RuBisCO)
still only accounted for one-third of the total carbon uptake. A substantial cyclic flux was noted
through phosphoenolpyruvate carboxylase (PEPC) and malic enzyme (ME) under both
heterotrophic and mixotrophic conditions, which is similar to the pathway of carbon assimilation
found in C4 plants.
In addition to their 13C MFA studies, Yang et al. (2002a) compared mRNA transcript levels
and protein expressions with pathway fluxes to decipher mechanisms of metabolic regulation.
Consistent with their flux results, genes encoding phycobilisomes, RuBisCO, and the CBB-cycle
associated gap2 isoform of glyceraldehyde-3-phosphate dehydrogenase (GAPDH) were all
transcriptionally repressed under heterotrophic conditions, while the oxPPP gene gnd
(gluconate-6-phosphate or G6P ↔ ribulose-5-phosphate or RU5P) was upregulated by about 60%.
Conversely, some expression levels did not appear to be in agreement with the flux results,
indicating post-translational regulation by cellular redox or metabolite concentrations. Several
genes encoding enzymes of central carbon metabolism were largely unaffected by light at the
transcriptional level despite dramatic rerouting of flux through these pathways. This work
7
highlighted the utility of 13C MFA to uncover novel insights about regulatory mechanisms when
combined with other ‘-omics’ platforms.
Nakajima et al. (2014) combined 13C MFA with metabolomic and transcriptomic analyses
of Synechocystis to compare cells grown under mixotrophic conditions and photoheterotrophic
conditions. Labeling was achieved by an optimized mix of 70% [1-13C] glucose and 30%
[U-13C] glucose while atrazine was added to the photoheterotrophic cultures to inhibit
photosynthesis. Samples were taken during the exponential growth phase, and nine proteinogenic
amino acids were selected for analysis: alanine, aspartate, glutamate, phenylalanine, glycine,
isoleucine, leucine, serine, and valine. A comparison of the fluxes and their 95% confidence
intervals showed that over half of the fluxes differed significantly between the two culture
conditions. Changes in enzyme expression within these pathways were less dramatic, with most
genes differing by less than two-fold between mixotrophic and photoheterotrophic conditions. A
six-fold increase in RuBisCO activity was observed under mixotrophic conditions when compared
to photoheterotrophic conditions. However, there was no significant change in the levels of RU5P
or ribulose-1,5-bisphosphate (RUBP) or in the expression of phosphoribulokinase
(RU5P ↔ RUBP) or RuBisCO large and small subunits. OxPPP flux was elevated under
photoheterotrophic conditions to compensate for loss of photosynthetically produced NAPDH, but
gene expression was again unaffected. In contrast to the previous study of Yang et al. (2002c),
some residual oxPPP flux was still detectable under mixotrophic conditions. The authors attributed
this to the lower light intensity used in the more recent study (40 μmol m-2 s-1 vs 125 μmol m-2 s-1),
consistent with model predictions reported by Shastri and Morgan (2005). The gene that exhibited
the largest expression change was gap1, which encodes an isoform of GAPDH that is essential for
8
glycolytic glucose breakdown and was suggested to respond to NADPH levels by shifting carbon
flow between glycolysis and oxPPP.
Another recent study by You et al. (2014) confirmed conclusions from previous studies in
Synechocystis under mixotrophic growth conditions. In addition to 13C MFA, isotope dilution
experiments were performed to identify the presence of particular pathways. Cells were fully
labeled using NaH13CO3 and [U-13C] glucose. Then unlabeled glyoxylate or glutamate was added
to determine the activities of specific reactions. The MFA model yielded evidence of high malic
enzyme activity in agreement with the previous analysis by Yang et al. (2002b). OxPPP flux was
low under the light- and carbon-sufficient conditions of the early-exponential phase, but labeling
in late-exponential phase indicated higher oxPPP activity. You et al. focused particular attention
toward elucidating the direction and activity of the TCA cycle. Similar to the flux analysis of
Nakajima et al. (2014), this study calculated a zero flux through the glyoxylate shunt. Isotope
dilution with glutamate detected carbon flow through α-ketoglutarate to succinate, which was
consistent with activity of the α-ketoglutarate decarboxylase bypass pathway recently discovered
by Zhang and Bryant (2011). However, 13C MFA verified that flux through this pathway was
negligibly small, in agreement with previous MFA studies.
In addition to Synechocystis, other strains of cyanobacteria have also become the subject
of recent flux profiling experiments. A steady-state 13C labeling study by Feng et al. (2010)
investigated the effects of different carbon and nitrogen substrates on the central metabolism of
Cyanothece sp. ATCC 51142 under continuous light conditions. Three labeled substrates were
tested ([U-13C] glucose, [2-13C] glycerol, and [3-13C] pyruvate) in either nitrogen-fixing or
nitrogen-sufficient conditions to determine their impacts on growth and amino acid biosynthesis.
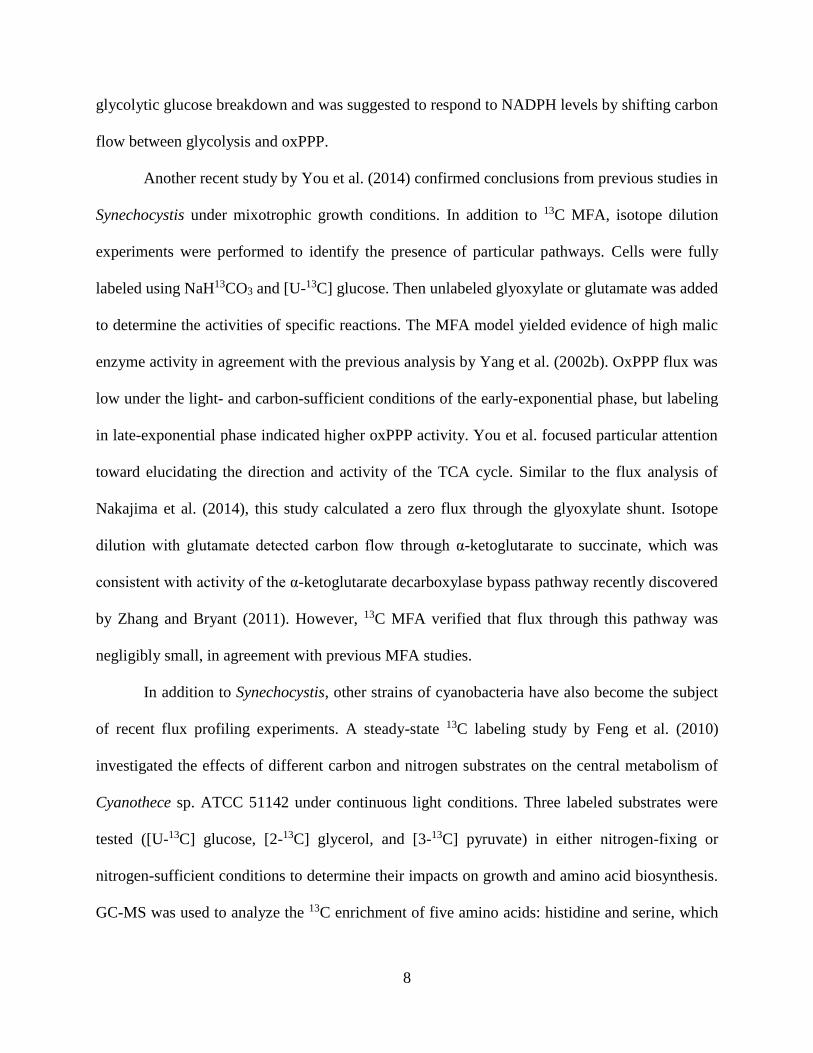
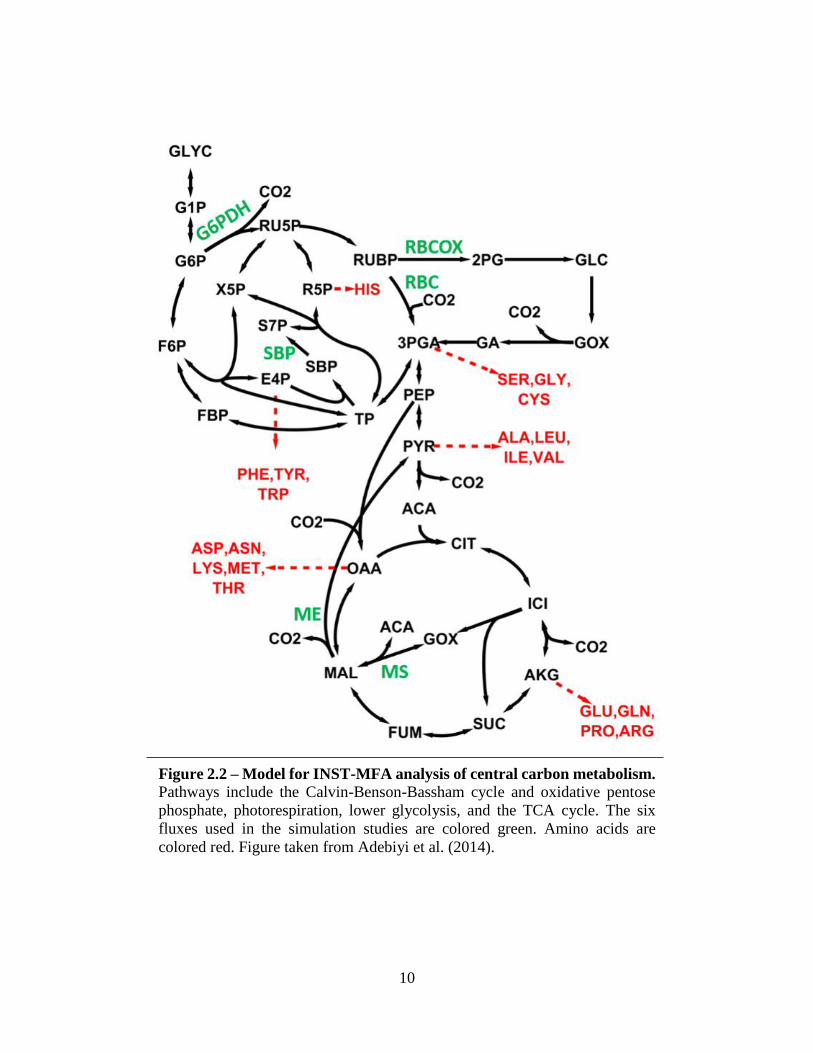
GC-MS was used to analyze the 13C enrichment of five amino acids: histidine and serine, which
9
are synthesized from CBB cycle and PPP intermediates; alanine, which is derived from pyruvate;
and aspartate and glutamate, which are both TCA cycle derivatives (Figure 2.2). Glycerol addition
doubled the specific growth rate under both nitrogen-fixing and nitrogen-sufficient conditions, but
neither glucose nor pyruvate enhanced growth in comparison to a control photoautotrophic culture.
Consistent with this observation, the contribution of glycerol carbon to amino acid biosynthesis
was substantially higher than either glucose or pyruvate. Furthermore, the amino acids histidine,
alanine, and serine were completely derived from glycerol carbon under nitrogen-sufficient
conditions, indicating a shift to photoheterotrophic growth. This study highlights the use of
13C labeling studies to reveal major pathways of carbon utilization in less-characterized species.
Feng et al. (2010) made extensive use of 13C labeling data to determine the contributions
of extracellular carbon substrates to intracellular amino acid pools but did not attempt to estimate
intracellular fluxes using rigorous pathway modeling. Another study by Alagesan et al. (2013)
provided a more comprehensive flux analysis of Cyanothece sp. ATCC 51142 metabolism under
similar growth conditions. A comparison of these two studies underscores the effects that culture
conditions and measurement availability have on the computed fluxes. Both groups analyzed
growth in nitrogen-sufficient and nitrogen-fixing conditions using 13C-labeled glycerol as a carbon
source. However, Feng et al. determined that a glycerol-fed culture in nitrogen-replete media
exhibited photoheterotrophic growth in the presence of light, while Alagesan et al. observed
mixotrophic metabolism under similar conditions. The variation in culture experimental setup
likely caused this difference, as the latter group chose a higher light intensity (100 μmol m-2 s-1 vs.
50 μmol m-2 s-1) to avoid light limitation, and the cells were harvested early in the exponential
growth phase to maintain sufficient CO2 availability. Also, a greater number of amino acids were
analyzed by Alagesan et al., providing increased redundancy and pathway coverage. This enabled
10
Figure 2.2 – Model for INST-MFA analysis of central carbon metabolism. Pathways include the Calvin-Benson-Bassham cycle and oxidative pentose
phosphate, photorespiration, lower glycolysis, and the TCA cycle. The six
fluxes used in the simulation studies are colored green. Amino acids are
colored red. Figure taken from Adebiyi et al. (2014).
11
13C MFA to be performed based on an extensive metabolic model that included a complete TCA
cycle, as recently reported by Zhang and Bryant (2011). In both cases, the addition of glycerol to
the media resulted in a higher growth rate, and both groups also noted incorporation of CO2
through anaplerotic pathways involved in the formation of oxaloacetate (OAA) from PEP (i.e.,
C4-like metabolism). Further evaluation of this strain would benefit from standardized growth
conditions and also by extending the 13C MFA studies to include additional isotopomer
measurements beyond those obtained from proteinogenic amino acids.
Isotopically nonstationary 13C MFA. The development of software packages, such as
INCA, has enabled INST-MFA studies of autotrophic metabolism in cyanobacteria. These
complement previous studies that have been limited to heterotrophic or mixotrophic conditions.
The approach was first applied by Young et al. (2011) to the model cyanobacterium Synechocystis
growing in a controlled photobioreactor. The study relied on both GC-MS and LC-MS/MS to
quantify labeling trajectories of 15 intracellular metabolites following administration of
13C-labeled bicarbonate to the culture. This was the first comprehensive flux analysis performed
using isotope labeling data obtained in a fully autotrophic system. Steady-state labeling was
typically achieved in less than 10 minutes, with the notable exception of TCA pathway
intermediates (e.g., succinate, fumarate, and citrate) that were more slowly labeled. The flux map
obtained using 13C INST-MFA was compared to a previously published linear programming
solution that predicted the theoretical optimum flux profile needed to maximize growth and
minimize light utilization (Shastri and Morgan 2005). Overall, the results indicated that
photoautotrophically grown Synechocystis cells exhibited suboptimal carbon efficiency, with
significant loss of fixed CO2 via oxPPP. This provides an example of how flux analysis can be
used to identify pathways responsible for reduced productivity, by pinpointing processes that
12
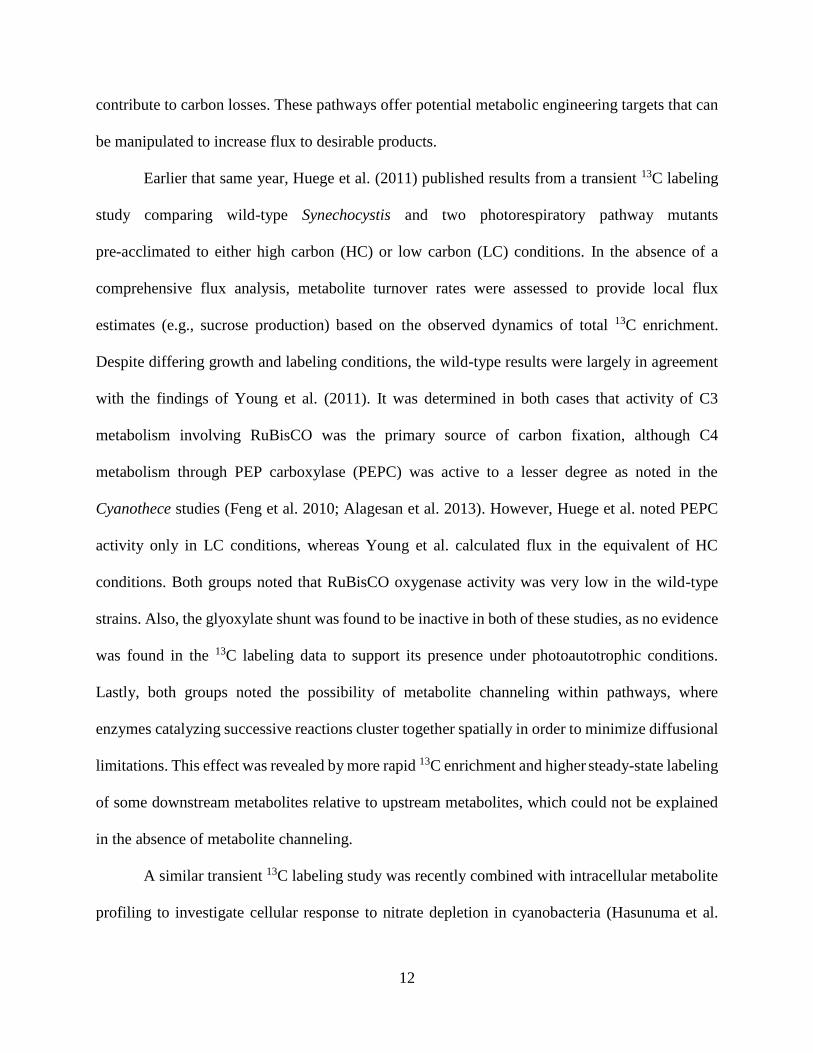
contribute to carbon losses. These pathways offer potential metabolic engineering targets that can
be manipulated to increase flux to desirable products.
Earlier that same year, Huege et al. (2011) published results from a transient 13C labeling
study comparing wild-type Synechocystis and two photorespiratory pathway mutants
pre-acclimated to either high carbon (HC) or low carbon (LC) conditions. In the absence of a
comprehensive flux analysis, metabolite turnover rates were assessed to provide local flux
estimates (e.g., sucrose production) based on the observed dynamics of total 13C enrichment.
Despite differing growth and labeling conditions, the wild-type results were largely in agreement
with the findings of Young et al. (2011). It was determined in both cases that activity of C3
metabolism involving RuBisCO was the primary source of carbon fixation, although C4
metabolism through PEP carboxylase (PEPC) was active to a lesser degree as noted in the
Cyanothece studies (Feng et al. 2010; Alagesan et al. 2013). However, Huege et al. noted PEPC
activity only in LC conditions, whereas Young et al. calculated flux in the equivalent of HC
conditions. Both groups noted that RuBisCO oxygenase activity was very low in the wild-type
strains. Also, the glyoxylate shunt was found to be inactive in both of these studies, as no evidence
was found in the 13C labeling data to support its presence under photoautotrophic conditions.
Lastly, both groups noted the possibility of metabolite channeling within pathways, where
enzymes catalyzing successive reactions cluster together spatially in order to minimize diffusional
limitations. This effect was revealed by more rapid 13C enrichment and higher steady-state labeling
of some downstream metabolites relative to upstream metabolites, which could not be explained
in the absence of metabolite channeling.
A similar transient 13C labeling study was recently combined with intracellular metabolite
profiling to investigate cellular response to nitrate depletion in cyanobacteria (Hasunuma et al.
13
2013). In Arthrospira platensis and Synechocystis, the rate of 13C incorporation in central carbon
metabolites and amino acids was determined over a thirty-minute labeling period using NaH13CO3.
In comparison with cells grown under nitrogen-replete conditions, nitrogen depletion resulted in
lower cell growth rate, lower percentage of proteins in the cell, and higher glycogen content. The
13C labeling data indicated that, with the exception of glutamine and glutamate, the enrichment of
most intracellular metabolites was significantly decreased in A. platensis cells cultivated without
nitrate. These findings suggest that cyanobacteria placed under nitrogen stress conditions degrade
intracellular proteins to amino acids, which then serve as the carbon source for glycogen synthesis.
Summary. MFA has proven useful for elucidating pathways in cyanobacteria. Both SS- and
INST-MFA have been used to increase understanding of central carbon metabolism, particularly
the use of oxPPP versus CBB and minimal activity in the TCA cycle and photorespiration.
Different feed and light conditions exhibited shifts in metabolism to ensure continuous production
of NADPH in the presence and absence of light. OxPPP was the prominent pathway in
heterotrophic cells but was also found to be active in mixotrophic cells and even photoautotrophic
cells, indicating decreased efficiency in carbon metabolism. Conversely, CBB flux was prominent
in photoautotrophic cells and higher than glucose flux in mixotrophic cells. Combining MFA with
other analysis methods provided deeper understanding of regulation and specifically demonstrated
the uncoupling of transcription and translation with metabolism. Overall, this information can be
used to identify interesting pathways for introducing biofuel or biochemical synthesis genes by
highlighting sources of abundant carbon versus unused pathways.
14
Optimization of Pyruvate-derived Products in Cyanobacteria
Pyruvate is produced as the end point of glycolysis and serves as a key metabolic node for
downstream branches of metabolism, including amino acid synthesis and the TCA cycle
(Figure 2.3). In metabolic engineering, this metabolite also serves as a precursor for a number of
products of interest. This review briefly focuses on cyanobacterial production of two of these
products and the metabolic engineering approaches used to increase productivity in two platform
strains, Synechocystis sp. PCC 6803 and Synechococcus elongatus sp. PCC 7942.
Cyanobacterial production of ethanol. Ethanol is one of the most visible biofuels in use
today. Current production in the U.S. is primarily achieved by processing starch-based crops, such
as corn. Recent legislation seeks to increase the volume of ethanol produced, but this adds excess
agricultural stress by requiring increases in crop yields and also in land use (Khoo 2015). Research
has gone into production of ethanol from platform microbes, such as Escherichia coli. Toxicity is
a primary limitation to large-scale production. Also, these microbes still require some high cost
carbon source, negating some of their benefits. Photoautotrophic cyanobacteria remain superior in
this regard, but productivity remains a significant drawback.
Exploration into ethanol production by cyanobacteria began in the strain Synechococcus
elongatus sp. PCC 7942 (S. elongatus). This strain was engineered by Deng and Coleman (1999)
through addition of pyruvate decarboxylase (pdc) and alcohol dehydrogenase II (adh) from
Zymomonas mobilis (Figure 2.3). Genes were first placed under control of the
ribulose 1,5-bisphosphate carboxylase/oxygenase large and small subunit (rbcLS) promoter. The
promoter led to high expression of PDC and ADH and resulted in ethanol production of 63 mg L-1
over 21 days (3 mg L-1 day-1) in liquid batch cultures. Further, the pdc start sequence and ribosome
binding site were replaced with the start sequence and ribosome binding site of rbcLS.
15
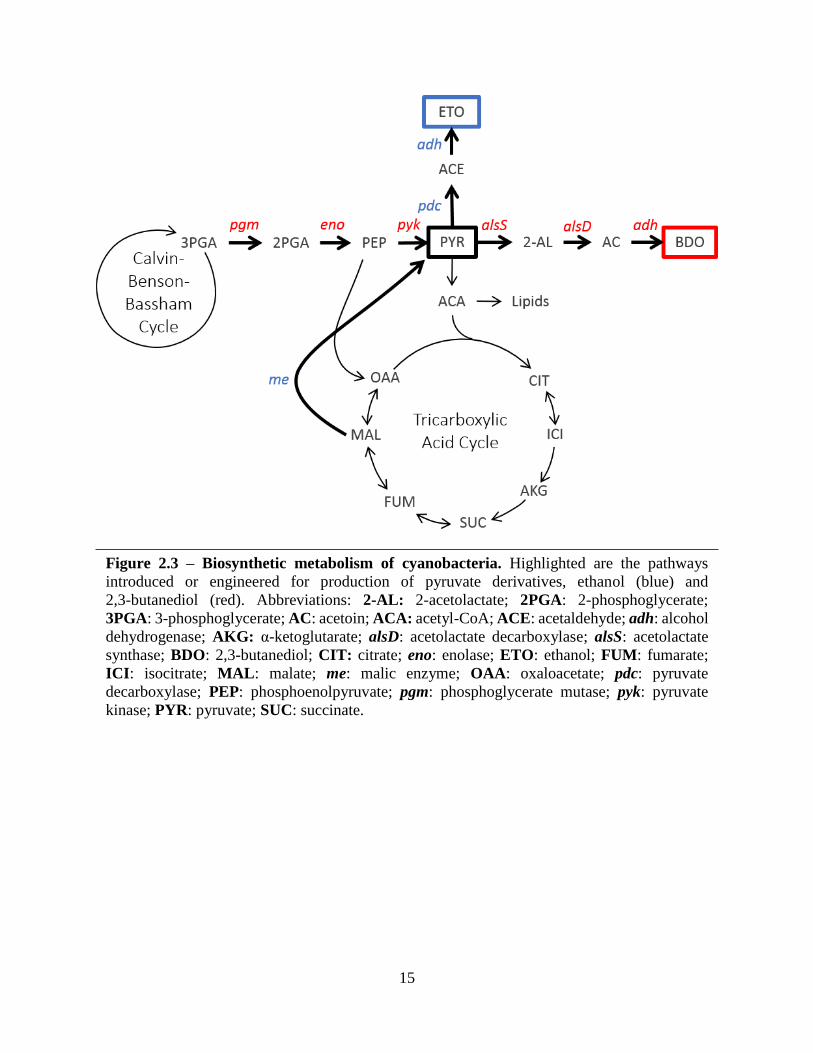
Figure 2.3 – Biosynthetic metabolism of cyanobacteria. Highlighted are the pathways
introduced or engineered for production of pyruvate derivatives, ethanol (blue) and
2,3-butanediol (red). Abbreviations: 2-AL: 2-acetolactate; 2PGA: 2-phosphoglycerate;
3PGA: 3-phosphoglycerate; AC: acetoin; ACA: acetyl-CoA; ACE: acetaldehyde; adh: alcohol
dehydrogenase; AKG: α-ketoglutarate; alsD: acetolactate decarboxylase; alsS: acetolactate
synthase; BDO: 2,3-butanediol; CIT: citrate; eno: enolase; ETO: ethanol; FUM: fumarate;
ICI: isocitrate; MAL: malate; me: malic enzyme; OAA: oxaloacetate; pdc: pyruvate
decarboxylase; PEP: phosphoenolpyruvate; pgm: phosphoglycerate mutase; pyk: pyruvate
kinase; PYR: pyruvate; SUC: succinate.
16
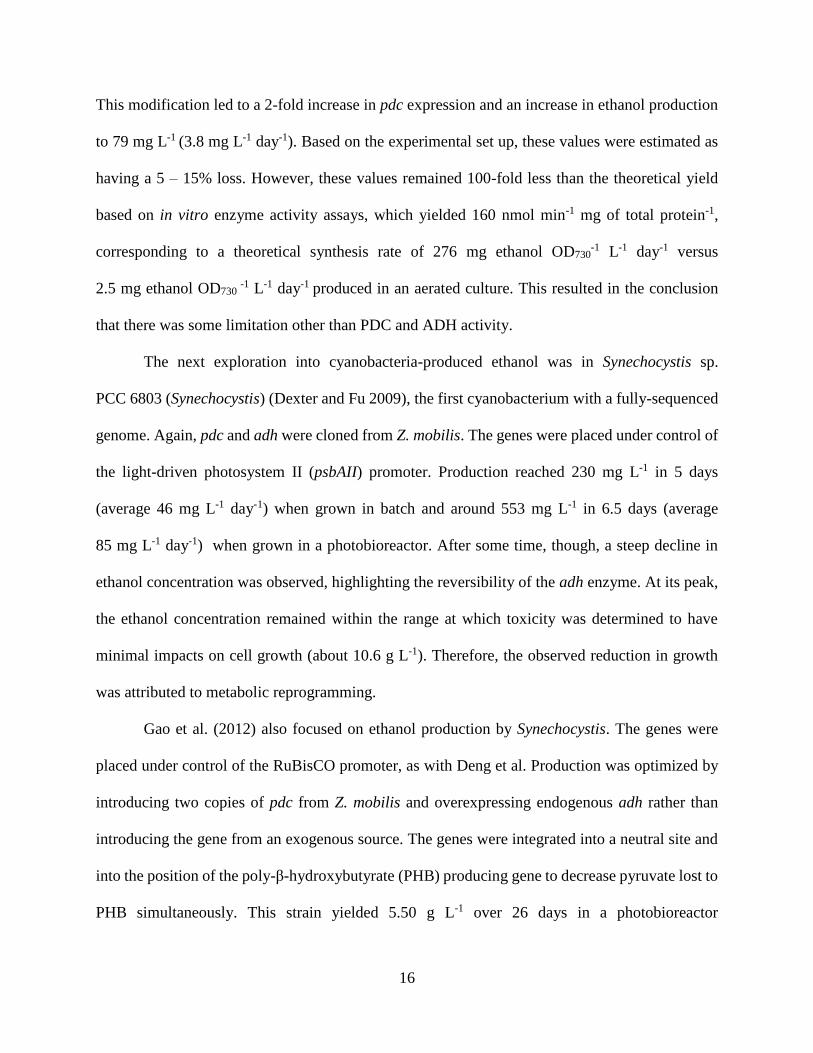
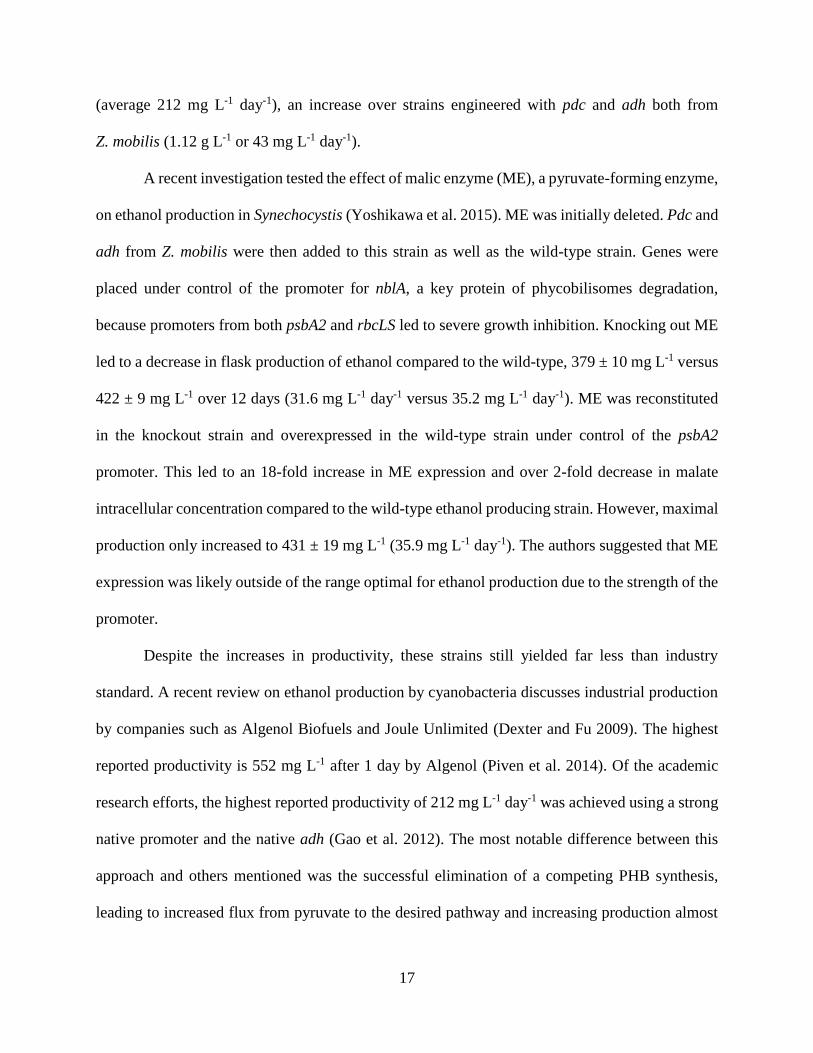
This modification led to a 2-fold increase in pdc expression and an increase in ethanol production
to 79 mg L-1 (3.8 mg L-1 day-1). Based on the experimental set up, these values were estimated as
having a 5 – 15% loss. However, these values remained 100-fold less than the theoretical yield
based on in vitro enzyme activity assays, which yielded 160 nmol min-1 mg of total protein-1,
corresponding to a theoretical synthesis rate of 276 mg ethanol OD730-1 L-1 day-1 versus
2.5 mg ethanol OD730 -1 L-1 day-1 produced in an aerated culture. This resulted in the conclusion
that there was some limitation other than PDC and ADH activity.
The next exploration into cyanobacteria-produced ethanol was in Synechocystis sp.
PCC 6803 (Synechocystis) (Dexter and Fu 2009), the first cyanobacterium with a fully-sequenced
genome. Again, pdc and adh were cloned from Z. mobilis. The genes were placed under control of
the light-driven photosystem II (psbAII) promoter. Production reached 230 mg L-1 in 5 days
(average 46 mg L-1 day-1) when grown in batch and around 553 mg L-1 in 6.5 days (average
85 mg L-1 day-1) when grown in a photobioreactor. After some time, though, a steep decline in
ethanol concentration was observed, highlighting the reversibility of the adh enzyme. At its peak,
the ethanol concentration remained within the range at which toxicity was determined to have
minimal impacts on cell growth (about 10.6 g L-1). Therefore, the observed reduction in growth
was attributed to metabolic reprogramming.
Gao et al. (2012) also focused on ethanol production by Synechocystis. The genes were
placed under control of the RuBisCO promoter, as with Deng et al. Production was optimized by
introducing two copies of pdc from Z. mobilis and overexpressing endogenous adh rather than
introducing the gene from an exogenous source. The genes were integrated into a neutral site and
into the position of the poly-β-hydroxybutyrate (PHB) producing gene to decrease pyruvate lost to
PHB simultaneously. This strain yielded 5.50 g L-1 over 26 days in a photobioreactor
17
(average 212 mg L-1 day-1), an increase over strains engineered with pdc and adh both from
Z. mobilis (1.12 g L-1 or 43 mg L-1 day-1).
A recent investigation tested the effect of malic enzyme (ME), a pyruvate-forming enzyme,
on ethanol production in Synechocystis (Yoshikawa et al. 2015). ME was initially deleted. Pdc and
adh from Z. mobilis were then added to this strain as well as the wild-type strain. Genes were
placed under control of the promoter for nblA, a key protein of phycobilisomes degradation,
because promoters from both psbA2 and rbcLS led to severe growth inhibition. Knocking out ME
led to a decrease in flask production of ethanol compared to the wild-type, 379 ± 10 mg L-1 versus
422 ± 9 mg L-1 over 12 days (31.6 mg L-1 day-1 versus 35.2 mg L-1 day-1). ME was reconstituted
in the knockout strain and overexpressed in the wild-type strain under control of the psbA2
promoter. This led to an 18-fold increase in ME expression and over 2-fold decrease in malate
intracellular concentration compared to the wild-type ethanol producing strain. However, maximal
production only increased to 431 ± 19 mg L-1 (35.9 mg L-1 day-1). The authors suggested that ME
expression was likely outside of the range optimal for ethanol production due to the strength of the
promoter.
Despite the increases in productivity, these strains still yielded far less than industry
standard. A recent review on ethanol production by cyanobacteria discusses industrial production
by companies such as Algenol Biofuels and Joule Unlimited (Dexter and Fu 2009). The highest
reported productivity is 552 mg L-1 after 1 day by Algenol (Piven et al. 2014). Of the academic
research efforts, the highest reported productivity of 212 mg L-1 day-1 was achieved using a strong
native promoter and the native adh (Gao et al. 2012). The most notable difference between this
approach and others mentioned was the successful elimination of a competing PHB synthesis,
leading to increased flux from pyruvate to the desired pathway and increasing production almost
18
5-fold. Moving forward, methods of eliminating competing pathways should be further
investigated to increase carbon to pyruvate and, further, to ethanol.
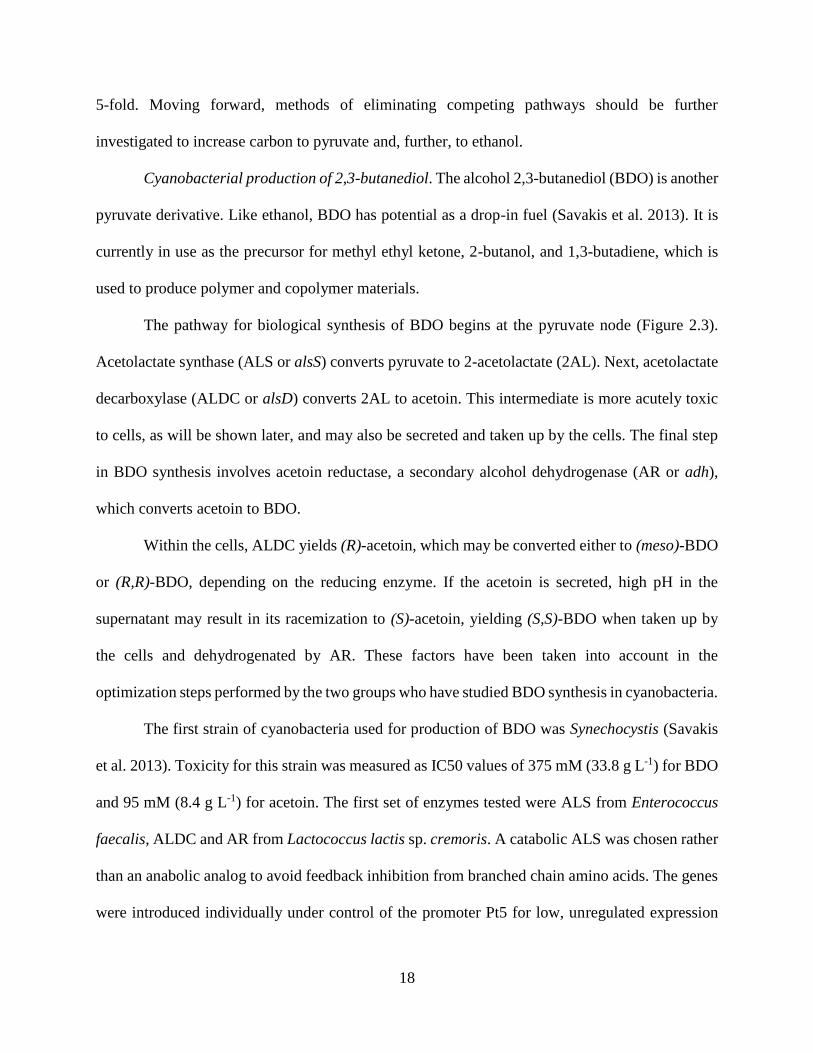
Cyanobacterial production of 2,3-butanediol. The alcohol 2,3-butanediol (BDO) is another
pyruvate derivative. Like ethanol, BDO has potential as a drop-in fuel (Savakis et al. 2013). It is
currently in use as the precursor for methyl ethyl ketone, 2-butanol, and 1,3-butadiene, which is
used to produce polymer and copolymer materials.
The pathway for biological synthesis of BDO begins at the pyruvate node (Figure 2.3).
Acetolactate synthase (ALS or alsS) converts pyruvate to 2-acetolactate (2AL). Next, acetolactate
decarboxylase (ALDC or alsD) converts 2AL to acetoin. This intermediate is more acutely toxic
to cells, as will be shown later, and may also be secreted and taken up by the cells. The final step
in BDO synthesis involves acetoin reductase, a secondary alcohol dehydrogenase (AR or adh),
which converts acetoin to BDO.
Within the cells, ALDC yields (R)-acetoin, which may be converted either to (meso)-BDO
or (R,R)-BDO, depending on the reducing enzyme. If the acetoin is secreted, high pH in the
supernatant may result in its racemization to (S)-acetoin, yielding (S,S)-BDO when taken up by
the cells and dehydrogenated by AR. These factors have been taken into account in the
optimization steps performed by the two groups who have studied BDO synthesis in cyanobacteria.
The first strain of cyanobacteria used for production of BDO was Synechocystis (Savakis
et al. 2013). Toxicity for this strain was measured as IC50 values of 375 mM (33.8 g L-1) for BDO
and 95 mM (8.4 g L-1) for acetoin. The first set of enzymes tested were ALS from Enterococcus
faecalis, ALDC and AR from Lactococcus lactis sp. cremoris. A catabolic ALS was chosen rather
than an anabolic analog to avoid feedback inhibition from branched chain amino acids. The genes
were introduced individually under control of the promoter Pt5 for low, unregulated expression
19
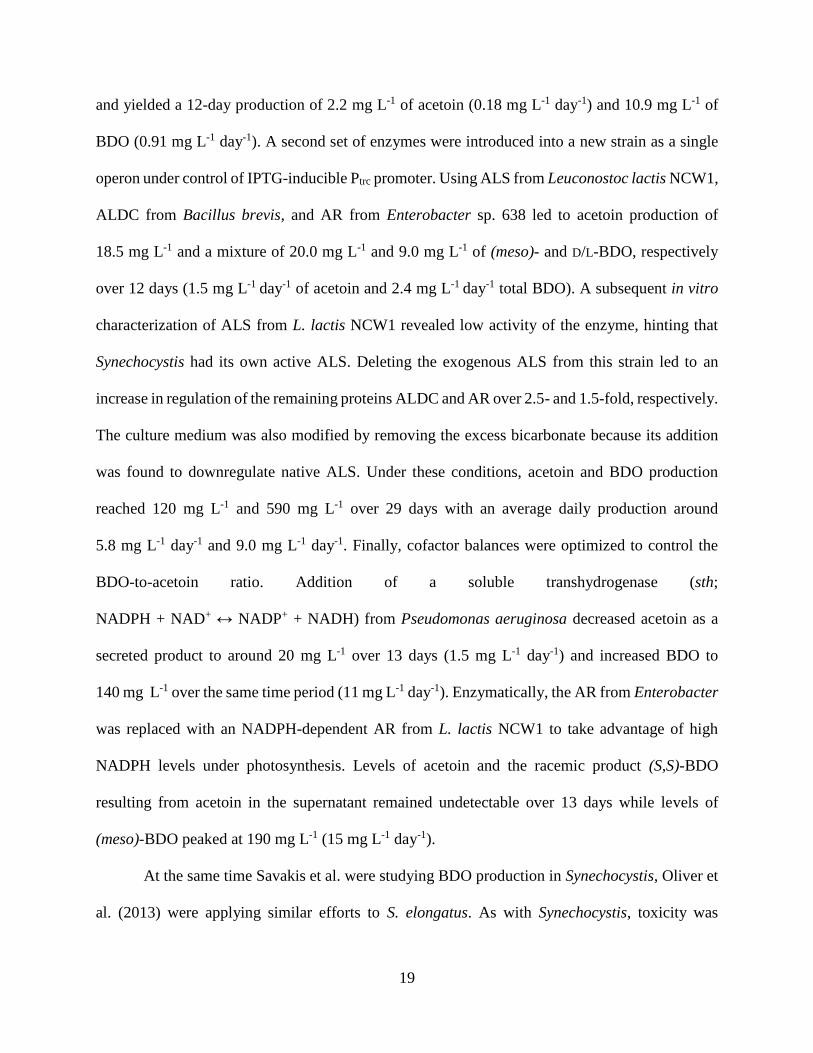
and yielded a 12-day production of 2.2 mg L-1 of acetoin (0.18 mg L-1 day-1) and 10.9 mg L-1 of
BDO (0.91 mg L-1 day-1). A second set of enzymes were introduced into a new strain as a single
operon under control of IPTG-inducible Ptrc promoter. Using ALS from Leuconostoc lactis NCW1,
ALDC from Bacillus brevis, and AR from Enterobacter sp. 638 led to acetoin production of
18.5 mg L-1 and a mixture of 20.0 mg L-1 and 9.0 mg L-1 of (meso)- and D/L-BDO, respectively
over 12 days (1.5 mg L-1 day-1 of acetoin and 2.4 mg L-1 day-1 total BDO). A subsequent in vitro
characterization of ALS from L. lactis NCW1 revealed low activity of the enzyme, hinting that
Synechocystis had its own active ALS. Deleting the exogenous ALS from this strain led to an
increase in regulation of the remaining proteins ALDC and AR over 2.5- and 1.5-fold, respectively.
The culture medium was also modified by removing the excess bicarbonate because its addition
was found to downregulate native ALS. Under these conditions, acetoin and BDO production
reached 120 mg L-1 and 590 mg L-1 over 29 days with an average daily production around
5.8 mg L-1 day-1 and 9.0 mg L-1 day-1. Finally, cofactor balances were optimized to control the
BDO-to-acetoin ratio. Addition of a soluble transhydrogenase (sth;
NADPH + NAD+ ↔ NADP+ + NADH) from Pseudomonas aeruginosa decreased acetoin as a
secreted product to around 20 mg L-1 over 13 days (1.5 mg L-1 day-1) and increased BDO to
140 mg L-1 over the same time period (11 mg L-1 day-1). Enzymatically, the AR from Enterobacter
was replaced with an NADPH-dependent AR from L. lactis NCW1 to take advantage of high
NADPH levels under photosynthesis. Levels of acetoin and the racemic product (S,S)-BDO
resulting from acetoin in the supernatant remained undetectable over 13 days while levels of
(meso)-BDO peaked at 190 mg L-1 (15 mg L-1 day-1).
At the same time Savakis et al. were studying BDO production in Synechocystis, Oliver et
al. (2013) were applying similar efforts to S. elongatus. As with Synechocystis, toxicity was
20
measured first, but S. elongatus was found to be more acutely sensitive to the products. Acetoin
led to a 42% decrease in growth in the first 24 hours at a concentration of 0.2 g L-1 versus an IC50
of 8.4 g L-1 in Synechocystis. The cells were less sensitive to BDO than acetoin, though, exhibiting
a 2.2% and 8.9% decrease in growth at concentrations of 10 g L-1 and 30 g L-1, respectively.
Engineering began with introduction of the ALS gene from Bacillus subtilis under control
of the IPTG-inducible promoter, PLlacO1. Various ALDC enzymes were tested, and two were
chosen for further investigation. ALDC from Enterobacter aerogenes resulted in moderate acetoin
production of 108 mg L-1 over 72 hours (36 mg L-1 day-1), while ALDC from Aeromonas
hydrophila yielded high acetoin levels, 203 mg L-1 over 72 hours (68 mg L-1 day-1). A similar
screening was performed to select the final enzyme in the pathway, referred to as secondary alcohol
dehydrogenase (ADH). Four enzymes were chosen, two producing BDO in the (R)-configuration
and two producing the (S)-configuration. Of these four, the highest productivity in the moderate
strain over 72 hours was achieved using ADH from Thermoanaerobacter brockii, which yielded
301 mg L-1 BDO (100 mg L-1 day-1) with 50 mg L-1 of acetoin (17 mg L-1 day-1). However, ADH
from Clostridium beijernickii yielded the highest productivity with A. hydrophila ALDC,
952 mg L-1 BDO (320 mg L-1 day-1) with 61 mg L-1 acetoin (20 mg L-1 day-1) compared to
568 mg L-1 (190 mg L-1 day-1) with 59 mg L-1 acetoin (20 mg L-1 day-1) produced using ADH from
T. brockii. Long term 21-day culturing of these two strains yielded 2.38 g L-1 BDO with
C. beijernickii ADH and 1.97 g L-1 with T. brockii ADH (790 mg L-1 day-1 and 660 mg L-1 day-1,
respectively). When lacI was transcribed in these strains as a repressor, constitutive expression
was observed in the absence of the inducer IPTG, indicating the presence of leaky expression
within the construct. It was also observed that increasing enzyme expression did not lead to
21
increased product formation, suggesting a substrate limitation, likely of pyruvate. These two
factors have been addressed in the next two papers.
The first limitation addressed was that of pyruvate availability. Because metabolites from
the Calvin-Benson-Bassham (CBB) cycle are necessary for carbon fixation, much of the carbon in
central carbon metabolism is cycled within this pathway rather proceeding from
3-phosphoglycerate (3PGA) towards pyruvate (Figure 2.3) (Oliver and Atsumi 2015). This work
targeted the 3PGA to pyruvate pathway within the background of a previously optimized strain
containing alsS from B. subtilis, alsD from A. hydrophila, and adh from C. beijernickii.
Overexpressing the first enzyme phosphoglycerate mutase (pgm) in this pathway had no
significant effect, but overexpressing the final pyruvate kinase (pyk) led to a significant growth
defect. Total BDO production by these cells remained similar to the control strains, leading to an
increased per-cell productivity and a final titer around 20 mg L-1 for one strain (strain 9) after
96 hours (5 mg L-1 day-1). Overexpression of all three genes between 3PGA and pyruvate led to
slower growth compared to the control but also to a final titer up to 49 mg L-1 (12 mg L-1 day-1)
over 96 hours. Increasing the light intensity from 55 to 250 μmol photons m-2 s-1 and increasing
the starting culture density led to a peak production of 726 mg L-1 over 60 hours (290 mg L-1 day-1)
by strain 9 versus 535 mg L-1 produced by the control strain (214 mg L-1 day-1). Production by the
pyk overexpressing strain also increased to 500 mg L-1 over 60 hours (200 mg L-1 day-1), and
growth increased as well. Overexpression of the enzymes within the 3PGA to pyruvate pathway
under high light and high cell density conditions led to an almost 1.4-fold increase in BDO
productivity.
Nozzi et al. (2015) addressed the issue of leaky expression by using a superfolder green
fluorescent protein (sfGFP) as a reporter. After eliminating the promoter PLlacO1 as a source, leaky
22
expression was discovered in alsS and adh but not alsD. A bacterial promoter prediction program
identified four and three potential promoter sites, respectively, but testing each site showed the
leaky expression was a cumulative effect. The greatest constitutive promoter effect was detected
in alsS. ADH activity increased when placed directly downstream of this gene. Rearranging the
enzyme order from alsS-alsD-adh to alsD-alsS-adh successfully suppressed expression in the
absence of IPTG. This led to lower productivity (45 mg L-1 OD730-1 versus 125 mg L-1 OD730
-1 with
addition of 1 mM IPTG). However, this was because the leaky expression led to higher
accumulation of BDO before IPTG addition in the base strain. This final article highlighted sources
of leaky expression in exogenous or overexpressed genes and illustrated the tightness in control
that may be achieved by modifying gene order.
The 2,3-butanediol synthesis pathway has been successfully introduced into cyanobacteria.
These analyses highlight a primary difference between two commonly-used strains, Synechocystis
and S. elongatus, that is, that the former exhibits higher tolerance to potentially toxic products
(Kämäräinen et al. 2012). Metabolic engineering platform decisions should consider this factor.
The highest productivity was observed in S. elongatus, peaking at 790 mg L-1 day-1 in a 21-day
production experiment (Oliver et al. 2013). Subsequent optimization resulted in further
improvement of this strain by increasing pyruvate through overexpression of enzymes within the
pathway from 3PGA to pyruvate. The productivity of the control in this experiment was lower
than the reported values in the previous paper, suggesting culture differences. However, the
enzyme overexpressing strain showed almost a 1.4-fold increase over the control strain under the
same conditions. The final optimization scheme of eliminating leaky expression is an especially
beneficial consideration in systems for which product formation involves growth-inhibiting steps,
for example, with the pyruvate kinase overexpression. By maintaining this control, cultures can be
23
grown to higher cell densities before product formation is induced, decoupling the two carbon
sinks and increasing carbon available for product synthesis.
Summary. Production of these two pyruvate derivatives show promise in increasing the
industrial feasibility of cyanobacteria. The primary benefit of cyanobacteria over more rapidly
growing bacteria is its ability to fix CO2. More recently, a group introduced CO2-fixing
mechanisms within the heterotrophic E. coli (Gong et al. 2015). However, the fixed carbon
accounted for less than 20% of carbon entering central carbon metabolism, representing
mixotrophic growth, which is already feasible in many strains of cyanobacteria, including
Synechocystis. The engineering approaches successfully applied within the optimized strains
presented within this literature review include the following:
1) engineering genes, including promoter and ribosome binding site optimization, gene
codon optimization, and gene order optimization,
2) eliminating pathways competing for the pyruvate, specifically PHB synthesis,
3) optimizing enzymes introduced, either by screening exogenous genes or by evaluating
the potential of endogenous genes, and
4) adjusting culture conditions, from altering media additives to fit the genes of interest
to increasing cell density to account for low growth/high product strains.
These steps consistently yielded increases in product formation and provide avenues for increasing
the productivity of cyanobacteria.
24
CHAPTER III
SIMULATION STUDY OF METABOLIC FLUX ANALYSIS
Introduction
Metabolic flux analysis (MFA) is a mathematical modeling approach used to determine
flow of material through intracellular biochemical pathways comprehensively (Nielsen 2003;
Sauer 2006; Stephanopoulos 1999; Wiechert 2001). The final outcome of MFA is a flux map that
depicts the in vivo activity of metabolic enzymes. This information can be used (i) to identify major
intracellular pathways and critical branch points in the metabolic network, (ii) to calculate rates of
otherwise unmeasurable pathways, and (iii) to determine maximum theoretical yields for synthesis
of products or biomass from complex, integrated biochemical pathways (Woolston et al. 2013).
However, MFA is most useful when flux comparisons can be made between different strains or
growth conditions and also when combined with other phenotypic data sets. This enables
researchers (i) to understand flux control at metabolic branch points (Vallino and Stephanopoulos
1994), (ii) to identify kinetic or regulatory bottlenecks in the metabolic network (Antoniewicz et
al. 2007), and (iii) to identify targets for re-routing flux to desirable end products (or away from
wasteful byproducts). One classic example that illustrates the application of MFA for rational
target selection is the overproduction of lysine in the soil bacterium Corynebacterium glutamicum,
which has been expertly summarized by Koffas and Stephanopoulos (2005).
MFA begins with translation of available biochemical and genomic information into a set
of mathematical equations representing metabolite mass balances. This system of equations can
be augmented by various thermodynamic and/or regulatory constraints. Stoichiometric MFA
25
approaches apply these balance equations to solve for intracellular fluxes based on measurements
of extracellular substrate consumption or product formation rates. However, the system of mass
balance equations is typically underdetermined for realistic metabolic networks, and therefore, it
is not possible to solve for all intracellular fluxes without making additional ad hoc assumptions.
In this case, optimization-based or constraint-based methods are often applied to explore the space
of possible solutions, rather than attempting to identify a unique flux solution. Alternatively,
additional measurements derived from isotope labeling experiments (ILEs) can be used to generate
an overdetermined system of equations that can be solved using least-squares regression. ILE are
accomplished using substrates with isotopically labeled atoms, typically carbon-13 (13C) or
deuterium (2H). This allows the metabolic model to be expanded to include mass isotope isomer
(isotopomer) balances of individual metabolites in addition to overall mass balances, altogether
providing the mathematical basis for 13C MFA calculations.
Two different 13C MFA approaches have been applied to cyanobacteria: steady-state MFA
(SS-MFA) and isotopically nonstationary MFA (INST-MFA) (Figure 2.1). A brief review of these
applications is found in Chapter 2. The term “steady-state” refers to isotopic steady state, in which
labeling measurements are obtained after 13C from introduced substrates has fully incorporated
into intracellular metabolites. Ideally, the experiment is performed in a continuous culture to
maintain metabolic steady state throughout the ILE. Alternatively, cells growing exponentially
(rapidly dividing) in batch culture may be used to approximate metabolic steady state conditions.
The isotope tracer for SS-MFA is typically a mixture of 13C-labeled glucose analogs, the
composition of which is selected to maximize flux precision within the pathways of interest
(Antoniewicz 2013). Under these conditions, cyanobacteria exhibit mixotrophic or heterotrophic
metabolism. INST-MFA becomes necessary for studies of autotrophic metabolism. In autotrophic
26
cultures, the condition of isotopic steady state is no longer ideal because addition of single carbon
tracers (13CO2 or NaH13CO3) results in a uniform 13C-labeling pattern in the downstream
metabolites. These steady-state labeling measurements fail to reflect carbon atom rearrangements
within the network (Shastri and Morgan 2007). Rather, transient measurements of isotope
incorporation following a feed switch from natural H12CO3- to enriched H13CO3
- are used to
estimate autotrophic fluxes in INST-MFA (Young et al. 2011).
Recently, a package of MATLAB routines, called INCA (Isotopomer Network
Compartmental Analysis), was developed to automate the computational workflow of INST-MFA
(Young 2014). This program solves the coupled system of ordinary differential equations that
comprise the transient isotopomer balances. INCA relies on the elementary metabolite unit
framework to simulate transient 13C labeling experiments efficiently (Young et al. 2008), allowing
for application of INST-MFA to metabolic networks of arbitrary size and complexity. As with
SS-MFA, the biological system must be maintained at metabolic steady state throughout the
labeling time course, but INST-MFA tracer experiments are performed on a time scale of minutes
rather than hours to assess the dynamics of 13C incorporation (Nöh and Wiechert 2006). Rapid
sampling and cold-quenching of cells are required to arrest the in vivo labeling state of central
carbon metabolites, which is then measured in cell extract samples using mass spectrometry
(Jazmin et al. 2014; Jazmin and Young 2013).
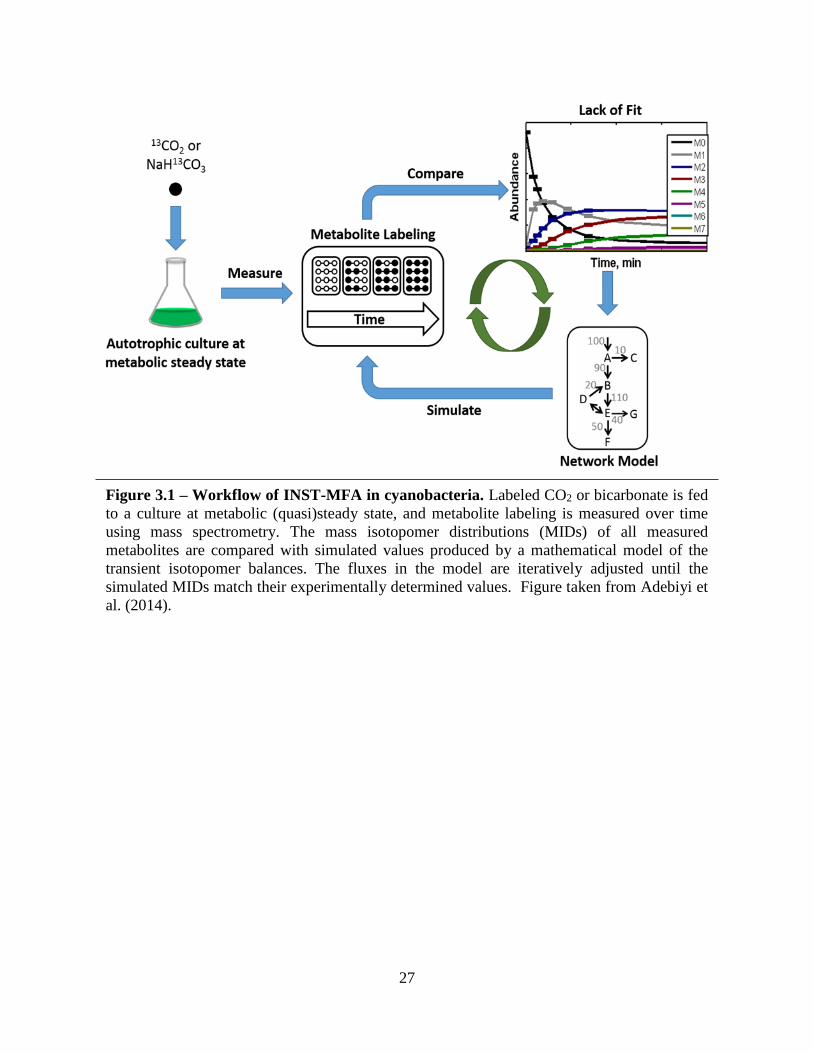
In INST-MFA, a stable isotopically labeled carbon source is introduced to cells, and the
labeling of the intracellular metabolites is measured over a series of time points (Figure 3.1). Gas
chromatography with mass spectrometry (GC/MS) is used to quantify the mass isotopomer
distribution of each metabolite at each time point. This yields a large amount of data. To aid in
simplifying this method of analysis, a previous model was probed to assess if there exists a minimal
27
Figure 3.1 – Workflow of INST-MFA in cyanobacteria. Labeled CO2 or bicarbonate is fed
to a culture at metabolic (quasi)steady state, and metabolite labeling is measured over time
using mass spectrometry. The mass isotopomer distributions (MIDs) of all measured
metabolites are compared with simulated values produced by a mathematical model of the
transient isotopomer balances. The fluxes in the model are iteratively adjusted until the
simulated MIDs match their experimentally determined values. Figure taken from Adebiyi et
al. (2014).
28
set of data that could be inputted into INCA and yield a reliable set of flux estimates. The following
sections provide data on subsets of metabolite and time points, emphasizing which groupings most
affected flux uncertainties and highlighting their significance within the metabolic model.
Method
The precision of flux estimates obtained from INST-MFA is dependent upon the
measurement of metabolite labeling within the pathways of interest. In order to assess the relative
importance of the measurements included in a prior cyanobacteria study (Young et al. 2011), the
same model and flux estimates were used to simulate time-course mass isotopomer measurements
at the times listed in Table 3.1. Then best-fit model parameters were estimated using the full
complement of MS measurements and assuming 0.5 mol% uncertainties on all values (Base Case
model). Next, all of the mass isotopomer measurements used for the simulation were separated
into one of six groups based on their location within the metabolic network (Table 3.2 and
Figure 2.2) and the fluxes were re-estimated after inactivating each group, separately. Inactivating
measurements did not change the best-fit values of the estimated fluxes, but the estimated
uncertainties fluctuated in several cases.
To precisely quantify flux uncertainties, 95% confidence intervals (CIs), indicating the
range of feasible flux values given the available data, were computed for the following six net
fluxes, which together span the null space of the stoichiometric matrix and represent all
independent degrees of freedom for the model: glucose-6-phosphate (G6P) dehydrogenase
(G6PDH), part of the oxidative pentose phosphate pathway (oxPPP); ribulose-1,5-bisphosphate
(RUBP) carboxylase (RBC) and sedoheptulose-1,7-bisphophatase (SBPase), both from the
Calvin-Benson-Bassham (CBB) cycle; RUBP oxygenase (RBCOX) of the photorespiratory (PR)
29
Table 3.1 – Simulated time points for mass
isotopomer measurements.
Time points are calculated as suggested by Nöh
and Wiechert (2006) using ti = abi-1 for a = 20
and b = 1.525. Exact times were rounded as
shown. Table taken from Adebiyi et al. (2014).
Table 3.2 – Ion fragment groupings by pathway.
The mass spectrometry metabolite ion fragments from the original INST-MFA model (Young
et al. 2011) were placed into groups based on pathway and size. Pathways include Calvin-
Benson-Bassham cycle, tricarboxylic acid (TCA) cycle, PEP-MAL cycle, photorespiration, and
the oxidative pentose phosphate pathway. Abbreviations: 3PGA: 3-phosphoglycerate; CIT:
citrate; DHAP: dihydroxyacetone phosphate; F6P: fructose-6-phosphate; FUM: fumarate;
G6P: glucose-6-phosphate; GA: glycerate; GAP: glyceraldehyde-3-phosphate; MAL: malate;
PEP: phosphoenolpyruvate; R5P: ribose-5-phosphate; RUBP: ribulose-1,5-bisphosphate;
RU5P: ribulose-5-phosphate; S7P: sedoheptulose-7-phosphate; SUC: succinate. Table taken
from Adebiyi et al. (2014).
30
pathway; malic enzyme (ME) of the phosphoenolpyruvate (PEP) cycle (PEP-cyc: formed by PEP
carboxylase, malate dehydrogenase, and malic enzyme); and malate synthase (MS) of the
tricarboxylic acid cycle glyoxylate shunt. A group of metabolites was considered to contribute
significantly to the flux uncertainty if the value increased over an arbitrary threshold of 1.5-fold in
response to inactivation of the metabolites. Any groups found to be significant based on this
criterion were further examined by inactivating each individual metabolite within the group to
determine which contributed the most towards the observed increase in flux uncertainty.
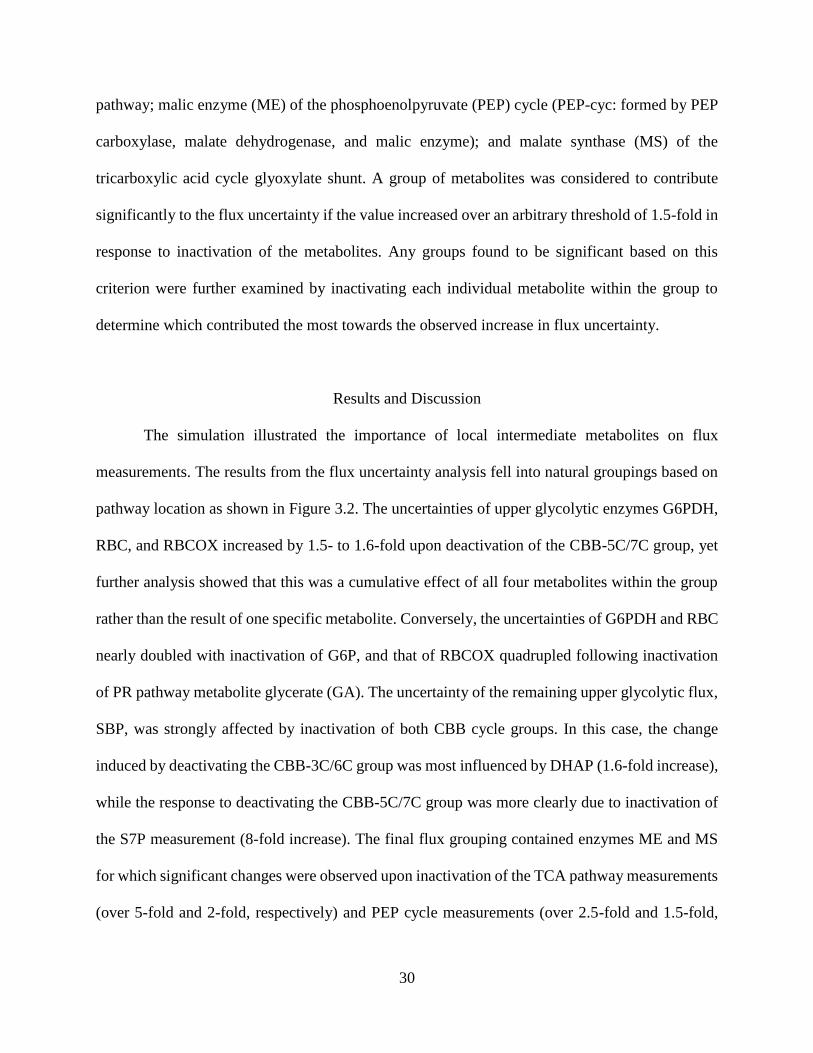
Results and Discussion
The simulation illustrated the importance of local intermediate metabolites on flux
measurements. The results from the flux uncertainty analysis fell into natural groupings based on
pathway location as shown in Figure 3.2. The uncertainties of upper glycolytic enzymes G6PDH,
RBC, and RBCOX increased by 1.5- to 1.6-fold upon deactivation of the CBB-5C/7C group, yet
further analysis showed that this was a cumulative effect of all four metabolites within the group
rather than the result of one specific metabolite. Conversely, the uncertainties of G6PDH and RBC
nearly doubled with inactivation of G6P, and that of RBCOX quadrupled following inactivation
of PR pathway metabolite glycerate (GA). The uncertainty of the remaining upper glycolytic flux,
SBP, was strongly affected by inactivation of both CBB cycle groups. In this case, the change
induced by deactivating the CBB-3C/6C group was most influenced by DHAP (1.6-fold increase),
while the response to deactivating the CBB-5C/7C group was more clearly due to inactivation of
the S7P measurement (8-fold increase). The final flux grouping contained enzymes ME and MS
for which significant changes were observed upon inactivation of the TCA pathway measurements
(over 5-fold and 2-fold, respectively) and PEP cycle measurements (over 2.5-fold and 1.5-fold,
31
Fig
ure
3.2
– E
ffec
t of
rem
ovin
g m
easu
rem
ents
on
flu
x u
nce
rtain
ties
. G
roups
of
mea
sure
men
ts (
G1
–G
6)
wer
e in
acti
vat
ed
in t
he
model
, an
d t
he
95
% c
on
fiden
ce i
nte
rval
(C
I) w
idth
fo
r ea
ch o
f si
x i
ndep
enden
t fl
uxes
was
rec
alcu
late
d a
nd c
om
par
ed t
o
the
Bas
e C
ase
model
, w
hic
h i
ncl
udes
all
mea
sure
men
ts e
xam
ined
by Y
oung e
t al
. (2
011).
If
the
CI
wid
th i
ncr
ease
d o
ver
an
arbit
rary
thre
shold
of
1.5
-fold
, th
e an
alysi
s w
as r
epea
ted f
or
each
indiv
idual
met
aboli
te w
ithin
the
gro
up t
o d
eter
min
e w
hic
h
one(
s) c
ontr
ibute
d m
ost
to t
he
obse
rved
incr
ease
. S
ee T
able
3.2
for
a li
st o
f m
easu
rem
ents
incl
uded
in e
ach g
roup.
X-a
xes
are
alig
ned
ver
tica
lly;
y-a
xes
are
ali
gned
ho
rizo
nta
lly w
ith t
he
exce
pti
on o
f S
BP
. F
igure
tak
en f
rom
Adeb
iyi
et a
l. (
2014).
32
respectively). Citrate contributed the most towards the importance of the TCA group, although no
single measurement within this group was responsible for the entirety of the observed effect on
either ME or MS. Inactivation of MAL alone led to a nearly 2.5-fold increase in the ME uncertainty
and over a 1.5-fold change in the MS uncertainty. Interestingly, inactivation of GA of the PR
pathway led to an almost 4-fold increase in the MS uncertainty because the MS substrate,
glyoxylate, is also an intermediate of the PR pathway (Figure 2.2).
In general, each enzyme’s substrate(s) and product(s) affected the flux uncertainty most
significantly. Availability of these measurements directly improves the reliability of flux
estimations by constraining the intermediate balance equations. Without this information, the
program must estimate flux values based on less direct measurements. In cyclic pathways or
reversible reactions, these metabolites become even more necessary, as seen with SBP.
Furthermore, product measurements aid in estimating flux distribution between branched
pathways, for example, between RBC and RBCOX. A number of metabolites across central carbon
metabolism are becoming detectable using GC/MS (Wegner et al. 2014).
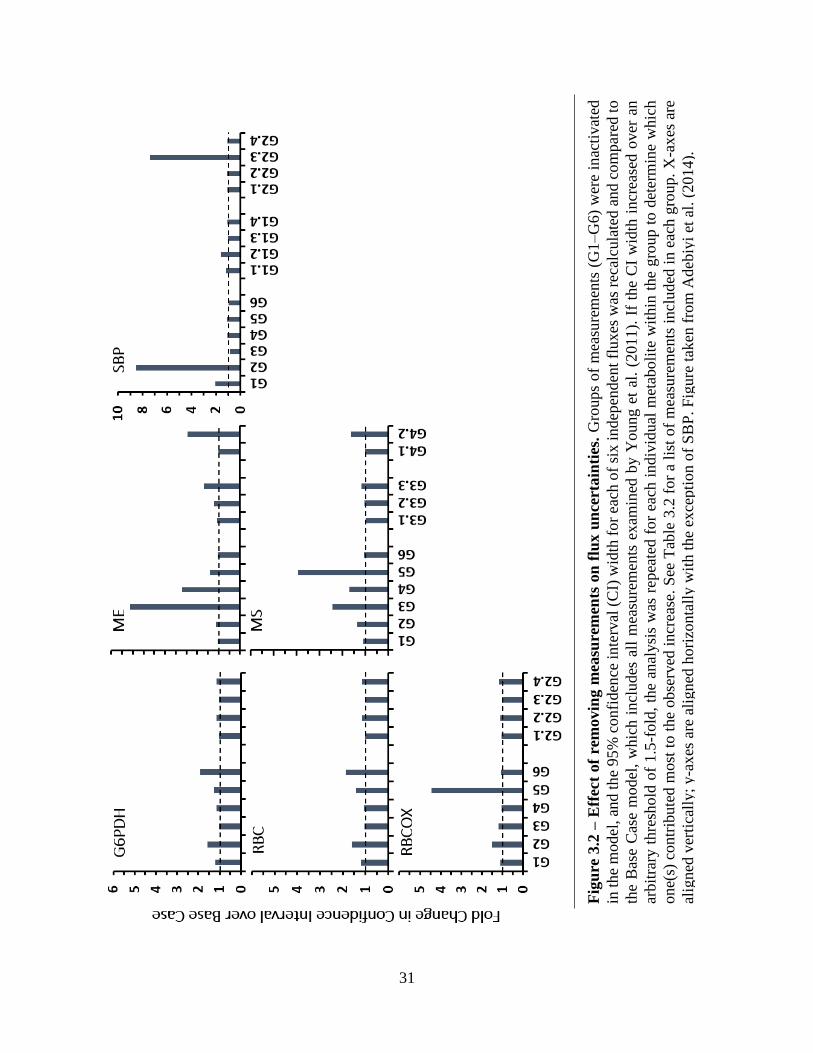
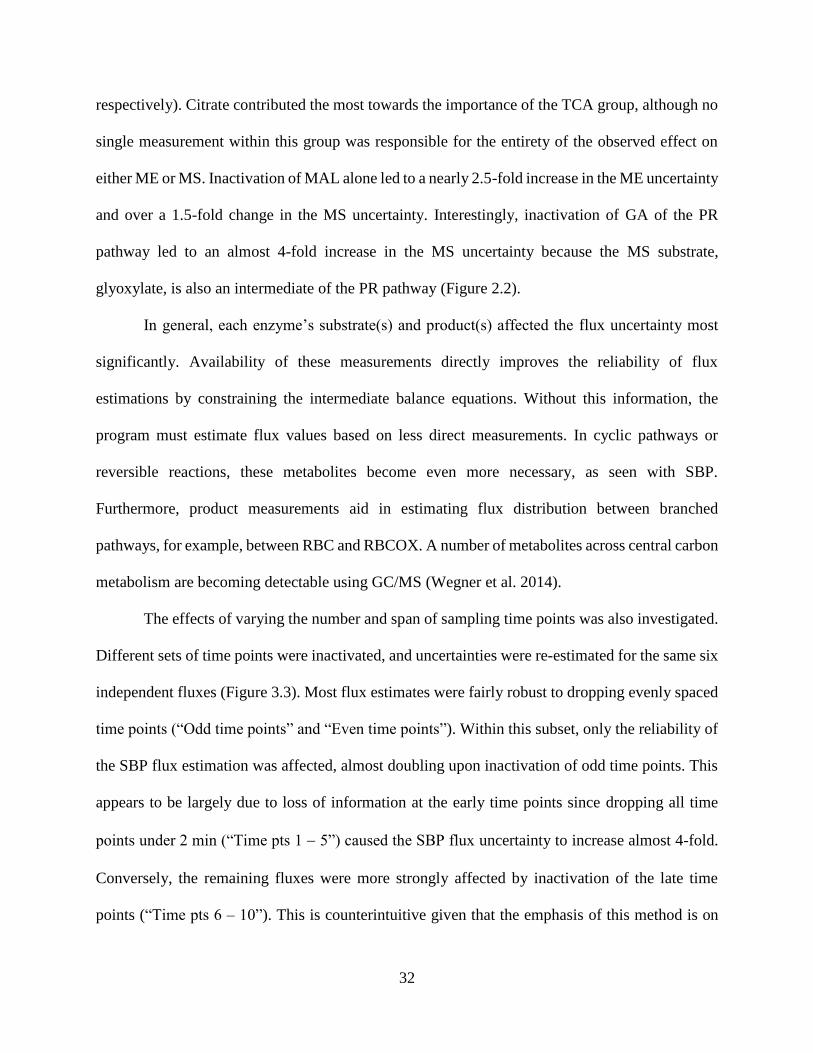
The effects of varying the number and span of sampling time points was also investigated.
Different sets of time points were inactivated, and uncertainties were re-estimated for the same six
independent fluxes (Figure 3.3). Most flux estimates were fairly robust to dropping evenly spaced
time points (“Odd time points” and “Even time points”). Within this subset, only the reliability of
the SBP flux estimation was affected, almost doubling upon inactivation of odd time points. This
appears to be largely due to loss of information at the early time points since dropping all time
points under 2 min (“Time pts 1 5”) caused the SBP flux uncertainty to increase almost 4-fold.
Conversely, the remaining fluxes were more strongly affected by inactivation of the late time
points (“Time pts 6 – 10”). This is counterintuitive given that the emphasis of this method is on
33
Figure 3.3 – Changes in flux uncertainties following time point
inactivation. (a) Time points from Table 3.1 were inactivated in
combinations as listed to determine their effect on flux uncertainty.
(b) Time points are optimized to include transient 13C incorporation
labeling. The dotted line separates time points 1 – 5 from 6 – 10.
Figure taken from Adebiyi et al. (2014).
34
transient incorporation of labeled carbon into intracellular metabolites. Overall, the initial time
point and a small subset of the final time points are concluded to be sufficient for an initial flux
estimate, though the remaining time points are still necessary to increase flux precision, as noted
in comparison of “all except pts 4,7,10” to “even time points” in Figure 3.3.
Conclusion
This simulation study has provided new insights into the requirements for flux estimation
using INST-MFA. The study illustrates the importance of metabolites representative of the
pathways and enzymes to be observed. Specifically, the substrates and products should be included
where possible, especially in cyclic or branched pathways. For time points, a reliable flux
estimation may be generated using only the initial time point and three time points approaching
steady-state enrichment. A select subset of the previous data has been shown as sufficient to
provide an initial estimate of the six flux values using this criteria (Figure Appendix A.2).
However, increasing the number of metabolites and the number of time points will aid in increasing
accuracy and lowering the uncertainty of the flux estimates by increasing redundancy.
35
CHAPTER IV
ENGINEERING OF CYANOBACTERIA FOR INCREASED ALDEHYDE PRODUCTION
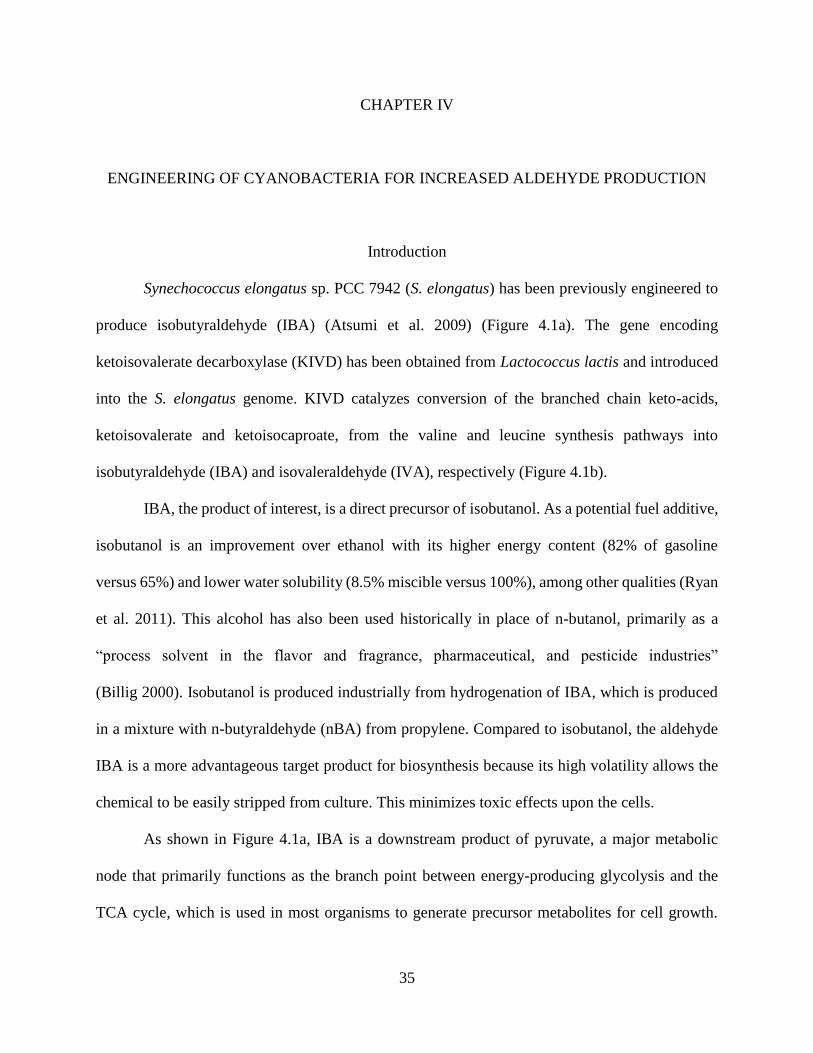
Introduction
Synechococcus elongatus sp. PCC 7942 (S. elongatus) has been previously engineered to
produce isobutyraldehyde (IBA) (Atsumi et al. 2009) (Figure 4.1a). The gene encoding
ketoisovalerate decarboxylase (KIVD) has been obtained from Lactococcus lactis and introduced
into the S. elongatus genome. KIVD catalyzes conversion of the branched chain keto-acids,
ketoisovalerate and ketoisocaproate, from the valine and leucine synthesis pathways into
isobutyraldehyde (IBA) and isovaleraldehyde (IVA), respectively (Figure 4.1b).
IBA, the product of interest, is a direct precursor of isobutanol. As a potential fuel additive,
isobutanol is an improvement over ethanol with its higher energy content (82% of gasoline
versus 65%) and lower water solubility (8.5% miscible versus 100%), among other qualities (Ryan
et al. 2011). This alcohol has also been used historically in place of n-butanol, primarily as a
“process solvent in the flavor and fragrance, pharmaceutical, and pesticide industries”
(Billig 2000). Isobutanol is produced industrially from hydrogenation of IBA, which is produced
in a mixture with n-butyraldehyde (nBA) from propylene. Compared to isobutanol, the aldehyde
IBA is a more advantageous target product for biosynthesis because its high volatility allows the
chemical to be easily stripped from culture. This minimizes toxic effects upon the cells.
As shown in Figure 4.1a, IBA is a downstream product of pyruvate, a major metabolic
node that primarily functions as the branch point between energy-producing glycolysis and the
TCA cycle, which is used in most organisms to generate precursor metabolites for cell growth.
36
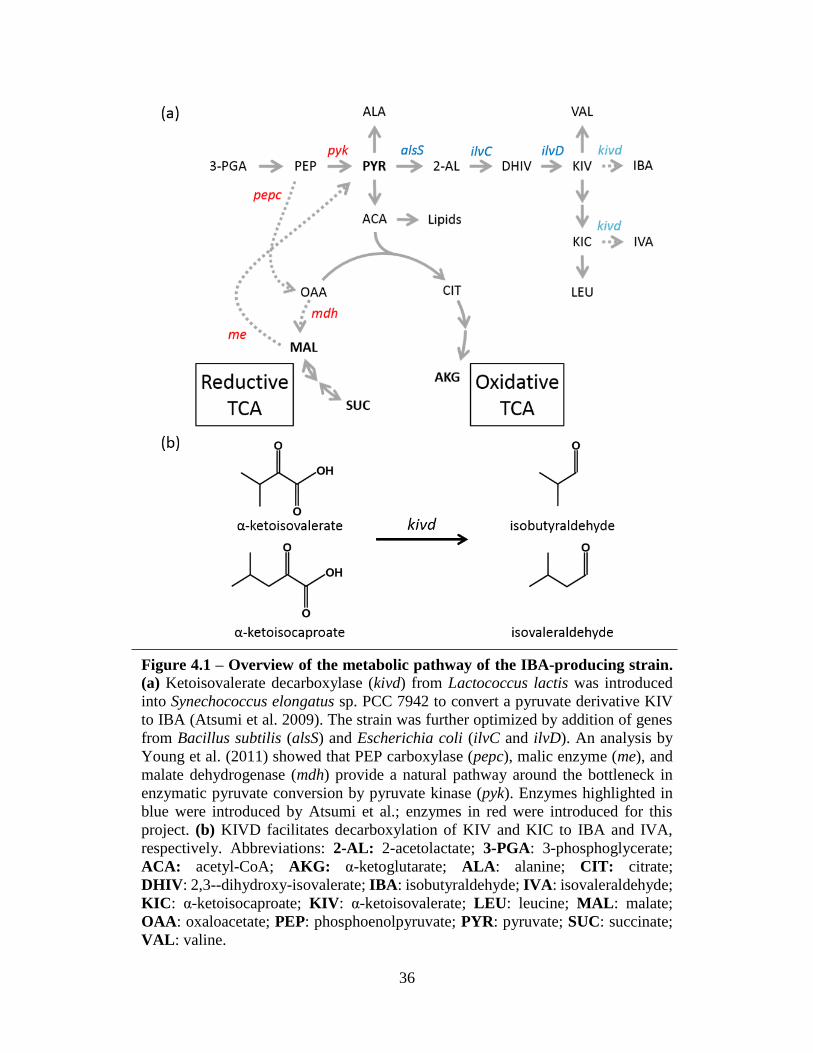
Figure 4.1 – Overview of the metabolic pathway of the IBA-producing strain.
(a) Ketoisovalerate decarboxylase (kivd) from Lactococcus lactis was introduced
into Synechococcus elongatus sp. PCC 7942 to convert a pyruvate derivative KIV
to IBA (Atsumi et al. 2009). The strain was further optimized by addition of genes
from Bacillus subtilis (alsS) and Escherichia coli (ilvC and ilvD). An analysis by
Young et al. (2011) showed that PEP carboxylase (pepc), malic enzyme (me), and
malate dehydrogenase (mdh) provide a natural pathway around the bottleneck in
enzymatic pyruvate conversion by pyruvate kinase (pyk). Enzymes highlighted in
blue were introduced by Atsumi et al.; enzymes in red were introduced for this
project. (b) KIVD facilitates decarboxylation of KIV and KIC to IBA and IVA,
respectively. Abbreviations: 2-AL: 2-acetolactate; 3-PGA: 3-phosphoglycerate;
ACA: acetyl-CoA; AKG: α-ketoglutarate; ALA: alanine; CIT: citrate;
DHIV: 2,3--dihydroxy-isovalerate; IBA: isobutyraldehyde; IVA: isovaleraldehyde;
KIC: α-ketoisocaproate; KIV: α-ketoisovalerate; LEU: leucine; MAL: malate;
OAA: oxaloacetate; PEP: phosphoenolpyruvate; PYR: pyruvate; SUC: succinate;
VAL: valine.
37
Additionally, pyruvate is the direct precursor of the proteinogenic amino acids alanine, valine,
leucine, and isoleucine. In metabolic engineering of cyanobacteria, pyruvate has found use as a
major precursor for production of several biofuels and biochemicals (Angermayr et al. 2015). A
brief review of two more pyruvate derivatives and metabolic engineering efforts applied towards
increasing productivity in cyanobacteria was provided in the Literature Review in Chapter 2.
Pyruvate is formed by pyruvate kinase (PYK) as the final step of glycolysis. PYK catalyzes
conversion of phosphoenolpyruvate (PEP) to pyruvate. High levels of ATP, produced in
abundance during photosynthesis, have been found to inhibit PYK activity (Knowles et al. 2001).
Decreased PYK flux has been observed in vivo by an isotopically nonstationary metabolic flux
analysis (INST-MFA) of the cyanobacterium Synechocystis sp. PCC 6803 under photoautotrophic
conditions (Young et al. 2011). In the analysis, a natural PYK bypass was noted in which carbon
was channeled from PEP into pyruvate through a three-step pathway involving PEP carboxylase
(PEPC), malate dehydrogenase (MDH), and malic enzyme (ME) (Figure 4.1a). Based on the
INST-MFA results, a comparable amount of pyruvate was produced through this bypass rather
than through PYK (5.3 ± 0.8 moles of ME flux per 100 moles of CO2 assimilated versus
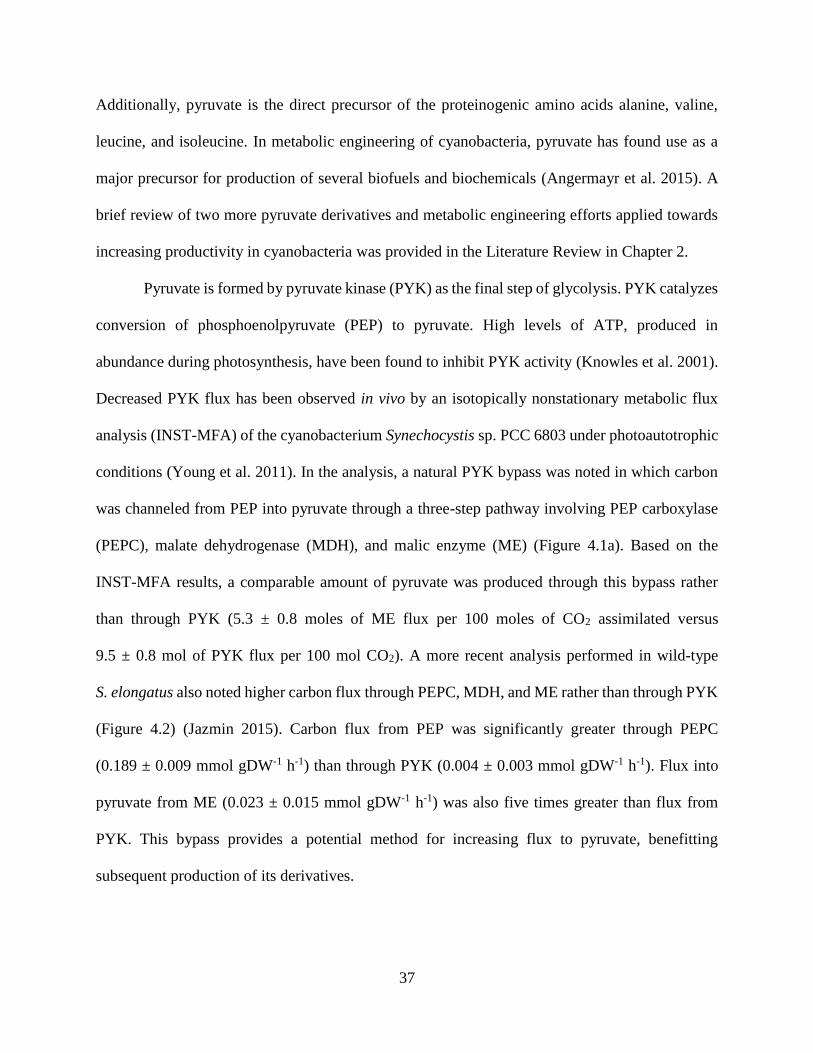
9.5 ± 0.8 mol of PYK flux per 100 mol CO2). A more recent analysis performed in wild-type
S. elongatus also noted higher carbon flux through PEPC, MDH, and ME rather than through PYK
(Figure 4.2) (Jazmin 2015). Carbon flux from PEP was significantly greater through PEPC
(0.189 ± 0.009 mmol gDW-1 h-1) than through PYK (0.004 ± 0.003 mmol gDW-1 h-1). Flux into
pyruvate from ME (0.023 ± 0.015 mmol gDW-1 h-1) was also five times greater than flux from
PYK. This bypass provides a potential method for increasing flux to pyruvate, benefitting
subsequent production of its derivatives.
38
Figure 4.2 – Comparison of flux into pyruvate. The combination of
PEP carboxylase (PEPC), malate dehydrogenase (MDH), and malic
enzyme (ME) form a natural pyruvate kinase (PYK) bypass to increase
carbon flux to pyruvate. 13C MFA analysis of S. elongatus was used to
estimate the flux through each enzyme. Data ± SEM; n = 3; **p < 0.01.
39
The IBA-producing cyanobacteria have been engineered through overexpression of each
bypass pathway gene: PEPC, MDH, and ME (Table 4.1). For comparison, the PYK enzyme has
also been overexpressed within the IBA-producing strain. This set of single-gene overexpression
strains comprise the initial set for characterization. The strains showing the greatest increase in
IBA production compared to the base strain will be selected as the background for double- and
triple-gene overexpressions with the objective of maximizing carbon flux within this bypass
pathway to increase flux to pyruvate and, ultimately, IBA.
Method
Culture conditions. Experiments were performed with three biological replicates per strain
in BG11 media1 modified with the addition of 50 mM NaHCO3. Each strain was inoculated to a
starting optical density (OD750nm) of 0.4 in 75 mL. Temperature was maintained at 30°C in a water
bath on a platform shaker set to 130 rpm. To begin, the cultures were placed in the dark to
synchronize the circadian rhythm of the cells. Flasks were removed from the dark after 12 hours
and returned to the water bath under a light intensity of 150 μE m-2 s-1. The cultures were induced
with 1 mM isopropyl-beta-D-thiogalactopyranoside (IPTG) to begin expression of the introduced
genes. Measurements began six hours after induction.
Strain construction. The base IBA-producing strain was obtained from the lab of James
Liao in University of California – Los Angeles. Further engineering was performed by Yao Xu
and Lara Jazmin of Vanderbilt University. Each enzyme for overexpression was cloned into a
vector encoding carbenicillin resistance. Genes were placed under control of the promoter lacP for
1 BG-11 medium contains the following per 1 L of deionized water: 1.5 g NaNO3, 0.04 g K2HPO4, 0.075 g MgSO4,
0.036 g CaCl2, 0.012 g FeNH4, 0.001 g Na2EDTA, 0.02 g Na2CO3, and 1 mL of trace element mix A5 [2.86 g L-1 H3BO3,
1.81 g L-1 MnCl2, 0.222 g L-1 ZnSO4, 0.391 g L-1 Na2MoO4, 0.079 g L-1 CuSO4, 0.0494 g L-1 Co(NO3)2].
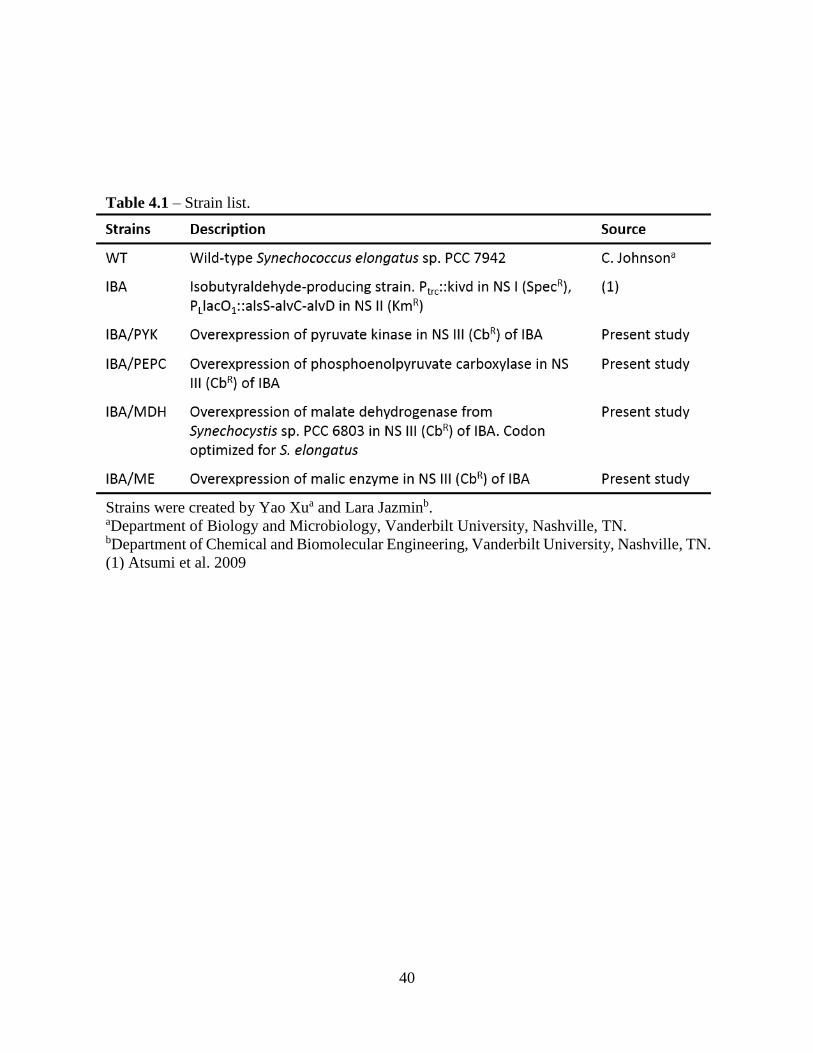
40
Table 4.1 – Strain list.
Strains were created by Yao Xua and Lara Jazminb. aDepartment of Biology and Microbiology, Vanderbilt University, Nashville, TN. bDepartment of Chemical and Biomolecular Engineering, Vanderbilt University, Nashville, TN.
(1) Atsumi et al. 2009
41
induction by IPTG. Upon selective pressure, the cells incorporated the plasmids into their
chromosome, resulting in a stable recombination. The genes encoding malic enzyme and
phosphoenolpyruvate carboxylase were cloned from wild-type S. elongatus. Malate
dehydrogenase was obtained from Synechocystis sp. PCC 6803 and codon optimized for insertion
into the S. elongatus strain.
Growth experiments. Growth was monitored over a 48-hour period during the exponential
growth phase. The time period was chosen to encompass at least one doubling time. Rates were
calculated using the MATLAB-based software package called ETA (Extracellular Time-course
Analysis) (Murphy and Young 2013) and compared to wild-type S. elongatus. Significant
decreases in growth rate of the engineered strains compared to the controls indicated increased
metabolic burden.
Quantification of aldehydes. IBA and IVA were readily stripped from the liquid culture
due to their high volatility. Air was bubbled into rubber stoppered culture flasks, and the effluent
was condensed in a series of two cold traps containing 25 mL of 1,2-propanediol. The first trap
was placed on ice to condense water from the vapor; the second was placed in a chiller set to -28°C.
Samples were taken from the traps and analyzed in a gas chromatograph with flame ionization
detector (GC/FID)2 with 1 mM n-butyraldehyde (nBA) added as an internal standard to determine
aldehyde concentration. The parent IBA-strain served as the primary control while a wild-type
S. elongatus was used as a negative control.
Metabolite pool size measurements. Thirty hours after induction, a sample of 20 mL of
culture was drawn, rapidly added to a chilled PBS solution to quench metabolism, and placed on
2 The samples were run using a Shimadzu Scientific Instrument GC 2010 equipped with a DB-Wax column (Agilent
Technologies; 30 m x 0.20 μm x 0.20 mm ID). Temperatures were as follows: injection temperature, 210°C; detector
temperature, 250°C; column oven temperature program, 30°C for 6 minutes, ramp 30°C min-1 to 230°C then hold 6
minutes. Carrier gas used was helium. Injection volume was 0.5 μL using a split ratio of 10:1.
42
ice. Cells were pelleted out of solution and lysed to extract the intracellular metabolites. The polar
metabolites were first derivatized by dissolution in a methoxyamine (MOX; Pierce, Rockford, IL)
reagent. Following sonication and incubation, samples were reacted with N,O-
bis(trimethylsilyl)trifluoroacetamide (BSTFA) + 10% trimethylchlorosilane (TMCS) for further
derivatization and incubated overnight. Samples were then centrifuged to remove further
dissolved residue and analyzed using GC/MS3, using norvaline as an internal standard for
comparison among strains.
Results and Discussion
Strain characterization was accomplished by comparing carbon flux into two primary
sinks, biomass and aldehydes. Flux into biomass formation was measured as growth rate.
Introduction of new carbon-consuming pathways was expected to result in decreased growth as
carbon is redirected from biomass. However, among the strains, there was no significant difference
in growth rates (Figure 4.3). The average doubling time of 34 hours was higher than the reported
value of less than 14 hours in the same strain (Kuan et al. 2015). This was likely an effect of the
higher starting cell density in the batch culture (OD ≅ 0.4) resulting in self-shading of the
photoautotrophic cells. Comparison of growth rates in a six-day experiment that began at lower
cell densities (OD ≅ 0.05) supported this conclusion (Appendix A.3). The parent IBA-producing
strain trended towards slower growth (μ = 0.0203 ± 0.0012 h-1) in comparison to the wild-type
(WT) S. elongatus strain (μ = 0.0239 ± 0.0012 h-1). The remaining mutant strains exhibited growth
rates more consistent with the parent IBA-producing strain. The lowered rate suggests that less
3 Samples were run using an Agilent Technologies 7890 gas chromatograph equipped with a DB-35MS column
(Agilent; 30 m x 0.25 mm x 0.25 mm ID). Temperatures were as follows: injection temperature, 270°C; column oven
temperature program, 80°C for 5 minutes, ramp at 10°C min-1 to 320°C then hold 5 minutes. Carrier gas used was
helium. Injection volume was 1 μL, and samples were run in splitless mode.
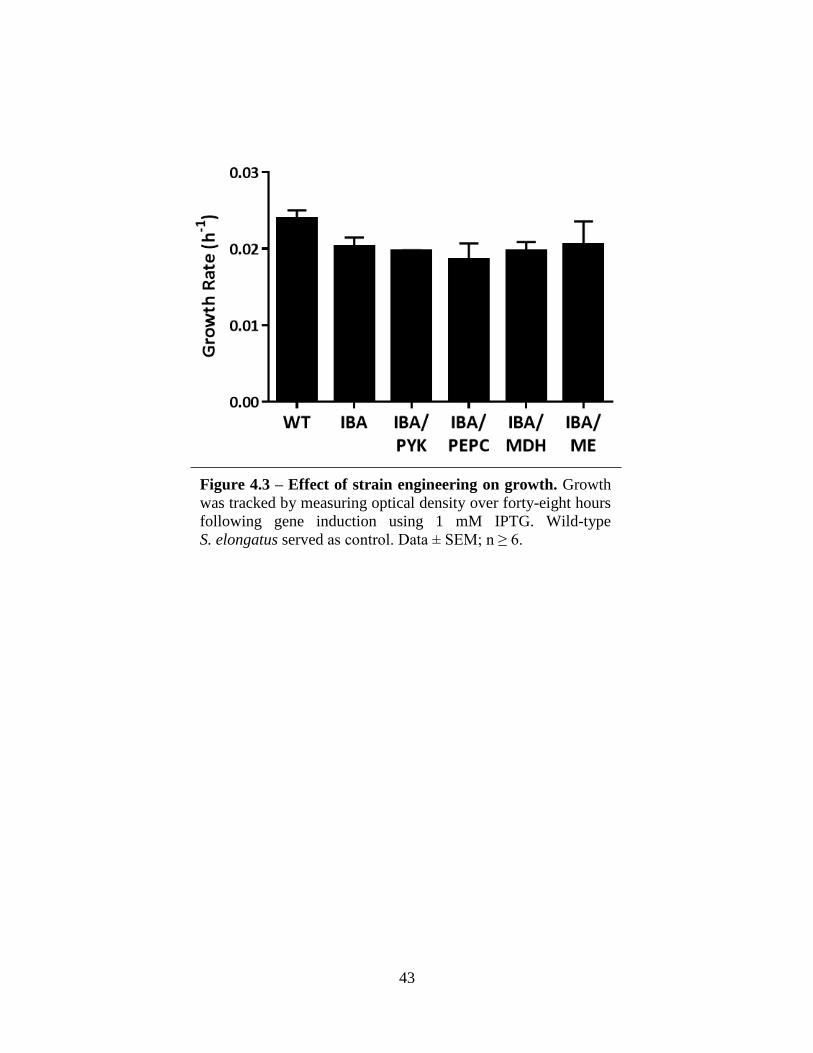
43
Figure 4.3 – Effect of strain engineering on growth. Growth
was tracked by measuring optical density over forty-eight hours
following gene induction using 1 mM IPTG. Wild-type
S. elongatus served as control. Data ± SEM; n ≥ 6.
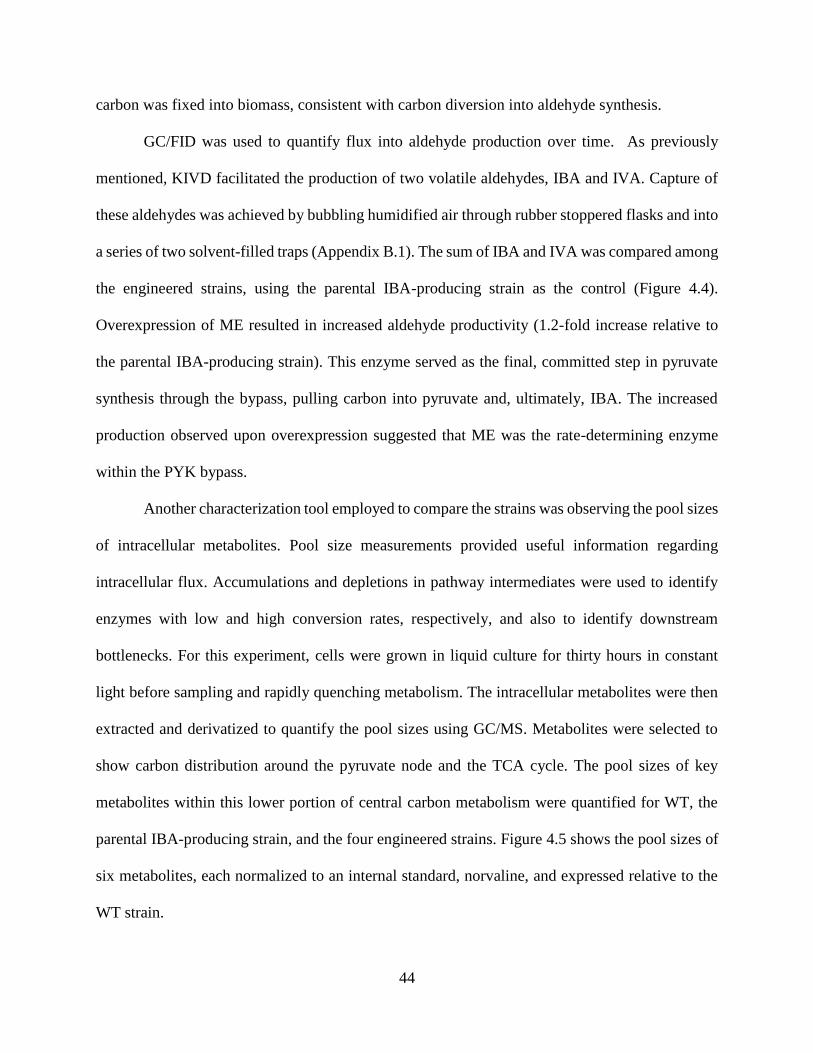
44
carbon was fixed into biomass, consistent with carbon diversion into aldehyde synthesis.
GC/FID was used to quantify flux into aldehyde production over time. As previously
mentioned, KIVD facilitated the production of two volatile aldehydes, IBA and IVA. Capture of
these aldehydes was achieved by bubbling humidified air through rubber stoppered flasks and into
a series of two solvent-filled traps (Appendix B.1). The sum of IBA and IVA was compared among
the engineered strains, using the parental IBA-producing strain as the control (Figure 4.4).
Overexpression of ME resulted in increased aldehyde productivity (1.2-fold increase relative to
the parental IBA-producing strain). This enzyme served as the final, committed step in pyruvate
synthesis through the bypass, pulling carbon into pyruvate and, ultimately, IBA. The increased
production observed upon overexpression suggested that ME was the rate-determining enzyme
within the PYK bypass.
Another characterization tool employed to compare the strains was observing the pool sizes
of intracellular metabolites. Pool size measurements provided useful information regarding
intracellular flux. Accumulations and depletions in pathway intermediates were used to identify
enzymes with low and high conversion rates, respectively, and also to identify downstream
bottlenecks. For this experiment, cells were grown in liquid culture for thirty hours in constant
light before sampling and rapidly quenching metabolism. The intracellular metabolites were then
extracted and derivatized to quantify the pool sizes using GC/MS. Metabolites were selected to
show carbon distribution around the pyruvate node and the TCA cycle. The pool sizes of key
metabolites within this lower portion of central carbon metabolism were quantified for WT, the
parental IBA-producing strain, and the four engineered strains. Figure 4.5 shows the pool sizes of
six metabolites, each normalized to an internal standard, norvaline, and expressed relative to the
WT strain.
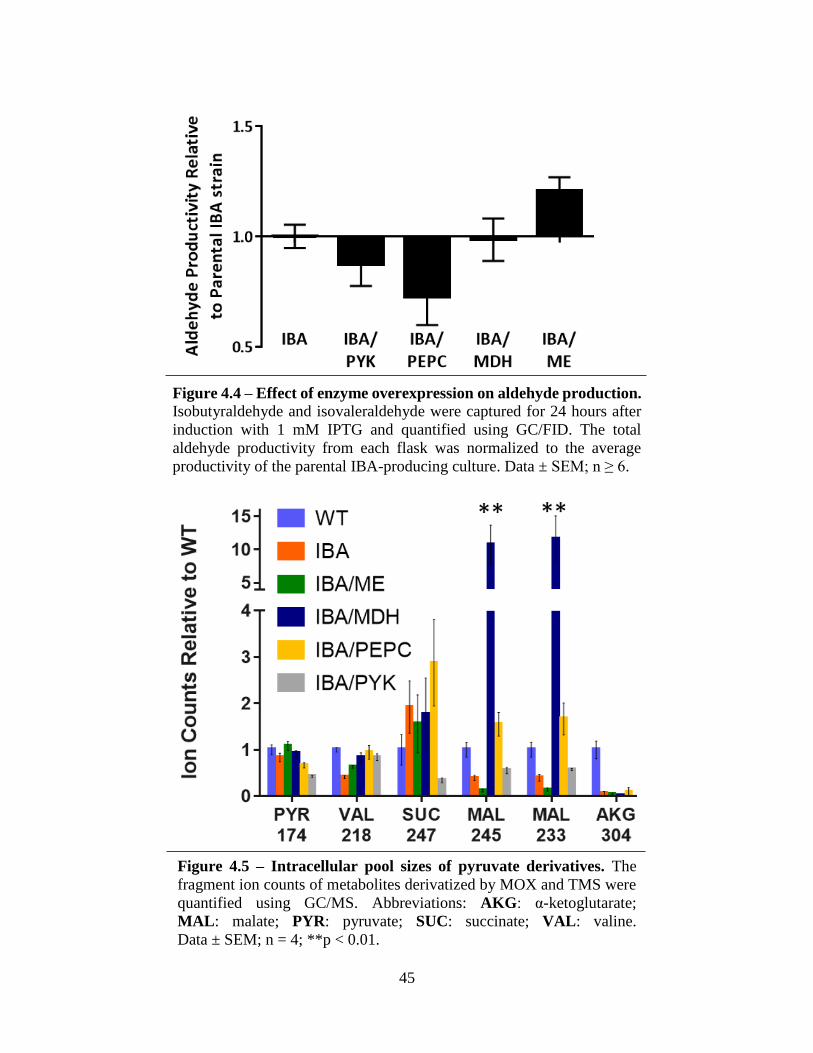
45
Figure 4.5 – Intracellular pool sizes of pyruvate derivatives. The
fragment ion counts of metabolites derivatized by MOX and TMS were
quantified using GC/MS. Abbreviations: AKG: α-ketoglutarate;
MAL: malate; PYR: pyruvate; SUC: succinate; VAL: valine.
Data ± SEM; n = 4; **p < 0.01.
Figure 4.4 – Effect of enzyme overexpression on aldehyde production.
Isobutyraldehyde and isovaleraldehyde were captured for 24 hours after
induction with 1 mM IPTG and quantified using GC/FID. The total
aldehyde productivity from each flask was normalized to the average
productivity of the parental IBA-producing culture. Data ± SEM; n ≥ 6.
46
Overexpression of PEPC, MDH, and ME showed preferential accumulation of metabolites
within the reductive branch of the TCA cycle. Cyanobacteria have an incomplete TCA cycle as
their genome does not encode the enzyme α-ketoglutarate dehydrogenase to catalyze conversion
of α-ketoglutarate (AKG) to succinate (SUC) (Figure 4.1). The reductive branch of the cycle
includes the MDH enzyme and terminates in SUC. The pool size of SUC showed a 1.5-fold to
3-fold increase in the parental IBA-producing strain and in strains overexpressing the PYK bypass
genes. This suggested that increased carbon entering the reductive branch of the TCA cycle
proceeded down the pathway to SUC rather than cycling up to pyruvate. Conversely,
overexpressing PYK decreased flux from PEP into this branch, as evidenced by the 65% decrease
in the SUC pool size with respect to WT and 80% decrease with respect to the parent
IBA-producing strain.
Malate (MAL) was another metabolite within the reductive branch that exhibited a
significant difference in pool size. In the MDH-overexpressing strain, the two MAL fragments
showed greater than 10-fold and 11-fold increases relative to the WT pool size (Figure 4.5). This
showed that MDH overexpression was successful in increasing carbon flux into MAL but unable
to increase flux into pyruvate. Conversely, 8-fold and 6-fold decreases were observed for the
fragments in the ME overexpression strain. These values identify ME as a pivotal enzyme within
the bypass pathway. This provides a physiological explanation as to why ME increased IBA
production and verifies the potential of the PYK bypass in increasing productivity of pyruvate
derivatives.
Conclusions
An alternate pathway was suggested and tested for increasing pyruvate. Successful increase
in pyruvate production was expected to increase production of pyruvate derivatives, IBA and IVA.

47
Single gene overexpression identified the rate-determining enzyme as ME. Overexpression of ME
resulted in depletion of the MAL pool into pyruvate for increased IBA formation. This provided
verification of the potential of this PYK bypass pathway for increasing formation of pyruvate
derivatives.
48
CHAPTER V
CONCLUSION
Summary
This thesis has focused on the application of metabolic engineering towards improving the
industrial potential of cyanobacteria. The chapters detail methods of analyses using MFA and
strain characterization. In this work, these methods were used to determine the metabolic
phenotype of different strains and to identify targets for further genetic engineering. The validated
analysis methods provide an effective toolset for subsequent strain engineering.
Chapter 3 discussed the simulation results of an INST-MFA application to cyanobacteria.
The goal was to determine a minimal data set that could be introduced to the computational
program and yield a reliable flux estimation. The metabolites that were found to exert the greatest
influence on the model were the substrates and products of the enzymes studied. Time points
approaching steady-state labeling most significantly affected the flux reliability, decreasing
uncertainty. Using this information, a minimal set of data was tested using simulated data and
experimental data (Appendix A). The analysis verified that the minimal set could be used to
estimate model fluxes. However, it also highlighted the benefit of a broader set, that is, to increase
the certainty and reliability of the flux estimation.
Chapter 4 provided data on the characterization of strains engineered to produce aldehydes.
The previous MFA analysis highlighted a bottleneck in production of pyruvate, the major
metabolite precursor, as evidenced by comparable flux through a bypass pathway. Each gene
within the bypass pathway was overexpressed to determine its effect on carbon flux towards
49
product. The malic enzyme overexpressing strain showed increased aldehyde productivity over
the base strain and was shown to deplete the precursor pool in favor of pyruvate formation. The
characterization results indicated potential targets for further genetic engineering.
Recommended Future Works
To further increase aldehyde productivity, the bypass genes, PEPC, MDH, and ME, may
be overexpressed in combination. Of the possible pairwise combinations, co-expression of ME
and MDH shows the most potential to improve productivity. From Chapter 4, it was observed that
MDH overexpression increased the malate pool while ME overexpression depleted it, suggesting
that, in combination, these enzymes could significantly increase pyruvate production. Conversely,
MDH-PEPC shows the least potential and will likely lead only to malate pooling, as observed in
overexpression of MDH. Overexpression of all three genes would be anticipated to increase
aldehyde production most significantly.
Exploration of productivity in cyanobacteria would benefit from metabolic flux analyses
of the overexpression strains characterized in this work. As discussed in the literature reviews,
MFA has been seldom applied to autotrophic cells. Only three articles have been published
applying INST-MFA to cyanobacteria (Hasunuma et al. 2013; Huege et al. 2011; Young et al.
2011) with only Young et al. yielding a flux map. INST-MFA of the ME-overexpressing strain
can be used to verify the conclusions derived from the metabolite pool study experiment. It may
also serve to identify pathways that could be knocked down or deleted to further increase carbon
for product formation.
50
Conclusion
This project addressed one of two primary drawbacks for implementation of cyanobacteria,
that is, productivity. However, further improvements can and should be made in this respect.
Continuous efforts towards building the cyanobacteria toolset will prove beneficial in increasing
its industrial feasibility. Justification for this exploration is that use of cyanobacteria has the
potential (i) to decrease dependence on nonrenewable resources, including crude oil,
(ii) to decrease side effects on the agricultural industry, resulting from use of arable land and
consumable feedstocks, and (iii) to reduce carbon dioxide levels in the atmosphere, reversing
effects of parallel industries. Cyanobacteria certainly illustrate potential, and industry will greatly
benefit from continued exploration in this regard.
51
APPENDIX A
SUPPLEMENTAL DATA
Minimal Data Set for INST-MFA
The conclusion from the simulation experiment was that (i) the substrates and products
should be included where possible, especially in cyclic or branched pathways and that, (ii) for time
points, a reliable flux estimation may be generated using only the initial time point and three time
points approaching steady-state enrichment. For verification, these criteria were applied to the
Synechocystis model using the simulated data as well as the experimental data. Actual
experimental error values were used for the experimental data set whereas the error for the
simulated data was set to 0.5 mol%. Seven metabolites were initially selected, but an eighth
metabolite was needed to bound the confidence intervals for the experimental data (Table A.1).
Four time points were chosen as suggested (Figure A.1). As shown in Figure A.2, there is good
agreement between the best fit and optimized minimal set with only a slight increase in the
confidence interval. The flux estimate values did change in the case of the minimal set using
experimental data. However, the best fit values for each flux were still within the confidence
interval of the estimated fluxes, indicating that these values may be improved to the correct value
by increasing the number of data points.
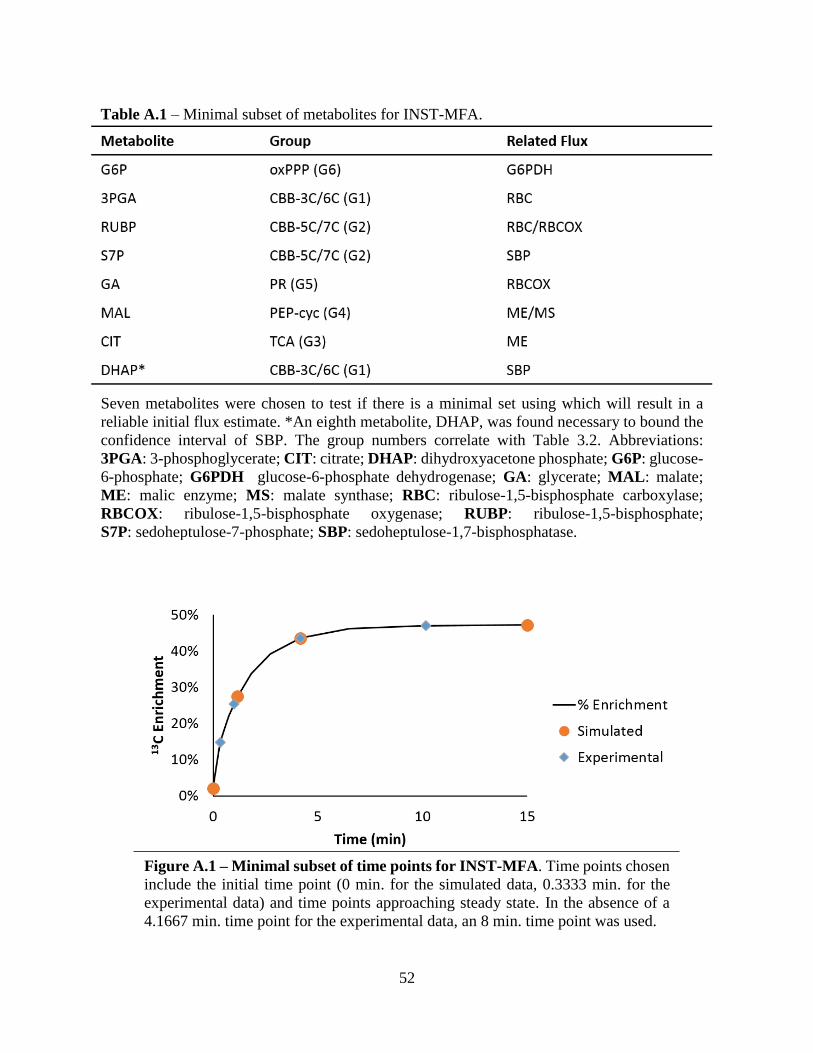
52
Table A.1 – Minimal subset of metabolites for INST-MFA.
Seven metabolites were chosen to test if there is a minimal set using which will result in a
reliable initial flux estimate. *An eighth metabolite, DHAP, was found necessary to bound the
confidence interval of SBP. The group numbers correlate with Table 3.2. Abbreviations:
3PGA: 3-phosphoglycerate; CIT: citrate; DHAP: dihydroxyacetone phosphate; G6P: glucose-
6-phosphate; G6PDH glucose-6-phosphate dehydrogenase; GA: glycerate; MAL: malate;
ME: malic enzyme; MS: malate synthase; RBC: ribulose-1,5-bisphosphate carboxylase;
RBCOX: ribulose-1,5-bisphosphate oxygenase; RUBP: ribulose-1,5-bisphosphate;
S7P: sedoheptulose-7-phosphate; SBP: sedoheptulose-1,7-bisphosphatase.
Figure A.1 – Minimal subset of time points for INST-MFA. Time points chosen
include the initial time point (0 min. for the simulated data, 0.3333 min. for the
experimental data) and time points approaching steady state. In the absence of a
4.1667 min. time point for the experimental data, an 8 min. time point was used.
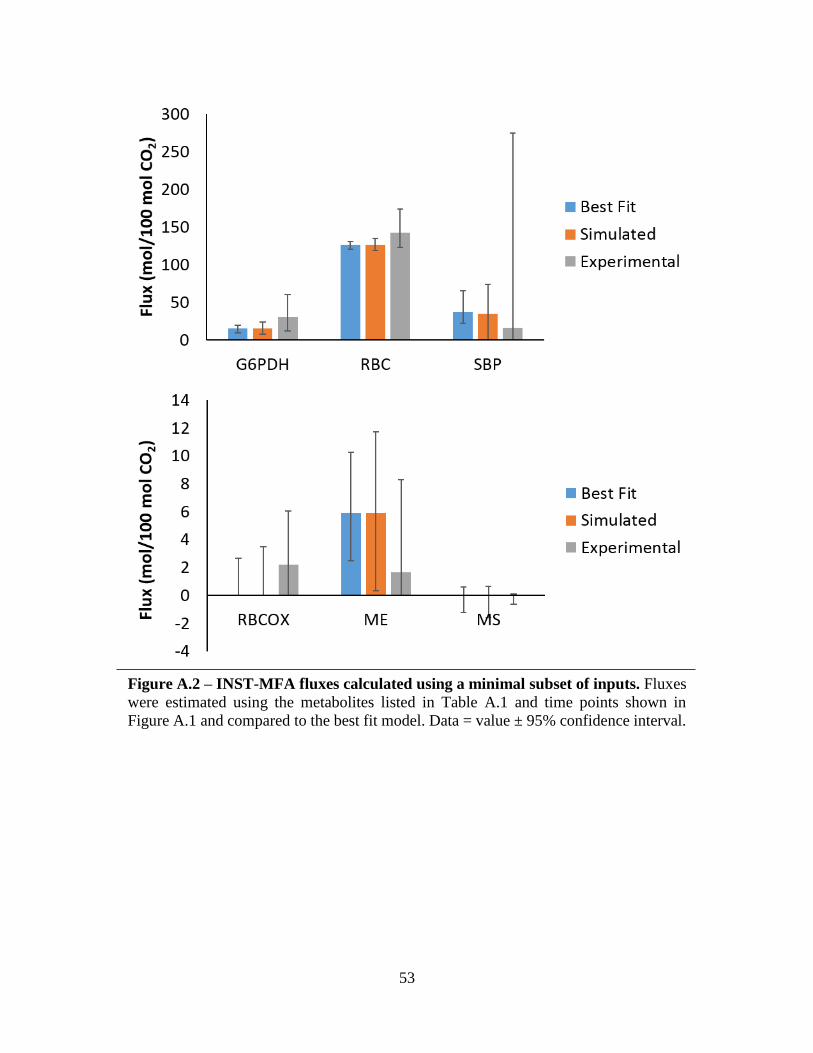
53
Figure A.2 – INST-MFA fluxes calculated using a minimal subset of inputs. Fluxes
were estimated using the metabolites listed in Table A.1 and time points shown in
Figure A.1 and compared to the best fit model. Data = value ± 95% confidence interval.
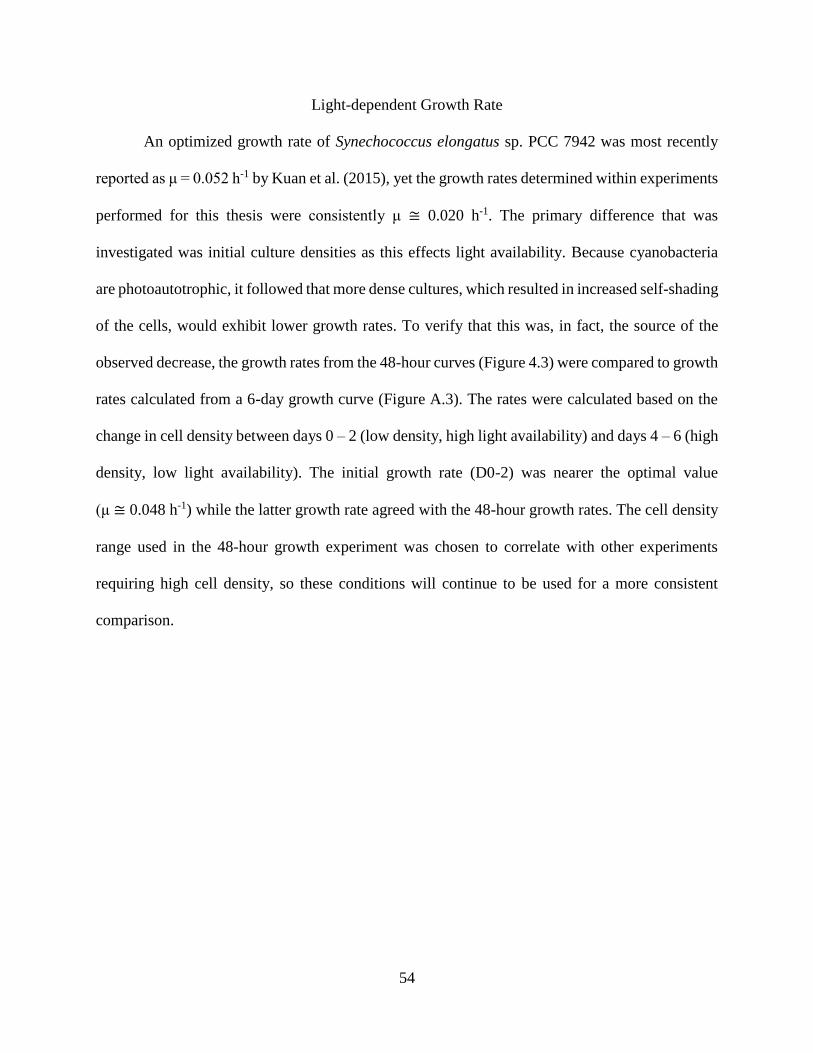
54
Light-dependent Growth Rate
An optimized growth rate of Synechococcus elongatus sp. PCC 7942 was most recently
reported as μ = 0.052 h-1 by Kuan et al. (2015), yet the growth rates determined within experiments
performed for this thesis were consistently μ ≅ 0.020 h-1. The primary difference that was
investigated was initial culture densities as this effects light availability. Because cyanobacteria
are photoautotrophic, it followed that more dense cultures, which resulted in increased self-shading
of the cells, would exhibit lower growth rates. To verify that this was, in fact, the source of the
observed decrease, the growth rates from the 48-hour curves (Figure 4.3) were compared to growth
rates calculated from a 6-day growth curve (Figure A.3). The rates were calculated based on the
change in cell density between days 0 – 2 (low density, high light availability) and days 4 – 6 (high
density, low light availability). The initial growth rate (D0-2) was nearer the optimal value
(μ ≅ 0.048 h-1) while the latter growth rate agreed with the 48-hour growth rates. The cell density
range used in the 48-hour growth experiment was chosen to correlate with other experiments
requiring high cell density, so these conditions will continue to be used for a more consistent
comparison.
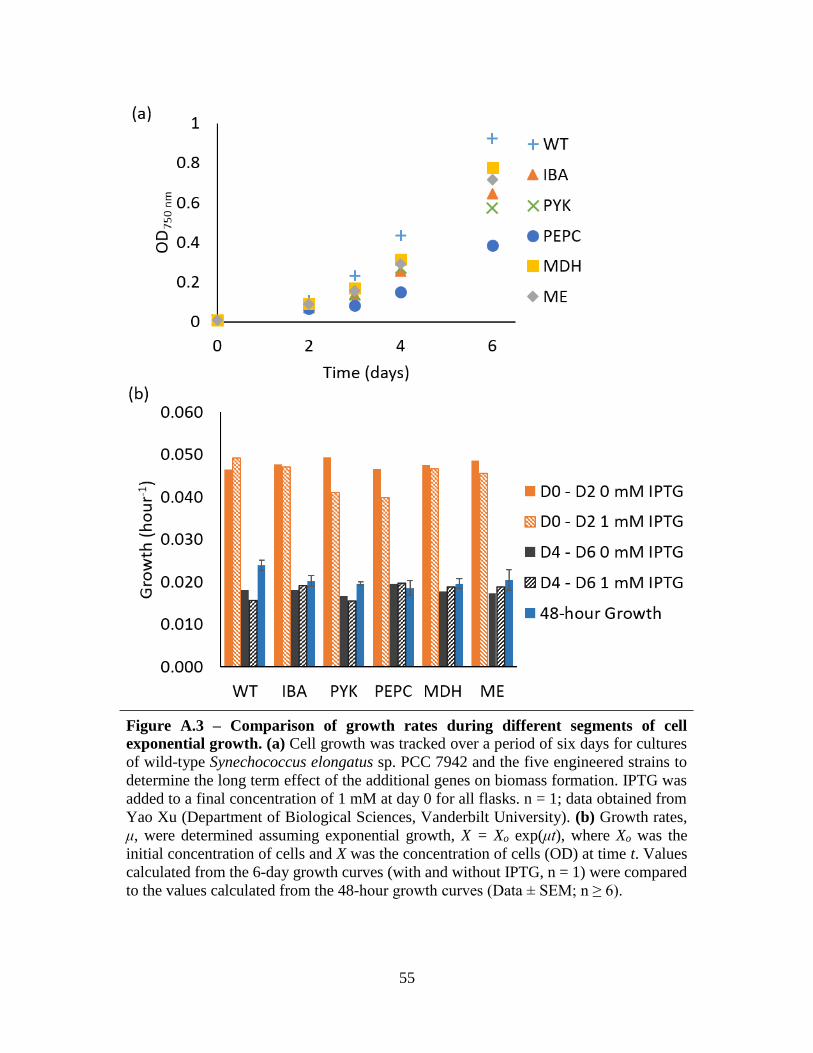
55
Figure A.3 – Comparison of growth rates during different segments of cell
exponential growth. (a) Cell growth was tracked over a period of six days for cultures
of wild-type Synechococcus elongatus sp. PCC 7942 and the five engineered strains to
determine the long term effect of the additional genes on biomass formation. IPTG was
added to a final concentration of 1 mM at day 0 for all flasks. n = 1; data obtained from
Yao Xu (Department of Biological Sciences, Vanderbilt University). (b) Growth rates,
μ, were determined assuming exponential growth, X = Xo exp(μt), where Xo was the
initial concentration of cells and X was the concentration of cells (OD) at time t. Values
calculated from the 6-day growth curves (with and without IPTG, n = 1) were compared
to the values calculated from the 48-hour growth curves (Data ± SEM; n ≥ 6).
56
APPENDIX B
PROTOCOLS
Media Recipes
The two types of media used for cell culturing were BG11 media and LB agar plates. BG11
media was used for agar plates for culture growth from frozen stock and long term growth of
strains and also for liquid cultures. To the plates and the pre-culture liquid flasks were added
antibiotic resistance to maintain selective pressure on the added genes and to minimize culture
contamination. LB plates were used check for contaminations following experiments.
BG11 recipe
Add make up water to desired 2+ L flask or 1 L media bottle (991.5 mL/L for plate, 983
mL/L for liquid culture).
Add media components from stock as described below.
Stock Agar Plate Liquid Culture
1) NaNO3 150 g/L 5 mL/L 10 mL/L
2) K2HPO4•3H2O 40 g/L 0.5 mL/L 1 mL/L
3) MgSO4•7H2O 75 g/L 0.5 mL/L 1 mL/L
4) CaCl2•2H2O 36 g/L 0.5 mL/L 1 mL/L
5) FeNH4•Citrate 12 g/L 0.5 mL/L 1 mL/L
6) Na2EDTA (pH8.0) 1 g/L 0.5 mL/L 1 mL/L
7) Na2CO3 20 g/L 0.5 mL/L 1 mL/L
8) A5 (listed below) --- 0.5 mL/L 1 mL/L
H3BO3 2.86 g/L
MnCl2•4H2O 1.81 g/L
ZnSO4•7H2O 0.222 g/L
Na2MoO4•2H2O 0.391 g/L
CuSO4•5H2O 0.079 g/L
Co(NO3)2•6H2O 0.0494 g/L
57
9) Bacteriological Agar (for Agar only) 15 g/L
10) NaS2O3 (for Agar only) 1M 1 mL
Autoclave on liquid cycle. Allow to cool to touch before proceeding.
For agar plates:
o Once cool to touch, add antibiotics to the following concentrations:
Antibiotic Stock Final
Concentration
Added from
stock
Km 50 mg/mL 10 μg/mL 0.2 mL/L
Spec 40 mg/mL 40 μg/mL 1 mL/L
Cb 10 mg/mL 5 μg/mL 0.5 mL/L
o Pour ~25-30 mL of agar into each sterile petri dish. Allow agar to solidify in hood with
open or cracked lids. When cool, replace each lid and store at room temperature.
For liquid plates:
o Once cool to touch, NaHCO3 may be added. Remove ~50 mL/L of media into a
separate beaker. Add necessary amount of NaHCO3 to smaller volume (4.2 g/L) and
mix until fully dissolved. Using a single-use sterilized syringe and 0.20 μm filter, filter
sterilize the solution back into the media.
LB media
Add 500 mL of water to a 1 L Erlenmeyer flask.
Add the following dry ingredients:
o 5 g NaCl
o 5 g Tryptone
o 2.5 g Yeast Extract
o 7.5 g Bacteriological agar
58
Autoclave on liquid cycle. Allow to cool to touch before proceeding.
Once cool to touch, pour ~25-30 mL of agar into each plate. Allow agar to solidify in hood
with open or cracked lids. When cool, replace each lid and store in 4°C refrigerator.
Thaw to room temperature before use.
Experiment Preculture
The following protocol provides a method to begin a culture from agar plate for
experiment. Consistent use of this method minimizes errors due to different numbers of passages.
Day 1: Add 2 mL of Modified BG11 media to 5 mL cell culture tube. Inoculate cells from agar
plate into media.
Day 2: Transfer the 2 mL culture to 25 mL of fresh media [with antibiotic, same as above] and
place in illuminated (~50 μE m-2 s-1) incubator set to 30°C and 100 rpm.
Day 4-5: Add 25 mL culture to 100 mL of fresh media [with antibiotic] in water bath set to
150 μE m-2 s-1, 30°C and 130 rpm, bubbling with air. Grow until the optical density (OD750 nm)
is between 0.8 – 1.0.
When desired OD is reached, begin prep for experiment.
Measuring Optical Density
Optical density (OD) is primarily used to track growth of the culture by measuring the
changes in absorbance in the liquid. OD may be converted to concentration of cells using two
equations:
Cell density (mg/mL) = 0.684 * (OD750 – 0.045) = 0.652 * (OD730 – 0.044)
59
Into each well of a 96-well clear bottom plate, pipette 200 μL of liquid.
Using the μQuant Spectrophotometer, measure absorbance (OD) at 750 nm and 730 nm.
o For measurements using BG11 media, correct using blank values of 0.045 for OD750
and 0.044 for OD730.
Culture Preparation
The culture preparation is consistent for each experiment. Cyanobacteria exhibit a
consistent circadian rhythm, or metabolic response to temporal oscillations in light availability. It
has been found that this persistent rhythm may be unsynchronized between cells within the same
culture. To synchronize the cells to the same rhythm, the cultures are given a 12-hour dark pulse,
after which the remaining experiment is performed under constant light.
Measure OD of preculture flask (dilute 100 μL culture + 900 μL media). Calculate volume
needed to inoculate 75 mL of fresh media (V2) using
(CV)1 = (CV)2
where C1 = concentration (OD) of the preculture flask, V1 = volume (mL) needed to inoculate
new culture, C2 = target OD, and V2 = volume (mL) of experimental culture.
Add calculated volume V1 into each of three (or four, if enough) 50 mL centrifuge tubes and
centrifuge at 3000 rpm for 10-12 minutes.
Remove supernatant.
o (optional) Resuspend cell pellet in ~5 mL of fresh media and centrifuge again. Remove
supernatant.
Record the weight of the empty flasks.
60
Record the weights of the flasks (“before run”) filled with desired volume of fresh BG11 media
[without antibiotic]. Use 5 ml of media from each flasks to resuspend the cell pellet and return
volume to the appropriate flask. Remove 250 μL of culture to measure OD (1 part cells : 2 parts
media; 3 x 200 μL per flask).
For dark pulse, wrap flask completely in foil and place in water bath for twelve hours. (Move
clamp rings down, if possible, to prevent tearing the paper.) Turn off lights and record time the
flasks were placed in the dark.
After 12 hours, remove the flasks from the water bath and foil. (Turn the lights back on and
replace the rings.)
Add (V2 ÷ 1000) μL of 1 M IPTG (final concentration of 1 mM IPTG). Remove 250 μL of
culture for measuring OD (1 part cells : 2 parts media; 3 x 200 μL per flask). Return flasks to
water bath and begin experimental time line (hour 0).
Determining Cell Growth Rate
Growth rate was tracked over a period of 48 hours to minimize the effect of measurement
error or rate calculation. The calculation was accomplished using ETA (Extracellular Time Course
Analysis) by inputting ODs averaged over a set of biological replicates, the standard error of the
triplicates, and the number of replicates (typically n = 3) (Murphy and Young 2013).
For growth experiments, use 125 Erlenmeyer flasks sealed with a foam plug (size C) and fitted
with a 5 mL plastic pipette (sterile) and 6” autoclaved needle with luer lock attachment.
o Cover each needle (for example, using 2 mL microcentrifuge tubes or aluminum foil)
to prevent contamination.
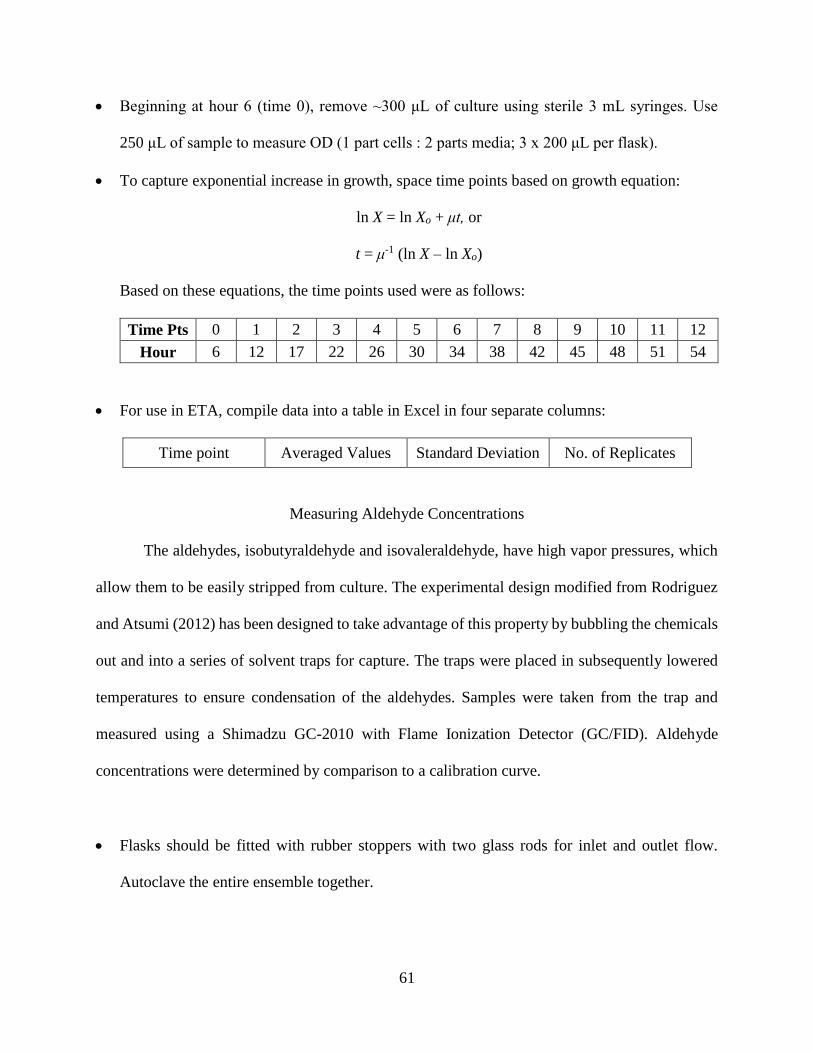
61
Beginning at hour 6 (time 0), remove ~300 μL of culture using sterile 3 mL syringes. Use
250 μL of sample to measure OD (1 part cells : 2 parts media; 3 x 200 μL per flask).
To capture exponential increase in growth, space time points based on growth equation:
ln X = ln Xo + μt, or
t = μ-1 (ln X – ln Xo)
Based on these equations, the time points used were as follows:
Time Pts 0 1 2 3 4 5 6 7 8 9 10 11 12
Hour 6 12 17 22 26 30 34 38 42 45 48 51 54
For use in ETA, compile data into a table in Excel in four separate columns:
Time point Averaged Values Standard Deviation No. of Replicates
Measuring Aldehyde Concentrations
The aldehydes, isobutyraldehyde and isovaleraldehyde, have high vapor pressures, which
allow them to be easily stripped from culture. The experimental design modified from Rodriguez
and Atsumi (2012) has been designed to take advantage of this property by bubbling the chemicals
out and into a series of solvent traps for capture. The traps were placed in subsequently lowered
temperatures to ensure condensation of the aldehydes. Samples were taken from the trap and
measured using a Shimadzu GC-2010 with Flame Ionization Detector (GC/FID). Aldehyde
concentrations were determined by comparison to a calibration curve.
Flasks should be fitted with rubber stoppers with two glass rods for inlet and outlet flow.
Autoclave the entire ensemble together.
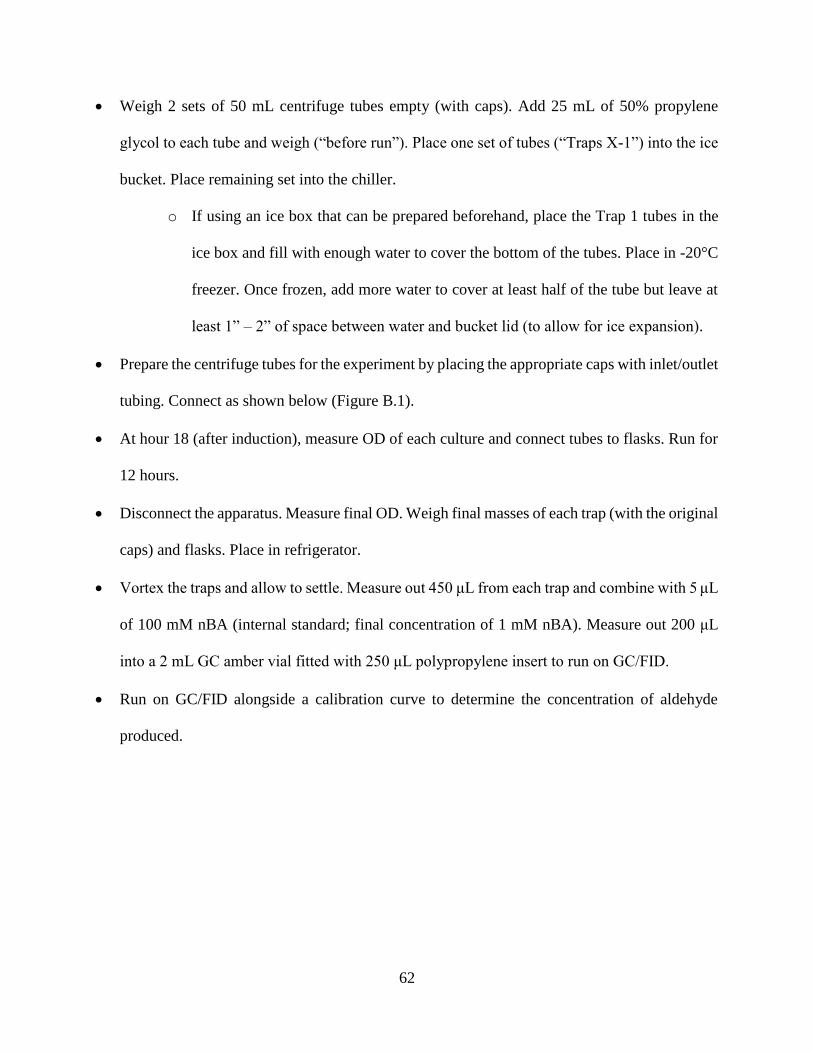
62
Weigh 2 sets of 50 mL centrifuge tubes empty (with caps). Add 25 mL of 50% propylene
glycol to each tube and weigh (“before run”). Place one set of tubes (“Traps X-1”) into the ice
bucket. Place remaining set into the chiller.
o If using an ice box that can be prepared beforehand, place the Trap 1 tubes in the
ice box and fill with enough water to cover the bottom of the tubes. Place in -20°C
freezer. Once frozen, add more water to cover at least half of the tube but leave at
least 1” – 2” of space between water and bucket lid (to allow for ice expansion).
Prepare the centrifuge tubes for the experiment by placing the appropriate caps with inlet/outlet
tubing. Connect as shown below (Figure B.1).
At hour 18 (after induction), measure OD of each culture and connect tubes to flasks. Run for
12 hours.
Disconnect the apparatus. Measure final OD. Weigh final masses of each trap (with the original
caps) and flasks. Place in refrigerator.
Vortex the traps and allow to settle. Measure out 450 μL from each trap and combine with 5 μL
of 100 mM nBA (internal standard; final concentration of 1 mM nBA). Measure out 200 μL
into a 2 mL GC amber vial fitted with 250 μL polypropylene insert to run on GC/FID.
Run on GC/FID alongside a calibration curve to determine the concentration of aldehyde
produced.
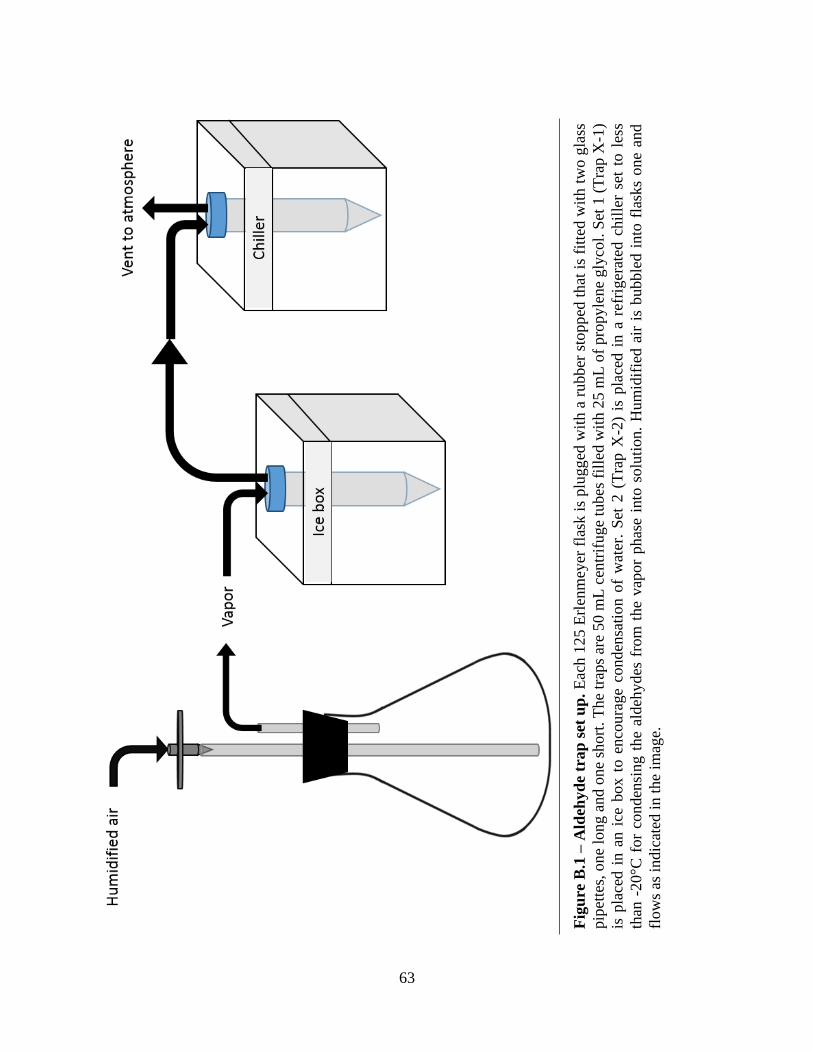
63
Fig
ure
B.1
– A
ldeh
yd
e tr
ap
set
up
. E
ach 1
25
Erl
enm
eyer
fla
sk i
s plu
gg
ed w
ith a
rubber
sto
pp
ed t
hat
is
fitt
ed w
ith t
wo
gla
ss
pip
ette
s, o
ne
long a
nd o
ne
short
. T
he
trap
s ar
e 50 m
L c
entr
ifuge
tubes
fil
led w
ith 2
5 m
L o
f pro
pyle
ne
gly
col.
Set
1 (
Tra
p X
-1)
is p
lace
d i
n a
n i
ce b
ox t
o e
nco
ura
ge
conden
sati
on o
f w
ater
. S
et 2
(T
rap X
-2)
is p
lace
d i
n a
ref
riger
ated
chil
ler
set
to l
ess
than
-20
°C f
or
conden
sing t
he
ald
ehyd
es f
rom
the
vap
or
phas
e in
to s
olu
tion.
Hum
idif
ied a
ir i
s b
ubble
d i
nto
fla
sks
one
and
flow
s as
indic
ated
in t
he
imag
e.
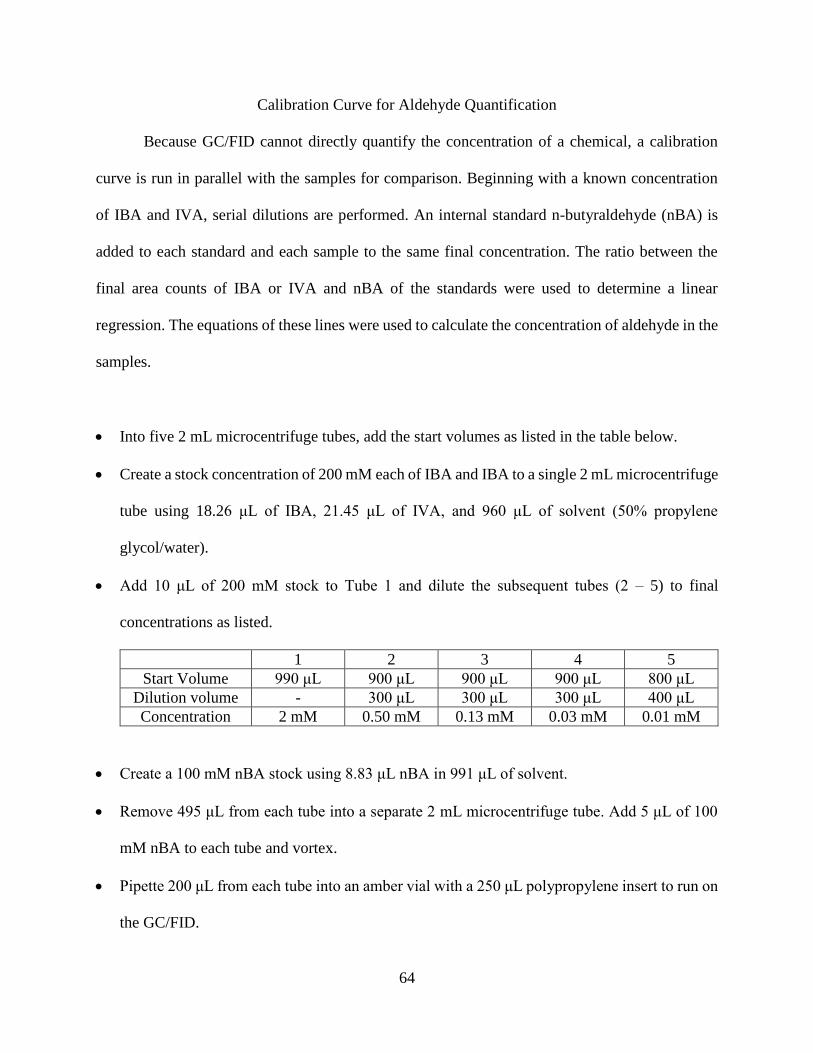
64
Calibration Curve for Aldehyde Quantification
Because GC/FID cannot directly quantify the concentration of a chemical, a calibration
curve is run in parallel with the samples for comparison. Beginning with a known concentration
of IBA and IVA, serial dilutions are performed. An internal standard n-butyraldehyde (nBA) is
added to each standard and each sample to the same final concentration. The ratio between the
final area counts of IBA or IVA and nBA of the standards were used to determine a linear
regression. The equations of these lines were used to calculate the concentration of aldehyde in the
samples.
Into five 2 mL microcentrifuge tubes, add the start volumes as listed in the table below.
Create a stock concentration of 200 mM each of IBA and IBA to a single 2 mL microcentrifuge
tube using 18.26 μL of IBA, 21.45 μL of IVA, and 960 μL of solvent (50% propylene
glycol/water).
Add 10 μL of 200 mM stock to Tube 1 and dilute the subsequent tubes (2 – 5) to final
concentrations as listed.
1 2 3 4 5
Start Volume 990 μL 900 μL 900 μL 900 μL 800 μL
Dilution volume - 300 μL 300 μL 300 μL 400 μL
Concentration 2 mM 0.50 mM 0.13 mM 0.03 mM 0.01 mM
Create a 100 mM nBA stock using 8.83 μL nBA in 991 μL of solvent.
Remove 495 μL from each tube into a separate 2 mL microcentrifuge tube. Add 5 μL of 100
mM nBA to each tube and vortex.
Pipette 200 μL from each tube into an amber vial with a 250 μL polypropylene insert to run on
the GC/FID.
65
GC/FID Program
The settings for the Shimadzu GC-2010 with Flame Ionization Detector were as follows:
Injector temperature: 210°C
Detector temperature: 250°C
Column: Agilent Technologies DB-Wax column, 30 m, 0.20 μm film thickness, 0.20 mm ID
Column oven temperature: 30°C for 6 min, ramp 6°C/min to 60°C, hold 2 minutes, ramp
40°C/min to 220°C, hold 7 minutes
Injection volume: 0.5 μL
Carrier gas: Helium
Column flow: 0.78 mL/min
Purge flow rate: 0.5 mL/min
Split ratio: 10:1
Metabolite Pool Size Measurements
Metabolite pool sizes were measured using an Agilent Technologies 7890A GC System
with Mass Spectrometer 5975C with Triple-Axis Detector. The experimental timeline was
designed to match that of isotopically nonstationary metabolic flux analyses experiments. Area
counts for each metabolite of interest were measured and normalized to an internal standard,
norvaline. Samples were derivatized using methoxyamine (MOX) and trimethylsilane (TMS) to
volatilize the samples of interest and increase the fragment sizes for measurement by GC/MS.
Comparison between engineered strains and the wild-type strain highlighted potential bottlenecks
and also shifts in fluxes that led to pools in carbon sinks.
66
Quenching
Overnight: pre-chill phosphate-buffered saline (PBS; 4°C) for the quenching solution and
chloroform and methanol for extraction (-20°C).
Use 125 Erlenmeyer flasks sealed with a foam plug (size C) and fitted with a 5 mL plastic
pipette (sterile) and 6” autoclaved needle with luer lock attachment.
o Cover each needle (for example, using 2 mL microcentrifuge tubes or aluminum foil)
to prevent contamination.
Aliquot 30 mL of PBS into 50 mL centrifuge tubes.
At hour 30 (after induction), remove 20 mL of sample from each culture using a 20 mL syringe
and quickly add to centrifuge containing chilled PBS. Mix to quench metabolism and place on
ice.
Vortex tubes and centrifuge at 5,000 rpm for 5 minutes at -10°C.
Aspirate supernatant and flash freeze cell pellet (liquid nitrogen). Store in -80°C freezer until
use.
Extracting
Resuspend cells in 4 mL chloroform (prechilled to -20°C).
Add 2 mL methanol (prechilled to -20°C) and vortex tubes for 30 minutes in refrigerator.
Add 1.5 mL iced-cold water, then vortex tubes for additional 5 minutes.
Transfer to 15 mL centrifuge tube.
Centrifuge at 5,000 rpm for 20 min at lowest temperature setting.
Collect aqueous (upper) phase in a new 15 mL tube or two Eppendorf tubes (label the tubes).
67
o (optional) Collect organic (lower) phase in a new 15 mL tube or two Eppendorf tubes.
Evaporate all extracts to dryness using N2 at room temperature. If using two tubes, evaporate
until volume is less than 800 μL; resuspend any dried product on tube walls and combine the
contents of one tubes into the other.
o NOTE: Add internal standard of Norvaline prior to final drying step (if using two tubes,
add when combining tubes.)
Store samples at -80°C until use.
MOX/TMS Derivatization
Dissolve the dried sample in 50 μL of MOX reagent.
Place in sonication bath for 30 min. at room temperature.
Incubate for 90 min. at 40°C on a heating block.
Add 70 uL of BSTFA +10 % TMCS.
For TMS: Incubate for 30 min. at 40°C on a heating block.
Remove from heating block and incubate overnight at room temperature.
Centrifuge for 5 min at 14,000 rpm to remove solid debris.
Transfer liquid to 2 mL amber vial with a 250 μL insert.
GC/FID Program
The settings for the Agilent 7890A GC System with Mass Spectrometer 5975C with Triple-
Axis Detector were as follows:
Injector temperature: 270°C
Column: Agilent Technologies DB-35MS column, 30 m, 0.25 μm film thickness, 0.25 mm ID
68
Column oven temperature: 80°C for 5 min, ramp 10°C/min to 320°C, hold 5 minutes
Injection volume: 1 μL
Carrier gas: Helium
Gas flow rate: 1 mL/min
Purge flow rate: 50 mL/min
Splitless for 2 minutes
Mass spectra obtained in scan mode over the range 100 – 500 m/z.
69
REFERENCES
Adebiyi AO, Jazmin LJ, Young JD (2014) 13C flux analysis of cyanobacterial metabolism.
Photosynthesis research:1-14. doi:10.1007/s11120-014-0045-1
Angermayr SA, Gorchs Rovira A, Hellingwerf KJ (2015) Metabolic engineering of cyanobacteria
for the synthesis of commodity products. Trends in Biotechnology 33 (6):352-361.
doi:10.1016/j.tibtech.2015.03.009
Antoniewicz MR (2013) Using multiple tracers for 13C metabolic flux analysis. Methods Mol
Biol 985:353-365. doi:10.1007/978-1-62703-299-5_17
Antoniewicz MR, Kraynie DF, Laffend LA, Gonzalez-Lergier J, Kelleher JK, Stephanopoulos G
(2007) Metabolic flux analysis in a nonstationary system: fed-batch fermentation of a high
yielding strain of E. coli producing 1,3-propanediol. Metabolic engineering 9 (3):277-292.
doi:10.1016/j.ymben.2007.01.003
Atsumi S, Higashide W, Liao JC (2009) Direct photosynthetic recycling of carbon dioxide to
isobutyraldehyde. Nat Biotech 27 (12):1177-1180. doi:10.1038/nbt.1586
Billig E (2000) Butyl Alcohols. In: Kirk-Othmer Encyclopedia of Chemical Technology. John
Wiley & Sons, Inc. doi:10.1002/0471238961.0221202502091212.a01.pub2
Deng MD, Coleman JR (1999) Ethanol synthesis by genetic engineering in cyanobacteria. Applied
and environmental microbiology 65 (2):523-528
Dexter J, Fu P (2009) Metabolic engineering of cyanobacteria for ethanol production. Energy &
Environmental Science 2 (8):857-864. doi:10.1039/B811937F
Ducat DC, Sachdeva G, Silver PA (2011) Rewiring hydrogenase-dependent redox circuits in
cyanobacteria. Proceedings of the National Academy of Sciences of the United States of
America 108 (10):3941-3946. doi:10.1073/pnas.1016026108
Dutta D, De D, Chaudhuri S, Bhattacharya S (2005) Hydrogen production by Cyanobacteria.
Microbial Cell Factories 4 (1):36
Gao Q, Wang W, Zhao H, Lu X (2012) Effects of fatty acid activation on photosynthetic
production of fatty acid-based biofuels in Synechocystis sp. PCC6803. Biotechnology for
biofuels 5 (1):17. doi:10.1186/1754-6834-5-17
Gong F, Liu G, Zhai X, Zhou J, Cai Z, Li Y (2015) Quantitative analysis of an engineered CO2-
fixing Escherichia coli reveals great potential of heterotrophic CO2 fixation.
Biotechnology for biofuels 8:86. doi:10.1186/s13068-015-0268-1
70
Hasunuma T, Kikuyama F, Matsuda M, Aikawa S, Izumi Y, Kondo A (2013) Dynamic metabolic
profiling of cyanobacterial glycogen biosynthesis under conditions of nitrate depletion.
Journal of experimental botany 64 (10):2943-2954. doi:10.1093/jxb/ert134
Hu Q, Richmond A (2013) Handbook of Microalgal Culture : Applied Phycology and
Biotechnology (2nd Edition). John Wiley & Sons, Somerset, NJ, USA
Huege J, Goetze J, Schwarz D, Bauwe H, Hagemann M, Kopka J (2011) Modulation of the Major
Paths of Carbon in Photorespiratory Mutants of Synechocystis. PLoS ONE 6 (1)
Jazmin LJ (2015) unpublished data.
Jazmin LJ, O’Grady JP, Ma F, Allen DK, Morgan JA, Young JD (2014) Isotopically Nonstationary
MFA (INST-MFA) of Autotrophic Metabolism. In: Dieuaide-Noubhani M, Alonso AP
(eds) Plant Metabolic Flux Analysis, vol 1090. Methods in Molecular Biology. Humana
Press, pp 181-210. doi:10.1007/978-1-62703-688-7_12
Jazmin LJ, Young JD (2013) Isotopically Nonstationary 13C Metabolic Flux Analysis. In: Alper
HS (ed) Systems Metabolic Engineering, vol 985. Methods in Molecular Biology. Humana
Press, pp 367-390. doi:10.1007/978-1-62703-299-5_18
Kämäräinen J, Knoop H, Stanford NJ, Guerrero F, Akhtar MK, Aro EM, Steuer R, Jones PR (2012)
Physiological tolerance and stoichiometric potential of cyanobacteria for hydrocarbon fuel
production. J Biotechnol 162 (1):67-74. doi:10.1016/j.jbiotec.2012.07.193
Khoo HH (2015) Review of bio-conversion pathways of lignocellulose-to-ethanol: Sustainability
assessment based on land footprint projections. Renewable and Sustainable Energy
Reviews 46 (0):100-119. doi:10.1016/j.rser.2015.02.027
Knowles VL, Smith CS, Smith CR, Plaxton WC (2001) Structural and regulatory properties of
pyruvate kinase from the Cyanobacterium synechococcus PCC 6301. The Journal of
biological chemistry 276 (24):20966-20972. doi:10.1074/jbc.M008878200
Koffas M, Stephanopoulos G (2005) Strain improvement by metabolic engineering: lysine
production as a case study for systems biology. Current Opinion in Biotechnology 16
(3):361-366. doi:10.1016/j.copbio.2005.04.010
Kuan D, Duff S, Posarac D, Bi X (2015) Growth optimization of Synechococcus elongatus
PCC7942 in lab flasks and a 2-D photobioreactor. The Canadian Journal of Chemical
Engineering 93 (4):640-647. doi:10.1002/cjce.22154
Kumar K, Dasgupta CN, Nayak B, Lindblad P, Das D (2011) Development of suitable
photobioreactors for CO2 sequestration addressing global warming using green algae and
cyanobacteria. Bioresource technology 102 (8):4945-4953.
doi:10.1016/j.biortech.2011.01.054
71
Leighty RW, Antoniewicz MR (2011) Dynamic metabolic flux analysis (DMFA): a framework
for determining fluxes at metabolic non-steady state. Metab Eng 13 (6):745-755.
doi:10.1016/j.ymben.2011.09.010
Liu X, Sheng J, Curtiss R, 3rd (2011) Fatty acid production in genetically modified cyanobacteria.
Proceedings of the National Academy of Sciences of the United States of America 108
(17):6899-6904. doi:10.1073/pnas.1103014108
Masukawa H, Inoue K, Sakurai H, Wolk CP, Hausinger RP (2010) Site-directed mutagenesis of
the Anabaena sp. strain PCC 7120 nitrogenase active site to increase photobiological
hydrogen production. Applied and environmental microbiology 76 (20):6741-6750.
doi:10.1128/aem.01056-10
Murphy TA, Young JD (2013) ETA: robust software for determination of cell specific rates from
extracellular time courses. Biotechnology and bioengineering 110 (6):1748-1758.
doi:10.1002/bit.24836
Nielsen J (2003) It Is All about Metabolic Fluxes. Journal of Bacteriology 185 (24):7031-7035.
doi:10.1128/jb.185.24.7031-7035.2003
Noh K, Gronke K, Luo B, Takors R, Oldiges M, Wiechert W (2007) Metabolic flux analysis at
ultra short time scale: isotopically non-stationary 13C labeling experiments. J Biotechnol
129 (2):249-267. doi:10.1016/j.jbiotec.2006.11.015
Nöh K, Wiechert W (2006) Experimental design principles for isotopically instationary 13C
labeling experiments. Biotechnology and bioengineering 94 (2):234-251.
doi:10.1002/bit.20803
Nozzi NE, Atsumi S (2015) Genome Engineering of the 2,3-Butanediol Biosynthetic Pathway for
Tight Regulation in Cyanobacteria. ACS Synthetic Biology.
doi:10.1021/acssynbio.5b00057
Oliver JW, Machado IM, Yoneda H, Atsumi S (2013) Cyanobacterial conversion of carbon
dioxide to 2,3-butanediol. Proceedings of the National Academy of Sciences of the United
States of America 110 (4):1249-1254. doi:10.1073/pnas.1213024110
Oliver JWK, Atsumi S (2015) A carbon sink pathway increases carbon productivity in
cyanobacteria. Metabolic Engineering 29 (0):106-112. doi:10.1016/j.ymben.2015.03.006
Piven I, Friedrich A, Dühring U, Uliczka F, Baier K, Inaba M, Shi T, Wang K, Enke H, Kramer D
(2014) Cyanobacterium sp. for Production of Compounds. Google Patents,
Quintana N, Van der Kooy F, Van de Rhee MD, Voshol GP, Verpoorte R (2011) Renewable
energy from Cyanobacteria: energy production optimization by metabolic pathway
engineering. Applied microbiology and biotechnology 91 (3):471-490.
doi:10.1007/s00253-011-3394-0
72
Rodriguez GM, Atsumi S (2012) Isobutyraldehyde production from Escherichia coli by removing
aldehyde reductase activity. Microbial Cell Factories 11:90-90. doi:10.1186/1475-2859-
11-90
Ryan C, Munz D, Bevers G (2011) Isobutanol-A Renewable Solution for the Transportation Fuels
Value Chain. Pipeline stress corrosion cracking (SCC) and elastomeric compatibility
Sauer U (2006) Metabolic networks in motion: 13C-based flux analysis. Molecular Systems
Biology 2 (1):n/a-n/a. doi:10.1038/msb4100109
Savakis PE, Angermayr SA, Hellingwerf KJ (2013) Synthesis of 2,3-butanediol by Synechocystis
sp. PCC6803 via heterologous expression of a catabolic pathway from lactic acid- and
enterobacteria. Metabolic Engineering 20 (0):121-130. doi:10.1016/j.ymben.2013.09.008
Sharma NK, Rai AK, Stal LJ (2013) Cyanobacteria : An Economic Perspective. John Wiley &
Sons, Incorporated, Somerset, NJ, USA
Shastri AA, Morgan JA (2007) A transient isotopic labeling methodology for 13C metabolic flux
analysis of photoautotrophic microorganisms. Phytochemistry 68 (16-18):2302-2312.
doi:10.1016/j.phytochem.2007.03.042
Stephanopoulos G (1999) Metabolic fluxes and metabolic engineering, vol 1. vol 1, 2000/08/10
edn. doi:10.1006/mben.1998.0101
Stephanopoulos G, Aristidou AA, Nielsen J (1998) Metabolic engineering: principles and
methodologies. Academic press,
Vallino JJ, Stephanopoulos G (1994) Carbon Flux Distributions at the Pyruvate Branch Point in
Corynebacterium glutamicum during Lysine Overproduction. Biotechnology progress 10
(3):320-326. doi:10.1021/bp00027a013
Varman AM, Xiao Y, Pakrasi HB, Tang YJ (2013) Metabolic engineering of Synechocystis sp.
strain PCC 6803 for isobutanol production. Applied and environmental microbiology 79
(3):908-914. doi:10.1128/aem.02827-12
Wegner A, Weindl D, Jäger C, Sapcariu SC, Dong X, Stephanopoulos G, Hiller K (2014) Fragment
Formula Calculator (FFC): Determination of Chemical Formulas for Fragment Ions in
Mass Spectrometric Data. Analytical Chemistry 86 (4):2221-2228. doi:10.1021/ac403879d
Wiechert W (2001) 13C Metabolic Flux Analysis. Metabolic Engineering 3 (3):195-206.
doi:10.1006/mben.2001.0187
Woolston BM, Edgar S, Stephanopoulos G (2013) Metabolic engineering: past and future. Annual
review of chemical and biomolecular engineering 4:259-288. doi:10.1146/annurev-
chembioeng-061312-103312
73
Yao L, Qi F, Tan X, Lu X (2014) Improved production of fatty alcohols in cyanobacteria by
metabolic engineering. Biotechnology for biofuels 7:94. doi:10.1186/1754-6834-7-94
Yoshikawa K, Hirasawa T, Shimizu H (2015) Effect of malic enzyme on ethanol production by
Synechocystis sp. PCC 6803. Journal of bioscience and bioengineering 119 (1):82-84.
doi:10.1016/j.jbiosc.2014.06.001
Young JD, Shastri AA, Stephanopoulos G, Morgan JA (2011) Mapping photoautotrophic
metabolism with isotopically nonstationary (13)C flux analysis. Metab Eng 13 (6):656-
665. doi:10.1016/j.ymben.2011.08.002
Young JD, Walther JL, Antoniewicz MR, Yoo H, Stephanopoulos G (2008) An elementary
metabolite unit (EMU) based method of isotopically nonstationary flux analysis.
Biotechnology and bioengineering 99 (3):686-699. doi:10.1002/bit.21632