Embed Size (px)
Citation preview
Drenos, F., Davey Smith, G., Ala-Korpela, M., Kettunen, J., Würtz, P.,Soininen, P., ... Timpson, N. (2016). Metabolic characterisation of a raregenetic variation within APOC3 and its lipoprotein lipase independenteffects. Circulation: Cardiovascular Genetics, 9(3), 231-239. DOI:10.1161/CIRCGENETICS.115.001302
Publisher's PDF, also known as Version of record
License (if available):CC BY
Link to published version (if available):10.1161/CIRCGENETICS.115.001302
Link to publication record in Explore Bristol ResearchPDF-document
This is the final published version of the article (version of record). It first appeared online via AHA athttp://circgenetics.ahajournals.org/content/9/3/231.abstract. Please refer to any applicable terms of use of thepublisher
University of Bristol - Explore Bristol ResearchGeneral rights
This document is made available in accordance with publisher policies. Please cite only the publishedversion using the reference above. Full terms of use are available:http://www.bristol.ac.uk/pure/about/ebr-terms
231
High triglycerides levels have been consistently linked to risk of cardiovascular disease,1 with mounting evidence
supporting their causal role in the progression of the disease.2–5 In moderately raised concentrations (2–10 mml/L),6 triglycer-ides appear to be able to penetrate the arterial intima7 where they are trapped within the arterial wall contributing to athero-sclerosis.8 In the fasting state, circulating triglycerides are trans-ported in large, medium, and small particles of very low–density lipoproteins (VLDLs) and their remnants after lipolysis and remodeling,9 mainly in the form of small VLDLs and interme-diate-density lipoproteins. Smaller percentages of triglyceride
can also be found in low-density lipoprotein (LDL; <10%) and high-density lipoprotein (HDL; ≈15%) particles.10 In postpran-dial conditions, chylomicrons and their remnants account for a large proportion of the elevated triglyceride levels.11
Clinical Perspective on p 239A common component of triglyceride-rich lipoproteins is
apolipoprotein C-III (APOC3). APOC3 is a small 99 amino acid peptide12 coded by the APOC3 gene located on chromo-some 11, between and in close proximity to the APOA4 and APOA1 genes.13 Recent advances in genetic data collection
Background—Plasma triglyceride levels have been implicated in atherosclerosis and coronary heart disease. Apolipoprotein C-III (APOC3) plays a key role in the hydrolysis of triglyceride-rich lipoproteins to remnant particles by lipoprotein lipase (LPL) and their uptake by the liver. A rare variant in APOC3(rs138326449) has been associated with triglyceride, very low–density lipoprotein, and high-density lipoprotein levels, as well as risk of coronary heart disease. We aimed to characterize the impact of this locus across a broad set of mainly lipids-focused metabolic measures.
Methods and Results—A high-throughput serum nuclear magnetic resonance metabolomics platform was used to quantify 225 metabolic measures in 13 285 participants from 2 European population cohorts. We analyzed the effect of the APOC3 variant on the metabolic measures and used the common LPL(rs12678919) polymorphism to test for LPL-independent effects. Eighty-one metabolic measures showed evidence of association with APOC3(rs138326449). In addition to previously reported triglyceride and high-density lipoprotein associations, the variant was also associated with very low–density lipoprotein and high-density lipoprotein composition measures, other cholesterol measures, and fatty acids. Comparison of the APOC3 and LPL associations revealed that APOC3 association results for medium and very large very low–density lipoprotein composition are unlikely to be solely predictable by the action of APOC3 through LPL.
Conclusions—We characterized the effects of the rare APOC3(rs138326449) loss of function mutation in lipoprotein metabolism, as well as the effects of LPL(rs12678919). Our results improve our understanding of the role of APOC3 in triglyceride metabolism, its LPL independent action, and the complex and correlated nature of human metabolites. (Circ Cardiovasc Genet. 2016;9:231-239. DOI: 10.1161/CIRCGENETICS.115.001302.)
Key Words: association studies ◼ genetics ◼ lipids ◼ LPL ◼ metabolism ◼ triglycerides ◼ VLDL
Circ Cardiovasc Genet is available at http://circgenetics.ahajournals.org DOI: 10.1161/CIRCGENETICS.115.001302
Received September 18, 2015; accepted April 21, 2016.From the MRC Integrative Epidemiology Unit, School of Social and Community Medicine, University of Bristol, Bristol (F.D., G.D.S., M.A.-K., D.A.L.,
T.R.G., N.J.T.); Institute of Cardiovascular Science, University College London, London, United Kingdom (F.D., C.D., J.-P.C.); Computational Medicine, Faculty of Medicine, University of Oulu & Biocenter Oulu, Oulu (M.A.-K., J.K., P.W., P.S., A.J.K.); NMR Metabolomics Laboratory, School of Pharmacy, University of Eastern Finland, Kuopio (M.A.-K., J.K., P.S.); Public Health Genomics Unit, Department of Chronic Disease Prevention, National Institute for Health and Welfare, Helsinki, Finland (J.K.); and Department of Non-communicable Disease Epidemiology, London School of Hygiene and Tropical Medicine, London, United Kingdom (C.D., J.-P.C.).
The Data Supplement is available at http://circgenetics.ahajournals.org/lookup/suppl/doi:10.1161/CIRCGENETICS.115.001302/-/DC1.Correspondence to Nicolas J. Timpson, PhD, MRC Integrative Epidemiology Unit, University of Bristol, Oakfield House, Oakfield Grove, Bristol BS8
2BN. E-mail [email protected] or Fotios Drenos, PhD, MRC Integrative Epidemiology Unit, University of Bristol, Oakfield House, Oakfield Grove, Bristol BS8 2BN. E-mail [email protected]
© 2016 The Authors. Circulation: Cardiovascular Genetics is published on behalf of the American Heart Association, Inc., by Wolters Kluwer. This is an open access article under the terms of the Creative Commons Attribution License, which permits use, distribution, and reproduction in any medium, provided that the original work is properly cited.
Metabolic Characterization of a Rare Genetic Variation Within APOC3 and Its Lipoprotein
Lipase–Independent EffectsFotios Drenos, PhD; George Davey Smith, MD, DSc; Mika Ala-Korpela, PhD;
Johannes Kettunen, PhD; Peter Würtz, PhD; Pasi Soininen, PhD; Antti J. Kangas, MSc; Caroline Dale, PhD; Debbie A. Lawlor, MBChB, PhD; Tom R. Gaunt, PhD;
Juan-Pablo Casas, PhD; Nicholas J. Timpson, PhD
Original Article
at University of Bristol Library on October 4, 2016http://circgenetics.ahajournals.org/Downloaded from at University of Bristol Library on October 4, 2016http://circgenetics.ahajournals.org/Downloaded from at University of Bristol Library on October 4, 2016http://circgenetics.ahajournals.org/Downloaded from at University of Bristol Library on October 4, 2016http://circgenetics.ahajournals.org/Downloaded from at University of Bristol Library on October 4, 2016http://circgenetics.ahajournals.org/Downloaded from at University of Bristol Library on October 4, 2016http://circgenetics.ahajournals.org/Downloaded from at University of Bristol Library on October 4, 2016http://circgenetics.ahajournals.org/Downloaded from at University of Bristol Library on October 4, 2016http://circgenetics.ahajournals.org/Downloaded from at University of Bristol Library on October 4, 2016http://circgenetics.ahajournals.org/Downloaded from at University of Bristol Library on October 4, 2016http://circgenetics.ahajournals.org/Downloaded from
232 Circ Cardiovasc Genet June 2016
have permitted the study of low minor allele frequency vari-ants (<5% minor allele frequencies) which have, potentially, strong associations with phenotypes. Through these methods, a rare loss of function single nucleotide variant rs138326449 that changes the splicing of the APOC3 gene10,14–16 has been identified. The rare allele of this single nucleotide variant has been associated with a substantial decrease in the risk of coro-nary artery disease,10,15 varying levels of reduction in triglycer-ide of 0.5 to 1.5 mmol/L depending on the population studied and evidence of changes to VLDL and HDL levels.16
APOC3 is involved in several intra- and extracellular mechanisms, including the production and clearance of triglyceride-rich lipoproteins from circulation. The effect of APOC3 on triglyceride and remnant particles, smaller and denser remodeled triglyceride-rich particles with some of their triglyceride removed, is suggested to operate mainly through the inhibition of triglyceride-rich lipoproteins hydro-lysis by lipoprotein lipase (LPL)17 and a subsequent attenu-ation of uptake into hepatocytes.12 LPL polymorphisms have been associated with levels of both triglyceride and HDL18 and also with risk of coronary artery disease.19 To date, epi-demiological studies have not had the required information to assess the molecular mechanisms involved, and despite the consensus that APOC3 is affecting the TLRs, small in vivo and in vitro studies have not determined the relative importance of the different mechanisms20 and how specific mutations of the APOC3 gene can affect these processes.21
Here we use data from 2 well-characterized European population cohort studies to provide a detailed profile of the associations between the rare and poorly characterized APOC3 genetic variant rs138326449 and individual lipopro-tein subclasses that might contribute to atherosclerosis risk. For this, we used a targeted metabolomics approach measur-ing, among others, the size and composition of 14 lipoprotein subclasses. This approach has previously been used to charac-terize the molecular profile of common diseases, identify new biomarkers, and study the genetic basis of systemic metabo-lism (reviewed in Soininen et al22). We aimed to characterize in greater detail the impact of variation at this locus and its role in triglyceride metabolism as seen from an epidemiological perspective, including elucidating APOC3’s LPL-dependent and LPL-independent actions on the levels and composition of specific lipoprotein particles, as well as the mechanism of action of a recently proposed APOC3 inhibitor for the treat-ment of hypertriglyceridemia.
MethodsStudy PopulationsThe Avon Longitudinal Study of Parents and Children (ALSPAC) is a population-based, prospective birth cohort (www.bris.ac.uk/alspac). The study initially invited >14 000 pregnancies and has since fol-lowed participants in several phases during development and maturi-ty. Information on the phases can be found at www.bris.ac.uk/alspac/researchers/resources-available/data-details/data-tables/documents/focusclinicsessions.pdf. Full details of the study have been published previously, and here focus is on the offspring of this study (herein referred to as young participants) and their mothers.23 Ethical ap-proval for the study was obtained from the ALSPAC Ethics and Law Committee and from the UK National Health Service Local Research Ethics Committees. Participants have provided informed consent for the use of the data.
Analyses were also undertaken in an independent cohort of wom-en. The British Women Heart Health Study (BWHHS) is a prospec-tive cohort study that recruited women between the ages of 60 and 79 years from 23 towns across the United Kingdom between 1999 and 2001 and has followed those women forward through record linkage and detailed questionnaires since that time.24 Ethical approval for the study was obtained from the UK National Health Service Research Ethics Committees, and participants provided informed consent.
Serum Nuclear Magnetic Resonance MetabolomicsA high-throughput serum nuclear magnetic resonance metabolomics platform was used to quantify ≤233 metabolic measures that repre-sent a broad molecular signature of systemic metabolism.22,25 The measured set covers multiple metabolic pathways, including lipopro-tein lipids and subclasses, fatty acids and fatty acid compositions, as well as amino acids and glycolysis precursors. All molecular mea-sures are quantified in a single experimental setup, constituting both established and novel metabolic risk factors.22 The applied nuclear magnetic resonance–based metabolic profiling has recently been used in various epidemiological and genetic studies.26–31 Applications of this high-throughput metabolomics platform has recently been reviewed,22 and details of the experimentation have been described elsewhere.25,32
For the ALSPAC young participants, metabolic measures were obtained from serum taken at follow-up clinic assessments at the approximate ages of 7, 15, and 17 years. In total, 7176 participants had at least one measurement, with 1453 measured at all 3 ages. For 73 sibling pairs, one child was removed at random before statistical analysis. Samples from the 15- and 17-year follow-up assessments were taken after overnight fast, for those assessed in the morning, and at least 6-hour fast for those assessed after 14.00 hours; samples tak-en at the 7-year assessment were nonfasted. To allow the maximum sample size for analyses (given the relative stability of fasting versus nonfasting samples33), data were taken from all available time points. However, to minimize unnecessary heterogeneity, where participants had repeat measurements, we prioritized those collected under fasted conditions. This led to a final analysis sample with 37.5% nonfasting (sensitivity analyses excluding those nonfasting are provided in the Data Supplement).
Measurements were available for 4530 ALSPAC mothers at a me-dian age of 48 years (with an overlap of 1981 mothers of the young participant sample). All of the samples from the ALSPAC mothers were taken after an overnight fast for those taken in the morning and a minimum 6-hour fast for those taken after 14.00 hours.
Samples were available for 3780 women from the BWHHS at baseline assessment (age 60–79 years) after an overnight fast for those assessed in the morning and a minimum of 6-hour fast for those assessed after 14.00 hours. Given differences in storage of the sam-ples between studies, 225 metabolites were common in all 3 and are used here.
GenotypingGenotyping for the rs138326449 splice variant APOC3 mutation was performed using KASPAR at KBioscience (www.lgcgenomics.com) for all participants from both studies who had a suitable DNA sample. Genotypes for the leading triglyceride-associated LPL singe nucleotide polymorphism (SNP) rs12678919, a downstream intergenic variant in linkage disequilibrium with an SNP with previous evidence of tran-scriptional regulation,34 were extracted from the existing genome-wide common variant data available in ALSPAC.35 For BWHHS, the SNP was extracted from the available Metabochip array data.36 Standard metrics were used to assess the quality of these data (missingness [>3%], non-European ancestry, and SNPs of minor allele frequency of <1%, call rate of <95%, and Hardy–Weinberg equilibrium [P<5×10⁻⁷]).
Statistical AnalysisThe metabolic measures were inspected for deviations from normal-ity and transformed, when needed, using the natural logarithm plus one to be consistent throughout because some metabolic measures
at University of Bristol Library on October 4, 2016http://circgenetics.ahajournals.org/Downloaded from
Drenos et al APOC3 Metabolomics 233
included zero values. For the analysis of the association between the metabolic measures and rs138326449(APOC3), we used a linear re-gression model adjusting for age, sex and, to try to adjust for the non-fasting measurements at age 7, as well as any other differences related to handling and storage of the blood samples, an indicator variable for the phase of measurement where relevant. Primary analysis was un-dertaken in the ALSPAC young participants. Meta-analyzed results, from a fixed-effects model, of ALSPAC mothers and BWHHS were generated in parallel to those from the ALSAPC offspring. This first approach was taken as the comparison of results from these sample sources permits the confirmation of observed results, but the com-plications of fasting status, age, and sex may complicate inference drawn from of a meta-analysis across all collections. Where overall meta-analysis was undertaken, we first pooled the ALSPAC mothers and young participants using a linear mixed-effects model to adjust for the pedigree correlation.37 Subsequently, we used a fixed-effect meta-analysis to combine the results of the pooled ALSPAC sample with the BWHHS women. To address the uncertainty caused by het-erogeneity, we also used a random effects meta-analysis model, but because of the small number of study samples available, we consider this as a sensitivity analysis of the main fixed-effects results.38 We used the Benjamini and Yekutieli false discovery rate procedure under dependency39 to adjust the P values of the confirmation analysis for the associations reaching the 0.05 P value threshold in the discovery sample and all meta-analysis results for multiple testing as imple-mented in the p.adjust package in R.
It is assumed that the APOC3 acts on triglyceride and VLDL largely through inhibition of LPL.12,17 We tested whether the APOC3 variant associations with metabolites could be explained by the in-hibition of LPL by using the genetic variant LPL(rs12678919) as a proxy of LPL protein levels.18 We estimated the predicted effect of APOC3 on the metabolites if this was exclusively through LPL by looking at the ratio of SNP associations between LPL(rs12678919) and the focus variant here APOC3(rs138326449). The model used the mean of the ratios of the effects of APOC3 and LPL genetic variants on each metabolite to obtain an estimate of the LPL-mediated effects of APOC3. To avoid the inclusion of metabolic measures that do not follow the assumed model of APOC3 action, we made use of the 25% trimmed mean as a true estimate of the effect of APOC3 on LPL. We bootstrapped the sample 1000 times to obtain the standard error of the mean of the ratios. The predicted effect of APOC3 on each metabolite was estimated as the product of the mean of the ratios and the LPL effect per metabolite, whereas the predicted confidence intervals were estimated taking into account the standard errors of both the LPL es-timates and of the mean of the ratios. The absence of overlap in the coefficients between the predicted and observed APOC3 estimates were considered as evidence for an effect of APOC3 not mediated by its inhibition of LPL. We followed the same procedure in each of the parallel studies and combined their estimates using a fixed-effects meta-analysis weighted by their sample size.
Analyses were undertaken in Stata (Stata Statistical Software: Release 13. College Station, TX: StataCorp LP) and R 3.1.040 and plots prepared using ggplot2.41
ResultsAPOC3(rs138326449) was present with minor allele frequen-cies of 0.20% to 0.28% in the 3 studies and adhered to Hardy–Weinberg equilibrium. LPL(rs12678919) polymorphism was more common with a minor allele frequencies of 9.2% to 10.6% across the 3 studies. Key characteristic of participants from each study are shown in Table 1.
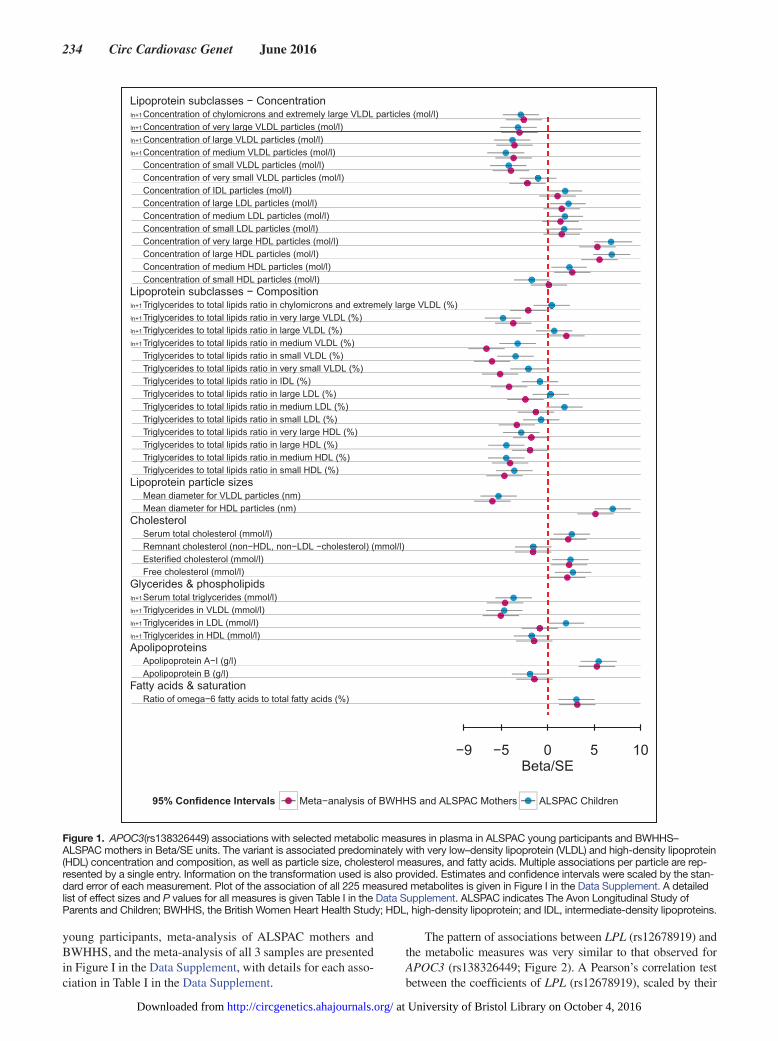
Of the 225 metabolic measures available in all 3 studies, when analyzed in the ALSPAC young participants, 134 showed nominal evidence of association with APOC3(rs138326449; P≤0.05). APOC3(rs138326449) was associated with a decrease in triglyceride concentration (−0.11 mmol/L of geo-metric mean, 95% confidence interval −0.16 to −0.05 mmol/L; P=2.57×10⁻⁴) and an increase of HDL (0.26 mmol/L, 95%
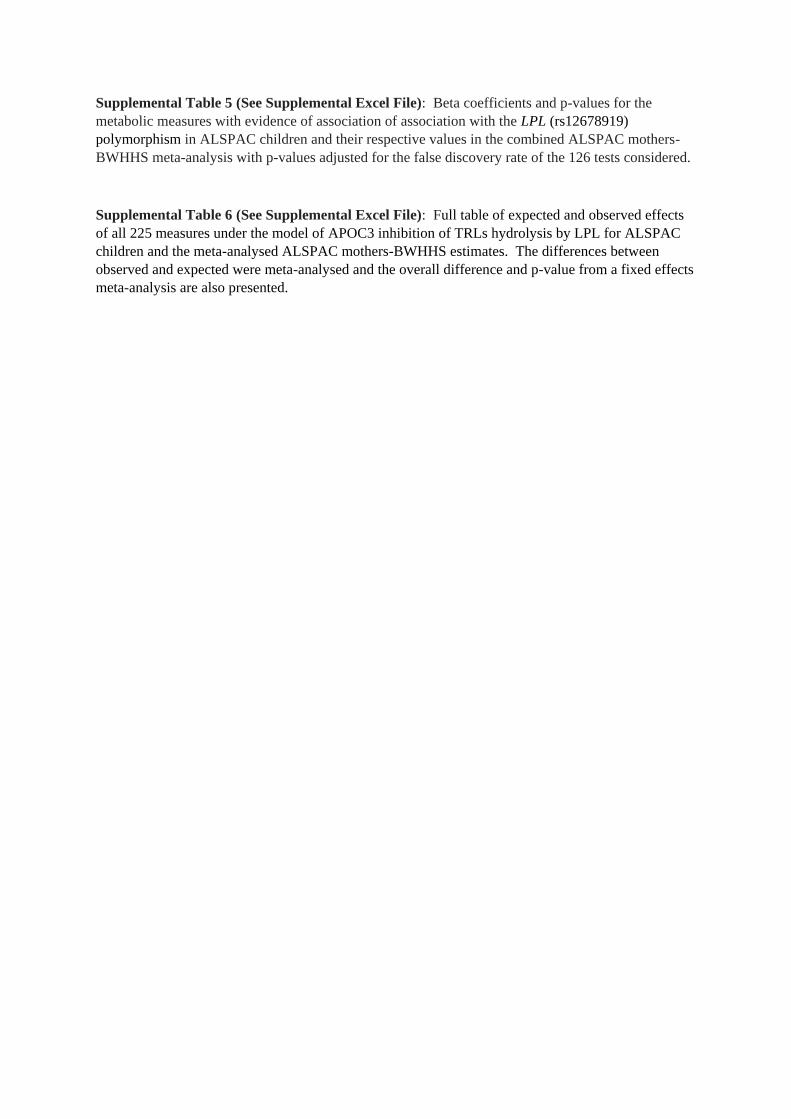
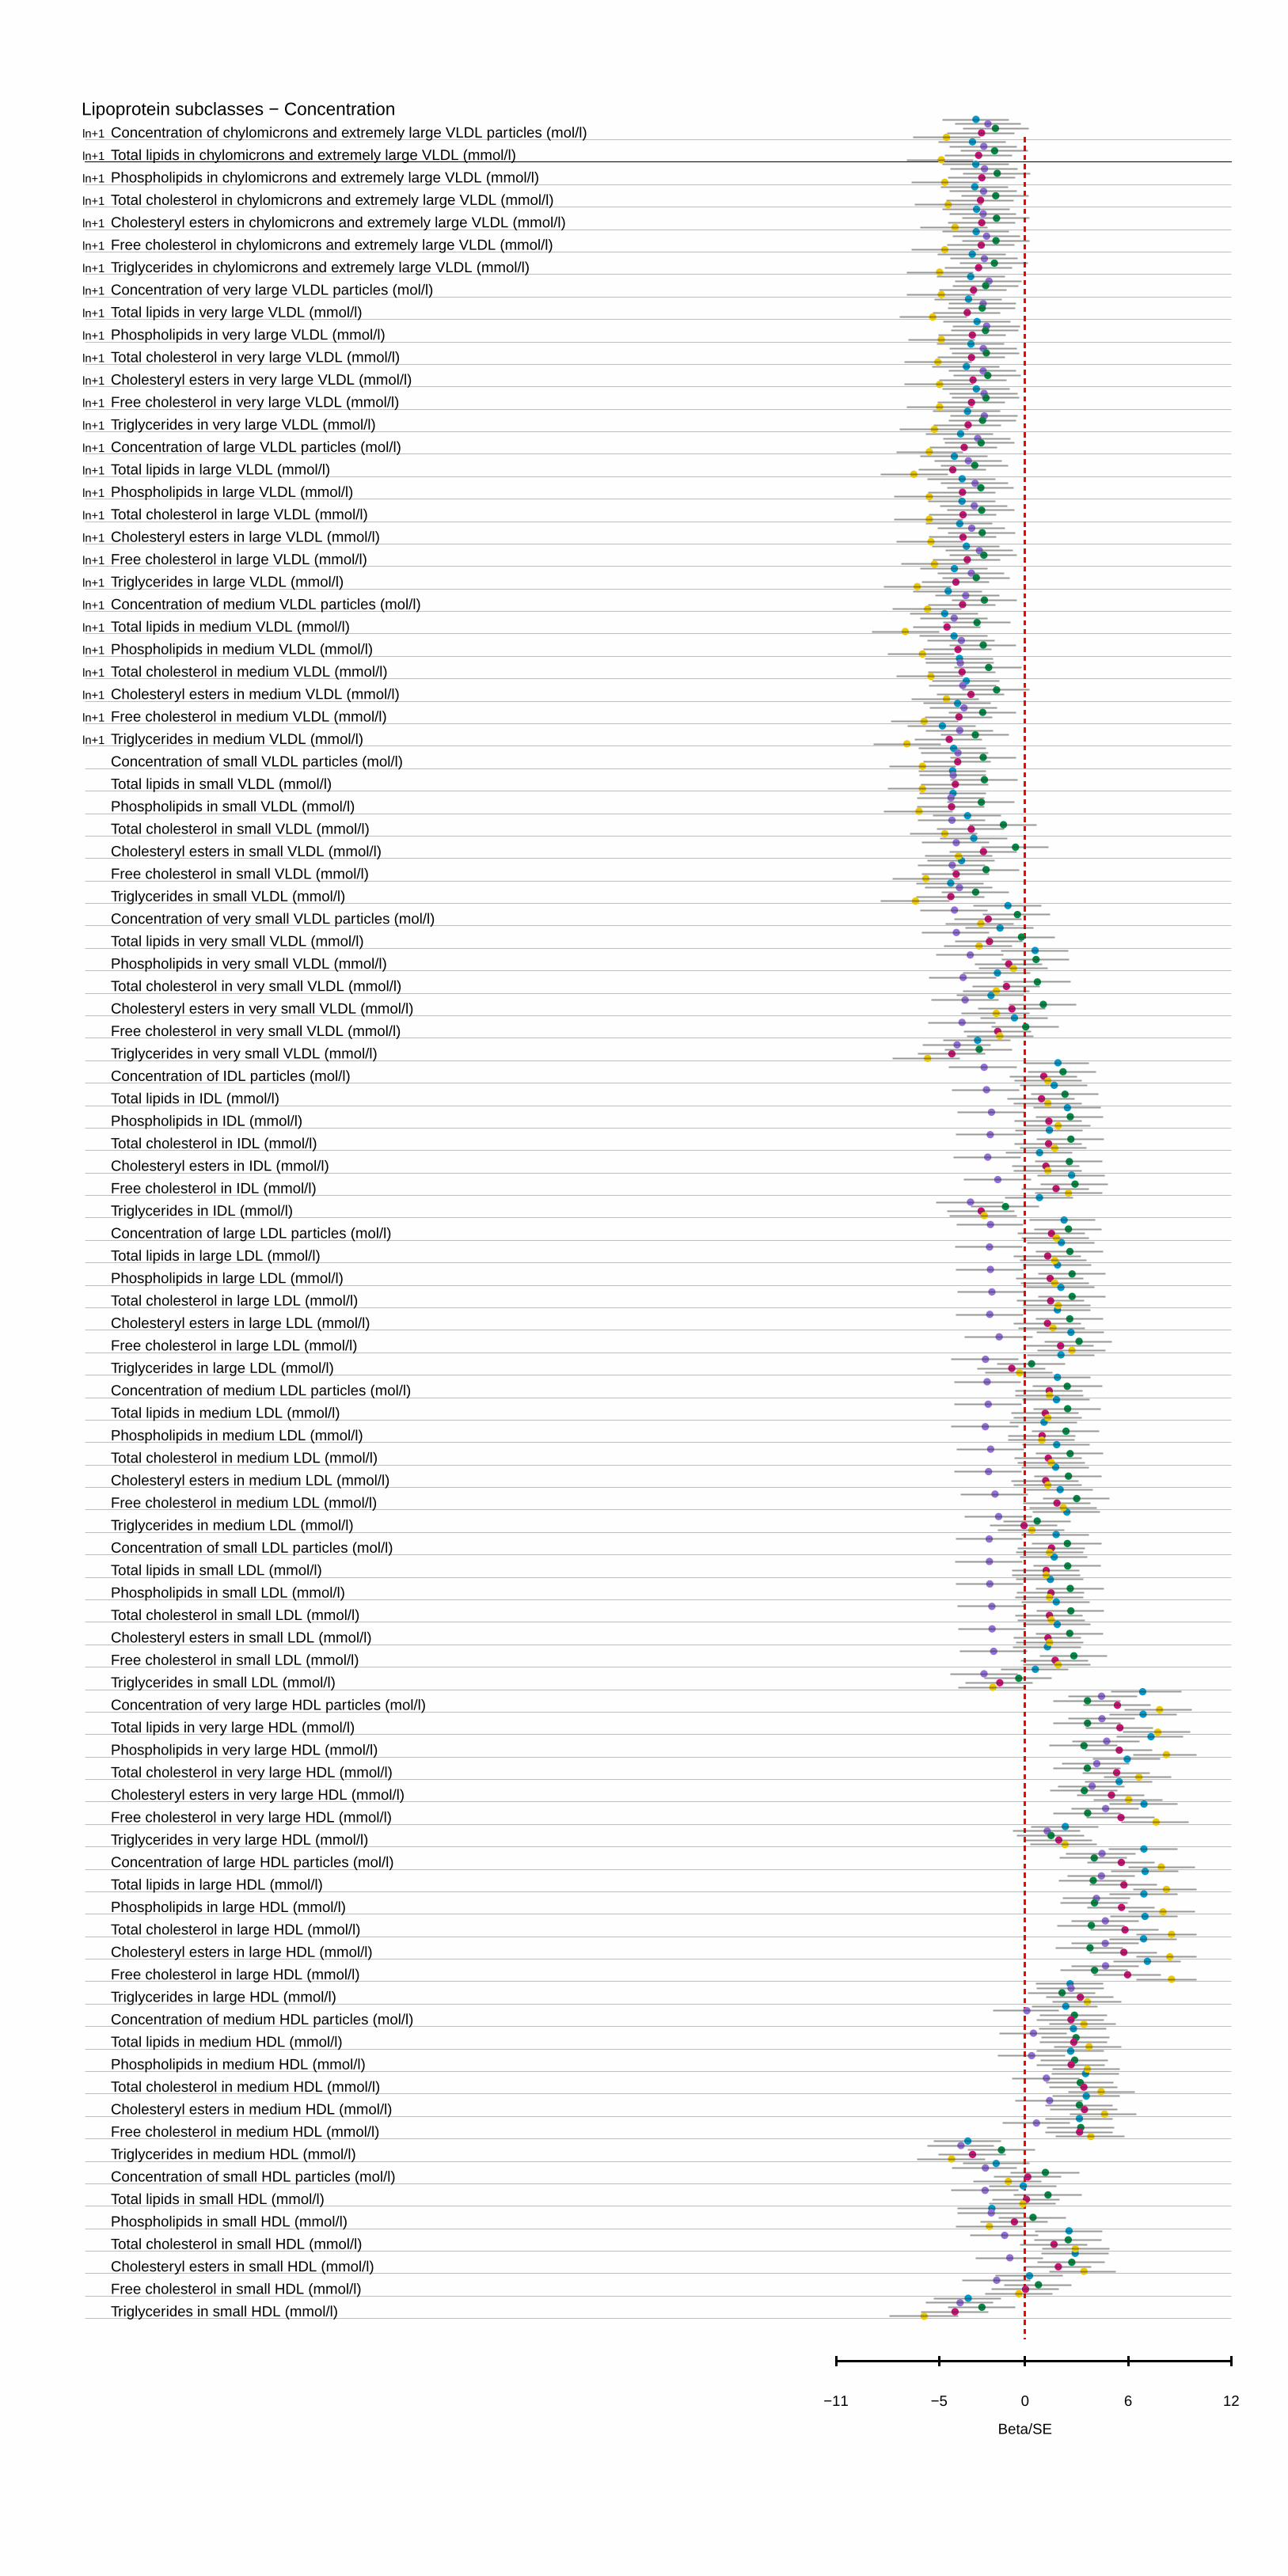
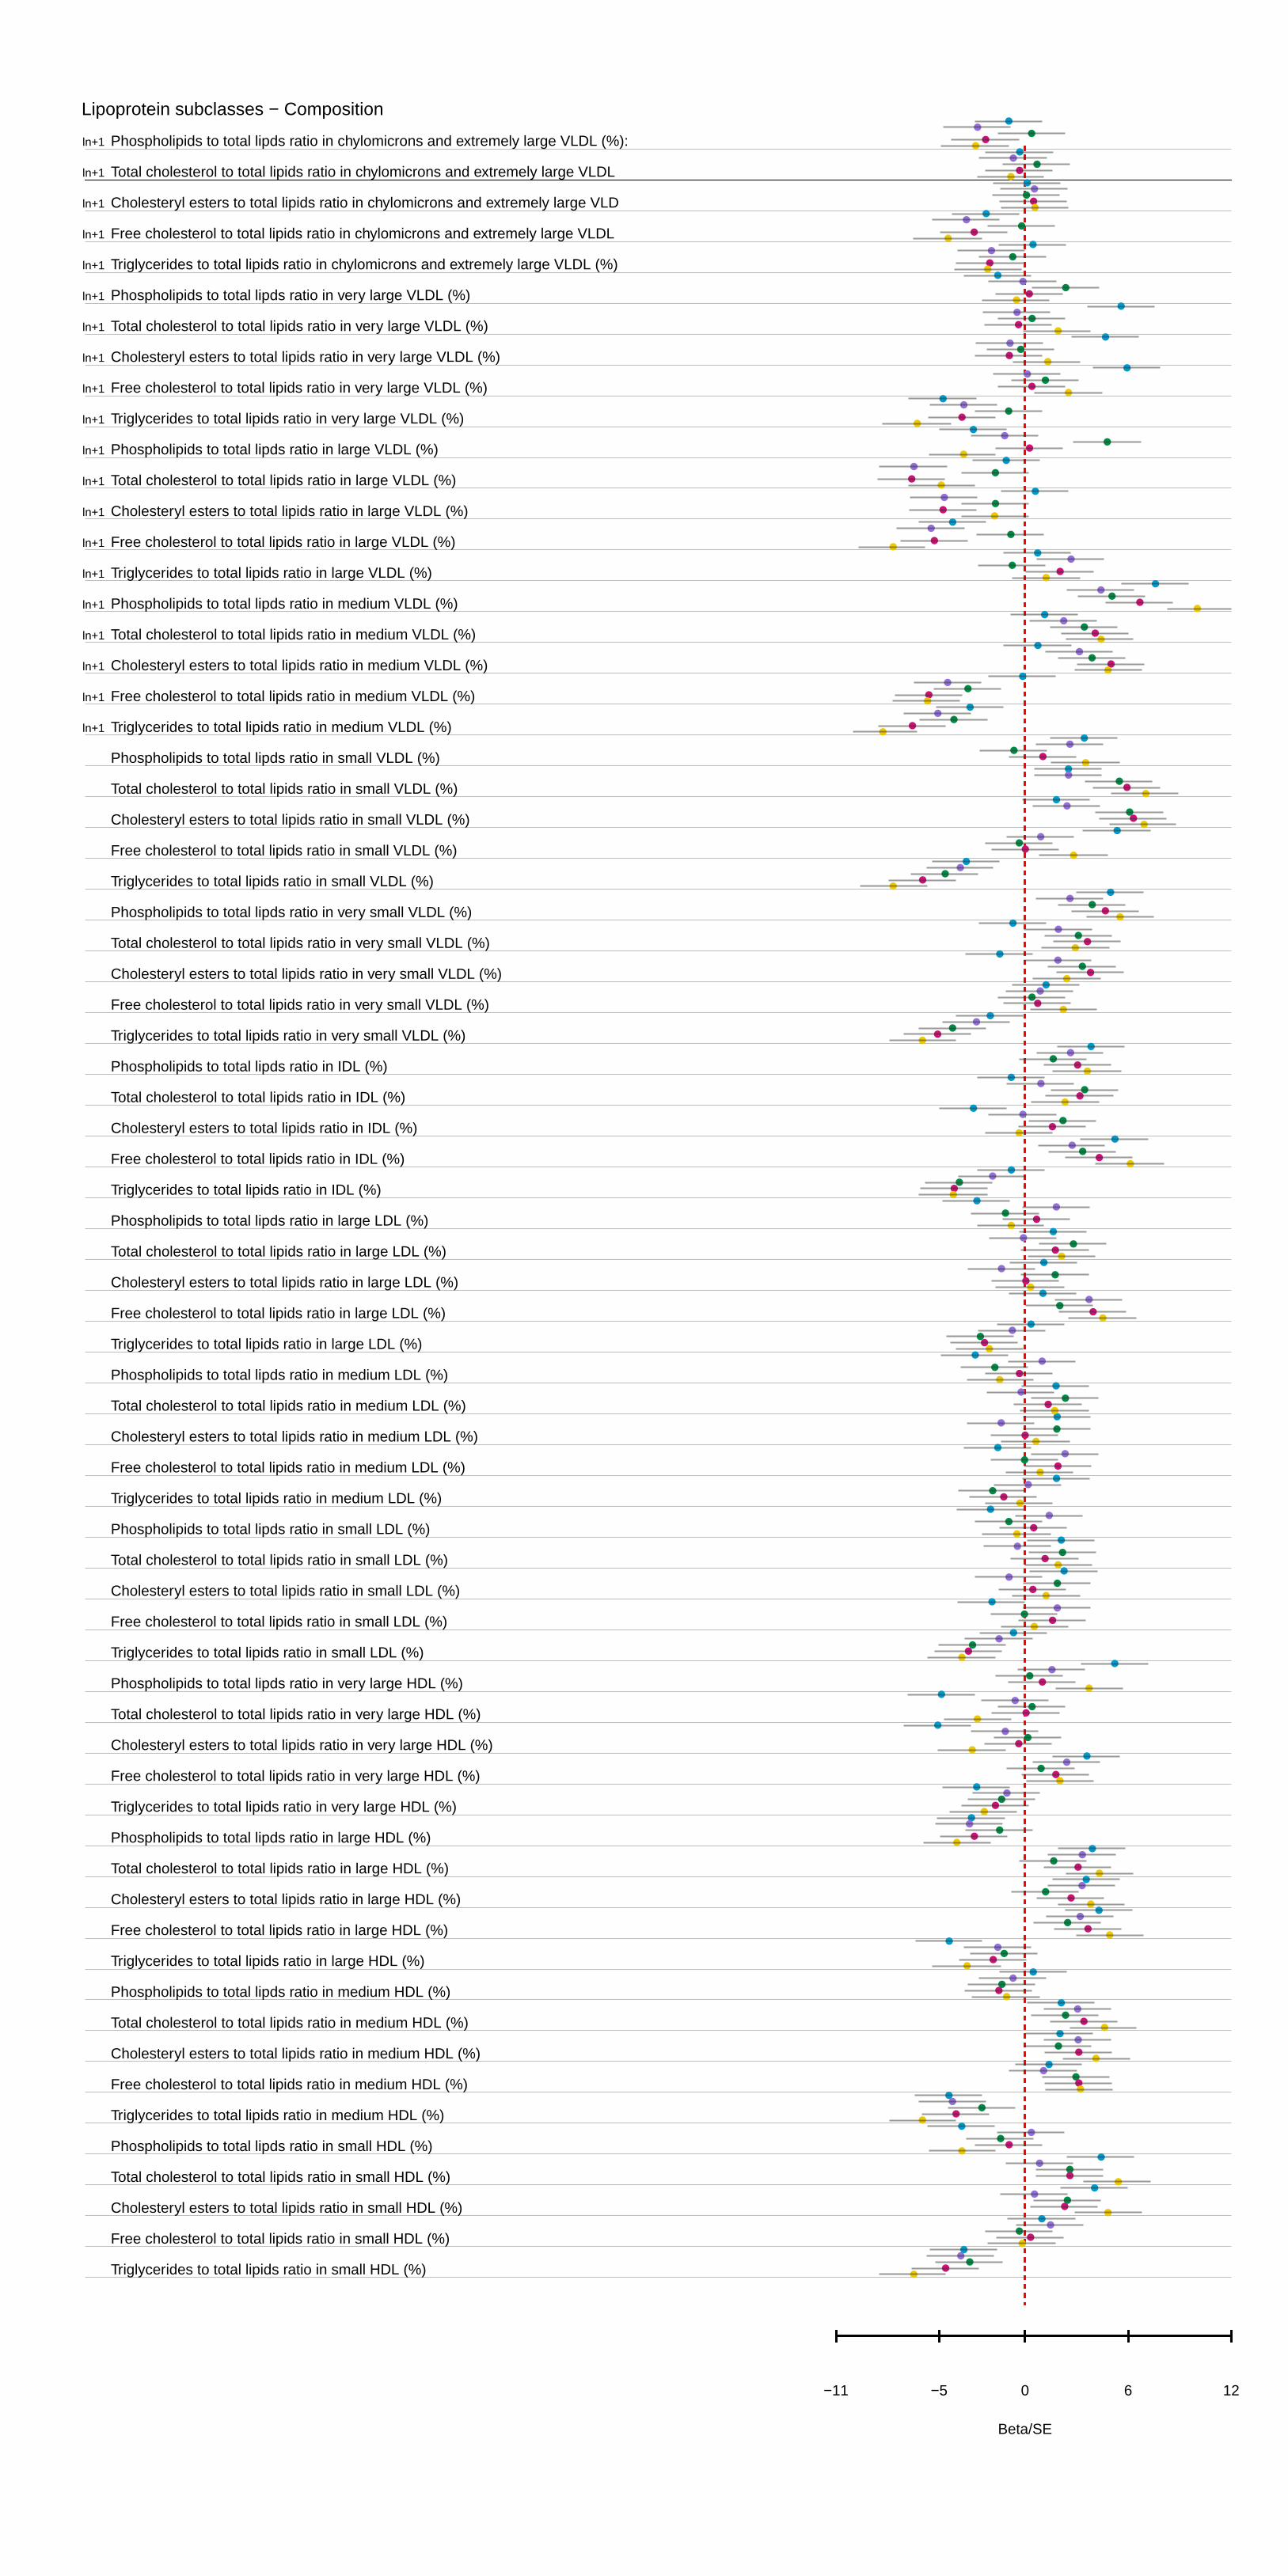
confidence interval 0.18–0.34 mmol/L; P=2.4×10⁻⁶). More generally, APOC3(rs138326449) showed an effect on a broad range of measures reflecting the circulating levels and lipid composition of VLDL and HDL particles (Figure 1). A full table of results for all 225 measures can be found in Table I in the Data Supplement. A comparison of the results from the mixed fasting–nonfasting analysis used and analysis based on fasting and nonfasting measurements showed broadly simi-lar association profiles, though there were differences in the nonfasting samples for specific measures of small HDL, very large VLDL, large LDL, remnant cholesterol, fatty acids, and glutamine (Table II in the Data Supplement).
In meta-analysis results of the ALSPAC mothers and BWHHS samples, 124 metabolic measures showed nominal evidence of association with APOC3(rs138326449) (P≤0.05; Table I in the Data Supplement), supporting 81 of the signals seen in the ALSPAC younger participants after adjustment for multiple testing (Table III in the Data Supplement). For both triglyceride and HDL, associations were stronger, but consistent with the young participant results (−0.23 mmol/L of geometric mean, 95% confidence interval −0.34 to −0.12 mmol/L; P=4.6×10⁻⁶ and 0.4191 mmol/L, 95% confidence interval 0.28–0.56 mmol/L; P=1.74×10⁻⁹, respectively). In addition to the VLDL and HDL measures of concentration and composition, evidence for an increase of the ratio of ω-6, polyunsaturated and monounsaturated fatty acids to total fatty acid, were also confirmed. When all 3 samples were consid-ered together, 118 associations were observed after adjustment for multiple testing, with 88 also showing evidence of asso-ciation in the random-effects model. Associations in ALSPAC
Table 1. Numbers of Individuals Measured and Key Characteristic of Samples Analyzed
ALSPAC Young Participants
ALSPAC Mothers BWHHS
N with NMR measurements
7176 4530 3646
N with NMR measurements and APOC3 information
6765 2463 3584
MAF of APOC3 % 0.20 0.26 0.28
N with NMR measurements and LPL information
5656 1953 1866
MAF of LPL 10.34 10.60 9.19
Sex (% females) 48.33 1 1
Age (years) (mean, interquartile range)
13.5 (7.5–17.7) 47.9 (45 - 51) 74.45 (70–79)
HDL mmol/L (mean, standard deviation)
1.44 (0.22) 1.69 (0.32) 1.67 (0.45)
TG mmol/L (geometric mean, untransformed standard deviation)
0.93 (0.18) 1.00 (0.24) 1.57 (0.31)
ALSPAC indicates The Avon Longitudinal Study of Parents and Children; APOC3, Apolipoprotein C-III; BWHHS, British Women Heart Health Study; HDL, high-density lipoprotein; LPL, lipoprotein lipase; MAF, minor allele frequency; NMR, nuclear magnetic resonance; and TG, triglyceride.
at University of Bristol Library on October 4, 2016http://circgenetics.ahajournals.org/Downloaded from
234 Circ Cardiovasc Genet June 2016
young participants, meta-analysis of ALSPAC mothers and BWHHS, and the meta-analysis of all 3 samples are presented in Figure I in the Data Supplement, with details for each asso-ciation in Table I in the Data Supplement.
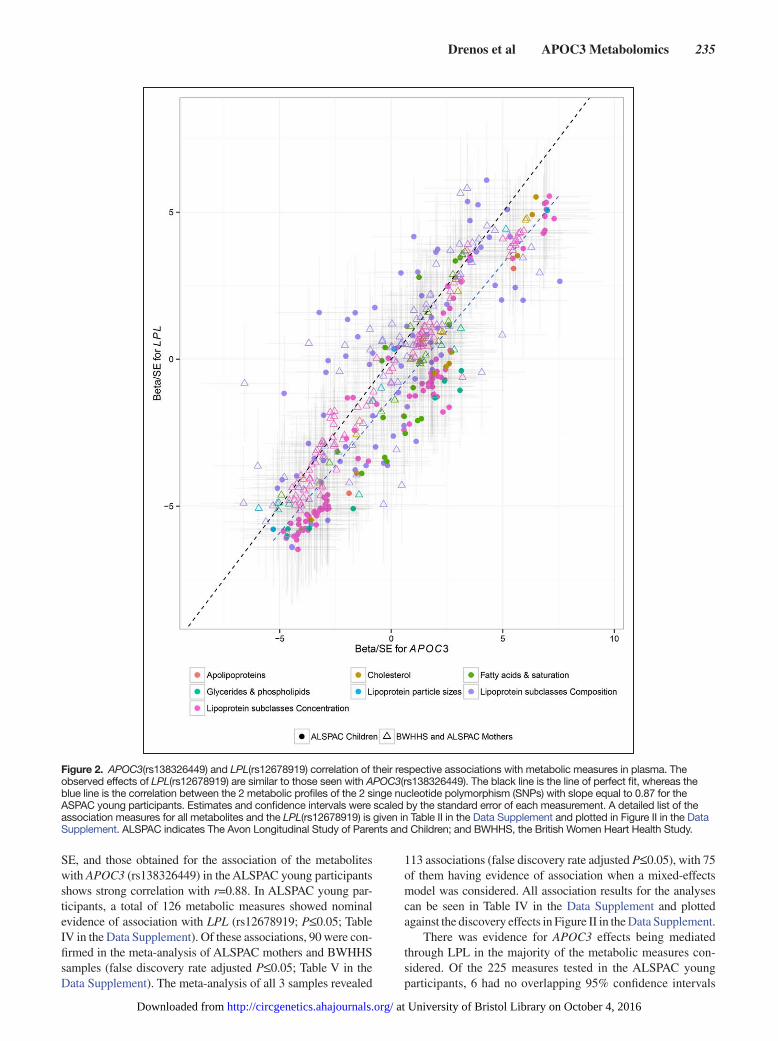
The pattern of associations between LPL (rs12678919) and the metabolic measures was very similar to that observed for APOC3 (rs138326449; Figure 2). A Pearson’s correlation test between the coefficients of LPL (rs12678919), scaled by their
Figure 1. APOC3(rs138326449) associations with selected metabolic measures in plasma in ALSPAC young participants and BWHHS–ALSPAC mothers in Beta/SE units. The variant is associated predominately with very low–density lipoprotein (VLDL) and high-density lipoprotein (HDL) concentration and composition, as well as particle size, cholesterol measures, and fatty acids. Multiple associations per particle are rep-resented by a single entry. Information on the transformation used is also provided. Estimates and confidence intervals were scaled by the stan-dard error of each measurement. Plot of the association of all 225 measured metabolites is given in Figure I in the Data Supplement. A detailed list of effect sizes and P values for all measures is given Table I in the Data Supplement. ALSPAC indicates The Avon Longitudinal Study of Parents and Children; BWHHS, the British Women Heart Health Study; HDL, high-density lipoprotein; and IDL, intermediate-density lipoproteins.
at University of Bristol Library on October 4, 2016http://circgenetics.ahajournals.org/Downloaded from
Drenos et al APOC3 Metabolomics 235
SE, and those obtained for the association of the metabolites with APOC3 (rs138326449) in the ALSPAC young participants shows strong correlation with r=0.88. In ALSPAC young par-ticipants, a total of 126 metabolic measures showed nominal evidence of association with LPL (rs12678919; P≤0.05; Table IV in the Data Supplement). Of these associations, 90 were con-firmed in the meta-analysis of ALSPAC mothers and BWHHS samples (false discovery rate adjusted P≤0.05; Table V in the Data Supplement). The meta-analysis of all 3 samples revealed
113 associations (false discovery rate adjusted P≤0.05), with 75 of them having evidence of association when a mixed-effects model was considered. All association results for the analyses can be seen in Table IV in the Data Supplement and plotted against the discovery effects in Figure II in the Data Supplement.
There was evidence for APOC3 effects being mediated through LPL in the majority of the metabolic measures con-sidered. Of the 225 measures tested in the ALSPAC young participants, 6 had no overlapping 95% confidence intervals
Figure 2. APOC3(rs138326449) and LPL(rs12678919) correlation of their respective associations with metabolic measures in plasma. The observed effects of LPL(rs12678919) are similar to those seen with APOC3(rs138326449). The black line is the line of perfect fit, whereas the blue line is the correlation between the 2 metabolic profiles of the 2 singe nucleotide polymorphism (SNPs) with slope equal to 0.87 for the ASPAC young participants. Estimates and confidence intervals were scaled by the standard error of each measurement. A detailed list of the association measures for all metabolites and the LPL(rs12678919) is given in Table II in the Data Supplement and plotted in Figure II in the Data Supplement. ALSPAC indicates The Avon Longitudinal Study of Parents and Children; and BWHHS, the British Women Heart Health Study.
at University of Bristol Library on October 4, 2016http://circgenetics.ahajournals.org/Downloaded from
236 Circ Cardiovasc Genet June 2016
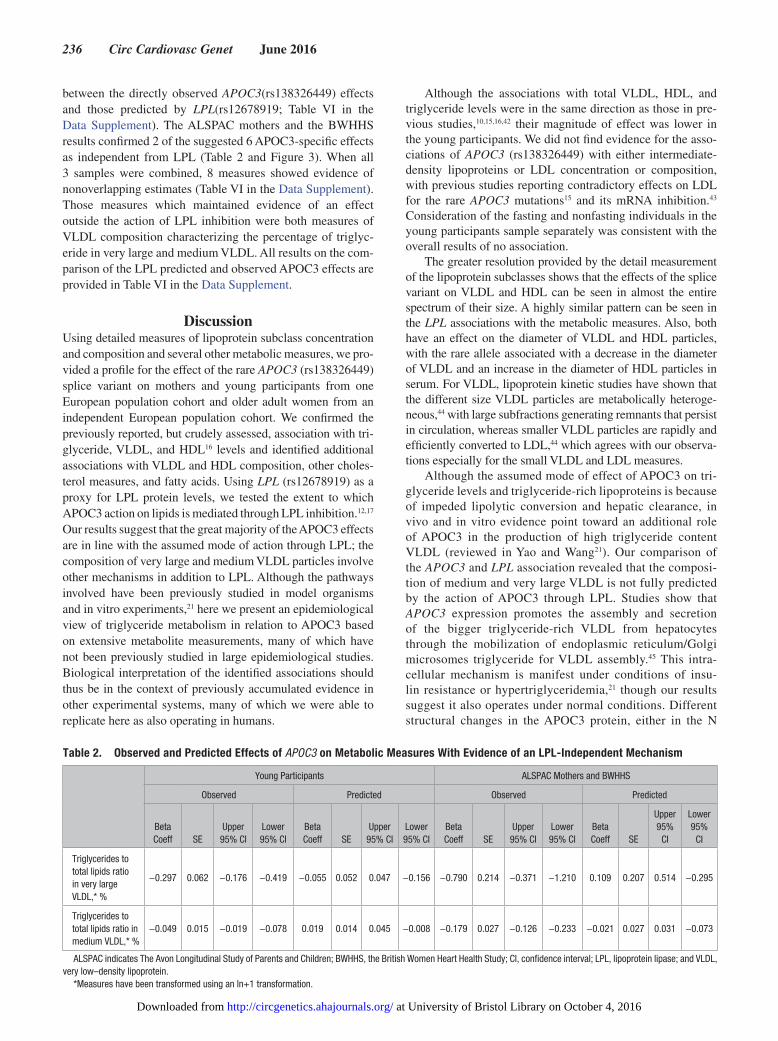
between the directly observed APOC3(rs138326449) effects and those predicted by LPL(rs12678919; Table VI in the Data Supplement). The ALSPAC mothers and the BWHHS results confirmed 2 of the suggested 6 APOC3-specific effects as independent from LPL (Table 2 and Figure 3). When all 3 samples were combined, 8 measures showed evidence of nonoverlapping estimates (Table VI in the Data Supplement). Those measures which maintained evidence of an effect outside the action of LPL inhibition were both measures of VLDL composition characterizing the percentage of triglyc-eride in very large and medium VLDL. All results on the com-parison of the LPL predicted and observed APOC3 effects are provided in Table VI in the Data Supplement.
DiscussionUsing detailed measures of lipoprotein subclass concentration and composition and several other metabolic measures, we pro-vided a profile for the effect of the rare APOC3 (rs138326449) splice variant on mothers and young participants from one European population cohort and older adult women from an independent European population cohort. We confirmed the previously reported, but crudely assessed, association with tri-glyceride, VLDL, and HDL16 levels and identified additional associations with VLDL and HDL composition, other choles-terol measures, and fatty acids. Using LPL (rs12678919) as a proxy for LPL protein levels, we tested the extent to which APOC3 action on lipids is mediated through LPL inhibition.12,17 Our results suggest that the great majority of the APOC3 effects are in line with the assumed mode of action through LPL; the composition of very large and medium VLDL particles involve other mechanisms in addition to LPL. Although the pathways involved have been previously studied in model organisms and in vitro experiments,21 here we present an epidemiological view of triglyceride metabolism in relation to APOC3 based on extensive metabolite measurements, many of which have not been previously studied in large epidemiological studies. Biological interpretation of the identified associations should thus be in the context of previously accumulated evidence in other experimental systems, many of which we were able to replicate here as also operating in humans.
Although the associations with total VLDL, HDL, and triglyceride levels were in the same direction as those in pre-vious studies,10,15,16,42 their magnitude of effect was lower in the young participants. We did not find evidence for the asso-ciations of APOC3 (rs138326449) with either intermediate-density lipoproteins or LDL concentration or composition, with previous studies reporting contradictory effects on LDL for the rare APOC3 mutations15 and its mRNA inhibition.43 Consideration of the fasting and nonfasting individuals in the young participants sample separately was consistent with the overall results of no association.
The greater resolution provided by the detail measurement of the lipoprotein subclasses shows that the effects of the splice variant on VLDL and HDL can be seen in almost the entire spectrum of their size. A highly similar pattern can be seen in the LPL associations with the metabolic measures. Also, both have an effect on the diameter of VLDL and HDL particles, with the rare allele associated with a decrease in the diameter of VLDL and an increase in the diameter of HDL particles in serum. For VLDL, lipoprotein kinetic studies have shown that the different size VLDL particles are metabolically heteroge-neous,44 with large subfractions generating remnants that persist in circulation, whereas smaller VLDL particles are rapidly and efficiently converted to LDL,44 which agrees with our observa-tions especially for the small VLDL and LDL measures.
Although the assumed mode of effect of APOC3 on tri-glyceride levels and triglyceride-rich lipoproteins is because of impeded lipolytic conversion and hepatic clearance, in vivo and in vitro evidence point toward an additional role of APOC3 in the production of high triglyceride content VLDL (reviewed in Yao and Wang21). Our comparison of the APOC3 and LPL association revealed that the composi-tion of medium and very large VLDL is not fully predicted by the action of APOC3 through LPL. Studies show that APOC3 expression promotes the assembly and secretion of the bigger triglyceride-rich VLDL from hepatocytes through the mobilization of endoplasmic reticulum/Golgi microsomes triglyceride for VLDL assembly.45 This intra-cellular mechanism is manifest under conditions of insu-lin resistance or hypertriglyceridemia,21 though our results suggest it also operates under normal conditions. Different structural changes in the APOC3 protein, either in the N
Table 2. Observed and Predicted Effects of APOC3 on Metabolic Measures With Evidence of an LPL-Independent Mechanism
Young Participants ALSPAC Mothers and BWHHS
Observed Predicted Observed Predicted
Beta Coeff SE
Upper 95% CI
Lower 95% CI
Beta Coeff SE
Upper 95% CI
Lower 95% CI
Beta Coeff SE
Upper 95% CI
Lower 95% CI
Beta Coeff SE
Upper 95%
CI
Lower 95%
CI
Triglycerides to total lipids ratio in very large VLDL,* %
−0.297 0.062 −0.176 −0.419 −0.055 0.052 0.047 −0.156 −0.790 0.214 −0.371 −1.210 0.109 0.207 0.514 −0.295
Triglycerides to total lipids ratio in medium VLDL,* %
−0.049 0.015 −0.019 −0.078 0.019 0.014 0.045 −0.008 −0.179 0.027 −0.126 −0.233 −0.021 0.027 0.031 −0.073
ALSPAC indicates The Avon Longitudinal Study of Parents and Children; BWHHS, the British Women Heart Health Study; CI, confidence interval; LPL, lipoprotein lipase; and VLDL, very low–density lipoprotein.
*Measures have been transformed using an ln+1 transformation.
at University of Bristol Library on October 4, 2016http://circgenetics.ahajournals.org/Downloaded from
Drenos et al APOC3 Metabolomics 237
or C terminals, affect the assembly and secretion of larger VLDL particles in different ways46,47 but have no effect on the triglyceride-poor smaller VLDL particles.
Our observations of a APOC3 LPL-independent triglycer-ide-related pathway agree with Gaudet et al,48 testing the effects of an APOC3 mRNA inhibitor on familial chylomicronemia syndrome sufferers. In this case, deficiency in LPL leads to severe hypertriglyceridemia, which can result in recurrent and potentially fatal pancreatitis. When 3 patients were given an APOC3 inhibitor that lowered their APOC3 levels, a reduction of triglyceride was observed.48 Similar results were obtained in patients with severe or uncontrolled hypertriglyceridemia.43 Although we did not find an LPL-independent effect on total serum triglyceride, either because of lack of statistical power or because of the differences between hypertriglyceridemia patients and the samples available here representing the gen-eral population, the availability of more refined measures of triglyceride concentration in specific subclasses permitted the identification of the likely mechanism responsible for the effect of APOC3 inhibition. Our results point toward changes in the composition of VLDL and its proportion of triglycer-ide though an intrahepatic pathway, rather than a mechanism involving changes in triglyceride absorption.
Our study has several limitations, mainly in relation to the differences in age and sex between the 3 study samples and the mix of fasting and nonfasting status in ALSPAC children. For these reasons, the ALSPAC mothers and BWHHS samples were only considered as able to confirm the common observed associations, with false positives indinguishable from hetero-geneity between the samples because of age and sex for the discordant result. Fasting status in the ALSPAC young partici-pants was addressed through a sensitivity analysis excluding nonfasting individuals, with no evidence of an effect that can change our conclusions. Finally, the low number of the rare APOC3(rs138326449) variant carriers might have contributed to the no identification of true associations because of low
statistical power, especially in the proportional modeling part of our work.
To summarize, we were able to refine and characterize the effects of the newly discovered APOC3(rs138326449) loss of function mutation in lipoprotein metabolism and its potential to affect triglyceride levels. We also characterized the effects of the GWAS lead signal in the area of LPL rs12678919 and compared its action to that of the APOC3 variant. Our findings suggest that the APOC3 variant has a wide range of actions on lipids and fatty acids beyond its known effect on triglyceride and HDL. Although our novel analyses suggest that much of the action of APOC3 on lipids is mediated via LPL action, as hypothesized, a parallel intracellular mechanism previously only observed in model organisms and cell cultures under conditions mimicking pathophysiological disorders also seem to be relevant for the composition of VLDL particles. Our results support the results of clinical trials on LPL-deficient patients for ISIS 304801, an antisense oligonucleotide inhibitor of APOC3 mRNA and, thus, illustrate the possible use of such approaches as a relatively quick and low-cost tool in the evaluation of drug targets.
AcknowledgmentsWe are extremely grateful to all the families who took part in this study, the midwives for their help in recruiting them, and the whole ALSPAC team, which includes interviewers, computer and labora-tory technicians, clerical workers, research scientists, volunteers, managers, receptionists, and nurses. This publication is the work of the authors, and Drs Drenos and Timpson will serve as guarantors for the contents of this article. GWAS data were generated by Sample Logistics and Genotyping Facilities at the Wellcome Trust Sanger Institute and LabCorp (Laboratory Corportation of America) using support from 23andMe.
Sources of FundingThe UK Medical Research Council and the Wellcome Trust (Grant ref: 102215/2/13/2) and the University of Bristol provide core support for ALSPAC. Grants from the British Heart Foundation (SP/07/008/24066) and Wellcome Trust (WT092830M and WT088806) funded data
Figure 3. Expected and observed APOC3–metabolites associations for the subset of metabolites with a lipoprotein lipase (LPL)–indepen-dent effect. The coefficients and confidence interval (CIs) are scaled by the SE of the observed effect. ALSPAC indicates The Avon Longi-tudinal Study of Parents and Children; BWHHS, the British Women Heart Health Study; and VLDL, very low–density lipoprotein.
at University of Bristol Library on October 4, 2016http://circgenetics.ahajournals.org/Downloaded from
238 Circ Cardiovasc Genet June 2016
collection from the ALSPAC mothers. The British Women’s Heart and Health Study has been supported by funding from the British Heart Foundation (BHF; grant PG/13/66/304422). Drs Drenos, Timpson, Davey Smith, and Lawlor all work in a Unit receiving funds from the UK Medical Research Council (MC_UU_12013/1–9). Dr Lawlor is a UK NIH Research Senior Investigator (NF-SI-0611-10196). Dr Würtz is funded by the Finnish Diabetes Research Foundation and the Novo Nordisk Foundation. Dr Kettunen was supported from the Academy of Finland (grant number 283045). The quantitative serum nuclear magnetic resonance (NMR) metabolomics platform and its develop-ment have been supported by the Academy of Finland, TEKES (the Finnish Funding Agency for Technology and Innovation), the Sigrid Juselius Foundation, the Novo Nordisk Foundation, the Finnish Diabetes Research Foundation, the Paavo Nurmi Foundation, and the strategic and infrastructural research funding from the University of Oulu, Finland, as well as by the British Heart Foundation, the Wellcome Trust, and the Medical Research Council, UK. The views expressed in this article are those of the authors and not neces-sarily any funding body. The funders did not have any influence over data collection, analyses, and interpretation of findings or writing of this article.
DisclosuresA.J. Kangas and Drs Soininen, Würtz, Kettunen, and Ala-Korpela are shareholders of Brainshake Ltd (www.brainshake.fi), a com-pany offering NMR-based metabolite profiling. A. Kangas and Drs Soininen, Würtz, and Kettunen report employment and consulting for Brainshake Ltd. The other authors report no conflicts.
References 1. Nordestgaard BG, Benn M, Schnohr P, Tybjaerg-Hansen A. Nonfasting
triglycerides and risk of myocardial infarction, ischemic heart disease, and death in men and women. JAMA. 2007;298:299–308. doi: 10.1001/jama.298.3.299.
2. Thomsen M, Varbo A, Tybjærg-Hansen A, Nordestgaard BG. Low nonfasting triglycerides and reduced all-cause mortality: a mende-lian randomization study. Clin Chem. 2014;60:737–746. doi: 10.1373/clinchem.2013.219881.
3. Varbo A, Benn M, Tybjærg-Hansen A, Jørgensen AB, Frikke-Schmidt R, Nordestgaard BG. Remnant cholesterol as a causal risk factor for isch-emic heart disease. J Am Coll Cardiol. 2013;61:427–436. doi: 10.1016/j.jacc.2012.08.1026.
4. Goldberg IJ, Eckel RH, McPherson R. Triglycerides and heart disease: still a hypothesis? Arterioscler Thromb Vasc Biol. 2011;31:1716–1725. doi: 10.1161/ATVBAHA.111.226100.
5. Holmes MV, Asselbergs FW, Palmer TM, Drenos F, Lanktree MB, Nelson CP, et al.; UCLEB consortium. Mendelian randomization of blood lipids for coronary heart disease. Eur Heart J. 2015;36:539–550. doi: 10.1093/eurheartj/eht571.
6. Nordestgaard BG, Varbo A. Triglycerides and cardiovascular disease. Lancet. 2014;384:626–635. doi: 10.1016/S0140-6736(14)61177-6.
7. Shaikh M, Wootton R, Nordestgaard BG, Baskerville P, Lumley JS, La Ville AE, et al. Quantitative studies of transfer in vivo of low density, Sf 12-60, and Sf 60-400 lipoproteins between plasma and arterial intima in humans. Arterioscler Thromb. 1991;11:569–577.
8. Rutledge JC, Mullick AE, Gardner G, Goldberg IJ. Direct visualization of lipid deposition and reverse lipid transport in a perfused artery: roles of VLDL and HDL. Circ Res. 2000;86:768–773.
9. Chapman MJ, Ginsberg HN, Amarenco P, Andreotti F, Borén J, Catapano AL, et al.; European Atherosclerosis Society Consensus Panel. Triglycer-ide-rich lipoproteins and high-density lipoprotein cholesterol in patients at high risk of cardiovascular disease: evidence and guidance for manage-ment. Eur Heart J. 2011;32:1345–1361. doi: 10.1093/eurheartj/ehr112.
10. Jørgensen AB, Frikke-Schmidt R, Nordestgaard BG, Tybjærg-Hansen A. Loss-of-function mutations in APOC3 and risk of ischemic vascular dis-ease. N Engl J Med. 2014;371:32–41. doi: 10.1056/NEJMoa1308027.
11. Xiao C, Lewis GF. Regulation of chylomicron production in hu-mans. Biochim Biophys Acta. 2012;1821:736–746. doi: 10.1016/j.bbalip.2011.09.019.
12. Ooi EM, Barrett PH, Chan DC, Watts GF. Apolipoprotein C-III: un-derstanding an emerging cardiovascular risk factor. Clin Sci (Lond). 2008;114:611–624. doi: 10.1042/CS20070308.
13. Kent WJ, Sugnet CW, Furey TS, Roskin KM, Pringle TH, Zahler AM, et al. The human genome browser at UCSC. Genome Res. 2002;12:996–1006. doi: 10.1101/gr.229102. Article published online before print in May 2002.
14. Tachmazidou I, Dedoussis G, Southam L, Farmaki AE, Ritchie GR, Xifara DK, et al.; UK10K consortium. A rare functional cardioprotective APOC3 variant has risen in frequency in distinct population isolates. Nat Commun. 2013;4:2872. doi: 10.1038/ncomms3872.
15. Crosby J, Peloso GM, Auer PL, Crosslin DR, Stitziel NO, Lange LA, et al. Loss-of-function mutations in APOC3, triglycerides, and coronary dis-ease. N Engl J Med. 2014;371:22–31.
16. Timpson NJ, Walter K, Min JL, Tachmazidou I, Malerba G, Shin SY, et al; UK1OK Consortium Members; UK1OK Consortium Members. A rare variant in APOC3 is associated with plasma triglyceride and VLDL levels in Europeans. Nat Commun. 2014;5:4871. doi: 10.1038/ncomms5871.
17. Ginsberg HN, Le NA, Goldberg IJ, Gibson JC, Rubinstein A, Wang-Iver-son P, et al. Apolipoprotein B metabolism in subjects with deficiency of apolipoproteins CIII and AI. Evidence that apolipoprotein CIII inhibits catabolism of triglyceride-rich lipoproteins by lipoprotein lipase in vivo. J Clin Invest. 1986;78:1287–1295. doi: 10.1172/JCI112713.
18. Global Lipids Genetics Consortium; Willer CJ, Schmidt EM, Sengupta S, et al. Discovery and refinement of loci associated with lipid levels. Nat Genet. 2013;45:1274–1283. doi: 10.1038/ng.2797.
19. Dichgans M, Malik R, König IR, Rosand J, Clarke R, Gretarsdottir S, et al; METASTROKE Consortium; CARDIoGRAM Consortium; C4D Consortium; International Stroke Genetics Consortium. Shared genetic susceptibility to ischemic stroke and coronary artery disease: a genome-wide analysis of common variants. Stroke. 2014;45:24–36. doi: 10.1161/STROKEAHA.113.002707.
20. Zheng C, Khoo C, Ikewaki K, Sacks FM. Rapid turnover of apolipoprotein C-III-containing triglyceride-rich lipoproteins contributing to the forma-tion of LDL subfractions. J Lipid Res. 2007;48:1190–1203. doi: 10.1194/jlr.P600011-JLR200.
21. Yao Z, Wang Y. Apolipoprotein C-III and hepatic triglyceride-rich lipo-protein production. Curr Opin Lipidol. 2012;23:206–212. doi: 10.1097/MOL.0b013e328352dc70.
22. Soininen P, Kangas AJ, Würtz P, Suna T, Ala-Korpela M. Quantitative serum nuclear magnetic resonance metabolomics in cardiovascular epi-demiology and genetics. Circ Cardiovasc Genet. 2015;8:192–206. doi: 10.1161/CIRCGENETICS.114.000216.
23. Boyd A, Golding J, Macleod J, Lawlor DA, Fraser A, Henderson J, et al. Cohort Profile: the ‘children of the 90s’–the index offspring of the Avon Longitudinal Study of Parents and Children. Int J Epidemiol. 2013;42:111–127. doi: 10.1093/ije/dys064.
24. Lawlor DA, Bedford C, Taylor M, Ebrahim S. Geographical variation in cardiovascular disease, risk factors, and their control in older women: British Women’s Heart and Health Study. J Epidemiol Community Health. 2003;57:134–140.
25. Soininen P, Kangas AJ, Würtz P, Tukiainen T, Tynkkynen T, Laatikainen R, et al. High-throughput serum NMR metabonomics for cost-effective holistic studies on systemic metabolism. Analyst. 2009;134:1781–1785. doi: 10.1039/b910205a.
26. Würtz P, Mäkinen VP, Soininen P, Kangas AJ, Tukiainen T, Kettunen J, et al. Metabolic signatures of insulin resistance in 7,098 young adults. Diabetes. 2012;61:1372–1380. doi: 10.2337/db11-1355.
27. Kettunen J, Tukiainen T, Sarin AP, Ortega-Alonso A, Tikkanen E, Lyy-tikäinen LP, et al. Genome-wide association study identifies multiple loci influencing human serum metabolite levels. Nat Genet. 2012;44:269–276. doi: 10.1038/ng.1073.
28. Kujala UM, Mäkinen VP, Heinonen I, Soininen P, Kangas AJ, Le-skinen TH, et al. Long-term leisure-time physical activity and se-rum metabolome. Circulation. 2013;127:340–348. doi: 10.1161/CIRCULATIONAHA.112.105551.
29. Fischer K, Kettunen J, Würtz P, Haller T, Havulinna AS, Kangas AJ, et al. Biomarker profiling by nuclear magnetic resonance spectroscopy for the prediction of all-cause mortality: an observational study of 17,345 per-sons. PLoS Med. 2014;11:e1001606. doi: 10.1371/journal.pmed.1001606.
30. Würtz P, Wang Q, Kangas AJ, Richmond RC, Skarp J, Tiainen M, et al. Metabolic signatures of adiposity in young adults: Mendelian randomiza-tion analysis and effects of weight change. PLoS Med. 2014;11:e1001765. doi: 10.1371/journal.pmed.1001765.
31. Würtz P, Havulinna AS, Soininen P, Tynkkynen T, Prieto-Merino D, Tillin T, et al. Metabolite profiling and cardiovascular event risk: a prospective
at University of Bristol Library on October 4, 2016http://circgenetics.ahajournals.org/Downloaded from
Drenos et al APOC3 Metabolomics 239
study of 3 population-based cohorts. Circulation. 2015;131:774–785. doi: 10.1161/CIRCULATIONAHA.114.013116.
32. Inouye M, Kettunen J, Soininen P, Silander K, Ripatti S, Kumpula LS, et al. Metabonomic, transcriptomic, and genomic variation of a population cohort. Mol Syst Biol. 2010;6:441. doi: 10.1038/msb.2010.93.
33. Sidhu D, Naugler C. Fasting time and lipid levels in a community-based population: a cross-sectional study. Arch Intern Med. 2012;172:1707–1710. doi: 10.1001/archinternmed.2012.3708.
34. Smith AJ, Palmen J, Putt W, Talmud PJ, Humphries SE, Drenos F. Ap-plication of statistical and functional methodologies for the investigation of genetic determinants of coronary heart disease biomarkers: lipoprotein lipase genotype and plasma triglycerides as an exemplar. Hum Mol Genet. 2010;19:3936–3947. doi: 10.1093/hmg/ddq308.
35. Bønnelykke K, Matheson MC, Pers TH, Granell R, Strachan DP, Alves AC, et al; Australian Asthma Genetics Consortium (AAGC); EArly Genetics and Lifecourse Epidemiology (EAGLE) Consortium. Meta-analysis of genome-wide association studies identifies ten loci influenc-ing allergic sensitization. Nat Genet. 2013;45:902–906. doi: 10.1038/ng.2694.
36. Shah T, Engmann J, Dale C, Shah S, White J, Giambartolomei C, et al; UCLEB Consortium. Population genomics of cardiometabolic traits: de-sign of the University College London-London School of Hygiene and Tropical Medicine-Edinburgh-Bristol (UCLEB) Consortium. PLoS One. 2013;8:e71345. doi: 10.1371/journal.pone.0071345.
37. Chen MH, Yang Q. GWAF: an R package for genome-wide associa-tion analyses with family data. Bioinformatics. 2010;26:580–581. doi: 10.1093/bioinformatics/btp710.
38. Higgins JP, Thompson SG, Spiegelhalter DJ. A re-evaluation of random-effects meta-analysis. J R Stat Soc Ser A Stat Soc. 2009;172:137–159. doi: 10.1111/j.1467-985X.2008.00552.x.
39. Benjamini Y, Yekutieli D. The control of the false discovery rate in mul-tiple testing under dependency. Ann Stat. 2001;29:1165–1188.
40. R: A language and environment for statistical computing. [computer pro-gram]. Version 3.1.0. Vienna, Austria; 2014.
41. Wickham H. ggplot2: elegant graphics for data analysis. New York: Springer; 2009.
42. Graham MJ, Lee RG, Bell TA III, Fu W, Mullick AE, Alexander VJ, et al. Antisense oligonucleotide inhibition of apolipoprotein C-III reduces plasma triglycerides in rodents, nonhuman primates, and humans. Circ Res. 2013;112:1479–1490. doi: 10.1161/CIRCRESAHA.111.300367.
43. Gaudet D, Alexander VJ, Baker BF, Brisson D, Tremblay K, Singleton W, et al. Antisense inhibition of apolipoprotein C-III in patients with hypertriglyceridemia. N Engl J Med. 2015;373:438–447. doi: 10.1056/NEJMoa1400283.
44. Packard CJ, Shepherd J. Lipoprotein heterogeneity and apolipoprotein B metabolism. Arterioscler Thromb Vasc Biol. 1997;17:3542–3556.
45. Sundaram M, Zhong S, Bou Khalil M, Links PH, Zhao Y, Iqbal J, et al. Expression of apolipoprotein C-III in McA-RH7777 cells enhances VLDL assembly and secretion under lipid-rich conditions. J Lipid Res. 2010;51:150–161. doi: 10.1194/M900346-JLR200.
46. Qin W, Sundaram M, Wang Y, Zhou H, Zhong S, Chang CC, et al. Mis-sense mutation in APOC3 within the C-terminal lipid binding domain of human ApoC-III results in impaired assembly and secretion of tria-cylglycerol-rich very low density lipoproteins: evidence that ApoC-III plays a major role in the formation of lipid precursors within the micro-somal lumen. J Biol Chem. 2011;286:27769–27780. doi: 10.1074/jbc.M110.203679.
47. Sundaram M, Zhong S, Bou Khalil M, Zhou H, Jiang ZG, Zhao Y, et al. Functional analysis of the missense APOC3 mutation Ala23Thr associated with human hypotriglyceridemia. J Lipid Res. 2010;51:1524–1534. doi: 10.1194/jlr.M005108.
48. Gaudet D, Brisson D, Tremblay K, Alexander VJ, Singleton W, Hughes SG, et al. Targeting APOC3 in the familial chylomicronemia syndrome. N Engl J Med. 2014;371:2200–2206. doi: 10.1056/NEJMoa1400284.
CLINICAL PERSPECTIVEPlasma triglycerides are robustly associated with atherosclerosis and coronary heart disease. Apolipoprotein C-III (APOC3), encoded by the APOC3 gene, is a common component of triglycerides-rich lipoproteins and plays an important role in their hydrolysis by lipoprotein lipase and their subsequent uptake into hepatocytes. Loss-of-function APOC3 mutations have been associated with lower levels of triglycerides and decreased coronary heart disease risk. Here we studied a rare APOC3 variant (rs138326449) in participants of 2 European population cohorts measuring a range of metabolic measures, mainly lipids associated, using a high-throughput nuclear magnetic resonance metabolomics platform. Among others, the muta-tion was associated with decreased very low–density lipoprotein and increased high-density lipoprotein and a decrease of their triglycerides content. No evidence of association could be established with low-density lipoprotein or other remnant cholesterol measures. Comparison between the effects of the APOC3 mutation and the LPL lead signal from GWAS studies revealed that they have similar metabolic effects. Two measures for the proportion of triglycerides in large and medium very low–density lipoprotein do not completely fit the classic model of APOC3 inhibition of lipoprotein lipase. Our results sup-port, on an epidemiological level, an alternative intrahepatic role for the mobilization of intracellular triglycerides for larger very low–density lipoprotein assembly, as observed in animal models and in vitro experiments under conditions mimicking insulin resistance or hypertriglyceridemia, in healthy individuals. This mechanism may be relevant to the action of the ISIS 304801 antisense oligonucleotide inhibitor of APOC3 mRNA to lower triglycerides in patients with lipoprotein lipase defi-ciency or hypertriglyceridemia.
at University of Bristol Library on October 4, 2016http://circgenetics.ahajournals.org/Downloaded from
and Nicholas J. TimpsonSoininen, Antti J. Kangas, Caroline Dale, Debbie A. Lawlor, Tom R. Gaunt, Juan-Pablo Casas Fotios Drenos, George Davey Smith, Mika Ala-Korpela, Johannes Kettunen, Peter Würtz, Pasi
Independent Effects−Lipoprotein Lipase and Its APOC3Metabolic Characterization of a Rare Genetic Variation Within
Print ISSN: 1942-325X. Online ISSN: 1942-3268 Copyright © 2016 American Heart Association, Inc. All rights reserved.
Dallas, TX 75231is published by the American Heart Association, 7272 Greenville Avenue,Circulation: Cardiovascular Genetics
doi: 10.1161/CIRCGENETICS.115.0013022016;9:231-239; originally published online April 25, 2016;Circ Cardiovasc Genet.
Free via Open Access http://circgenetics.ahajournals.org/content/9/3/231
World Wide Web at: The online version of this article, along with updated information and services, is located on the
http://circgenetics.ahajournals.org/content/suppl/2016/04/25/CIRCGENETICS.115.001302.DC1.htmlData Supplement (unedited) at:
http://circgenetics.ahajournals.org//subscriptions/
is online at: Circulation: Cardiovascular Genetics Information about subscribing to Subscriptions:
http://www.lww.com/reprints Information about reprints can be found online at: Reprints:
document. Permissions and Rights Question and Answer information about this process is available in the
requested is located, click Request Permissions in the middle column of the Web page under Services. FurtherCenter, not the Editorial Office. Once the online version of the published article for which permission is being
can be obtained via RightsLink, a service of the Copyright ClearanceCirculation: Cardiovascular Geneticsin Requests for permissions to reproduce figures, tables, or portions of articles originally publishedPermissions:
at University of Bristol Library on October 4, 2016http://circgenetics.ahajournals.org/Downloaded from
SUPPLEMENTAL MATERIAL
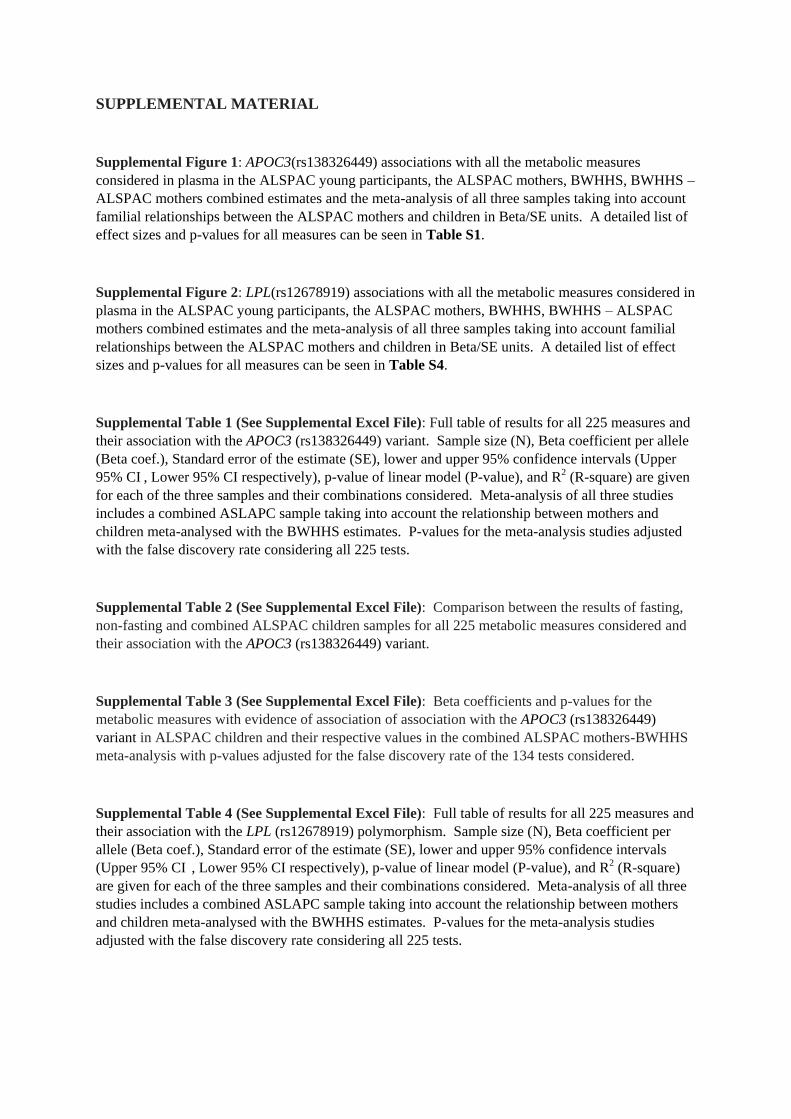
Supplemental Figure 1: APOC3(rs138326449) associations with all the metabolic measures
considered in plasma in the ALSPAC young participants, the ALSPAC mothers, BWHHS, BWHHS –
ALSPAC mothers combined estimates and the meta-analysis of all three samples taking into account
familial relationships between the ALSPAC mothers and children in Beta/SE units. A detailed list of
effect sizes and p-values for all measures can be seen in Table S1.
Supplemental Figure 2: LPL(rs12678919) associations with all the metabolic measures considered in
plasma in the ALSPAC young participants, the ALSPAC mothers, BWHHS, BWHHS – ALSPAC
mothers combined estimates and the meta-analysis of all three samples taking into account familial
relationships between the ALSPAC mothers and children in Beta/SE units. A detailed list of effect
sizes and p-values for all measures can be seen in Table S4.
Supplemental Table 1 (See Supplemental Excel File): Full table of results for all 225 measures and
their association with the APOC3 (rs138326449) variant. Sample size (N), Beta coefficient per allele
(Beta coef.), Standard error of the estimate (SE), lower and upper 95% confidence intervals (Upper
95% CI , Lower 95% CI respectively), p-value of linear model (P-value), and R2 (R-square) are given
for each of the three samples and their combinations considered. Meta-analysis of all three studies
includes a combined ASLAPC sample taking into account the relationship between mothers and
children meta-analysed with the BWHHS estimates. P-values for the meta-analysis studies adjusted
with the false discovery rate considering all 225 tests.
Supplemental Table 2 (See Supplemental Excel File): Comparison between the results of fasting,
non-fasting and combined ALSPAC children samples for all 225 metabolic measures considered and
their association with the APOC3 (rs138326449) variant.
Supplemental Table 3 (See Supplemental Excel File): Beta coefficients and p-values for the
metabolic measures with evidence of association of association with the APOC3 (rs138326449)
variant in ALSPAC children and their respective values in the combined ALSPAC mothers-BWHHS
meta-analysis with p-values adjusted for the false discovery rate of the 134 tests considered.
Supplemental Table 4 (See Supplemental Excel File): Full table of results for all 225 measures and
their association with the LPL (rs12678919) polymorphism. Sample size (N), Beta coefficient per
allele (Beta coef.), Standard error of the estimate (SE), lower and upper 95% confidence intervals
(Upper 95% CI , Lower 95% CI respectively), p-value of linear model (P-value), and R2 (R-square)
are given for each of the three samples and their combinations considered. Meta-analysis of all three
studies includes a combined ASLAPC sample taking into account the relationship between mothers
and children meta-analysed with the BWHHS estimates. P-values for the meta-analysis studies
adjusted with the false discovery rate considering all 225 tests.
Supplemental Table 5 (See Supplemental Excel File): Beta coefficients and p-values for the
metabolic measures with evidence of association of association with the LPL (rs12678919)
polymorphism in ALSPAC children and their respective values in the combined ALSPAC mothers-
BWHHS meta-analysis with p-values adjusted for the false discovery rate of the 126 tests considered.
Supplemental Table 6 (See Supplemental Excel File): Full table of expected and observed effects
of all 225 measures under the model of APOC3 inhibition of TRLs hydrolysis by LPL for ALSPAC
children and the meta-analysed ALSPAC mothers-BWHHS estimates. The differences between
observed and expected were meta-analysed and the overall difference and p-value from a fixed effects
meta-analysis are also presented.
Lipoprotein subclasses − Concentration
ln+1
ln+1
ln+1
ln+1
ln+1
ln+1
ln+1
ln+1
ln+1
ln+1
ln+1
ln+1
ln+1
ln+1
ln+1
ln+1
ln+1
ln+1
ln+1
ln+1
ln+1
ln+1
ln+1
ln+1
ln+1
ln+1
ln+1
ln+1
Concentration of chylomicrons and extremely large VLDL particles (mol/l)
Total lipids in chylomicrons and extremely large VLDL (mmol/l)
Phospholipids in chylomicrons and extremely large VLDL (mmol/l)
Total cholesterol in chylomicrons and extremely large VLDL (mmol/l)
Cholesteryl esters in chylomicrons and extremely large VLDL (mmol/l)
Free cholesterol in chylomicrons and extremely large VLDL (mmol/l)
Triglycerides in chylomicrons and extremely large VLDL (mmol/l)
Concentration of very large VLDL particles (mol/l)
Total lipids in very large VLDL (mmol/l)
Phospholipids in very large VLDL (mmol/l)
Total cholesterol in very large VLDL (mmol/l)
Cholesteryl esters in very large VLDL (mmol/l)
Free cholesterol in very large VLDL (mmol/l)
Triglycerides in very large VLDL (mmol/l)
Concentration of large VLDL particles (mol/l)
Total lipids in large VLDL (mmol/l)
Phospholipids in large VLDL (mmol/l)
Total cholesterol in large VLDL (mmol/l)
Cholesteryl esters in large VLDL (mmol/l)
Free cholesterol in large VLDL (mmol/l)
Triglycerides in large VLDL (mmol/l)
Concentration of medium VLDL particles (mol/l)
Total lipids in medium VLDL (mmol/l)
Phospholipids in medium VLDL (mmol/l)
Total cholesterol in medium VLDL (mmol/l)
Cholesteryl esters in medium VLDL (mmol/l)
Free cholesterol in medium VLDL (mmol/l)
Triglycerides in medium VLDL (mmol/l)
Concentration of small VLDL particles (mol/l)
Total lipids in small VLDL (mmol/l)
Phospholipids in small VLDL (mmol/l)
Total cholesterol in small VLDL (mmol/l)
Cholesteryl esters in small VLDL (mmol/l)
Free cholesterol in small VLDL (mmol/l)
Triglycerides in small VLDL (mmol/l)
Concentration of very small VLDL particles (mol/l)
Total lipids in very small VLDL (mmol/l)
Phospholipids in very small VLDL (mmol/l)
Total cholesterol in very small VLDL (mmol/l)
Cholesteryl esters in very small VLDL (mmol/l)
Free cholesterol in very small VLDL (mmol/l)
Triglycerides in very small VLDL (mmol/l)
Concentration of IDL particles (mol/l)
Total lipids in IDL (mmol/l)
Phospholipids in IDL (mmol/l)
Total cholesterol in IDL (mmol/l)
Cholesteryl esters in IDL (mmol/l)
Free cholesterol in IDL (mmol/l)
Triglycerides in IDL (mmol/l)
Concentration of large LDL particles (mol/l)
Total lipids in large LDL (mmol/l)
Phospholipids in large LDL (mmol/l)
Total cholesterol in large LDL (mmol/l)
Cholesteryl esters in large LDL (mmol/l)
Free cholesterol in large LDL (mmol/l)
Triglycerides in large LDL (mmol/l)
Concentration of medium LDL particles (mol/l)
Total lipids in medium LDL (mmol/l)
Phospholipids in medium LDL (mmol/l)
Total cholesterol in medium LDL (mmol/l)
Cholesteryl esters in medium LDL (mmol/l)
Free cholesterol in medium LDL (mmol/l)
Triglycerides in medium LDL (mmol/l)
Concentration of small LDL particles (mol/l)
Total lipids in small LDL (mmol/l)
Phospholipids in small LDL (mmol/l)
Total cholesterol in small LDL (mmol/l)
Cholesteryl esters in small LDL (mmol/l)
Free cholesterol in small LDL (mmol/l)
Triglycerides in small LDL (mmol/l)
Concentration of very large HDL particles (mol/l)
Total lipids in very large HDL (mmol/l)
Phospholipids in very large HDL (mmol/l)
Total cholesterol in very large HDL (mmol/l)
Cholesteryl esters in very large HDL (mmol/l)
Free cholesterol in very large HDL (mmol/l)
Triglycerides in very large HDL (mmol/l)
Concentration of large HDL particles (mol/l)
Total lipids in large HDL (mmol/l)
Phospholipids in large HDL (mmol/l)
Total cholesterol in large HDL (mmol/l)
Cholesteryl esters in large HDL (mmol/l)
Free cholesterol in large HDL (mmol/l)
Triglycerides in large HDL (mmol/l)
Concentration of medium HDL particles (mol/l)
Total lipids in medium HDL (mmol/l)
Phospholipids in medium HDL (mmol/l)
Total cholesterol in medium HDL (mmol/l)
Cholesteryl esters in medium HDL (mmol/l)
Free cholesterol in medium HDL (mmol/l)
Triglycerides in medium HDL (mmol/l)
Concentration of small HDL particles (mol/l)
Total lipids in small HDL (mmol/l)
Phospholipids in small HDL (mmol/l)
Total cholesterol in small HDL (mmol/l)
Cholesteryl esters in small HDL (mmol/l)
Free cholesterol in small HDL (mmol/l)
Triglycerides in small HDL (mmol/l)
●
●
●
●
●
●
●
●
●
●
●
●
●
●
●
●
●
●
●
●
●
●
●
●
●
●
●
●
●
●
●
●
●
●
●
●
●
●
●
●
●
●
●
●
●
●
●
●
●
●
●
●
●
●
●
●
●
●
●
●
●
●
●
●
●
●
●
●
●
●
●
●
●
●
●
●
●
●
●
●
●
●
●
●
●
●
●
●
●
●
●
●
●
●
●
●
●
●
●
●
●
●
●
●
●
●
●
●
●
●
●
●
●
●
●
●
●
●
●
●
●
●
●
●
●
●
●
●
●
●
●
●
●
●
●
●
●
●
●
●
●
●
●
●
●
●
●
●
●
●
●
●
●
●
●
●
●
●
●
●
●
●
●
●
●
●
●
●
●
●
●
●
●
●
●
●
●
●
●
●
●
●
●
●
●
●
●
●
●
●
●
●
●
●
●
●
●
●
●
●
●
●
●
●
●
●
●
●
●
●
●
●
●
●
●
●
●
●
●
●
●
●
●
●
●
●
●
●
●
●
●
●
●
●
●
●
●
●
●
●
●
●
●
●
●
●
●
●
●
●
●
●
●
●
●
●
●
●
●
●
●
●
●
●
●
●
●
●
●
●
●
●
●
●
●
●
●
●
●
●
●
●
●
●
●
●
●
●
●
●
●
●
●
●
●
●
●
●
●
●
●
●
●
●
●
●
●
●
●
●
●
●
●
●
●
●
●
●
●
●
●
●
●
●
●
●
●
●
●
●
●
●
●
●
●
●
●
●
●
●
●
●
●
●
●
●
●
●
●
●
●
●
●
●
●
●
●
●
●
●
●
●
●
●
●
●
●
●
●
●
●
●
●
●
●
●
●
●
●
●
●
●
●
●
●
●
●
●
●
●
●
●
●
●
●
●
●
●
●
●
●
●
●
●
●
●
●
●
●
●
●
●
●
●
●
●
●
●
●
●
●
●
●
●
●
●
●
●
●
●
●
●
●
●
●
●
●
●
●
●
●
●
●
●
●
●
●
●
●
●
●
●
●
●
●
●
●
●
●
●
●
●
●
●
●
●
●
●
●
●
●
●
●
●
●
●
●
●
●
●
●
●
●
●
●
●
●
●
●
●
Beta/SE
−11 −5 0 6 12
0 20 40 60
Lipoprotein subclasses − Composition
ln+1
ln+1
ln+1
ln+1
ln+1
ln+1
ln+1
ln+1
ln+1
ln+1
ln+1
ln+1
ln+1
ln+1
ln+1
ln+1
ln+1
ln+1
ln+1
ln+1
Phospholipids to total lipds ratio in chylomicrons and extremely large VLDL (%):
Total cholesterol to total lipids ratio in chylomicrons and extremely large VLDL
Cholesteryl esters to total lipids ratio in chylomicrons and extremely large VLD
Free cholesterol to total lipids ratio in chylomicrons and extremely large VLDL
Triglycerides to total lipids ratio in chylomicrons and extremely large VLDL (%)
Phospholipids to total lipds ratio in very large VLDL (%)
Total cholesterol to total lipids ratio in very large VLDL (%)
Cholesteryl esters to total lipids ratio in very large VLDL (%)
Free cholesterol to total lipids ratio in very large VLDL (%)
Triglycerides to total lipids ratio in very large VLDL (%)
Phospholipids to total lipds ratio in large VLDL (%)
Total cholesterol to total lipids ratio in large VLDL (%)
Cholesteryl esters to total lipids ratio in large VLDL (%)
Free cholesterol to total lipids ratio in large VLDL (%)
Triglycerides to total lipids ratio in large VLDL (%)
Phospholipids to total lipds ratio in medium VLDL (%)
Total cholesterol to total lipids ratio in medium VLDL (%)
Cholesteryl esters to total lipids ratio in medium VLDL (%)
Free cholesterol to total lipids ratio in medium VLDL (%)
Triglycerides to total lipids ratio in medium VLDL (%)
Phospholipids to total lipds ratio in small VLDL (%)
Total cholesterol to total lipids ratio in small VLDL (%)
Cholesteryl esters to total lipids ratio in small VLDL (%)
Free cholesterol to total lipids ratio in small VLDL (%)
Triglycerides to total lipids ratio in small VLDL (%)
Phospholipids to total lipds ratio in very small VLDL (%)
Total cholesterol to total lipids ratio in very small VLDL (%)
Cholesteryl esters to total lipids ratio in very small VLDL (%)
Free cholesterol to total lipids ratio in very small VLDL (%)
Triglycerides to total lipids ratio in very small VLDL (%)
Phospholipids to total lipds ratio in IDL (%)
Total cholesterol to total lipids ratio in IDL (%)
Cholesteryl esters to total lipids ratio in IDL (%)
Free cholesterol to total lipids ratio in IDL (%)
Triglycerides to total lipids ratio in IDL (%)
Phospholipids to total lipds ratio in large LDL (%)
Total cholesterol to total lipids ratio in large LDL (%)
Cholesteryl esters to total lipids ratio in large LDL (%)
Free cholesterol to total lipids ratio in large LDL (%)
Triglycerides to total lipids ratio in large LDL (%)
Phospholipids to total lipds ratio in medium LDL (%)
Total cholesterol to total lipids ratio in medium LDL (%)
Cholesteryl esters to total lipids ratio in medium LDL (%)
Free cholesterol to total lipids ratio in medium LDL (%)
Triglycerides to total lipids ratio in medium LDL (%)
Phospholipids to total lipds ratio in small LDL (%)
Total cholesterol to total lipids ratio in small LDL (%)
Cholesteryl esters to total lipids ratio in small LDL (%)
Free cholesterol to total lipids ratio in small LDL (%)
Triglycerides to total lipids ratio in small LDL (%)
Phospholipids to total lipds ratio in very large HDL (%)
Total cholesterol to total lipids ratio in very large HDL (%)
Cholesteryl esters to total lipids ratio in very large HDL (%)
Free cholesterol to total lipids ratio in very large HDL (%)
Triglycerides to total lipids ratio in very large HDL (%)
Phospholipids to total lipds ratio in large HDL (%)
Total cholesterol to total lipids ratio in large HDL (%)
Cholesteryl esters to total lipids ratio in large HDL (%)
Free cholesterol to total lipids ratio in large HDL (%)
Triglycerides to total lipids ratio in large HDL (%)
Phospholipids to total lipds ratio in medium HDL (%)
Total cholesterol to total lipids ratio in medium HDL (%)
Cholesteryl esters to total lipids ratio in medium HDL (%)
Free cholesterol to total lipids ratio in medium HDL (%)
Triglycerides to total lipids ratio in medium HDL (%)
Phospholipids to total lipds ratio in small HDL (%)
Total cholesterol to total lipids ratio in small HDL (%)
Cholesteryl esters to total lipids ratio in small HDL (%)
Free cholesterol to total lipids ratio in small HDL (%)
Triglycerides to total lipids ratio in small HDL (%)
●
●
●
●
●
●
●
●
●
●
●
●
●
●
●
●
●
●
●
●
●
●
●
●
●
●
●
●
●
●
●
●
●
●
●
●
●
●
●
●
●
●
●
●
●
●
●
●
●
●
●
●
●
●
●
●
●
●
●
●
●
●
●
●
●
●
●
●
●
●
●
●
●
●
●
●
●
●
●
●
●
●
●
●
●
●
●
●
●
●
●
●
●
●
●
●
●
●
●
●
●
●
●
●
●
●
●
●
●
●
●
●
●
●
●
●
●
●
●
●
●
●
●
●
●
●
●
●
●
●
●
●
●
●
●
●
●
●
●
●
●
●
●
●
●
●
●
●
●
●
●
●
●
●
●
●
●
●
●
●
●
●
●
●
●
●
●
●
●
●
●
●
●
●
●
●
●
●
●
●
●
●
●
●
●
●
●
●
●
●
●
●
●
●
●
●
●
●
●
●
●
●
●
●
●
●
●
●
●
●
●
●
●
●
●
●
●
●
●
●
●
●
●
●
●
●
●
●
●
●
●
●
●
●
●
●
●
●
●
●
●
●
●
●
●
●
●
●
●
●
●
●
●
●
●
●
●
●
●
●
●
●
●
●
●
●
●
●
●
●
●
●
●
●
●
●
●
●
●
●
●
●
●
●
●
●
●
●
●
●
●
●
●
●
●
●
●
●
●
●
●
●
●
●
●
●
●
●
●
●
●
●
●
●
●
●
●
●
●
●
●
●
●
●
●
●
●
●
●
●
●
●
●
●
●
●
●
●
●
●
●
●
●
●
●
●
●
●
●
●
Beta/SE
−11 −5 0 6 12
0 20 40 60
Lipoprotein particle sizes
Cholesterol
Glycerides & phospholipids
Apolipoproteins
Fatty acids & saturation
Glycolysis related metabolites
Amino acids
Ketone bodies
Fluid balance
Inflammation
ln+1
ln+1
ln+1
ln+1
ln+1
ln+1
ln+1
ln+1
ln+1
Mean diameter for VLDL particles (nm)
Mean diameter for LDL particles (nm)
Mean diameter for HDL particles (nm)
Serum total cholesterol (mmol/l)
Total cholesterol in VLDL (mmol/l)
Remnant cholesterol (non−HDL, non−LDL −cholesterol) (mmol/l)
Total cholesterol in LDL (mmol/l)
Total cholesterol in HDL (mmol/l)
Total cholesterol in HDL2 (mmol/l)
Total cholesterol in HDL3 (mmol/l)
Esterified cholesterol (mmol/l)
Free cholesterol (mmol/l)
Serum total triglycerides (mmol/l)
Triglycerides in VLDL (mmol/l)
Triglycerides in LDL (mmol/l)
Triglycerides in HDL (mmol/l)
Total phosphoglycerides (mmol/l)
Ratio of triglycerides to phosphoglycerides
Phosphatidylcholine and other cholines (mmol/l)
Total cholines (mmol/l)
Apolipoprotein A−I (g/l)
Apolipoprotein B (g/l)
Ratio of apolipoprotein B to apolipoprotein A−I
Total fatty acids (mmol/l)
Estimated degree of unsaturation
22:6, docosahexaenoic acid (mmol/l)
18:2, linoleic acid (mmol/l)
Omega−3 fatty acids (mmol/l)
Omega−6 fatty acids (mmol/l)
Polyunsaturated fatty acids (mmol/l)
Monounsaturated fatty acids; 16:1, 18:1 (mmol/l)
Saturated fatty acids (mmol/l)
Ratio of 22:6 docosahexaenoic acid to total fatty acids (%)
Ratio of 18:2 linoleic acid to total fatty acids (%)
Ratio of omega−3 fatty acids to total fatty acids (%)
Ratio of omega−6 fatty acids to total fatty acids (%)
Ratio of polyunsaturated fatty acids to total fatty acids (%)
Ratio of monounsaturated fatty acids to total fatty acids (%)
Ratio of saturated fatty acids to total fatty acids (%)
Glucose (mmol/l)
Lactate (mmol/l)
Pyruvate (mmol/l)
Citrate (mmol/l)
Alanine (mmol/l)
Glutamine (mmol/l)
Histidine (mmol/l)
Isoleucine (mmol/l)
Leucine (mmol/l)
Valine (mmol/l)
Phenylalanine (mmol/l)
Tyrosine (mmol/l)
Acetate (mmol/l)
Acetoacetate (mmol/l)
3−hydroxybutyrate (mmol/l)
Creatinine (mmol/l)
Albumin (signal area)
Glycoprotein acetyls, mainly a1−acid glycoprotein (mmol/l)
●
●
●
●
●
●
●
●
●
●
●
●
●
●
●
●
●
●
●
●
●
●
●
●
●
●
●
●
●
●
●
●
●
●
●
●
●
●
●
●
●
●
●
●
●
●
●
●
●
●
●
●
●
●
●
●
●
●
●
●
●
●
●
●
●
●
●
●
●
●
●
●
●
●
●
●
●
●
●
●
●
●
●
●
●
●
●
●
●
●
●
●
●
●
●
●
●
●
●
●
●
●
●
●
●
●
●
●
●
●
●
●
●
●
●
●
●
●
●
●
●
●
●
●
●
●
●
●
●
●
●
●
●
●
●
●
●
●
●
●
●
●
●
●
●
●
●
●
●
●
●
●
●
●
●
●
●
●
●
●
●
●
●
●
●
●
●
●
●
●
●
●
●
●
●
●
●
●
●
●
●
●
●
●
●
●
●
●
●
●
●
●
●
●
●
●
●
●
●
●
●
●
●
●
●
●
●
●
●
●
●
●
●
●
●
●
●
●
●
●
●
●
●
●
●
●
●
●
●
●
●
●
●
●
●
●
●
●
●
●
●
●
●
●
●
●
●
●
●
●
●
●
●
●
●
●
●
●
●
●
●
●
●
●
●
●
●
●
●
●
●
●
●
●
●
●
●
●
●
●
●
●
●
●
●
Beta/SE
−11 −5 0 6 12
0 20 40 60
●●●●● ●●●●● ●●●●● ●●●●● ●●●●●Meta−analysis of BWHHS and ALSPAC Mothers ALSPAC Children Meta−analysis of all ALSPAC Mothers BWHHS
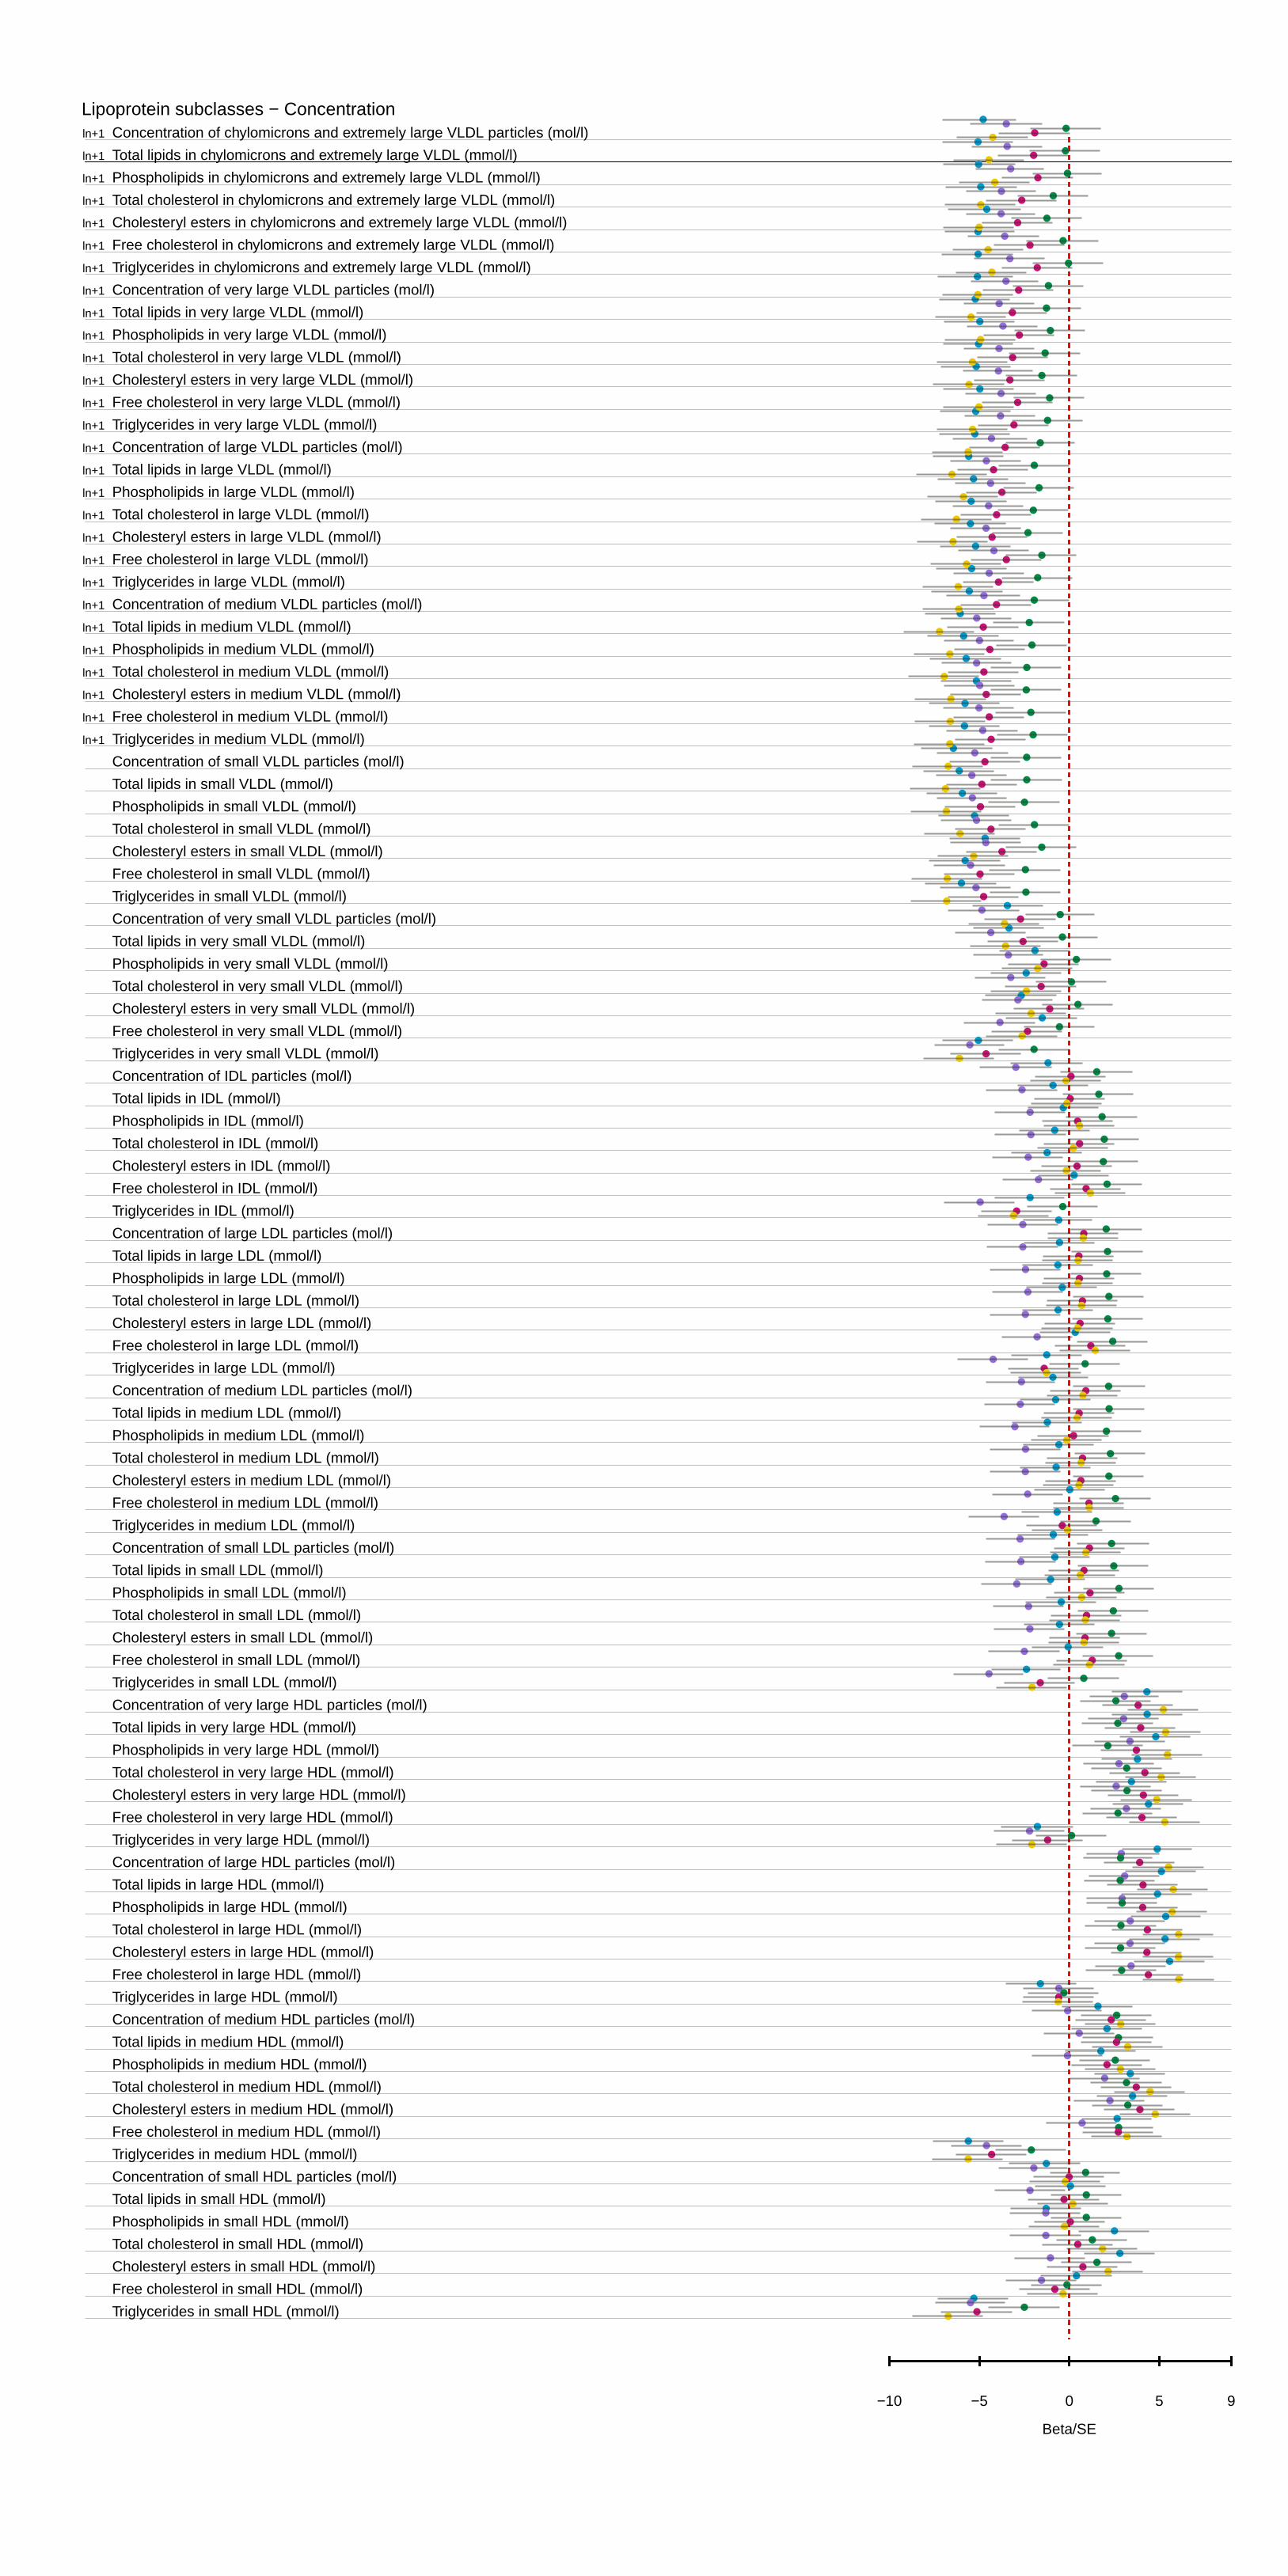
Lipoprotein subclasses − Concentration
ln+1
ln+1
ln+1
ln+1
ln+1
ln+1
ln+1
ln+1
ln+1
ln+1
ln+1
ln+1
ln+1
ln+1
ln+1
ln+1
ln+1
ln+1
ln+1
ln+1
ln+1
ln+1
ln+1
ln+1
ln+1
ln+1
ln+1
ln+1
Concentration of chylomicrons and extremely large VLDL particles (mol/l)
Total lipids in chylomicrons and extremely large VLDL (mmol/l)
Phospholipids in chylomicrons and extremely large VLDL (mmol/l)
Total cholesterol in chylomicrons and extremely large VLDL (mmol/l)
Cholesteryl esters in chylomicrons and extremely large VLDL (mmol/l)
Free cholesterol in chylomicrons and extremely large VLDL (mmol/l)
Triglycerides in chylomicrons and extremely large VLDL (mmol/l)
Concentration of very large VLDL particles (mol/l)
Total lipids in very large VLDL (mmol/l)
Phospholipids in very large VLDL (mmol/l)
Total cholesterol in very large VLDL (mmol/l)
Cholesteryl esters in very large VLDL (mmol/l)
Free cholesterol in very large VLDL (mmol/l)
Triglycerides in very large VLDL (mmol/l)
Concentration of large VLDL particles (mol/l)
Total lipids in large VLDL (mmol/l)
Phospholipids in large VLDL (mmol/l)
Total cholesterol in large VLDL (mmol/l)
Cholesteryl esters in large VLDL (mmol/l)
Free cholesterol in large VLDL (mmol/l)
Triglycerides in large VLDL (mmol/l)
Concentration of medium VLDL particles (mol/l)
Total lipids in medium VLDL (mmol/l)
Phospholipids in medium VLDL (mmol/l)
Total cholesterol in medium VLDL (mmol/l)
Cholesteryl esters in medium VLDL (mmol/l)
Free cholesterol in medium VLDL (mmol/l)
Triglycerides in medium VLDL (mmol/l)
Concentration of small VLDL particles (mol/l)
Total lipids in small VLDL (mmol/l)
Phospholipids in small VLDL (mmol/l)
Total cholesterol in small VLDL (mmol/l)
Cholesteryl esters in small VLDL (mmol/l)
Free cholesterol in small VLDL (mmol/l)
Triglycerides in small VLDL (mmol/l)
Concentration of very small VLDL particles (mol/l)
Total lipids in very small VLDL (mmol/l)
Phospholipids in very small VLDL (mmol/l)
Total cholesterol in very small VLDL (mmol/l)
Cholesteryl esters in very small VLDL (mmol/l)
Free cholesterol in very small VLDL (mmol/l)
Triglycerides in very small VLDL (mmol/l)
Concentration of IDL particles (mol/l)
Total lipids in IDL (mmol/l)
Phospholipids in IDL (mmol/l)
Total cholesterol in IDL (mmol/l)
Cholesteryl esters in IDL (mmol/l)
Free cholesterol in IDL (mmol/l)
Triglycerides in IDL (mmol/l)
Concentration of large LDL particles (mol/l)
Total lipids in large LDL (mmol/l)
Phospholipids in large LDL (mmol/l)
Total cholesterol in large LDL (mmol/l)
Cholesteryl esters in large LDL (mmol/l)
Free cholesterol in large LDL (mmol/l)
Triglycerides in large LDL (mmol/l)
Concentration of medium LDL particles (mol/l)
Total lipids in medium LDL (mmol/l)
Phospholipids in medium LDL (mmol/l)
Total cholesterol in medium LDL (mmol/l)
Cholesteryl esters in medium LDL (mmol/l)
Free cholesterol in medium LDL (mmol/l)
Triglycerides in medium LDL (mmol/l)
Concentration of small LDL particles (mol/l)
Total lipids in small LDL (mmol/l)
Phospholipids in small LDL (mmol/l)
Total cholesterol in small LDL (mmol/l)
Cholesteryl esters in small LDL (mmol/l)
Free cholesterol in small LDL (mmol/l)
Triglycerides in small LDL (mmol/l)
Concentration of very large HDL particles (mol/l)
Total lipids in very large HDL (mmol/l)
Phospholipids in very large HDL (mmol/l)
Total cholesterol in very large HDL (mmol/l)
Cholesteryl esters in very large HDL (mmol/l)
Free cholesterol in very large HDL (mmol/l)
Triglycerides in very large HDL (mmol/l)
Concentration of large HDL particles (mol/l)
Total lipids in large HDL (mmol/l)
Phospholipids in large HDL (mmol/l)
Total cholesterol in large HDL (mmol/l)
Cholesteryl esters in large HDL (mmol/l)
Free cholesterol in large HDL (mmol/l)
Triglycerides in large HDL (mmol/l)
Concentration of medium HDL particles (mol/l)
Total lipids in medium HDL (mmol/l)
Phospholipids in medium HDL (mmol/l)
Total cholesterol in medium HDL (mmol/l)
Cholesteryl esters in medium HDL (mmol/l)
Free cholesterol in medium HDL (mmol/l)
Triglycerides in medium HDL (mmol/l)
Concentration of small HDL particles (mol/l)
Total lipids in small HDL (mmol/l)
Phospholipids in small HDL (mmol/l)
Total cholesterol in small HDL (mmol/l)
Cholesteryl esters in small HDL (mmol/l)
Free cholesterol in small HDL (mmol/l)
Triglycerides in small HDL (mmol/l)
●
●
●
●
●
●
●
●
●
●
●
●
●
●
●
●
●
●
●
●
●
●
●
●
●
●
●
●
●
●
●
●
●
●
●
●
●
●
●
●
●
●
●
●
●
●
●
●
●
●
●
●
●
●
●
●
●
●
●
●
●
●
●
●
●
●
●
●
●
●
●
●
●
●
●
●
●
●
●
●
●
●
●
●
●
●
●
●
●
●
●
●
●
●
●
●
●
●
●
●
●
●
●
●
●
●
●
●
●
●
●
●
●
●
●
●
●
●
●
●
●
●
●
●
●
●
●
●
●
●
●
●
●
●
●
●
●
●
●
●
●
●
●
●
●
●
●
●
●
●
●
●
●
●
●
●
●
●
●
●
●
●
●
●
●
●
●
●
●
●
●
●
●
●
●
●
●
●
●
●
●
●
●
●
●
●
●
●
●
●
●
●
●
●
●
●
●
●
●
●
●
●
●
●
●
●
●
●
●
●
●
●
●
●
●
●
●
●
●
●
●
●
●
●
●
●
●
●
●
●
●
●
●
●
●
●
●
●
●
●
●
●
●
●
●
●
●
●
●
●
●
●
●
●
●
●
●
●
●
●
●
●
●
●
●
●
●
●
●
●
●
●
●
●
●
●
●
●
●
●
●
●
●
●
●
●
●
●
●
●
●
●
●
●
●
●
●
●
●
●
●
●
●
●
●
●
●
●
●
●
●
●
●
●
●
●
●
●
●
●
●
●
●
●
●
●
●
●
●
●
●
●
●
●
●
●
●
●
●
●
●
●
●
●
●
●
●
●
●
●
●
●
●
●
●
●
●
●
●
●
●
●
●
●
●
●
●
●
●
●
●
●
●
●
●
●
●
●
●
●
●
●
●
●
●
●
●
●
●
●
●
●
●
●
●
●
●
●
●
●
●
●
●
●
●
●
●
●
●
●
●
●
●
●
●
●
●
●
●
●
●
●
●
●
●
●
●
●
●
●
●
●
●
●
●
●
●
●
●
●
●
●
●
●
●
●
●
●
●
●
●
●
●
●
●
●
●
●
●
●
●
●
●
●
●
●
●
●
●
●
●
●
●
●
●
●
●
●
●
●
●
●
●
●
●
●
●
●
●
●
Beta/SE
−10 −5 0 5 9
0 20 40 60
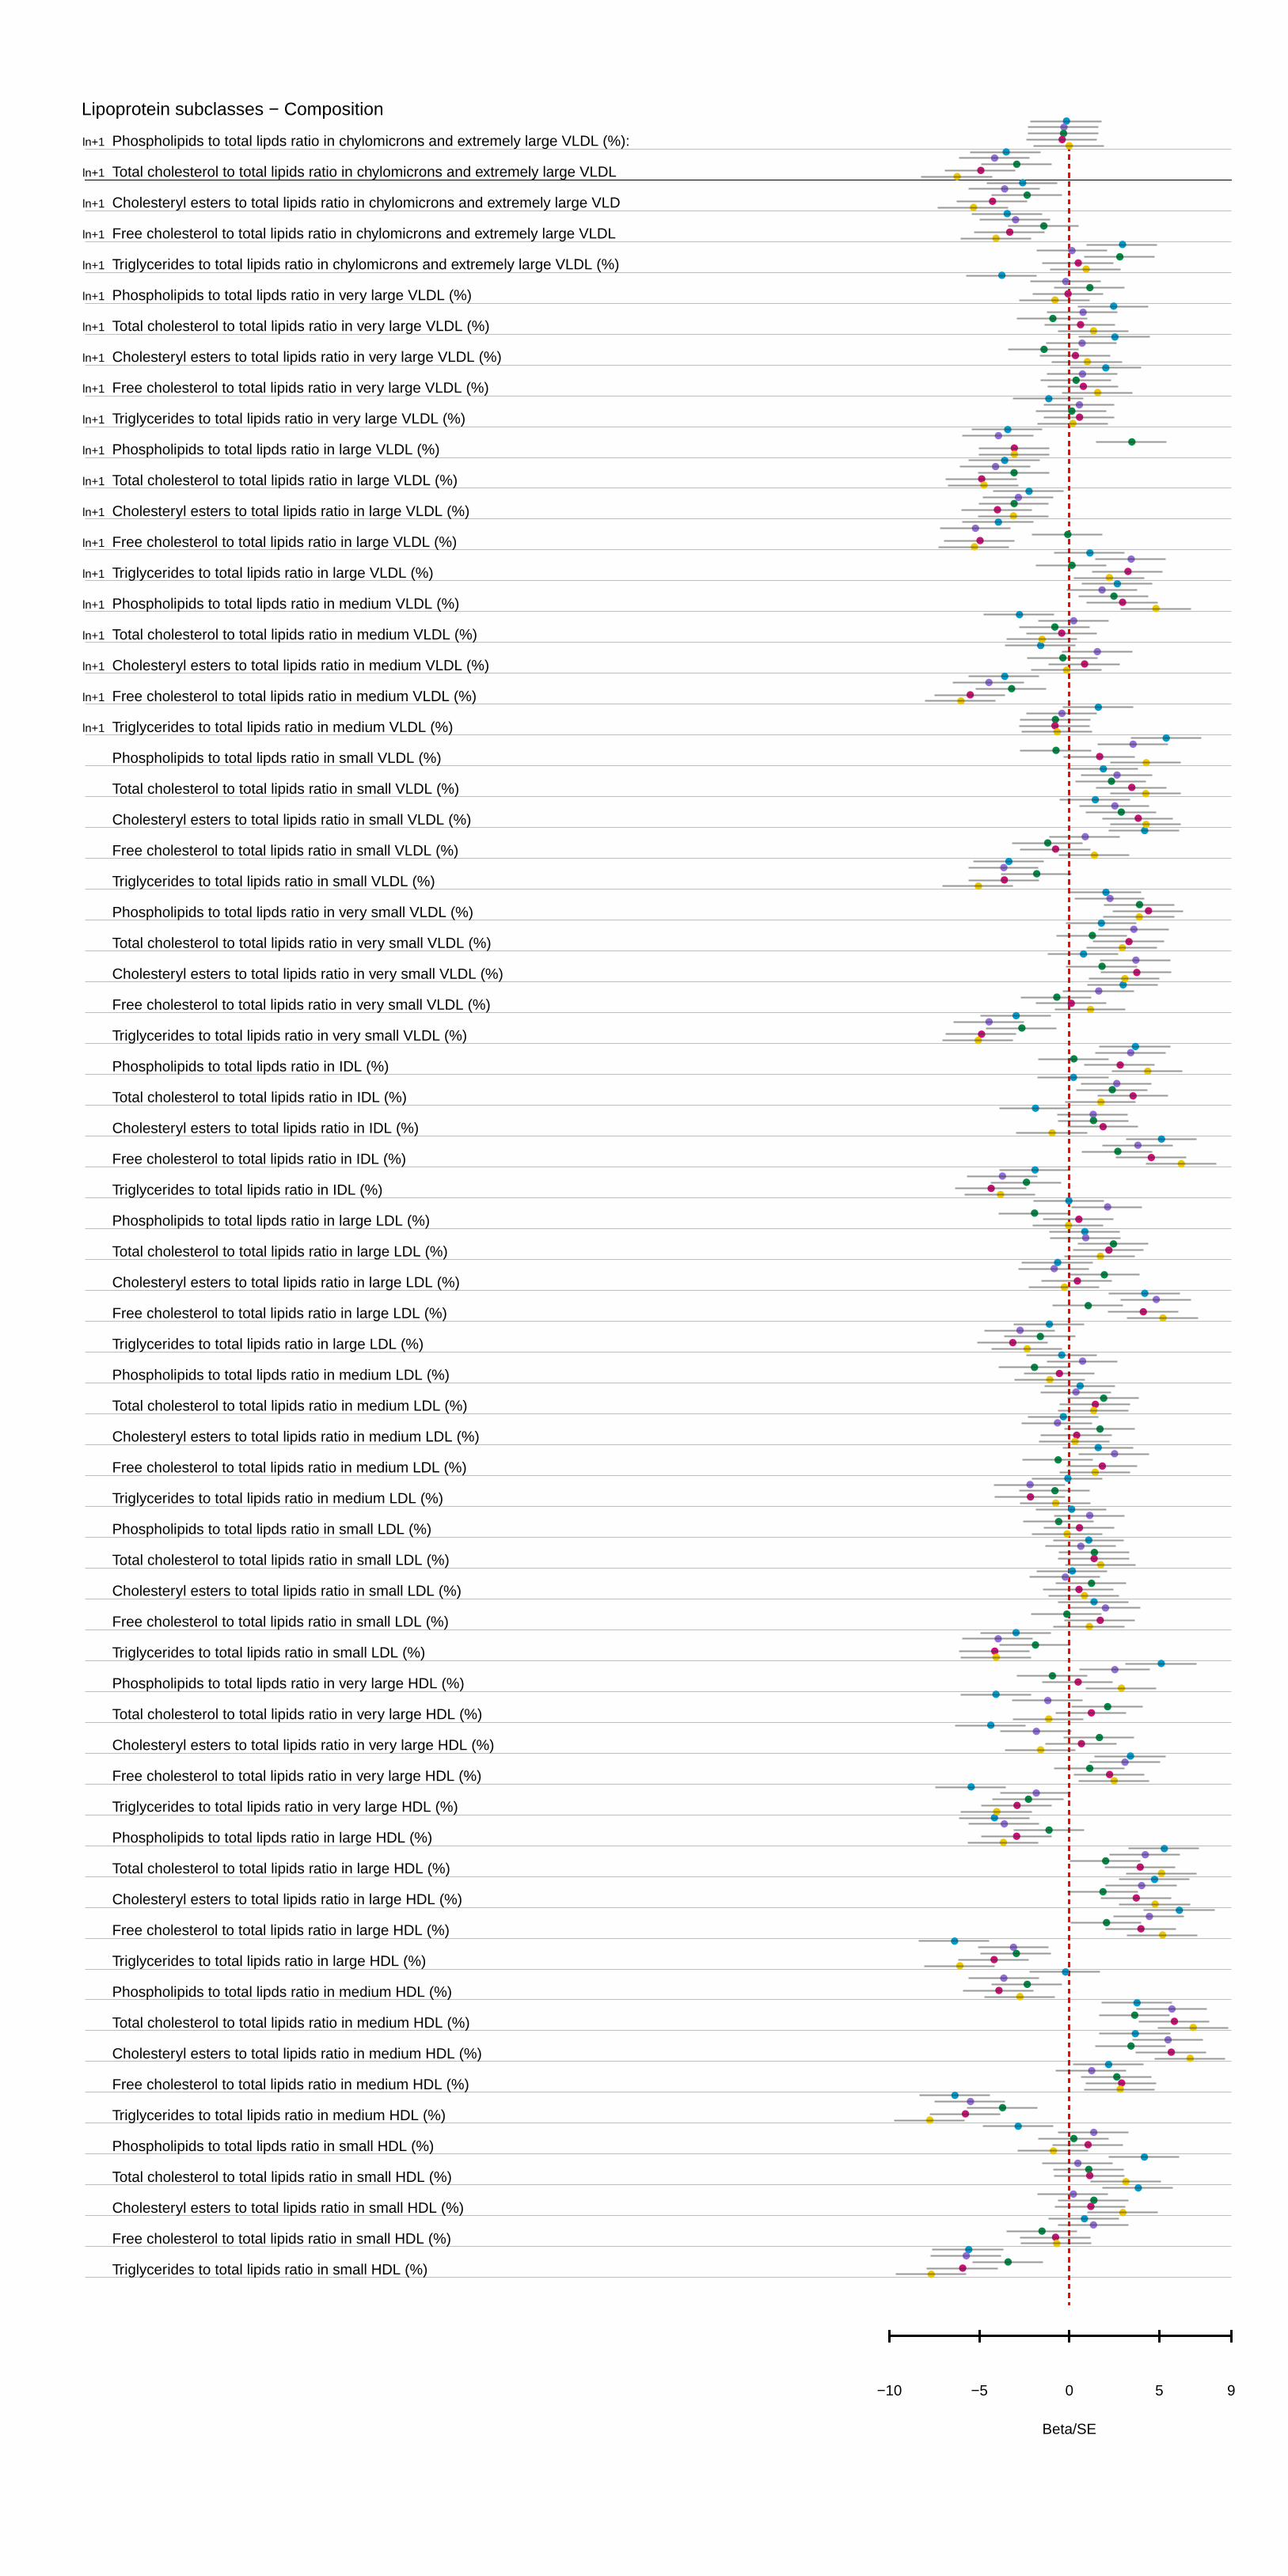
Lipoprotein subclasses − Composition
ln+1
ln+1
ln+1
ln+1
ln+1
ln+1
ln+1
ln+1
ln+1
ln+1
ln+1
ln+1
ln+1
ln+1
ln+1
ln+1
ln+1
ln+1
ln+1
ln+1
Phospholipids to total lipds ratio in chylomicrons and extremely large VLDL (%):
Total cholesterol to total lipids ratio in chylomicrons and extremely large VLDL
Cholesteryl esters to total lipids ratio in chylomicrons and extremely large VLD
Free cholesterol to total lipids ratio in chylomicrons and extremely large VLDL
Triglycerides to total lipids ratio in chylomicrons and extremely large VLDL (%)
Phospholipids to total lipds ratio in very large VLDL (%)
Total cholesterol to total lipids ratio in very large VLDL (%)
Cholesteryl esters to total lipids ratio in very large VLDL (%)
Free cholesterol to total lipids ratio in very large VLDL (%)
Triglycerides to total lipids ratio in very large VLDL (%)
Phospholipids to total lipds ratio in large VLDL (%)
Total cholesterol to total lipids ratio in large VLDL (%)
Cholesteryl esters to total lipids ratio in large VLDL (%)
Free cholesterol to total lipids ratio in large VLDL (%)
Triglycerides to total lipids ratio in large VLDL (%)
Phospholipids to total lipds ratio in medium VLDL (%)
Total cholesterol to total lipids ratio in medium VLDL (%)
Cholesteryl esters to total lipids ratio in medium VLDL (%)
Free cholesterol to total lipids ratio in medium VLDL (%)
Triglycerides to total lipids ratio in medium VLDL (%)
Phospholipids to total lipds ratio in small VLDL (%)
Total cholesterol to total lipids ratio in small VLDL (%)
Cholesteryl esters to total lipids ratio in small VLDL (%)
Free cholesterol to total lipids ratio in small VLDL (%)
Triglycerides to total lipids ratio in small VLDL (%)
Phospholipids to total lipds ratio in very small VLDL (%)
Total cholesterol to total lipids ratio in very small VLDL (%)
Cholesteryl esters to total lipids ratio in very small VLDL (%)
Free cholesterol to total lipids ratio in very small VLDL (%)
Triglycerides to total lipids ratio in very small VLDL (%)
Phospholipids to total lipds ratio in IDL (%)
Total cholesterol to total lipids ratio in IDL (%)
Cholesteryl esters to total lipids ratio in IDL (%)
Free cholesterol to total lipids ratio in IDL (%)
Triglycerides to total lipids ratio in IDL (%)
Phospholipids to total lipds ratio in large LDL (%)
Total cholesterol to total lipids ratio in large LDL (%)
Cholesteryl esters to total lipids ratio in large LDL (%)
Free cholesterol to total lipids ratio in large LDL (%)
Triglycerides to total lipids ratio in large LDL (%)
Phospholipids to total lipds ratio in medium LDL (%)
Total cholesterol to total lipids ratio in medium LDL (%)
Cholesteryl esters to total lipids ratio in medium LDL (%)
Free cholesterol to total lipids ratio in medium LDL (%)
Triglycerides to total lipids ratio in medium LDL (%)
Phospholipids to total lipds ratio in small LDL (%)
Total cholesterol to total lipids ratio in small LDL (%)
Cholesteryl esters to total lipids ratio in small LDL (%)
Free cholesterol to total lipids ratio in small LDL (%)
Triglycerides to total lipids ratio in small LDL (%)
Phospholipids to total lipds ratio in very large HDL (%)
Total cholesterol to total lipids ratio in very large HDL (%)
Cholesteryl esters to total lipids ratio in very large HDL (%)
Free cholesterol to total lipids ratio in very large HDL (%)
Triglycerides to total lipids ratio in very large HDL (%)
Phospholipids to total lipds ratio in large HDL (%)
Total cholesterol to total lipids ratio in large HDL (%)
Cholesteryl esters to total lipids ratio in large HDL (%)
Free cholesterol to total lipids ratio in large HDL (%)
Triglycerides to total lipids ratio in large HDL (%)
Phospholipids to total lipds ratio in medium HDL (%)
Total cholesterol to total lipids ratio in medium HDL (%)
Cholesteryl esters to total lipids ratio in medium HDL (%)
Free cholesterol to total lipids ratio in medium HDL (%)
Triglycerides to total lipids ratio in medium HDL (%)
Phospholipids to total lipds ratio in small HDL (%)
Total cholesterol to total lipids ratio in small HDL (%)
Cholesteryl esters to total lipids ratio in small HDL (%)
Free cholesterol to total lipids ratio in small HDL (%)
Triglycerides to total lipids ratio in small HDL (%)
●
●
●
●
●
●
●
●
●
●
●
●
●
●
●
●
●
●
●
●
●
●
●
●
●
●
●
●
●
●
●
●
●
●
●
●
●
●
●
●
●
●
●
●
●
●
●
●
●
●
●
●
●
●
●
●
●
●
●
●
●
●
●
●
●
●
●
●
●
●
●
●
●
●
●
●
●
●
●
●
●
●
●
●
●
●
●
●
●
●
●
●
●
●
●
●
●
●
●
●
●
●
●
●
●
●
●
●
●
●
●
●
●
●
●
●
●
●
●
●
●
●
●
●
●
●
●
●
●
●
●
●
●
●
●
●
●
●
●
●
●
●
●
●
●
●
●
●
●
●
●
●
●
●
●
●
●
●
●
●
●
●
●
●
●
●
●
●
●
●
●
●
●
●
●
●
●
●
●
●
●
●
●
●
●
●
●
●
●
●
●
●
●
●
●
●
●
●
●
●
●
●
●
●
●
●
●
●
●
●
●
●
●
●
●
●
●
●
●
●
●
●
●
●
●
●
●
●
●
●
●
●
●
●
●
●
●
●
●
●
●
●
●
●
●
●
●
●
●
●
●
●
●
●
●
●
●
●
●
●
●
●
●
●
●
●
●
●
●
●
●
●
●
●
●
●
●
●
●
●
●
●
●
●
●
●
●
●
●
●
●
●
●
●
●
●
●
●
●
●
●
●
●
●
●
●
●
●
●
●
●
●
●
●
●
●
●
●
●
●
●
●
●
●
●
●
●
●
●
●
●
●
●
●
●
●
●
●
●
●
●
●
●
●
●
●
●
●
●
●
Beta/SE
−10 −5 0 5 9
0 20 40 60
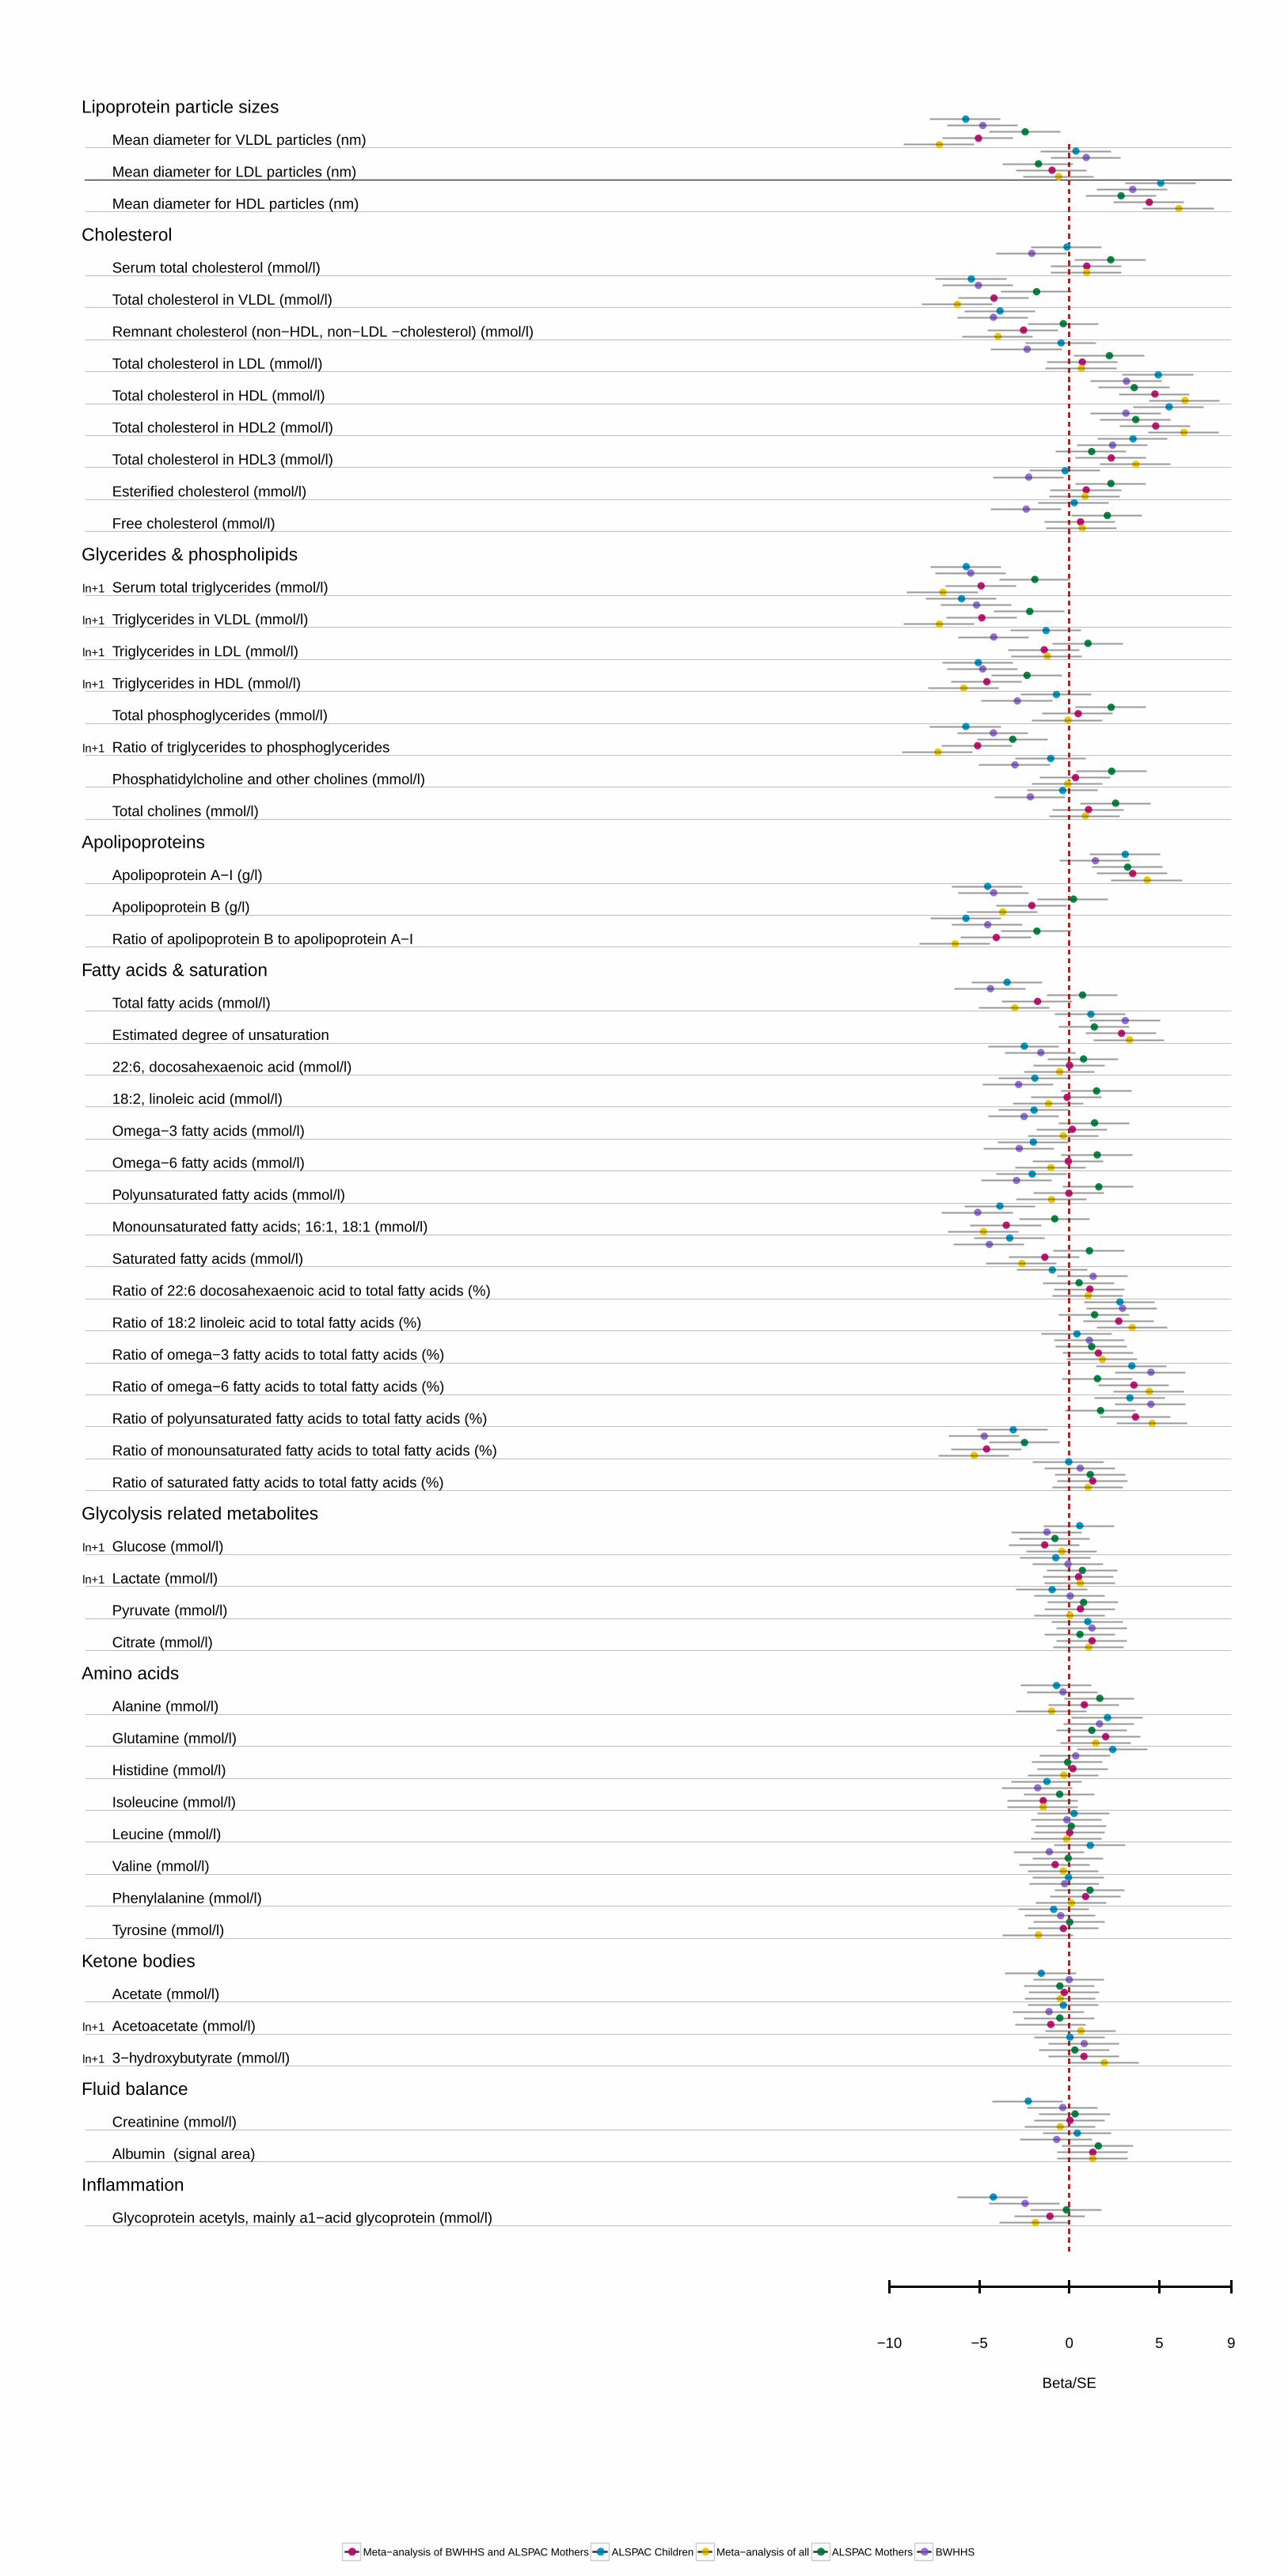
Lipoprotein particle sizes
Cholesterol
Glycerides & phospholipids
Apolipoproteins
Fatty acids & saturation
Glycolysis related metabolites
Amino acids
Ketone bodies
Fluid balance
Inflammation
ln+1
ln+1
ln+1
ln+1
ln+1
ln+1
ln+1
ln+1
ln+1
Mean diameter for VLDL particles (nm)
Mean diameter for LDL particles (nm)
Mean diameter for HDL particles (nm)
Serum total cholesterol (mmol/l)
Total cholesterol in VLDL (mmol/l)
Remnant cholesterol (non−HDL, non−LDL −cholesterol) (mmol/l)
Total cholesterol in LDL (mmol/l)
Total cholesterol in HDL (mmol/l)
Total cholesterol in HDL2 (mmol/l)
Total cholesterol in HDL3 (mmol/l)
Esterified cholesterol (mmol/l)
Free cholesterol (mmol/l)
Serum total triglycerides (mmol/l)
Triglycerides in VLDL (mmol/l)
Triglycerides in LDL (mmol/l)
Triglycerides in HDL (mmol/l)
Total phosphoglycerides (mmol/l)
Ratio of triglycerides to phosphoglycerides
Phosphatidylcholine and other cholines (mmol/l)
Total cholines (mmol/l)
Apolipoprotein A−I (g/l)
Apolipoprotein B (g/l)
Ratio of apolipoprotein B to apolipoprotein A−I
Total fatty acids (mmol/l)
Estimated degree of unsaturation
22:6, docosahexaenoic acid (mmol/l)
18:2, linoleic acid (mmol/l)
Omega−3 fatty acids (mmol/l)
Omega−6 fatty acids (mmol/l)
Polyunsaturated fatty acids (mmol/l)
Monounsaturated fatty acids; 16:1, 18:1 (mmol/l)
Saturated fatty acids (mmol/l)
Ratio of 22:6 docosahexaenoic acid to total fatty acids (%)
Ratio of 18:2 linoleic acid to total fatty acids (%)
Ratio of omega−3 fatty acids to total fatty acids (%)
Ratio of omega−6 fatty acids to total fatty acids (%)
Ratio of polyunsaturated fatty acids to total fatty acids (%)
Ratio of monounsaturated fatty acids to total fatty acids (%)
Ratio of saturated fatty acids to total fatty acids (%)
Glucose (mmol/l)
Lactate (mmol/l)
Pyruvate (mmol/l)
Citrate (mmol/l)
Alanine (mmol/l)
Glutamine (mmol/l)
Histidine (mmol/l)
Isoleucine (mmol/l)
Leucine (mmol/l)
Valine (mmol/l)
Phenylalanine (mmol/l)
Tyrosine (mmol/l)
Acetate (mmol/l)
Acetoacetate (mmol/l)
3−hydroxybutyrate (mmol/l)
Creatinine (mmol/l)
Albumin (signal area)
Glycoprotein acetyls, mainly a1−acid glycoprotein (mmol/l)
●
●
●
●
●
●
●
●
●
●
●
●
●
●
●
●
●
●
●
●
●
●
●
●
●
●
●
●
●
●
●
●
●
●
●
●
●
●
●
●
●
●
●
●
●
●
●
●
●
●
●
●
●
●
●
●
●
●
●
●
●
●
●
●
●
●
●
●
●
●
●
●
●
●
●
●
●
●
●
●
●
●
●
●
●
●
●
●
●
●
●
●
●
●
●
●
●
●
●
●
●
●
●
●
●
●
●
●
●
●
●
●
●
●
●
●
●
●
●
●
●
●
●
●
●
●
●
●
●
●
●
●
●
●
●
●
●
●
●
●
●
●
●
●
●
●
●
●
●
●
●
●
●
●
●
●
●
●
●
●
●
●
●
●
●
●
●
●
●
●
●
●
●
●
●
●
●
●
●
●
●
●
●
●
●
●
●
●
●
●
●
●
●
●
●
●
●
●
●
●
●
●
●
●
●
●
●
●
●
●
●
●
●
●
●
●
●
●
●
●
●
●
●
●
●
●
●
●
●
●
●
●
●
●
●
●
●
●
●
●
●
●
●
●
●
●
●
●
●
●
●
●
●
●
●
●
●
●
●
●
●
●
●
●
●
●
●
●
●
●
●
●
●
●
●
●
●
●
●
●
●
●
●
●
●
Beta/SE
−10 −5 0 5 9
0 20 40 60
●●●●● ●●●●● ●●●●● ●●●●● ●●●●●Meta−analysis of BWHHS and ALSPAC Mothers ALSPAC Children Meta−analysis of all ALSPAC Mothers BWHHS