Embed Size (px)
Citation preview
Meta-Analytic Depiction Of Ordered CategoricalDiagnostic Test Accuracy In ROC Space
No Thresholds Left Behind
Ben A. Dwamena, MD
The University of Michigan Radiology & VAMC Nuclear Medicine, Ann Arbor, Michigan
2009 Stata Conference, Washington, DC - July 31, 2009
B.A. Dwamena (UofM-VAMC) Meta-analysis of Ordinal Test Accuracy DC 2009 1 / 100
Outline
1 Objectives
2 Diagnostic Test Evaluation
3 Example Data
4 Current Methods for Meta-analysis of Ordinal Data
5 Proposed Algorithm for Meta-analysis of Ordinal Data
6 Worked Examples
7 Concluding Remarks
B.A. Dwamena (UofM-VAMC) Meta-analysis of Ordinal Test Accuracy DC 2009 2 / 100
Objectives
Objectives
1 Review underlying concepts of medical diagnostic test evaluation
2 Provide illustrated overview of current methods for meta-analysis ofdiagnostic test accuracy studies with discrete outcomes
3 Describe a robust and flexible parametric algorithm for meta-analysisof ordered categorical data
4 Demonstrate implementation with Stata using two data sets, onewith studies reporting same set of categories and the other withdisparately categorized outcomes
B.A. Dwamena (UofM-VAMC) Meta-analysis of Ordinal Test Accuracy DC 2009 3 / 100
Diagnostic Test Evaluation
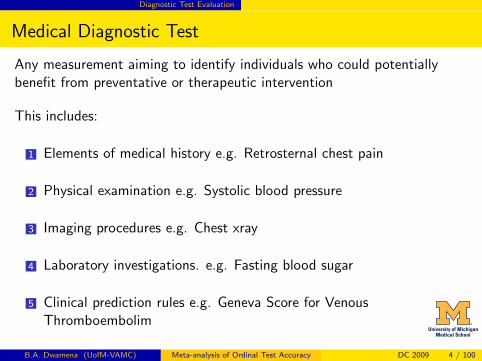
Medical Diagnostic Test
Any measurement aiming to identify individuals who could potentiallybenefit from preventative or therapeutic intervention
This includes:
1 Elements of medical history e.g. Retrosternal chest pain
2 Physical examination e.g. Systolic blood pressure
3 Imaging procedures e.g. Chest xray
4 Laboratory investigations. e.g. Fasting blood sugar
5 Clinical prediction rules e.g. Geneva Score for VenousThromboembolim
B.A. Dwamena (UofM-VAMC) Meta-analysis of Ordinal Test Accuracy DC 2009 4 / 100
Diagnostic Test Evaluation
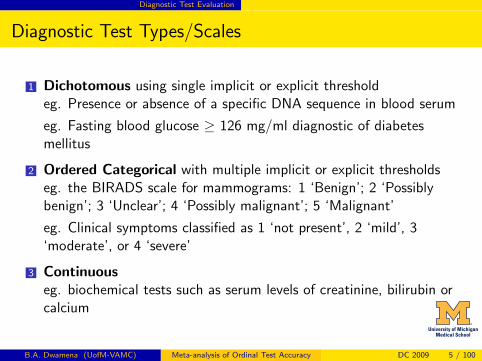
Diagnostic Test Types/Scales
1 Dichotomous using single implicit or explicit thresholdeg. Presence or absence of a specific DNA sequence in blood serum
eg. Fasting blood glucose ≥ 126 mg/ml diagnostic of diabetesmellitus
2 Ordered Categorical with multiple implicit or explicit thresholdseg. the BIRADS scale for mammograms: 1 ‘Benign’; 2 ‘Possiblybenign’; 3 ‘Unclear’; 4 ‘Possibly malignant’; 5 ‘Malignant’
eg. Clinical symptoms classified as 1 ‘not present’, 2 ‘mild’, 3‘moderate’, or 4 ‘severe’
3 Continuouseg. biochemical tests such as serum levels of creatinine, bilirubin orcalcium
B.A. Dwamena (UofM-VAMC) Meta-analysis of Ordinal Test Accuracy DC 2009 5 / 100
Diagnostic Test Evaluation
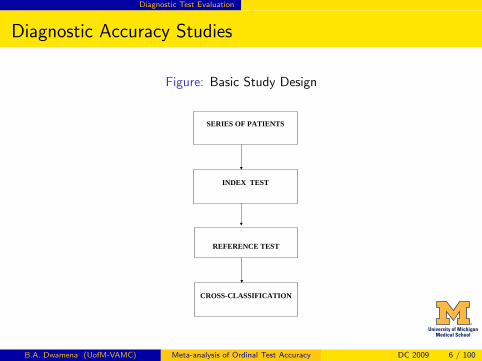
Diagnostic Accuracy Studies
Figure: Basic Study Design
SERIES OF PATIENTS
INDEX TEST
REFERENCE TEST
CROSS-CLASSIFICATION
B.A. Dwamena (UofM-VAMC) Meta-analysis of Ordinal Test Accuracy DC 2009 6 / 100
Diagnostic Test Evaluation
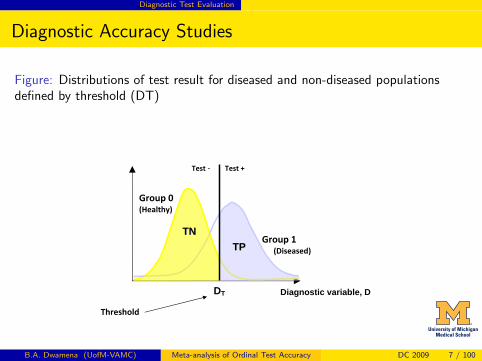
Diagnostic Accuracy Studies
Figure: Distributions of test result for diseased and non-diseased populationsdefined by threshold (DT)
Diagnostic variable, D
Group 0 (Healthy)
Group 1 (Diseased) TTPP
TTNN
DT
Test +Test -
Threshold
B.A. Dwamena (UofM-VAMC) Meta-analysis of Ordinal Test Accuracy DC 2009 7 / 100
Diagnostic Test Evaluation
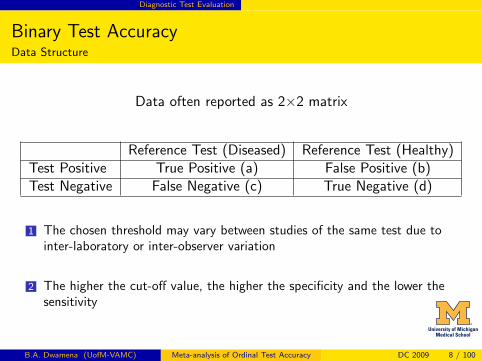
Binary Test AccuracyData Structure
Data often reported as 2×2 matrix
Reference Test (Diseased) Reference Test (Healthy)Test Positive True Positive (a) False Positive (b)Test Negative False Negative (c) True Negative (d)
1 The chosen threshold may vary between studies of the same test due tointer-laboratory or inter-observer variation
2 The higher the cut-off value, the higher the specificity and the lower thesensitivity
B.A. Dwamena (UofM-VAMC) Meta-analysis of Ordinal Test Accuracy DC 2009 8 / 100
Diagnostic Test Evaluation
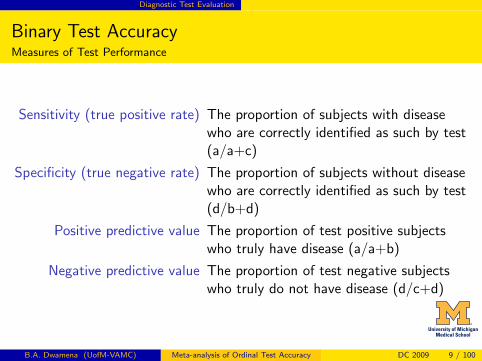
Binary Test AccuracyMeasures of Test Performance
Sensitivity (true positive rate) The proportion of subjects with diseasewho are correctly identified as such by test(a/a+c)
Specificity (true negative rate) The proportion of subjects without diseasewho are correctly identified as such by test(d/b+d)
Positive predictive value The proportion of test positive subjectswho truly have disease (a/a+b)
Negative predictive value The proportion of test negative subjectswho truly do not have disease (d/c+d)
B.A. Dwamena (UofM-VAMC) Meta-analysis of Ordinal Test Accuracy DC 2009 9 / 100
Diagnostic Test Evaluation
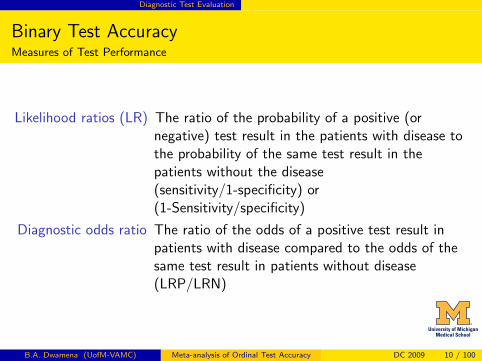
Binary Test AccuracyMeasures of Test Performance
Likelihood ratios (LR) The ratio of the probability of a positive (ornegative) test result in the patients with disease tothe probability of the same test result in thepatients without the disease(sensitivity/1-specificity) or(1-Sensitivity/specificity)
Diagnostic odds ratio The ratio of the odds of a positive test result inpatients with disease compared to the odds of thesame test result in patients without disease(LRP/LRN)
B.A. Dwamena (UofM-VAMC) Meta-analysis of Ordinal Test Accuracy DC 2009 10 / 100
Diagnostic Test Evaluation
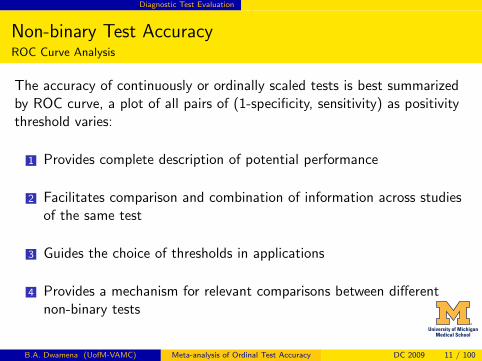
Non-binary Test AccuracyROC Curve Analysis
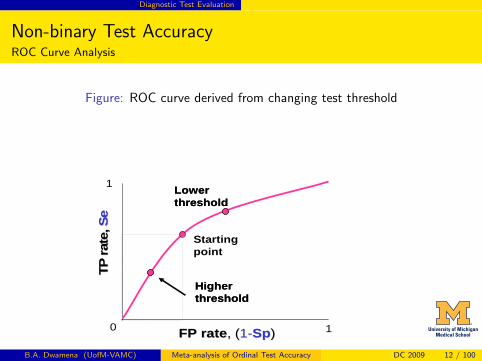
The accuracy of continuously or ordinally scaled tests is best summarizedby ROC curve, a plot of all pairs of (1-specificity, sensitivity) as positivitythreshold varies:
1 Provides complete description of potential performance
2 Facilitates comparison and combination of information across studiesof the same test
3 Guides the choice of thresholds in applications
4 Provides a mechanism for relevant comparisons between differentnon-binary tests
B.A. Dwamena (UofM-VAMC) Meta-analysis of Ordinal Test Accuracy DC 2009 11 / 100
Diagnostic Test Evaluation
Non-binary Test AccuracyROC Curve Analysis
Figure: ROC curve derived from changing test threshold
TP ra
te,
TP ra
te, S
eSe
FP rateFP rate,, ((11--SpSp))0
1
1
Lower thresholdLower threshold
HigherthresholdHigherthreshold
Startingpoint
B.A. Dwamena (UofM-VAMC) Meta-analysis of Ordinal Test Accuracy DC 2009 12 / 100
Diagnostic Test Evaluation
Non-binary Test AccuracyROC Curve Analysis
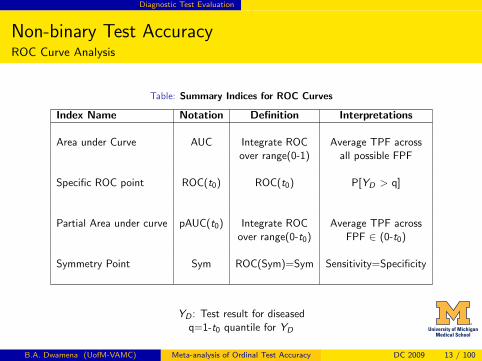
Table: Summary Indices for ROC Curves
Index Name Notation Definition Interpretations
Area under Curve AUC Integrate ROC Average TPF acrossover range(0-1) all possible FPF
Specific ROC point ROC(t0) ROC(t0) P[YD > q]
Partial Area under curve pAUC(t0) Integrate ROC Average TPF acrossover range(0-t0) FPF ∈ (0-t0)
Symmetry Point Sym ROC(Sym)=Sym Sensitivity=Specificity
YD : Test result for diseasedq=1-t0 quantile for YD
B.A. Dwamena (UofM-VAMC) Meta-analysis of Ordinal Test Accuracy DC 2009 13 / 100
Diagnostic Test Evaluation
Ordinal Test AccuracyData Structure
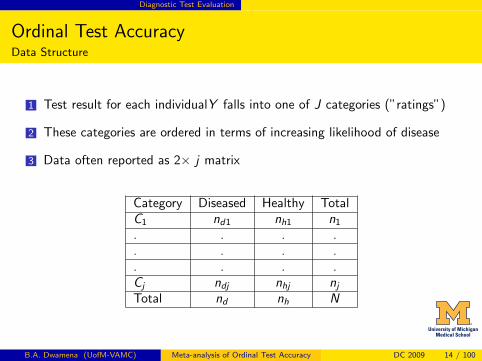
1 Test result for each individualY falls into one of J categories (”ratings”)
2 These categories are ordered in terms of increasing likelihood of disease
3 Data often reported as 2× j matrix
Category Diseased Healthy TotalC1 nd1 nh1 n1
. . . .
. . . .
. . . .Cj ndj nhj nj
Total nd nh N
B.A. Dwamena (UofM-VAMC) Meta-analysis of Ordinal Test Accuracy DC 2009 14 / 100
Diagnostic Test Evaluation
Ordinal Data AnalysisExample Data
117 consecutive patients older than age 50 admitted to a Veterans Affairs(VA) nursing home (NH).
Screened for alcohol dependence using CAGE questionnaire as index test.
DSM-III-R criteria were used as Reference standard.
Forty-nine percent of study participants had lifetime alcohol abuse ordependence.
B.A. Dwamena (UofM-VAMC) Meta-analysis of Ordinal Test Accuracy DC 2009 15 / 100
Diagnostic Test Evaluation
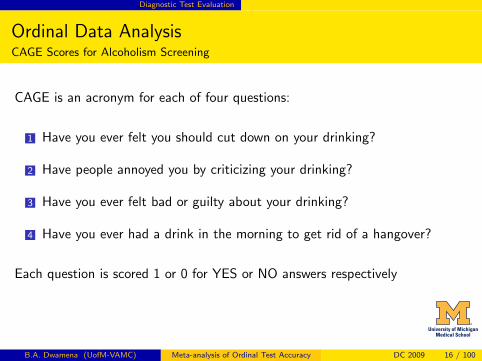
Ordinal Data AnalysisCAGE Scores for Alcoholism Screening
CAGE is an acronym for each of four questions:
1 Have you ever felt you should cut down on your drinking?
2 Have people annoyed you by criticizing your drinking?
3 Have you ever felt bad or guilty about your drinking?
4 Have you ever had a drink in the morning to get rid of a hangover?
Each question is scored 1 or 0 for YES or NO answers respectively
B.A. Dwamena (UofM-VAMC) Meta-analysis of Ordinal Test Accuracy DC 2009 16 / 100
Diagnostic Test Evaluation
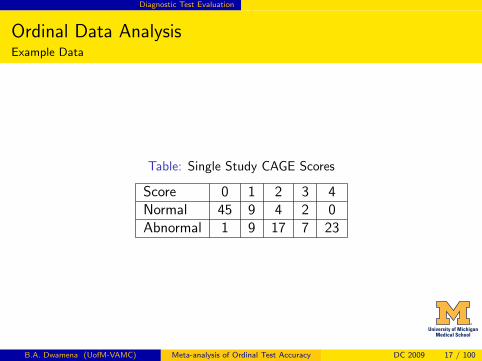
Ordinal Data AnalysisExample Data
Table: Single Study CAGE Scores
Score 0 1 2 3 4Normal 45 9 4 2 0Abnormal 1 9 17 7 23
B.A. Dwamena (UofM-VAMC) Meta-analysis of Ordinal Test Accuracy DC 2009 17 / 100
Diagnostic Test Evaluation
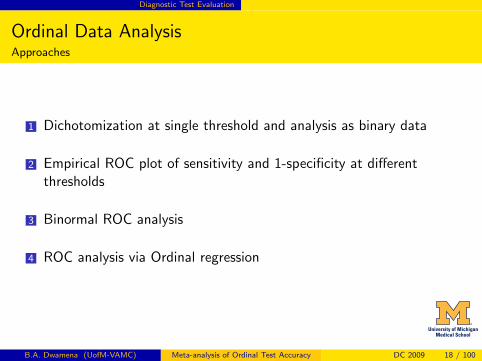
Ordinal Data AnalysisApproaches
1 Dichotomization at single threshold and analysis as binary data
2 Empirical ROC plot of sensitivity and 1-specificity at differentthresholds
3 Binormal ROC analysis
4 ROC analysis via Ordinal regression
B.A. Dwamena (UofM-VAMC) Meta-analysis of Ordinal Test Accuracy DC 2009 18 / 100
Diagnostic Test Evaluation
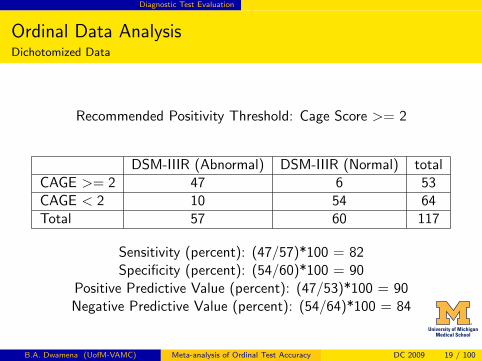
Ordinal Data AnalysisDichotomized Data
Recommended Positivity Threshold: Cage Score >= 2
DSM-IIIR (Abnormal) DSM-IIIR (Normal) totalCAGE >= 2 47 6 53CAGE < 2 10 54 64Total 57 60 117
Sensitivity (percent): (47/57)*100 = 82Specificity (percent): (54/60)*100 = 90
Positive Predictive Value (percent): (47/53)*100 = 90Negative Predictive Value (percent): (54/64)*100 = 84
B.A. Dwamena (UofM-VAMC) Meta-analysis of Ordinal Test Accuracy DC 2009 19 / 100
Diagnostic Test Evaluation
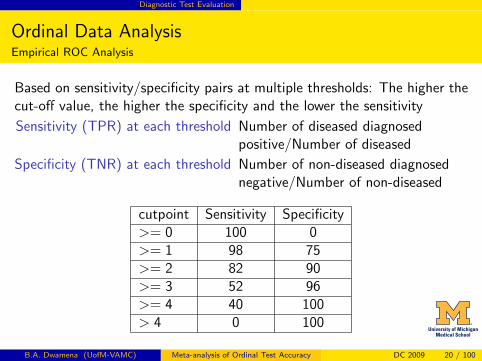
Ordinal Data AnalysisEmpirical ROC Analysis
Based on sensitivity/specificity pairs at multiple thresholds: The higher thecut-off value, the higher the specificity and the lower the sensitivity
Sensitivity (TPR) at each threshold Number of diseased diagnosedpositive/Number of diseased
Specificity (TNR) at each threshold Number of non-diseased diagnosednegative/Number of non-diseased
cutpoint Sensitivity Specificity>= 0 100 0>= 1 98 75>= 2 82 90>= 3 52 96>= 4 40 100> 4 0 100
B.A. Dwamena (UofM-VAMC) Meta-analysis of Ordinal Test Accuracy DC 2009 20 / 100
Diagnostic Test Evaluation
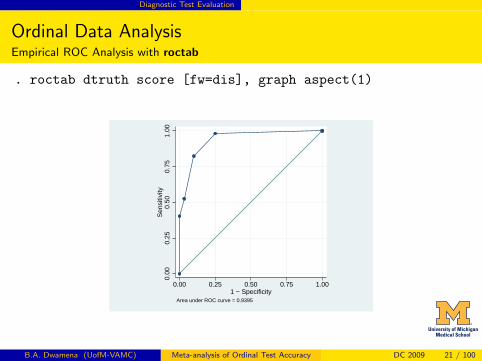
Ordinal Data AnalysisEmpirical ROC Analysis with roctab
. roctab dtruth score [fw=dis], graph aspect(1)
0.00
0.25
0.50
0.75
1.00
Sen
sitiv
ity
0.00 0.25 0.50 0.75 1.001 − Specificity
Area under ROC curve = 0.9395
B.A. Dwamena (UofM-VAMC) Meta-analysis of Ordinal Test Accuracy DC 2009 21 / 100
Diagnostic Test Evaluation
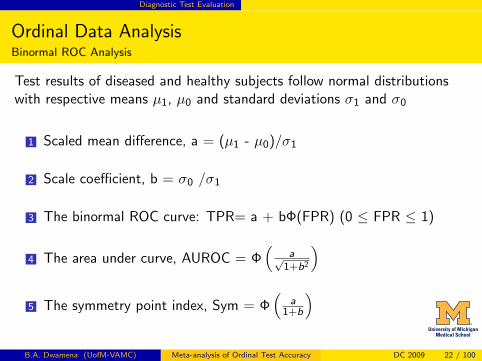
Ordinal Data AnalysisBinormal ROC Analysis
Test results of diseased and healthy subjects follow normal distributionswith respective means µ1, µ0 and standard deviations σ1 and σ0
1 Scaled mean difference, a = (µ1 - µ0)/σ1
2 Scale coefficient, b = σ0 /σ1
3 The binormal ROC curve: TPR= a + bΦ(FPR) (0 ≤ FPR ≤ 1)
4 The area under curve, AUROC = Φ(
a√1+b2
)5 The symmetry point index, Sym = Φ
(a
1+b
)B.A. Dwamena (UofM-VAMC) Meta-analysis of Ordinal Test Accuracy DC 2009 22 / 100

Diagnostic Test Evaluation
Ordinal Data AnalysisBinormal ROC Analysis using rocfit
. rocfit dtruth score [fw=dis]
Binormal model of dtruth on score Number of obs = 117
Goodness-of-fit chi2(2) = 2.88
Prob > chi2 = 0.2373
Log likelihood = -126.31934
------------------------------------------------------------------------------
| Coef. Std. Err. z P>|z| [95% Conf. Interval]
-------------+----------------------------------------------------------------
intercept | 2.919589 0.648216 4.50 0.000 1.649110 4.190068
slope (*) | 1.443559 0.444514 1.00 0.318 0.572328 2.314789
-------------+----------------------------------------------------------------
/cut1 | 0.663779 0.175958 3.77 0.000 0.318907 1.008651
/cut2 | 1.355698 0.207460 6.53 0.000 0.949083 1.762312
/cut3 | 1.950510 0.296180 6.59 0.000 1.370009 2.531011
/cut4 | 2.207473 0.358501 6.16 0.000 1.504824 2.910122
------------------------------------------------------------------------------
------------------------------------------------------------------------------
| Indices from binormal fit
Index | Estimate Std. Err. [95% Conf. Interval]
-------------+----------------------------------------------------------------
ROC area | 0.951799 0.018976 0.914606 0.988991
delta(m) | 2.022495 0.328053 1.379522 2.665467
d(e) | 2.389621 0.270268 1.859906 2.919336
d(a) | 2.351199 0.267932 1.826062 2.876336
------------------------------------------------------------------------------
B.A. Dwamena (UofM-VAMC) Meta-analysis of Ordinal Test Accuracy DC 2009 23 / 100
Diagnostic Test Evaluation
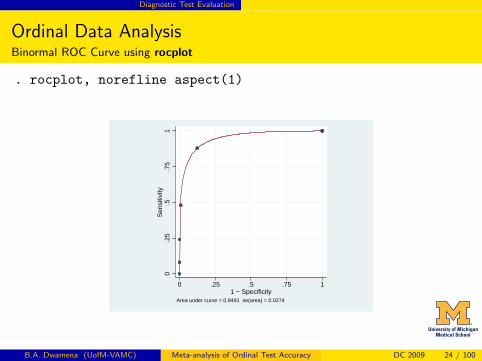
Ordinal Data AnalysisBinormal ROC Curve using rocplot
. rocplot, norefline aspect(1)
0.2
5.5
.75
1S
ensi
tivity
0 .25 .5 .75 11 − Specificity
Area under curve = 0.9491 se(area) = 0.0274
B.A. Dwamena (UofM-VAMC) Meta-analysis of Ordinal Test Accuracy DC 2009 24 / 100
Diagnostic Test Evaluation
Ordinal Data AnalysisROC Analysis via Heteroskedastic Ordinal Regression
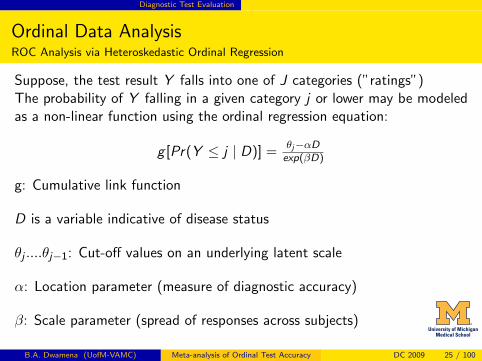
Suppose, the test result Y falls into one of J categories (”ratings”)The probability of Y falling in a given category j or lower may be modeledas a non-linear function using the ordinal regression equation:
g [Pr(Y ≤ j | D)] =θj−αDexp(βD)
g: Cumulative link function
D is a variable indicative of disease status
θj ....θj−1: Cut-off values on an underlying latent scale
α: Location parameter (measure of diagnostic accuracy)
β: Scale parameter (spread of responses across subjects)
B.A. Dwamena (UofM-VAMC) Meta-analysis of Ordinal Test Accuracy DC 2009 25 / 100
Diagnostic Test Evaluation
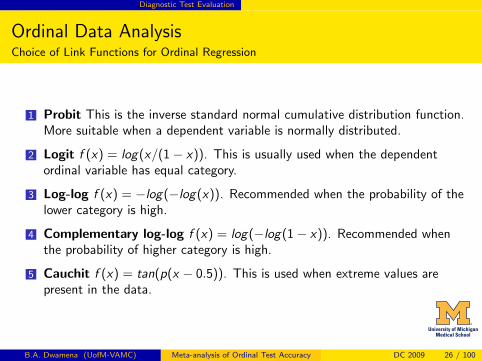
Ordinal Data AnalysisChoice of Link Functions for Ordinal Regression
1 Probit This is the inverse standard normal cumulative distribution function.More suitable when a dependent variable is normally distributed.
2 Logit f (x) = log(x/(1− x)). This is usually used when the dependentordinal variable has equal category.
3 Log-log f (x) = −log(−log(x)). Recommended when the probability of thelower category is high.
4 Complementary log-log f (x) = log(−log(1− x)). Recommended whenthe probability of higher category is high.
5 Cauchit f (x) = tan(p(x − 0.5)). This is used when extreme values arepresent in the data.
B.A. Dwamena (UofM-VAMC) Meta-analysis of Ordinal Test Accuracy DC 2009 26 / 100
Diagnostic Test Evaluation
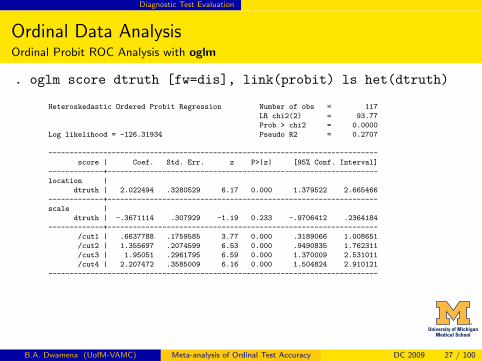
Ordinal Data AnalysisOrdinal Probit ROC Analysis with oglm
. oglm score dtruth [fw=dis], link(probit) ls het(dtruth)
Heteroskedastic Ordered Probit Regression Number of obs = 117
LR chi2(2) = 93.77
Prob > chi2 = 0.0000
Log likelihood = -126.31934 Pseudo R2 = 0.2707
------------------------------------------------------------------------------
score | Coef. Std. Err. z P>|z| [95% Conf. Interval]
-------------+----------------------------------------------------------------
location |
dtruth | 2.022494 .3280529 6.17 0.000 1.379522 2.665466
-------------+----------------------------------------------------------------
scale |
dtruth | -.3671114 .307929 -1.19 0.233 -.9706412 .2364184
-------------+----------------------------------------------------------------
/cut1 | .6637788 .1759585 3.77 0.000 .3189066 1.008651
/cut2 | 1.355697 .2074599 6.53 0.000 .9490835 1.762311
/cut3 | 1.95051 .2961795 6.59 0.000 1.370009 2.531011
/cut4 | 2.207472 .3585009 6.16 0.000 1.504824 2.910121
------------------------------------------------------------------------------
B.A. Dwamena (UofM-VAMC) Meta-analysis of Ordinal Test Accuracy DC 2009 27 / 100
Diagnostic Test Evaluation
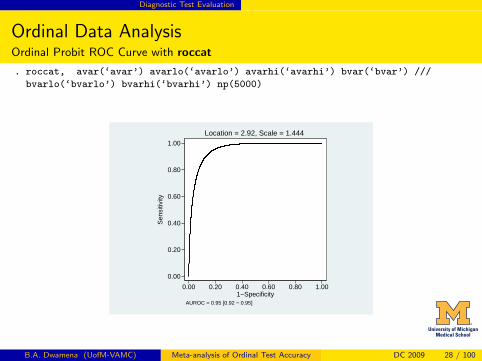
Ordinal Data AnalysisOrdinal Probit ROC Curve with roccat
. roccat, avar(‘avar’) avarlo(‘avarlo’) avarhi(‘avarhi’) bvar(‘bvar’) ///
bvarlo(‘bvarlo’) bvarhi(‘bvarhi’) np(5000)
0.00
0.20
0.40
0.60
0.80
1.00
Sen
sitiv
ity
0.00 0.20 0.40 0.60 0.80 1.001−Specificity
AUROC = 0.95 [0.92 − 0.95]
Location = 2.92, Scale = 1.444
B.A. Dwamena (UofM-VAMC) Meta-analysis of Ordinal Test Accuracy DC 2009 28 / 100
Diagnostic Test Evaluation
Diagnostic Meta-analysisCritical review and statistical combination of previous research
Rationale
1 Too few patients in a single study
2 Too selected a population in a single study
3 No consensus regarding accuracy, impact, reproducibility of test(s)
4 Data often scattered across several journals
5 Explanation of variability in test accuracy
6 etc.
B.A. Dwamena (UofM-VAMC) Meta-analysis of Ordinal Test Accuracy DC 2009 29 / 100
Diagnostic Test Evaluation
Diagnostic Meta-analysisScope
1 Identification of the number, quality and scope of primary studies
2 Quantification of overall classification performance (sensitivity andspecificity), discriminatory power (diagnostic odds ratios) andinformational value (diagnostic likelihood ratios)
3 Assessment of the impact of technological evolution (by cumulativemeta-analysis based on publication year), technical characteristics oftest, methodological quality of primary studies and publicationselection bias on estimates of diagnostic accuracy
4 Highlighting of potential issues that require further research
B.A. Dwamena (UofM-VAMC) Meta-analysis of Ordinal Test Accuracy DC 2009 30 / 100
Diagnostic Test Evaluation
Diagnostic Meta-analysisMethodological Concepts
1 Meta-analysis of diagnostic accuracy studies may be performed toprovide summary estimates of test performance based on a collectionof studies and their reported empirical or estimated smooth ROCcurves
2 Statistical methodology for meta-analysis of diagnostic accuracystudies focused on studies reporting estimates of test sensitivity andspecificity or two by two data
3 Both fixed and random-effects meta-analytic models have beendeveloped to combine information from such studies
B.A. Dwamena (UofM-VAMC) Meta-analysis of Ordinal Test Accuracy DC 2009 31 / 100
Diagnostic Test Evaluation
Diagnostic Meta-analysisMethodological Concepts
1 To meta-analyze studies with results in more than two categories,results are often dichotomized in order to employ one of the binarymethods
2 It is more efficient and informative to take all thresholds into account
3 Existing methods require the same number and set of thresholds, arecomputationally intensive adapations of the binary methods or arebased on hierarchical ordinal probit regression implementable usingBayesian inference
B.A. Dwamena (UofM-VAMC) Meta-analysis of Ordinal Test Accuracy DC 2009 32 / 100
Example Data
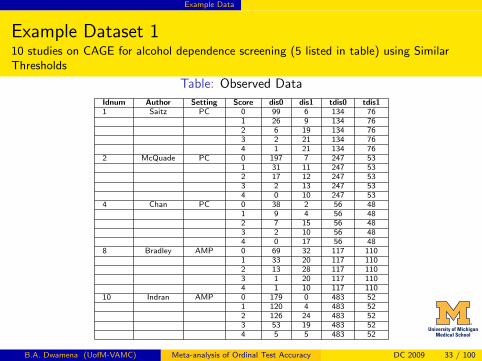
Example Dataset 110 studies on CAGE for alcohol dependence screening (5 listed in table) using SimilarThresholds
Table: Observed Data
Idnum Author Setting Score dis0 dis1 tdis0 tdis11 Saitz PC 0 99 6 134 76
1 26 9 134 762 6 19 134 763 2 21 134 764 1 21 134 76
2 McQuade PC 0 197 7 247 531 31 11 247 532 17 12 247 533 2 13 247 534 0 10 247 53
4 Chan PC 0 38 2 56 481 9 4 56 482 7 15 56 483 2 10 56 484 0 17 56 48
8 Bradley AMP 0 69 32 117 1101 33 20 117 1102 13 28 117 1103 1 20 117 1104 1 10 117 110
10 Indran AMP 0 179 0 483 521 120 4 483 522 126 24 483 523 53 19 483 524 5 5 483 52
B.A. Dwamena (UofM-VAMC) Meta-analysis of Ordinal Test Accuracy DC 2009 33 / 100
Example Data
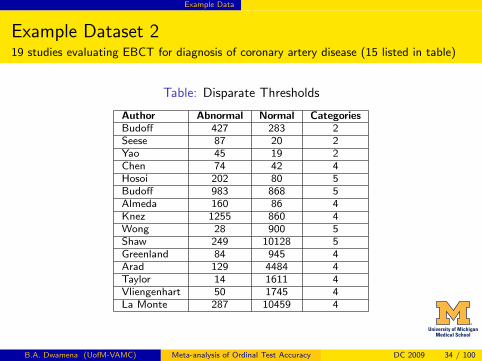
Example Dataset 219 studies evaluating EBCT for diagnosis of coronary artery disease (15 listed in table)
Table: Disparate Thresholds
Author Abnormal Normal CategoriesBudoff 427 283 2Seese 87 20 2Yao 45 19 2Chen 74 42 4Hosoi 202 80 5Budoff 983 868 5Almeda 160 86 4Knez 1255 860 4Wong 28 900 5Shaw 249 10128 5Greenland 84 945 4Arad 129 4484 4Taylor 14 1611 4Vliengenhart 50 1745 4La Monte 287 10459 4
B.A. Dwamena (UofM-VAMC) Meta-analysis of Ordinal Test Accuracy DC 2009 34 / 100
Current Methods for Meta-analysis of Ordinal Data
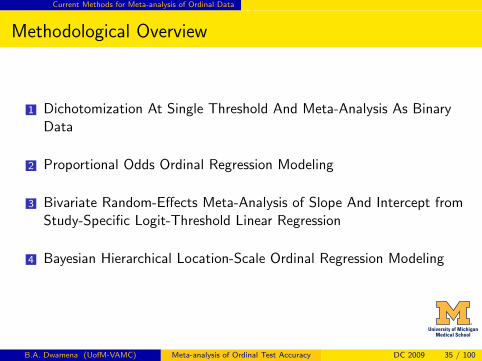
Methodological Overview
1 Dichotomization At Single Threshold And Meta-Analysis As BinaryData
2 Proportional Odds Ordinal Regression Modeling
3 Bivariate Random-Effects Meta-Analysis of Slope And Intercept fromStudy-Specific Logit-Threshold Linear Regression
4 Bayesian Hierarchical Location-Scale Ordinal Regression Modeling
B.A. Dwamena (UofM-VAMC) Meta-analysis of Ordinal Test Accuracy DC 2009 35 / 100
Current Methods for Meta-analysis of Ordinal Data
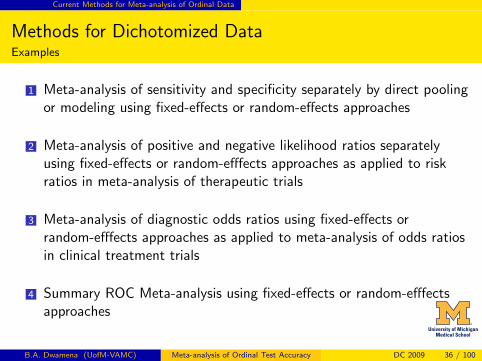
Methods for Dichotomized DataExamples
1 Meta-analysis of sensitivity and specificity separately by direct poolingor modeling using fixed-effects or random-effects approaches
2 Meta-analysis of positive and negative likelihood ratios separatelyusing fixed-effects or random-efffects approaches as applied to riskratios in meta-analysis of therapeutic trials
3 Meta-analysis of diagnostic odds ratios using fixed-effects orrandom-efffects approaches as applied to meta-analysis of odds ratiosin clinical treatment trials
4 Summary ROC Meta-analysis using fixed-effects or random-efffectsapproaches
B.A. Dwamena (UofM-VAMC) Meta-analysis of Ordinal Test Accuracy DC 2009 36 / 100
Current Methods for Meta-analysis of Ordinal Data
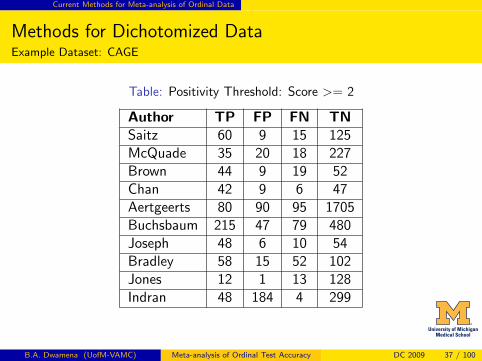
Methods for Dichotomized DataExample Dataset: CAGE
Table: Positivity Threshold: Score >= 2
Author TP FP FN TNSaitz 60 9 15 125McQuade 35 20 18 227Brown 44 9 19 52Chan 42 9 6 47Aertgeerts 80 90 95 1705Buchsbaum 215 47 79 480Joseph 48 6 10 54Bradley 58 15 52 102Jones 12 1 13 128Indran 48 184 4 299
B.A. Dwamena (UofM-VAMC) Meta-analysis of Ordinal Test Accuracy DC 2009 37 / 100
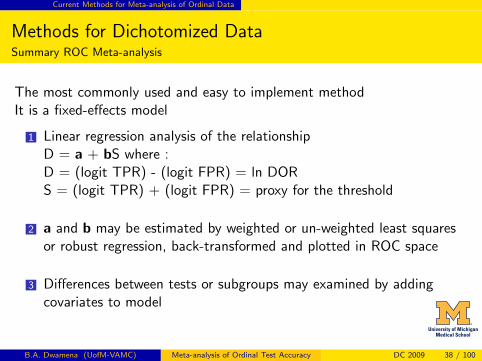
Current Methods for Meta-analysis of Ordinal Data
Methods for Dichotomized DataSummary ROC Meta-analysis
The most commonly used and easy to implement methodIt is a fixed-effects model
1 Linear regression analysis of the relationshipD = a + bS where :D = (logit TPR) - (logit FPR) = ln DORS = (logit TPR) + (logit FPR) = proxy for the threshold
2 a and b may be estimated by weighted or un-weighted least squaresor robust regression, back-transformed and plotted in ROC space
3 Differences between tests or subgroups may examined by addingcovariates to model
B.A. Dwamena (UofM-VAMC) Meta-analysis of Ordinal Test Accuracy DC 2009 38 / 100
Current Methods for Meta-analysis of Ordinal Data
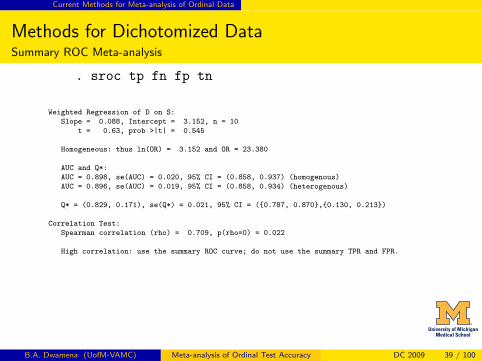
Methods for Dichotomized DataSummary ROC Meta-analysis
. sroc tp fn fp tn
Weighted Regression of D on S:
Slope = 0.088, Intercept = 3.152, n = 10
t = 0.63, prob >|t| = 0.545
Homogeneous: thus ln(OR) = 3.152 and OR = 23.380
AUC and Q*:
AUC = 0.898, se(AUC) = 0.020, 95% CI = (0.858, 0.937) (homogenous)
AUC = 0.896, se(AUC) = 0.019, 95% CI = (0.858, 0.934) (heterogenous)
Q* = (0.829, 0.171), se(Q*) = 0.021, 95% CI = ({0.787, 0.870},{0.130, 0.213})
Correlation Test:
Spearman correlation (rho) = 0.709, p(rho=0) = 0.022
High correlation: use the summary ROC curve; do not use the summary TPR and FPR.
B.A. Dwamena (UofM-VAMC) Meta-analysis of Ordinal Test Accuracy DC 2009 39 / 100
Current Methods for Meta-analysis of Ordinal Data
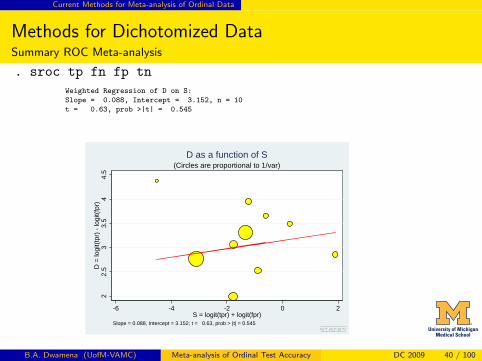
Methods for Dichotomized DataSummary ROC Meta-analysis
. sroc tp fn fp tnWeighted Regression of D on S:
Slope = 0.088, Intercept = 3.152, n = 10
t = 0.63, prob >|t| = 0.5452
2.5
33.
54
4.5
D =
logi
t(tpr
) - lo
git(f
pr)
-6 -4 -2 0 2S = logit(tpr) + logit(fpr)
Slope = 0.088, Intercept = 3.152; t = 0.63, prob > |t| = 0.545
(Circles are proportional to 1/var)D as a function of S
B.A. Dwamena (UofM-VAMC) Meta-analysis of Ordinal Test Accuracy DC 2009 40 / 100
Current Methods for Meta-analysis of Ordinal Data
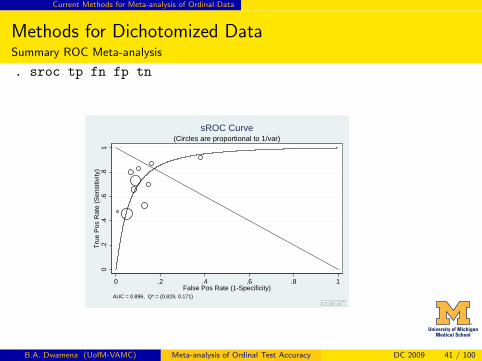
Methods for Dichotomized DataSummary ROC Meta-analysis
. sroc tp fn fp tn
0.2
.4.6
.81
True
Pos
Rat
e (S
ensi
tivity
)
0 .2 .4 .6 .8 1False Pos Rate (1-Specificity)
AUC = 0.896, Q* = (0.829, 0.171)
(Circles are proportional to 1/var)sROC Curve
B.A. Dwamena (UofM-VAMC) Meta-analysis of Ordinal Test Accuracy DC 2009 41 / 100
Current Methods for Meta-analysis of Ordinal Data
Methods for Dichotomized DataMixed Effects Hierarchical Models
Mathematically equivalent models for estimating underlying SROC and averageoperating point and/or exploring heterogeneity
Hierarchical Summary ROC(HSROC) Model
1 Focused on inferences about the SROC curve, or comparing SROC curvesbut summary operating point(s) can be derived from the model parameters
Bivariate Mixed Effects Models
1 Focused on inferences about sensitivity and specificity but SROC curve(s)can be derived from the model parameters
2 Generalization of the commonly used DerSimonian and Laird random effectsmodel
B.A. Dwamena (UofM-VAMC) Meta-analysis of Ordinal Test Accuracy DC 2009 42 / 100
Current Methods for Meta-analysis of Ordinal Data
Methods for Dichotomized DataHierarchical Summary ROC Regression
Level 1: Within-study variability
yij ∼ Bin (nij , πij)
logit (πij) = (θi + αiXij) exp (−βXij)
θi and αi Study-specific threshold and accuracy parameters
yij Number testing positive assumed to be binomially distributed
πij Probability that a patient in study i with disease status j has apositive test result
Xij True disease status(coded -0.5 for those without disease and 0.5for those with the disease)
B.A. Dwamena (UofM-VAMC) Meta-analysis of Ordinal Test Accuracy DC 2009 43 / 100
Current Methods for Meta-analysis of Ordinal Data
Methods for Dichotomized DataHierarchical Summary ROC Regression
Level 2: Between-study variability
θi ∼ N(Θ, σ2
θ
)αi ∼ N
(A, σ2
α
)Θ and A Means of the normally distributed threshold and accuracy
parameters
σ2θ and σ2
α Variances of mean threshold and accuracy
β Shape parameter which models any asymmetry in the SROCcurve
B.A. Dwamena (UofM-VAMC) Meta-analysis of Ordinal Test Accuracy DC 2009 44 / 100
Current Methods for Meta-analysis of Ordinal Data
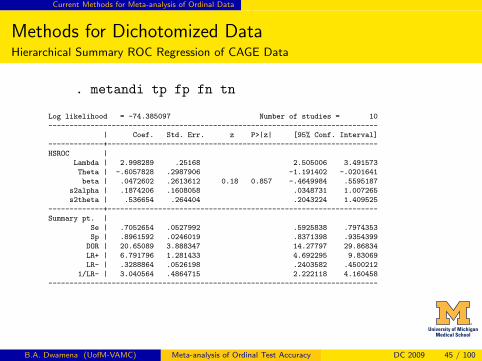
Methods for Dichotomized DataHierarchical Summary ROC Regression of CAGE Data
. metandi tp fp fn tn
Log likelihood = -74.385097 Number of studies = 10
------------------------------------------------------------------------------
| Coef. Std. Err. z P>|z| [95% Conf. Interval]
-------------+----------------------------------------------------------------
HSROC |
Lambda | 2.998289 .25168 2.505006 3.491573
Theta | -.6057828 .2987906 -1.191402 -.0201641
beta | .0472602 .2613612 0.18 0.857 -.4649984 .5595187
s2alpha | .1874206 .1608058 .0348731 1.007265
s2theta | .536654 .264404 .2043224 1.409525
-------------+----------------------------------------------------------------
Summary pt. |
Se | .7052654 .0527992 .5925838 .7974353
Sp | .8961592 .0246019 .8371398 .9354399
DOR | 20.65089 3.888347 14.27797 29.86834
LR+ | 6.791796 1.281433 4.692295 9.83069
LR- | .3288864 .0526198 .2403582 .4500212
1/LR- | 3.040564 .4864715 2.222118 4.160458
------------------------------------------------------------------------------
B.A. Dwamena (UofM-VAMC) Meta-analysis of Ordinal Test Accuracy DC 2009 45 / 100
Current Methods for Meta-analysis of Ordinal Data
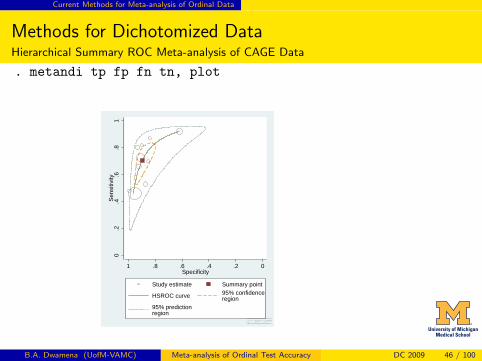
Methods for Dichotomized DataHierarchical Summary ROC Meta-analysis of CAGE Data
. metandi tp fp fn tn, plot
0.2
.4.6
.81
Sen
sitiv
ity
0.2.4.6.81Specificity
Study estimate Summary point
HSROC curve 95% confidenceregion
95% predictionregion
B.A. Dwamena (UofM-VAMC) Meta-analysis of Ordinal Test Accuracy DC 2009 46 / 100
Current Methods for Meta-analysis of Ordinal Data
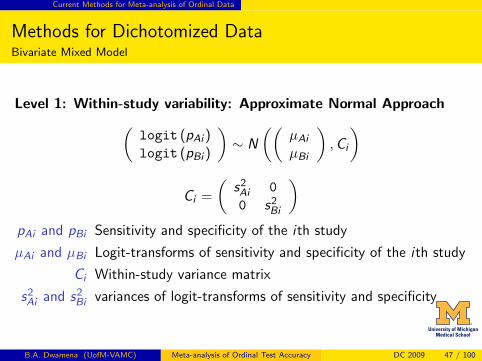
Methods for Dichotomized DataBivariate Mixed Model
Level 1: Within-study variability: Approximate Normal Approach(logit (pAi )logit (pBi )
)∼ N
((µAi
µBi
),Ci
)
Ci =
(s2Ai 00 s2
Bi
)pAi and pBi Sensitivity and specificity of the ith study
µAi and µBi Logit-transforms of sensitivity and specificity of the ith study
Ci Within-study variance matrix
s2Ai and s2
Bi variances of logit-transforms of sensitivity and specificity
B.A. Dwamena (UofM-VAMC) Meta-analysis of Ordinal Test Accuracy DC 2009 47 / 100
Current Methods for Meta-analysis of Ordinal Data
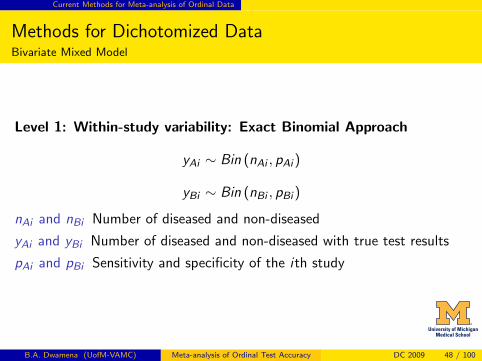
Methods for Dichotomized DataBivariate Mixed Model
Level 1: Within-study variability: Exact Binomial Approach
yAi ∼ Bin (nAi , pAi )
yBi ∼ Bin (nBi , pBi )
nAi and nBi Number of diseased and non-diseased
yAi and yBi Number of diseased and non-diseased with true test results
pAi and pBi Sensitivity and specificity of the ith study
B.A. Dwamena (UofM-VAMC) Meta-analysis of Ordinal Test Accuracy DC 2009 48 / 100
Current Methods for Meta-analysis of Ordinal Data
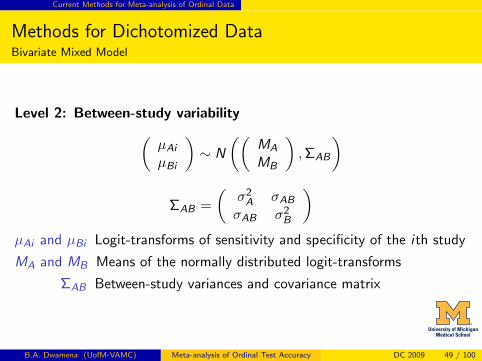
Methods for Dichotomized DataBivariate Mixed Model
Level 2: Between-study variability(µAi
µBi
)∼ N
((MA
MB
),ΣAB
)
ΣAB =
(σ2
A σAB
σAB σ2B
)µAi and µBi Logit-transforms of sensitivity and specificity of the ith study
MA and MB Means of the normally distributed logit-transforms
ΣAB Between-study variances and covariance matrix
B.A. Dwamena (UofM-VAMC) Meta-analysis of Ordinal Test Accuracy DC 2009 49 / 100
Current Methods for Meta-analysis of Ordinal Data
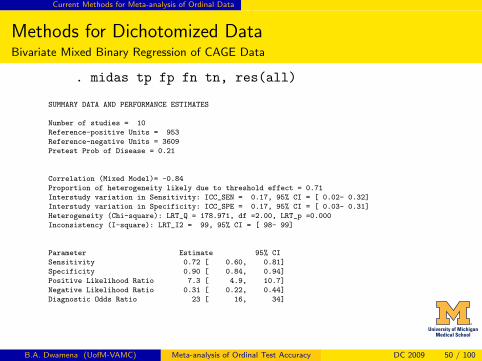
Methods for Dichotomized DataBivariate Mixed Binary Regression of CAGE Data
. midas tp fp fn tn, res(all)
SUMMARY DATA AND PERFORMANCE ESTIMATES
Number of studies = 10
Reference-positive Units = 953
Reference-negative Units = 3609
Pretest Prob of Disease = 0.21
Correlation (Mixed Model)= -0.84
Proportion of heterogeneity likely due to threshold effect = 0.71
Interstudy variation in Sensitivity: ICC_SEN = 0.17, 95% CI = [ 0.02- 0.32]
Interstudy variation in Specificity: ICC_SPE = 0.17, 95% CI = [ 0.03- 0.31]
Heterogeneity (Chi-square): LRT_Q = 178.971, df =2.00, LRT_p =0.000
Inconsistency (I-square): LRT_I2 = 99, 95% CI = [ 98- 99]
Parameter Estimate 95% CI
Sensitivity 0.72 [ 0.60, 0.81]
Specificity 0.90 [ 0.84, 0.94]
Positive Likelihood Ratio 7.3 [ 4.9, 10.7]
Negative Likelihood Ratio 0.31 [ 0.22, 0.44]
Diagnostic Odds Ratio 23 [ 16, 34]
B.A. Dwamena (UofM-VAMC) Meta-analysis of Ordinal Test Accuracy DC 2009 50 / 100
Current Methods for Meta-analysis of Ordinal Data
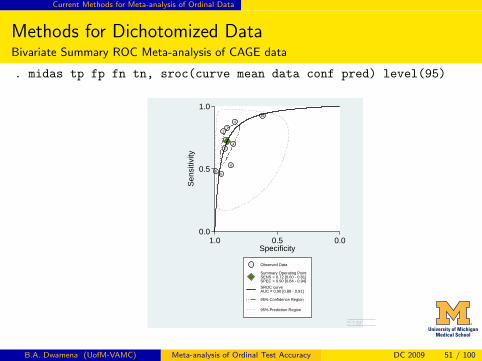
Methods for Dichotomized DataBivariate Summary ROC Meta-analysis of CAGE data
. midas tp fp fn tn, sroc(curve mean data conf pred) level(95)
1
23
4
5
6
7
8
9
10
0.0
0.5
1.0
Sen
sitiv
ity
0.00.51.0Specificity
Observed Data
Summary Operating PointSENS = 0.72 [0.60 - 0.81]SPEC = 0.90 [0.84 - 0.94]SROC curveAUC = 0.90 [0.88 - 0.91]
95% Confidence Region
95% Prediction Region
B.A. Dwamena (UofM-VAMC) Meta-analysis of Ordinal Test Accuracy DC 2009 51 / 100
Current Methods for Meta-analysis of Ordinal Data
Proportional Odds Regression(POR) Framework
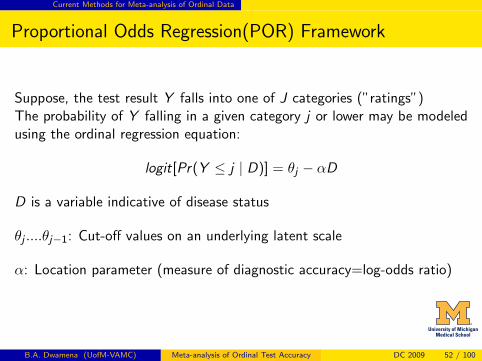
Suppose, the test result Y falls into one of J categories (”ratings”)The probability of Y falling in a given category j or lower may be modeledusing the ordinal regression equation:
logit[Pr(Y ≤ j | D)] = θj − αD
D is a variable indicative of disease status
θj ....θj−1: Cut-off values on an underlying latent scale
α: Location parameter (measure of diagnostic accuracy=log-odds ratio)
B.A. Dwamena (UofM-VAMC) Meta-analysis of Ordinal Test Accuracy DC 2009 52 / 100
Current Methods for Meta-analysis of Ordinal Data
Proportional Odds Regression(POR) FrameworkAlternative Fixed- or Random-effects Approaches
1 Single POR and log-odds ratio of pooled data
2 Single POR and log-odds ratio with adjustment for study usingdummy variables
3 Study-specific POR and log-odds ratios
All ROC curves are symmetric because of the assumption of a constantodds ratio for test accuracy
B.A. Dwamena (UofM-VAMC) Meta-analysis of Ordinal Test Accuracy DC 2009 53 / 100
Current Methods for Meta-analysis of Ordinal Data
Proportional Odds Regression ModelFixed-effects POR of Pooled Data (FEPOR)
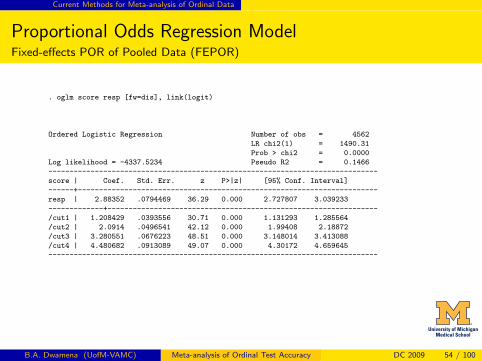
. oglm score resp [fw=dis], link(logit)
Ordered Logistic Regression Number of obs = 4562
LR chi2(1) = 1490.31
Prob > chi2 = 0.0000
Log likelihood = -4337.5234 Pseudo R2 = 0.1466
------------------------------------------------------------------------------
score | Coef. Std. Err. z P>|z| [95% Conf. Interval]
------+-----------------------------------------------------------------------
resp | 2.88352 .0794469 36.29 0.000 2.727807 3.039233
-------------+----------------------------------------------------------------
/cut1 | 1.208429 .0393556 30.71 0.000 1.131293 1.285564
/cut2 | 2.0914 .0496541 42.12 0.000 1.99408 2.18872
/cut3 | 3.280551 .0676223 48.51 0.000 3.148014 3.413088
/cut4 | 4.480682 .0913089 49.07 0.000 4.30172 4.659645
------------------------------------------------------------------------------
B.A. Dwamena (UofM-VAMC) Meta-analysis of Ordinal Test Accuracy DC 2009 54 / 100
Current Methods for Meta-analysis of Ordinal Data
Proportional Odds Regression ModelRandom-effects POR of Pooled Data (REPOR)
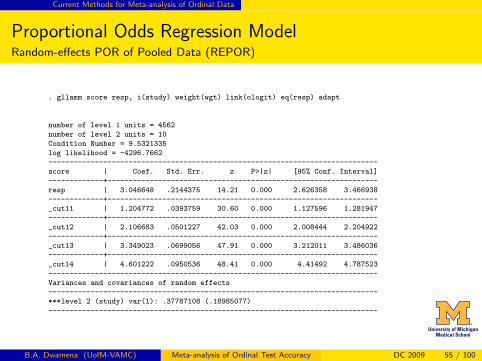
. gllamm score resp, i(study) weight(wgt) link(ologit) eq(resp) adapt
number of level 1 units = 4562
number of level 2 units = 10
Condition Number = 9.5321335
log likelihood = -4296.7662
------------------------------------------------------------------------------
score | Coef. Std. Err. z P>|z| [95% Conf. Interval]
-------------+----------------------------------------------------------------
resp | 3.046648 .2144375 14.21 0.000 2.626358 3.466938
-------------+----------------------------------------------------------------
_cut11 | 1.204772 .0393759 30.60 0.000 1.127596 1.281947
-------------+----------------------------------------------------------------
_cut12 | 2.106683 .0501227 42.03 0.000 2.008444 2.204922
-------------+----------------------------------------------------------------
_cut13 | 3.349023 .0699056 47.91 0.000 3.212011 3.486036
-------------+----------------------------------------------------------------
_cut14 | 4.601222 .0950536 48.41 0.000 4.41492 4.787523
------------------------------------------------------------------------------
Variances and covariances of random effects
------------------------------------------------------------------------------
***level 2 (study) var(1): .37787108 (.18985077)
------------------------------------------------------------------------------
B.A. Dwamena (UofM-VAMC) Meta-analysis of Ordinal Test Accuracy DC 2009 55 / 100
Current Methods for Meta-analysis of Ordinal Data
Proportional Odds Regression ModelFixed-effects POR with Studies as Dummy Variables (FEPORD)
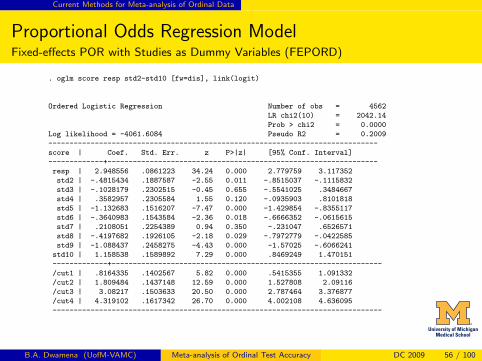
. oglm score resp std2-std10 [fw=dis], link(logit)
Ordered Logistic Regression Number of obs = 4562
LR chi2(10) = 2042.14
Prob > chi2 = 0.0000
Log likelihood = -4061.6084 Pseudo R2 = 0.2009
------------------------------------------------------------------------------
score | Coef. Std. Err. z P>|z| [95% Conf. Interval]
-------------+----------------------------------------------------------------
resp | 2.948556 .0861223 34.24 0.000 2.779759 3.117352
std2 | -.4815434 .1887587 -2.55 0.011 -.8515037 -.1115832
std3 | -.1028179 .2302515 -0.45 0.655 -.5541025 .3484667
std4 | .3582957 .2305584 1.55 0.120 -.0935903 .8101818
std5 | -1.132683 .1516207 -7.47 0.000 -1.429854 -.8355117
std6 | -.3640983 .1543584 -2.36 0.018 -.6666352 -.0615615
std7 | .2108051 .2254389 0.94 0.350 -.231047 .6526571
std8 | -.4197682 .1926105 -2.18 0.029 -.7972779 -.0422585
std9 | -1.088437 .2458275 -4.43 0.000 -1.57025 -.6066241
std10 | 1.158538 .1589892 7.29 0.000 .8469249 1.470151
-------------+----------------------------------------------------------------
/cut1 | .8164335 .1402567 5.82 0.000 .5415355 1.091332
/cut2 | 1.809484 .1437148 12.59 0.000 1.527808 2.09116
/cut3 | 3.08217 .1503633 20.50 0.000 2.787464 3.376877
/cut4 | 4.319102 .1617342 26.70 0.000 4.002108 4.636095
------------------------------------------------------------------------------
B.A. Dwamena (UofM-VAMC) Meta-analysis of Ordinal Test Accuracy DC 2009 56 / 100
Current Methods for Meta-analysis of Ordinal Data
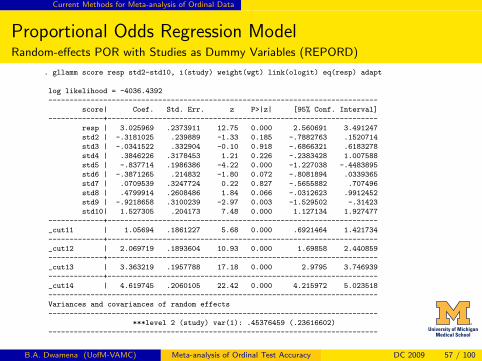
Proportional Odds Regression ModelRandom-effects POR with Studies as Dummy Variables (REPORD)
. gllamm score resp std2-std10, i(study) weight(wgt) link(ologit) eq(resp) adapt
log likelihood = -4036.4392
------------------------------------------------------------------------------
score| Coef. Std. Err. z P>|z| [95% Conf. Interval]
-------------+----------------------------------------------------------------
resp | 3.025969 .2373911 12.75 0.000 2.560691 3.491247
std2 | -.3181025 .239889 -1.33 0.185 -.7882763 .1520714
std3 | -.0341522 .332904 -0.10 0.918 -.6866321 .6183278
std4 | .3846226 .3178453 1.21 0.226 -.2383428 1.007588
std5 | -.837714 .1986386 -4.22 0.000 -1.227038 -.4483895
std6 | -.3871265 .214832 -1.80 0.072 -.8081894 .0339365
std7 | .0709539 .3247724 0.22 0.827 -.5655882 .707496
std8 | .4799914 .2608486 1.84 0.066 -.0312623 .9912452
std9 | -.9218658 .3100239 -2.97 0.003 -1.529502 -.31423
std10| 1.527305 .204173 7.48 0.000 1.127134 1.927477
-------------+----------------------------------------------------------------
_cut11 | 1.05694 .1861227 5.68 0.000 .6921464 1.421734
-------------+----------------------------------------------------------------
_cut12 | 2.069719 .1893604 10.93 0.000 1.69858 2.440859
-------------+----------------------------------------------------------------
_cut13 | 3.363219 .1957788 17.18 0.000 2.9795 3.746939
-------------+----------------------------------------------------------------
_cut14 | 4.619745 .2060105 22.42 0.000 4.215972 5.023518
------------------------------------------------------------------------------
Variances and covariances of random effects
------------------------------------------------------------------------------
***level 2 (study) var(1): .45376459 (.23616602)
------------------------------------------------------------------------------
B.A. Dwamena (UofM-VAMC) Meta-analysis of Ordinal Test Accuracy DC 2009 57 / 100
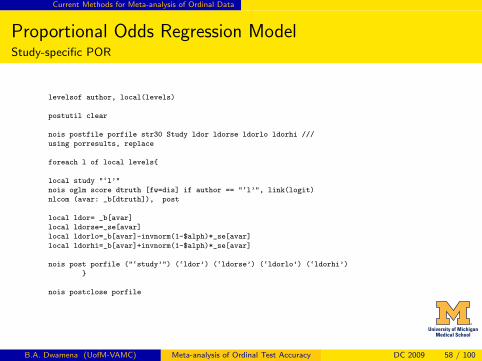
Current Methods for Meta-analysis of Ordinal Data
Proportional Odds Regression ModelStudy-specific POR
levelsof author, local(levels)
postutil clear
nois postfile porfile str30 Study ldor ldorse ldorlo ldorhi ///
using porresults, replace
foreach l of local levels{
local study "‘l’"
nois oglm score dtruth [fw=dis] if author == "‘l’", link(logit)
nlcom (avar: _b[dtruth]), post
local ldor= _b[avar]
local ldorse=_se[avar]
local ldorlo=_b[avar]-invnorm(1-$alph)*_se[avar]
local ldorhi=_b[avar]+invnorm(1-$alph)*_se[avar]
nois post porfile ("‘study’") (‘ldor’) (‘ldorse’) (‘ldorlo’) (‘ldorhi’)
}
nois postclose porfile
B.A. Dwamena (UofM-VAMC) Meta-analysis of Ordinal Test Accuracy DC 2009 58 / 100
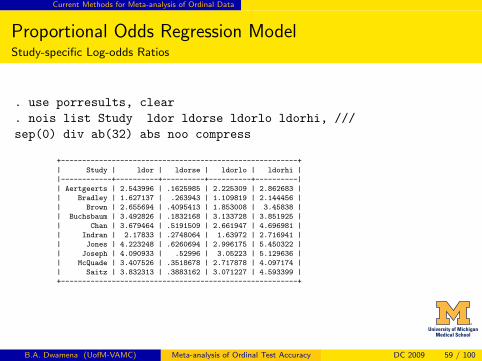
Current Methods for Meta-analysis of Ordinal Data
Proportional Odds Regression ModelStudy-specific Log-odds Ratios
. use porresults, clear
. nois list Study ldor ldorse ldorlo ldorhi, ///sep(0) div ab(32) abs noo compress
+--------------------------------------------------------+
| Study | ldor | ldorse | ldorlo | ldorhi |
|------------+----------+----------+----------+----------|
| Aertgeerts | 2.543996 | .1625985 | 2.225309 | 2.862683 |
| Bradley | 1.627137 | .263943 | 1.109819 | 2.144456 |
| Brown | 2.655694 | .4095413 | 1.853008 | 3.45838 |
| Buchsbaum | 3.492826 | .1832168 | 3.133728 | 3.851925 |
| Chan | 3.679464 | .5191509 | 2.661947 | 4.696981 |
| Indran | 2.17833 | .2748064 | 1.63972 | 2.716941 |
| Jones | 4.223248 | .6260694 | 2.996175 | 5.450322 |
| Joseph | 4.090933 | .52996 | 3.05223 | 5.129636 |
| McQuade | 3.407526 | .3518678 | 2.717878 | 4.097174 |
| Saitz | 3.832313 | .3883162 | 3.071227 | 4.593399 |
+--------------------------------------------------------+
B.A. Dwamena (UofM-VAMC) Meta-analysis of Ordinal Test Accuracy DC 2009 59 / 100
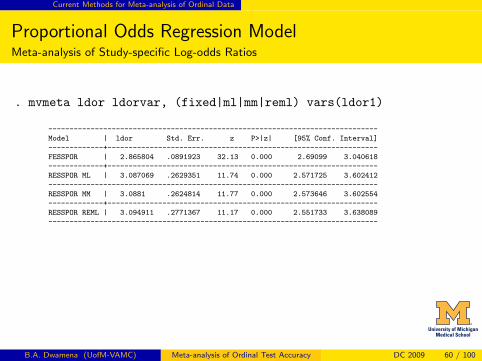
Current Methods for Meta-analysis of Ordinal Data
Proportional Odds Regression ModelMeta-analysis of Study-specific Log-odds Ratios
. mvmeta ldor ldorvar, (fixed|ml|mm|reml) vars(ldor1)
------------------------------------------------------------------------------
Model | ldor Std. Err. z P>|z| [95% Conf. Interval]
-------------+----------------------------------------------------------------
FESSPOR | 2.865804 .0891923 32.13 0.000 2.69099 3.040618
-------------+----------------------------------------------------------------
RESSPOR ML | 3.087069 .2629351 11.74 0.000 2.571725 3.602412
------------------------------------------------------------------------------
RESSPOR MM | 3.0881 .2624814 11.77 0.000 2.573646 3.602554
-------------+----------------------------------------------------------------
RESSPOR REML | 3.094911 .2771367 11.17 0.000 2.551733 3.638089
------------------------------------------------------------------------------
B.A. Dwamena (UofM-VAMC) Meta-analysis of Ordinal Test Accuracy DC 2009 60 / 100
Current Methods for Meta-analysis of Ordinal Data
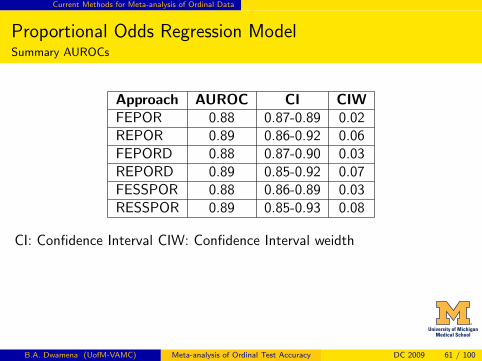
Proportional Odds Regression ModelSummary AUROCs
Approach AUROC CI CIWFEPOR 0.88 0.87-0.89 0.02REPOR 0.89 0.86-0.92 0.06FEPORD 0.88 0.87-0.90 0.03REPORD 0.89 0.85-0.92 0.07FESSPOR 0.88 0.86-0.89 0.03RESSPOR 0.89 0.85-0.93 0.08
CI: Confidence Interval CIW: Confidence Interval weidth
B.A. Dwamena (UofM-VAMC) Meta-analysis of Ordinal Test Accuracy DC 2009 61 / 100
Current Methods for Meta-analysis of Ordinal Data
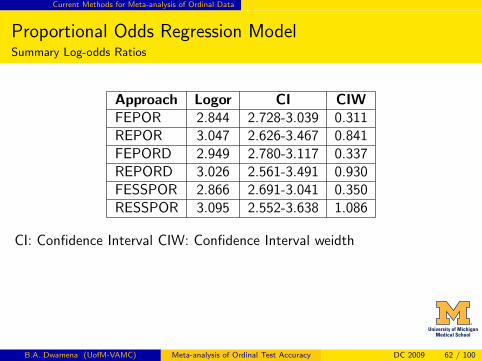
Proportional Odds Regression ModelSummary Log-odds Ratios
Approach Logor CI CIWFEPOR 2.844 2.728-3.039 0.311REPOR 3.047 2.626-3.467 0.841FEPORD 2.949 2.780-3.117 0.337REPORD 3.026 2.561-3.491 0.930FESSPOR 2.866 2.691-3.041 0.350RESSPOR 3.095 2.552-3.638 1.086
CI: Confidence Interval CIW: Confidence Interval weidth
B.A. Dwamena (UofM-VAMC) Meta-analysis of Ordinal Test Accuracy DC 2009 62 / 100
Current Methods for Meta-analysis of Ordinal Data
Logit-Threshold/Bivariate Meta-Regression Model
This consists of:
1 Study-specific Logit-Threshold Linear Regression(Moses-Shapiro-Littenberg)
2 Bivariate Mixed Modeling Of Study-Specific Intercepts And Slopes
3 Parametric Estimation Of Summary ROC And Indices Using MeanIntercept And Slope Estimates
B.A. Dwamena (UofM-VAMC) Meta-analysis of Ordinal Test Accuracy DC 2009 63 / 100
Current Methods for Meta-analysis of Ordinal Data
Logit-Threshold/Bivariate Meta-RegressionStudy-specific Logit-Threshold Linear Regression
For the jth threshold of the ith study,
Dij = αi + βiSij where:
Dij = logit(TPRij)− logit(FPRij)
Sij = logit(TPRij) + logit(FPRij)
TPR = True Positive Rate; FPR = False Positive Rate
αi = Study-specific Intercept
βi = Study-specific Slope
αi and βi estimated by maximum likelihood
B.A. Dwamena (UofM-VAMC) Meta-analysis of Ordinal Test Accuracy DC 2009 64 / 100

Current Methods for Meta-analysis of Ordinal Data
Logit-Threshold/Bivariate Meta-RegressionBivariate Meta-Regression: Within-study Variability
(αi
βi
)∼ N
((µαi
µβi
),ΣW
)ΣW =
(σ2
αi ρiσαiσβi
ρiσαiσβi σ2βi
)αi and βi Estimated intercept and slope estimates of the ith study
µαi and µβi True intercept and slope estimates of the ith study
ΣW Within-study correlation (ρi ) variances (σ2αi and σ2
βi ) andcovariance (ρiσαiσβi ) matrix
B.A. Dwamena (UofM-VAMC) Meta-analysis of Ordinal Test Accuracy DC 2009 65 / 100
Current Methods for Meta-analysis of Ordinal Data
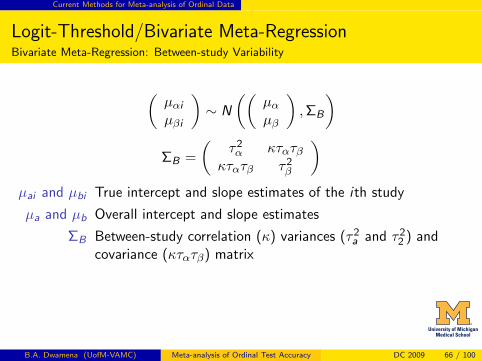
Logit-Threshold/Bivariate Meta-RegressionBivariate Meta-Regression: Between-study Variability
(µαi
µβi
)∼ N
((µα
µβ
),ΣB
)ΣB =
(τ2α κτατβ
κτατβ τ2β
)µai and µbi True intercept and slope estimates of the ith study
µa and µb Overall intercept and slope estimates
ΣB Between-study correlation (κ) variances (τ2a and τ2
2 ) andcovariance (κτατβ) matrix
B.A. Dwamena (UofM-VAMC) Meta-analysis of Ordinal Test Accuracy DC 2009 66 / 100
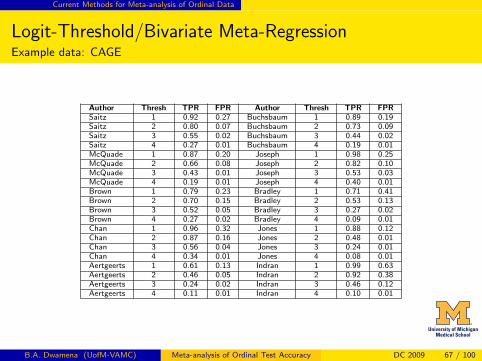
Current Methods for Meta-analysis of Ordinal Data
Logit-Threshold/Bivariate Meta-RegressionExample data: CAGE
Author Thresh TPR FPR Author Thresh TPR FPRSaitz 1 0.92 0.27 Buchsbaum 1 0.89 0.19Saitz 2 0.80 0.07 Buchsbaum 2 0.73 0.09Saitz 3 0.55 0.02 Buchsbaum 3 0.44 0.02Saitz 4 0.27 0.01 Buchsbaum 4 0.19 0.01McQuade 1 0.87 0.20 Joseph 1 0.98 0.25McQuade 2 0.66 0.08 Joseph 2 0.82 0.10McQuade 3 0.43 0.01 Joseph 3 0.53 0.03McQuade 4 0.19 0.01 Joseph 4 0.40 0.01Brown 1 0.79 0.23 Bradley 1 0.71 0.41Brown 2 0.70 0.15 Bradley 2 0.53 0.13Brown 3 0.52 0.05 Bradley 3 0.27 0.02Brown 4 0.27 0.02 Bradley 4 0.09 0.01Chan 1 0.96 0.32 Jones 1 0.88 0.12Chan 2 0.87 0.16 Jones 2 0.48 0.01Chan 3 0.56 0.04 Jones 3 0.24 0.01Chan 4 0.34 0.01 Jones 4 0.08 0.01Aertgeerts 1 0.61 0.13 Indran 1 0.99 0.63Aertgeerts 2 0.46 0.05 Indran 2 0.92 0.38Aertgeerts 3 0.24 0.02 Indran 3 0.46 0.12Aertgeerts 4 0.11 0.01 Indran 4 0.10 0.01
B.A. Dwamena (UofM-VAMC) Meta-analysis of Ordinal Test Accuracy DC 2009 67 / 100
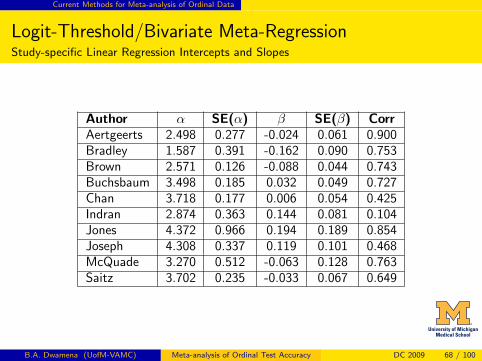
Current Methods for Meta-analysis of Ordinal Data
Logit-Threshold/Bivariate Meta-RegressionStudy-specific Linear Regression Intercepts and Slopes
Author α SE(α) β SE(β) CorrAertgeerts 2.498 0.277 -0.024 0.061 0.900Bradley 1.587 0.391 -0.162 0.090 0.753Brown 2.571 0.126 -0.088 0.044 0.743Buchsbaum 3.498 0.185 0.032 0.049 0.727Chan 3.718 0.177 0.006 0.054 0.425Indran 2.874 0.363 0.144 0.081 0.104Jones 4.372 0.966 0.194 0.189 0.854Joseph 4.308 0.337 0.119 0.101 0.468McQuade 3.270 0.512 -0.063 0.128 0.763Saitz 3.702 0.235 -0.033 0.067 0.649
B.A. Dwamena (UofM-VAMC) Meta-analysis of Ordinal Test Accuracy DC 2009 68 / 100
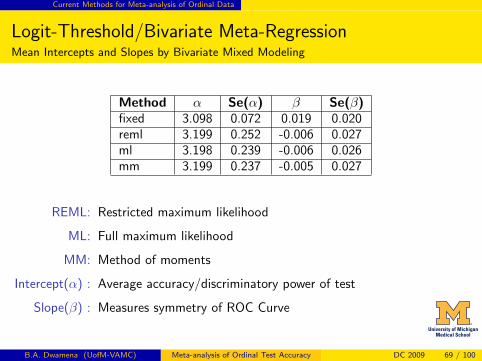
Current Methods for Meta-analysis of Ordinal Data
Logit-Threshold/Bivariate Meta-RegressionMean Intercepts and Slopes by Bivariate Mixed Modeling
Method α Se(α) β Se(β)fixed 3.098 0.072 0.019 0.020reml 3.199 0.252 -0.006 0.027ml 3.198 0.239 -0.006 0.026mm 3.199 0.237 -0.005 0.027
REML: Restricted maximum likelihood
ML: Full maximum likelihood
MM: Method of moments
Intercept(α) : Average accuracy/discriminatory power of test
Slope(β) : Measures symmetry of ROC Curve
B.A. Dwamena (UofM-VAMC) Meta-analysis of Ordinal Test Accuracy DC 2009 69 / 100
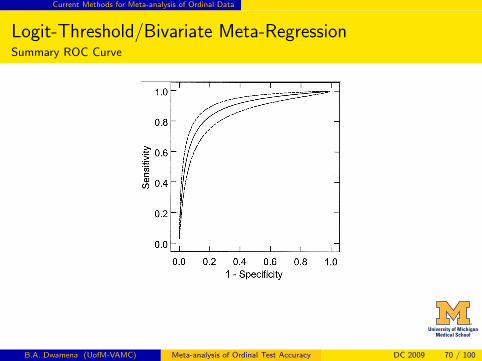
Current Methods for Meta-analysis of Ordinal Data
Logit-Threshold/Bivariate Meta-RegressionSummary ROC Curve
B.A. Dwamena (UofM-VAMC) Meta-analysis of Ordinal Test Accuracy DC 2009 70 / 100
Current Methods for Meta-analysis of Ordinal Data
Bayesian Hierarchical Ordinal Regression ModelConceptual Framework
1 Random-effects formulation of meta-analysis of studies with an unequalnumber of nonnested categories
2 Employs a hierarchical ordinal regression model, accounting forheterogeneity of studies within-study correlation
3 Assumes that each study estimates a study-specific ROC curve that can beviewed as a random sample from a population of all ROC curves of suchstudies
4 Accounts for different sources of variation in the data, through study-specificlocation and scale parameters
5 There are several ways to construct summary ROC curves and their crediblebands
B.A. Dwamena (UofM-VAMC) Meta-analysis of Ordinal Test Accuracy DC 2009 71 / 100
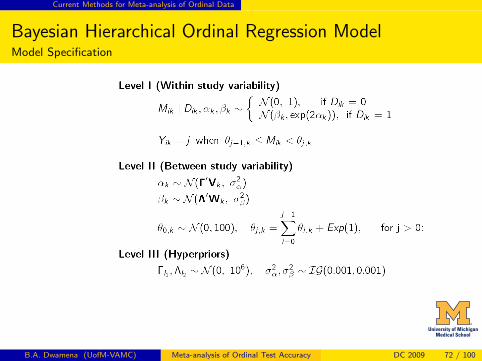
Current Methods for Meta-analysis of Ordinal Data
Bayesian Hierarchical Ordinal Regression ModelModel Specification
B.A. Dwamena (UofM-VAMC) Meta-analysis of Ordinal Test Accuracy DC 2009 72 / 100
Current Methods for Meta-analysis of Ordinal Data
Bayesian Hierarchical Ordinal Regression ModelSpecification
1 The model explicitly uses latent variables M that give rise to the data Y viaa discretization process depending on thresholds θ
2 Dik indicate the true disease status of the patient i in study k with Dik= 1 ifdisease is present and Dik= 0 if not
3 βk is the location parameter and αk the scale parameter for the ROC curveof study k.
4 Vk and Wk are study-level covariate vectors of dimensions v1 and v2 ,respectively
B.A. Dwamena (UofM-VAMC) Meta-analysis of Ordinal Test Accuracy DC 2009 73 / 100
Current Methods for Meta-analysis of Ordinal Data
Bayesian Hierarchical Ordinal Regression ModelParameter Estimation
1 Markov Chain Monte Carlo Simulation using Gibbs Sampling
2 Estimation via poster means and medians
3 Every simulated pair (βk , αk) defines an ROC curve
4 The sensitivity of the posterior estimates to choice of priors may beexamined using several different priors for the variances of study locationand scale parameters
B.A. Dwamena (UofM-VAMC) Meta-analysis of Ordinal Test Accuracy DC 2009 74 / 100
Current Methods for Meta-analysis of Ordinal Data
Bayesian Hierarchical Ordinal Regression ModelSummary ROCs, Functionals and Variability
1 Summary ROC Curves
1 Mean SROC
2 Pointwise SROC
3 Loess SROC
4 Mean Qstar and AUROC
2 Variability
1 Envelope Bands for ROC Curves
2 Pointwise Bands for ROC Curves
3 Credible intervals for TPR at fixed FPR
B.A. Dwamena (UofM-VAMC) Meta-analysis of Ordinal Test Accuracy DC 2009 75 / 100
Current Methods for Meta-analysis of Ordinal Data
Bayesian Hierarchical Ordinal Regression ModelMethodology and Application
See Dukic and Gatsonis (2003) for application to data from a recently publishedmeta-analysis evaluating accuracy of a single serum progesterone test fordiagnosing pregnancy failure.
1 They meta-analyzed 20 out of 27 eligible studies, published from 1980 to1996.
2 Among the selected studies, seven had 2 categories, four had 4, eight had 5,and one had 7.
3 Thirteen of the studies were prospective and 7 retrospective.
B.A. Dwamena (UofM-VAMC) Meta-analysis of Ordinal Test Accuracy DC 2009 76 / 100
Proposed Algorithm for Meta-analysis of Ordinal Data
Multi-stage SROC Modeling Algorithm
This consists of:
1 Estimation Of Study-Specific ROC Parameters From Observed 2 By JData By Heteroskedastic Ordinal Regression
2 Estimation Of Mean Location And Scale From Study-SpecificEstimates By Bivariate Linear Mixed Modeling
3 Estimation Of Summary ROC And Indices Using Mean Location AndScale Estimates
B.A. Dwamena (UofM-VAMC) Meta-analysis of Ordinal Test Accuracy DC 2009 77 / 100
Proposed Algorithm for Meta-analysis of Ordinal Data
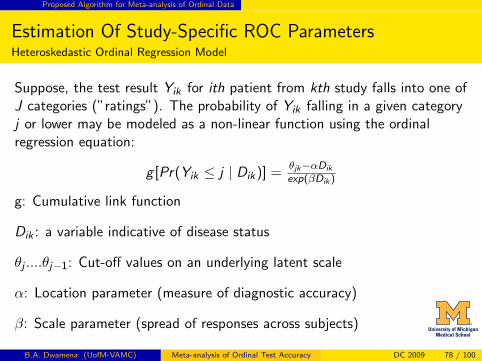
Estimation Of Study-Specific ROC ParametersHeteroskedastic Ordinal Regression Model
Suppose, the test result Yik for ith patient from kth study falls into one ofJ categories (”ratings”). The probability of Yik falling in a given categoryj or lower may be modeled as a non-linear function using the ordinalregression equation:
g [Pr(Yik ≤ j | Dik)] =θjk−αDik
exp(βDik )
g: Cumulative link function
Dik : a variable indicative of disease status
θj ....θj−1: Cut-off values on an underlying latent scale
α: Location parameter (measure of diagnostic accuracy)
β: Scale parameter (spread of responses across subjects)
B.A. Dwamena (UofM-VAMC) Meta-analysis of Ordinal Test Accuracy DC 2009 78 / 100
Proposed Algorithm for Meta-analysis of Ordinal Data
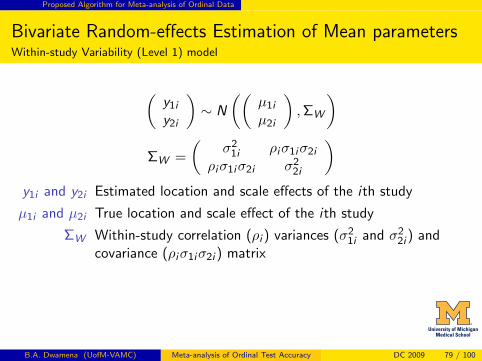
Bivariate Random-effects Estimation of Mean parametersWithin-study Variability (Level 1) model
(y1i
y2i
)∼ N
((µ1i
µ2i
),ΣW
)ΣW =
(σ2
1i ρiσ1iσ2i
ρiσ1iσ2i σ22i
)y1i and y2i Estimated location and scale effects of the ith study
µ1i and µ2i True location and scale effect of the ith study
ΣW Within-study correlation (ρi ) variances (σ21i and σ2
2i ) andcovariance (ρiσ1iσ2i ) matrix
B.A. Dwamena (UofM-VAMC) Meta-analysis of Ordinal Test Accuracy DC 2009 79 / 100
Proposed Algorithm for Meta-analysis of Ordinal Data
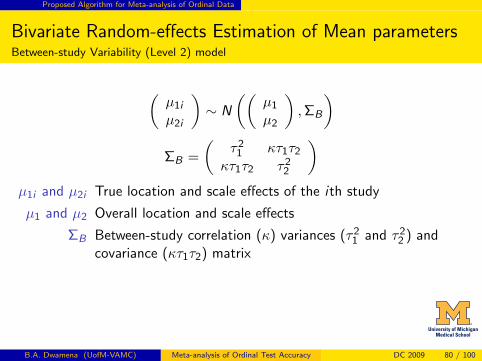
Bivariate Random-effects Estimation of Mean parametersBetween-study Variability (Level 2) model
(µ1i
µ2i
)∼ N
((µ1
µ2
),ΣB
)ΣB =
(τ2
1 κτ1τ2
κτ1τ2 τ22
)µ1i and µ2i True location and scale effects of the ith study
µ1 and µ2 Overall location and scale effects
ΣB Between-study correlation (κ) variances (τ21 and τ2
2 ) andcovariance (κτ1τ2) matrix
B.A. Dwamena (UofM-VAMC) Meta-analysis of Ordinal Test Accuracy DC 2009 80 / 100
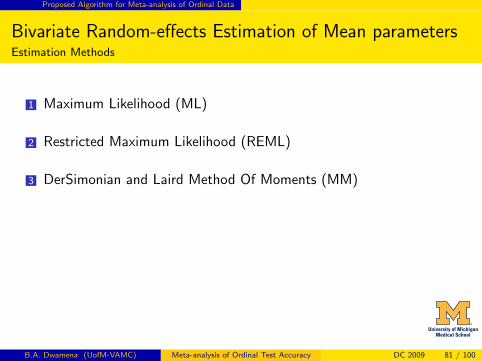
Proposed Algorithm for Meta-analysis of Ordinal Data
Bivariate Random-effects Estimation of Mean parametersEstimation Methods
1 Maximum Likelihood (ML)
2 Restricted Maximum Likelihood (REML)
3 DerSimonian and Laird Method Of Moments (MM)
B.A. Dwamena (UofM-VAMC) Meta-analysis of Ordinal Test Accuracy DC 2009 81 / 100
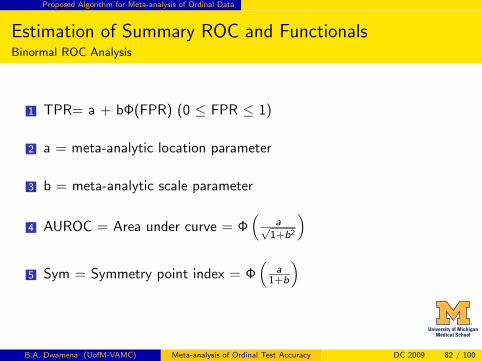
Proposed Algorithm for Meta-analysis of Ordinal Data
Estimation of Summary ROC and FunctionalsBinormal ROC Analysis
1 TPR= a + bΦ(FPR) (0 ≤ FPR ≤ 1)
2 a = meta-analytic location parameter
3 b = meta-analytic scale parameter
4 AUROC = Area under curve = Φ(
a√1+b2
)5 Sym = Symmetry point index = Φ
(a
1+b
)
B.A. Dwamena (UofM-VAMC) Meta-analysis of Ordinal Test Accuracy DC 2009 82 / 100
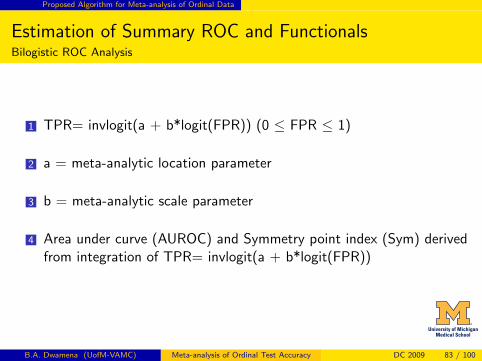
Proposed Algorithm for Meta-analysis of Ordinal Data
Estimation of Summary ROC and FunctionalsBilogistic ROC Analysis
1 TPR= invlogit(a + b*logit(FPR)) (0 ≤ FPR ≤ 1)
2 a = meta-analytic location parameter
3 b = meta-analytic scale parameter
4 Area under curve (AUROC) and Symmetry point index (Sym) derivedfrom integration of TPR= invlogit(a + b*logit(FPR))
B.A. Dwamena (UofM-VAMC) Meta-analysis of Ordinal Test Accuracy DC 2009 83 / 100
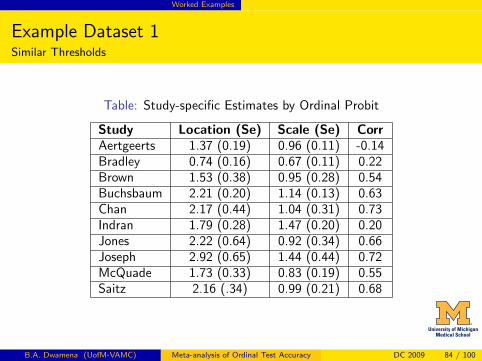
Worked Examples
Example Dataset 1Similar Thresholds
Table: Study-specific Estimates by Ordinal Probit
Study Location (Se) Scale (Se) CorrAertgeerts 1.37 (0.19) 0.96 (0.11) -0.14Bradley 0.74 (0.16) 0.67 (0.11) 0.22Brown 1.53 (0.38) 0.95 (0.28) 0.54Buchsbaum 2.21 (0.20) 1.14 (0.13) 0.63Chan 2.17 (0.44) 1.04 (0.31) 0.73Indran 1.79 (0.28) 1.47 (0.20) 0.20Jones 2.22 (0.64) 0.92 (0.34) 0.66Joseph 2.92 (0.65) 1.44 (0.44) 0.72McQuade 1.73 (0.33) 0.83 (0.19) 0.55Saitz 2.16 (.34) 0.99 (0.21) 0.68
B.A. Dwamena (UofM-VAMC) Meta-analysis of Ordinal Test Accuracy DC 2009 84 / 100
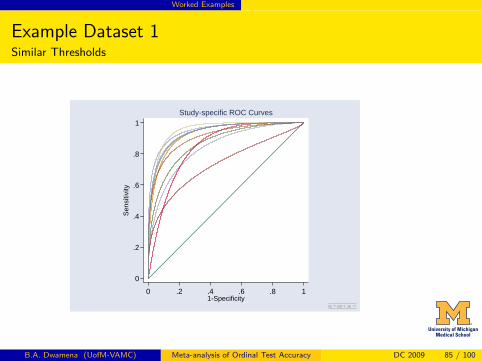
Worked Examples
Example Dataset 1Similar Thresholds
0
.2
.4
.6
.8
1S
ensi
tivity
0 .2 .4 .6 .8 11-Specificity
Study-specific ROC Curves
B.A. Dwamena (UofM-VAMC) Meta-analysis of Ordinal Test Accuracy DC 2009 85 / 100
Worked Examples
Example Dataset 1Similar Thresholds
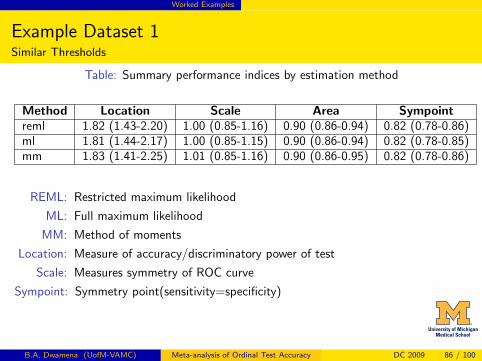
Table: Summary performance indices by estimation method
Method Location Scale Area Sympointreml 1.82 (1.43-2.20) 1.00 (0.85-1.16) 0.90 (0.86-0.94) 0.82 (0.78-0.86)ml 1.81 (1.44-2.17) 1.00 (0.85-1.15) 0.90 (0.86-0.94) 0.82 (0.78-0.85)mm 1.83 (1.41-2.25) 1.01 (0.85-1.16) 0.90 (0.86-0.95) 0.82 (0.78-0.86)
REML: Restricted maximum likelihood
ML: Full maximum likelihood
MM: Method of moments
Location: Measure of accuracy/discriminatory power of test
Scale: Measures symmetry of ROC curve
Sympoint: Symmetry point(sensitivity=specificity)
B.A. Dwamena (UofM-VAMC) Meta-analysis of Ordinal Test Accuracy DC 2009 86 / 100
Worked Examples
Example Dataset 1Similar Thresholds
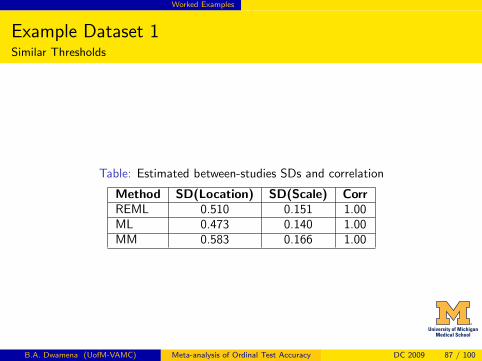
Table: Estimated between-studies SDs and correlation
Method SD(Location) SD(Scale) CorrREML 0.510 0.151 1.00ML 0.473 0.140 1.00MM 0.583 0.166 1.00
B.A. Dwamena (UofM-VAMC) Meta-analysis of Ordinal Test Accuracy DC 2009 87 / 100
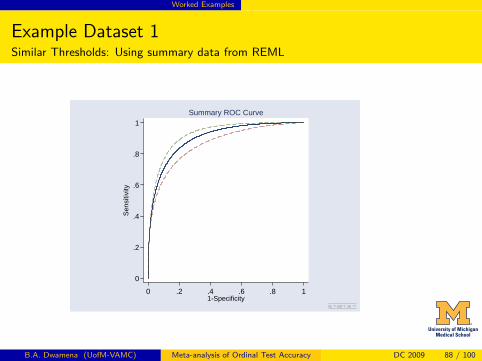
Worked Examples
Example Dataset 1Similar Thresholds: Using summary data from REML
0
.2
.4
.6
.8
1S
ensi
tivity
0 .2 .4 .6 .8 11-Specificity
Summary ROC Curve
B.A. Dwamena (UofM-VAMC) Meta-analysis of Ordinal Test Accuracy DC 2009 88 / 100
Worked Examples
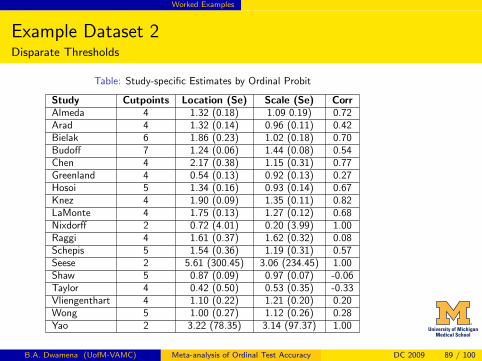
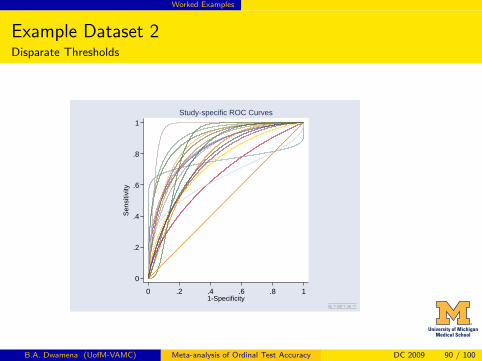
Example Dataset 2Disparate Thresholds
Table: Study-specific Estimates by Ordinal Probit
Study Cutpoints Location (Se) Scale (Se) CorrAlmeda 4 1.32 (0.18) 1.09 0.19) 0.72Arad 4 1.32 (0.14) 0.96 (0.11) 0.42Bielak 6 1.86 (0.23) 1.02 (0.18) 0.70Budoff 7 1.24 (0.06) 1.44 (0.08) 0.54Chen 4 2.17 (0.38) 1.15 (0.31) 0.77Greenland 4 0.54 (0.13) 0.92 (0.13) 0.27Hosoi 5 1.34 (0.16) 0.93 (0.14) 0.67Knez 4 1.90 (0.09) 1.35 (0.11) 0.82LaMonte 4 1.75 (0.13) 1.27 (0.12) 0.68Nixdorff 2 0.72 (4.01) 0.20 (3.99) 1.00Raggi 4 1.61 (0.37) 1.62 (0.32) 0.08Schepis 5 1.54 (0.36) 1.19 (0.31) 0.57Seese 2 5.61 (300.45) 3.06 (234.45) 1.00Shaw 5 0.87 (0.09) 0.97 (0.07) -0.06Taylor 4 0.42 (0.50) 0.53 (0.35) -0.33Vliengenthart 4 1.10 (0.22) 1.21 (0.20) 0.20Wong 5 1.00 (0.27) 1.12 (0.26) 0.28Yao 2 3.22 (78.35) 3.14 (97.37) 1.00
B.A. Dwamena (UofM-VAMC) Meta-analysis of Ordinal Test Accuracy DC 2009 89 / 100
Worked Examples
Example Dataset 2Disparate Thresholds
0
.2
.4
.6
.8
1S
ensi
tivity
0 .2 .4 .6 .8 11-Specificity
Study-specific ROC Curves
B.A. Dwamena (UofM-VAMC) Meta-analysis of Ordinal Test Accuracy DC 2009 90 / 100
Worked Examples
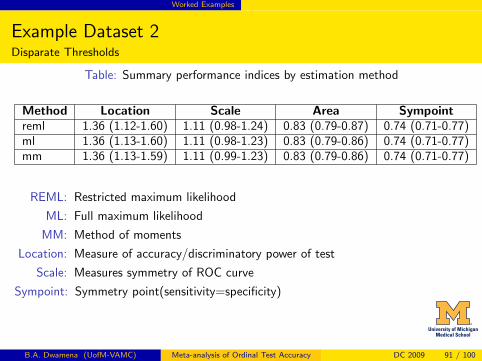
Example Dataset 2Disparate Thresholds
Table: Summary performance indices by estimation method
Method Location Scale Area Sympointreml 1.36 (1.12-1.60) 1.11 (0.98-1.24) 0.83 (0.79-0.87) 0.74 (0.71-0.77)ml 1.36 (1.13-1.60) 1.11 (0.98-1.23) 0.83 (0.79-0.86) 0.74 (0.71-0.77)mm 1.36 (1.13-1.59) 1.11 (0.99-1.23) 0.83 (0.79-0.86) 0.74 (0.71-0.77)
REML: Restricted maximum likelihood
ML: Full maximum likelihood
MM: Method of moments
Location: Measure of accuracy/discriminatory power of test
Scale: Measures symmetry of ROC curve
Sympoint: Symmetry point(sensitivity=specificity)
B.A. Dwamena (UofM-VAMC) Meta-analysis of Ordinal Test Accuracy DC 2009 91 / 100

Worked Examples
Example Dataset 2Disparate Thresholds
Table: Estimated between-studies SDs and correlation
Method SD(Location) SD(Scale) CorrREML 0.441 0.183 0.563ML 0.423 0.74 0.563MM 0.420 0.174 0.562
B.A. Dwamena (UofM-VAMC) Meta-analysis of Ordinal Test Accuracy DC 2009 92 / 100
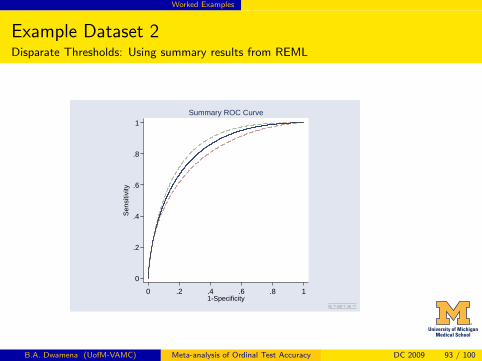
Worked Examples
Example Dataset 2Disparate Thresholds: Using summary results from REML
0
.2
.4
.6
.8
1S
ensi
tivity
0 .2 .4 .6 .8 11-Specificity
Summary ROC Curve
B.A. Dwamena (UofM-VAMC) Meta-analysis of Ordinal Test Accuracy DC 2009 93 / 100
Concluding Remarks
Conclusions
1 Dichotomization of ordinal data is simple with abundance ofmeta-analytical methods and software programs but inefficient withloss of information
2 The ”no thresholds left behind” proposed algorithm is very robust,flexible, informative and efficient
3 It is invariant to the number/set of thresholds, link function orestimation procedure
B.A. Dwamena (UofM-VAMC) Meta-analysis of Ordinal Test Accuracy DC 2009 94 / 100
Concluding Remarks
Conclusions
1 Easily extended for covariate meta-regression and covariate-adjustedSROC analysis
2 Easily implemented in Stata using Stata-native and User-writtencommands
3 midacat module for automated implementation will be availableshortly
4 Datasets, do-files and unpublished ado-files available from author onrequest
B.A. Dwamena (UofM-VAMC) Meta-analysis of Ordinal Test Accuracy DC 2009 95 / 100
References I
Aertgeerts B., Buntinx F., and Kester A.The value of the CAGE in screening for alcohol abuse and alcohol dependence in generalclinical populations: a diagnostic meta-analysis.J clin Epidemiol 2004;57:30-39
Arends L.R., Hamza T.H., Von Houwelingen J.C., Heijenbrok-Kal M.H., HuninkM.G.M. and Stijnen T.Bivariate Random Effects Meta-Analysis of ROC Curves.Med Decis Making 2008;28:621-628
Begg C.B. and Mazumdar M.Operating characteristics of a rank correlation test for publication bias.Biometrics 1994;50:1088-1101
Chu H. and Cole S.R.Bivariate meta-analysis of sensitivity and specificity with sparse data: a generalized linearmixed model approach.J Clin Epidemiol 2006;59:1331-1332
Dendukuri N., Chui K. and Brophy J.M.Validity of EBCT for coronary artery disease: a systematic review and meta-analysis.BMC Medicine 2007;5:35
References II
Dukic V. and Gatsonis C.Meta-analysis of diagnostic test accuracy studies with varying number of thresholds.Biometrics 2003;59:936-946
Dwamena, B.midas: Module for Meta-Analytical Integration of Diagnostic Accuracy StudiesBoston College Department of Economics, Statistical Software Components 2007;s456880: http://ideas.repec.org/c/boc/bocode/s456880.html.
Ewing J.A.Detecting Alcoholism: The CAGE questionnaire.JAMA 1984;252:1905-1907
Harbord R.M., Deeks J.J., Egger M., Whitting P. and Sterne J.A.Unification of models for meta-analysis of diagnostic accuracy studies.Biostatistics 2007;8:239-251
Harbord R.M., Whitting P., Sterne J.A.C., Egger M., Deeks J.J., Shang A. andBachmann L.M.An empirical comparison of methods for meta-analysis of diagnostic accuracy showedhierarchical models are necessaryJournal of Clinical Epidemiology 2008;61;1095-1103
References III
Harbord R.M., and Whitting P.metandi: Meta-analysis of diagnostic accuracy using hierarchical logistic regressionStata Journal 2009;2:211-229
Irwig L., Macaskill P., Glasziou P. and Fahey M.Meta-analytic methods for diagnostic test accuracy.J Clin Epidemiol 1995;48:119-30
Kester A.D.M., and Buntinx F.Meta-Analysis of ROC Curves.Med Decis Making 2000;20:430-439
Littenberg B. and Moses L. E.Estimating diagnostic accuracy from multiple conflicting reports: a new meta-analyticmethod.Med Decis Making 1993;13:313-321
Macaskill P.Empirical Bayes estimates generated in a hierarchical summary ROC analysis agreedclosely with those of a full Bayesian analysis.J Clin Epidemiol 2004;57:925-932
References IV
Moses L.E., Shapiro D. and Littenberg B.Combining independent studies of a diagnostic test into a summary ROC curve:data-analyticapproaches and some additional considerations.Stat Med 1993;12:1293-13116
Pepe M.S.Receiver Operating Characteristic Methodology.Journal of the American Statistical Association 2000;95:308-311
Pepe M.S.The Statistical Evaluation of Medical Tests for Classification and Prediction.2003; Oxford: Oxford University Press
Reitsma J.B., Glas A.S., Rutjes A.W.S., Scholten R.J.P.M., Bossuyt P.M. andZwinderman A.H.Bivariate analysis of sensitivity and specificity produces informative summary measures indiagnostic reviews.J Clin Epidemiol 2005;58:982-990
Rutter C.M., and Gatsonis C.A.A hierarchical regression approach to meta-analysis of diagnostic test accuracy evaluationsStat Med 2001;20:2865-2884
References V
Toledano A. and Gatsonis C.A.Regression analysis of correlated receiver operating characteristic data.Academic Radiology 1995;2:S30-S36
Tosteson A.A. and Begg C.B.A general regression methodology for ROC curve estimation.Medical Decision Making 1988;8:204-215
Williams R.Using Heterogeneous Choice Models To Compare Logit and Probit Coefficients AcrossGroupsSociological Methods and Research 2009;37: 531-559
White I.R.Multivariate Random-effects Meta-analysis.Stata Journal 2009;1:40-56