Embed Size (px)
Citation preview
Loyola University Chicago Loyola University Chicago
Loyola eCommons Loyola eCommons
Dissertations Theses and Dissertations
2011
Meta-Analysis of the Relationship Between Collective Teacher Meta-Analysis of the Relationship Between Collective Teacher
Efficacy and Student Achievement Efficacy and Student Achievement
Rachel Jean Eells Loyola University Chicago
Follow this and additional works at: https://ecommons.luc.edu/luc_diss
Part of the Educational Psychology Commons
Recommended Citation Recommended Citation Eells, Rachel Jean, "Meta-Analysis of the Relationship Between Collective Teacher Efficacy and Student Achievement" (2011). Dissertations. 133. https://ecommons.luc.edu/luc_diss/133
This Dissertation is brought to you for free and open access by the Theses and Dissertations at Loyola eCommons. It has been accepted for inclusion in Dissertations by an authorized administrator of Loyola eCommons. For more information, please contact [email protected].
This work is licensed under a Creative Commons Attribution-Noncommercial-No Derivative Works 3.0 License. Copyright © 2011 Rachel Jean Eells
LOYOLA UNIVERSITY CHICAGO
META-ANALYSIS OF THE RELATIONSHIP BETWEEN
COLLECTIVE TEACHER EFFICACY AND STUDENT ACHIEVEMENT
A DISSERTATION SUBMITTED TO
THE FACULTY OF THE GRADUATE SCHOOL
IN CANDIDACY FOR THE DEGREE OF
DOCTOR OF PHILOSPHY
PROGRAM IN EDUCATIONAL PSYCHOLOGY
BY
RACHEL J. EELLS
CHICAGO, IL
AUGUST 2011

Copyright by Rachel J. Eells, 2011 All rights reserved.
iii
ACKNOWLEDGMENTS
This dissertation is about efficacy, and through the process of writing, my
own efficacy for scholarly work has been built. I am grateful for all of those people
who helped me get to this point, providing support, modeling, assistance, and access
to experiences.
In addition to providing expertise, guidance, and timely feedback, Dr. Terri
Pigott, my dissertation advisor, consistently displayed unwavering confidence that I
would succeed, completing this work according to plan. Because of her combination
of high expectations and scaffolding, I was able to approach the tasks at hand feeling
quite capable of the challenge. I am so grateful to Terri for ushering me into the
world of meta-analysis and for encouraging and enabling my progress.
I also wish to thank the other two members of my committee for their
assistance. Dr. Meng-Jia Wu introduced me to meta-analysis, and I’d like to thank
her for being such an excellent professor. It is because of the classes with Meng-Jia
that I began to think like a statistician, and when it came time to formulate the
preliminary version of this study, her suggestions and assistance were invaluable.
Dr. David Ensminger provided the perspective that I needed to consider my content
in new ways. I am grateful for the ways in which he helped me to strengthen my
argument.
iv
I am so thankful that I was able to complete my Educational Psychology
program at Loyola University Chicago, even as the program ceased to be. Many
thanks go to Dr. Lynne Golomb and Dr. Pamela Fenning for making sure that I did
not get lost in the shuffle.
For supporting my doctoral studies, I wish to thank the administration,
faculty, students, and staff of Concordia University Chicago. Concordia welcomed
me, supporting me academically, spiritually, and financially during this process, and
encouraging me to finish. I am grateful to be a faculty member at Concordia, and
looking forward to the work we will do together. Special thanks to John Farrand
and Sarah Nordman, the graduate students who assisted me with coding.
I have been blessed with teachers that have taught me so much more than
curriculum. Ms. Lucy Lettera showed me what it means to be a reflective educator.
Dr. Judy Preuss very directly encouraged my return to academia. These two women
represent the array of excellent role models I’ve had as I developed into the person I
am today. They taught me to value education.
My friends have been a constant and reliable source of encouragement and
support. I am thankful for Xan Endrinal, who was my head cheerleader, regaling me
with restorative praise. I also wish to thank Nora O’Brien for reminding me to ask
for help and for being an extra pair of hands. These ladies seemed to anticipate what
I needed, either rallying the troops, or just helping me to rally.
My family has made this journey a reality. Vickie Eells, my mother-in-law, has
been so helpful to me in this process, as she was able to coordinate our visits with
v
my deadlines, so that I could hide away and write. For helping me define who I am,
and teaching me about perspective, I’m grateful to my brother, Joshua. My father,
Rev. Martin Doering, always encouraged me to ask hard questions and seek out
complex answers, while approaching life with faith and creativity. I am grateful that
he taught me about courage and conviction. Dr. Sandra Doering, my mother,
provided the “stepfoots” in which I could follow. Watching her enter academia gave
me confidence in my ability to do the same. I’ve achieved this because she showed
me that it can be done, and I’m so grateful to have been mentored by such an
amazing woman.
And to my husband, Brandon, and my daughter, Lucy, I offer deepest
gratitude, and warmest affection. Their daily lives were the most impacted during
this process, as schedules were shifted, home office space was rearranged, finances
were stretched, and focus was diverted. When asked why something needed to
happen, Lucy once explained, “Because do it.” That simple, fragmented directive
kept me working many times. Lucy was born during my doctoral studies, and I have
valued watching her grow and learn as I explore the learning process. She teaches
me so much every day, and I hope that I can impart valuable lessons about life, love,
and learning to her, in return. Brandon has always been my hero because he is my
balance. He keeps me upright when I’m about to stumble, or picks me up when I do.
He reminds me to relax and enjoy the little moments of respite whenever they come.
His love is steady and strong, even when it seems that my brain and emotions have

vi
been hijacked. As Lucy might put it: Cheers to my little family, who sits in chairs in
my heart forever.
vii
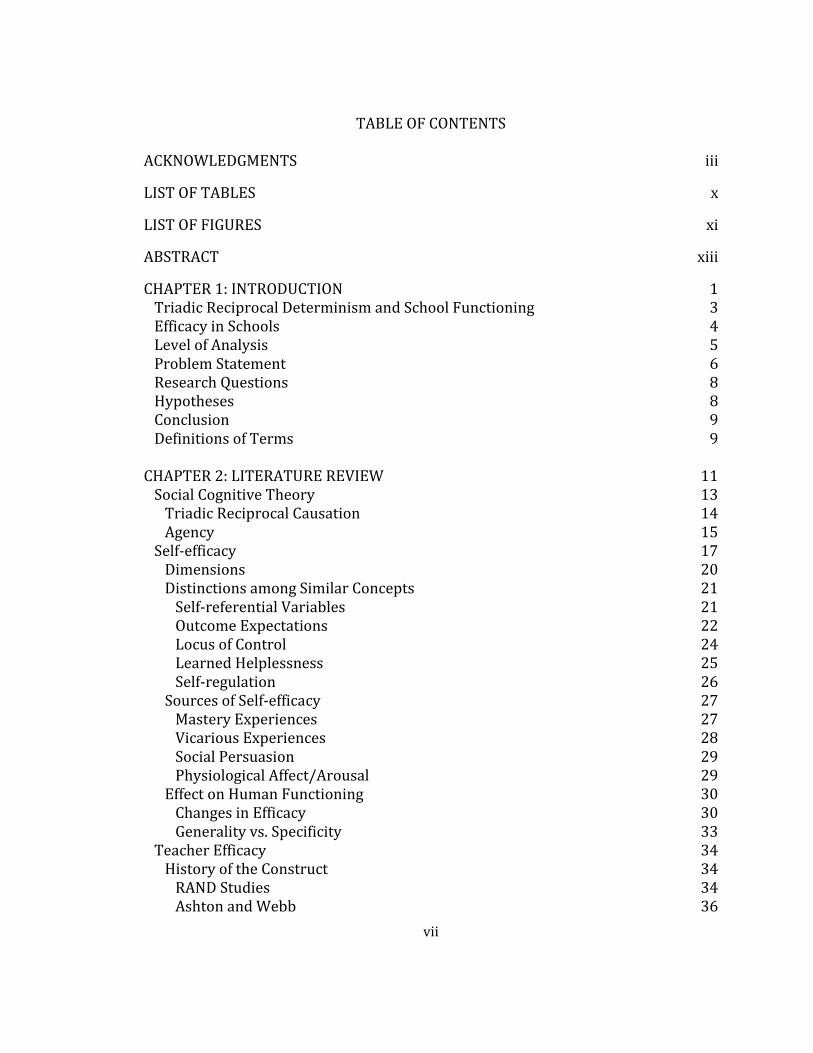
TABLE OF CONTENTS
ACKNOWLEDGMENTS iii
LIST OF TABLES x
LIST OF FIGURES xi
ABSTRACT xiii
CHAPTER 1: INTRODUCTION 1 Triadic Reciprocal Determinism and School Functioning 3 7 Efficacy in Schools 4 8 Level of Analysis 5 9 Problem Statement 6 10 Research Questions 8 11 Hypotheses 8 11 Conclusion 9 11 Definitions of Terms 9 12 CHAPTER 2: LITERATURE REVIEW 11 13 Social Cognitive Theory 13 13 Triadic Reciprocal Causation 14 13 Agency 15 14 Self-efficacy 17 17 Dimensions 20 18 Distinctions among Similar Concepts 21 Self-referential Variables 21 Outcome Expectations 22 Locus of Control 24 Learned Helplessness 25 Self-regulation 26 Sources of Self-efficacy 27 Mastery Experiences 27 Vicarious Experiences 28 Social Persuasion 29 Physiological Affect/Arousal 29 Effect on Human Functioning 30 Changes in Efficacy 30 Generality vs. Specificity 33 Teacher Efficacy 34 History of the Construct 34 RAND Studies 34 Ashton and Webb 36
viii
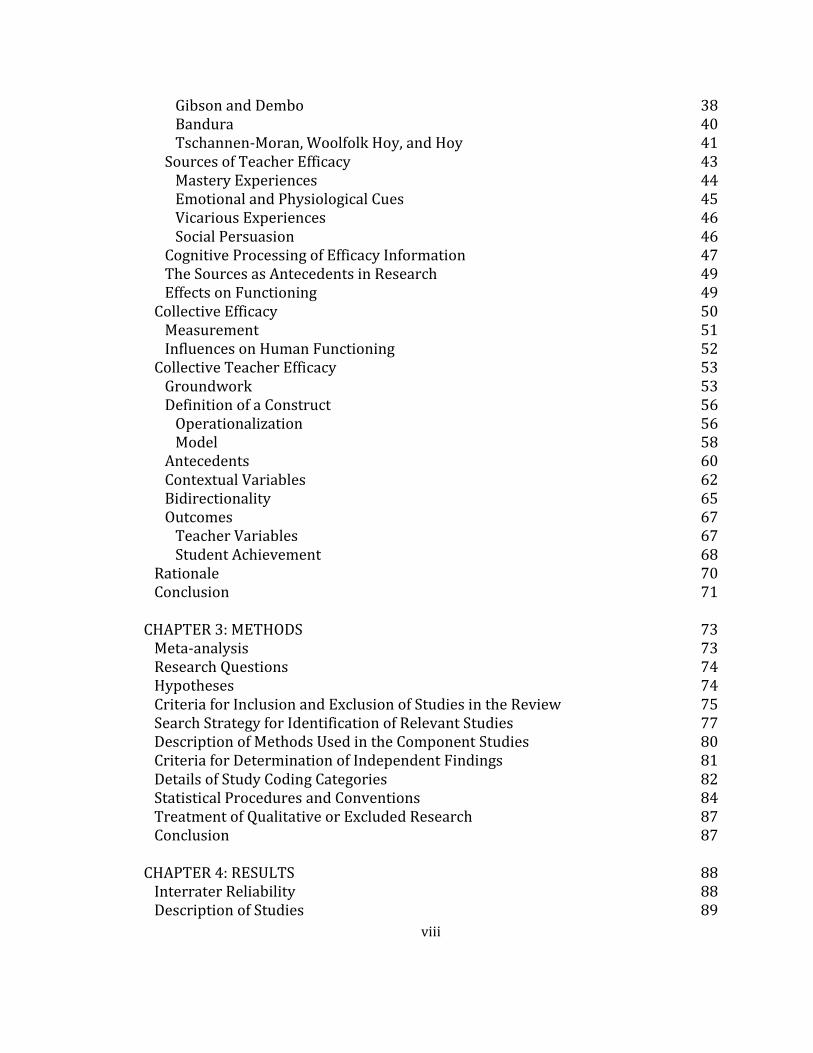
Gibson and Dembo 38 Bandura 40 Tschannen-Moran, Woolfolk Hoy, and Hoy 41 Sources of Teacher Efficacy 43 Mastery Experiences 44 Emotional and Physiological Cues 45 Vicarious Experiences 46 Social Persuasion 46 Cognitive Processing of Efficacy Information 47 The Sources as Antecedents in Research 49 Effects on Functioning 49 Collective Efficacy 50 Measurement 51 Influences on Human Functioning 52 39 Collective Teacher Efficacy 53 Groundwork 53 Definition of a Construct 56 Operationalization 56 Model 58 Antecedents 60 Contextual Variables 62 Bidirectionality 65 Outcomes 67 Teacher Variables 67 Student Achievement 68 Rationale 70 Conclusion 71 54 CHAPTER 3: METHODS 73 55 Meta-analysis 73 Research Questions 74 Hypotheses 74 Criteria for Inclusion and Exclusion of Studies in the Review 75 Search Strategy for Identification of Relevant Studies 77 Description of Methods Used in the Component Studies 80 Criteria for Determination of Independent Findings 81 Details of Study Coding Categories 82 Statistical Procedures and Conventions 84 Treatment of Qualitative or Excluded Research 87 Conclusion 87 CHAPTER 4: RESULTS 88 Interrater Reliability 88 Description of Studies 89
ix
Meta-analyses One and Two: r-mean 99 Meta-Analyses Three Through Thirteen 101 Moderator Analysis 104 Cross-tabulation of Moderators 105 Moderator: University Affiliation 107 Moderator: CTE Measure 108 Conclusion 109 CHAPTER 5: DISCUSSION 110 Summary of Findings 110 Effect Sizes 110 Moderator Analysis 116 Relevance 118 Limitations 122 Implications for Future Research 124 Conclusion 128
APPENDIX A: INITIAL SCREENING SPREADSHEET 130
APPENDIX B: SPREADSHEET: CODING DOCUMENT/MANUAL 146
APPENDIX C: MODERATOR ANALYSIS OF R-MEAN (OUTLIER REMOVED) 152
APPENDIX D: INSTRUMENTS TO MEASURE COLLECTIVE TEACHER EFFICACY:
CE-SCALE (SHORT) AND CTBS 154
REFERENCE LIST 157
VITA 170
x
LIST OF TABLES
1. Characteristics of component studies. 90 2. Sample sizes and effect sizes (reported and calculated) for each study in the meta-analysis. 96 3. Homogeneity statistics and random effects weighted average effect sizes for all meta-analyses. 103 4. Cross-tabulation of moderators: University affiliation and state. 105 5. Cross-tabulation of moderators: University affiliation and CTE measure 106 6. Measures of diversity for the large-sample studies that measured CTE before achievement. 114
xi
LIST OF FIGURES
1. Triadic reciprocal determinism, as it applies to school functioning. Adapted
from Bandura (1986). 4
2. Heritage of the collective teacher efficacy construct. 12 3. Triadic Reciprocal Determinism, with further description of the cognitive component of the personal factors. Adapted from Bandura (1986). 18 4. Teachers’ Sense of Efficacy: The Multidimensional Construct (Ashton & Webb, 1996, p. 5). 37 29 5. “The cyclical nature of teacher efficacy” (Tschannen-Moran, Woolfolk Hoy, & Hoy, 1998, p. 228). 42 6. Bandura’s 1993 “path analysis showing the role of perceived collective
efficacy in the causal structure of school-level achievement in reading and
mathematics” (p. 143). 55 32 42
7. “Proposed model of the formation, influence, and change of perceived collective efficacy in schools” (Goddard, Hoy, et al., 2004, p. 11). 59 45 8. “Hypothesized model of perceived collective teacher efficacy” (Adams & Forsythe, 2006, p. 639). 63 9. Database search process, arranged chronologically 78
10. Selection process for study inclusion in preliminary meta-analysis. 79 11. Funnel plot of precision by Fisher’s Z. 98 12. Funnel Plot of Precision by Fisher’s Z, with imputed values added after
Duvall and Tweedie’s trim and fill. Open shapes are the observed random-
effects effect sizes, closed shaped are imputed effect sizes. 98
13. Forest Plot of r-mean effect sizes (N=26), including random effects weighted average effect size. 100
xii
14. Effect sizes for all meta-analyses conducted, with 95% confidence intervals. 102 15. Forest plot of r-mean effect sizes, grouped by moderator: University affiliation. 107 16. Forest plot of r-mean effect sizes, grouped by moderator: CTE measure. 108
xiii
ABSTRACT
Collective teacher efficacy is an emergent school level variable reflecting a
faculty’s collective belief in its ability to positively affect students. It has been linked
in the literature to school achievement. This meta-analysis systematically
synthesized results from 26 component studies, including dissertations and
published articles, which reported at least one correlation between collective
teacher efficacy and school achievement.
The research questions addressed the distribution of effect sizes for the
relationship and the moderator variables that could explain any variance found
among the studies. It was hypothesized that collective teacher efficacy would be
strongly associated with subsequent student achievement, and that certain
moderator variables would be able to explain differences among studies.
The various meta-analyses conducted yielded weighted average effect sizes
ranging from 0.537 to 0.628. Collective teacher efficacy was found to be strongly
and positively correlated with student achievement. This held true for all subject
areas measured, and regardless of timing of measurement. Moderator analysis
revealed that both university affiliation and instrument used to measure collective
efficacy were able to explain the variance found among studies.

xiv
This research has implications for schools, teacher education programs, and
education policy. Using social-cognitive theory as a framework, this study highlights
the importance of teachers’ beliefs about their collective ability. Having a faculty
that believes that it can accomplish great things is vital for the health of a school.
Because of the dynamic nature of school functioning, wherein school achievement
acts as both antecedent and consequence of collective teacher efficacy, interventions
designed to improve the efficacy beliefs of teachers and a faculty as a whole can be a
starting point for positive change within the school system.
1
CHAPTER 1
INTRODUCTION
This chapter first describes school functioning from a social cognitive
perspective, so that the topic of collective teacher efficacy and its connection to
student achievement can be introduced in context. It then states the problem that
prompted this study and explains how the current literature has not yet addressed
this problem. The final section of this chapter details how this study fills that gap in
the research, and is followed by a section that provides defintions of key terms.
Imagine two different schools. One has a faculty that feels that, as a group,
they are able to accomplish great things for their students: They have the resources
available, they have experienced success in the past, they feel valued and supported
by their adminstration, and they hold high expectations for the success of their
students. Having been recognized as an excellent school by governing bodies, they
continued to be well-funded. The other school has had their funding cut because of
consistently low performance on standardized testing, they lack necessary
resources, they feel no connection to decisions-makers, they experience high rates
of teacher burnout and turnover, and they feel unsupported by the school families.
These teachers may hold lower expectations of student success, and they might not
feel that they can make a difference because the odds are stacked against them. The

2
first school may continue to promote high achievement and successful outcomes,
while the faculty of the second school may find itself trapped, knowing that things
need to improve, but feeling that they cannot do much to make those improvements.
Many schools will fall somewhere in between these two extremes, working to
determine what they can and cannot control, and estimating their potential for
success.
Since the federal government, under George W. Bush, enacted the No Child
Left Behind Act of 2001, there has been increased emphasis on school accountability
and student achievement. Formalized methods have been developed to provide
feedback to schools about their relative success or failure. Under Barack Obama, the
administration is continuing this emphasis on teacher accountability, in the hopes
that schools in the United States will be filled with good teachers who are capable of
producing positive outcomes for students. Of education, WhiteHouse.gov states,
“Teachers are the single most important resource to a child’s learning. President
Obama will ensure that teachers are supported as professionals in the classroom,
while also holding them more accountable. He will invest in innovative strategies to
help teachers to improve student outcomes, and use rewards and incentives to keep
talented teachers in the schools that need them the most” (whitehouse.gov, n.d,
Reform and Invest in K-12 Education section, para. 2).
As the United States seeks to define what is essential to the health and
success of our schools, a host of variables must be examined: student level variables,
3
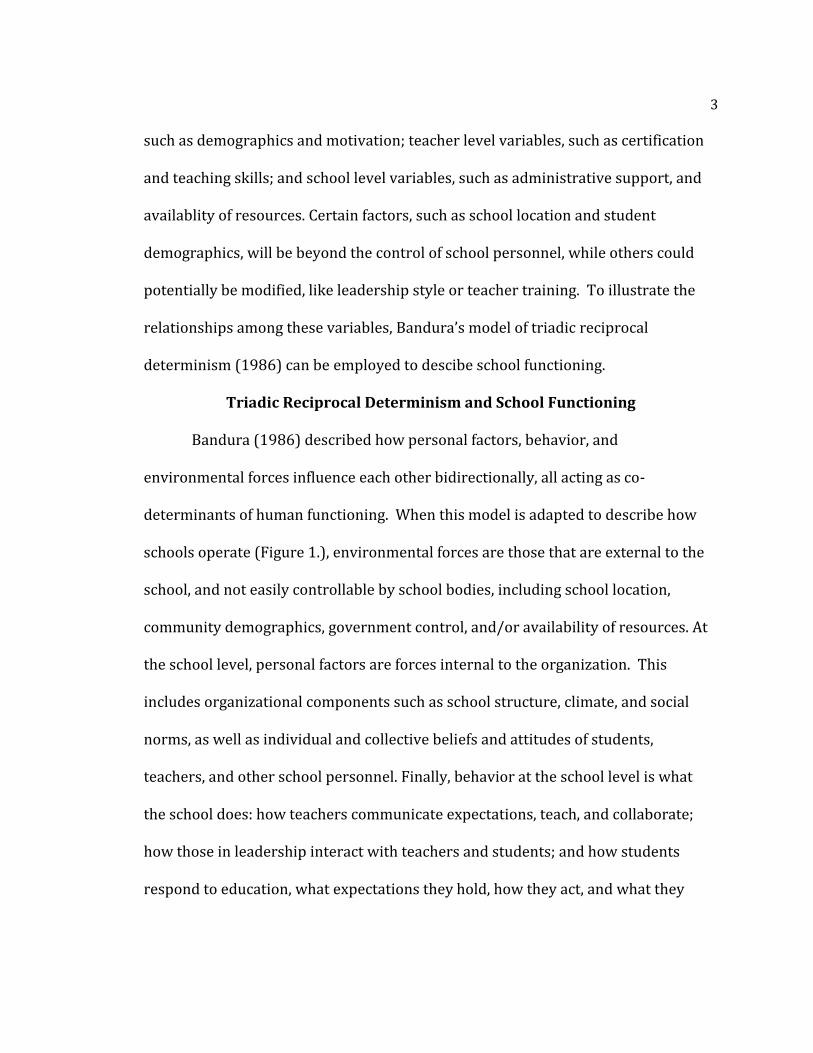
such as demographics and motivation; teacher level variables, such as certification
and teaching skills; and school level variables, such as administrative support, and
availablity of resources. Certain factors, such as school location and student
demographics, will be beyond the control of school personnel, while others could
potentially be modified, like leadership style or teacher training. To illustrate the
relationships among these variables, Bandura’s model of triadic reciprocal
determinism (1986) can be employed to descibe school functioning.
Triadic Reciprocal Determinism and School Functioning
Bandura (1986) described how personal factors, behavior, and
environmental forces influence each other bidirectionally, all acting as co-
determinants of human functioning. When this model is adapted to describe how
schools operate (Figure 1.), environmental forces are those that are external to the
school, and not easily controllable by school bodies, including school location,
community demographics, government control, and/or availability of resources. At
the school level, personal factors are forces internal to the organization. This
includes organizational components such as school structure, climate, and social
norms, as well as individual and collective beliefs and attitudes of students,
teachers, and other school personnel. Finally, behavior at the school level is what
the school does: how teachers communicate expectations, teach, and collaborate;
how those in leadership interact with teachers and students; and how students
respond to education, what expectations they hold, how they act, and what they
4
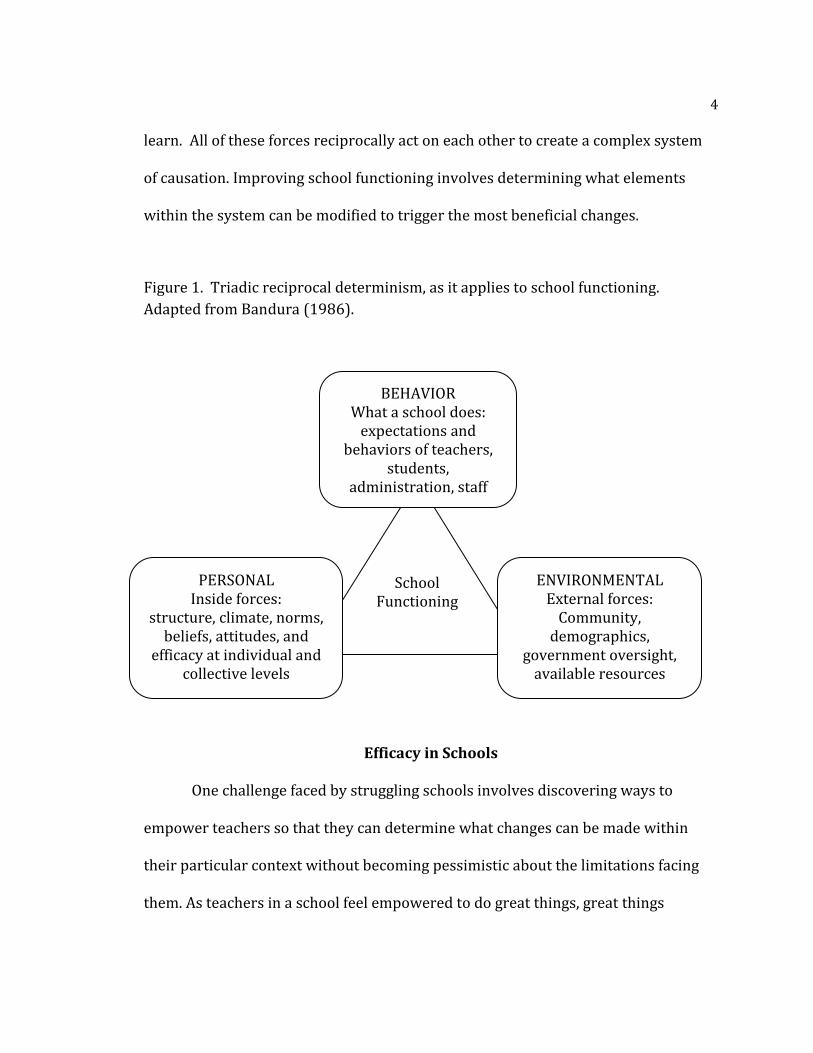
learn. All of these forces reciprocally act on each other to create a complex system
of causation. Improving school functioning involves determining what elements
within the system can be modified to trigger the most beneficial changes.
Figure 1. Triadic reciprocal determinism, as it applies to school functioning.
Adapted from Bandura (1986).
Efficacy in Schools
One challenge faced by struggling schools involves discovering ways to
empower teachers so that they can determine what changes can be made within
their particular context without becoming pessimistic about the limitations facing
them. As teachers in a school feel empowered to do great things, great things
School Functioning
BEHAVIOR What a school does:
expectations and behaviors of teachers,
students, administration, staff
PERSONAL Inside forces:
structure, climate, norms, beliefs, attitudes, and
efficacy at individual and collective levels
ENVIRONMENTAL External forces:
Community, demographics,
government oversight, available resources
5
happen. If they feel powerless, and believe they cannot surmount the obstacles in
front of them, they will be less likely to persist when challenged, and will not expend
as much effort (Bandura, 1977, 1997, 1998, 2000; Tschannen-Moran, Woolfolk Hoy,
& Hoy, 1998).
The efficacy beliefs of teachers can be categorized two ways. Individual
teacher efficacy is a belief about one’s own ability to promote positive change for
students (Tschannen-Moran et al., 1998), while collective teacher efficacy is a group
variable that reflects beliefs of a particular group of teachers about their collective
ability to promote successful student outcomes within their school (Goddard, Hoy,
& Woolfolk Hoy, 2000). Efficacy involves more than positive thinking or optimism. It
is tied to the construct of agency (the ability to make things happen) and to action
(Bandura, 1982, 1998, 2001). Efficacy develops as a person, or a group, experiences
success, success is modeled, and/or encouragment and feedback are provided
(Bandura, 1977, 1997). Highly efficacious teams or individuals will feel optimistic
about success because they feel that they have the abilties needed to create that
success. This engenders positive thinking, as limitations are seen as challenges
rather than roadblocks, and the power of uncontrollable circumstances is weighed
against that which can be controlled (Bandura, 2001).
Level of Analysis
This research examines the connection between collective teacher efficacy
and student achievement. Because school functioning is complex and reciprocal, it is
6
not assumed that a direct and exclusive path can be drawn between the two
variables. Instead, organizational variables such as school climate, school norms,
and collective teacher efficacy set the stage for teacher functioning (efficacy beliefs,
attitudes, expectations, and the resulting behavior) at the individual level. Those
teacher variables affect individual student efficacy, attitudes, expectations, behavior,
and ultimately learning, which then is measured as a part of the school’s
achievement. “The sense of collective efficacy in a school can affect teachers’ self-
referent thoughts and, hence, their teaching performance and student learning”
(Goddard, Hoy, & Woolfolk Hoy, 2004, p. 8).
In organizations such as schools, the individual executes the work of the
collective, so collective teacher efficacy results in diffential teacher behavior, just as
school wide achievement is calculated by measuring the learning of individual
students. This moving from group to individual level and back again presents a
statistical challenge for researchers, as it becomes difficult to measure relationships
across levels. For that reason, most current studies addressing the relationship
between teacher efficacy and student achievement do so at the group level,
measuring collective teacher efficacy and school achievement.
Problem Statement
Research on the connection between collective teacher efficacy (CTE) and
student achievement began with Bandura’s (1993) article linking CTE, achievement
and socio-economic status (SES), and continued, with a bulk of published research
7
coming out of Ohio State University in the last twelve years. Much of the research is
moving on and considering new constructs, taking the CTE-achievement link as a
given. While the construct of collective teacher efficacy has been explored in the
literature during the last two decades, knowledge about the relationship may be
limited because the number of published studies is relatively small, and many have
used samples from the same geographic area. Additionally, comparison of results is
not always straightforward for three reasons: some early studies employed multi-
level analysis instead of the more frequently used group level analysis; a variety of
statistical analyses have been used; and collective teacher efficacy has been
measured in multiple ways.
Systematically synthesizing results from numerous studies, meta-analysis
has been used to examine social-cognitive career theory (Brown et al., 2008; Sheu et
al., 2010), self-efficacy and work-related performance (Stajkovic & Luthans, 1998),
self-efficacy and academic outcomes (Multon, Brown, & Lent, 1991), teacher
efficacy (Shahid & Thompson, 2001) and the measurement of teacher efficacy
(Henson, Kogan, & Vacha-Haase, 2001). Gully, Incalcaterra, Joshi, & Beaubien
(2002) used meta-analysis to examine the relationship between collective efficacy in
the workplace (called team-efficacy by the authors) and its relationship with team
performance, but no study to date has used meta-analysis to investigate the
connection between collective teacher efficacy and achievement.
8
Research Questions
This study fills this gap in the literature by analyzing results from research
concerned with the relationship between collective teacher efficacy and student
achievement. Meta-analysis was used to synthesize various studies, producing a big
picture of the relationship. The existing published research was limited and
somewhat localized, but meta-analysis offered a way to broaden the search,
examining all available studies (published and unpublished) at once, so that an
overall effect size could be calculated, and potential moderators could be teased out.
This meta-analysis addressed the following questions:
1. What is the distribution of the effect sizes measuring the relationship
between collective teacher efficacy and student achievement in the
literature?
2. How do the effect sizes of this relationship vary based on certain moderator
variables, such as school level, school location, type of study, instruments
used, or the researchers involved?
Hypotheses
The hypotheses for this study were derived from a review of the current
literature.
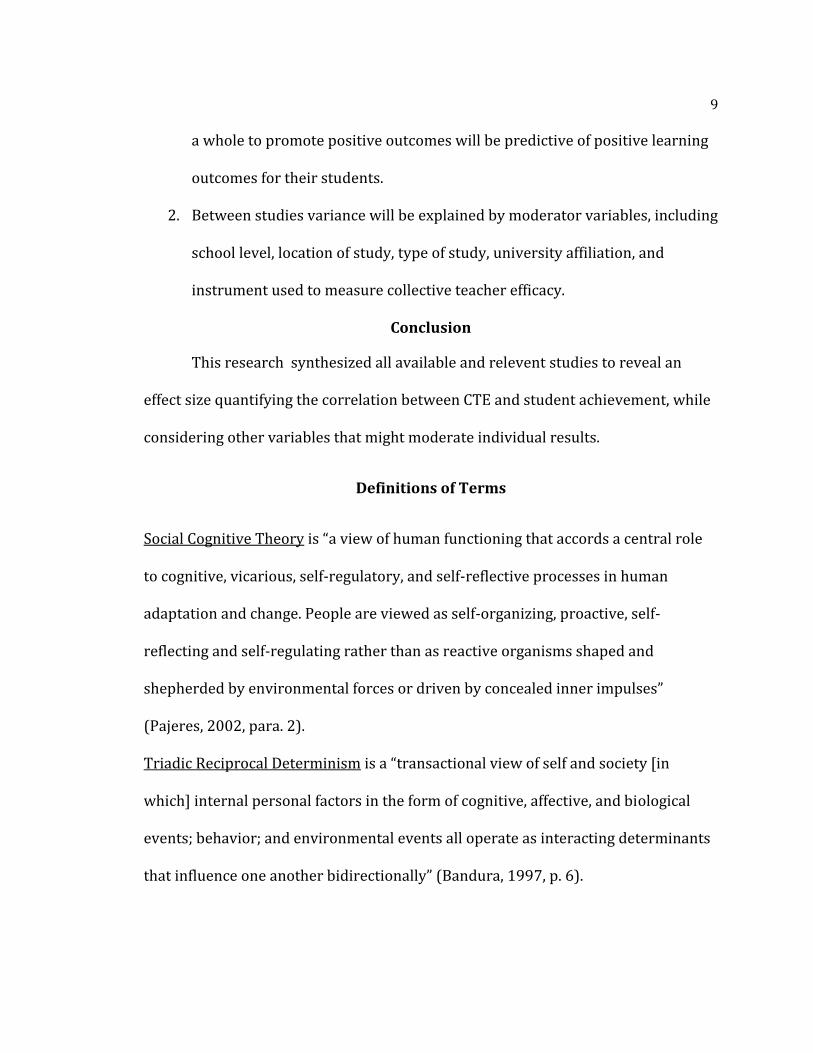
1. Collective teacher efficacy (CTE) will be strongly associated with student
achievement: The beliefs that teachers hold about the ability of the school as
9
a whole to promote positive outcomes will be predictive of positive learning
outcomes for their students.
2. Between studies variance will be explained by moderator variables, including
school level, location of study, type of study, university affiliation, and
instrument used to measure collective teacher efficacy.
Conclusion
This research synthesized all available and relevent studies to reveal an
effect size quantifying the correlation between CTE and student achievement, while
considering other variables that might moderate individual results.
Definitions of Terms
Social Cognitive Theory is “a view of human functioning that accords a central role
to cognitive, vicarious, self-regulatory, and self-reflective processes in human
adaptation and change. People are viewed as self-organizing, proactive, self-
reflecting and self-regulating rather than as reactive organisms shaped and
shepherded by environmental forces or driven by concealed inner impulses”
(Pajeres, 2002, para. 2).
Triadic Reciprocal Determinism is a “transactional view of self and society [in
which] internal personal factors in the form of cognitive, affective, and biological
events; behavior; and environmental events all operate as interacting determinants
that influence one another bidirectionally” (Bandura, 1997, p. 6).
10
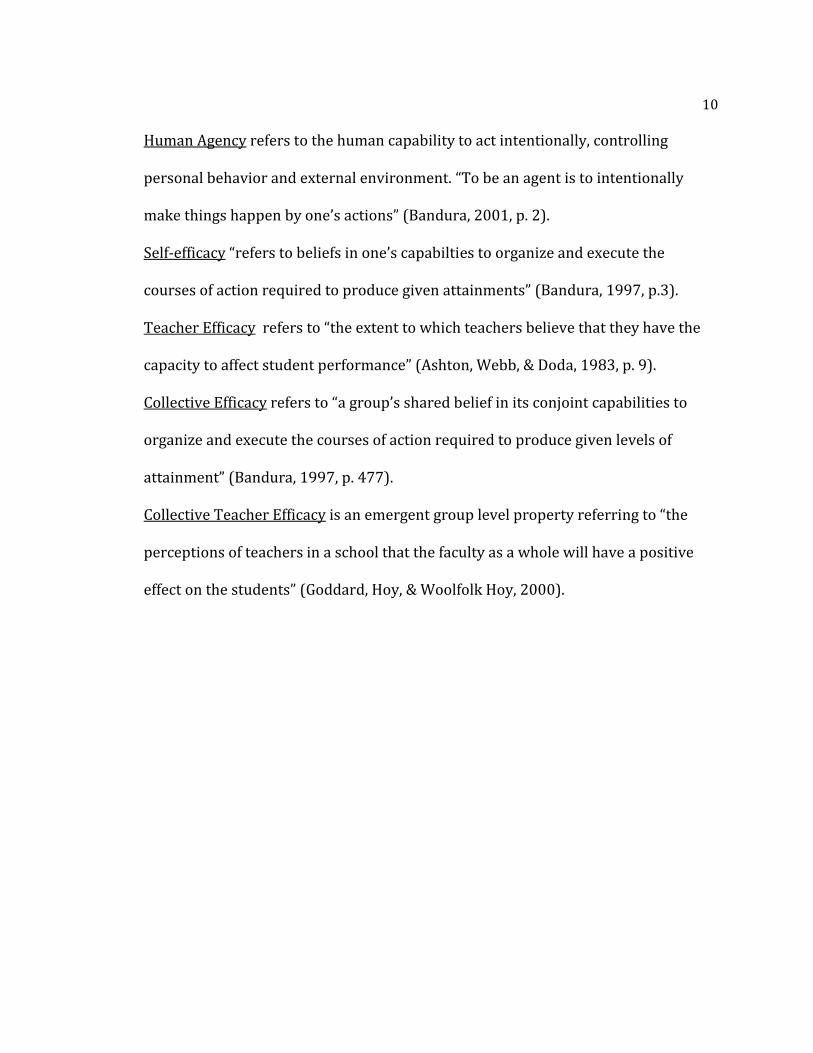
Human Agency refers to the human capability to act intentionally, controlling
personal behavior and external environment. “To be an agent is to intentionally
make things happen by one’s actions” (Bandura, 2001, p. 2).
Self-efficacy “refers to beliefs in one’s capabilties to organize and execute the
courses of action required to produce given attainments” (Bandura, 1997, p.3).
Teacher Efficacy refers to “the extent to which teachers believe that they have the
capacity to affect student performance” (Ashton, Webb, & Doda, 1983, p. 9).
Collective Efficacy refers to “a group’s shared belief in its conjoint capabilities to
organize and execute the courses of action required to produce given levels of
attainment” (Bandura, 1997, p. 477).
Collective Teacher Efficacy is an emergent group level property referring to “the
perceptions of teachers in a school that the faculty as a whole will have a positive
effect on the students” (Goddard, Hoy, & Woolfolk Hoy, 2000).
11
CHAPTER 2
LITERATURE REVIEW
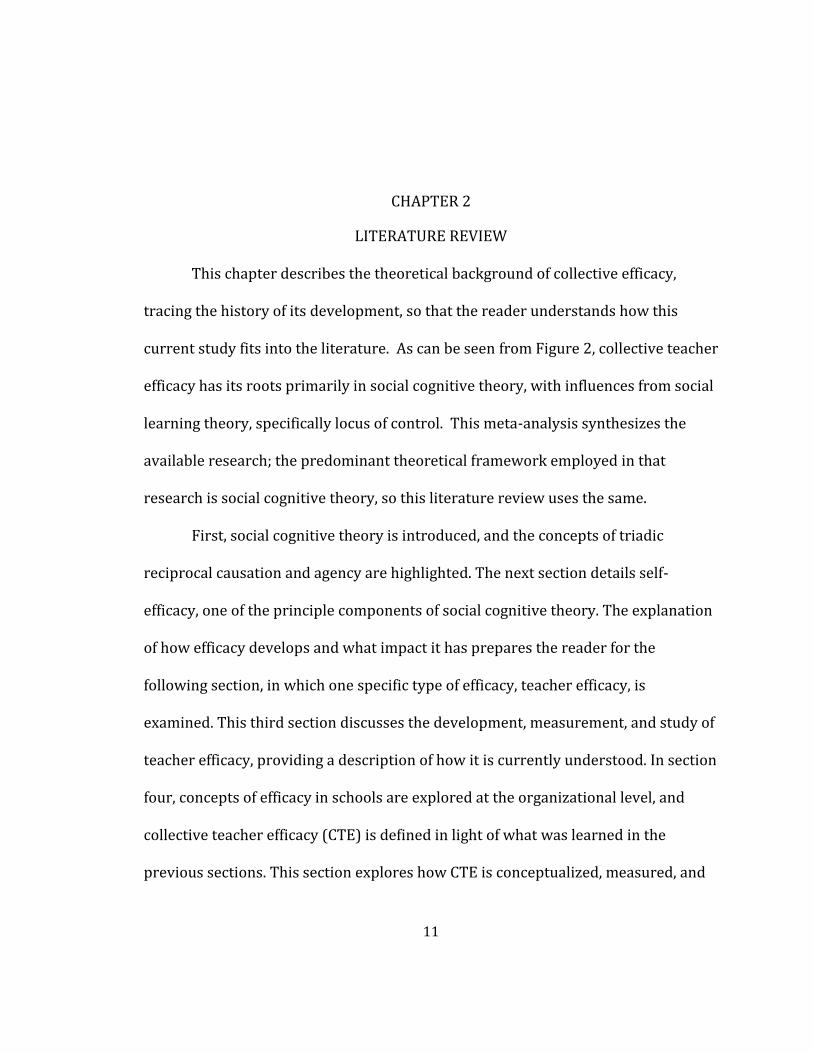
This chapter describes the theoretical background of collective efficacy,
tracing the history of its development, so that the reader understands how this
current study fits into the literature. As can be seen from Figure 2, collective teacher
efficacy has its roots primarily in social cognitive theory, with influences from social
learning theory, specifically locus of control. This meta-analysis synthesizes the
available research; the predominant theoretical framework employed in that
research is social cognitive theory, so this literature review uses the same.
First, social cognitive theory is introduced, and the concepts of triadic
reciprocal causation and agency are highlighted. The next section details self-
efficacy, one of the principle components of social cognitive theory. The explanation
of how efficacy develops and what impact it has prepares the reader for the
following section, in which one specific type of efficacy, teacher efficacy, is
examined. This third section discusses the development, measurement, and study of
teacher efficacy, providing a description of how it is currently understood. In section
four, concepts of efficacy in schools are explored at the organizational level, and
collective teacher efficacy (CTE) is defined in light of what was learned in the
previous sections. This section explores how CTE is conceptualized, measured, and
12
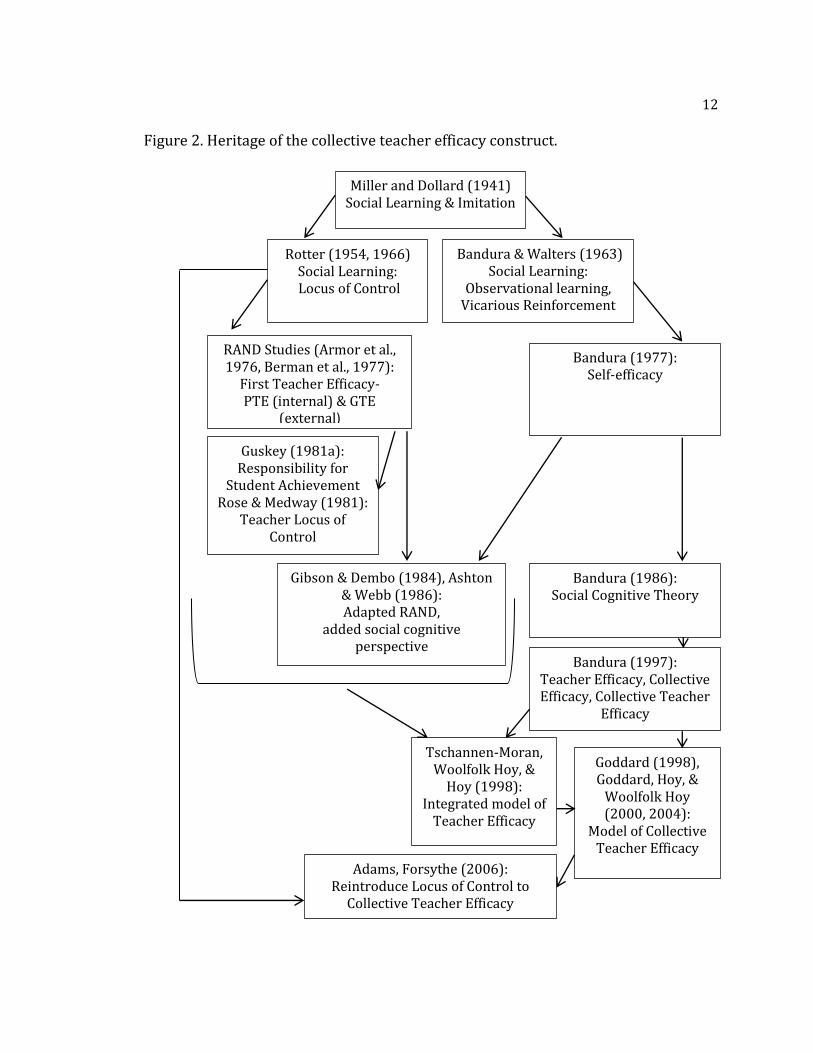
Figure 2. Heritage of the collective teacher efficacy construct.
Miller and Dollard (1941) Social Learning & Imitation
Bandura & Walters (1963) Social Learning:
Observational learning, Vicarious Reinforcement
Rotter (1954, 1966) Social Learning: Locus of Control
RAND Studies (Armor et al., 1976, Berman et al., 1977):
First Teacher Efficacy- PTE (internal) & GTE
(external)
Bandura (1977): Self-efficacy
Gibson & Dembo (1984), Ashton & Webb (1986): Adapted RAND,
added social cognitive perspective
Guskey (1981a): Responsibility for
Student Achievement Rose & Medway (1981):
Teacher Locus of Control
Bandura (1997): Teacher Efficacy, Collective Efficacy, Collective Teacher
Efficacy
Bandura (1986): Social Cognitive Theory
Tschannen-Moran, Woolfolk Hoy, &
Hoy (1998): Integrated model of
Teacher Efficacy
Goddard (1998), Goddard, Hoy, &
Woolfolk Hoy (2000, 2004):
Model of Collective Teacher Efficacy
Adams, Forsythe (2006): Reintroduce Locus of Control to
Collective Teacher Efficacy
13
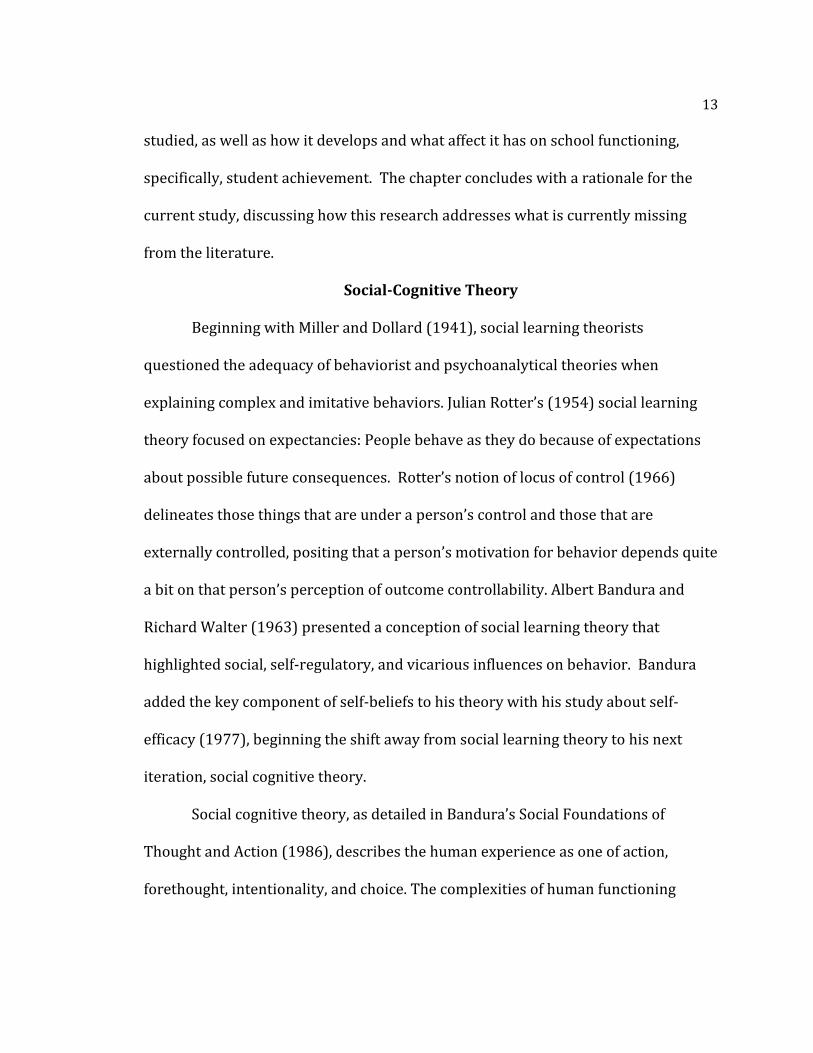
studied, as well as how it develops and what affect it has on school functioning,
specifically, student achievement. The chapter concludes with a rationale for the
current study, discussing how this research addresses what is currently missing
from the literature.
Social-Cognitive Theory
Beginning with Miller and Dollard (1941), social learning theorists
questioned the adequacy of behaviorist and psychoanalytical theories when
explaining complex and imitative behaviors. Julian Rotter’s (1954) social learning
theory focused on expectancies: People behave as they do because of expectations
about possible future consequences. Rotter’s notion of locus of control (1966)
delineates those things that are under a person’s control and those that are
externally controlled, positing that a person’s motivation for behavior depends quite
a bit on that person’s perception of outcome controllability. Albert Bandura and
Richard Walter (1963) presented a conception of social learning theory that
highlighted social, self-regulatory, and vicarious influences on behavior. Bandura
added the key component of self-beliefs to his theory with his study about self-
efficacy (1977), beginning the shift away from social learning theory to his next
iteration, social cognitive theory.
Social cognitive theory, as detailed in Bandura’s Social Foundations of
Thought and Action (1986), describes the human experience as one of action,
forethought, intentionality, and choice. The complexities of human functioning
14
cannot be sufficiently explained by the influence of external forces (such as
reinforcers or punishers), internal drives (such as libido) or biological factors (how
the human brain and body have evolved). The emergence of social cognitive theory
brought attention to the influence of observational learning, vicarious experience,
and self-beliefs on human behavior. Central to this theory is the idea that human
functioning is the product of multiple influences that interact dynamically (Pajares,
2002).
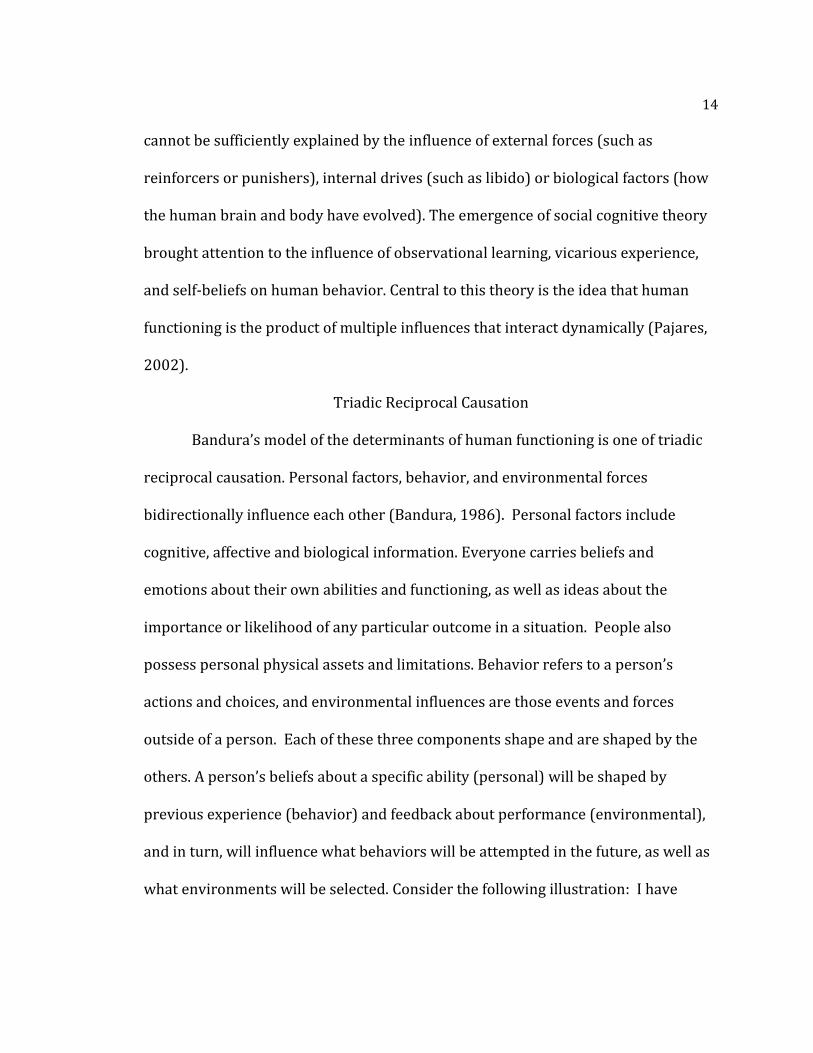
Triadic Reciprocal Causation
Bandura’s model of the determinants of human functioning is one of triadic
reciprocal causation. Personal factors, behavior, and environmental forces
bidirectionally influence each other (Bandura, 1986). Personal factors include
cognitive, affective and biological information. Everyone carries beliefs and
emotions about their own abilities and functioning, as well as ideas about the
importance or likelihood of any particular outcome in a situation. People also
possess personal physical assets and limitations. Behavior refers to a person’s
actions and choices, and environmental influences are those events and forces
outside of a person. Each of these three components shape and are shaped by the
others. A person’s beliefs about a specific ability (personal) will be shaped by
previous experience (behavior) and feedback about performance (environmental),
and in turn, will influence what behaviors will be attempted in the future, as well as
what environments will be selected. Consider the following illustration: I have
15
never been downhill skiing. This is partly because I’ve always doubted my ability to
ski, so I’ve not been motivated to try. If I were to attempt this sport, I may discover
that this skill is attainable, and I might be reinforced by praise and encouragement
from those around me, prompting me to return to the mountain and try again, and
altering my beliefs about my abilities and the outcomes of my actions. The choices
we make, and the people we become are determined by the interactions among our
beliefs and attitudes, our actions and experiences, and the information that we
receive from those around us. Triadic reciprocal causation describes human
functionality that is dynamic and active, which leads to another central concept in
social cognitive theory: agency.
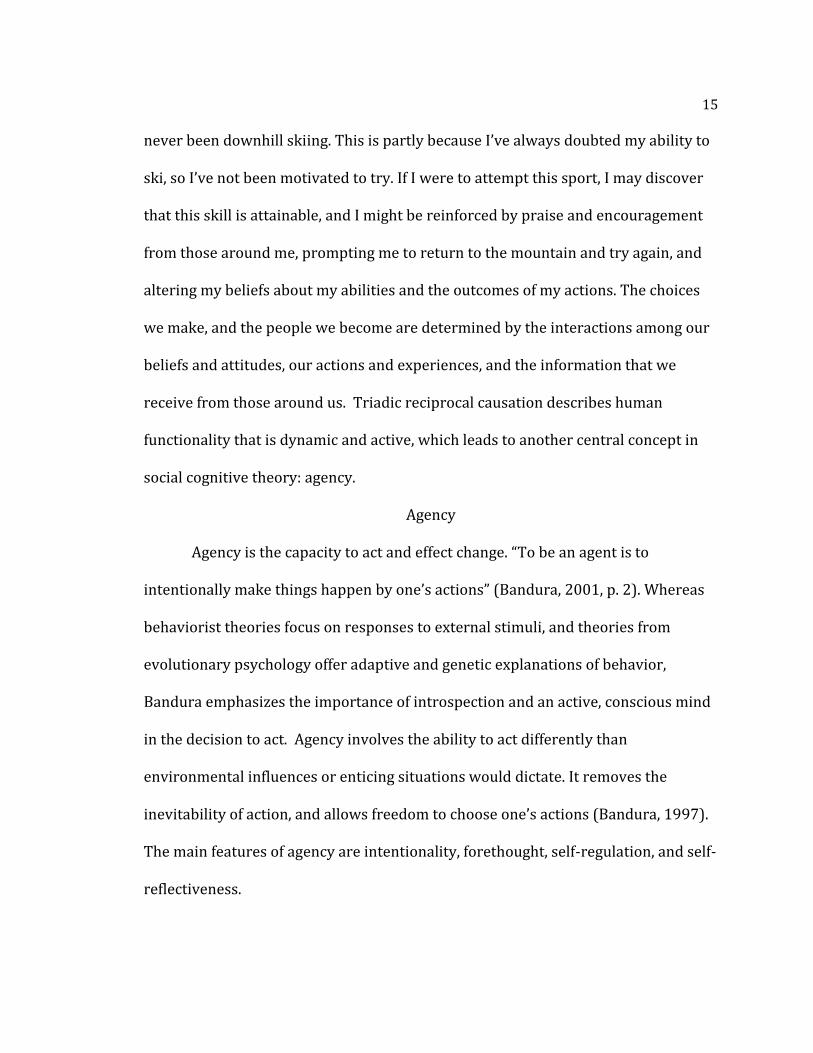
Agency
Agency is the capacity to act and effect change. “To be an agent is to
intentionally make things happen by one’s actions” (Bandura, 2001, p. 2). Whereas
behaviorist theories focus on responses to external stimuli, and theories from
evolutionary psychology offer adaptive and genetic explanations of behavior,
Bandura emphasizes the importance of introspection and an active, conscious mind
in the decision to act. Agency involves the ability to act differently than
environmental influences or enticing situations would dictate. It removes the
inevitability of action, and allows freedom to choose one’s actions (Bandura, 1997).
The main features of agency are intentionality, forethought, self-regulation, and self-
reflectiveness.
16
Agency involves intentionality. Making something happen accidentally is not
agency because it involves no intention. Likewise, an intentional act can have
unforeseen consequences, but that does not negate the agency. Intentions precede
acts, and are mental representations of and commitment to courses of action
(Bandura, 2001). This is also related to forethought. Planning for outcomes that are
temporally distant serves to direct action. Foresightful behavior “enables people to
transcend the dictates of their immediate environment and to shape and regulate
the present to fit a desired future” (p. 7).
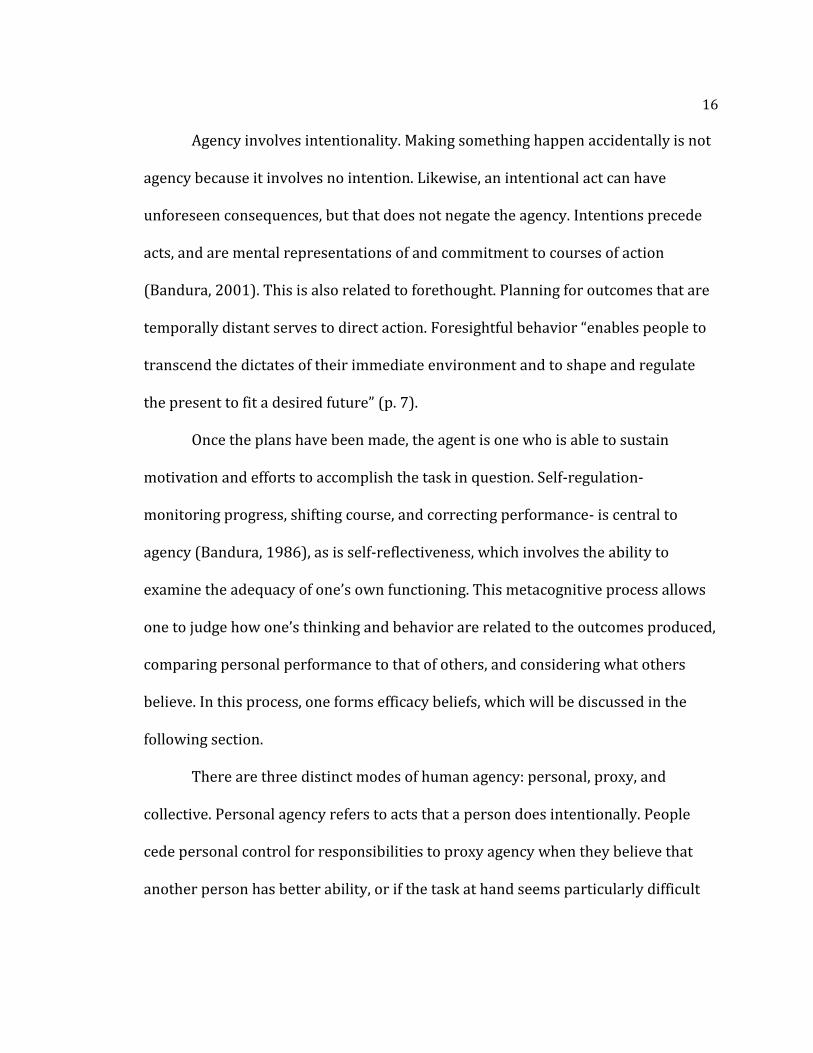
Once the plans have been made, the agent is one who is able to sustain
motivation and efforts to accomplish the task in question. Self-regulation-
monitoring progress, shifting course, and correcting performance- is central to
agency (Bandura, 1986), as is self-reflectiveness, which involves the ability to
examine the adequacy of one’s own functioning. This metacognitive process allows
one to judge how one’s thinking and behavior are related to the outcomes produced,
comparing personal performance to that of others, and considering what others
believe. In this process, one forms efficacy beliefs, which will be discussed in the
following section.
There are three distinct modes of human agency: personal, proxy, and
collective. Personal agency refers to acts that a person does intentionally. People
cede personal control for responsibilities to proxy agency when they believe that
another person has better ability, or if the task at hand seems particularly difficult
17
or onerous and they don’t want the responsibility. When responsibility is shared
with others, in the belief that, as a group, they can make desired progress toward a
common goal, collective agency emerges (Bandura, 2001).
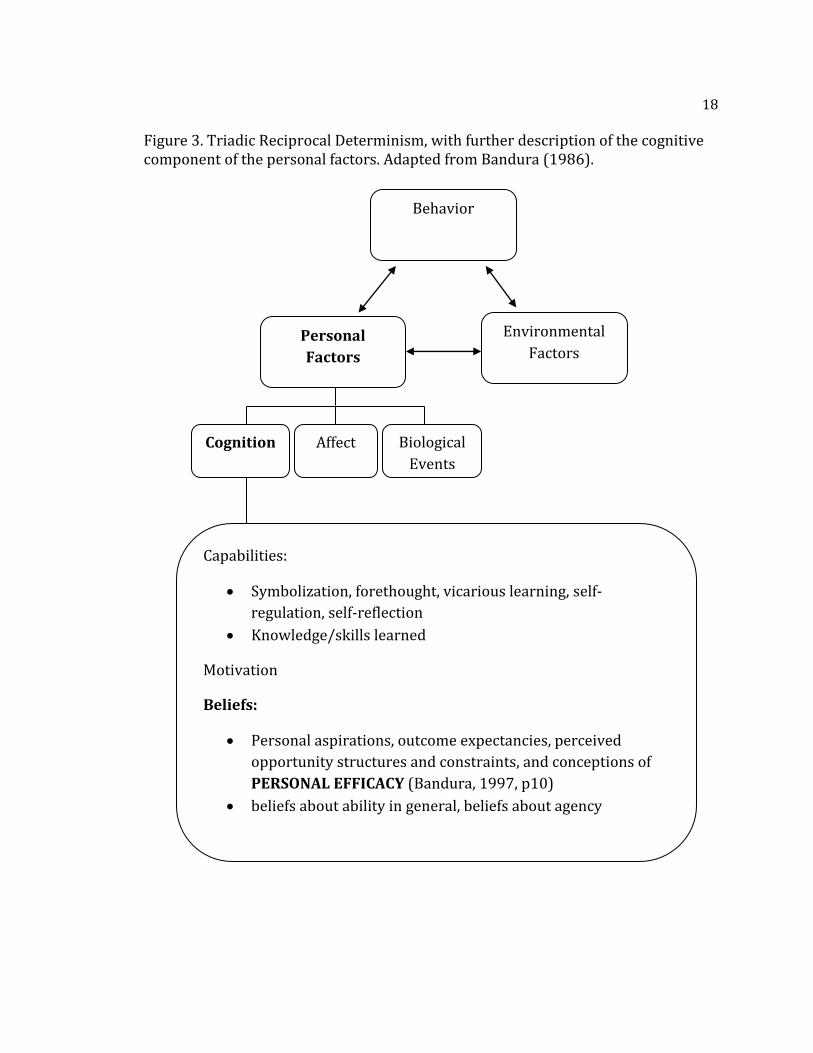
Agency reflects personal power over outcome. The focus of this literature
review will now narrow to examine more closely how the personal factors within
the model of triadic reciprocal causation, specifically cognitive features, exert
influence on human functioning (Figure 3). The cognitive component is comprised
of “personal aspirations, outcome expectancies, perceived opportunity structures
and constraints, and conceptions of personal efficacy“ (Bandura, 1997, p. 10). Self-
efficacy involves cognitions about agency, ability, and success, and is the focus of the
next section.
Self- Efficacy
“Perceived self-efficacy refers to beliefs in one’s capabilities to organize and
execute the courses of action required to produce given attainments” (Bandura,
1997, p.3). It is one’s estimation of the potential for success, and since the
introduction of the concept, it has become a powerful way to explain differences in
human performance.
In 1977, Albert Bandura wrote an article placing self-efficacy at the center of
a theoretical framework for analyzing behavior change, and asserting its importance
in human functioning. The article was written from a clinical perspective, with
18
Figure 3. Triadic Reciprocal Determinism, with further description of the cognitive component of the personal factors. Adapted from Bandura (1986).
Behavior
Personal
Factors
Environmental
Factors
Biological
Events
Cognition Affect
Capabilities:
Symbolization, forethought, vicarious learning, self-
regulation, self-reflection
Knowledge/skills learned
Motivation
Beliefs:
Personal aspirations, outcome expectancies, perceived
opportunity structures and constraints, and conceptions of
PERSONAL EFFICACY (Bandura, 1997, p10)
beliefs about ability in general, beliefs about agency
19
beliefs and behavior having been studied in the treatment of defensive and/or
dysfunctional behavior. Self-efficacy was presented as a common cognitive
mechanism activated in both cognitive-based and performance-based modes of
treatment. This common mechanism could account for learning and change that can
happen even in the absence of successful performance, and also explain how
mastery of a task is the most powerful way to effect psychological change. Either
form of treatment, Bandura said, changes a person’s self-efficacy, and, assuming that
a person has the skills needed and the right incentives, “efficacy expectations are a
major determinant of people’s choice of activities, how much effort they will expend,
and of how long they will sustain effort in dealing with stressful situations”
(Bandura, 1977, p. 194).
Since the writing of that article, self-efficacy became a central tenet of social
cognitive theory, addressing nearly all aspects of human functioning (Pajares, 2002).
Within the model of triadic reciprocal determinism, personal factors are afforded as
much influence on human functioning as environmental influences and behavior, so
one’s personal beliefs about ability and power to effect change have an impact on
every behavior choice a person makes. “Efficacy beliefs are the foundation of human
agency” (Bandura, 2001, p.10). Without the belief that we exert control over our
circumstances, there is no agency, and therefore, no power to act. Our self-efficacy
beliefs provide the lens through which we view our options and ultimately choose to
act, even if our choices appear to be out of concert with external reality. “People’s
20
level of motivation, affective states, and actions are based more on what they believe
than on what is objectively true” (Bandura, 1997, p.2). Humans are not bound solely
to environmental control of behavior; rather a person’s active, purposeful cognitions
interact with environmental stimuli to influence behavior. The behaviorist would
say that external reinforcement of a certain behavior leads to increased frequency of
that behavior. Bandura posited that reinforcement is a motivational device, and it
works because of a person’s beliefs about reinforcement (1977). Self-efficacy beliefs
are part of the human element in the control and direction of behavior.
Dimensions
Efficacy expectations can vary according to magnitude, generality and
strength, and, instead of being considered a global personality trait, self-efficacy is
specific to ability and situation (Bandura, 1977, 1986, 1997). This means that a
person will feel differing levels of efficacy for different situations, and those efficacy
beliefs can vary depending on the context and the goal. Some teachers feel perfectly
at ease speaking in front of groups of children, but their efficacy for public speaking
decreases when addressing adults. Although public speaking efficacy might
generalize somewhat between contexts, there are changes in magnitude (which
refers to task difficulty) and strength (referring to persistence) (Bandura, 1977). A
high school social studies teacher may feel the greatest efficacy for teaching history
to sophomores, less so for teaching economics to juniors, and no efficacy at all for
teaching calculus to seniors. Likewise, a person might feel a general sense of efficacy
21
for teaching (I am good at helping people learn and understand) that may not relate
to all subject areas (I am able to teach kids algebra, but I’m not as confident that I
could teach grammar) or grade levels (I can teach middle schoolers, but I don’t think
I would be as effective with second graders). General versus specific efficacy for
teaching will be discussed again later.
Distinctions among Similar Concepts
This section will explore how efficacy differs from other similar ideas. The
first part looks at self-referential variables (self-concept, self-esteem), the second
deals with issues of outcome and control (expectancies, locus of control, and learned
helplessness), and the final part addresses self-regulation.
Self-referential Variables
Self-efficacy differs from self-concept and self-esteem in its specificity and
predictive ability (Bandura, 1997). As these three variables appear to be similar, it
is important to illustrate how self-efficacy is conceptually distinct.
Self-efficacy beliefs are formed by asking questions about what a person can
or cannot do, while self-concept beliefs come from answering questions about being
(Who am I?) or feeling (How do I feel about myself as…?) (Pajares & Schunk, 2001).
Self-concept is global, a composite view of the self, and is less predictive of behavior
than self-efficacy, which varies according to domain and circumstances (Bandura,
1997).
22
Self-efficacy reflects beliefs about capability, while self-esteem reflects beliefs
about self-worth. Sometimes these beliefs appear in concert with one another, as
people develop skills in areas that make them feel good about themselves, and a job
well done can raise self-esteem. However, they need not exist simultaneously. A
person can feel inefficacious in a certain domain without any damage to self-esteem,
and on the other hand, another person may believe in their ability to do something
exceptionally well, even while believing himself/herself worthless. (Bandura,
1997). “People need much more than high self-esteem to do well in given
pursuits…People need firm confidence in their efficacy to mount and sustain the
effort required to succeed” (Bandura, 1997, p 11). Recent studies have echoed this
idea: Jean Twenge (2006) points to a generation of students whose self-esteem has
been artificially inflated after decades of self-esteem initiatives in schools. Those
initiatives aimed to raise achievement by raising esteem, instead of building efficacy
through authentic opportunities to be successful.
Outcome Expectations
When considering a task at hand, two types of expectations will influence
behavior choice. Efficacy expectations reflect levels of certainty in one’s ability to
execute specific behaviors. Outcome expectations reflect what one believes will
occur because of behavior, and they come in three major forms, each being either
positive or negative: physical effects, social effects, and one’s own reaction to and
evaluation of personal behavior (Bandura, 1977, 1986, 1997).
23
Consider the parents who understand that controlling their children by
intimidation is well within their capabilities, but who judge the outcomes of that
type of domination to be undesirable and detrimental. These parents avoid such
tactics, even though those methods could be easily employed. People make choices
about the use of existing abilities because of anticipated outcomes.
Behavior produces performance, which brings about outcomes. For example,
in schools, a letter grade is not an outcome, it is a performance indicator. For a
student, the resulting positive or negative consequences of receiving a certain grade
are the outcomes. Efficacy beliefs shape and are shaped by outcome expectations. “It
is because people see outcomes as contingent on the adequacy of their performance,
and care about those outcomes, that they rely on efficacy beliefs in deciding which
course of action to pursue and how long to pursue it” (Bandura, 1997, p. 24).
However, when factors outside of quality of performance can affect outcomes, or
when outcomes are connected to an established minimum performance level such
that work performance above that level is not rewarded differentially, then efficacy
beliefs can only explain some of the variation in outcome expectations (Bandura,
1977, 1986, 1997). In a troubled economy, unstable financial situations can affect
the outcomes of a person’s job performance: work that might typically have been
rewarded may not yield the same outcomes, as companies have to lay off workers.
In classrooms, once a student determines what level of work will be enough to
24
secure the desired outcomes (praise, approval, rewards) that student may not be
compelled to work harder than that.
Bandura’s distinction between efficacy expectations and outcome
expectations will become critical to an understanding of teacher efficacy and how it
is conceptualized, and will be revisited in later sections of this literature review.
Locus of Control
The issue of control over outcomes leads to Rotter’s (1966) social learning
theory and locus of control. Rotter posited that people develop, through their
reinforcement histories, generalized expectations about whether outcomes are
determined by things outside of personal control, or are the results of behavior. Self-
efficacy and locus of control must be distinguished, but they work together, because
the way in which a person tends to attribute control informs that person’s beliefs
about their abilities (Bandura, 1977, 1986, 1997). Generally, those who believe that
situations cannot be controlled or changed do not persist as long when a task is
difficult, and it becomes easy to relinquish personal investment or responsibility in
that situation. However, one who is highly efficacious yet existing in an environment
over which there is little personal control may be motivated to change the system
and protest the lack of control, while a person with low self-efficacy, in that same
environment, may feel a sense of resignation or even apathy. In situations in which a
person can feel a measure of control over outcomes, high self-efficacy brings

25
aspirations and satisfaction with efforts, while individuals with low self-efficacy
confront their own shortcomings (Bandura, 1997).
It is important to note that Rotter’s ideas about control were instrumental in
the initial development of the concept of teacher efficacy, and will therefore be
reexamined within the discussion of teacher efficacy.
Learned Helplessness
Maier and Seligman (1976) defined learned helplessness as when “an
organism has learned that outcomes are uncontrollable by his responses and is
seriously debilitated by this knowledge” (p.4). As it relates to self-efficacy, this is a
problem of agency. One must be careful to make a distinction between the futility
that arises when one is not able to successfully perform a task and the futility that
comes from existing in an environment that is unreceptive or hostile to one’s
successful performance. “To alter efficacy-based futility requires development of
competencies and expectations of personal effectiveness. By contrast, to change
outcome-based futility necessitates change in prevailing environmental
contingencies that restore the instrumental value of the competencies that people
already possess” (Bandura, 1977, p. 205). When faced with an unresponsive
environment, some people mistakenly attribute their lack of success to a supposed
lack of ability, while others can maintain their efficacy, yet quit trying because they
understand that their work will not pay off. Assessment of the futility or potential of
26
a situation contributes to the way in which a person cognitively processes
information that leads to efficacy beliefs.
Self-Regulation
Self-regulation is considered separately from the other self-variables because
it has to do with action and balance, as opposed to beliefs, judgments, or
evaluations. It has already been addressed in this literature review as a main feature
of agency, but is being revisited to further clarify distinctions.
Self-regulation involves the ways in which humans assess their beliefs,
capabilities, and possible outcomes; set goals; and plan courses of action (Bandura,
1991). In Piaget’s theory (1960, as cited in Bandura, 1997), self-regulation is
triggered by the need for equilibration: A person experiences cognitive conflict and
needs to make adjustments to restore balance. This idea is similar in structure to
control systems theory (Powers, 1973), in which negative feedback acts as the
regulator for behavior. Within a closed loop of cause and effect, when a person
senses a disparity between desired and perceived outcome, he or she will work to
make adjustments to achieve a set standard (Cziko, 1992). The understanding, from
this perspective, is that what people do is guided not by external forces, but rather
by their own effort to control what is sensed or perceived (Powers, 1973).
Bandura (1991, 1997) describes the differences between a social cognitive
theory of self-regulation and the theories that utilize the negative feedback model by
highlighting the proactive nature of forethought. In a negative feedback model, no
27
action is needed if performance matches the internal standard, or if no feedback is
forthcoming. While correcting for a discrepancy is indeed a function of self-
regulation, “self-regulation via negative discrepancy tells only half the story, and not
necessarily the more interesting half” (Bandura, 1997, p. 131). The proactive self-
regulator is able to produce as well as reduce discrepancies, creating disequilibrium
for oneself. This is where self-efficacy comes into play: “After people attain the
standard they have been pursuing, those who have a strong sense of self-efficacy
generally set a higher standard for themselves” (Bandura, 1991, p.260).
As self-regulation directs action, self-efficacy influences self-regulation. Self-
efficacy affects goal setting, perceptions of success and failure, persistence, and how
activities are valued (Bandura 1991). The results of self-regulation and action can
then further inform self-efficacy.
Sources of Self-efficacy
Efficacy in a particular domain can develop in four ways: through mastery
experiences, vicarious experiences, social persuasion, and physiological
affect/arousal (Bandura, 1977, 1986, 1997). It is from these sources that
individuals gather information about their particular capabilities to perform a given
task.
Mastery Experiences
The first and strongest source of efficacy is the collection of mastery
experiences. When people attempt and practice tasks, they discover that the task is
28
one that is attainable and can be perfected, thus strengthening self-efficacy, or they
conclude, after struggles and failures, that they cannot succeed, weakening efficacy
beliefs. As a person works to develop new skills, access to success is crucial. In
schools, job training environments, and therapeutic environments, novices are not
tasked with the most complex problems first. After starting with the most
rudimentary components to be learned, difficulty is increased as tasks are mastered.
In this way, successful performance provides the efficacy needed to attempt the next
task. Generally, children don’t learn to read using novels, new employees aren’t
asked to run a company, and clients with snake phobias aren’t immediately asked to
hold pythons. Attainable successes are presented, along with appropriate feedback
and support, so that confidence in ability increases. After efficacy has been
established, then occasional failure will no longer be a threat, and may serve to
strengthen persistence (Bandura, 1977). Conversely, success that comes too easily
brings an expectation of quick results, and when failures happen, easy
discouragement. “A resilient sense of efficacy requires experience in overcoming
obstacles through perseverant effort. By sticking it out through tough times people
emerge more able and stronger from adversity” (Bandura, 1998, p. 54).
Vicarious Experiences
Efficacy that is gained by observation is acquired vicariously. Observing
another person perform a task successfully can influence personal beliefs about the
ability to do the same. This source of efficacy information is less dependable than
29
mastery experiences, but is most beneficial when the observer can identify with the
model, when the behavior modeled has clear outcomes, and when a variety of
models demonstrate successful performance (Bandura, 1977, 1986, 1997). A
learner can become convinced of the potential for accomplishment by seeing other
people in similar situations execute tasks successfully. Children watch their peers
and learn what activities to try. Teachers observe how their colleagues handle
challenges and are inspired to do the same. Vicarious experience leads people to say,
“I can do that, too.”
Social Persuasion
When a trustworthy and credible source offers encouragement by expressing
confidence in a learner’s abilities to succeed, self-efficacy can be increased. Social
persuasion alone produces weak efficacy expectations that can be quickly
disconfirmed, but when used along with corrective feedback and other assistance to
achieve success, can encourage greater effort (Bandura, 1977, 1986, 1997). As
those who motivate carefully structure opportunities for a leaner to both be
successful and observe others being successful, they also offer pep talks to
encourage persistence and increase motivation (Bandura, 1988).
Physiological Affect/Arousal
Finally, the body itself is a source of information about perceived ability.
When confronted with a task, physiological cues, such as fear, anger, and sorrow,
contribute to a person’s sense of personal competency, as that person relies on
30
bodily cues to warn them of vulnerability and anxiety. People come to expect
success when they feel low arousal, while high anxiety inhibits confidence in
abilities (Bandura, 1977, 1986, 1997).
Effect on Human Functioning
The sources of self-efficacy provide information that must be processed
cognitively before that information shapes self-efficacy. If a person believes that
success was fortuitous and not a reflection of ability, then beliefs about capabilities
may remain unchanged. Likewise, if a person does not believe the verbal persuasion
being offered, cannot identify with the model being observed, or cannot trust their
gut, self-efficacy will not increase. The sources must be perceived to be authentic
(Bandura, 1977, 1986, 1997). When information from the four sources is deemed
credible, it combines to shape efficacy beliefs which influence functioning through
cognitive, affective, motivational and selective processes (Bandura, 1977, 1986,
1997). “It is partly on the basis of efficacy beliefs that people choose what challenges
to undertake, how much effort to expend in the endeavor, how long to persevere in
the face of obstacles and failures, and whether failures are motivating or
demoralizing” (Bandura, 2001, p. 10).
Changes in Efficacy
Since self-efficacy influences behavior, those people whose job it is to
motivate must work to simultaneously employ the four sources of efficacy so that
efficacy can be maximized. “Efficacy builders do more than convey positive
31
appraisals. They structure situations for others in ways that bring success and avoid
placing them, prematurely, in situations where they are likely to fail” (Bandura,
1998, p. 54). Teachers, trainers, and therapists set up opportunities for success
while providing models of behavior and words of encouragement that are specific
and meaningful as well as advice about how to handle the anxiety and stress of
trying something that is a challenge.
As a way to enhance personal beliefs so that organizational functioning can
be improved, Bandura suggests guided mastery modeling, which involves
demonstrating a skill, providing guided practice with feedback and encouragement
for skill perfection, and then allowing opportunities to use the skill successfully in
authentic and increasingly challenging situations. This builds confidence in one’s
capabilities (Bandura, 1988). This technique, in school settings, is referred to as
scaffolding, and comes from Vygotskian theory. Scaffolding involves organizing a
task so that effort is rewarded by success, modeling actions and strategies, pointing
out results of actions, and providing assistance and feedback as a learner gains
skills. Learning is therefore a social interaction between a less experienced novice
and someone with a higher level of expertise. Successful scaffolding leads to learner
confidence in efforts, willingness to learn from mistakes, and greater persistence in
the face of difficulties (Meadows, 1998).
Just as increases in self-efficacy can improve functioning, when self-efficacy is
weakened, either temporarily or more permanently, performance may be
32
undermined. Circumstances can alter a person’s mindset such that he or she doesn’t
exercise all capabilities available. These circumstances include a rigidity of thought;
attention only to what is novel about a task; assignment to subordinate roles;
gender and racial stereotyping; and the offering of help when it isn’t needed
(Bandura, 1988, 1997). For this reason, Pajares and Schunk (2001) call for schools
to go beyond solely academic preparation to equip individuals with necessary skills,
confidence in those skills, and an environment that values their contributions, so
that they are ready to pursue personal ambitions.
Consider the student who is capable of high achievement in school, but does
not perform well. That student may be underperforming because of perceptions that
high achievement is unattainable, undesirable, or unappreciated. Perhaps that
student belongs to a social or cultural group that is stereotyped as low performing,
and has been underserved, ignored, or pitied, thereby removing opportunities to
build self-efficacy. Perhaps that student is susceptible to anxiety about performance,
and cannot cope with demands to demonstrate skill. Perhaps this student does not
view the outcomes of high achievement as important enough to justify the expended
effort. Performance isn’t always about skill, and those who assist and evaluate the
learning of new behaviors must pay attention to personal expectations that can
undermine success.
33
Generality vs. Specificity
Through a series of experiments, in which self-efficacy was manipulated
through vicarious influence, bogus peer norms, and arbitrary reference points,
Bandura found that self-efficacy independently contributes to both motivation and
performance (Bandura, 1997). Self-efficacy’s effect on motivation can affect actions
generally, as it contributes to a sense of tenacity. Emotional states are regulated by
efficacy beliefs- how we assess threat, regulate stress, control thoughts, and work to
change our environments (Bandura, 1998). “It is the resiliency of self-belief that
counts” (Bandura, 1988, p. 282). Those with strong beliefs in their own abilities
persevere through occasional failure, focusing on task mastery, and not succumbing
to self-doubt. Young children tend to overestimate their own abilities, and this
confidence grants them access to a variety of experiences. “Human accomplishments
and positive well-being require an optimistic sense of personal efficacy to override
the numerous impediments to success” (Bandura, 1998, p. 56).
Self-efficacy influences can be specific to performance in various life
domains, as well. For example, Lent, Brown, and Hackett (1994) developed a Social
Cognitive Career Theory (SCCT) that explored how self-efficacy affects career
choices when perceptions of ability, or lack thereof, are more powerful than actual
ability. A stronger sense of efficacy leads to more career options considered, greater
interest in those options, better educational preparation, and greater staying power.
34
Another specific application, self-efficacy for teaching, has been explored
extensively, because of the implications for schools and student performance. The
next section will present the growth of that construct.
Teacher Efficacy
Teacher efficacy, as it is currently understood, reflects beliefs about a
teacher’s ability to effectively help students learn. Over the past 40 years, teacher
efficacy has been explored, redefined, and measured in a variety of ways, and its
connections to other school variables have been well-established.
History of the Construct
The study of teacher efficacy grew out of two theoretical frameworks. The
first conception of teacher efficacy was based on Rotter’s social learning theory and
locus of control (1966). After Bandura’s conception of self-efficacy (1977) was
presented, teacher efficacy became more closely aligned with social cognitive
theory. The following sections explain the history of the teacher efficacy construct,
detailing how researchers have shaped the concept as they developed instruments
for its measurement.
RAND Studies
In the late seventies, the RAND organization conducted two studies of school
functioning: One examined factors contributing to reading success for inner city
children (Armor et al., 1976), the other identified factors contributing to the
continuation of innovative programs (Berman et al., 1977). These studies are
35
important because, based on Rotter’s 1966 article about internal versus external
control, they included two items on the questionnaires used that would measure
teacher efficacy.
Our measure of teachers’ sense of efficacy was based on two questions. One asked whether the teacher felt that “when it comes right down to it, a teacher can’t really do much [because] most of a student’s motivation and performance depends on his or her home environment.” The other asked whether the teacher thought that “if I try really hard, I can get through to even the most difficult or unmotivated students.” Responses to these two questions were combined into a single measure of efficacy—the extent to which the teacher believed he or she had the capacity to affect student performance. (Berman et al., 1977, p 159-160)
Both of these studies found that teacher efficacy was related to student
performance, and the Berman et al. study found connections between teacher
efficacy and both higher goal achievement and continuation of projects after federal
grants are removed. Since the publication of these two studies, the construct
measured by the first RAND item has come to be known as general teaching efficacy
(GTE) and it reflects that which is beyond a teacher’s control. The second RAND
item measures what is known as personal teaching efficacy (PTE) and it reflects
elements under a teacher’s control.
The RAND studies sparked an interest in teacher efficacy, and the years
following saw multiple adaptations and expansions of the RAND items as
researchers sought to more fully explore the construct. Guskey (1981a) published
the Responsibility for Student Achievement Questionnaire (RSA), which asked
respondents to decide how much of a given (positive or negative) situation was
36
caused by the teacher and how much was outside the teacher’s control. He found
that teachers perceived greater responsibility for positive events and less for
negative events (Guskey, 1981b). Rose and Medway (1981) developed the Teacher
Locus of Control Scale (TLC) to measure perceived internal or external control of
classroom events. The scale was found to be more predictive of teacher behavior
than Rotter’s Internal-External Locus of Control (I-E) Scale (1966), and teachers in
high SES schools who perceived internal control of classroom successes had
students who were more frequently participating in self-directed activities.
Ashton and Webb
Beginning in the early eighties, Patricia Ashton, Rodman Webb, and various
colleagues worked to more fully explore the concept of teacher efficacy, developing
a conceptual framework (Ashton, Webb, & Doda, 1983; Ashton & Webb, 1986). They
expanded the RAND work by incorporating social cognitive theory, and Bandura’s
self-efficacy, instead of focusing solely on internal or external control, as did the
previous studies. Their model of teacher efficacy was multidimensional, examining
how generalized beliefs about outcome-response relationships influence (and are
influenced by) both generalized beliefs about self-efficacy and teaching efficacy,
which both influence (and are influenced by) a sense of personal teaching efficacy,
which reflects the teacher’s beliefs about personal ability to teach in a particular
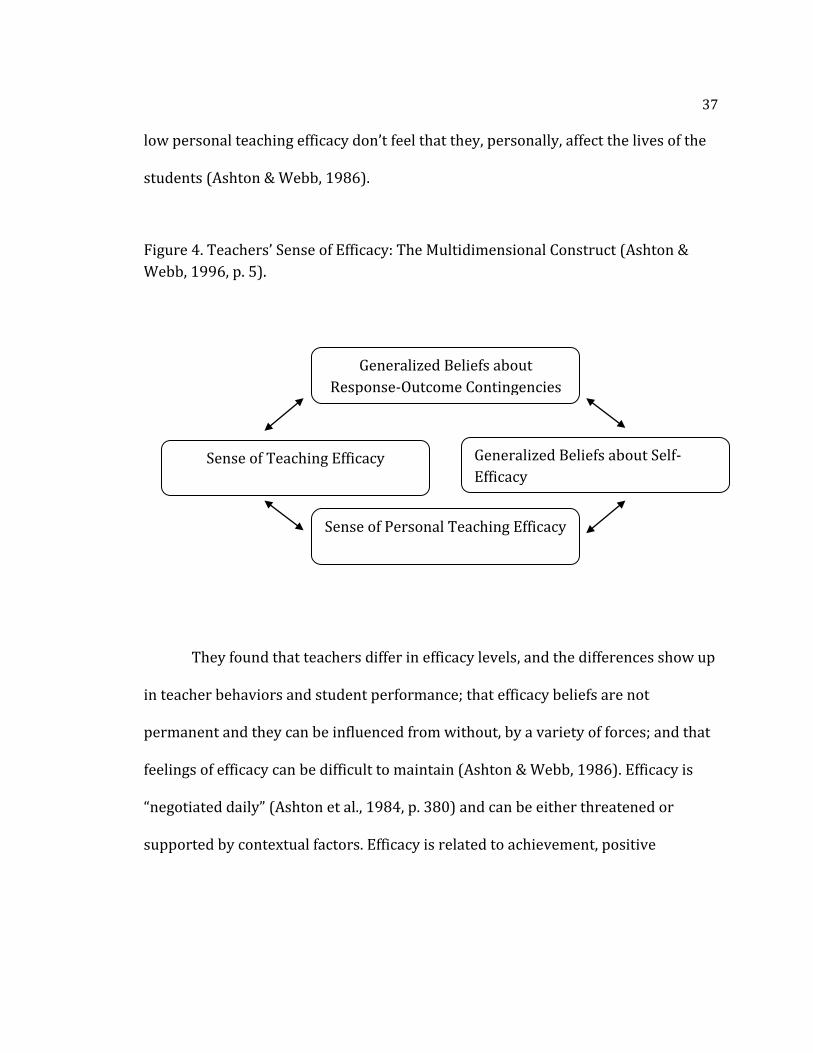
context (Figure 4). Teachers with low teaching efficacy don’t feel that teachers, in
general, can make much of a difference in the lives of students, while teachers with
37
low personal teaching efficacy don’t feel that they, personally, affect the lives of the
students (Ashton & Webb, 1986).
Figure 4. Teachers’ Sense of Efficacy: The Multidimensional Construct (Ashton &
Webb, 1996, p. 5).
They found that teachers differ in efficacy levels, and the differences show up
in teacher behaviors and student performance; that efficacy beliefs are not
permanent and they can be influenced from without, by a variety of forces; and that
feelings of efficacy can be difficult to maintain (Ashton & Webb, 1986). Efficacy is
“negotiated daily” (Ashton et al., 1984, p. 380) and can be either threatened or
supported by contextual factors. Efficacy is related to achievement, positive
Generalized Beliefs about
Response-Outcome Contingencies
Sense of Teaching Efficacy Generalized Beliefs about Self-
Efficacy
Sense of Personal Teaching Efficacy
38
classroom climate, organizational structures, and high academic expectations
(Ashton et al., 1984).
For these studies, two additional measures were developed to measure
efficacy (Ashton & Webb, 1986) in addition to the RAND items. The Webb efficacy
measure included seven items, for which the participant would need to agree with
one of a pair or contradicting statements: “A. A teacher should not be expected to
reach every child…B. Every child is reachable…” (Ashton et al., 1982, p. 36). The
second measure, the Ashton Vignettes (as they have come to be known) exist in long
(50 items) and short (15 items)forms and ask participants to rate their own
predicted effectiveness in hypothetical situations such as the following:
A new student has been assigned to your class. Her records indicate that she never does her homework and does not seem to care about education. Her IQ score is 83, and her achievement scores have been below the 30th percentile. How effective would you be in increasing her achievement test score? (Ashton et al., 1982, p. 47).
Both of these measures were designed to address more complexity than the RAND
items could, situating the construct in more specific contexts. In 1984, Ashton, Buhr,
and Crocker found that the vignette items correlated with RAND items when they
are written so that they ask a teacher to compare their effectiveness to other
teachers.
Gibson and Dembo
While Ashton & Webb were doing their work, Sherri Gibson and Myron H.
Dembo developed a 30 item instrument (Teacher Efficacy Scale, or TES) to measure
39
General Teaching Efficacy (GTE, reflected RAND item 1) and Personal Teaching
Efficacy (PTE, similar to RAND item 2). The framework for this assessment was
social-cognitive theory: GTE reflected outcome expectancy and PTE reflected self-
efficacy (Gibson & Dembo, 1984). They predicted that teachers with high GTE and
high PTE would demonstrate high levels of persistence and confidence, providing
more instructional time, a strong academic focus, and quality feedback, while low
scoring teachers would give up easily in the face of failure.
This measure became popular among researchers, and has been modified to
suit various research purposes. Hoy and Woolfolk (1990) found that during the
professional semester, student teachers’ sense of PTE improved, while GTE
declined. Witcher et al. (2002) found that among preservice teachers, a
transmissive viewpoint, in which the teacher dispenses knowledge to students, was
moderately associated with lower GTE. Woolfolk, Rosoff, and Hoy (1990) separated
GTE and PTE and found that teachers with higher PTE used more humanistic
approaches to classroom discipline. Ross (1992) and da Costa (1995) both found a
positive relationship between PTE and pupil achievement. Allinder (1995) adapted
the TES for special education teachers, finding that teachers with high teaching
efficacy set student goals that were more ambitions, and increased the year-end
goals more often. Lamorey and Wilcox (2005) used an adapted TES to find that
higher early intervention practitioner efficacy scores were associated with more
years of experience in early intervention.
40
Guskey and Passaro (1993) modified Gibson and Dembo’s instrument,
adding alternate forms of questions because they believed PTE was actually
measuring an internal orientation, and GTE an external orientation, specifically
reflecting external constraints. The questions were rewritten so that every PTE item
and every GTE item were phrased in two ways, reflecting both internal and external
orientation. They found that GTE dimension of Gibson and Dembo really measures
external attribution of student failure. This modification would show up again when
Goddard (1998) created his scale to measure collective teacher efficacy.
Bandura
Twenty years after his first article about self-efficacy, Bandura published Self-
Efficacy: The Exercise of Control (Bandura, 1997), in which he addressed both
teacher efficacy and collective teacher efficacy, and the impact that efficacy beliefs
can have on the classroom: “Evidence indicates that teachers’ beliefs in their
instructional efficacy partly determine how they structure academic activities in
their classrooms and shape students’ evaluations of their intellectual capabilities”
(p. 240). This book began a shift in teacher efficacy research back to social cognitive
theory, with less of a focus on locus of control and Rotter’s social learning theory. In
order to properly measure teacher efficacy, Bandura called for scales to be
expanded to reflect the multifaceted nature of the construct. Instead of focusing on
general teaching efficacy (which seemed to be a measure of outcome expectancy
rather than efficacy expectation), the focus should be more specific, measuring
41
content-area efficacy. In this way, scales can more precisely determine how a
teacher’s sense of efficacy is related to student performance. To that end, he created
his own unpublished Teacher Self- Efficacy Scale (as cited in Tschannen-Moran,
Woolfolk Hoy, & Hoy, 1998) that measures efficacy for various contexts
(disciplinary efficacy, instructional efficacy, efficacy to influence decision making,
etc.). A newer version of this scale accompanies an article he wrote concerning how
to construct self-efficacy scales (Bandura, 2006).
Tschannen-Moran, Woolfolk Hoy, and Hoy
In 1998, Tschannen-Moran, Woolfolk Hoy and Hoy brought together the
existing lines of research, proposing an integrated model (Figure 5) that shows that
teacher efficacy has a cyclical nature. The sources of efficacy information (mastery
experience, vicarious experience, social persuasion, physiological arousal) inform
cognitive processes, which are used to both analyze the teaching task (which
involves outcome expectancies) and assess personal teaching competence. This
information informs a sense of teaching efficacy, which leads to certain teacher
behaviors and attitudes that affect performance, providing new sources of efficacy
information.
Rather than delineate GTE and PTE, this model describes teacher efficacy as
informed by consideration of the teaching task and context (constraints and
resources alike) and consideration of personal strengths and weaknesses in the
particular context. While GTE measures beliefs about teaching in general, this model
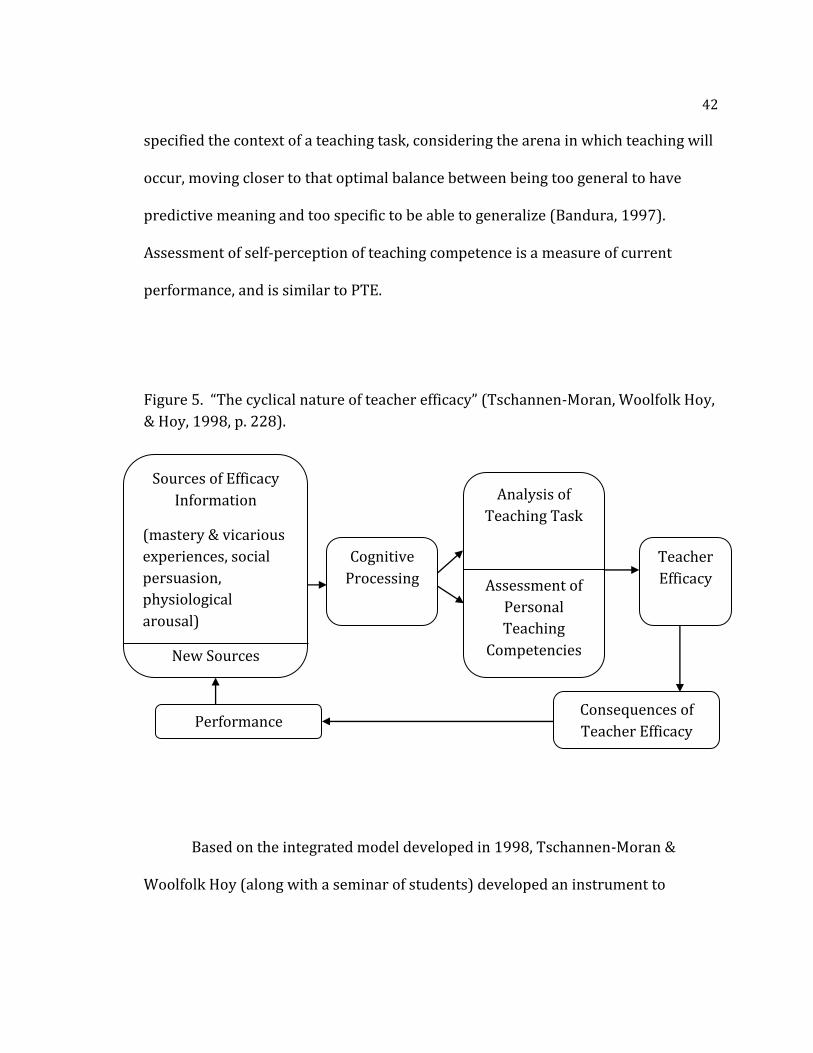
42
specified the context of a teaching task, considering the arena in which teaching will
occur, moving closer to that optimal balance between being too general to have
predictive meaning and too specific to be able to generalize (Bandura, 1997).
Assessment of self-perception of teaching competence is a measure of current
performance, and is similar to PTE.
Figure 5. “The cyclical nature of teacher efficacy” (Tschannen-Moran, Woolfolk Hoy,
& Hoy, 1998, p. 228).
Based on the integrated model developed in 1998, Tschannen-Moran &
Woolfolk Hoy (along with a seminar of students) developed an instrument to
Analysis of
Teaching Task
Assessment of
Personal
Teaching
Competencies
Sources of Efficacy
Information
(mastery & vicarious
experiences, social
persuasion,
physiological
arousal)
New Sources
Performance Consequences of
Teacher Efficacy
Cognitive
Processing
Teacher
Efficacy
43
measure teacher efficacy that would improve on the existing measures. They started
with Bandura’s unpublished teacher-efficacy measure, selecting items that were
most relevant and adding more, then narrowing down the collected pool and field
testing varying formats. The result was the OSTES (Ohio State Teacher Efficacy
Scale), which is now called the Teachers’ Sense of Efficacy Scale (TSES), in long (24
items) or short form (12 items). This scale sought to better capture both internal
and external components that make up teacher efficacy, making the measure
optimally specific to actual teaching (Tschannen-Moran & Woolfolk Hoy, 2001).
Teacher efficacy is studied so that educators and researchers can discover
ways to improve school functioning. This model and measure defines the current
understanding of teacher efficacy, so the remainder of this section will elaborate on
components within that model, focusing on the development and effects of teacher
efficacy.
Sources of Teacher Efficacy
Within the context of education, the four sources of self-efficacy (mastery
experiences, vicarious experiences, social persuasion, and physiological arousal),
contribute to teacher efficacy as well, and can be seen in the ways the teachers are
prepared for, introduced to, and supported within their professional work. The
cognitive processing of information from these sources influences how teachers
perceive both task demands and personal competencies (Tschannen-Moran et al.,
1998). Teacher education programs are built to provide as much efficacy-building
44
information as possible before professional service, so that novice teachers are as
prepared and as confident as they can be. For this reason, the descriptions of the
four sources will be framed within the context of teacher preparation.
Mastery Experiences
It is by teaching that a person understands how learned skills and behaviors
affect the instructional setting. Strengths and weaknesses can be weighed according
to their use in practice, so mastery experience is the most powerful source of
efficacy information (Tschannen-Moran et al., 1998). For preservice teachers, time
spent in the classroom and in teaching settings, assisting, tutoring, and managing
while receiving support and scaffolding, adds to the collection of mastery
experiences. However, it is not until student teaching and initial professional
teaching that a teacher is able to accumulate authentic, meaningful experiences.
Efficacy beliefs are strengthened substantially when success is achieved on difficult tasks with little assistance or when success is achieved early in learning with few setbacks; however, not all successful experiences encourage efficacy. For example, efficacy is not enhanced when success is achieved through extensive external assistance, relatively late in learning, or on an easy and unimportant task (Tschannen-Moran et al., 1998).
This implies that education majors should get into classrooms as soon as possible,
and those classrooms should be diverse, representing a wide range of experiences,
so that they can collect supported, easy successes that will give them the confidence
to open themselves up to a variety of teaching situations. Teachers in the field
develop efficacy in their particular contexts by applying their capabilities to the task
45
at hand and then experiencing the impact of those skills (Tschannen-Moran et al.,
1998).
Emotional and Physiological Cues
Another reason to collect as many preservice experiences as possible is to get
comfortable in situations that are initially perceived as stressful or threatening. A
person’s physiological response to experiences informs their beliefs about
capabilities. Information from the body, such as increased heart rate, sweaty palms,
nausea, shallow breathing, trembling, and a fluttering stomach, can be perceived
positively or negatively, and this cognitive processing contributes to a teacher’s
beliefs about capability and functioning. Some teachers feel comfortable in front of a
classroom full of fourth graders, but ill at ease with adults. Likewise, a high school
teacher may be terrified at the thought of being in charge of kindergarteners.
Teachers who have never had experience in inner city schools may believe the
teaching task too stressful or threatening, and so avoid it, just as a teacher who is
afraid of confrontation may avoid positions of leadership and oversight. Clients in
therapy may work to overcome fear responses through exposure therapy, in which
a client experiences a feared object in increasingly interactive ways, while in a safe
and relaxing environment, thereby building efficacy as anxiety is reduced or
managed (Bandura, 1977). In the same way, teachers learn to lessen or manage
their own physiological responses by experiencing stressful situations, monitoring
their levels of anxiety, and seeing if they can overcome their own emotional
46
responses and be successful. When teacher candidates experience challenging
situations before they are actually responsible for teaching, they are able to lessen
their fear responses, enabling them to gradually take on more responsibilities.
Vicarious Experiences
Within the preservice experience, teacher candidates begin to build mastery
and interpret physiological cues while observing professionals in action. These
observations provide vicarious experience, so that a person comes to identify with
the teacher role, imagining life as an educator.
Models of successful teachers are the basis for deciding that the teaching task is manageable and that situational and personal resources are adequate. Watching others teach in skillful and adept ways- especially observing admired, credible, and similar models-can affect the observer’s personal teaching competence (Tschannen-Moran et al., 1998, p. 230).
In order to build teacher efficacy before authentic mastery experiences are
available, it is important for candidates to begin to see themselves as successful
teachers. Watching others succeed can build efficacy beliefs, which can then impact
a candidate’s willingness to try and therefore collect mastery experiences and
reduce anxiety levels. Tschannen-Moran and her colleagues point out, however, that
vicarious experience helps a candidate assess a teaching task, but does not influence
self-perceptions of teaching competence as much (1998).
Social Persuasion
Because of the vicarious nature of teacher preparation programs, it is crucial
to supplement observational learning with as many authentic experiences as
47
possible, all the while providing specific and helpful feedback about strengths and
weaknesses. Just as a coach provides encouragement and feedback to refine athletic
performance, experts, supervisors, and peers can provide valuable information
about how a teacher’s capabilities match contextual demands (Tschannen-Moran et
al., 1998). Out of context, social persuasion is not as powerful because it can seem
contrived or false, but when capable others talk honestly about a candidate’s
potential for success, that feedback can serve to build the efficacy needed to attempt
increasingly challenging tasks. Within schools, encouragement, support, and
feedback from administrators, mentors, and peers can bolster teacher efficacy,
especially when challenging situations threaten a teacher’s beliefs about personal
capability, or the demands of a teaching task seem difficult to surmount.
Cognitive Processing of Efficacy Information
Information from the four sources must be cognitively processed, and the
resulting perceptions of that information will influence how the teaching task is
analyzed and how personal capabilities are assessed (Tschannen-Moran et al.,
1998). How a person weighs and considers efficacy information will depend on
personal variables, such as biases, attention, perceived control, and levels of
optimism, which act as filters, making some messages about capability more salient
than others. For example, watching another teacher successfully interact with a
group of students may not provide the vicarious experience that can build efficacy if
the observer doesn’t feel that his or her context is similar enough. Similarly, if a
48
person carries biases concerning the behavior of certain groups of students, that
teacher’s own physiological or emotional signals may obscure the potential for
success. On the other hand, overconfidence in one’s abilities as a teacher may lead a
person to disregard negative feedback or constructive criticism. Also, as a teacher
progresses through a career, the sources take on changing levels of significance.
When a task is seen as routine…there is little active analysis of the task, and efficacy is based on memories of how well the task has been handled in the past. Prospective or inexperienced teachers, however, rely more heavily on their analysis of the task and on vicarious experience (what they believe other teachers could do) to gauge their own likely success, that is, their efficacy in the given situation (Tschannen-Moran et al., 1998, p. 234).
Once established, teaching efficacy appears to be fairly stable, but efforts to increase
efficacy can be successful and beneficial. Tschannen-Moran and colleagues (1998)
suggest the following ways to build efficacy in teachers:
Warn teachers that implementation of innovation seems to initially weaken
efficacy, but as teachers adjust to changes, and begin to see improvements in
student learning, efficacy improves once again (Ross, 1998).
Provide specific feedback about performance and opportunities to develop
new skills.
Teachers should work collaboratively to analyze their task requirements,
identifying needed skills and components.
Those in leadership need to help teachers feel more control over their
professional lives by highlighting the effort and planning that led to positive
results.
49
The Sources as Antecedents in Research
Numerous studies have examined how the sources of efficacy information
combine to act as antecedents to teacher efficacy. The use of microteaching
(teaching a mini-lesson to peers) for preservice post-graduate teachers in Australia
increased personal teacher efficacy and teacher efficacy in classroom management
(Mergler & Tangen, 2010). Research examining the effects of student teaching have
found that while GTE decreases during the internship (Parker & Guarino, 2001),
beliefs about personal teaching efficacy increase (Knoblauch & Woolfolk Hoy, 2008).
This increase in efficacy can be followed by a significant decrease during the first
professional year, perhaps warranting an increase in social persuasion (Woolfolk
Hoy & Spero, 2005). Novice teachers, who have not yet collected many mastery
experiences, rely on contextual factors (resources and support) to inform self-
efficacy beliefs (Tschannen-Moran & Woolfolk Hoy, 2006). Professional efficacy is
nurtured when teachers are provided with an organization design that affords
teachers some control and a supportive social system (Hemric, Eury, & Shellman,
2010), and when provided with appropriate professional development and coaching
(Cantrell & Hughes, 2008).
Effects on Functioning
In the same way that self-efficacy influences human functioning, teacher
efficacy has an influence on what goes on in the classroom. It has been connected to
student achievement (Armor et al., 1976; Berman et al., 1977; Ashton et al., 1983;
50
Ross, 1992; da Costa, 1995;), teaching approaches (Woolfolk & Hoy, 1990; Witcher
et al., 2002), classroom and school decision making (Moore & Esselman, 1992),
teacher burnout (Skaalvik & Skaalvik, 2007), professional commitment (Ross &
Gray, 2006; Ware & Kitsantas, 2007),and collective teacher efficacy (Fives & Looney,
2009; Skaalvik & Skaalvik, 2007).
Teacher efficacy has also been connected to grade level (Moore & Esselman,
1992), which could be considered a contextual variable. The desire to connect
efficacy to other contextual and school level variables, such as socioeconomic status
and leadership in a school, required consideration of the unit of analysis. Even the
connection between teacher efficacy and student achievement presents problems,
as it is challenging to talk about a school’s achievement in terms of individual
teachers’ efficacy. This led to the study of collective teacher efficacy. The next
sections will explain collective efficacy in general terms, and then apply the concept
to school functioning.
Collective Efficacy
Rooted in self-efficacy, collective efficacy is “a group’s shared belief in the
conjoint capabilities to organize and execute the courses of action required to
produce given levels of attainment” (Bandura, 1997, p. 477). It is an emergent
group-level property, reflecting the belief in the group’s power to accomplish its
goals (Bandura, 1997, 2001). It is predictive of group performance (Bandura, 1993)
51
in a variety of settings, including schools, athletic teams, and organizations
(Bandura, 1997).
Together, people can accomplish that which one person cannot. Social action
depends on the belief that a group can effect change. Collective efficacy helps people
realize their shared destiny, enabling agency at the group level. (Bandura, 1997,
2000).
Measurement
There are two conceptually different ways to measure perceived collective
efficacy: aggregation of individuals’ beliefs about their own personal efficacies to
accomplish group goals, or aggregation of members’ beliefs about the group’s ability
to accomplish group goals (Bandura, 1997, 2000). If the collective activity consists
of the sum of independent successes, as it does for a track and field team, then it is
preferable to measure and aggregate the personal efficacies of the actors. When an
entire group must interact, like a basketball team would, and collective activity is
the product of cooperative work, then it makes more sense to measure group
members’ beliefs about what the team can accomplish. In either case, the dynamics
of a group and the efficacies of individuals share an interdependence. This can
create an analytical challenge, as “individual-level controls can inadvertently
remove most of the emergent social properties” (Bandura, 1997, p. 479).
Nevertheless, when measuring group level functioning, it is wise to employ group
level variables.
52
Influences on Human Functioning
Collective efficacy develops as self-efficacy does, and has similar effects.
Shared beliefs about collective efficacy influence the kinds of future outcomes
sought through collective action, resource use, amount of effort expended,
endurance in the face of difficulty, and level of vulnerability (Bandura, 1997, 1998,
2000). When a group feels that success is attainable through their collective efforts,
then performance improves, while organizations that lack efficacy are met with less
success. As our society changes, collective efficacy is challenged- it becomes difficult
to envision that the human race, together, can accomplish collective goals when
people are split into factions, global problems seem insurmountable, and decision
making power, ceded by proxy to leaders, seems too far out of reach (Bandura,
2001). “Social efforts to change lives for the better require merging diverse self-
interests in support of common core values and goals. Disagreements among
different constituencies create additional obstacles to successful collective action”
(Bandura, 1998, p. 68).
Gully, Incalcaterra, Joshi, & Beaubien (2002) used meta-analysis to examine
the relationship between collective efficacy in the workplace (called team-efficacy
by the authors) and its relationship with team performance, finding that team
efficacy was positively related to performance, with stronger effect sizes at the team
rather than individual level and when interdependence was high.

53
Numerous studies of the effects of naturally developed collective efficacy
have been conducted in educational systems, business organizations, athletic teams,
combat teams, and urban neighborhoods. “The findings taken as a whole show that
the higher the perceived collective efficacy, the higher the groups’ motivational
investment in their undertakings, the stronger their staying power in the face of
impediments and setbacks, and the greater their performance accomplishments”
(Bandura, 2000, p. 78). When groups believe that they can achieve great things, they
are spurred to action, and can be a powerful force for change in companies,
communities, and schools.
Collective Teacher Efficacy
When efficacy is considered at the school level, it is an organizational
property reflecting beliefs about the capability of the school to achieve its goals.
Since teachers interact and collaborate within schools with varying degrees of
success, it is valuable to examine efficacy at both the individual and collective levels.
Groundwork
As the construct of teacher efficacy was being explored, some researchers
began to examine the organizational properties of schools, realizing that individual
teacher beliefs and behaviors were not enough to satisfactorily explain school level
functioning. Chubb (1988) called for a school level focus, saying,
School performance is unlikely to be significantly improved by any measure or set of measures that fails to recognize that school are institutions-
54
complex organizations composed of independent parts, governed by well-established rules and norms of behavior, and adapted for stability. Their influence on learning does not depend on any particular educational practice, on how they test or assign homework or evaluate teaching, but rather on their organization as a whole, on their goals, leadership, followership, and climate (p. 29).
His research found that high and low performance schools differed very little in
classroom practices, and formal structures were very similar. Distinctions were
evident in student bodies and informal organization: when leadership is strong,
expectations are high, and authority is delegated to the classroom, students perform
at higher levels. In 1989, Newmann, Rutter, and Smith found that teacher efficacy,
aggregated to the collective level, is influenced by school organizational features,
such as responsiveness of administrators, teacher collaboration, encouragement of
innovation, and orderly student behavior. Tschannen-Moran et al. (1998)
recognized the contagiousness of a low sense of efficacy in schools and the resultant
demoralization.
Schools where teachers’ conversations dwell on the insurmountable difficulties of educating students are likely to undermine teachers’ sense of efficacy. Schools where teachers work together to find ways to address the learning, motivation, and behavior problems of their students are likely to enhance teachers’ feelings of efficacy (p 221).
The literature on teacher efficacy demonstrates a connection to student
achievement, so the next step was to explore how collective teacher efficacy helps
explain the effect of schools on student achievement, contributing to our
understanding of the ways in which schools differ (Goddard, 1998).
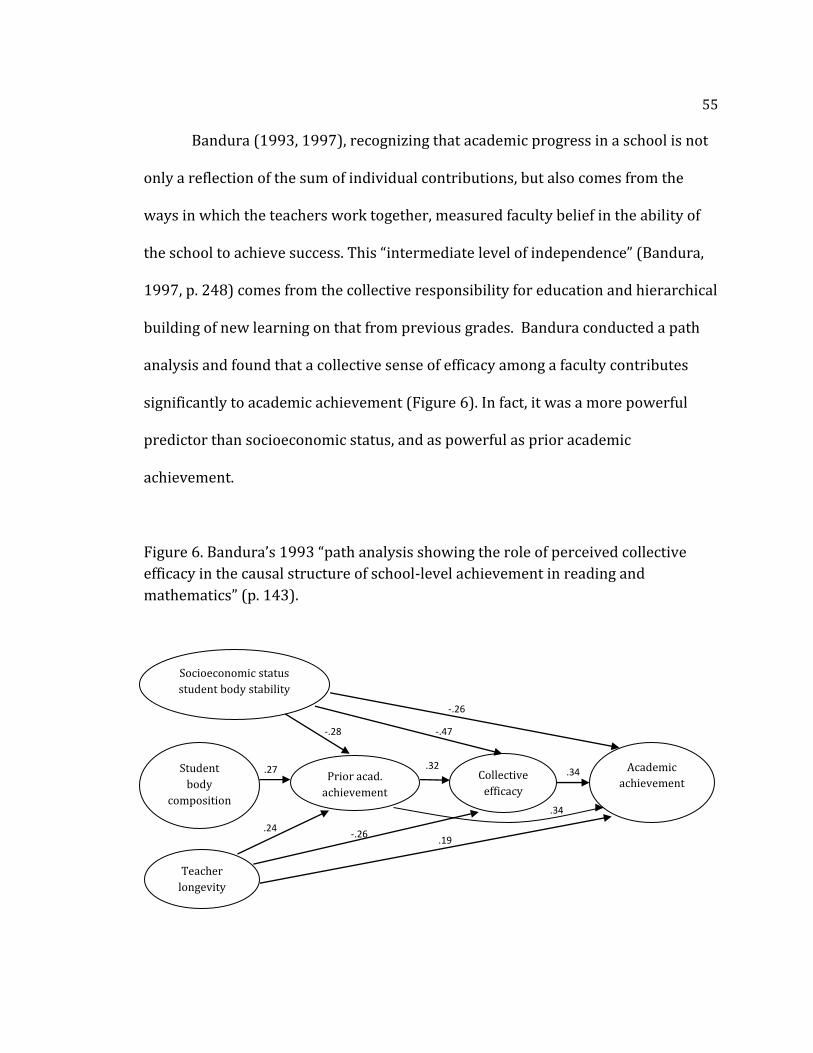
55
Bandura (1993, 1997), recognizing that academic progress in a school is not
only a reflection of the sum of individual contributions, but also comes from the
ways in which the teachers work together, measured faculty belief in the ability of
the school to achieve success. This “intermediate level of independence” (Bandura,
1997, p. 248) comes from the collective responsibility for education and hierarchical
building of new learning on that from previous grades. Bandura conducted a path
analysis and found that a collective sense of efficacy among a faculty contributes
significantly to academic achievement (Figure 6). In fact, it was a more powerful
predictor than socioeconomic status, and as powerful as prior academic
achievement.
Figure 6. Bandura’s 1993 “path analysis showing the role of perceived collective
efficacy in the causal structure of school-level achievement in reading and
mathematics” (p. 143).
Student
body
composition
Prior acad.
achievement
Collective
efficacy
Academic
achievement
Socioeconomic status
student body stability
Teacher
longevity
-.26
-.47 -.28
.27
.24 -.26
.19
.34
.32 .34
56
Bandura also found that collective efficacy changes across grade levels,
starting low for kindergarten teachers, increasing in the primary grades, and then
decreasing as children enter the middle grades (1997).
Definition of a Construct
Building on Bandura’s self-efficacy (1997) and teacher efficacy from
Tschannen-Moran et al. (1998), Goddard and his colleagues (Goddard, 1998;
Goddard, Hoy, & Woolfolk Hoy, 2000, 2004) explored how best to describe and
measure collective teacher efficacy, as they investigated its connection with student
achievement. Collective teacher efficacy (CTE) is an emergent group level property,
a “product of the interactive dynamics of group members” (Goddard et al., 2000, p.
482). It represents a teachers shared perceptions about the functioning of the school
as a whole, and is associated with persistence, level of effort, stress levels, tasks,
shared thoughts, and group achievement (Goddard, 1998). At the school level,
human agency becomes organizational agency, as “schools act purposively in
pursuit of their educational goals” (Goddard et al., 2000, p. 483).
Operationalization
In order to operationalize the perceived collective efficacy of teachers,
Goddard developed an instrument to measure CTE, based on Gibson and Dembo
(1984), adapted to fit the theoretical model of teacher efficacy developed by
Tschannen-Moran, Hoy and Woolfolk Hoy (1998), and further modified to address
group, rather than individual orientation. The resulting measure included items that
57
assessed group competence (GC) and task analysis (TA) in both negative (-) and
positive (+) ways (Goddard, 1998; Goddard et al., 2000). Sample items include:
Teachers in this school are well prepared to teach the subjects they are assigned to teach (GC+). Teachers here don’t have the skills needed to produce meaningful student learning (GC-). The opportunities in this community help ensure that these students will learn (TA+). The lack of instructional materials and supplies in this school makes teaching very difficult (TA-). (Goddard et al., 2000, p. 488).
This represented a significant change, because, with the exception of Bandura’s
1993 study, previous research aggregated individual teaching efficacy to the school
level and did not examine collective teacher efficacy. Later research by Goddard and
LoGerfo (2007) supported the decision to look to the collective, finding that
variability in group goal attainment is best described when group members are
asked questions about group processes, as opposed to aggregating beliefs about
personal ability. Additionally, the choice to word items both positively and
negatively improved upon Gibson and Dembo’s instrument (1984), which only
included GC- or TA+ items (Goddard, 1998).
Pilot testing of the new instrument provided “evidence that collective teacher
efficacy is a single construct uniting the concepts of group competence and task
analysis” (Goddard, 1998, p. 78). Tests for criterion-related validity demonstrated
that the construct of collective teacher efficacy is negatively related to conflict in
schools and teacher powerlessness, but positively related to trust in colleagues and
58
teacher efficacy (Goddard, 1998; Goddard et al., 2000). A reliability of .96 was found
for the final version of the collective teacher efficacy scale (Goddard, 1998).
Instead of aggregating student-level variables to the school level, Goddard’s
study used hierarchical linear modeling to analyze “only the portion of variance in
student characteristics that occurs between schools” (Goddard et al., 2000, p. 498).
He found that in the 47 elementary schools studied, CTE explained between one-half
and two-thirds of the between schools variance in student achievement for math
and reading, and that student achievement was affected more by collective efficacy
beliefs than by race or SES (Goddard, 1998; Goddard et al., 2000).
A modified version of the CE SCALE was created by Goddard (2002b), and
contained 12 items, instead of 21. In this more parsimonious version, all four
categories (GC+, GC-, TA+, and TA-) are represented in equal proportion. In his
validity testing, Goddard found that scores on the long and short versions were
highly correlated (r=0.983), and that the short form positively predicts between-
school variability for student achievement in math (Goddard, 2002b).
Model
In 2004, Goddard, Hoy, and Woolfolk Hoy developed a model to describe the
development and power of collective efficacy in schools (Figure 7). The model, an
adaptation of the teacher efficacy model (Tschannen-Moran et al., 1998), is cyclical
and shows how collective efficacy has the potential to grow through use because of
reciprocal causality.
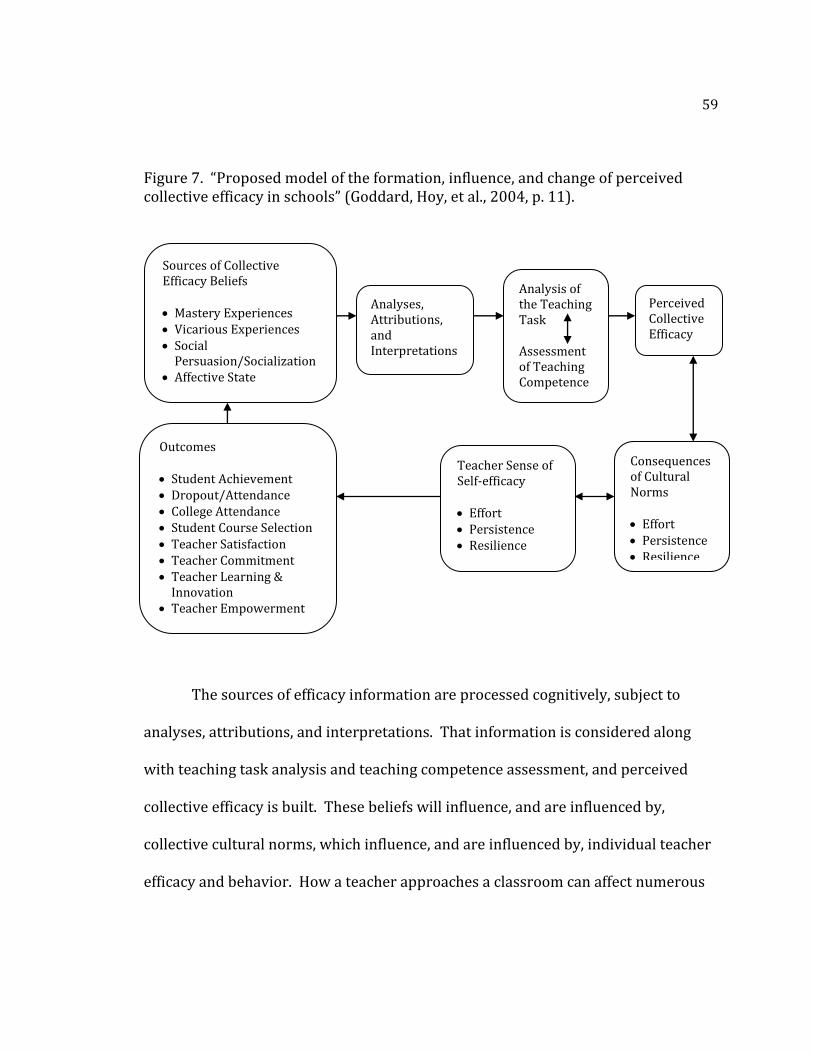
59
Figure 7. “Proposed model of the formation, influence, and change of perceived collective efficacy in schools” (Goddard, Hoy, et al., 2004, p. 11).
The sources of efficacy information are processed cognitively, subject to
analyses, attributions, and interpretations. That information is considered along
with teaching task analysis and teaching competence assessment, and perceived
collective efficacy is built. These beliefs will influence, and are influenced by,
collective cultural norms, which influence, and are influenced by, individual teacher
efficacy and behavior. How a teacher approaches a classroom can affect numerous
Sources of Collective Efficacy Beliefs Mastery Experiences Vicarious Experiences Social
Persuasion/Socialization Affective State
Outcomes Student Achievement Dropout/Attendance College Attendance Student Course Selection Teacher Satisfaction Teacher Commitment Teacher Learning &
Innovation Teacher Empowerment
Analyses, Attributions, and Interpretations
Analysis of the Teaching Task Assessment of Teaching Competence
Perceived Collective Efficacy
Consequences of Cultural Norms Effort Persistence Resilience
Teacher Sense of Self-efficacy Effort Persistence Resilience
60
outcomes, including student achievement and teacher behavior. These outcomes
then provide new sources of efficacy, so the cycle repeats.
Antecedents
The cyclical nature of the model presented by Goddard, Hoy, et al. (2004)
suggests that CTE is malleable and can be influenced by previous events. Some of
the current CTE research examines antecedents to see what contributes to the
development of CTE. Bandura’s four sources of efficacy still apply, this time at the
collective level (Goddard et al., 2000; Goddard, Hoy, et al., 2004).
Mastery experiences refer to success and failures that teachers feel as a
whole group. While failures can undermine CTE, resilience comes from persistent
effort to overcome challenges.
Vicarious experiences are provided when schools look to other schools as
examples of how to succeed, and when research about the characteristics of
exemplary schools provides models for schools that struggle.
Social persuasion takes the form of professional development, workshops,
feedback, etc. This also includes socialization into a faculty, as new faculty members
in a school with high collective efficacy learn that success is the norm, and that they
are expected to rise to that challenge. “Collective efficacy beliefs serve to encourage
certain actions and constrain others” (Goddard, Hoy, et al., 2004, p. 9).
Affective states at the organizational level are evident in a group’s
interpretation of stress and challenge. “Efficacious organizations can tolerate
61
pressure and crises and continue to function without severe negative consequences;
in fact, they learn how to adapt and cope with disruptive forces” (Goddard et al,
2000, p. 484), while less efficacious organizations respond dysfunctionally to stress.
A majority of the research examines the predictive power of these
antecedents. It can be difficult to separate the effects of each of the four sources, and
the research reflects that, often conceptualizing them together. Mastery experiences
operationalized as prior academic achievement have been found to be predictive of
CTE (Goddard, 2001; Goddard & Goddard, 2001; Goddard, LoGerfo, & Hoy, 2004;
Ross, Hogaboam-Gary, & Gray, 2004). Ross, Hogaboam-Gray and Gray (2004) found
that school processes designed to promote teacher ownership (addressing all four
efficacy sources) was an even better predictor of CTE than prior academic
achievement. Academic press, another combination of the four sources, was also
found to contribute to CTE (Hoy, Sweetland, & Smith, 2002; Hoy, Smith, &
Sweetland, 2002).
Some studies attempt to change collective efficacy. Cantrell & Hughes (2008)
found that professional development (potentially addressing all four sources) and
coaching (social persuasion) for teaching literacy improved CTE, but Zambo and
Zambo (2008) found that mathematics professional development increased
competence, but not CTE- despite improvements in their own skills, teachers’
confidence in one another remain unchanged.
62
The 2004 model indicates that the four sources provide information from the
past that is cognitively processed and brought to bear when a faculty analyzes the
present teaching task and assesses teaching competence. Administrators can work
to improve CTE by providing access to the four sources of efficacy and by addressing
both task demands and personal competence (Goddard et al., 2000).
Contextual Variables
Adams and Forsythe (2006) labeled Bandura’s four sources as remote
efficacy sources and looked at task analysis and assessment of competence as
proximate efficacy sources. Analyzing the teaching task includes consideration of
present contextual variables of the teaching environment, such as availability of
resources; student and faculty demographics; bureaucratic structures; physical
conditions of schools; school size; and school level. These variables affect a teachers’
ability to teach and students’ ability to learn. While the four sources occurred in the
past, these contextual conditions are ongoing in a teacher’s present, influencing the
teaching tasks. Adams and Forsythe suggest that a locus of control perspective be
reintroduced into the social-cognitive understanding of efficacy sources, so that
contextual variables that can hinder or enable efficacy are not overlooked. This
return to the two strands of efficacy research would incorporate questions of
internal and external control to the analysis of the teaching task. Their
hypothesized model of perceived CTE has both remote and proximate sources of
efficacy information cognitively processed to inform CTE (Figure 8).
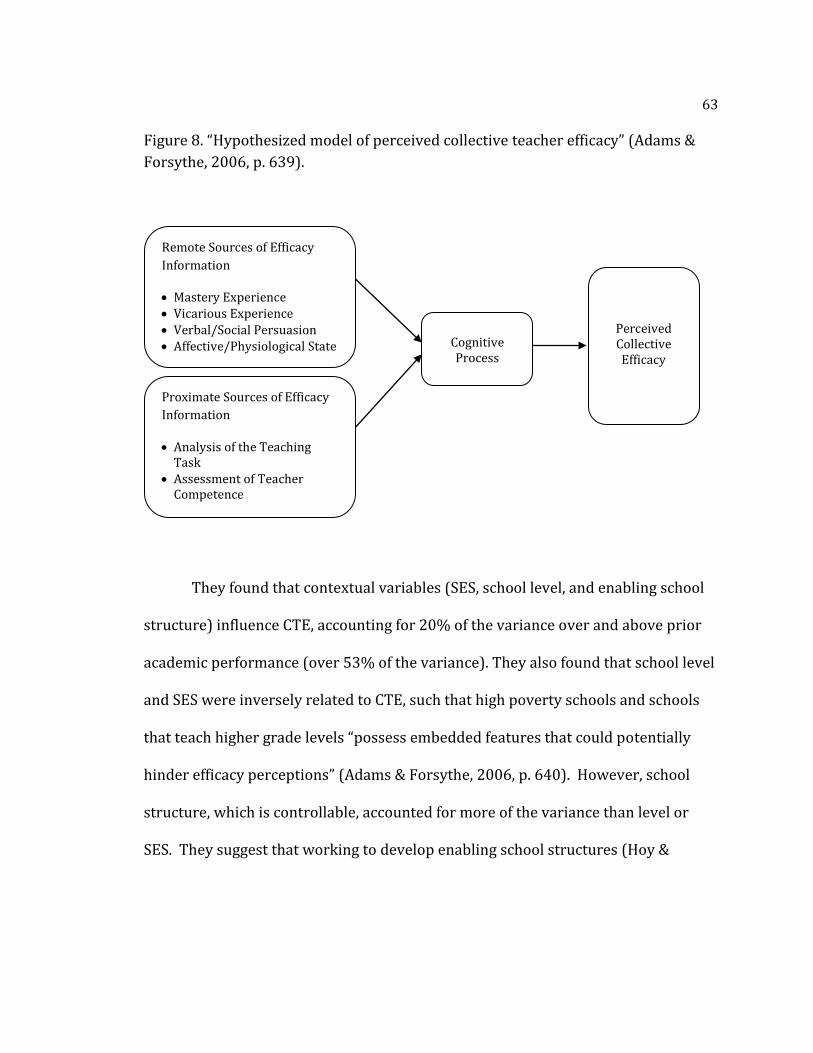
63
Figure 8. “Hypothesized model of perceived collective teacher efficacy” (Adams &
Forsythe, 2006, p. 639).
They found that contextual variables (SES, school level, and enabling school
structure) influence CTE, accounting for 20% of the variance over and above prior
academic performance (over 53% of the variance). They also found that school level
and SES were inversely related to CTE, such that high poverty schools and schools
that teach higher grade levels “possess embedded features that could potentially
hinder efficacy perceptions” (Adams & Forsythe, 2006, p. 640). However, school
structure, which is controllable, accounted for more of the variance than level or
SES. They suggest that working to develop enabling school structures (Hoy &
Remote Sources of Efficacy
Information
Mastery Experience Vicarious Experience Verbal/Social Persuasion Affective/Physiological State
Proximate Sources of Efficacy
Information
Analysis of the Teaching Task
Assessment of Teacher Competence
Cognitive Process
Perceived Collective Efficacy
64
Sweetland, 2000, 2001) can improve the CTE of a school by promoting the kinds of
social interactions that can provide efficacy information.
Other researchers have found connections between CTE and what could be
called proximate sources of efficacy. The inverse relationship between CTE and SES
is well-established (Bandura, 1993; Parker, 1994; Goddard & Goddard, 2001;
Goddard, LoGerfo, et al., 2004), but not inevitable: Goddard and Skrla (2006) found
that in the particular urban school they studied, percentage of minority students
and rate of poverty were not related to CTE, instead teachers’ race and years of
experience were important. They suggest that perhaps researchers should examine
how school leaders can “create conditions that counter institutionalized deficit
thinking” (p. 231). Tschannen-Moran & Barr (2004) also found no correlation
between CTE and SES in their study of Virginia schools.
The leadership style of administrators contributes to the environment of a
school, and thus would be considered within the analysis of the teaching task.
Schools with transformational leadership, in which members are intellectually
stimulated and valued, and a vision is identified and sustained (Ross & Gary, 2006a)
tend to have higher levels of CTE (Ross & Gray, 2006a, 2006b; Dussault, Payette, &
Leroux, 2008).
School culture and context are often a reflection of cultural norms of a nation
or country. For this reason, CTE needs to be researched internationally. Schecter
and Tschannen-Moran (2006) worked to develop an Israeli version of the Collective
65
Teacher Sense of Efficacy Scale (Tschannen-Moran & Barr, 2004), and two very
recent studies are exploring cross-cultural differences in collective teacher efficacy
(Chong et al. 2010; Klassen et al., 2010).
Bidirectionality
In the 2004 model, the relationship between perceived collective efficacy and
the consequences of cultural norms is bidirectional. CTE influences cultural norms
when belief leads to action: “We believe we can be successful, so we behave this
way.” Cultural norms influence CTE when action transforms belief: “We behave this
way, therefore, we believe we will be successful.” The collective beliefs of teachers
about the potential for successfully functioning at their school create a climate of
high expectations at one end, or futility at the other.
If a faculty holds high expectations for success, then their behavior will
reflect that. Teachers will be more likely to put forth extra effort, persist in the face
of challenges, and show resilience to occasional failure. New faculty will be
introduced into an environment in which certain behaviors are expected. When the
norms for teacher behavior at a certain school call for certain courses of action that
lead to success, then CTE will increase.
A faculty that holds little confidence in their ability to promote successful
outcomes will not be as motivated to persist through difficulty, will show little
resilience when faced with failure, and will be less likely to put in extra effort in the
classroom. New faculty will see the behaviors of the existing faculty and may simply
66
conclude that since little is being done to promote achievement, there is little that
can be done, adopting the jaundiced view of the faculty’s collective efficacy.
The consequences of cultural norms at a school are also related reciprocally
to individual teacher efficacy. As teachers are socialized, learning a school’s norms
and expectations, they begin to see how they fit into the broad scheme. Do their
abilities measure up? Do they believe that they can achieve the kind of success that
the school expects? “The sense of collective efficacy in a school can affect teachers’
self-referent thoughts and, hence, their teaching performance and student learning”
(Goddard, Hoy, et al., 2004, p. 8). Collective and personal efficacy beliefs affect the
normative environment of a school as much as the environment affects beliefs.
The connection between collective and individual teacher efficacy has been
explored in the literature. A school’s success depends on both individual and group
efforts, and accomplishments in one may lead to accomplishments in the other.
Since collective mastery experiences come from successes of individual teachers, the
two constructs may vary together (Goddard et al., 2000). Individual and collective
efficacies have been found to be related and sometimes independent (Parker, 1994).
There are significant correlations between teacher efficacy and collective teacher
efficacy (Kurz & Knight, 2004; Fives & Looney, 2009). CTE is predictive of teacher
efficacy for management and enhancing social relationships between students (Lev
& Koslowsky, 2009), and predicts variation in teacher efficacy better than SES and
achievement (Goddard & Goddard, 2001).
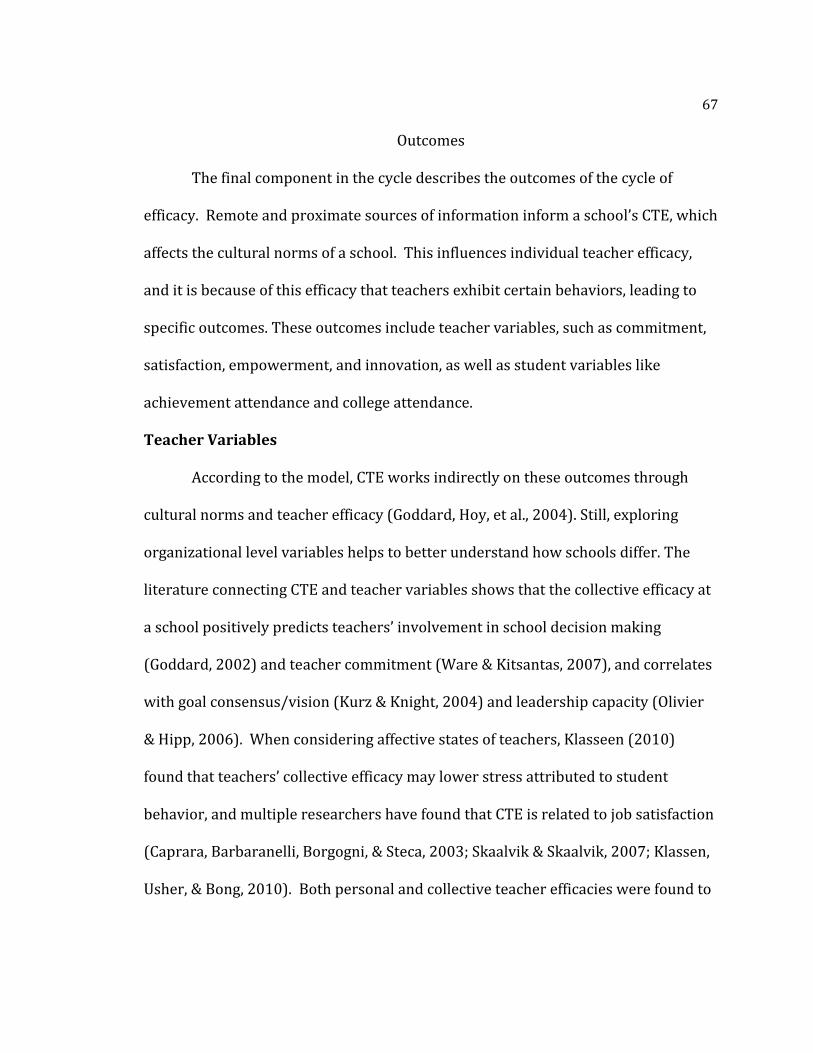
67
Outcomes
The final component in the cycle describes the outcomes of the cycle of
efficacy. Remote and proximate sources of information inform a school’s CTE, which
affects the cultural norms of a school. This influences individual teacher efficacy,
and it is because of this efficacy that teachers exhibit certain behaviors, leading to
specific outcomes. These outcomes include teacher variables, such as commitment,
satisfaction, empowerment, and innovation, as well as student variables like
achievement attendance and college attendance.
Teacher Variables
According to the model, CTE works indirectly on these outcomes through
cultural norms and teacher efficacy (Goddard, Hoy, et al., 2004). Still, exploring
organizational level variables helps to better understand how schools differ. The
literature connecting CTE and teacher variables shows that the collective efficacy at
a school positively predicts teachers’ involvement in school decision making
(Goddard, 2002) and teacher commitment (Ware & Kitsantas, 2007), and correlates
with goal consensus/vision (Kurz & Knight, 2004) and leadership capacity (Olivier
& Hipp, 2006). When considering affective states of teachers, Klasseen (2010)
found that teachers’ collective efficacy may lower stress attributed to student
behavior, and multiple researchers have found that CTE is related to job satisfaction
(Caprara, Barbaranelli, Borgogni, & Steca, 2003; Skaalvik & Skaalvik, 2007; Klassen,
Usher, & Bong, 2010). Both personal and collective teacher efficacies were found to
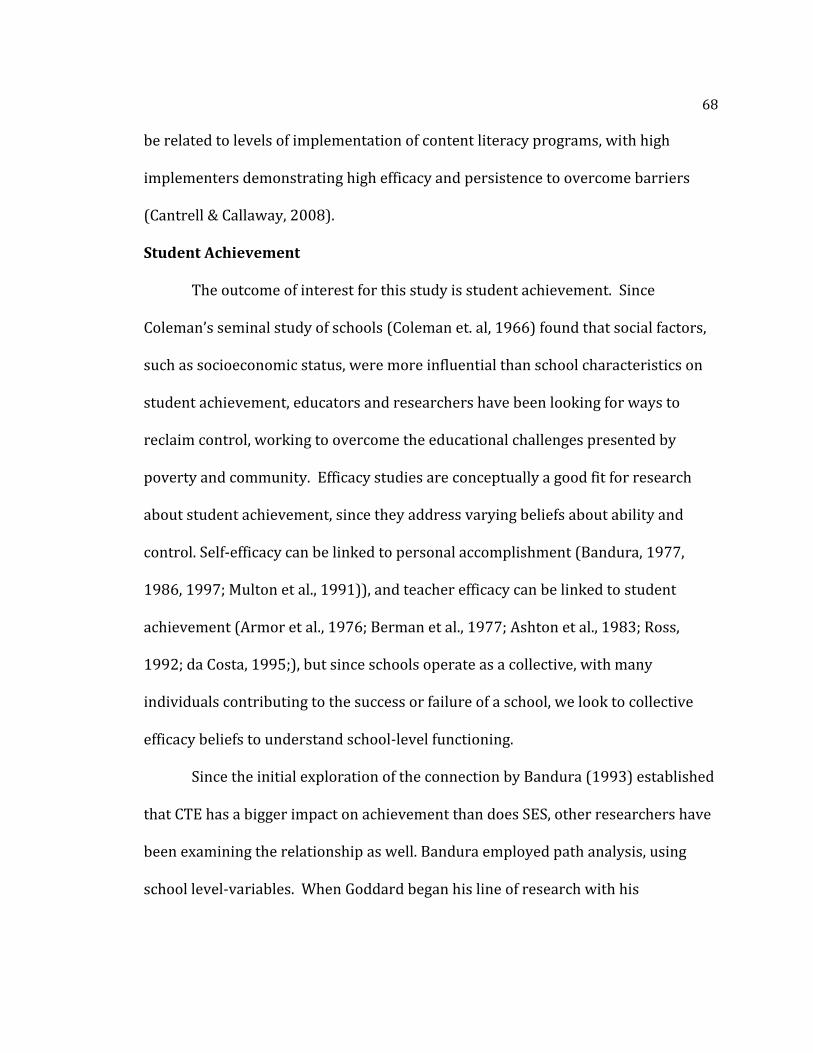
68
be related to levels of implementation of content literacy programs, with high
implementers demonstrating high efficacy and persistence to overcome barriers
(Cantrell & Callaway, 2008).
Student Achievement
The outcome of interest for this study is student achievement. Since
Coleman’s seminal study of schools (Coleman et. al, 1966) found that social factors,
such as socioeconomic status, were more influential than school characteristics on
student achievement, educators and researchers have been looking for ways to
reclaim control, working to overcome the educational challenges presented by
poverty and community. Efficacy studies are conceptually a good fit for research
about student achievement, since they address varying beliefs about ability and
control. Self-efficacy can be linked to personal accomplishment (Bandura, 1977,
1986, 1997; Multon et al., 1991)), and teacher efficacy can be linked to student
achievement (Armor et al., 1976; Berman et al., 1977; Ashton et al., 1983; Ross,
1992; da Costa, 1995;), but since schools operate as a collective, with many
individuals contributing to the success or failure of a school, we look to collective
efficacy beliefs to understand school-level functioning.
Since the initial exploration of the connection by Bandura (1993) established
that CTE has a bigger impact on achievement than does SES, other researchers have
been examining the relationship as well. Bandura employed path analysis, using
school level-variables. When Goddard began his line of research with his
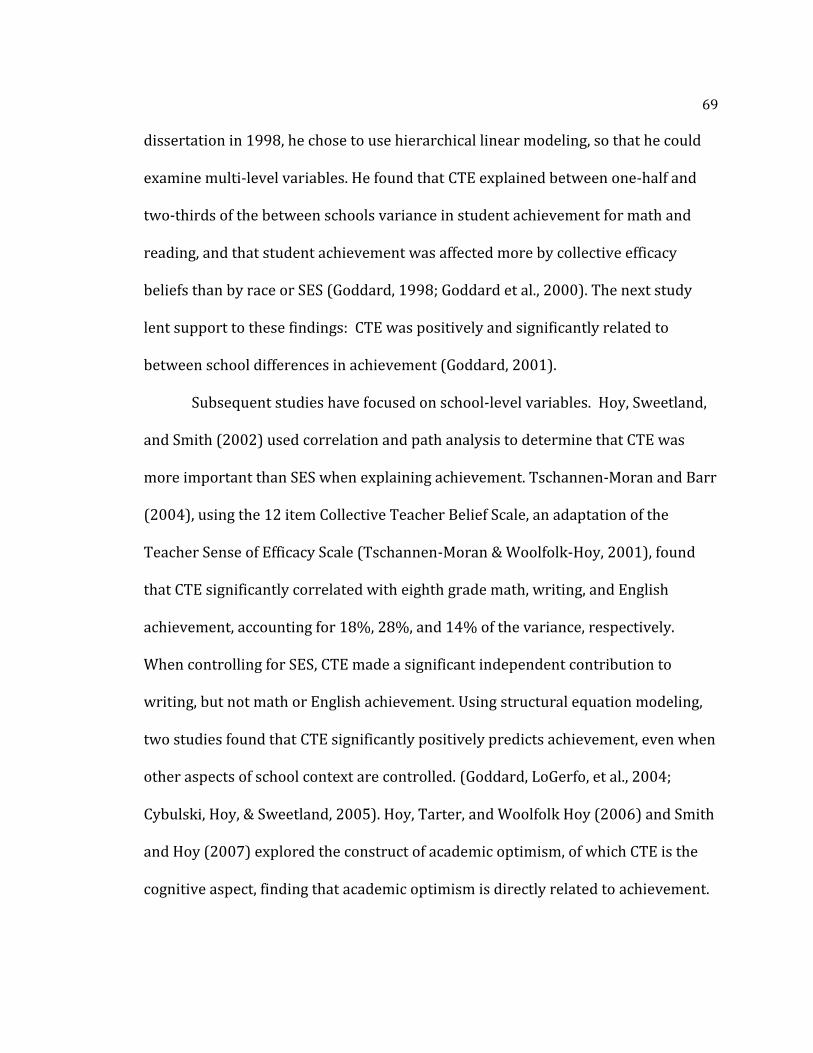
69
dissertation in 1998, he chose to use hierarchical linear modeling, so that he could
examine multi-level variables. He found that CTE explained between one-half and
two-thirds of the between schools variance in student achievement for math and
reading, and that student achievement was affected more by collective efficacy
beliefs than by race or SES (Goddard, 1998; Goddard et al., 2000). The next study
lent support to these findings: CTE was positively and significantly related to
between school differences in achievement (Goddard, 2001).
Subsequent studies have focused on school-level variables. Hoy, Sweetland,
and Smith (2002) used correlation and path analysis to determine that CTE was
more important than SES when explaining achievement. Tschannen-Moran and Barr
(2004), using the 12 item Collective Teacher Belief Scale, an adaptation of the
Teacher Sense of Efficacy Scale (Tschannen-Moran & Woolfolk-Hoy, 2001), found
that CTE significantly correlated with eighth grade math, writing, and English
achievement, accounting for 18%, 28%, and 14% of the variance, respectively.
When controlling for SES, CTE made a significant independent contribution to
writing, but not math or English achievement. Using structural equation modeling,
two studies found that CTE significantly positively predicts achievement, even when
other aspects of school context are controlled. (Goddard, LoGerfo, et al., 2004;
Cybulski, Hoy, & Sweetland, 2005). Hoy, Tarter, and Woolfolk Hoy (2006) and Smith
and Hoy (2007) explored the construct of academic optimism, of which CTE is the
cognitive aspect, finding that academic optimism is directly related to achievement.
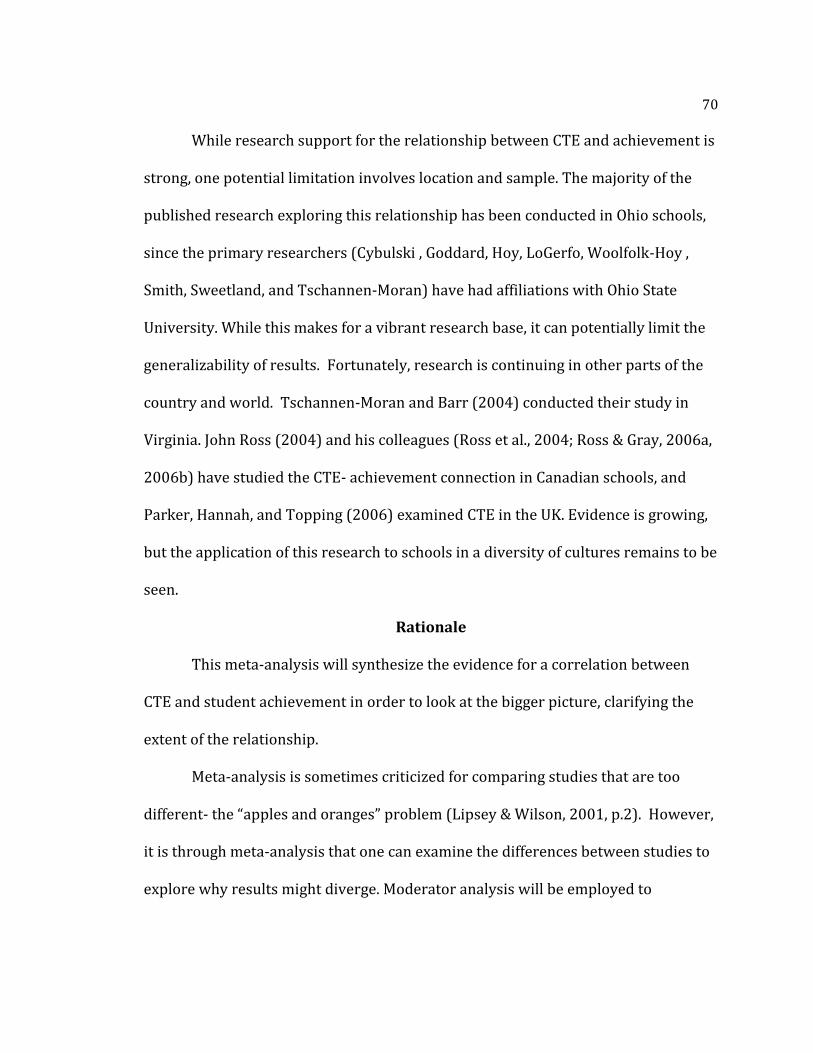
70
While research support for the relationship between CTE and achievement is
strong, one potential limitation involves location and sample. The majority of the
published research exploring this relationship has been conducted in Ohio schools,
since the primary researchers (Cybulski , Goddard, Hoy, LoGerfo, Woolfolk-Hoy ,
Smith, Sweetland, and Tschannen-Moran) have had affiliations with Ohio State
University. While this makes for a vibrant research base, it can potentially limit the
generalizability of results. Fortunately, research is continuing in other parts of the
country and world. Tschannen-Moran and Barr (2004) conducted their study in
Virginia. John Ross (2004) and his colleagues (Ross et al., 2004; Ross & Gray, 2006a,
2006b) have studied the CTE- achievement connection in Canadian schools, and
Parker, Hannah, and Topping (2006) examined CTE in the UK. Evidence is growing,
but the application of this research to schools in a diversity of cultures remains to be
seen.
Rationale
This meta-analysis will synthesize the evidence for a correlation between
CTE and student achievement in order to look at the bigger picture, clarifying the
extent of the relationship.
Meta-analysis is sometimes criticized for comparing studies that are too
different- the “apples and oranges” problem (Lipsey & Wilson, 2001, p.2). However,
it is through meta-analysis that one can examine the differences between studies to
explore why results might diverge. Moderator analysis will be employed to
71
investigate those factors that might explain variations. In this particular study, a
review of the literature reveals that multiple measures are used to assess CTE, and
that a majority of the research has been conducted in Ohio schools. Through meta-
analysis, one is able to determine if these variations do indeed make a difference in
effect size. Is this phenomenon exclusive to Ohio schools? Is it only apparent when
using a certain measure or when studied by certain researchers? Is the construct
conceptualized differently in the various studies? When these questions have been
answered, implications may emerge that can direct future research; influence
teacher education and mentoring; and provide suggestions about school structures
and leadership.
This study will synthesize various studies in order to provide an overall
effect size that quantifies the correlation between CTE and student achievement,
and will explore moderator variables that might affect that relationship. It will
analyze the current research, so that future directions may be determined.
Conclusion
In this chapter, the construct of collective teacher efficacy has been
introduced. From the theoretical framework of social cognitive theory, efficacy was
defined and then related to teachers so that it could then be understood as an
organizational property in schools. Collective beliefs about a school’s ability to
promote successful outcomes for students are powerful, in that they shape social
norms, and influence individual teacher as well as team behavior. When a school
72
demonstrates high levels of collective efficacy, students benefit, as their teachers
hold high expectations for success, persist in the face of difficulty, put in extra effort,
and show resilience. These teacher behaviors and the resulting school climate lead
to high student achievement. As the United States seeks to improve schools, and
increase achievement, part of the focus must be on collective teacher efficacy. It is
one of the biggest influences on student achievement, and, unlike school
demographic variables, such as student SES or neighborhood, which do not change
very easily, it can be influenced and changed, making it a potential key to school
improvement.
Having reviewed the pertinent literature, this chapter has provided the
background needed to conduct research that will clarify the relationship between
CTE and student achievement by meta-analyzing the results of all appropriate,
available studies.
73
CHAPTER 3
METHODS
After a brief introduction to the technique, and a reiteration of the research
questions, this chapter describes the methods for conducting the meta-analysis.
Following the guidelines for systematic review developed by the Campbell
Collaboration, this chapter will explain the following:
a. Criteria for inclusion and exclusion of studies in the review
b. Search strategy for identification of relevant studies
c. Description of methods used in the component studies
d. Criteria for determination of independent findings
e. Details of study coding categories
f. Statistical procedures and conventions
g. Treatment of qualitative research
(The Campbell Collaboration, 2001, p. 2).
Meta-Analysis
Beginning in the 1970s, meta-analysis has been used to synthesize research
results, using existing data to uncover patterns of findings in studies that purport to
assess the same or similar constructs (Lipsey & Wilson, 2001). Using meta-analysis,
this study synthesized data from all available studies that meet the inclusion
74
criteria, so that the relationship between collective teacher efficacy and student
achievement can be more fully understood.
Thorough and detailed procedures are explained so that the reader is aware
of how studies were selected, coded, and statistically analyzed. This systematic
approach is essential for conducting a meta-analysis that includes all available and
relevant information but does not muddy the waters with an overabundance of data
points that cannot be compared.
Research Questions
This meta-analysis addressed the following questions:
1. What is the distribution of the effect sizes measuring the relationship
between collective teacher efficacy and student achievement in the
literature?
2. How do the effect sizes of this relationship vary based on certain moderator
variables, such as school level, school location, type of study, instruments
used, or the researchers involved?
Hypotheses
The hypotheses for this study were derived from a review of the current
literature.
1. Collective teacher efficacy (CTE) will be strongly associated with student
achievement: The beliefs that teachers hold about the ability of the school as
75
a whole to promote positive outcomes will be predictive of positive learning
outcomes for their students.
2. Between studies variance will be explained by moderator variables, including
school level, location of study, type of study, university affiliation, and
instrument used to measure collective teacher efficacy.
Criteria for Inclusion and Exclusion of Studies in the Review
This study examined correlations between collective teacher efficacy and
student achievement. The preliminary eligibility criteria included the following:
1. Studies were included that focus on teachers and students involved with
compulsory education (K-12). The decision to include all compulsory grades
was made so that all available studies could be used. Any studies conducted
at the post-secondary level were excluded, since a college education is not
compulsory, and the student population is comprised of self-selected
individuals.
2. Studies were included that report school level variables of collective teacher
efficacy and student achievement. Studies that do not aggregate the variables
to the school level were excluded, so that comparisons could be made. For
example, Goddard, et al. (2000) did not aggregate student achievement to the
school level, so it is excluded even though it examined the relationship of
interest. Collective teacher efficacy is typically measured through self-report
survey of teachers and then aggregated, so that the school yields one score.
76
School achievement is typically measured with standardized tests, but
studies that use other measurements were included if the achievement
variable is quantifiable on a continuous scale, as was the case for Parker et al.
(2006), who used percentage of students attaining or exceeding minimum
national benchmark levels, as assessed by teacher observation.
3. Studies were included that report a Pearson product-moment correlation
between CTE and student achievement. This is typically reported as a
descriptive statistic. Studies that ultimately consider other relationships
were included as long as the desired correlation was reported. For example,
Ross and Gray (2006) were interested in indirect leadership effects, but
reported the correlations needed. On the other hand, Hoy et al. (2006)
discussed how CTE, as part of Academic Optimism, affects achievement, but
they did not report a correlation between CTE and achievement. When the
relationship is considered, but correlations are not reported, authors were
contacted to see if that data was available.
4. Studies conducted in any country were included if the report was available in
English.
Relevance decisions were made by the researcher, and initial screening was
conducted by examining article titles and abstracts and recording information on an
initial screening spreadsheet (Appendix A). Potential articles were further screened
77
by reading full reports. Final selection was made during the coding process, with the
input of multiple coders.
Search Strategy for Identification of Relevant Studies
In order to retrieve all available studies that meet the criteria, several
strategies were used. First, keyword searches of computerized databases were
conducted. In order to identify variants of words, wildcard characters were initially
used (e.g. efficac* to locate efficacy and efficacious). Preliminary searches revealed
that using the following combinations yielded the most helpful results: “collective
teacher efficacy”; ”collective efficacy” and “teacher”; “collective teacher efficacy”
and “achievement”; and ”collective efficacy”, “teacher”, and “achievement”.
Searches were performed using ERIC, Academic Search Premiere, PsycINFO, JSTOR,
Wilson Web, Dissertations and Theses: Proquest, and Google Scholar. Searches of
other available databases did not yield any additional potential articles. Figure 9
details the database search process.
Next, key authors were contacted (Bandura, Goddard, Hoy, Ross, Tschannen-
Moran), and finally, reference lists of previous meta-analyses, literature reviews,
and collected articles were examined by the researcher.
Studies with titles and/or abstracts that appeared promising were collected
electronically, if available. Articles that could not be electronically accessed were
collected from hardcopy journals and books at university libraries, via interlibrary
loan, or directly requested from author(s). References for potential articles were
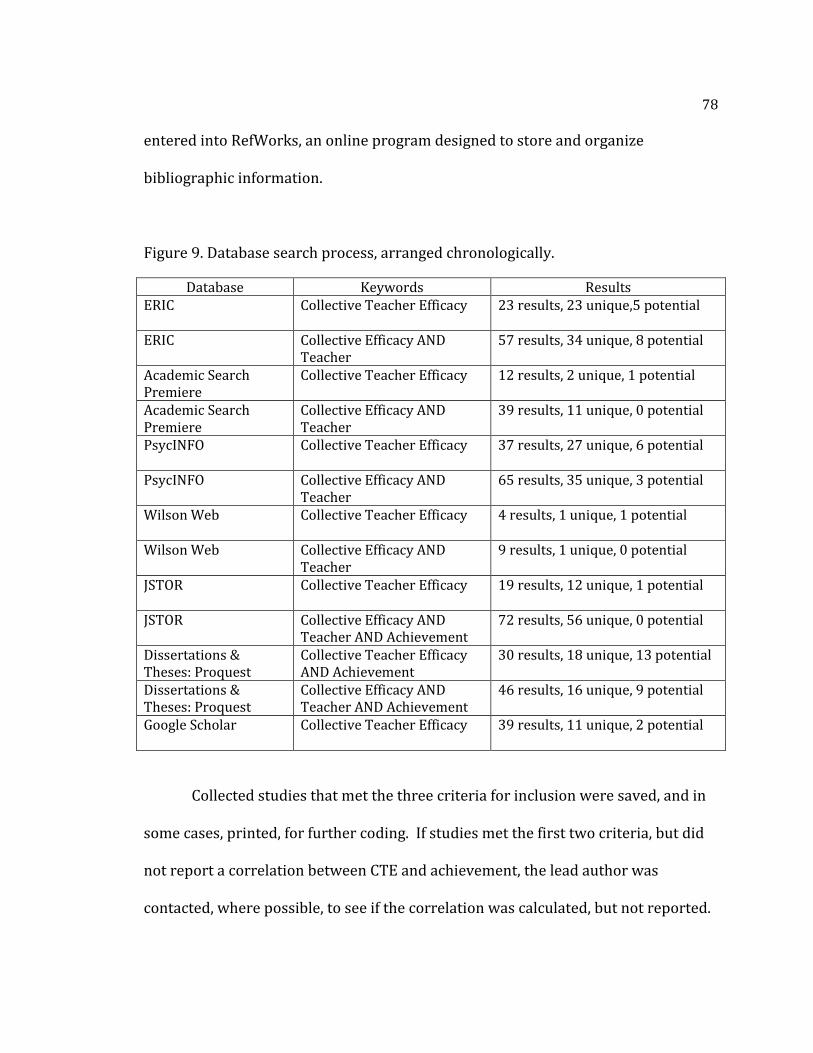
78
entered into RefWorks, an online program designed to store and organize
bibliographic information.
Figure 9. Database search process, arranged chronologically.
Database Keywords Results ERIC
Collective Teacher Efficacy 23 results, 23 unique,5 potential
ERIC Collective Efficacy AND Teacher
57 results, 34 unique, 8 potential
Academic Search Premiere
Collective Teacher Efficacy 12 results, 2 unique, 1 potential
Academic Search Premiere
Collective Efficacy AND Teacher
39 results, 11 unique, 0 potential
PsycINFO
Collective Teacher Efficacy 37 results, 27 unique, 6 potential
PsycINFO Collective Efficacy AND Teacher
65 results, 35 unique, 3 potential
Wilson Web
Collective Teacher Efficacy 4 results, 1 unique, 1 potential
Wilson Web Collective Efficacy AND Teacher
9 results, 1 unique, 0 potential
JSTOR
Collective Teacher Efficacy 19 results, 12 unique, 1 potential
JSTOR Collective Efficacy AND Teacher AND Achievement
72 results, 56 unique, 0 potential
Dissertations & Theses: Proquest
Collective Teacher Efficacy AND Achievement
30 results, 18 unique, 13 potential
Dissertations & Theses: Proquest
Collective Efficacy AND Teacher AND Achievement
46 results, 16 unique, 9 potential
Google Scholar
Collective Teacher Efficacy 39 results, 11 unique, 2 potential
Collected studies that met the three criteria for inclusion were saved, and in
some cases, printed, for further coding. If studies met the first two criteria, but did
not report a correlation between CTE and achievement, the lead author was
contacted, where possible, to see if the correlation was calculated, but not reported.
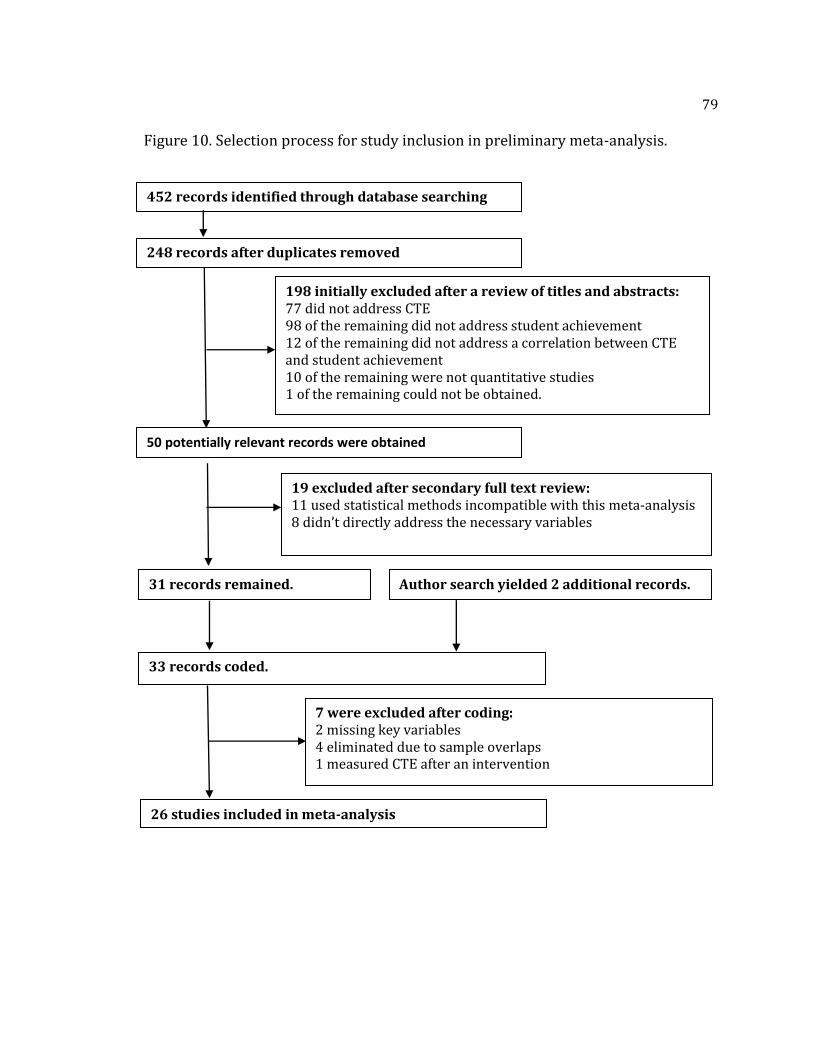
79
Figure 10. Selection process for study inclusion in preliminary meta-analysis.
248 records after duplicates removed
198 initially excluded after a review of titles and abstracts: 77 did not address CTE 98 of the remaining did not address student achievement 12 of the remaining did not address a correlation between CTE and student achievement 10 of the remaining were not quantitative studies 1 of the remaining could not be obtained.
50 potentially relevant records were obtained
19 excluded after secondary full text review: 11 used statistical methods incompatible with this meta-analysis 8 didn’t directly address the necessary variables
31 records remained.
33 records coded.
26 studies included in meta-analysis
452 records identified through database searching
Author search yielded 2 additional records.
7 were excluded after coding: 2 missing key variables 4 eliminated due to sample overlaps 1 measured CTE after an intervention
80
The selection process was documented with a flow chart, in order to
illustrate how the inclusion criteria were applied to the available studies, and how
the final studies were selected. Figure 10 documents the inclusion and exclusion
process for the preliminary study.
Description of Methods Used in the Component Studies
Since the statistic of interest for this meta-analysis was the Pearson product-
moment coefficient, many types of study designs were acceptable, as long as the
correlation between CTE and some measure of student achievement was reported.
The studies examined utilized path analyses, correlation, regression, and
general linear modeling. For some, the CTE-achievement correlation was the focus
of the study, while others examined a number of additional variables as well, or
even reported the correlation as part of overall descriptive statistics and explored
something else entirely. Partial correlations, regression coefficients, and
correlations from within models were not used, as they factor in other variables.
Initially, the articles were to be confined to those that reported a correlation
between CTE and subsequent student achievement. However, study coding and
contact with authors revealed that many studies that examined this relationship did
not adhere to these time constraints. Many (eight dissertations, one published
article) used student achievement data that was measured at some point before
CTE, without conceptualizing that achievement as antecedent to CTE. Seven of the
81
studies did not clearly describe the timing of the measurements, leaving ten studies
that specifically state that CTE was measured before achievement.
Criteria for Determination of Independent Findings
When a study reported more than one of the required correlations for a
single sample, the correlated variables were examined, and all appropriate
correlations were coded. Multiple measures of CTE for the same sample were
coded, as were all measures of student achievement within the same sample. For
each study, a mean correlation was determined by finding the average of all
reported correlations between CTE and achievement. A spreadsheet was compiled
containing columns for the calculated mean correlation, and correlations between
CTE and subject specific achievement (math, reading, writing, English, social studies,
science) as well as overall achievement. When a study reported more than one
subject-specific correlation, then those correlations were averaged to yield one data
point per column. For example, Pearce (2007) measured math, reading, and writing
achievement for third, fourth, and fifth grades, so for each subject area, the average
of the three correlations for CTE and achievement was reported as one correlation.
These calculations were necessary for six studies (Fancera, 2009; Garcia, 2004;
Jackson, 2010; McCoach & Colbert, 2010; Pearce, 2007; and Washburn, 2006).
None of the usable studies reported correlations for more than one
independent sample, so there were no cases in which one study yielded two
correlations for one meta-analysis.
82
Details of Study Coding Categories
The coding sheet and manual (Appendix B) were developed as Excel
spreadsheets, and documented the following: characteristics of the study, the
setting, and the subjects; study design; outcome measures (collective teacher
efficacy, and student achievement); relevant statistics; and additional information
that may prove helpful. All studies were coded by the author. Two additional coders
were trained and they coded six of the studies, so that interrater reliability could be
evaluated.
The literature review indicated that variables that can influence CTE include
prior academic achievement (Goddard, 2001; Goddard & Goddard, 2001; Goddard,
LoGerfo, & Hoy, 2004; Ross, Hogaboam-Gary, & Gray, 2004), SES (Bandura, 1993;
Parker, 1994; Goddard & Goddard, 2001; Goddard, LoGerfo, et al., 2004),
administrative leadership style (Ross & Gray, 2006a, 2006b; Dussault, Payette, &
Leroux, 2008), school level, and school structure (Adams & Forsythe, 2006). These
variables were coded as possible moderators. Of these potential moderators, only
school level was reported consistently enough to perform moderator analysis.
A preliminary meta-analysis of only published studies (Eells, 2010) found
that instrument used to measure CTE was a moderator of the between-study
variance. Additionally, Tschannen-Moran and Barr (2004) have raised questions
concerning the adequacy of the CE SCALE in challenging environments. For these
reasons, CTE measure was coded for moderator analysis.
83
The preliminary study (Eells, 2010) also found that location of the study was
a significant moderator, and that schools in Ohio showed a higher effect size. The
number of studies included in that analysis (N=9) was small, so that relationship
needed further investigation; thus, state was also coded as a possible moderator.
Examination of the studies revealed that many of the authors were affiliated
with Ohio State University at some point, or someone with ties to Ohio State
University sat on the author’s dissertation committee. For that reason, university
affiliation was also coded as a potential moderator. Additionally, since this meta-
analysis included both published and unpublished studies, coding included an
indication of study type (dissertation or article) to be examined as a potential
moderator.
The coding process revealed similarities between several pairs of studies.
The study for the dissertation by Barr (2002) was continued and expanded by
Tschannen-Moran and Barr (2004). M. Tschannen-Moran (personal
correspondence, November 22, 2010) confirmed that the published study included
the sample from the dissertation, so Barr(2002) was eliminated, while Tschannen-
Moran and Barr (2004) remained. The dissertation by Cybulski (2003) became a
published article (Cybulski, Hoy, and Sweetland, 2005), reporting duplicate sample
sizes and correlations, so the dissertation remained in the analysis, and the
published article was removed. W. Hoy (personal communication, March 4, 2010)
confirmed that the studies by Goddard, LoGerfo, and Hoy (2004) and Hoy,
84
Sweetland, and Smith (2002) used the same dataset. It was decided that the
Goddard et al. (2004) study would remain, since it reported more usable
correlations than did Hoy et al. (2004). The dissertations by Jackson (2010) and
Kirby (2010), both from the College of William and Mary, reported identical sample
sizes and correlations; it is assumed that they used the same dataset. The decision to
use Jackson’s study was made because Jackson’s study (2010) addressed the
relationship between CTE and achievement directly, while Kirby (2010) explored
Academic Optimism (of which CTE is a part). For the preliminary study, Ross
(2004) was included, but further examination revealed that Ross’s reported
correlation was measured after a running-records assessment intervention. Since
none of the other studies employed an intervention, this study was excluded.
Statistical Procedures and Conventions
The primary effect of interest was the predictive relationship between
measured CTE and subsequent student achievement, both continuous variables, as
measured by the Pearson product-moment correlation coefficient (r). These
coefficients needed no further calculation from study results, since the correlation
coefficient, as reported, is the effect size. Statistics were calculated using
Comprehensive Meta-analysis software (Borenstein et al., 2005), which required the
input of correlation, sample size, and effect direction (positive or negative) as well
as moderator information.
85
Recognizing that data can be deceptive (Schmidt, 2010), procedures to
correct sampling and measurement error were conducted where possible. To
correct for sampling error, calculations were conducted after the effect size (r) was
transformed using Fisher’s Zr –transform (Lipsey & Wilson, 2001), which is a
variance stabilizing transformation. Instead of simply comparing correlations across
studies with varied sample sizes, meta-analysis weights each effect size based on the
standard error. In this way, studies with small sample sizes will not artificially alter
the overall effect size. In one of the component studies, Sidhu (2006) reported a
sample size of 6, with a CTE-math achievement correlation of .375. Since this
component study has a very small sample size, its confidence intervals is very wide,
indicating room for a lot of possible error. The component study with the largest
sample size (205) was Ross and Gray (2006a), with a CTE- overall achievement
correlation of 0.58. Stabilizing the variance in this way allows for more accurate
comparison.
The correction for measurement error employs the reliabilities of each
measure used (Schmidt, 2010). For this meta-analysis, this correction could not be
conducted because the component studies did not employ the same tools to
measure CTE and achievement, and did not always report the reliabilities of the
measures used.
Various strategies were employed to address the potential effects of
publication bias. First, the search process included both published and unpublished
86
studies, as well as studies that addressed different relationships but reported the
correlation of interest, and efforts were made to locate studies from other countries.
Second, this group of studies contained one outlier, so analysis was conducted both
with and without the outlier. Third, the decision was made to include studies that
measured achievement before CTE, as long as the study addressed the influence of
CTE on achievement in some way. Adhering to a stricter timing policy would have
reduced the sample size by more than half. Finally, data were examined using a
funnel plot to look for asymmetry, which would indicate the presence of publication
bias.
The software used calculates both fixed and random effects models. For each
meta-analysis run, the a priori assumption was that the effect sizes would not come
from the same population, necessitating random-effects analysis, and there would
therefore be variance that needed to be explained through moderator analysis.
Cooper (2010) defends this method when moderator choices are theoretical and/or
practical. However, the calculations for the homogeneity statistic (Q) came from
fixed-effects calculations, because random-effects calculations assume between
sample variance, distorting Q.
After homogeneity testing, random-effects procedures were used to calculate
weighted mean effect sizes, and moderator analysis was employed to determine
what may account for any variance that existed in the effect sizes. The moderator
analyses included both categorical, ANOVA-type models and meta-regression, and
87
began by examining the following variables: university affiliation, state, and
instrument used to measure CTE.
Treatment of Qualitative or Excluded Research
Studies which do not provide the needed correlation coefficient have been
addressed as part of the literature review, but were not analyzed systematically.
Conclusion
This chapter reiterated the research questions and hypotheses, briefly
described meta-analysis, and detailed the procedures and methods that were used
to conduct this study. The systematic search procedures increased the chances that
all available studies appropriate for conclusion were located and coded so that the
results could be analyzed, yielding an effect size that quantifies the nature of the
relationship between CTE and student achievement, while considering moderator
variables that may be significant. With clearly defined procedures in place, the meta-
analysis was careful, detailed, and thorough, with explicit documentation
throughout.
88
CHAPTER 4
RESULTS
This chapter will report the results of the analyses conducted. It will begin
with a report about interrater reliability before presenting a description of the
sample, detailing the characteristics of the component studies. Next, the initial meta-
analysis is described and results reported. This is followed by a description of the
twelve additional meta-analyses run and their results. Finally, moderator analysis is
explained in depth.
Interrater Reliability
The quality of the coding document was analyzed in the preliminary study
(Eells, 2010), so for this study, double coding was used to check the reliability of the
researcher’s coding. Two graduate students were trained to code six of the
published articles. The agreement rates (for document items) between the
researcher and the first additional coder ranged from 0.67 to 1.00, with an average
AR of 0.93. In additional to discussion and reexamination of the texts, the coding
completed by the second additional coder was used for comparison purposes to
resolve any disagreements. The disagreements were clerical in nature, and did not
reveal any problems with the quality of the coding document. The final data set
used the coding completed by the researcher.
89
Description of Studies
Table 1 provides sample characteristics for the 26 studies that were
included. The dates of publications for the nine studies that appeared in journals
(seven) or a book (one) ranged from 1994 to 2010, with a median of 2004, and
triple modes of 2002, 2004, and 2006. The seventeen dissertations were completed
between 2003 and 2010, with a median year of 2007, and a mode of 2010. All were
written in English.
Five of the studies were conducted in Ohio schools by authors with an
affiliation to Ohio State University. Five of the studies were conducted in Virginia
schools, four of which were authored by those with affiliations to The College of
William and Mary. This is noteworthy, since the bulk of the research concerning
teacher efficacy, both at the individual and collective level, finds its heritage at Ohio
State, with Wayne Hoy, Anita Woolfolk Hoy, Roger Goddard, and Megan Tschannen-
Moran (Tschannen-Moran & Woolfolk Hoy, 1998; Goddard, et al., 2000). Two of the
four 2010 dissertations came from The College of William and Mary, where
Tschannen-Moran is a current faculty member. The other two were from the
University of Alabama, where C. John Tarter is currently a faculty member. Tarter,
who collaborated with Hoy and Woolfolk Hoy to study Academic Optimism (Hoy,
Tarter, & Woolfolk Hoy, 2006) was dissertation chair for one of the Alabama
dissertations and both of the dissertations from St. John’s University in Jamaica, NY.
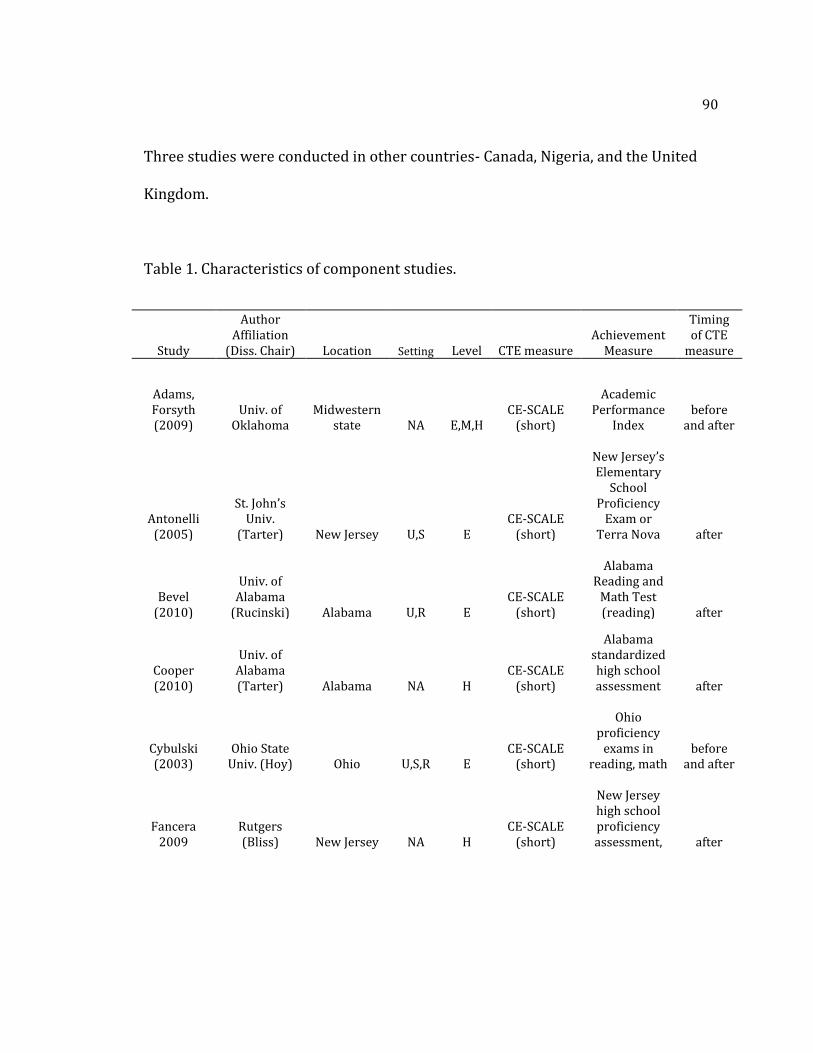
90
Three studies were conducted in other countries- Canada, Nigeria, and the United
Kingdom.
Table 1. Characteristics of component studies.
Study
Author Affiliation
(Diss. Chair) Location Setting Level CTE measure Achievement
Measure
Timing of CTE
measure
Adams, Forsyth (2009)
Univ. of Oklahoma
Midwestern state NA E,M,H
CE-SCALE (short)
Academic Performance
Index before
and after
Antonelli (2005)
St. John’s Univ.
(Tarter) New Jersey U,S E CE-SCALE
(short)
New Jersey’s Elementary
School Proficiency
Exam or Terra Nova after
Bevel (2010)
Univ. of Alabama
(Rucinski) Alabama U,R E CE-SCALE
(short)
Alabama
Reading and Math Test (reading) after
Cooper (2010)
Univ. of Alabama (Tarter) Alabama NA H
CE-SCALE (short)
Alabama standardized high school assessment after
Cybulski (2003)
Ohio State Univ. (Hoy) Ohio U,S,R E
CE-SCALE (short)
Ohio
proficiency exams in
reading, math before
and after
Fancera 2009
Rutgers (Bliss) New Jersey NA H
CE-SCALE (short)
New Jersey high school proficiency assessment, after
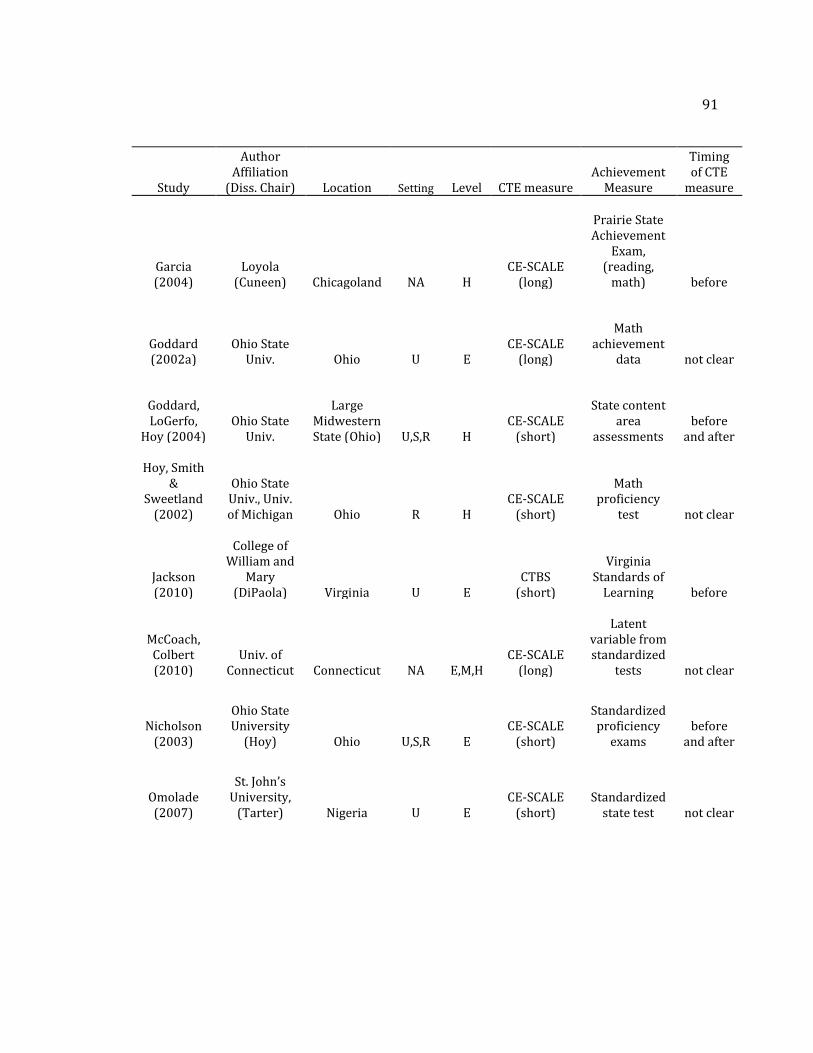
91
Study
Author Affiliation
(Diss. Chair) Location Setting Level CTE measure Achievement
Measure
Timing of CTE
measure
Garcia (2004)
Loyola (Cuneen) Chicagoland NA H
CE-SCALE (long)
Prairie State Achievement
Exam, (reading,
math) before
Goddard (2002a)
Ohio State Univ. Ohio U E
CE-SCALE (long)
Math achievement
data not clear
Goddard, LoGerfo,
Hoy (2004) Ohio State
Univ.
Large Midwestern State (Ohio) U,S,R H
CE-SCALE (short)
State content
area assessments
before and after
Hoy, Smith
& Sweetland
(2002)
Ohio State Univ., Univ. of Michigan Ohio R H
CE-SCALE (short)
Math proficiency
test not clear
Jackson (2010)
College of
William and Mary
(DiPaola) Virginia U E CTBS
(short)
Virginia Standards of
Learning before
McCoach, Colbert (2010)
Univ. of Connecticut Connecticut NA E,M,H
CE-SCALE (long)
Latent
variable from standardized
tests not clear
Nicholson (2003)
Ohio State University
(Hoy) Ohio U,S,R E CE-SCALE
(short)
Standardized proficiency
exams before
and after
Omolade (2007)
St. John’s University,
(Tarter) Nigeria U E CE-SCALE
(short) Standardized
state test not clear
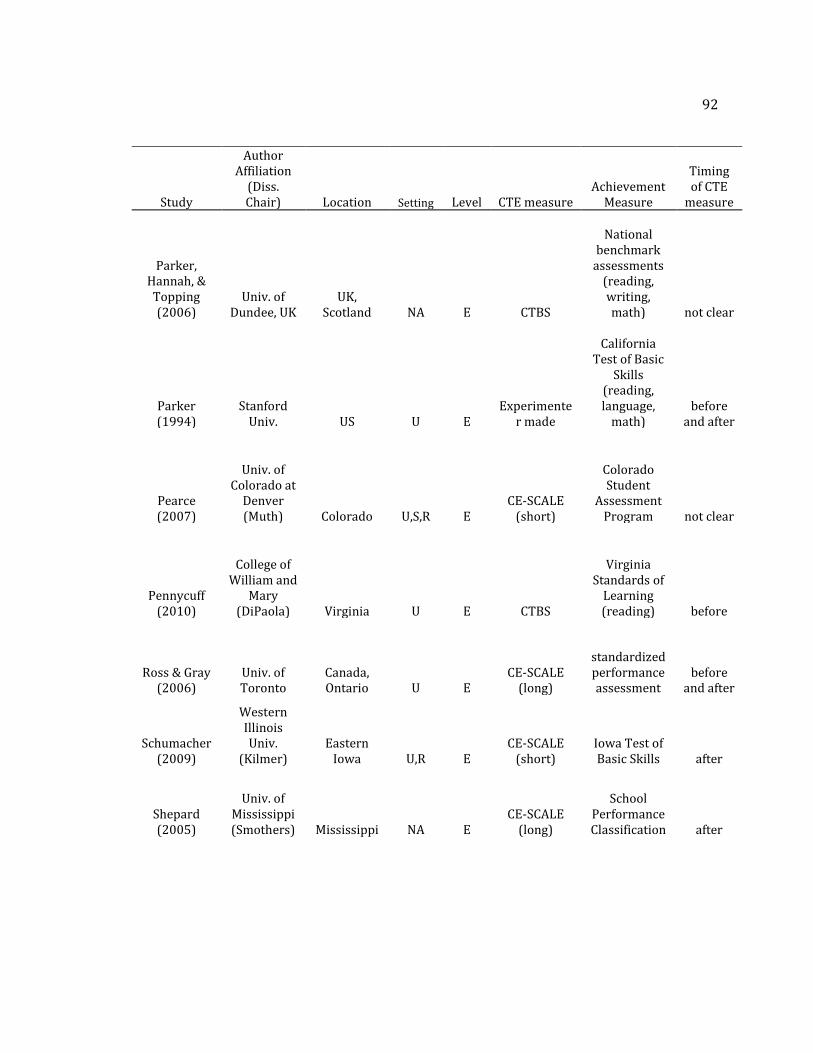
92
Study
Author Affiliation
(Diss. Chair) Location Setting Level CTE measure
Achievement Measure
Timing of CTE
measure
Parker, Hannah, & Topping (2006)
Univ. of Dundee, UK
UK, Scotland NA E CTBS
National
benchmark assessments
(reading, writing, math) not clear
Parker (1994)
Stanford Univ. US U E
Experimenter made
California
Test of Basic Skills
(reading, language,
math) before
and after
Pearce (2007)
Univ. of Colorado at
Denver (Muth) Colorado U,S,R E
CE-SCALE (short)
Colorado Student
Assessment Program not clear
Pennycuff (2010)
College of William and
Mary (DiPaola) Virginia U E CTBS
Virginia Standards of
Learning (reading) before
Ross & Gray (2006)
Univ. of Toronto
Canada, Ontario U E
CE-SCALE (long)
standardized performance assessment
before and after
Schumacher (2009)
Western Illinois Univ.
(Kilmer) Eastern
Iowa U,R E CE-SCALE
(short) Iowa Test of Basic Skills after
Shepard (2005)
Univ. of Mississippi (Smothers) Mississippi NA E
CE-SCALE (long)
School Performance Classification after
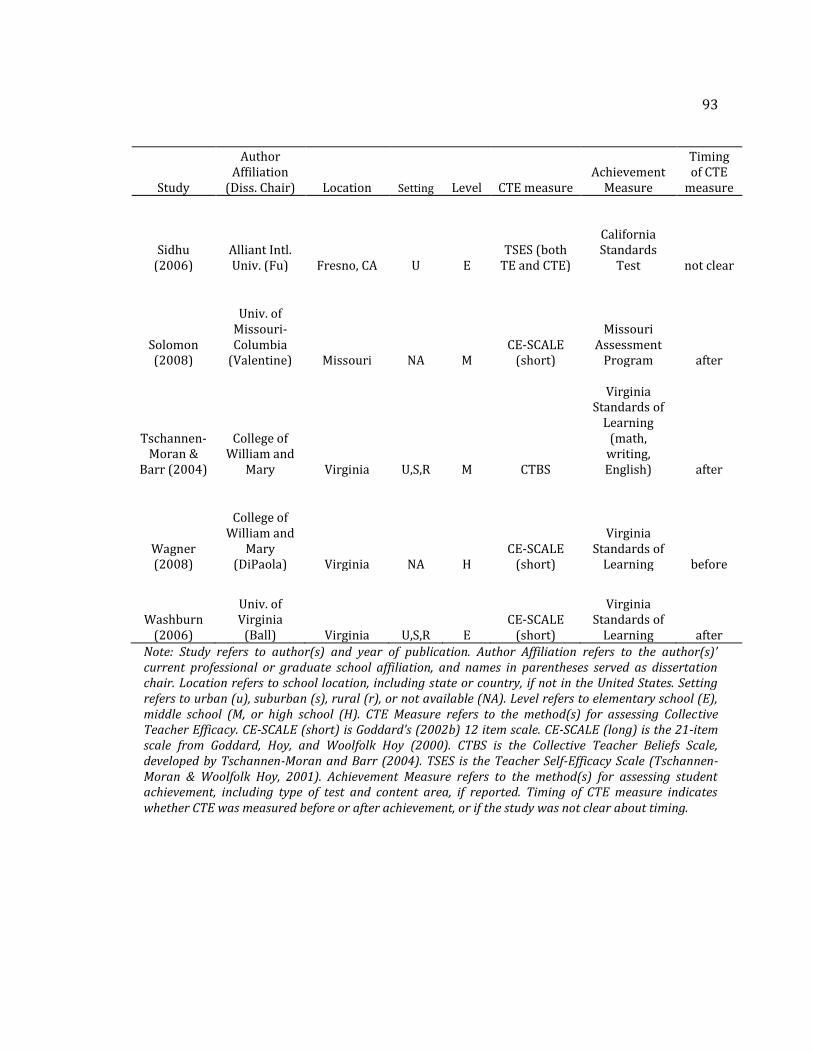
93
Study
Author Affiliation
(Diss. Chair) Location Setting Level CTE measure Achievement
Measure
Timing of CTE
measure
Sidhu (2006)
Alliant Intl. Univ. (Fu) Fresno, CA U E
TSES (both TE and CTE)
California Standards
Test not clear
Solomon (2008)
Univ. of
Missouri-Columbia
(Valentine) Missouri NA M CE-SCALE
(short)
Missouri Assessment
Program after
Tschannen-Moran &
Barr (2004)
College of William and
Mary Virginia U,S,R M CTBS
Virginia
Standards of Learning
(math, writing, English) after
Wagner (2008)
College of William and
Mary (DiPaola) Virginia NA H
CE-SCALE (short)
Virginia Standards of
Learning before
Washburn (2006)
Univ. of Virginia
(Ball) Virginia U,S,R E CE-SCALE
(short)
Virginia Standards of
Learning after
Note: Study refers to author(s) and year of publication. Author Affiliation refers to the author(s)’ current professional or graduate school affiliation, and names in parentheses served as dissertation chair. Location refers to school location, including state or country, if not in the United States. Setting refers to urban (u), suburban (s), rural (r), or not available (NA). Level refers to elementary school (E), middle school (M, or high school (H). CTE Measure refers to the method(s) for assessing Collective Teacher Efficacy. CE-SCALE (short) is Goddard’s (2002b) 12 item scale. CE-SCALE (long) is the 21-item scale from Goddard, Hoy, and Woolfolk Hoy (2000). CTBS is the Collective Teacher Beliefs Scale, developed by Tschannen-Moran and Barr (2004). TSES is the Teacher Self-Efficacy Scale (Tschannen-Moran & Woolfolk Hoy, 2001). Achievement Measure refers to the method(s) for assessing student achievement, including type of test and content area, if reported. Timing of CTE measure indicates whether CTE was measured before or after achievement, or if the study was not clear about timing.
94
Sixteen studies were conducted at the elementary school level, two at the
middle school level, and six in high schools. Two studies included all grade levels.
With the exception of the Nigeria study, all of the schools were public. The Nigerian
schools were a combination of public and private.
In all studies, CTE was measured using self-report, likert scale surveys,
typically administered during regularly scheduled faculty meetings. 20 of the
studies used the Collective Efficacy Scale (CE-SCALE) developed as a 21 item
instrument by Goddard and his colleagues (Goddard, et al., 2000), and later
modified to become a short form by Goddard (2002b). Five of the 20 studies used
the long form of the CE-SCALE and 15 used the short form. Four studies measured
CTE with the Collective Teacher Belief Scale, or CTBS (Tschannen-Moran & Barr,
2004). One study used the Teacher Self-Efficacy Scale (Tschannen-Moran & Hoy,
2001), measuring both teacher efficacy and collective efficacy, and one study used
an experimenter-made instrument.
Achievement, in all cases, was measured with state-mandated standardized
assessments, and obtained from the governing bodies. The samples were
independent, even when the studies were conducted in the same state, and
achievement data was obtained from the same governing body. In cases of potential
overlap, authors were contacted to confirm independence, and if needed, studies
were eliminated.
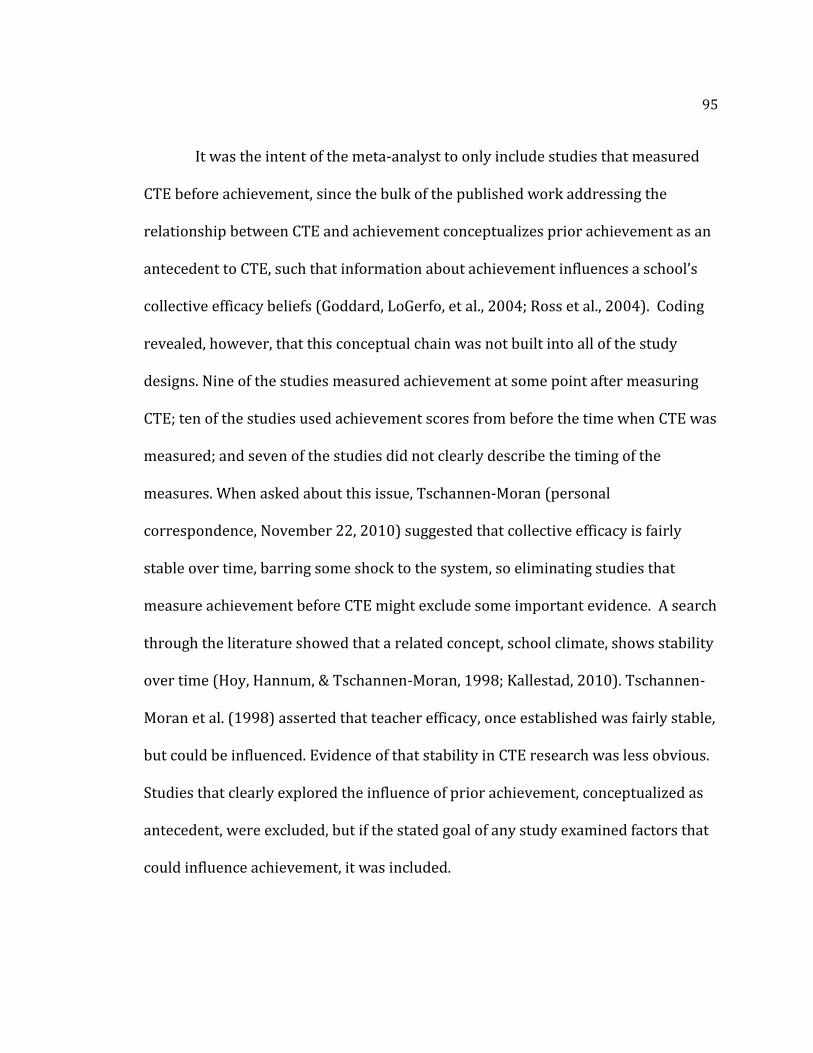
95
It was the intent of the meta-analyst to only include studies that measured
CTE before achievement, since the bulk of the published work addressing the
relationship between CTE and achievement conceptualizes prior achievement as an
antecedent to CTE, such that information about achievement influences a school’s
collective efficacy beliefs (Goddard, LoGerfo, et al., 2004; Ross et al., 2004). Coding
revealed, however, that this conceptual chain was not built into all of the study
designs. Nine of the studies measured achievement at some point after measuring
CTE; ten of the studies used achievement scores from before the time when CTE was
measured; and seven of the studies did not clearly describe the timing of the
measures. When asked about this issue, Tschannen-Moran (personal
correspondence, November 22, 2010) suggested that collective efficacy is fairly
stable over time, barring some shock to the system, so eliminating studies that
measure achievement before CTE might exclude some important evidence. A search
through the literature showed that a related concept, school climate, shows stability
over time (Hoy, Hannum, & Tschannen-Moran, 1998; Kallestad, 2010). Tschannen-
Moran et al. (1998) asserted that teacher efficacy, once established was fairly stable,
but could be influenced. Evidence of that stability in CTE research was less obvious.
Studies that clearly explored the influence of prior achievement, conceptualized as
antecedent, were excluded, but if the stated goal of any study examined factors that
could influence achievement, it was included.
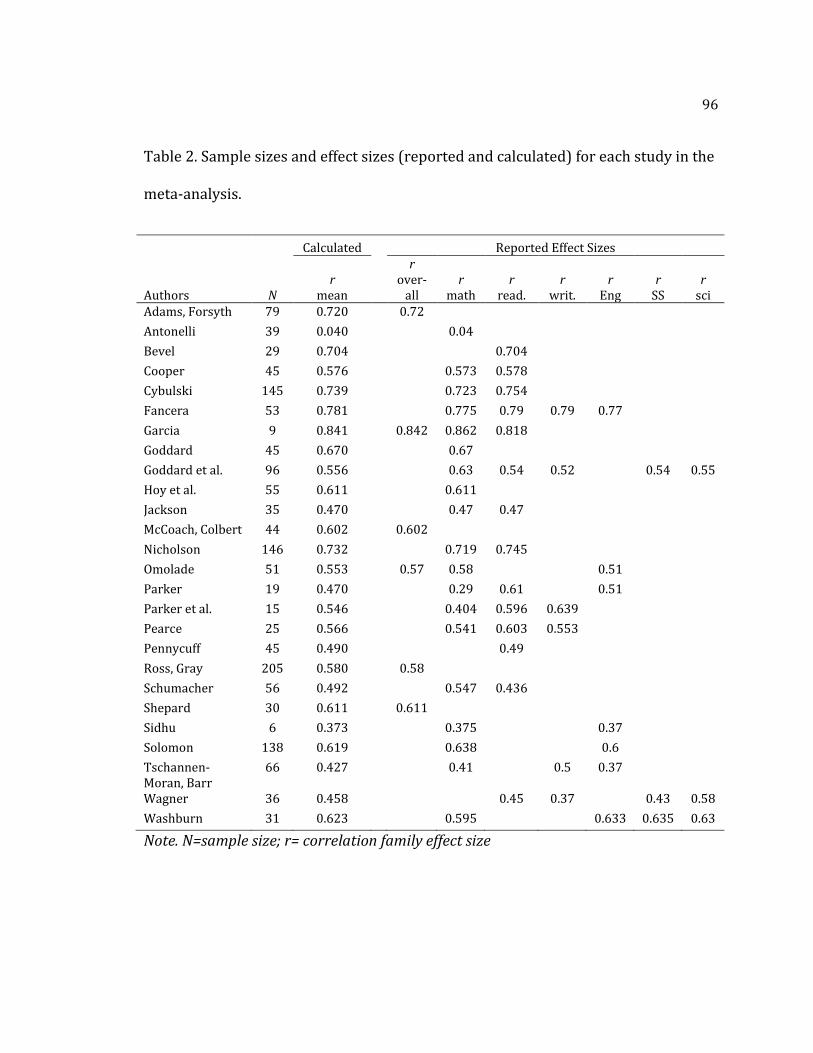
96
Table 2. Sample sizes and effect sizes (reported and calculated) for each study in the
meta-analysis.
Calculated Reported Effect Sizes
Authors N
r mean
r over-
all r
math r
read. r
writ. r
Eng r
SS r
sci Adams, Forsyth 79 0.720 0.72
Antonelli 39 0.040 0.04
Bevel 29 0.704 0.704
Cooper 45 0.576 0.573 0.578
Cybulski 145 0.739 0.723 0.754
Fancera 53 0.781 0.775 0.79 0.79 0.77
Garcia 9 0.841 0.842 0.862 0.818
Goddard 45 0.670 0.67
Goddard et al. 96 0.556 0.63 0.54 0.52 0.54 0.55
Hoy et al. 55 0.611 0.611
Jackson 35 0.470 0.47 0.47
McCoach, Colbert 44 0.602 0.602
Nicholson 146 0.732 0.719 0.745
Omolade 51 0.553 0.57 0.58 0.51
Parker 19 0.470 0.29 0.61 0.51
Parker et al. 15 0.546 0.404 0.596 0.639
Pearce 25 0.566 0.541 0.603 0.553
Pennycuff 45 0.490 0.49
Ross, Gray 205 0.580 0.58
Schumacher 56 0.492 0.547 0.436
Shepard 30 0.611 0.611
Sidhu 6 0.373 0.375 0.37
Solomon 138 0.619 0.638 0.6
Tschannen-Moran, Barr
66 0.427 0.41 0.5 0.37
Wagner 36 0.458 0.45 0.37 0.43 0.58
Washburn 31 0.623 0.595 0.633 0.635 0.63
Note. N=sample size; r= correlation family effect size
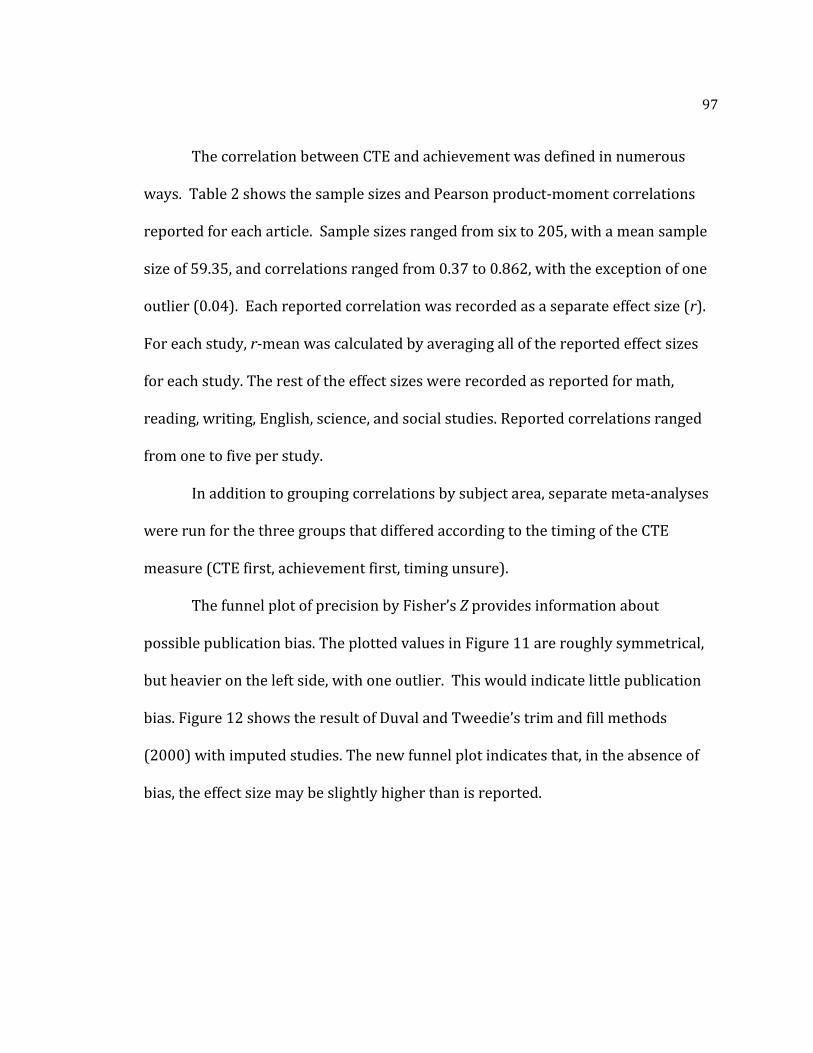
97
The correlation between CTE and achievement was defined in numerous
ways. Table 2 shows the sample sizes and Pearson product-moment correlations
reported for each article. Sample sizes ranged from six to 205, with a mean sample
size of 59.35, and correlations ranged from 0.37 to 0.862, with the exception of one
outlier (0.04). Each reported correlation was recorded as a separate effect size (r).
For each study, r-mean was calculated by averaging all of the reported effect sizes
for each study. The rest of the effect sizes were recorded as reported for math,
reading, writing, English, science, and social studies. Reported correlations ranged
from one to five per study.
In addition to grouping correlations by subject area, separate meta-analyses
were run for the three groups that differed according to the timing of the CTE
measure (CTE first, achievement first, timing unsure).
The funnel plot of precision by Fisher’s Z provides information about
possible publication bias. The plotted values in Figure 11 are roughly symmetrical,
but heavier on the left side, with one outlier. This would indicate little publication
bias. Figure 12 shows the result of Duval and Tweedie’s trim and fill methods
(2000) with imputed studies. The new funnel plot indicates that, in the absence of
bias, the effect size may be slightly higher than is reported.
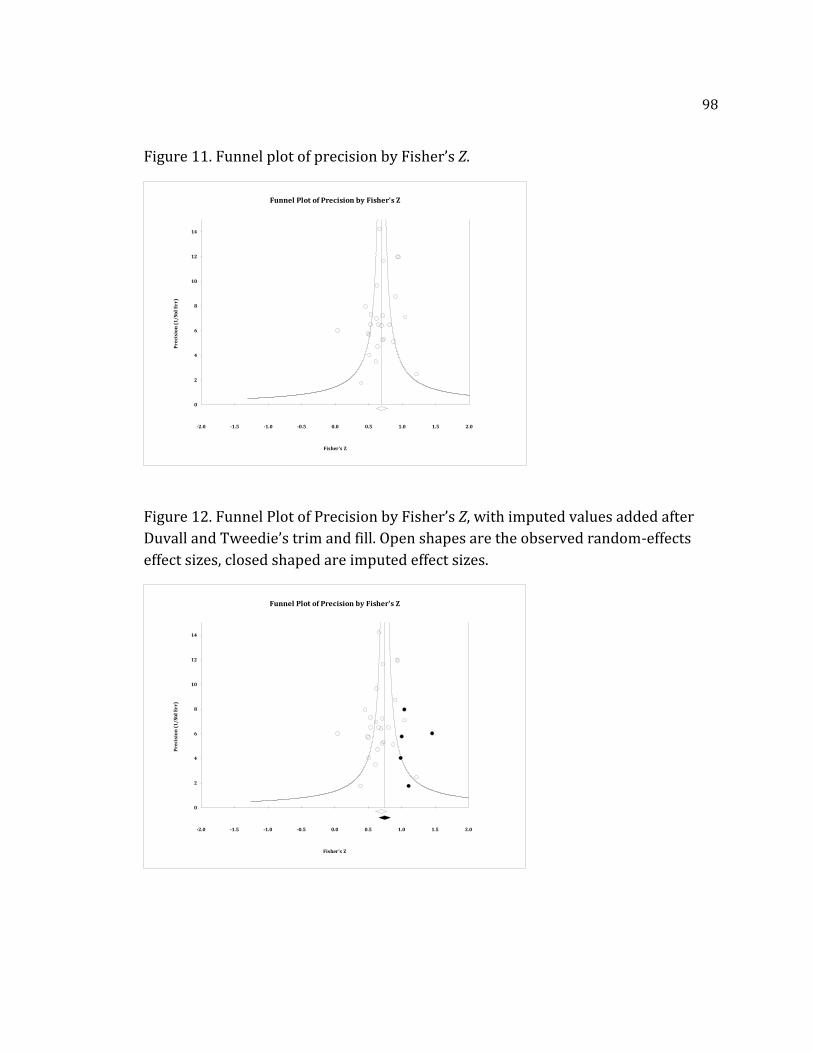
98
Figure 11. Funnel plot of precision by Fisher’s Z.
Figure 12. Funnel Plot of Precision by Fisher’s Z, with imputed values added after
Duvall and Tweedie’s trim and fill. Open shapes are the observed random-effects
effect sizes, closed shaped are imputed effect sizes.
-2.0 -1.5 -1.0 -0.5 0.0 0.5 1.0 1.5 2.0
0
2
4
6
8
10
12
14
Pre
cisi
on
(1
/Std
Err
)
Fisher's Z
Funnel Plot of Precision by Fisher's Z
-2.0 -1.5 -1.0 -0.5 0.0 0.5 1.0 1.5 2.0
0
2
4
6
8
10
12
14
Pre
cisi
on
(1
/Std
Err
)
Fisher's Z
Funnel Plot of Precision by Fisher's Z
99
One study was treated as an outlier. It was a dissertation that addressed
school effectiveness, with CTE as one variable measured. Since the CTE-achievement
correlation reported was so low (0.04), the author was contacted. She indicated that
the correlation in question was not a major component of the study, so its low value
was not explored further, and the author could offer no explanation about possible
reasons for the value (L. Antonelli, personal communication, December 4, 2010).
Meta-Analyses One and Two: r-mean
Examination of the forest plot of the effect sizes for r-mean (Figure 13)
provides a visual analysis of the data. Two studies have confidence intervals that
contain zero, and one of those studies reports a correlation so different from the
others that it will be treated as an outlier. A line cannot be drawn that intersects all
confidence intervals. This suggests heterogeneity in the sample.
The null hypothesis for the test of homogeneity is that all effect sizes come from the
same population (HO: 1= 2= …3). The Q statistic measures the variance within the
sample, and in this case, Q=55.114 (df=25, p<.001). This means that there are
significant differences within the sample, and the effect sizes are not coming from
the same population: The null hypothesis is rejected, and random-effects modeling
is most appropriate, confirming the a priori assumption. The remainder of the meta-
analyses will utilize random-effects modeling to yield a weighted average effect size,
and moderator analyses to explain any variance found. If homogeneity testing
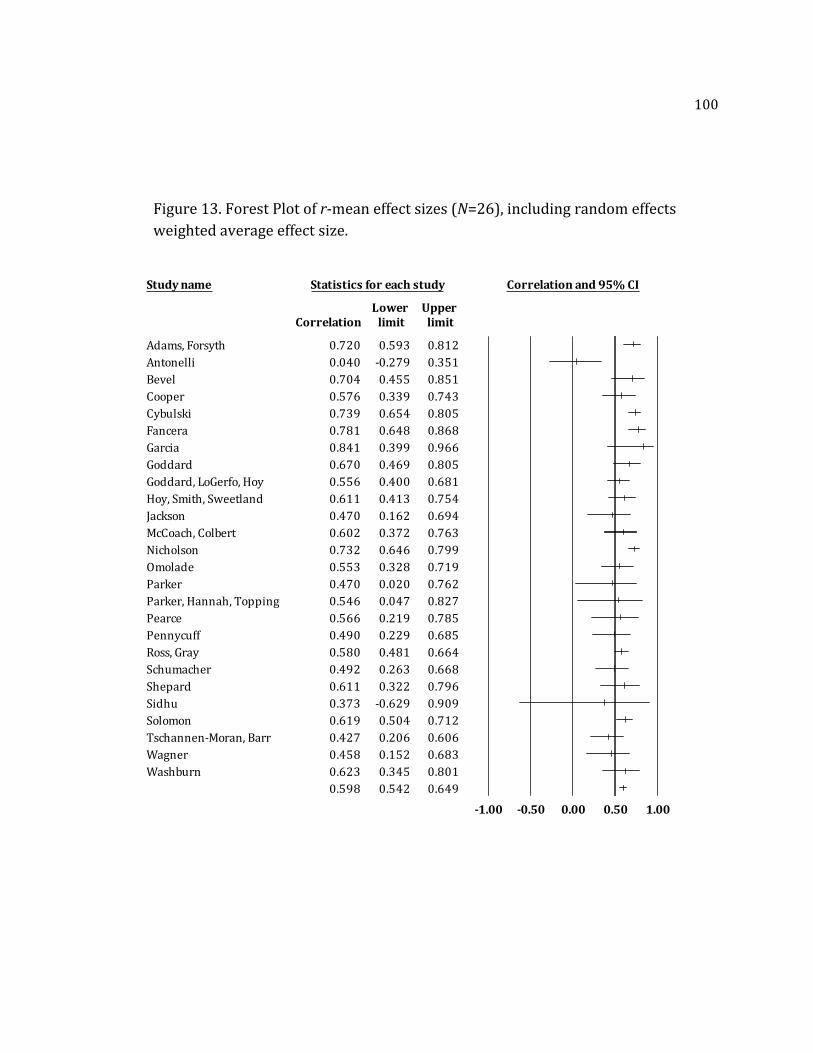
100
Study name Statistics for each study Correlation and 95% CI
Lower Upper Correlation limit limit
Adams, Forsyth 0.720 0.593 0.812
Antonelli 0.040 -0.279 0.351
Bevel 0.704 0.455 0.851
Cooper 0.576 0.339 0.743
Cybulski 0.739 0.654 0.805
Fancera 0.781 0.648 0.868
Garcia 0.841 0.399 0.966
Goddard 0.670 0.469 0.805
Goddard, LoGerfo, Hoy 0.556 0.400 0.681
Hoy, Smith, Sweetland 0.611 0.413 0.754
Jackson 0.470 0.162 0.694
McCoach, Colbert 0.602 0.372 0.763
Nicholson 0.732 0.646 0.799
Omolade 0.553 0.328 0.719
Parker 0.470 0.020 0.762
Parker, Hannah, Topping 0.546 0.047 0.827
Pearce 0.566 0.219 0.785
Pennycuff 0.490 0.229 0.685
Ross, Gray 0.580 0.481 0.664
Schumacher 0.492 0.263 0.668
Shepard 0.611 0.322 0.796
Sidhu 0.373 -0.629 0.909
Solomon 0.619 0.504 0.712
Tschannen-Moran, Barr 0.427 0.206 0.606
Wagner 0.458 0.152 0.683
Washburn 0.623 0.345 0.801
0.598 0.542 0.649
-1.00 -0.50 0.00 0.50 1.00
Figure E. Forest Plot of r-mean effect sizes (N=26) grouped by moderator: university affiliation
Figure 13. Forest Plot of r-mean effect sizes (N=26), including random effects
weighted average effect size.
101
reveals that there is not significant variance in the sample, then the fixed effect and
random effects calculations will yield the same effect size.
Using random-effects modeling, which assumes significant between-study
variance, the weighted average effect size for r-mean is 0.598, with a 95%
confidence interval of 0.542 - 0.649. When the same meta-analysis was repeated
with the outlier (Antonelli, 2005) removed, homogeneity testing indicated that
there was less variance to explain: Q=38.198 (df=24, p<0.03). The weighted average
effect size of r-mean (outlier removed) was 0.617, with a 95% confidence interval of
0.571 - 0.659.
Meta-Analyses Three through Thirteen
While r-mean compared all available information, studies were also grouped
by type of achievement measured and by timing of measurement to see if this would
alter the results.
Figure 14 presents the forest plot of effect sizes for all meta-analyses
conducted, and Table 3 presents all the relevant statistics. All of the confidence
intervals overlap. The tests of heterogeneity revealed that eight of the thirteen
analyses showed significant variance within their samples, further confirming the
need for random-effects modeling. The five analyses with a non-significant Q all
examined 8 or fewer studies.
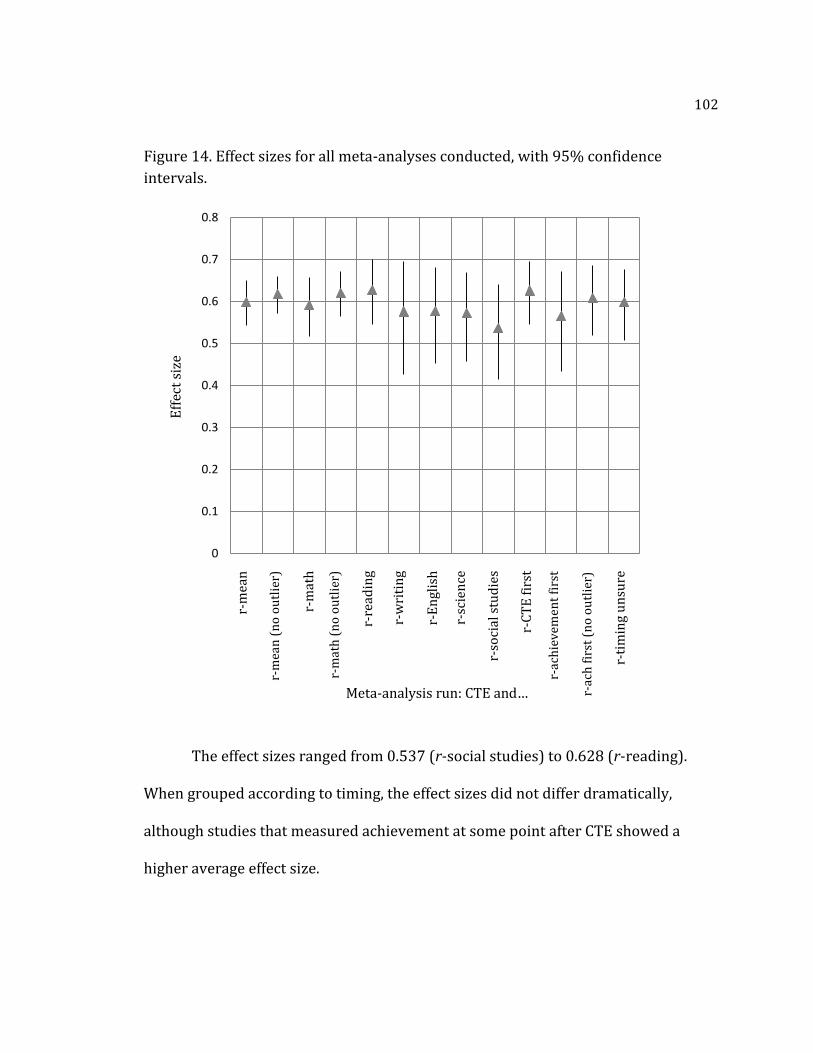
102
Figure 14. Effect sizes for all meta-analyses conducted, with 95% confidence
intervals.
The effect sizes ranged from 0.537 (r-social studies) to 0.628 (r-reading).
When grouped according to timing, the effect sizes did not differ dramatically,
although studies that measured achievement at some point after CTE showed a
higher average effect size.
0
0.1
0.2
0.3
0.4
0.5
0.6
0.7
0.8
1 2 3 4 5 6 7 8 9 10 11 12 13
Eff
ect
size
r-m
ean
r-m
ean
(n
o o
utl
ier)
r-m
ath
r-m
ath
(n
o o
utl
ier)
r-re
adin
g
r-w
riti
ng
r-E
ngl
ish
r-sc
ien
ce
r-so
cial
stu
die
s
r-C
TE
fir
st
r-ac
hie
vem
ent
firs
t
r-ac
h f
irst
(n
o o
utl
ier)
r-ti
min
g u
nsu
re
Meta-analysis run: CTE and…
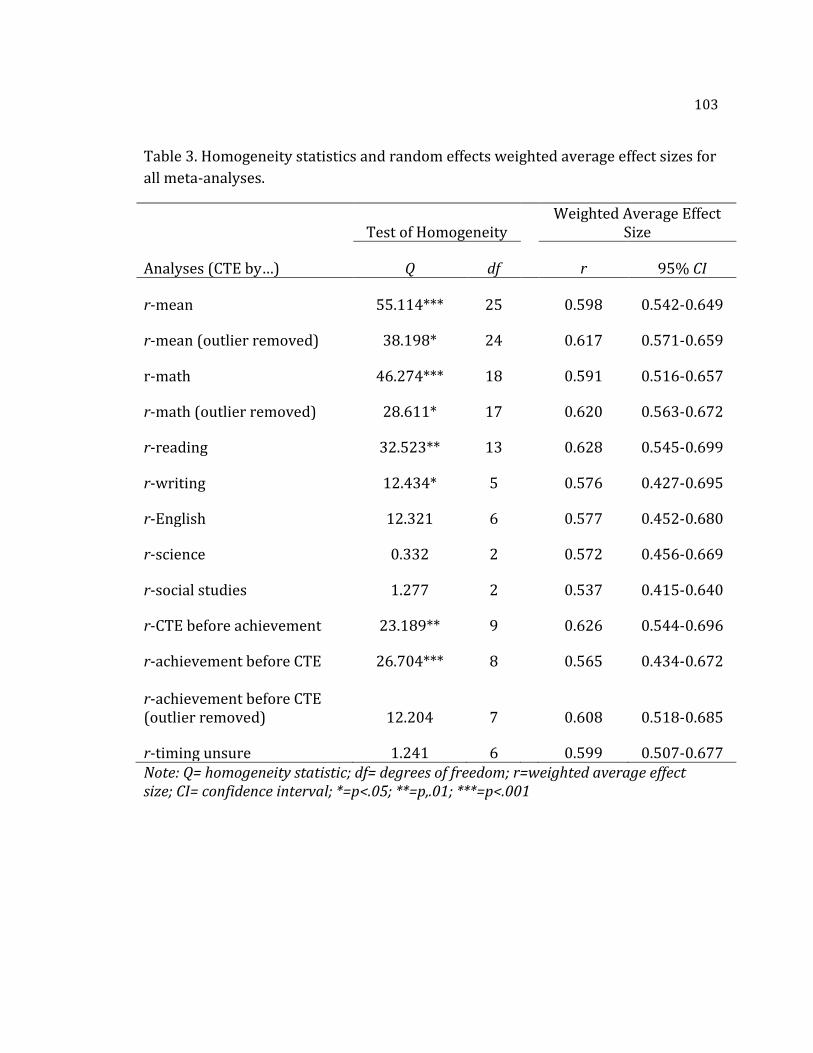
103
Table 3. Homogeneity statistics and random effects weighted average effect sizes for
all meta-analyses.
Test of Homogeneity Weighted Average Effect
Size
Analyses (CTE by…) Q df
r 95% CI
r-mean 55.114*** 25
0.598 0.542-0.649
r-mean (outlier removed) 38.198* 24
0.617 0.571-0.659
r-math 46.274*** 18
0.591 0.516-0.657
r-math (outlier removed) 28.611* 17
0.620 0.563-0.672
r-reading 32.523** 13
0.628 0.545-0.699
r-writing 12.434* 5
0.576 0.427-0.695
r-English 12.321 6
0.577 0.452-0.680
r-science 0.332 2
0.572 0.456-0.669
r-social studies 1.277 2
0.537 0.415-0.640
r-CTE before achievement 23.189** 9
0.626 0.544-0.696
r-achievement before CTE 26.704*** 8
0.565 0.434-0.672 r-achievement before CTE (outlier removed) 12.204 7
0.608 0.518-0.685
r-timing unsure 1.241 6
0.599 0.507-0.677 Note: Q= homogeneity statistic; df= degrees of freedom; r=weighted average effect size; CI= confidence interval; *=p<.05; **=p,.01; ***=p<.001
104
Moderator Analysis
In an effort to explain the variance found in the sample, five variables were
examined as potential moderators: university affiliation, CTE measure, state (study
location), school level (elementary, middle high school, all), and study type
(dissertation or published study). Since all of these variables were categorical, the
ANOVA-like mixed effect model was used. Meta-regression was not appropriate,
because there were a small number of studies, and because the variables were
categorical rather than continuous.
The analyses were conducted using r-mean (outlier removed). This effect
size was used because it included all of the studies (minus the outlier), so it would
have the potential to yield the most meaningful results.
Neither school level nor study type was a significant moderator: Neither
could explain any of the variance between groups. The moderator, state, was
eliminated from consideration because of confound with another moderator
variable, as will be explained. The two moderators that had significant associations
with effect size were university affiliation, and CTE measure. The following sections
describe these moderator analyses in further detail. A table with results from both
the significant and non-significant moderators can be found in Appendix C
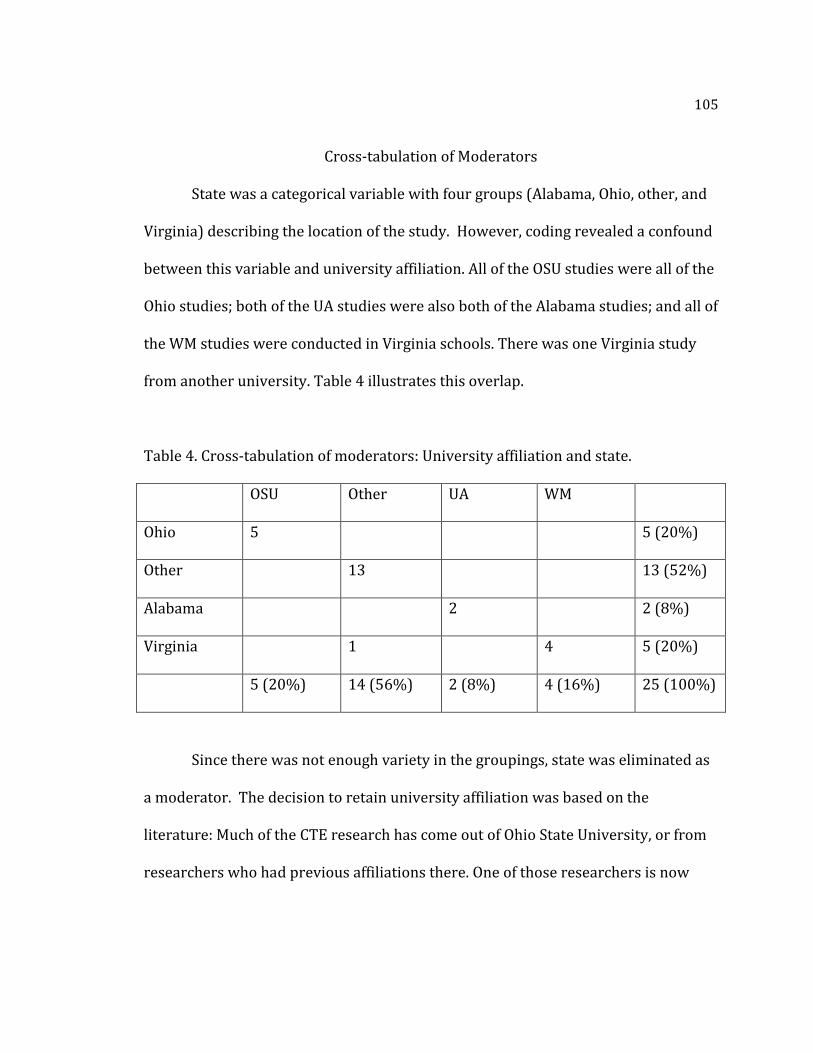
105
Cross-tabulation of Moderators
State was a categorical variable with four groups (Alabama, Ohio, other, and
Virginia) describing the location of the study. However, coding revealed a confound
between this variable and university affiliation. All of the OSU studies were all of the
Ohio studies; both of the UA studies were also both of the Alabama studies; and all of
the WM studies were conducted in Virginia schools. There was one Virginia study
from another university. Table 4 illustrates this overlap.
Table 4. Cross-tabulation of moderators: University affiliation and state.
OSU Other UA WM
Ohio 5 5 (20%)
Other 13 13 (52%)
Alabama 2 2 (8%)
Virginia 1 4 5 (20%)
5 (20%) 14 (56%) 2 (8%) 4 (16%) 25 (100%)
Since there was not enough variety in the groupings, state was eliminated as
a moderator. The decision to retain university affiliation was based on the
literature: Much of the CTE research has come out of Ohio State University, or from
researchers who had previous affiliations there. One of those researchers is now
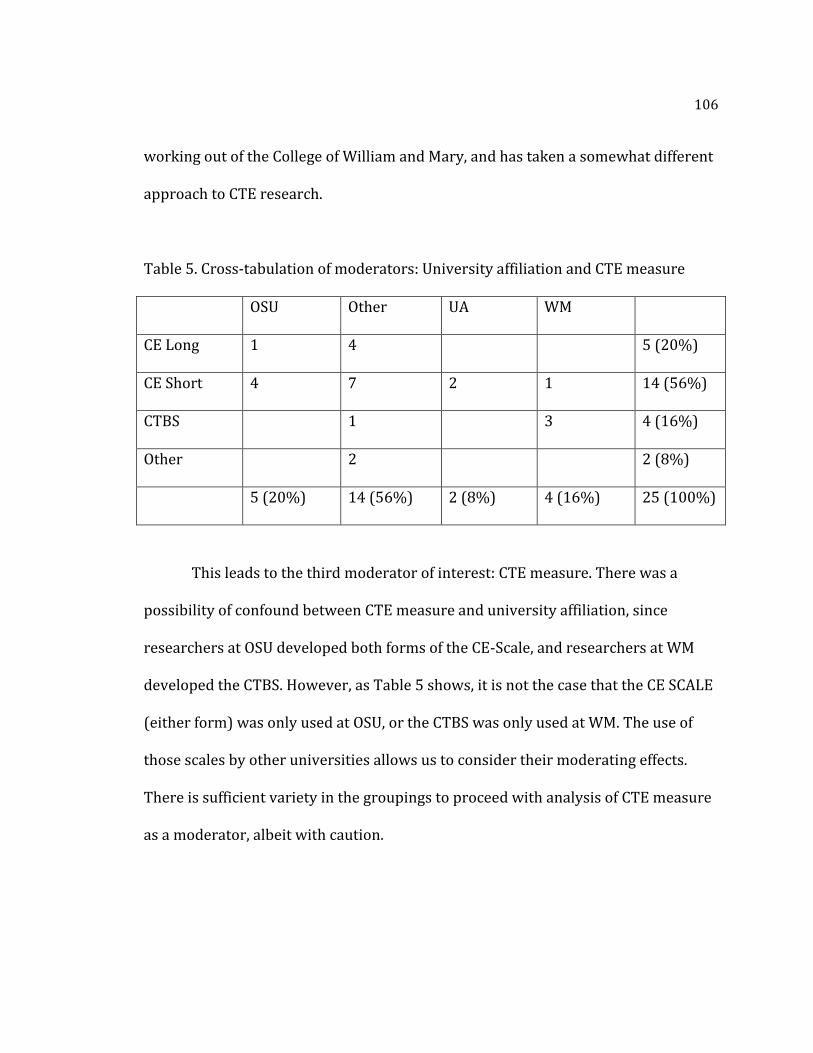
106
working out of the College of William and Mary, and has taken a somewhat different
approach to CTE research.
Table 5. Cross-tabulation of moderators: University affiliation and CTE measure
OSU Other UA WM
CE Long 1 4 5 (20%)
CE Short 4 7 2 1 14 (56%)
CTBS 1 3 4 (16%)
Other 2 2 (8%)
5 (20%) 14 (56%) 2 (8%) 4 (16%) 25 (100%)
This leads to the third moderator of interest: CTE measure. There was a
possibility of confound between CTE measure and university affiliation, since
researchers at OSU developed both forms of the CE-Scale, and researchers at WM
developed the CTBS. However, as Table 5 shows, it is not the case that the CE SCALE
(either form) was only used at OSU, or the CTBS was only used at WM. The use of
those scales by other universities allows us to consider their moderating effects.
There is sufficient variety in the groupings to proceed with analysis of CTE measure
as a moderator, albeit with caution.
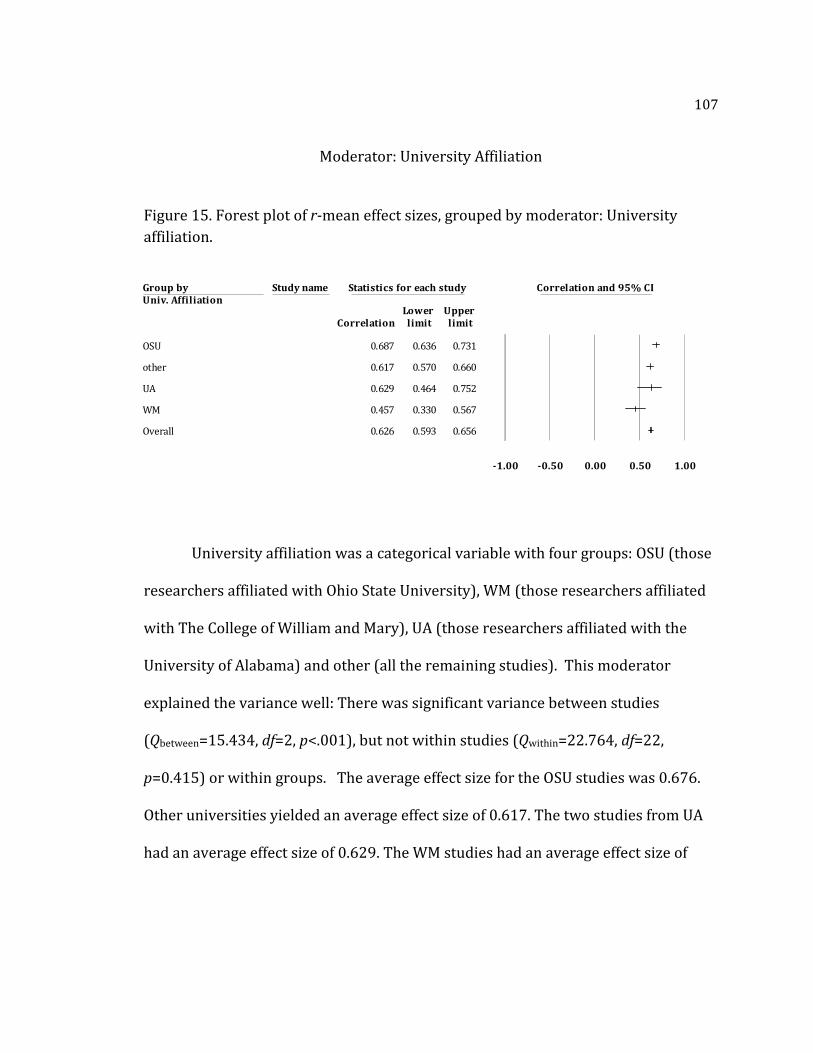
107
Group byUniv. Affiliation
Study name Statistics for each study Correlation and 95% CI
Lower Upper Correlation limit limit
OSU 0.687 0.636 0.731
other 0.617 0.570 0.660
UA 0.629 0.464 0.752
WM 0.457 0.330 0.567
Overall 0.626 0.593 0.656
-1.00 -0.50 0.00 0.50 1.00
Figure E. Forest Plot of r-mean effect sizes (N=26) grouped by moderator: university affiliation
Moderator: University Affiliation
Figure 15. Forest plot of r-mean effect sizes, grouped by moderator: University
affiliation.
University affiliation was a categorical variable with four groups: OSU (those
researchers affiliated with Ohio State University), WM (those researchers affiliated
with The College of William and Mary), UA (those researchers affiliated with the
University of Alabama) and other (all the remaining studies). This moderator
explained the variance well: There was significant variance between studies
(Qbetween=15.434, df=2, p<.001), but not within studies (Qwithin=22.764, df=22,
p=0.415) or within groups. The average effect size for the OSU studies was 0.676.
Other universities yielded an average effect size of 0.617. The two studies from UA
had an average effect size of 0.629. The WM studies had an average effect size of
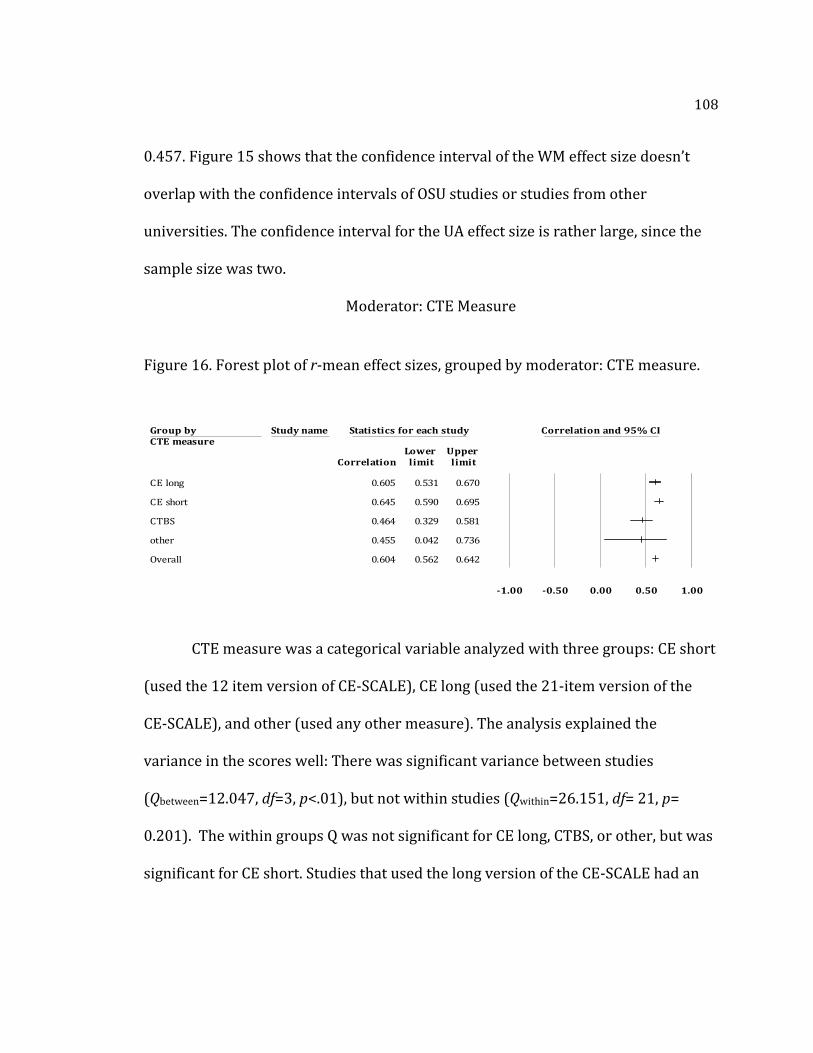
108
Group byCTE measure
Study name Statistics for each study Correlation and 95% CI
Lower Upper Correlation limit limit
CE long 0.605 0.531 0.670
CE short 0.645 0.590 0.695
CTBS 0.464 0.329 0.581
other 0.455 0.042 0.736
Overall 0.604 0.562 0.642
-1.00 -0.50 0.00 0.50 1.00
Figure E. Forest Plot of r-mean effect sizes (N=26) grouped by moderator: university affiliation
0.457. Figure 15 shows that the confidence interval of the WM effect size doesn’t
overlap with the confidence intervals of OSU studies or studies from other
universities. The confidence interval for the UA effect size is rather large, since the
sample size was two.
Moderator: CTE Measure
Figure 16. Forest plot of r-mean effect sizes, grouped by moderator: CTE measure.
CTE measure was a categorical variable analyzed with three groups: CE short
(used the 12 item version of CE-SCALE), CE long (used the 21-item version of the
CE-SCALE), and other (used any other measure). The analysis explained the
variance in the scores well: There was significant variance between studies
(Qbetween=12.047, df=3, p<.01), but not within studies (Qwithin=26.151, df= 21, p=
0.201). The within groups Q was not significant for CE long, CTBS, or other, but was
significant for CE short. Studies that used the long version of the CE-SCALE had an

109
average effect size of 0.605; studies that used the short version of the CE-SCALE had
an average effect size of 0.645; studies that used the CTBS had an average effect size
of 0.464; and studies that used some other measure (N=2) had an effect size of
0.455, and a large confidence interval. There was no overlap between the confidence
intervals for studies that used the short form of the CE-SCALE and studies that used
the CTBS. Figure 16 shows these confidence intervals.
Conclusion
The meta-analyses conducted for this sample demonstrate a strong positive
effect size for the relationship between CTE and achievement. As collective teacher
efficacy increases in a school, so does achievement. This holds true for all subject
areas measured, and regardless of timing of measurement.
Moderator analysis revealed that, compared to the rest of the sample, studies
that were affiliated with the College of William and Mary tended to have lower
average effect sizes, and studies that were affiliated with Ohio State University
tended to have higher average effect sizes. Another important moderator was the
tool used to measure collective teacher efficacy. Studies that used the short form of
the CE-SCALE (Goddard, 2002b) yielded higher effect sizes than studies that used
the CTBS (Tschannen-Moran & Barr, 2004).
110
CHAPTER 5
DISCUSSION
In this chapter, a summary of findings is presented, including both effect size
and moderator analysis. Next, the relevance of the findings is explored, so that the
study can be viewed in the larger context of the field. The third section describes the
limitations of this study, and finally, implications for future research are presented.
Summary of Findings
This meta-analysis demonstrated that collective teacher efficacy and student
achievement are strongly related. The strength of this relationship exists across
subject areas, when using varied instruments, and in multiple locations. This is the
first meta-analysis to address this relationship.
Effect Sizes
The first research question addressed the distribution of the effect sizes
measuring the relationship between collective teacher efficacy and student
achievement. The related hypothesis was supported: Collective teacher efficacy
(CTE) was strongly and positively associated with student achievement. In the
111
multiple meta-analyses conducted, the effect sizes for this relationship varied from
0.537 to 0.628, and the confidence intervals for these effect sizes overlapped,
showing similarity. The largest effect size was found for CTE and reading
achievement and the lowest was for CTE and social studies achievement. When all
correlations within a single study were averaged to r-mean, and the outlier was
removed, the effect size was 0.617. With the outlier included, the relationship was
still strong, with an effect size of 0.598.
Since these effect sizes are based on correlational research, the predictive
nature of this relationship can only be established when the measurement of CTE
preceeds the measure of achievement. The studies that measured CTE before
measuring achievement yielded an effect size of 0.626. Since a number of the
component studies used archival achievement data, this time-order structure was
not consistent. The studies that measured CTE and used historical achievement
data yielded an effect size of 0.565, and when the outlier was removed, the effect
size rose to 0.608. The studies that didn’t clearly describe the timing of the
measures yielded an effect size of 0.599. The confidence intervals of all three of
these conditions overlap.
Regardless of timing, the effect sizes are strong. Their similarity may suggest
stability over time. In fact, the possibility that CTE is a relatively stable trait was an
explanation given for the timing variation in at least two of the studies (M.
Tschannen-Moran, personal correspondence, November 22, 2010). A slightly
112
different rationale was offered as well: “The distinction may be an artifact of
research methods as opposed to genuine differences in antecedents versus
consequences” (M. Tschannen-Moran, personal correspondence, November 23,
2010). Neither of these explanations is satisfactory for this analysis, however,
because the purpose of this study and of many of the component studies was to
clearly quantify the effect size between CTE and subsequent achievement. This
muddies the waters, as it becomes difficult to delineate the predictive power of
prior achievement on CTE from the predictive power of CTE on subsequent
achievement.
An alternative explanation may find its roots in the reciprocal nature of
efficacy: As conceptualized in Bandura’s model of triadic reciprocal determinism
(1986), personal factors, behavior, and external factors all work bidirectionally,
influencing each other within human functioning. So in a particular context (school),
beliefs (personal factors) will influence achievement (behavior), and achievement
will influence beliefs. The model of teacher efficacy from Tschannen-Moran et al.
(1998) and the model of collective teacher efficacy from Goddard, Hoy, and
Woolfolk Hoy (2004) added directionality within a loop, such that achievement
affects effficacy, which affects achievement, and so on. Under this framework, the
results of this study could be interpreted thus: Using the model proposed by
Goddard, Hoy, and Woolfolk Hoy (2004), perceived collective efficacy was strongly
correlated with subsequent achievement (r = 0.626), and prior acheivement was
113
strongly correlated with subsequent perceived collective efficacy (r = 0.608). The
assumption made, however, is that all of the studies that measured achievement
before CTE can be reconceptualized as antecedent studies. Since this was not the
original intent, that assumption may be unsupported.
Reexamination of the data revealed that five of the six largest component
sample sizes (N ranging from 79 to 205) were from studies that measured CTE
before achievement. The diversity represented in these five studies make the results
generalizable. They were conducted in urban, suburban, and rural areas, with a
range of socioeconomic status, and some ethnic diversity (see Table 6). Because
these studies utilized the desired time-order, and were conducted with large,
diverse samples, they provide important evidence that CTE is related to subsequent
acheivement within a variety of environments and that the relationship may be
causal.
These results are consistent with the findings of the component studies, as
well as studies that were not included in the meta-analysis. Bandura’s path analysis
of the causal structure of school achievement (1993) showed that the effect of
collective efficacy on achievement was greater than the effect of SES on
achievement. Goddard, Hoy, and Woolfolk Hoy (2000) used hierarchical linear
modeling and found that collective teacher efficacy explained 53.27% of the
between-school variance in mathematics, and 69.64% of the same for reading.
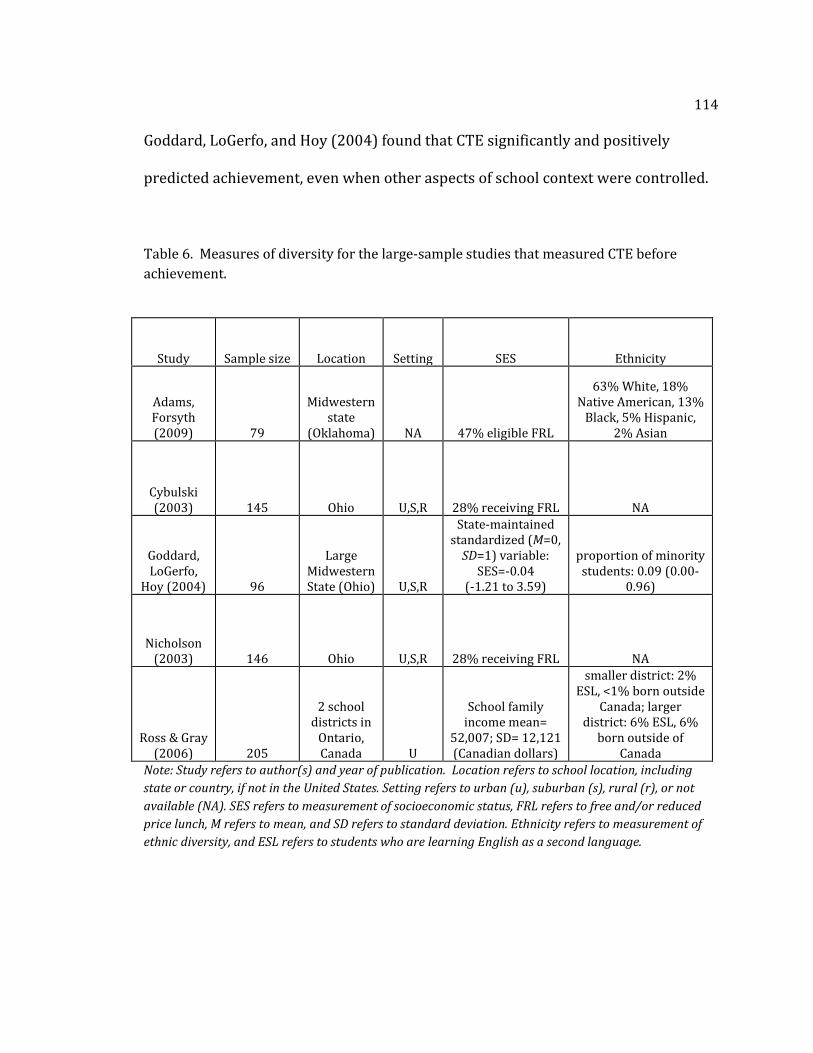
114
Goddard, LoGerfo, and Hoy (2004) found that CTE significantly and positively
predicted achievement, even when other aspects of school context were controlled.
Table 6. Measures of diversity for the large-sample studies that measured CTE before
achievement.
Study Sample size Location Setting SES Ethnicity
Adams, Forsyth (2009) 79
Midwestern state
(Oklahoma) NA 47% eligible FRL
63% White, 18% Native American, 13%
Black, 5% Hispanic, 2% Asian
Cybulski (2003) 145 Ohio U,S,R 28% receiving FRL NA
Goddard, LoGerfo,
Hoy (2004) 96
Large Midwestern State (Ohio) U,S,R
State-maintained standardized (M=0,
SD=1) variable: SES=-0.04
(-1.21 to 3.59)
proportion of minority students: 0.09 (0.00-
0.96)
Nicholson (2003) 146 Ohio U,S,R 28% receiving FRL NA
Ross & Gray (2006) 205
2 school districts in
Ontario, Canada U
School family income mean=
52,007; SD= 12,121 (Canadian dollars)
smaller district: 2% ESL, <1% born outside
Canada; larger district: 6% ESL, 6%
born outside of Canada
Note: Study refers to author(s) and year of publication. Location refers to school location, including
state or country, if not in the United States. Setting refers to urban (u), suburban (s), rural (r), or not
available (NA). SES refers to measurement of socioeconomic status, FRL refers to free and/or reduced
price lunch, M refers to mean, and SD refers to standard deviation. Ethnicity refers to measurement of
ethnic diversity, and ESL refers to students who are learning English as a second language.
115
In order to interpret effect sizes, it is important to understand relative
strength. Cohen (1988) proposed general benchmarks for evaluating the strength of
an effect size. For correlational research, Cohen labeled an effect size as small if r =
0.10, medium if r = 0.30, and large if r = 0.50. Since Cohen chose these quantities to
provide only a general yardstick for the behavioral sciences, caution must be
exercised in interpretation (Valentine & Cooper, 2003). To provide points of
comparison, a search for other meta-analyses examining the correlational effect of
various factors on school achievement was conducted. Bulris (2009) found that
school culture had a strong moderate effect (r = 0.349) on student achievement.
Waters and Marzano (2006) found a positive correlation (r = 0.24) between district
leadership and school achievement. Sirin (2005) examined the effect size for the
relationship between socioeconomic status and school achievement. At the
individual level, the effect was moderate (r = 0.27), and at the collective level, the
effect was strong (r = 0.67). Within educational research, there is a likelihood of
smaller effect sizes (Valentine & Cooper, 2003), so the effect sizes from this study
can confidently be considered strong. The beliefs that teachers hold about the
ability of the school as a whole to promote positive outcomes were predictive of
positive learning outcomes for their students.
116
Moderator Analysis
The second research question addressed moderator variables, considering
possible explanations of the variance between studies. As hypothesized, researcher
affiliation and CTE instrument both explained some of the variance. The possible
interaction of these moderators made the analysis complex, and the hypothesized
moderator, state, was eliminated from analysis because the available studies did not
provide enough variety to ascertain any moderating effect that could be distinct
from university affiliation (all of the studies conducted in Ohio were all of the
studies affiliated with Ohio State University, and four out of the five Virginia studies
were conducted out of the College of William and Mary).
Studies from Ohio State University had significantly higher effect sizes that
studies from the College of William and Mary, and there was no overlap in their
confidence intervals. This indicates that there is something that distinguishes
research at one institution from research at another.
Perhaps the distinction has to do with the population being sampled: All of
the OSU studies sampled Ohio schools, and all of the WM studies sampled Virginia
schools. This study doesn’t not provide enough evidence to explore this further. The
only data point that could be relevant to that discussion is the one study conducted
in Virginia schools not affiliated with WM (Washburn, 2006), which had a higher
effect size than the other Virginia studies.
117
Another potential reason for the distinction may be found in the study
designs. Qualitative study may reveal patterns in the types of statistics used,
methodologies, or assumptions about CTE. The core of CTE research began at OSU,
and included Tschannen-Moran, who is currently on the faculty at The College of
William and Mary. She did her graduate work at Ohio State University, along with
Goddard, Cybulski, and Tarter (who supervised three of the component
dissertations), working with faculty members Hoy and Woolfolk Hoy. As she has
carried this line of research with her to the College of William and Mary, perhaps
that she has taken a slightly different, more cautious approach to CTE research.
The second significant moderator was CTE measure: Studies that used the
CE-SCALE (Goddard, et al., 2000; Goddard, 2002b), had higher average effect sizes
than studies that used the CTBS (Tschannen-Moran & Barr, 2004). In fact, there was
no overlap in the confidence intervals of the effect sizes from studies that used the
short form of the CE-SCALE (Goddard, 2002b) and studies that used the CTBS.
The CE-SCALE includes items that address task analysis and group
competence (Goddard et al., 2000). Tschannen-Moran and Barr (2004) developed
the CTBS (with subscales for instructional strategies and student discipline) because
of concerns that the CE-SCALE “artificially drives down the collective efficacy scores
of schools in more challenging environments by its explicit measure of task
difficulty” (Tschannen-Moran & Barr, 2004, p. 199). Both of these instruments can
be found in Appendix D.
118
If the CE-SCALE does indeed drive scores down, then challenging schools
would have lower scores than less challenging schools. If a challenging school is one
in which achievement is low, then there would be a pattern of high correlation
between CTE and achievement. Perhaps this is why studies that used the CE-SCALE
yielded a higher effect size.
There was not enough data to examine such moderators as socioeconomic
status or adminstrative leadership style. Perhaps that sort of information could help
to further explain the variance, and help to operationalize what it means to call a
school a challenging environment.
Relevance
This meta-analysis adds to existing evidence about the connection between
CTE and achievement. The connection between collective teacher efficacy and
student achievement is particularly salient now, as the United States considers the
role of teachers in schools. At the time of this writing, a controversial piece of
legislation moving through the Wisconsin legislature would remove collective
bargaining rights from public unions, including teachers’ unions (Maher & Brat,
2011); the Florida Senate has passed a bill that institutes a merit pay system that is
based on student achievement, as measured by standardized tests, and creates one
year contracts for all teachers, eliminating tenure (March & Silvestrini, 2011); and in
his 2011 Annual Letter, Bill Gates describes the goals of the Bill and Melinda Gates
Foundation to study and invest in ways to improve teacher effectiveness (Gates,
119
2011). Philanthropists and politicians are involved in the nation’s conversations
about education and what is necessary for high achieving schools, and much of what
is being proposed conveys an underlying message that teachers just aren’t doing a
good enough job. Education historian Diane Ravitch (2010) describes the Obama
administration’s Race to the Top program as a continuation of the overemphasis on
testing that No Child Left Behind brought. This is demoralizing to teachers, and puts
the focus on the wrong things, she says: “By its words and actions, the
administration seems to assume that the school gets low scores because it has a bad
principal or bad teachers. But the staff may be heroic in the face of daily challenges;
they may be operating with fewer resources than schools in affluent neighborhoods.
Absent individual evaluations, it seems unfair to conclude that the staff is failing”
(Ravitch, 2010, ¶ 17). Commenting on Chicago mayor Richard Daley’s claim that
teachers only work six hours a day (Pearson, 2011), educator and author Greg
Michie says, “The ‘new reformers’ have been so successful in framing the debate
around public education that teachers and their advocates are left spending way too
much time on the defensive. And that causes us all to take our eyes off the things
that need attention if we really want to work toward equal opportunities and
outcomes for all children” (Michie, 2011, ¶ 8). The current antagonism toward
schools and teachers has the potential to corrode any sense of collective efficacy
that has been built in our schools.
120
CTE-achievement research suggests that in order to improve schools,
teachers must feel empowered to do so, instead of feeling blamed for things beyond
their control. In 2010, 51.1% of Illinois public schools did not make adequate yearly
progress (AYP) (Illinois State Board of Education, Data Analysis and Progress
Reporting Division, 2010). CTE research suggests that working to bolster faculty
efficacy in Illinois schools could have a positive effect on student achievement in the
future. The trouble is that schools that don’t make AYP are at risk of increased
deterioration of collective efficacy. In situations such as these, when the failure of
mastery experiences lowers efficacy, administrators may need to bolster efficacy
through social persuasion or vicarious experiences. This means that efforts for
school reform must be proactive, rather than reactive: Resources should be focused
on supporting, empowering, and encouraging faculties, as opposed to stripping
away power, threatening job security, or basing pay on test scores.
Collective efficacy is a group attribute, and groups are made of individuals.
Collective efficacy can be threatened or strengthened by an influential few
(Bandura, 2000). Administrators would do well to note the ways in which a
powerful but vocal minority can influence collective beliefs. Low efficacy beliefs are
contagious, and can influence willingness to try. If teachers don’t feel that their
efforts will lead to success, they are, potentially, less likely to dedicate the energy
needed in order to make a positive impact. However, confidence in collective ability
can also be contagious. If break room chatter revolves around successes,
121
overcoming obstacles, and opportunities to make a difference, the social norms of a
faculty may be established such that new faculty members realize that optimism,
dedication, and resilience characterize the school. This reveals the social-cognitive
nature of the construct: Together, a faculty builds efficacy.
The future of education depends on capable faculties who feel that their hard
work can lead to positive outcomes. Currently, teachers in the United States are
encountering increased opposition and discouragement. A strong sense that as a
group, a faculty can do great things in a school can be protective. “People’s beliefs in
their collective efficacy influence the type of futures they seek to achieve; how well
they use their resources; how much effort they put into their group endeavor; their
staying power when collective efforts fail to produce quick results or meet forcible
opposition; and their vulnerability to discouragement” (Bandura, 1998, p 65).
An understanding of the importance of collective teacher efficacy can
influence teacher preparation, recruitment, and retention. Perhaps the educational
system needs to re-envision teaching effectiveness, with a focus on encouraging and
sustaining beliefs that educators and schools can make a difference, rather than
simply asking for high test scores. Perhaps school accountability has more to do
with the beliefs and attitudes that the school collectively holds about its potential
for success than was previously considered. President Obama has said that “he will
push to end the use of ineffective, ‘off-the-shelf’ tests, and support new, state-of-the-
art assessment and accountability systems that provide timely and useful
122
information about the learning and progress of individual students”
(whitehouse.gov, n.d, Reform and Invest in K-12 Education section, para. 2). While
the progress of the students is the end goal, it should not be the only variable
measured. If the Obama administration is serious about moving away from sole
reliance on high stakes testing, perhaps it should consider how collective efficacy
research can provide one of many starting points for positive change in the school
system.
Limitations
There are some limitations inherent in meta-analysis. Conducting a meta-
analysis involves methodical steps and procedures, with many possible choices
along the way. Clarity of methods is intended to address the choices made, but there
is always the possibility that varying the inclusion/exclusion criteria, the coding
categories, or the statistical procedures would produce different results. A related
concern is the apples and oranges issue: the mix of studies synthesized may be too
dissimilar to yield meaningful overall results (Lipsey and Wilson, 2001). Within this
meta-analysis, this problem became apparent when examining how the variables
were defined. Student achievement was operationalized in numerous ways, and
CTE, in a few ways. Additionally, there was some discrepancy concerning the timing
of the measures. As previously stated, although the component studies addressed
the correlation between CTE and achievement, some were clearer when
distinguishing prior achievement from subsequent achievement. This posed a
123
problem because that inconsistency reduces the certainty of any conclusions drawn
about how CTE can predict achievement.
Another limitation for this meta-analysis was the small number of studies
sampled. This line of research is less than 20 years old, and relies on a handful of
studies to demonstrate the relationship in question. Many of the lead researchers,
having determined that there is a positive correlation between CTE and
achievement, have gone on to explore other related areas. Of the original studies
located, a number had to be excluded because they did not report the simple
correlation, even though they explored the relationship. Further study could seek to
include these results in some way.
Correlational research can only go so far. The effect size for this meta-
analysis came from Pearson product-moment correlations, which quantify the
strength of a relationship. While there will always be a correlation between cause
and effect, correlation is not sufficient to determine causation. This research makes
it clear that CTE and school achievement vary together: They are strongly and
positively correlated, but this study is limited because it cannot address causation.
Researchers are looking to uncover what other variables affect CTE and student
achievement. These relationships can be explored in more complex ways, and it
may not be sufficient to just talk about correlation.
One limitation of CTE research, in general, is the level of analysis problem.
The measures of collective efficacy beliefs used in the component studies aggregate
124
individual beliefs about the functioning of the collective. While this is an
improvement over measures that would simply aggregate individual teacher
efficacy scores, it still relies on individuals to make judgments about collective
functioning (Bandura, 1997, 2000). Bandura (2000) suggests another option for
measuring perceived collective efficacy, wherein group members deliberate to
arrive at a consensual judgment. This method, Bandura goes on, is severely limited,
as groups can be subject to social persuasion and the influence of a powerful few. So
while the existing measures are the most sound, one still must remember that
measuring beliefs of the collective always involves individual perception.
The confounding of moderator variables was a particular limitation for this
study. Nothing could be said about the location of the studies, since that variable
was confounded with the university affiliation of the authors. It remains to be seen if
schools in Virginia are somehow different enough from schools in Ohio to impact the
relationship between collective teacher efficacy and student achievement.
Additionally, although university affiliation and CTE measure were both able to
explain the between-groups variance, those two variables may not be completely
independent of one another, as the two main CTE measures were developed in the
two main universities studied.
Implications for future research
This meta-analysis can provide a starting point for further study that can
clarify some of the limitations.
125
Since CTE research so far has been carried out primarily by researchers with
ties to Ohio State University, and since university affiliation was an effective
moderator, systematic qualitative study could seek to uncover patterns in research
design and methodology. Studies conducted out of various universities could add to
the literature as well, and it would be interesting to revisit this meta-analysis in ten
or twenty years, to see where the research has moved.
Future research should continue to examine the various measures of CTE, to
determine predictive power in a variety of settings and types of schools. Taken
together, Tschannen-Moran and Barr’s reservations about the CE-SCALE (2004) and
the results of the moderator analysis concerning CTE instrument suggest that
instruments should be compared and examined for potential limitations with
challenging populations. Ideally, this could be studied within one diverse state,
wherein all schools use the same measure of achievement, and yet, there is a wide
range of school functioning and health (more challenging to less challenging
environments).
In order to investigate collective efficacy in schools around the country,
studies could be designed that use an achievement measure that is standardized
across states, so that regional diversity could be more completely represented.
Another reason to conduct more CTE-achievement research in a variety of
school systems is to see how CTE makes a difference in schools that face
considerable challenges and potential restructuring. Since the socioeconomic status
126
of a neighborhood cannot be easily changed, it become important to find variables in
the system that can manipulated in order to foster school improvement. Research
in this area could have important implications for our country’s attempts to improve
schools. This type of research can also seek to define what is considered to be a
challenging population. Perhaps schools can be grouped by measures of adequate
yearly progress (AYP). In Illinois, the AYP performance target for 2010 was at least
77.5% Meeting/Exceeding standards for all students and each subgroup in
mathematics and reading (Illinois State Board of Education, 2010). Since AYP is a
federally mandated measure of school success, this may be a viable way to
determine what constitutes a challenging population.
The issue of timing in CTE research needs to be addressed more clearly, so
that distinctions can be made between antecedent and consequence. The cyclical
nature of efficacy makes this a challenge. Longitudinal studies examining year to
year changes in CTE, achievement, and school contextual variables may reveal
patterns that are not evident in short-term research. This could lead to exploration
of an alternative approach to the teaching profession, one in which a more fluid
career is encouraged. Perhaps teachers need to feel that they can alternate between
more challenging and less challenging environments, building efficacy, then taking it
to the schools that need it the most. When teachers are full of optimism and passion
for the field, they can, together, raise collective efficacy and create school climates in
which teachers are setting high expectations and displaying the resilience needed to
127
overcome obstacles. When collective efficacy begins to slip, perhaps it’s time for a
change: Those teachers that are burned out and feeling less efficacious can
transition to less challenging schools to rebuild CTE. Perhaps these shifts can occur
within a school building: sharing responsibility, changing classrooms, not remaining
in a rut. An approach like this must be carefully considered, as it could have far-
reaching ramifications.
In order to assist schools as they seek to build collective efficacy, research
should look at antecedents of efficacy as possible intervention points. Future
studies could consider how to set up mastery experiences so that faculties have
access to opportunities to feel success. Studies could examine the effects of vicarious
experiences as faculties examine other similar schools and programs that are
successful. Examination of schools that work could provide a template of success
and bolster feelings of perceived control. Research could focus on the ways that
administrators take advantage of the potential positive effects of social persuasion.
Like a coach giving a pep talk, leaders in school can work to combat pessimism and
hopelessness among the faculty by encouraging passion and commitment, and
reminding teachers of their power of their profession, the strength of their
preparation, and their commitment to excellence. Affective states can be felt at the
school level (Goddard, Hoy, & Woolfolk Hoy, 2000), and research can help faculties
acknowledge the ways that they deal with stressors, so that coping methods are not
dysfunctional. This may involve considering how the group reacts to certain stimuli
128
(like student demographics), and how perceptions about success or failure are
shaped by the environment.
Since CTE research has been firmly planted within the framework of social
cognitive theory, future research could build bridges to other theoretical
perspectives. As Adams and Forsyth (2006) suggest, perhaps a reintroduction of
locus of control theory would be beneficial, examining not only the four sources of
efficacy information, but also contextual variables that influence efficacy. This
connection may help to explain why the correlation between CTE and achievement
is lower for some schools- perhaps contextual variables exert more influences in
some environments. Another connection to a different perspective becomes
possible when examining the model of collective efficacy from Goddard, Hoy, and
Woolfolk Hoy (2004) in light of control systems theory. The model of collective
efficacy in schools can be viewed as a closed loop, which is described as a system in
which perception influences response and response influences perception (Cziko,
1992). If, as has been suggested, the difference between antecedents and
consequences is difficult to parse, examination of this process within a feedback
loop may be illuminating.
Conclusion
The research presented in this dissertation fills a gap in the literature by
systematically analyzing studies of collective teacher efficacy and achievement. This
meta-analysis is the first to assemble the studies of this nature, present an average
129
effect size, and consider what variables moderate the differences between studies.
The results show that collective teacher efficacy is strongly related to achievement
in schools. The strength of that relationship was moderated in this study by
instrument used to measure efficacy and researcher affiliation. This study is
relevant because it speaks to a possible change point in the educational system.
Social cognitive theory espouses a model of triadic reciprocal determinism in which
beliefs affect behavior and environment, and environment and behavior have an
effect on beliefs. At the collective level, the beliefs that teachers hold about their
school’s ability to affect achievement are important to the success of that school.
Intervention efforts can be directed at building efficacy, so that teachers approach
their schools ready, willing, and able to be effective.
130
APPENDIX A
INITIAL SCREENING SPREADSHEET
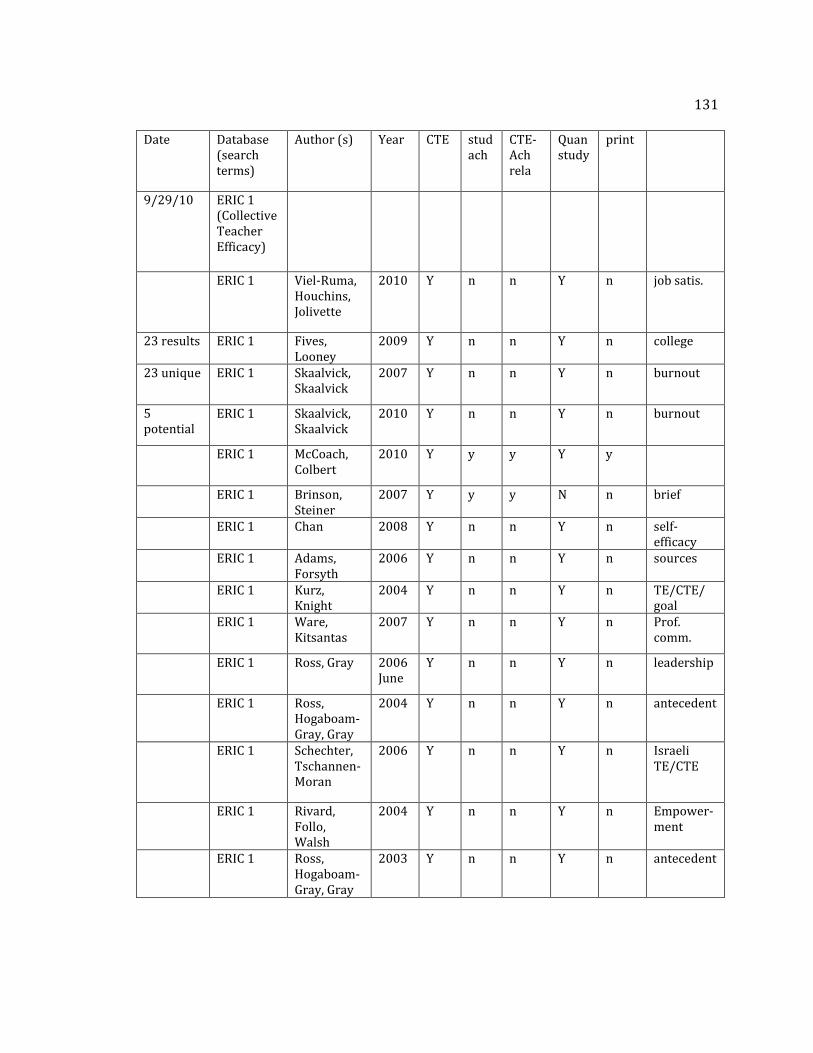
131
Date Database (search terms)
Author (s) Year CTE stud ach
CTE- Ach rela
Quan study
9/29/10 ERIC 1 (Collective Teacher Efficacy)
ERIC 1 Viel-Ruma, Houchins, Jolivette
2010 Y n n Y n job satis.
23 results ERIC 1 Fives, Looney
2009 Y n n Y n college
23 unique ERIC 1 Skaalvick, Skaalvick
2007 Y n n Y n burnout
5 potential
ERIC 1 Skaalvick, Skaalvick
2010 Y n n Y n burnout
ERIC 1 McCoach, Colbert
2010 Y y y Y y
ERIC 1 Brinson, Steiner
2007 Y y y N n brief
ERIC 1 Chan 2008 Y n n Y n self-efficacy
ERIC 1 Adams, Forsyth
2006 Y n n Y n sources
ERIC 1 Kurz, Knight
2004 Y n n Y n TE/CTE/ goal
ERIC 1 Ware, Kitsantas
2007 Y n n Y n Prof. comm.
ERIC 1 Ross, Gray 2006 June
Y n n Y n leadership
ERIC 1 Ross, Hogaboam-Gray, Gray
2004 Y n n Y n antecedent
ERIC 1 Schechter, Tschannen-Moran
2006 Y n n Y n Israeli TE/CTE
ERIC 1 Rivard, Follo, Walsh
2004 Y n n Y n Empower-ment
ERIC 1 Ross, Hogaboam-Gray, Gray
2003 Y n n Y n antecedent
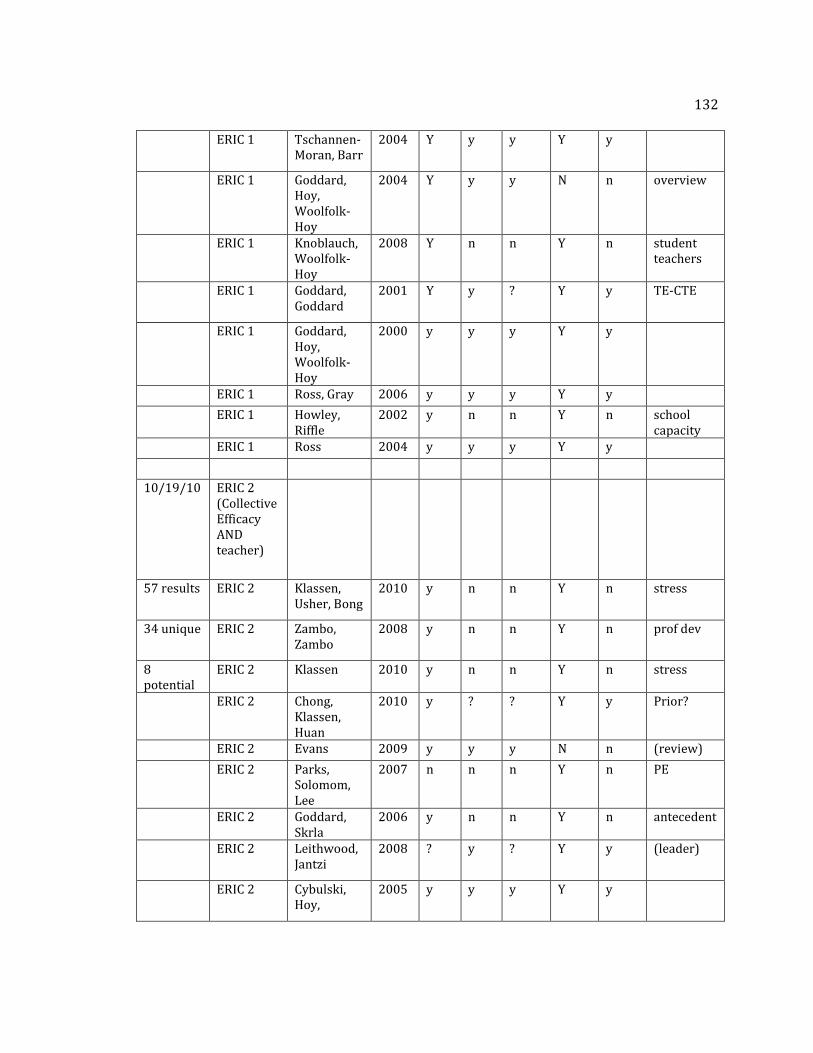
132
ERIC 1 Tschannen-Moran, Barr
2004 Y y y Y y
ERIC 1 Goddard, Hoy, Woolfolk-Hoy
2004 Y y y N n overview
ERIC 1 Knoblauch, Woolfolk-Hoy
2008 Y n n Y n student teachers
ERIC 1 Goddard, Goddard
2001 Y y ? Y y TE-CTE
ERIC 1 Goddard, Hoy, Woolfolk-Hoy
2000 y y y Y y
ERIC 1 Ross, Gray 2006 y y y Y y
ERIC 1 Howley, Riffle
2002 y n n Y n school capacity
ERIC 1 Ross 2004 y y y Y y
10/19/10 ERIC 2 (Collective Efficacy AND teacher)
57 results ERIC 2 Klassen, Usher, Bong
2010 y n n Y n stress
34 unique ERIC 2 Zambo, Zambo
2008 y n n Y n prof dev
8 potential
ERIC 2 Klassen 2010 y n n Y n stress
ERIC 2 Chong, Klassen, Huan
2010 y ? ? Y y Prior?
ERIC 2 Evans 2009 y y y N n (review)
ERIC 2 Parks, Solomom, Lee
2007 n n n Y n PE
ERIC 2 Goddard, Skrla
2006 y n n Y n antecedent
ERIC 2 Leithwood, Jantzi
2008 ? y ? Y y (leader)
ERIC 2 Cybulski, Hoy,
2005 y y y Y y
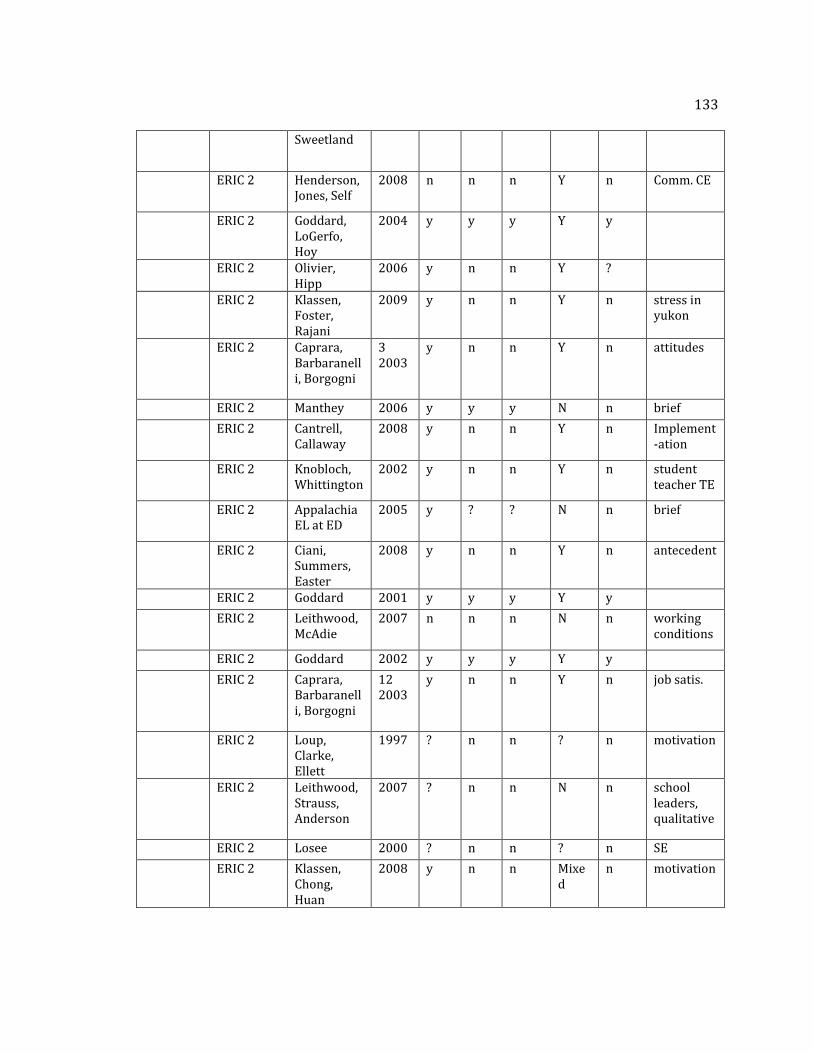
133
Sweetland
ERIC 2 Henderson, Jones, Self
2008 n n n Y n Comm. CE
ERIC 2 Goddard, LoGerfo, Hoy
2004 y y y Y y
ERIC 2 Olivier, Hipp
2006 y n n Y ?
ERIC 2 Klassen, Foster, Rajani
2009 y n n Y n stress in yukon
ERIC 2 Caprara, Barbaranelli, Borgogni
3 2003
y n n Y n attitudes
ERIC 2 Manthey 2006 y y y N n brief
ERIC 2 Cantrell, Callaway
2008 y n n Y n Implement-ation
ERIC 2 Knobloch, Whittington
2002 y n n Y n student teacher TE
ERIC 2 Appalachia EL at ED
2005 y ? ? N n brief
ERIC 2 Ciani, Summers, Easter
2008 y n n Y n antecedent
ERIC 2 Goddard 2001 y y y Y y
ERIC 2 Leithwood, McAdie
2007 n n n N n working conditions
ERIC 2 Goddard 2002 y y y Y y
ERIC 2 Caprara, Barbaranelli, Borgogni
12 2003
y n n Y n job satis.
ERIC 2 Loup, Clarke, Ellett
1997 ? n n ? n motivation
ERIC 2 Leithwood, Strauss, Anderson
2007 ? n n N n school leaders, qualitative
ERIC 2 Losee 2000 ? n n ? n SE
ERIC 2 Klassen, Chong, Huan
2008 y n n Mixed
n motivation
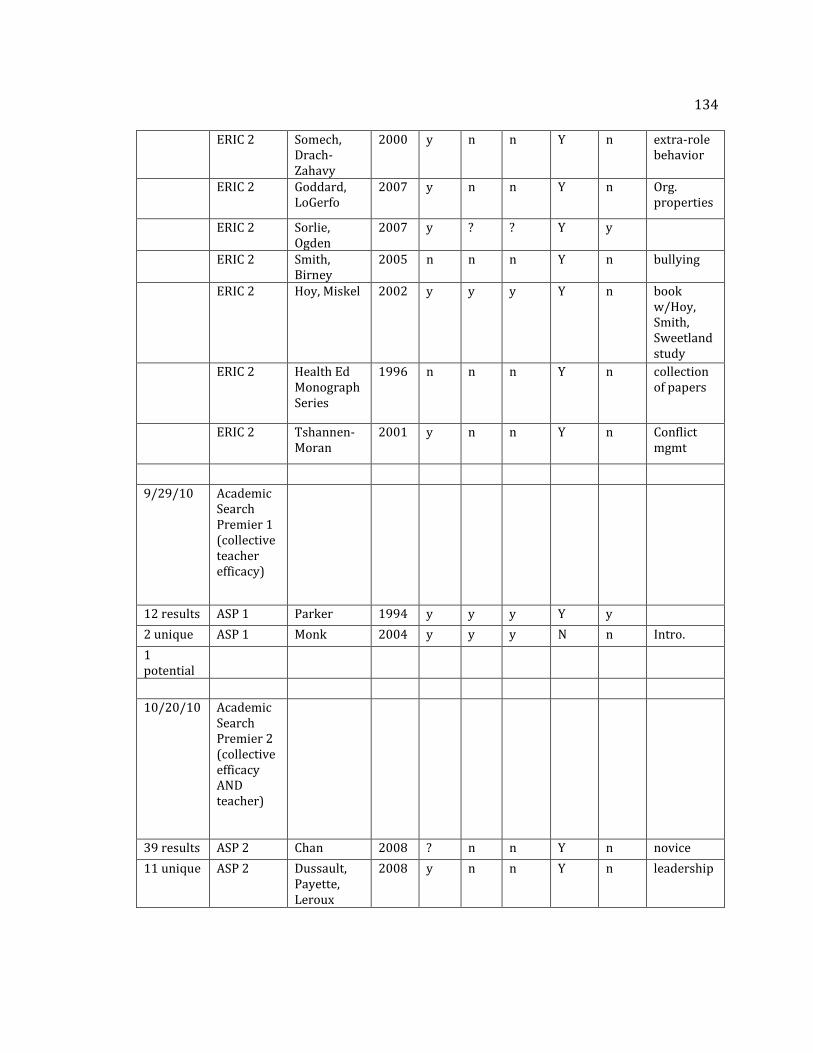
134
ERIC 2 Somech, Drach-Zahavy
2000 y n n Y n extra-role behavior
ERIC 2 Goddard, LoGerfo
2007 y n n Y n Org. properties
ERIC 2 Sorlie, Ogden
2007 y ? ? Y y
ERIC 2 Smith, Birney
2005 n n n Y n bullying
ERIC 2 Hoy, Miskel 2002 y y y Y n book w/Hoy, Smith, Sweetland study
ERIC 2 Health Ed Monograph Series
1996 n n n Y n collection of papers
ERIC 2 Tshannen-Moran
2001 y n n Y n Conflict mgmt
9/29/10 Academic Search Premier 1 (collective teacher efficacy)
12 results ASP 1 Parker 1994 y y y Y y
2 unique ASP 1 Monk 2004 y y y N n Intro.
1 potential
10/20/10 Academic Search Premier 2 (collective efficacy AND teacher)
39 results ASP 2 Chan 2008 ? n n Y n novice
11 unique ASP 2 Dussault, Payette, Leroux
2008 y n n Y n leadership
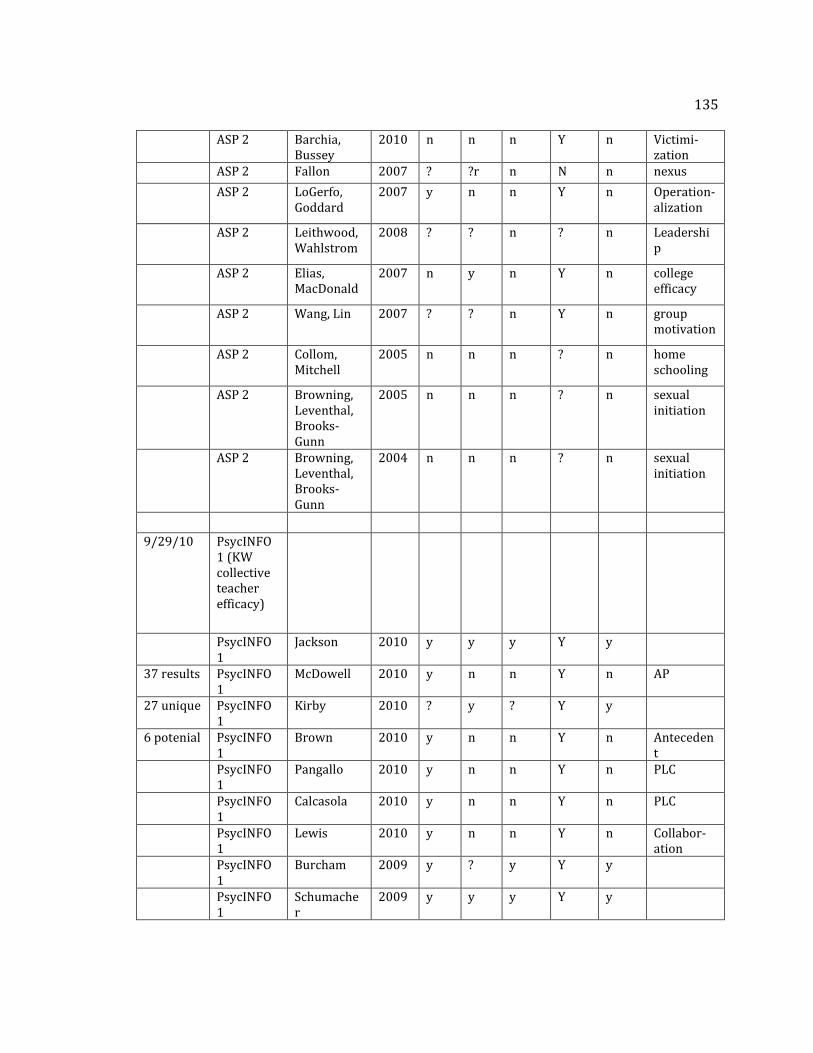
135
ASP 2 Barchia, Bussey
2010 n n n Y n Victimi-zation
ASP 2 Fallon 2007 ? ?r n N n nexus
ASP 2 LoGerfo, Goddard
2007 y n n Y n Operation-alization
ASP 2 Leithwood, Wahlstrom
2008 ? ? n ? n Leadership
ASP 2 Elias, MacDonald
2007 n y n Y n college efficacy
ASP 2 Wang, Lin 2007 ? ? n Y n group motivation
ASP 2 Collom, Mitchell
2005 n n n ? n home schooling
ASP 2 Browning, Leventhal, Brooks-Gunn
2005 n n n ? n sexual initiation
ASP 2 Browning, Leventhal, Brooks-Gunn
2004 n n n ? n sexual initiation
9/29/10 PsycINFO 1 (KW collective teacher efficacy)
PsycINFO 1
Jackson 2010 y y y Y y
37 results PsycINFO 1
McDowell 2010 y n n Y n AP
27 unique PsycINFO 1
Kirby 2010 ? y ? Y y
6 potenial PsycINFO 1
Brown 2010 y n n Y n Antecedent
PsycINFO 1
Pangallo 2010 y n n Y n PLC
PsycINFO 1
Calcasola 2010 y n n Y n PLC
PsycINFO 1
Lewis 2010 y n n Y n Collabor-ation
PsycINFO 1
Burcham 2009 y ? y Y y
PsycINFO 1
Schumacher
2009 y y y Y y
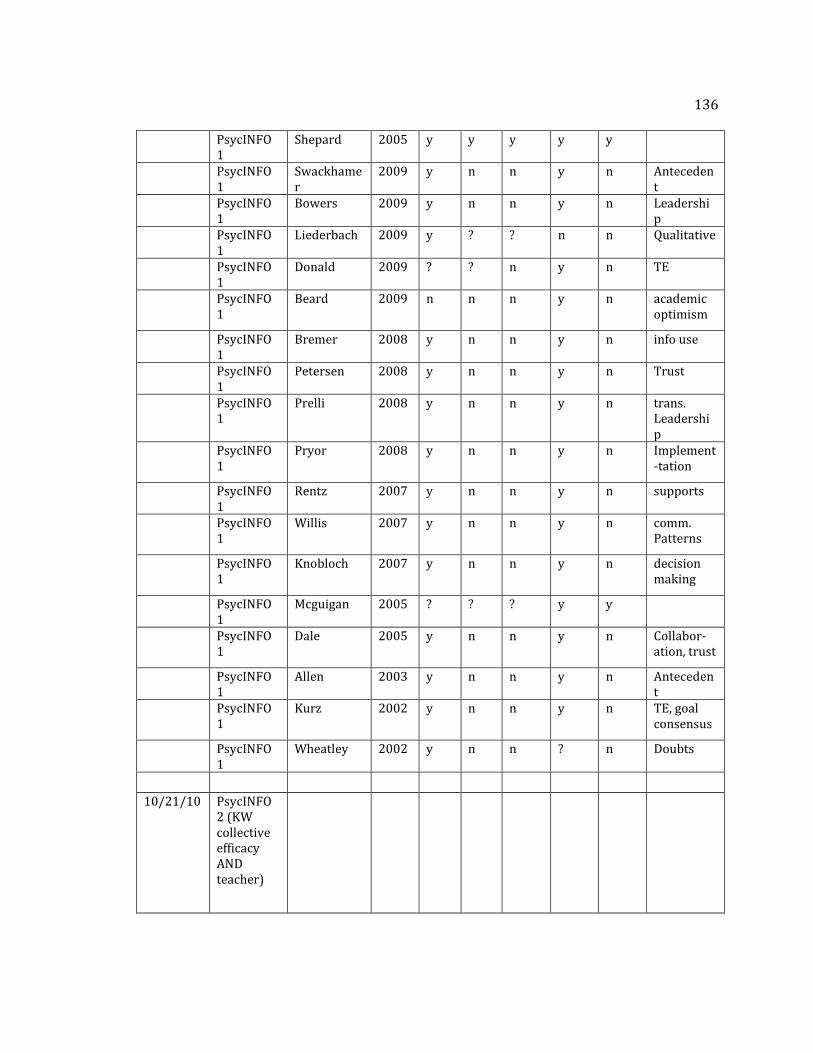
136
PsycINFO 1
Shepard 2005 y y y y y
PsycINFO 1
Swackhamer
2009 y n n y n Antecedent
PsycINFO 1
Bowers 2009 y n n y n Leadership
PsycINFO 1
Liederbach 2009 y ? ? n n Qualitative
PsycINFO 1
Donald 2009 ? ? n y n TE
PsycINFO 1
Beard 2009 n n n y n academic optimism
PsycINFO 1
Bremer 2008 y n n y n info use
PsycINFO 1
Petersen 2008 y n n y n Trust
PsycINFO 1
Prelli 2008 y n n y n trans. Leadership
PsycINFO 1
Pryor 2008 y n n y n Implement-tation
PsycINFO 1
Rentz 2007 y n n y n supports
PsycINFO 1
Willis 2007 y n n y n comm. Patterns
PsycINFO 1
Knobloch 2007 y n n y n decision making
PsycINFO 1
Mcguigan 2005 ? ? ? y y
PsycINFO 1
Dale 2005 y n n y n Collabor-ation, trust
PsycINFO 1
Allen 2003 y n n y n Antecedent
PsycINFO 1
Kurz 2002 y n n y n TE, goal consensus
PsycINFO 1
Wheatley 2002 y n n ? n Doubts
10/21/10 PsycINFO 2 (KW collective efficacy AND teacher)
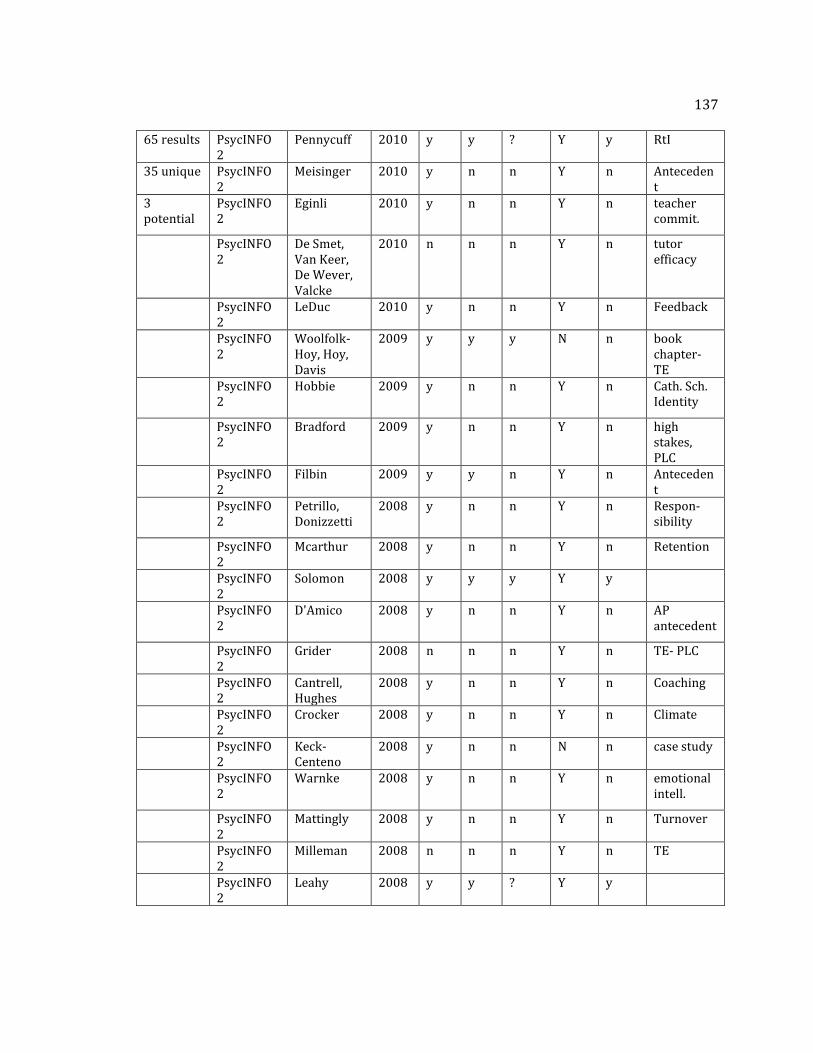
137
65 results PsycINFO 2
Pennycuff 2010 y y ? Y y RtI
35 unique PsycINFO 2
Meisinger 2010 y n n Y n Antecedent
3 potential
PsycINFO 2
Eginli 2010 y n n Y n teacher commit.
PsycINFO 2
De Smet, Van Keer, De Wever, Valcke
2010 n n n Y n tutor efficacy
PsycINFO 2
LeDuc 2010 y n n Y n Feedback
PsycINFO 2
Woolfolk-Hoy, Hoy, Davis
2009 y y y N n book chapter- TE
PsycINFO 2
Hobbie 2009 y n n Y n Cath. Sch. Identity
PsycINFO 2
Bradford 2009 y n n Y n high stakes, PLC
PsycINFO 2
Filbin 2009 y y n Y n Antecedent
PsycINFO 2
Petrillo, Donizzetti
2008 y n n Y n Respon-sibility
PsycINFO 2
Mcarthur 2008 y n n Y n Retention
PsycINFO 2
Solomon 2008 y y y Y y
PsycINFO 2
D'Amico 2008 y n n Y n AP antecedent
PsycINFO 2
Grider 2008 n n n Y n TE- PLC
PsycINFO 2
Cantrell, Hughes
2008 y n n Y n Coaching
PsycINFO 2
Crocker 2008 y n n Y n Climate
PsycINFO 2
Keck-Centeno
2008 y n n N n case study
PsycINFO 2
Warnke 2008 y n n Y n emotional intell.
PsycINFO 2
Mattingly 2008 y n n Y n Turnover
PsycINFO 2
Milleman 2008 n n n Y n TE
PsycINFO 2
Leahy 2008 y y ? Y y
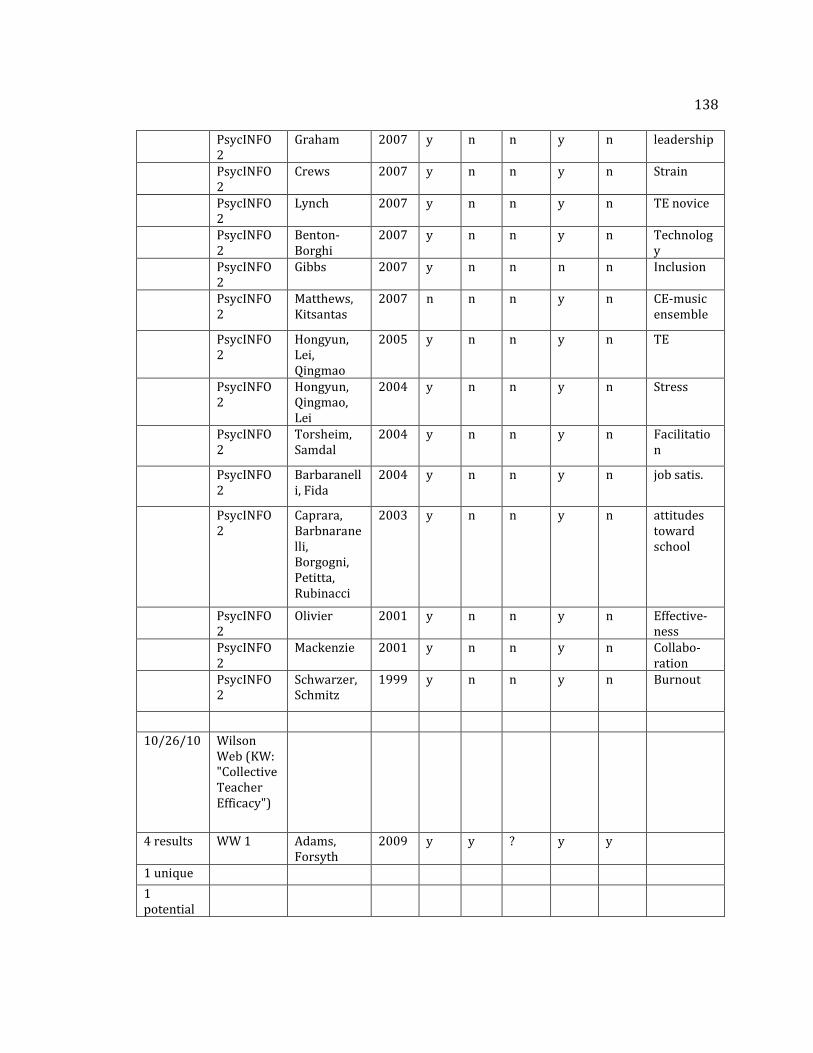
138
PsycINFO 2
Graham 2007 y n n y n leadership
PsycINFO 2
Crews 2007 y n n y n Strain
PsycINFO 2
Lynch 2007 y n n y n TE novice
PsycINFO 2
Benton-Borghi
2007 y n n y n Technology
PsycINFO 2
Gibbs 2007 y n n n n Inclusion
PsycINFO 2
Matthews, Kitsantas
2007 n n n y n CE-music ensemble
PsycINFO 2
Hongyun, Lei, Qingmao
2005 y n n y n TE
PsycINFO 2
Hongyun, Qingmao, Lei
2004 y n n y n Stress
PsycINFO 2
Torsheim, Samdal
2004 y n n y n Facilitation
PsycINFO 2
Barbaranelli, Fida
2004 y n n y n job satis.
PsycINFO 2
Caprara, Barbnaranelli, Borgogni, Petitta, Rubinacci
2003 y n n y n attitudes toward school
PsycINFO 2
Olivier 2001 y n n y n Effective-ness
PsycINFO 2
Mackenzie 2001 y n n y n Collabo-ration
PsycINFO 2
Schwarzer, Schmitz
1999 y n n y n Burnout
10/26/10 Wilson Web (KW: "Collective Teacher Efficacy")
4 results WW 1 Adams, Forsyth
2009 y y ? y y
1 unique
1 potential
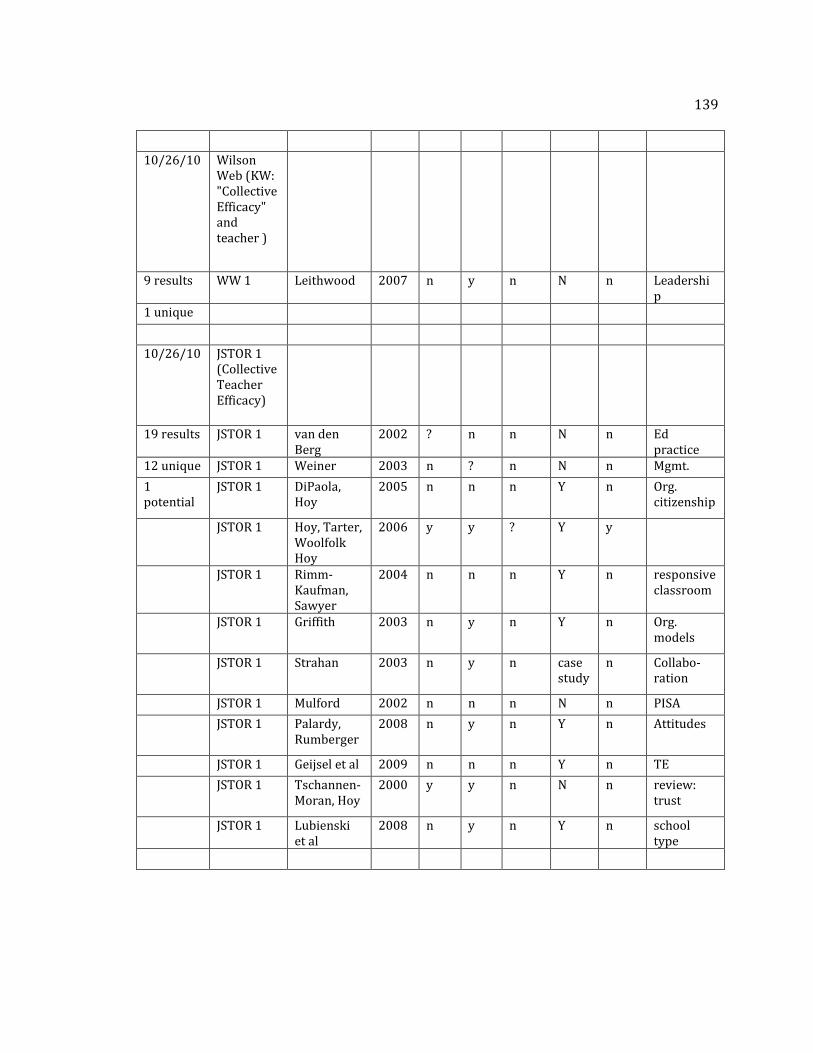
139
10/26/10 Wilson Web (KW: "Collective Efficacy" and teacher )
9 results WW 1 Leithwood 2007 n y n N n Leadership
1 unique
10/26/10 JSTOR 1 (Collective Teacher Efficacy)
19 results JSTOR 1 van den Berg
2002 ? n n N n Ed practice
12 unique JSTOR 1 Weiner 2003 n ? n N n Mgmt.
1 potential
JSTOR 1 DiPaola, Hoy
2005 n n n Y n Org. citizenship
JSTOR 1 Hoy, Tarter, Woolfolk Hoy
2006 y y ? Y y
JSTOR 1 Rimm-Kaufman, Sawyer
2004 n n n Y n responsive classroom
JSTOR 1 Griffith 2003 n y n Y n Org. models
JSTOR 1 Strahan 2003 n y n case study
n Collabo-ration
JSTOR 1 Mulford 2002 n n n N n PISA
JSTOR 1 Palardy, Rumberger
2008 n y n Y n Attitudes
JSTOR 1 Geijsel et al 2009 n n n Y n TE
JSTOR 1 Tschannen-Moran, Hoy
2000 y y n N n review: trust
JSTOR 1 Lubienski et al
2008 n y n Y n school type
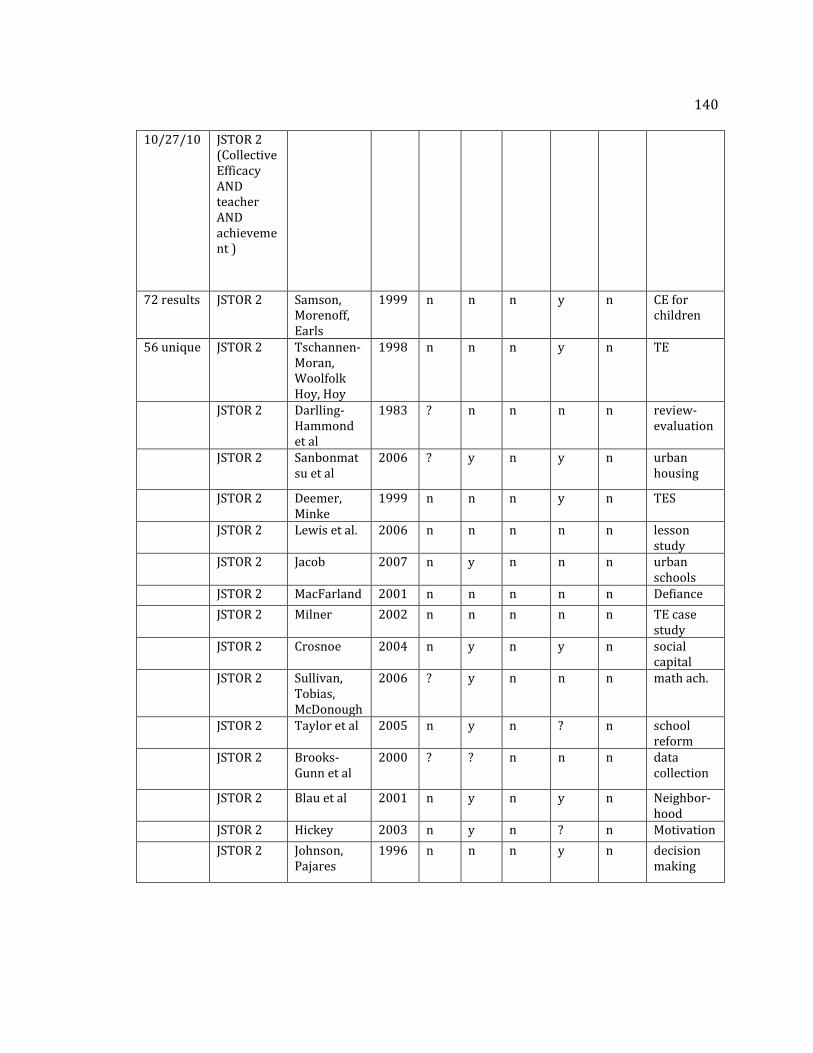
140
10/27/10 JSTOR 2 (Collective Efficacy AND teacher AND achievement )
72 results JSTOR 2 Samson, Morenoff, Earls
1999 n n n y n CE for children
56 unique JSTOR 2 Tschannen-Moran, Woolfolk Hoy, Hoy
1998 n n n y n TE
JSTOR 2 Darlling-Hammond et al
1983 ? n n n n review- evaluation
JSTOR 2 Sanbonmatsu et al
2006 ? y n y n urban housing
JSTOR 2 Deemer, Minke
1999 n n n y n TES
JSTOR 2 Lewis et al. 2006 n n n n n lesson study
JSTOR 2 Jacob 2007 n y n n n urban schools
JSTOR 2 MacFarland 2001 n n n n n Defiance
JSTOR 2 Milner 2002 n n n n n TE case study
JSTOR 2 Crosnoe 2004 n y n y n social capital
JSTOR 2 Sullivan, Tobias, McDonough
2006 ? y n n n math ach.
JSTOR 2 Taylor et al 2005 n y n ? n school reform
JSTOR 2 Brooks-Gunn et al
2000 ? ? n n n data collection
JSTOR 2 Blau et al 2001 n y n y n Neighbor-hood
JSTOR 2 Hickey 2003 n y n ? n Motivation
JSTOR 2 Johnson, Pajares
1996 n n n y n decision making
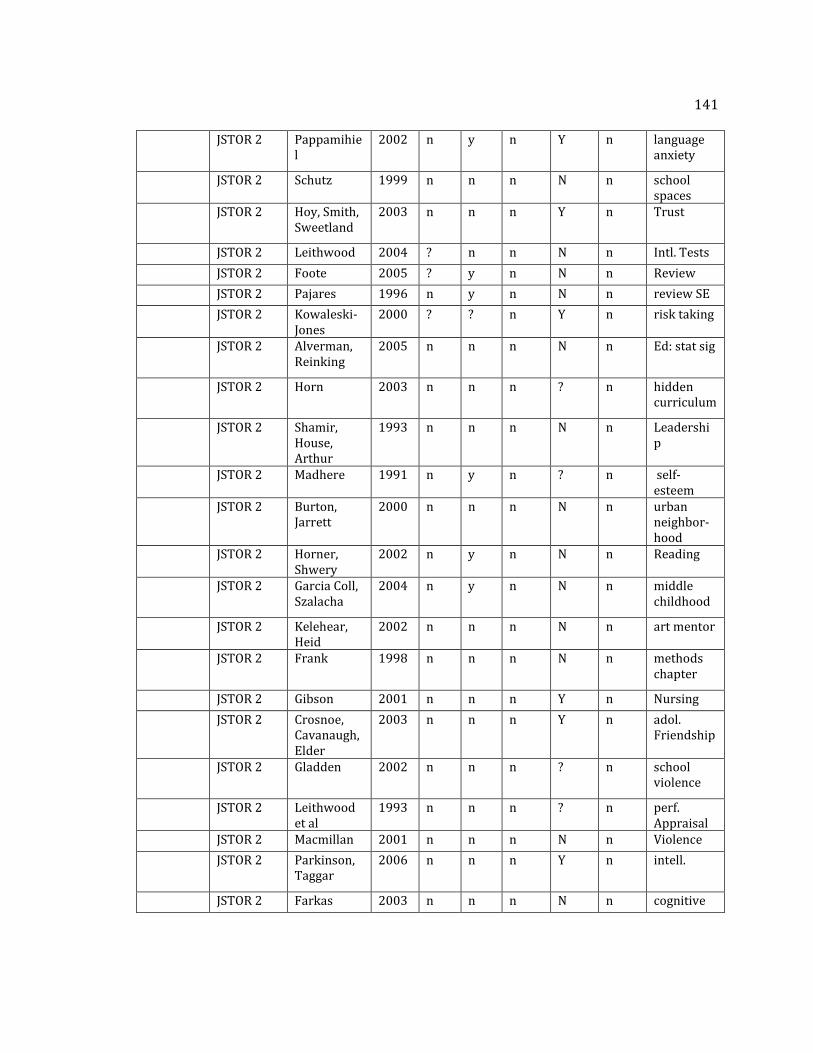
141
JSTOR 2 Pappamihiel
2002 n y n Y n language anxiety
JSTOR 2 Schutz 1999 n n n N n school spaces
JSTOR 2 Hoy, Smith, Sweetland
2003 n n n Y n Trust
JSTOR 2 Leithwood 2004 ? n n N n Intl. Tests
JSTOR 2 Foote 2005 ? y n N n Review
JSTOR 2 Pajares 1996 n y n N n review SE
JSTOR 2 Kowaleski-Jones
2000 ? ? n Y n risk taking
JSTOR 2 Alverman, Reinking
2005 n n n N n Ed: stat sig
JSTOR 2 Horn 2003 n n n ? n hidden curriculum
JSTOR 2 Shamir, House, Arthur
1993 n n n N n Leadership
JSTOR 2 Madhere 1991 n y n ? n self-esteem
JSTOR 2 Burton, Jarrett
2000 n n n N n urban neighbor-hood
JSTOR 2 Horner, Shwery
2002 n y n N n Reading
JSTOR 2 Garcia Coll, Szalacha
2004 n y n N n middle childhood
JSTOR 2 Kelehear, Heid
2002 n n n N n art mentor
JSTOR 2 Frank 1998 n n n N n methods chapter
JSTOR 2 Gibson 2001 n n n Y n Nursing
JSTOR 2 Crosnoe, Cavanaugh, Elder
2003 n n n Y n adol. Friendship
JSTOR 2 Gladden 2002 n n n ? n school violence
JSTOR 2 Leithwood et al
1993 n n n ? n perf. Appraisal
JSTOR 2 Macmillan 2001 n n n N n Violence
JSTOR 2 Parkinson, Taggar
2006 n n n Y n intell.
JSTOR 2 Farkas 2003 n n n N n cognitive
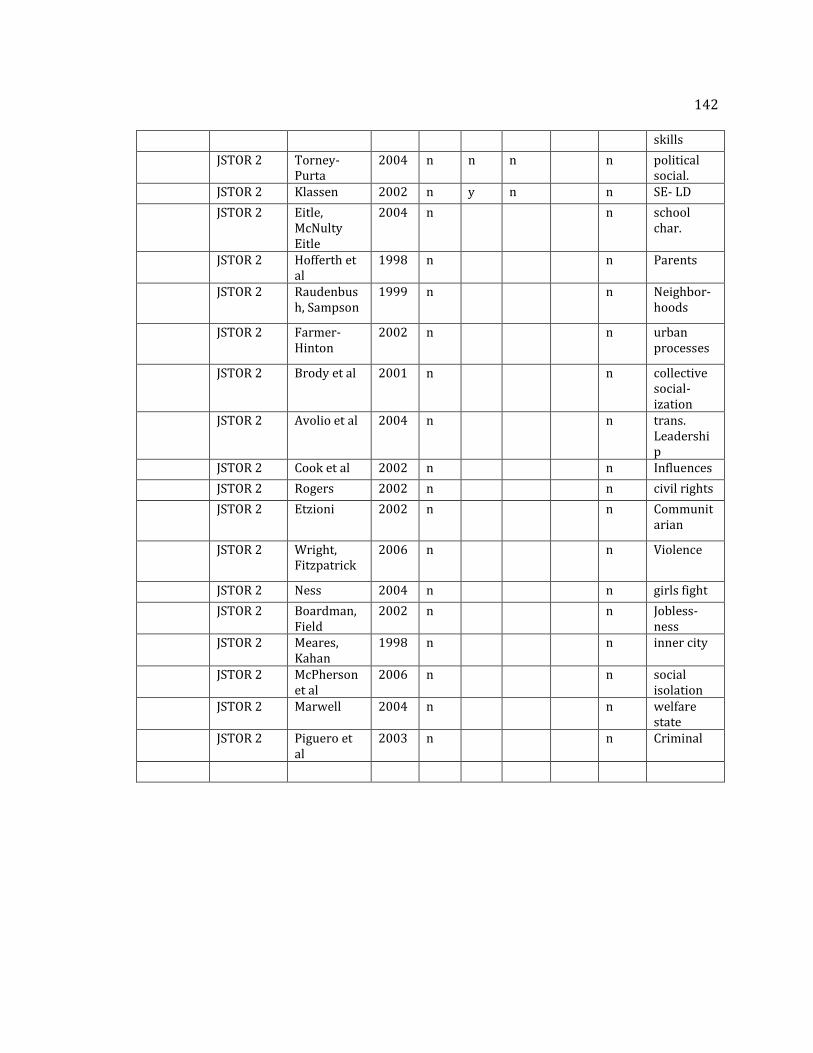
142
skills
JSTOR 2 Torney-Purta
2004 n n n n political social.
JSTOR 2 Klassen 2002 n y n n SE- LD
JSTOR 2 Eitle, McNulty Eitle
2004 n n school char.
JSTOR 2 Hofferth et al
1998 n n Parents
JSTOR 2 Raudenbush, Sampson
1999 n n Neighbor-hoods
JSTOR 2 Farmer-Hinton
2002 n n urban processes
JSTOR 2 Brody et al 2001 n n collective social-ization
JSTOR 2 Avolio et al 2004 n n trans. Leadership
JSTOR 2 Cook et al 2002 n n Influences
JSTOR 2 Rogers 2002 n n civil rights
JSTOR 2 Etzioni 2002 n n Communitarian
JSTOR 2 Wright, Fitzpatrick
2006 n n Violence
JSTOR 2 Ness 2004 n n girls fight
JSTOR 2 Boardman, Field
2002 n n Jobless-ness
JSTOR 2 Meares, Kahan
1998 n n inner city
JSTOR 2 McPherson et al
2006 n n social isolation
JSTOR 2 Marwell 2004 n n welfare state
JSTOR 2 Piguero et al
2003 n n Criminal
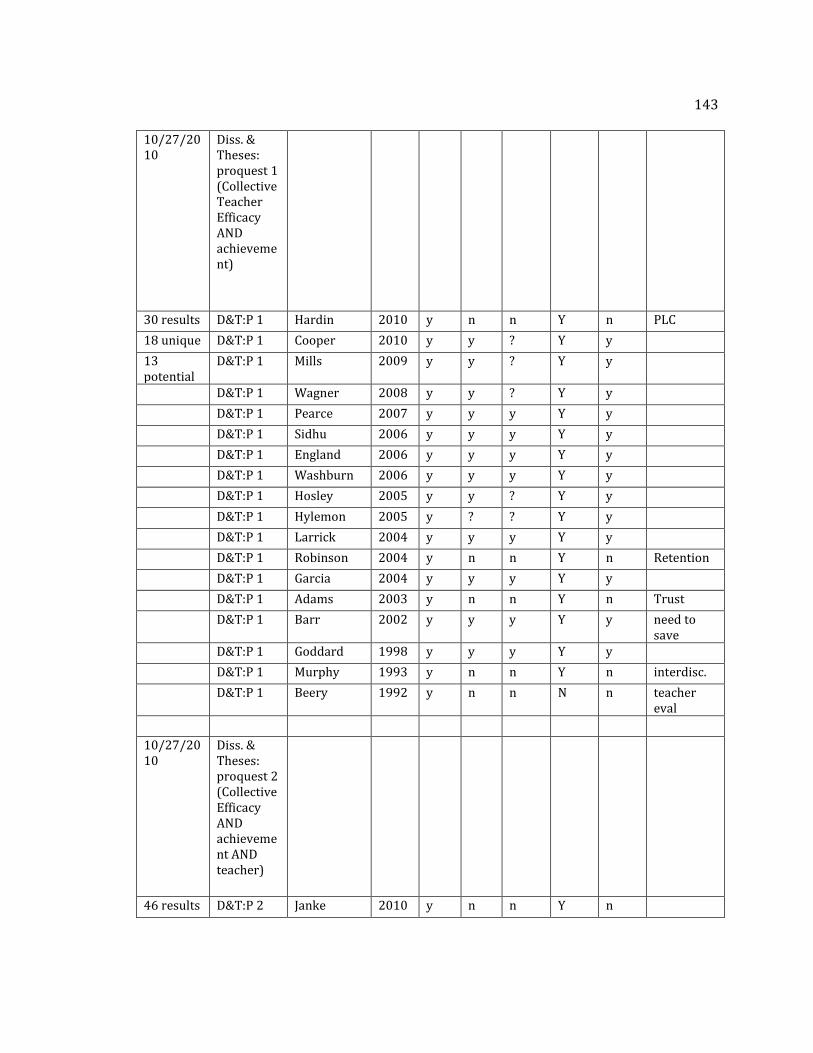
143
10/27/2010
Diss. & Theses: proquest 1 (Collective Teacher Efficacy AND achievement)
30 results D&T:P 1 Hardin 2010 y n n Y n PLC
18 unique D&T:P 1 Cooper 2010 y y ? Y y
13 potential
D&T:P 1 Mills 2009 y y ? Y y
D&T:P 1 Wagner 2008 y y ? Y y
D&T:P 1 Pearce 2007 y y y Y y
D&T:P 1 Sidhu 2006 y y y Y y
D&T:P 1 England 2006 y y y Y y
D&T:P 1 Washburn 2006 y y y Y y
D&T:P 1 Hosley 2005 y y ? Y y
D&T:P 1 Hylemon 2005 y ? ? Y y
D&T:P 1 Larrick 2004 y y y Y y
D&T:P 1 Robinson 2004 y n n Y n Retention
D&T:P 1 Garcia 2004 y y y Y y
D&T:P 1 Adams 2003 y n n Y n Trust
D&T:P 1 Barr 2002 y y y Y y need to save
D&T:P 1 Goddard 1998 y y y Y y
D&T:P 1 Murphy 1993 y n n Y n interdisc.
D&T:P 1 Beery 1992 y n n N n teacher eval
10/27/2010
Diss. & Theses: proquest 2 (Collective Efficacy AND achievement AND teacher)
46 results D&T:P 2 Janke 2010 y n n Y n
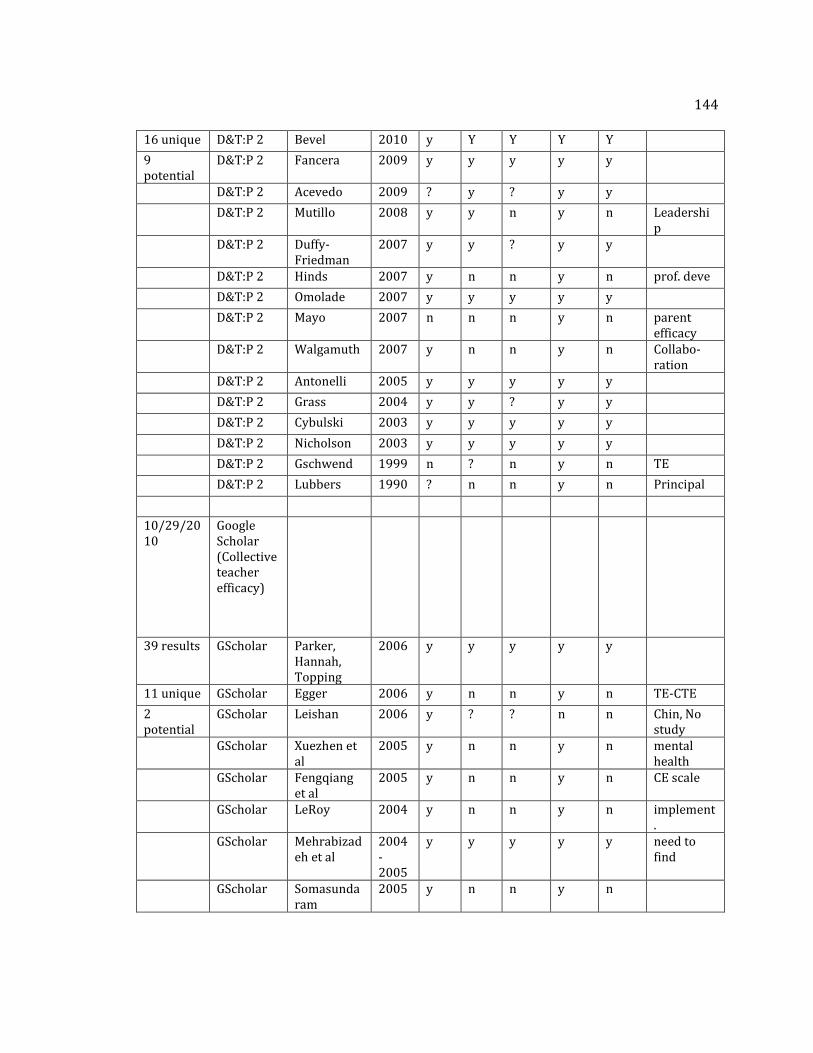
144
16 unique D&T:P 2 Bevel 2010 y Y Y Y Y
9 potential
D&T:P 2 Fancera 2009 y y y y y
D&T:P 2 Acevedo 2009 ? y ? y y
D&T:P 2 Mutillo 2008 y y n y n Leadership
D&T:P 2 Duffy-Friedman
2007 y y ? y y
D&T:P 2 Hinds 2007 y n n y n prof. deve
D&T:P 2 Omolade 2007 y y y y y
D&T:P 2 Mayo 2007 n n n y n parent efficacy
D&T:P 2 Walgamuth 2007 y n n y n Collabo-ration
D&T:P 2 Antonelli 2005 y y y y y
D&T:P 2 Grass 2004 y y ? y y
D&T:P 2 Cybulski 2003 y y y y y
D&T:P 2 Nicholson 2003 y y y y y
D&T:P 2 Gschwend 1999 n ? n y n TE
D&T:P 2 Lubbers 1990 ? n n y n Principal
10/29/2010
Google Scholar (Collective teacher efficacy)
39 results GScholar Parker, Hannah, Topping
2006 y y y y y
11 unique GScholar Egger 2006 y n n y n TE-CTE
2 potential
GScholar Leishan 2006 y ? ? n n Chin, No study
GScholar Xuezhen et al
2005 y n n y n mental health
GScholar Fengqiang et al
2005 y n n y n CE scale
GScholar LeRoy 2004 y n n y n implement.
GScholar Mehrabizadeh et al
2004-2005
y y y y y need to find
GScholar Somasundaram
2005 y n n y n

145
GScholar Shi 2005 y y y N n overview
GScholar Hardin 2010 y n n Y n PLC
GScholar Wu 2008 y n n Y n trans leader
146
APPENDIX B
SPREADSHEET: CODING DOCUMENT/MANUAL
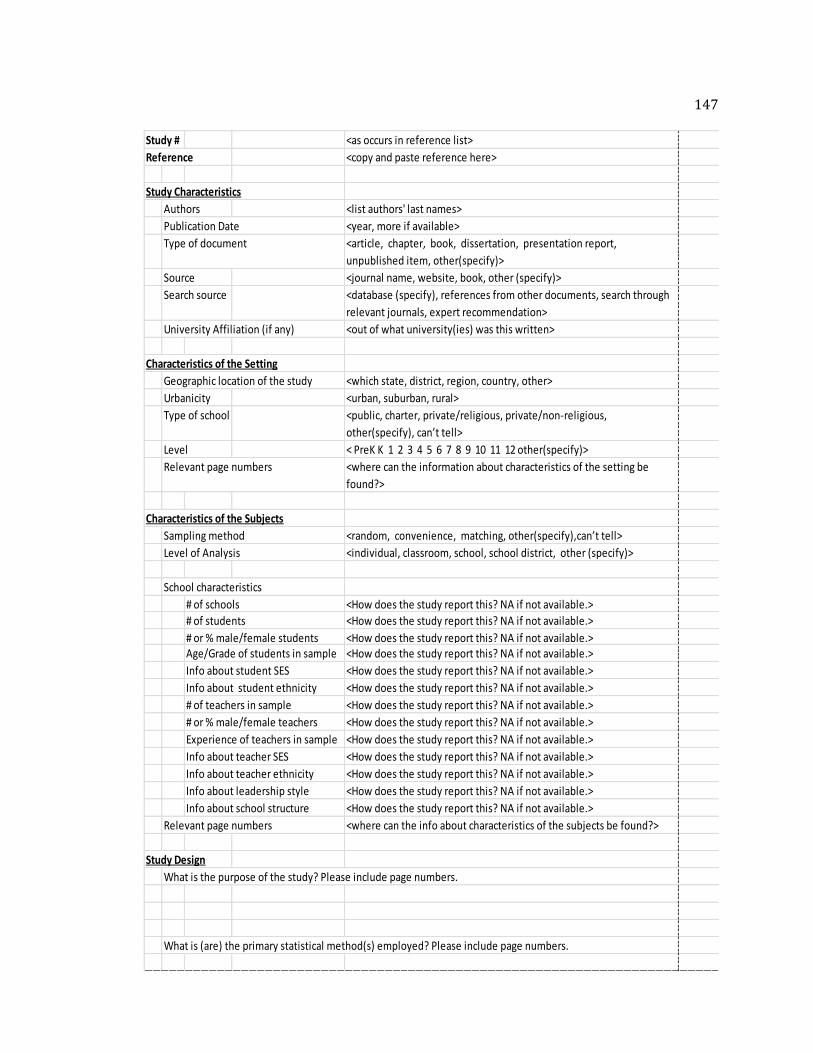
147
Study # <as occurs in reference list>
Reference <copy and paste reference here>
Study Characteristics
Authors <list authors' last names>
Publication Date <year, more if available>
Type of document <article, chapter, book, dissertation, presentation report,
unpublished item, other(specify)>
Source <journal name, website, book, other (specify)>
Search source <database (specify), references from other documents, search through
relevant journals, expert recommendation>
University Affiliation (if any) <out of what university(ies) was this written>
Characteristics of the Setting
Geographic location of the study <which state, district, region, country, other>
Urbanicity <urban, suburban, rural>
Type of school <public, charter, private/religious, private/non-religious,
other(specify), can’t tell>
Level < PreK K 1 2 3 4 5 6 7 8 9 10 11 12 other(specify)>
Relevant page numbers <where can the information about characteristics of the setting be
found?>
Characteristics of the Subjects
Sampling method <random, convenience, matching, other(specify),can’t tell>
Level of Analysis <individual, classroom, school, school district, other (specify)>
School characteristics
# of schools <How does the study report this? NA if not available.>
# of students <How does the study report this? NA if not available.>
# or % male/female students <How does the study report this? NA if not available.>Age/Grade of students in sample <How does the study report this? NA if not available.>
Info about student SES <How does the study report this? NA if not available.>
Info about student ethnicity <How does the study report this? NA if not available.>
# of teachers in sample <How does the study report this? NA if not available.>
# or % male/female teachers <How does the study report this? NA if not available.>
Experience of teachers in sample <How does the study report this? NA if not available.>
Info about teacher SES <How does the study report this? NA if not available.>
Info about teacher ethnicity <How does the study report this? NA if not available.>
Info about leadership style <How does the study report this? NA if not available.>
Info about school structure <How does the study report this? NA if not available.>
Relevant page numbers <where can the info about characteristics of the subjects be found?>
Study Design
What is the purpose of the study? Please include page numbers.
What is (are) the primary statistical method(s) employed? Please include page numbers.
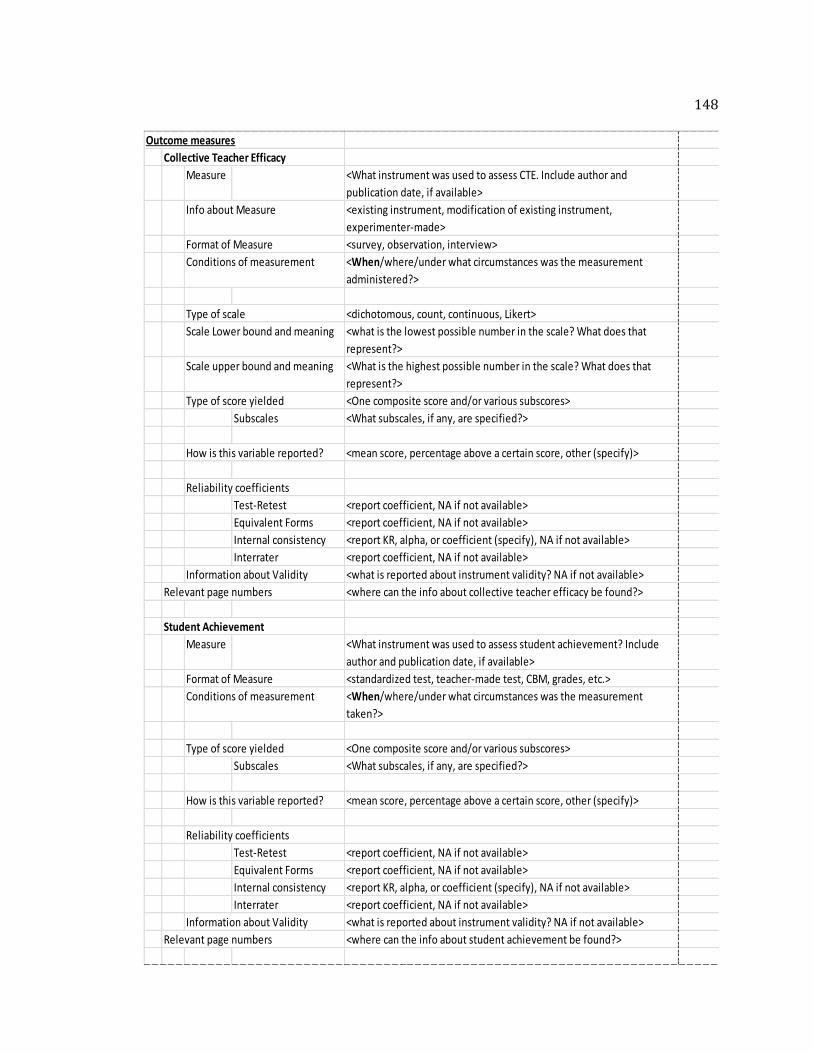
148
Outcome measures
Collective Teacher Efficacy
Measure <What instrument was used to assess CTE. Include author and
publication date, if available>
Info about Measure <existing instrument, modification of existing instrument,
experimenter-made>
Format of Measure <survey, observation, interview>
Conditions of measurement <When/where/under what circumstances was the measurement
administered?>
Type of scale <dichotomous, count, continuous, Likert>
Scale Lower bound and meaning <what is the lowest possible number in the scale? What does that
represent?>
Scale upper bound and meaning <What is the highest possible number in the scale? What does that
represent?>
Type of score yielded <One composite score and/or various subscores>
Subscales <What subscales, if any, are specified?>
How is this variable reported? <mean score, percentage above a certain score, other (specify)>
Reliability coefficients
Test-Retest <report coefficient, NA if not available>
Equivalent Forms <report coefficient, NA if not available>
Internal consistency <report KR, alpha, or coefficient (specify), NA if not available>
Interrater <report coefficient, NA if not available>
Information about Validity <what is reported about instrument validity? NA if not available>
Relevant page numbers <where can the info about collective teacher efficacy be found?>
Student Achievement
Measure <What instrument was used to assess student achievement? Include
author and publication date, if available>
Format of Measure <standardized test, teacher-made test, CBM, grades, etc.>
Conditions of measurement <When/where/under what circumstances was the measurement
taken?>
Type of score yielded <One composite score and/or various subscores>
Subscales <What subscales, if any, are specified?>
How is this variable reported? <mean score, percentage above a certain score, other (specify)>
Reliability coefficients
Test-Retest <report coefficient, NA if not available>
Equivalent Forms <report coefficient, NA if not available>
Internal consistency <report KR, alpha, or coefficient (specify), NA if not available>
Interrater <report coefficient, NA if not available>
Information about Validity <what is reported about instrument validity? NA if not available>
Relevant page numbers <where can the info about student achievement be found?>
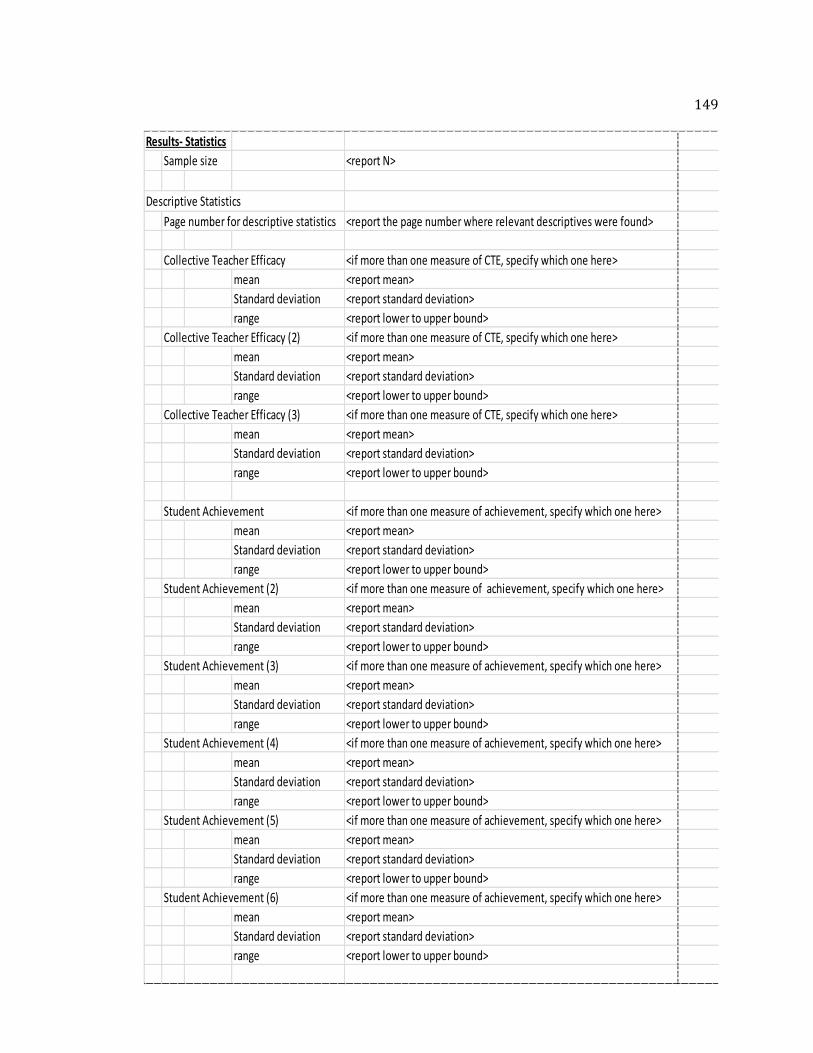
149
Results- Statistics
Sample size <report N>
Descriptive Statistics
Page number for descriptive statistics <report the page number where relevant descriptives were found>
Collective Teacher Efficacy <if more than one measure of CTE, specify which one here>
mean <report mean>
Standard deviation <report standard deviation>
range <report lower to upper bound>
Collective Teacher Efficacy (2) <if more than one measure of CTE, specify which one here>
mean <report mean>
Standard deviation <report standard deviation>
range <report lower to upper bound>
Collective Teacher Efficacy (3) <if more than one measure of CTE, specify which one here>
mean <report mean>
Standard deviation <report standard deviation>
range <report lower to upper bound>
Student Achievement <if more than one measure of achievement, specify which one here>
mean <report mean>
Standard deviation <report standard deviation>
range <report lower to upper bound>
Student Achievement (2) <if more than one measure of achievement, specify which one here>
mean <report mean>
Standard deviation <report standard deviation>
range <report lower to upper bound>
Student Achievement (3) <if more than one measure of achievement, specify which one here>
mean <report mean>
Standard deviation <report standard deviation>
range <report lower to upper bound>
Student Achievement (4) <if more than one measure of achievement, specify which one here>
mean <report mean>
Standard deviation <report standard deviation>
range <report lower to upper bound>
Student Achievement (5) <if more than one measure of achievement, specify which one here>
mean <report mean>
Standard deviation <report standard deviation>
range <report lower to upper bound>
Student Achievement (6) <if more than one measure of achievement, specify which one here>
mean <report mean>
Standard deviation <report standard deviation>
range <report lower to upper bound>
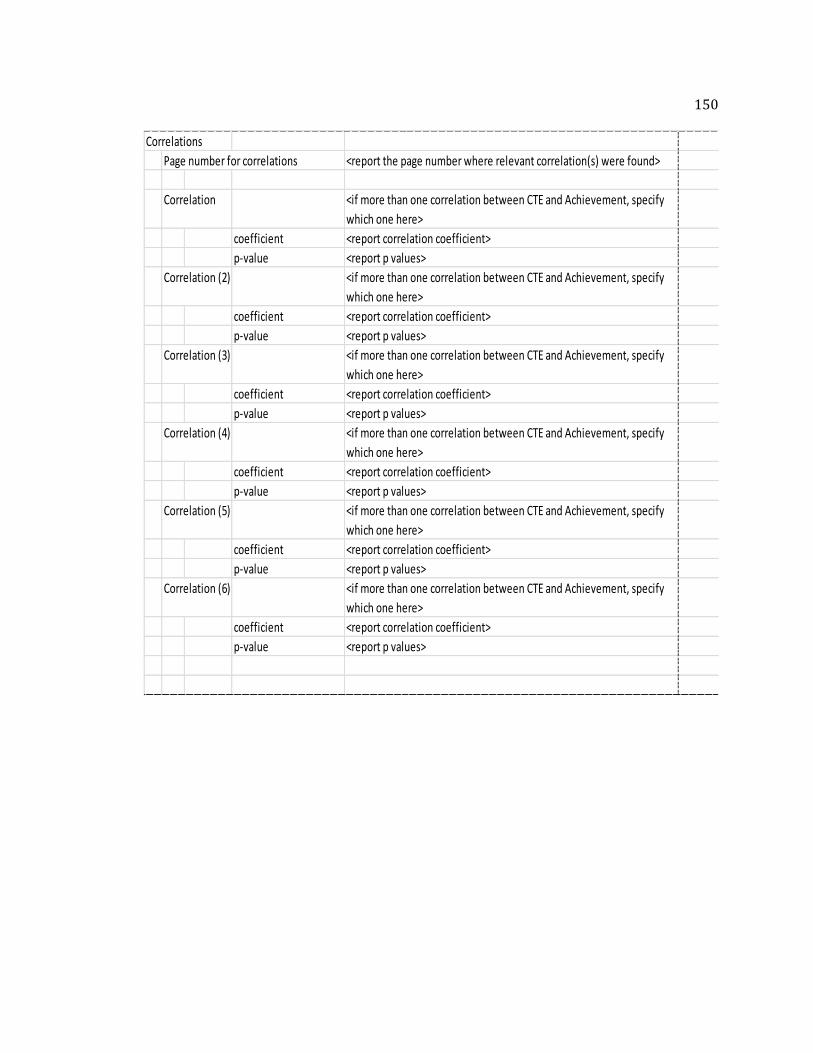
150
Correlations
Page number for correlations <report the page number where relevant correlation(s) were found>
Correlation <if more than one correlation between CTE and Achievement, specify
which one here>
coefficient <report correlation coefficient>
p-value <report p values>
Correlation (2) <if more than one correlation between CTE and Achievement, specify
which one here>
coefficient <report correlation coefficient>
p-value <report p values>
Correlation (3) <if more than one correlation between CTE and Achievement, specify
which one here>
coefficient <report correlation coefficient>
p-value <report p values>
Correlation (4) <if more than one correlation between CTE and Achievement, specify
which one here>
coefficient <report correlation coefficient>
p-value <report p values>
Correlation (5) <if more than one correlation between CTE and Achievement, specify
which one here>
coefficient <report correlation coefficient>
p-value <report p values>
Correlation (6) <if more than one correlation between CTE and Achievement, specify
which one here>
coefficient <report correlation coefficient>
p-value <report p values>
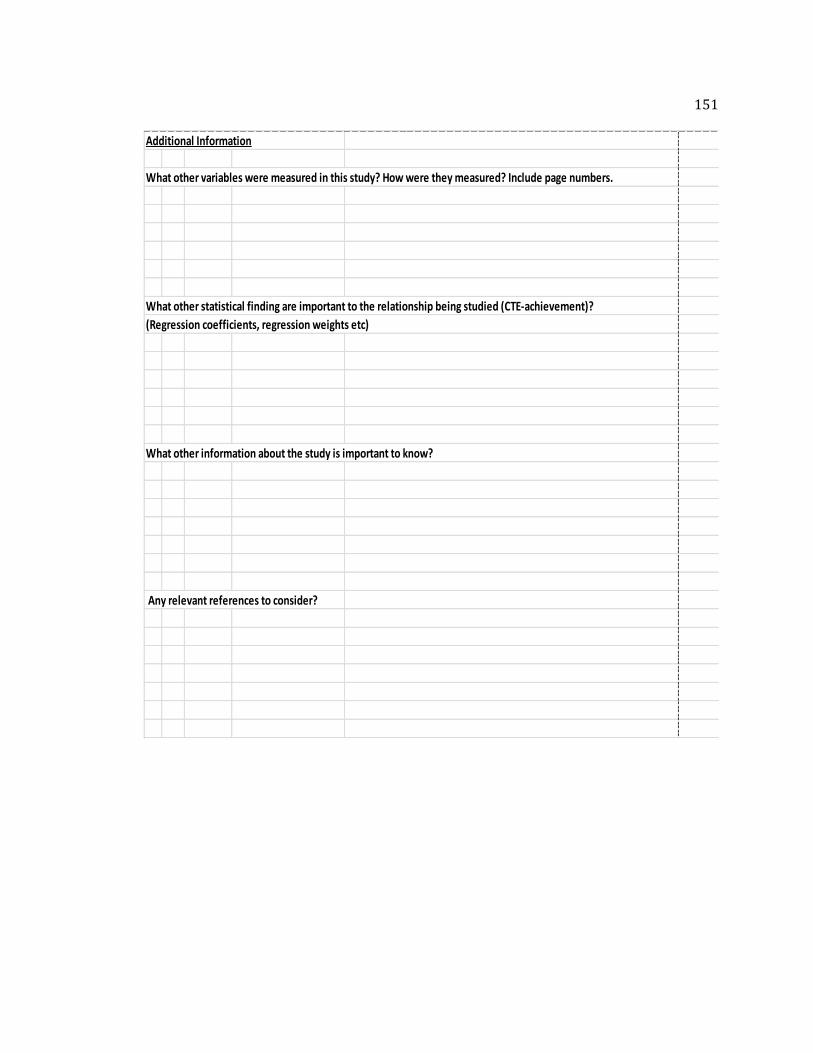
151
Additional Information
What other variables were measured in this study? How were they measured? Include page numbers.
What other statistical finding are important to the relationship being studied (CTE-achievement)?
(Regression coefficients, regression weights etc)
What other information about the study is important to know?
Any relevant references to consider?
152
APPENDIX C
MODERATOR ANALYSIS OF R-MEAN (OUTLIER REMOVED)
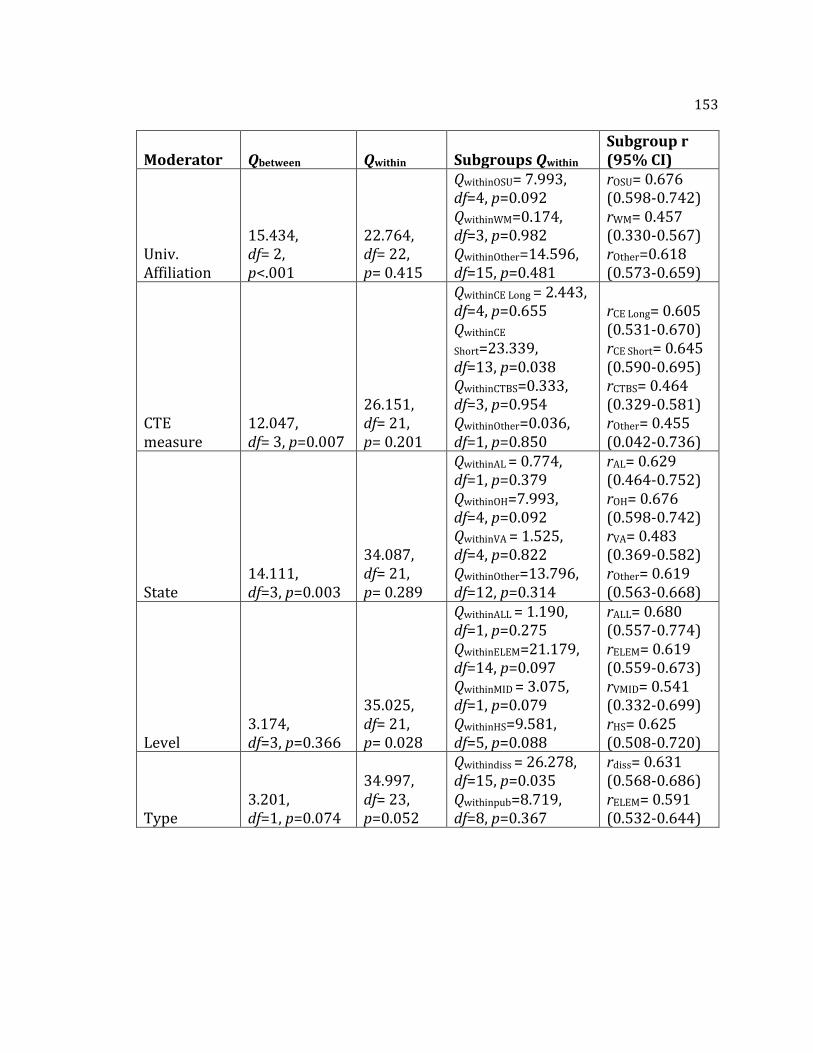
153
Moderator Qbetween Qwithin Subgroups Qwithin Subgroup r (95% CI)
Univ. Affiliation
15.434, df= 2, p<.001
22.764, df= 22, p= 0.415
QwithinOSU= 7.993, df=4, p=0.092 QwithinWM=0.174, df=3, p=0.982 QwithinOther=14.596, df=15, p=0.481
rOSU= 0.676 (0.598-0.742) rWM= 0.457 (0.330-0.567) rOther=0.618 (0.573-0.659)
CTE measure
12.047, df= 3, p=0.007
26.151, df= 21, p= 0.201
QwithinCE Long = 2.443, df=4, p=0.655 QwithinCE
Short=23.339, df=13, p=0.038 QwithinCTBS=0.333, df=3, p=0.954 QwithinOther=0.036, df=1, p=0.850
rCE Long= 0.605 (0.531-0.670) rCE Short= 0.645 (0.590-0.695) rCTBS= 0.464 (0.329-0.581) rOther= 0.455 (0.042-0.736)
State 14.111, df=3, p=0.003
34.087, df= 21, p= 0.289
QwithinAL = 0.774, df=1, p=0.379 QwithinOH=7.993, df=4, p=0.092 QwithinVA = 1.525, df=4, p=0.822 QwithinOther=13.796, df=12, p=0.314
rAL= 0.629 (0.464-0.752) rOH= 0.676 (0.598-0.742) rVA= 0.483 (0.369-0.582) rOther= 0.619 (0.563-0.668)
Level 3.174, df=3, p=0.366
35.025, df= 21, p= 0.028
QwithinALL = 1.190, df=1, p=0.275 QwithinELEM=21.179, df=14, p=0.097 QwithinMID = 3.075, df=1, p=0.079 QwithinHS=9.581, df=5, p=0.088
rALL= 0.680 (0.557-0.774) rELEM= 0.619 (0.559-0.673) rVMID= 0.541 (0.332-0.699) rHS= 0.625 (0.508-0.720)
Type 3.201, df=1, p=0.074
34.997, df= 23, p=0.052
Qwithindiss = 26.278, df=15, p=0.035 Qwithinpub=8.719, df=8, p=0.367
rdiss= 0.631 (0.568-0.686) rELEM= 0.591 (0.532-0.644)

154
APPENDIX D
INSTRUMENTS TO MEASURE COLLECTIVE TEACHER EFFICACY:
CE-SCALE (SHORT) AND CTBS
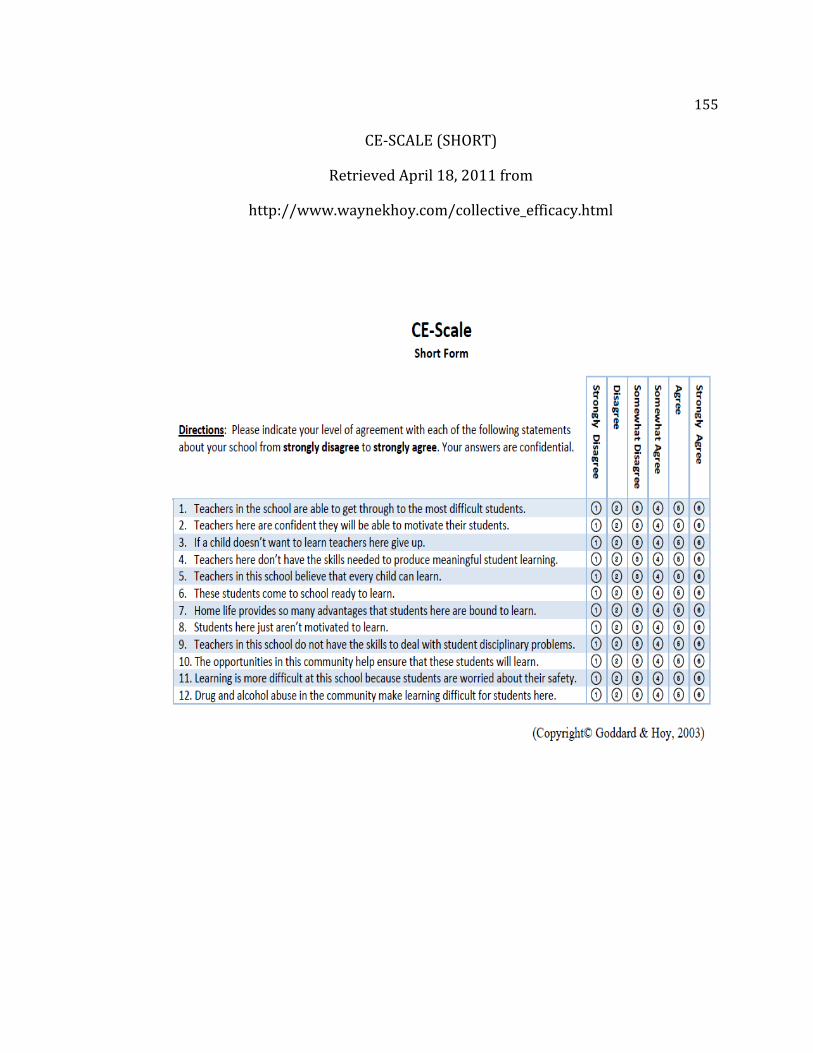
155
CE-SCALE (SHORT)
Retrieved April 18, 2011 from
http://www.waynekhoy.com/collective_efficacy.html
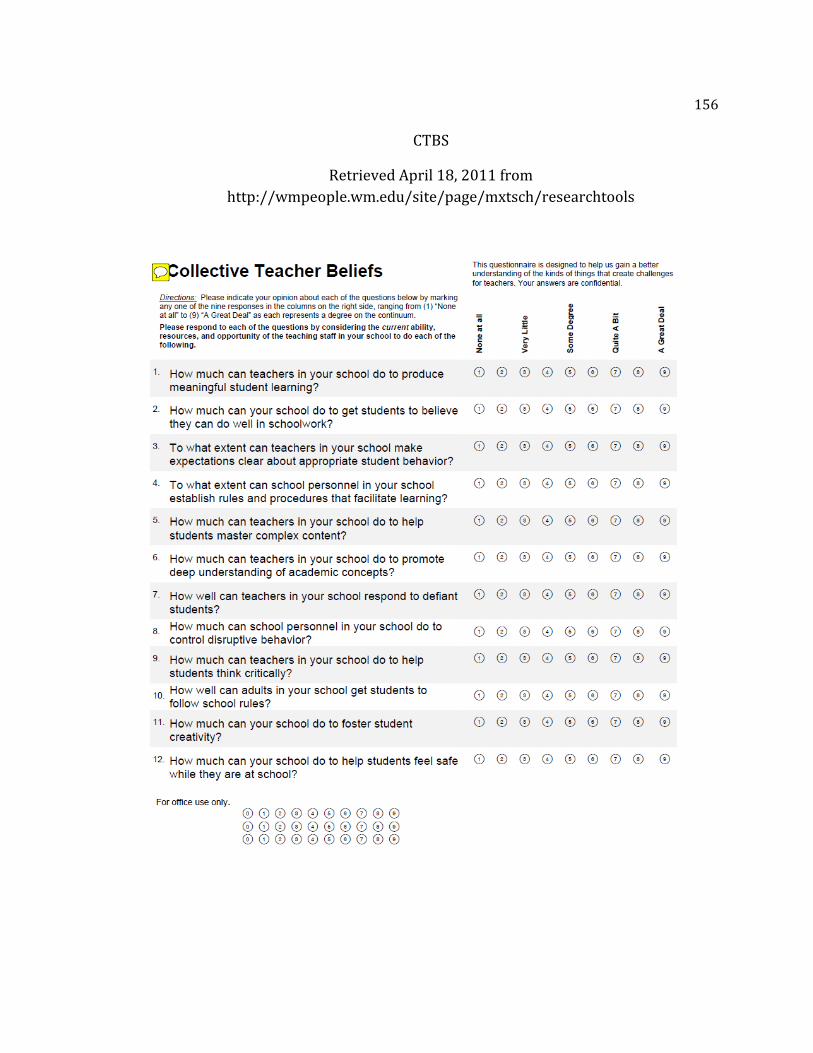
156
CTBS
Retrieved April 18, 2011 from
http://wmpeople.wm.edu/site/page/mxtsch/researchtools
157
REFERENCE LIST
References marked with an asterisk indicate studies included in the meta-analysis.
*Adams, C. M., & Forsyth, P. B. (2006). Proximate sources of collective teacher efficacy. Journal of Educational Administration, 44 (6), 625-642.
Allinder, R.M. (1995). An examination of the relationship between teacher efficacy and curriculum-based measurement and student achievement. Remedial & Special Education, 16 (4), 247-254.
*Antonelli, L. A. (2005). Organizational and SES predictors of student achievement and school effectiveness (Doctoral Dissertation). Retrieved from ProQuest Dissertations and Theses Database. (AAT 3189160).
Armor,D ., Conroy-Oseguera, P., Cox, M., King, N., McDonnell, L., Pascal, A., et al. (1976). Analysis of the school preferred reading program in selected Los Angeles minority schools (Report No. R-2007-LAUSD; ERIC Document Reproduction No. 130 243). Santa Monica, CA: Rand Corporation
Ashton, P., Buhr, D., & Crocker, L. (1984). Teachers' sense of efficacy: A self- or norm-referenced construct? Florida Journal of Educational Research, 26 (1), 29-41.
Ashton, P.T., & Webb, R.B. (1986). Making a difference: Teachers’ sense of efficacy and student achievement. New York: Longman.
Ashton, P., Webb, R., & Doda, N. (1982). A study of teacher’s sense of efficacy. (Final report to the National Institute of Education, Volume II [Appendices]). Gainesville, FL: Florida University.
Ashton, P., Webb, R., & Doda, N. (1983). A study of teacher’s sense of efficacy. (Final report to the National Institute of Education, Executive Summary). Gainesville, FL: Florida University.
Bandura, A. (1977). Self-efficacy: Toward a unifying theory of behavioral change. Psychological Review, 84 (2), 191-215.
Bandura, A. (1986). Social foundations of thought and action: A social cognitive theory. Englewood Cliffs, NJ: Prentice Hall. Bandura, A. (1988). Organisational applications of social cognitive theory. Australian Journal of Management, 13 (2), 275-302.
158
Bandura, A. (1991). Social cognitive theory of self-regulation. Organizational Behavior and Human Decision Processes, 50, 248-287.
Bandura, A. (1993). Perceived self-efficacy in cognitive development and functioning. Educational Psychologist, 28 (2), 117-148.
Bandura, A. (1997). Self-efficacy: The exercise of control. New York: W.H. Freeman and Company.
Bandura, A. (1998). Personal and collective efficacy in human adaptation and change. In J.G. Adair, D. Belanger, & K.L. Dion (Eds.), Advances in psychological science: Vol 1. Personal, social, and cultural aspects. Hove, UK: Psychology Press.
Bandura, A. (2000). Exercise of human agency through collective efficacy. Current Directions In Psychological Science, 9 (3), 75-78.
Bandura, A. (2001). Social cognitive theory: An agentic perspective. Annual Review of Psychology, 52, 1-26.
Bandura, A. (2006). Guide for constructing self-efficacy scales. In F. Pajares & T.C. Urdan (Eds.), Self-efficacy beliefs of adolescents. Greenwich, CT: Information Age Publishing.
Bandura, A., & Walters, R. H. (1963). Social learning and personality development. New York: Holt, Rinehart, & Winston.
Berman, P., McLaughlin, M., Bass, G., Pauly, E., & Zellman, G. (1977). Federal programs supporting educational change, vol. VII: Factors affecting implementation and continuation. (Report No. R-1589-7-HEW; ERIC Document Reproduction No. 140 432). Santa Monica, CA: Rand Corporation.
*Bevel, R. (2010). The effects of academic optimism on student academic achievement in Alabama (Doctoral Dissertation). Retrieved from ProQuest Dissertations and Theses Database. (AAT 3409002).
Borenstein M., Hedges L., Higgins J., & Rothstein H. (2005). Comprehensive Meta-Analysis (Version 2) [Software]. Englewood, NJ: Biostat. Available from http://www.Meta-Analysis.com
Brown, S., Tramayne, S., Hoxha, D., Telander, K., Fan, X., & Lent, R. (2008). Social cognitive predictors of college students' academic performance and persistence: A meta-analytic path analysis. Journal of Vocational Behavior, 72 (3), 298-308.
159
Bulris, M.E. (2009). A meta-analysis of research on the mediated effects of principal leadership on student achievement: Examining the effect size of school culture on student achievement as an indicator of teacher effectiveness (Doctoral Dissertation). Retrieved from ProQuest Dissertations and Theses Database (AAT 3389429).
The Campbell Collaboration. (2001). Guidelines for Preparation of Review Protocols. Retrieved from http://www.campbellcollaboration.org/artman2/uploads/1/C2_Protocols_guidelines_v1.pdf
Cantrell, S., & Callaway, P. (2008). High and low implementers of content literacy instruction: Portraits of teacher efficacy. Teaching and Teacher Education: An International Journal of Research and Studies, 24 (7), 1739-1750.
Cantrell, S., & Hughes, H. (2008). Teacher efficacy and content literacy implementation: An exploration of the effects of extended professional development with coaching. Journal of Literacy Research, 40 (1), 95.
Caprara, G., Barbaranelli, C., Borgogni, L., & Steca, P. (2003). Efficacy beliefs as determinants of teachers' job satisfaction. Journal of Educational Psychology, 95 (4), 821-32.
Chong, W., Klassen, R., Huan, V., Wong, I., & Kates, A. (2010). The relationships among school types, teacher efficacy beliefs, and academic climate: Perspective from Asian middle schools. Journal of Educational Research, 103 (3), 183-190.
Chubb, J.E. (1988). Why the current wave of school reform will fail. The Public Interest, 90, 28-49.
Cohen, J. (1988). Statistical power for the behavioral sciences (2nd ed). Hillsdale, NJ: Erlbaum.
Cooper, H. (2010). Research synthesis and meta-analysis (4th ed.). Los Angeles: SAGE Publications.
*Cooper, J. (2010). Collective efficacy, organizational citizenship behavior, and school effectiveness in Alabama public high schools. (Doctoral Dissertation). Retrieved from ProQuest Dissertations and Theses Database. (AAT 3422943).
*Cybulski, T. G. (2003). Investigating the role of the collective efficacy of teachers in fiscal efficiency and student achievement. (Doctoral Dissertation). Retrieved from ProQuest Dissertations and Theses Database. (AAT 3124056).
160
Cybulski, T. G., Hoy, W. K., & Sweetland, S. R. (2005). The roles of collective efficacy of teachers and fiscal efficiency in student achievement. Journal of Educational Administration, 43 (5), 439-461.
Cziko, G.A. (1992). Purposeful behavior as the control of perception: Implications for educational research. Educational Researcher, 21 (9), 10-18+27.
da Costa, J.L. (1995). Teacher collaboration: A comparison of four strategies. The Alberta Journal of Educational Research, 41 (4), 407-420.
Dussault, M., Payette, D., & Leroux, M. (2008). Principals’ transformational leadership and teachers’ collective efficacy. Psychological Reports, 102 (2), 401-410.
Duval, S., & Tweedie, R. (2000). Trim and fill: A simple funnel-plot-based method of testing and adjusting for publication bias in mate-analysis. Biometrics, 56 (2), 455-463.
Eells, R. (2010). Meta-analysis of the relationship between collective teacher efficacy and student achievement. Unpublished Manuscript.
*Fancera, S. (2009). Instructional leadership influence on collective efficacy and school achievement. (Doctoral Dissertation). Retrieved from ProQuest Dissertations and Theses Database. (AAT 3373674).
Fives, H., & Looney, L. (2009). College instructors' sense of teaching and collective efficacy. International Journal of Teaching and Learning in Higher Education, 20 (2), 182-191.
*Garcia, H. (2004). The impact of collective efficacy on student achievement: Implications for building a learning community. (Doctoral Dissertation). Retrieved from ProQuest Dissertations and Theses Database. (AAT 3165916).
Gates, B. (2011, January). 2011 annual letter from Bill Gates. Retrieved from www.gatesfoundation.org
Gibson, S., & Dembo, M.H. (1984). Teacher efficacy: A construct validation. Journal of Educational Psychology, 76 (4), 569-582.
Goddard, R.D. (1998). The effects of collective teacher efficacy on student achievement in urban public elementary schools (Doctoral dissertation). Retrieved from http://etd.ohiolink.edu/
161
Goddard, R. D. (2001). Collective efficacy: A neglected construct in the study of schools and student achievement. Journal of Educational Psychology, 93 (3), 467-76.
*Goddard, R. D. (2002a). Collective efficacy and school organization: A multilevel analysis of teacher influence in schools. In W. K. Hoy, & C. G. Miskel (Eds.), Theory and research in educational administration (pp. 169-184). Greenwich, CT: Information Age Publishing.
Goddard, R.D. (2002b). A theoretical and empirical analysis of the measurement of collective efficacy: The development of a short form. Educational and Psychological Measurement, 62 (1), 97-110.
Goddard, R. D., & Goddard, Y. L. (2001). A multilevel analysis of the relationship between teacher and collective efficacy in urban schools. Teaching and Teacher Education, 17 (7), 807-18.
Goddard, R. D., Hoy, W. K., & Woolfolk Hoy, A. (2000). Collective teacher efficacy: Its meaning, measure, and impact on student achievement. American Educational Research Journal, 37 (2), 479-507.
Goddard, R. D., Hoy, W. K., & Woolfolk Hoy, A. (2004). Collective efficacy beliefs: Theoretical developments, empirical evidence, and future directions. Educational Researcher, 33 (3), 3-13.
Goddard, R. D., & LoGerfo, L. F. (2007). Measuring emergent organizational properties: A structural equation modeling test of self- versus group-referent perceptions. Educational and Psychological Measurement, 67 (5), 845-858.
*Goddard, R., LoGerfo, L., & Hoy, W. (2004). High school accountability: The role of perceived collective efficacy. Educational Policy, 18 (3), 403-425.
Goddard, R. D., & Skrla, L. (2006). The influence of school social composition on teachers' collective efficacy beliefs. Educational Administration Quarterly, 42 (2), 216-235.
Gully, S.M., Incalcaterra, K.A., Joshi, A., & Beaubien, J.M. (2002). A meta-analysis of team-efficacy, potency, and performance: Interdependence and level of analysis as moderators of observed relationships. Journal of Applied Psychology, 87 (5), 819-832.
Guskey, T.R. (1981a). Measurement of the responsibility teachers assume for academic successes and failures in the classroom. Journal of Teacher Education, 32 (3), 44-51).
162
Guskey, T.R. (1981b). The relationship of affect toward teaching and teaching self-concept to responsibility for student achievement. Journal of Social Studies Research, 5 (2), 69-74.
Guskey, T.R., & Passaro, P. (1993, April). Teacher efficacy: A study of construct dimensions. Paper presented at the Annual Meeting of the American Educational Research Association, Atlanta, GA.
Hemric, M., Eury, A., & Shellman, D. (2010). Correlations between perceived teacher empowerment and perceived sense of teacher self-efficacy. AASA Journal of Scholarship & Practice, 7 (1), 37-50.
Henson, R., Kogan, L., & Vacha-Haase, T. (2001). A reliability generalization study of the teacher efficacy scale and related instruments. Educational and Psychological Measurement, 61 (3), 404-420.
Hoy, W.K., Hannum, J., & Tshannen-Moran, M. (1998). Organizational climate and student achievement: A parsimonious and longitudinal view. Journal of School Leadership, 8, 336-359.
*Hoy, W. K., Smith, P. A., & Sweetland, S. R. (2002). A test of a model of school achievement in rural schools: The significance of collective efficacy. In W. K. Hoy, & C. G. Miskel (Eds.), Theory and research in educational administration (pp. 185-202). Greenwich, CT: Information Age Publishing.
Hoy, W.K., & Sweetland, S.R. (2000). School bureaucracies that work: Enabling, not coercive. Journal of School Leadership, 10 (6), 525-541.
Hoy, W.K., & Sweetland, S.R. (2001). Designing better schools: The meaning and measure of enabling school structures. Educational Administration Quarterly, 37 (3), 296-321.
Hoy, W. K., Sweetland, S. R., & Smith, P. A. (2002). Toward an organizational model of achievement in high schools: The significance of collective efficacy. Educational Administration Quarterly, 38 (1), 77-93.
Hoy, W. K., Tarter, C. J., & Woolfolk Hoy, A. (2006). Academic optimism of schools: A force for student achievement. American Educational Research Journal, 43 (3), 425-446.
Hoy, W., & Woolfolk, A. (1990). Socialization of student teachers. American Educational Research Journal, 27 (2), 279-300.
163
Illinois State Board of Education (2010). No Child Left Behind/Adequate Yearly Progress. Retrieved March 10, 2010 from http://www.isbe.state.il.us/ayp/htmls/ayp_calc.htm
Illinois State Board of Education, Data Analysis and Progress Reporting Division
(October, 2010). A profile of Illinois public schools: Selections from the school report card files. Retrieved from http://www.isbe.state.il.us/research/pdfs/public_school_profile_01-10.pdf
*Jackson, J. (2009). Organizational citizenship behaviors, collective teacher efficacy,
and student achievement in elementary schools (Doctoral Dissertation). Retrieved from ProQuest Dissertations and Theses Database. (AAT 3392567).
Kallestad, J.H. (2010). Changes in school climate in a long-term perspective.
Scandinavian Journal of Educational Research, 54 (1), 1-14.
Knoblauch, D., & Woolfolk Hoy, A. (2008). “Maybe I can teach those kids.” The influence of contextual factors on student teachers’ efficacy beliefs. Teaching and Teacher Education, 24, 166-179.
Klassen, R. (2010). Teacher stress: The mediating role of collective efficacy beliefs. Journal of Educational Research, 103 (5), 342-350.
Klassen, R., Usher, E., & Bong, M. (2010). Teachers’ collective efficacy, job satisfaction, and job stress in cross-cultural context. Journal of Experimental Education, 78 (4), 464-486.
Kurz, T. B., & Knight, S. L. (2004). An exploration of the relationship among teacher efficacy, collective teacher efficacy, and goal consensus. Learning Environments Research, 7 (2), 111-128.
Lamorey, S., & Wilcox, M.J. (2005). Early intervention practitioners’ self-efficacy: A measure and its applications. Early Childhood Research Quarterly, 20, 69-84.
Lent, R.W., Brown, S.D., & Hackett, G. (1994). Toward a unifying social cognitive theory of career and academic interest, choice, and performance. Journal of Vocational Behavior, 45 (1), 79-122.
Lev, S., & Koslowsky, M. (2009). Moderating the collective and self-efficacy relationship. Journal of Educational Administration, 47 (4), 452-462.
Lipsey, M.W., & Wilson, D.B. (2001).Practical Meta-Analysis. Thousand Oaks, CA: SAGE Publications.
164
Maher, K., & Brat, I. (2011, March 10). Wisconsin Assembly begins debating union bill. The Wall Street Journal. Retrieved from online.wsj.com
March, W., & Silvestrini, E. (2011, March 10). Florida Senate approves teacher tenure bill. Tampa Bay Online. Retrieved from www.2tbo.com
Maier, S.F., & Seligman, M.E.P. (1976). Learned helplessness: Theory and evidence. Journal of Experimental Psychology: General, 105 (1), 3-46.
*McCoach, D.B. & Colbert, R.D. (2010). Factors underlying the collective teacher efficacy scale and their mediating role in the effect of socioeconomic status on academic achievement at the school level. Measurement and Evaluation in Counseling and Development, 43 (1), 31-47.
Meadows, S. (1998). Children learning to think: Learning from others? A Vygotskian
theory and educational psychology. Educational and Child Psychology, 15 (2), 6-13.
Mergler, A., & Tangen, D. (2010). Using Microteaching to Enhance Teacher Efficacy in Pre-Service Teachers. Teaching Education, 21 (2), 199-210.
Michie, G. (2011, March 10). On 30-hour weeks and the public pummeling of teachers. The Huffington Post. Retrieved from www.huffingtonpost.com
Moore, W.P., & Esselman, M.E. (1992). Teacher efficacy, empowerment, and a focused instructional climate: Does student achievement benefit? Paper presented at the Annual Meeting of the American Educational Research Association, San Francisco, CA.
Multon, K., Brown, S., & Lent, R. (1991). Relation of self-efficacy beliefs to academic outcomes: A meta-analytic investigation. Journal of Counseling Psychology, 38 (1), 30-39.
Newmann, F., Rutter, R., & Smith, M. (1989). Organizational factors that affect school sense of efficacy, community, and expectations. Sociology of Education, 62 (4), 221-238.
*Nicholson, M. R. (2003). Transformational leadership and collective efficacy: A model of school achievement (Doctoral Dissertation). Retrieved from ProQuest Dissertations and Theses Database. (AAT 3093682).
No Child Left Behind Act of 2001, 20 U.S.C. § 6301 (2002).
165
Olivier, D., & Hipp, K. (2006). Leadership capacity and collective efficacy: Interacting to sustain student learning in a professional learning community. Journal of School Leadership, 16 (5), 505-519.
*Omolade, R. (2007). A systems test of effectiveness of elementary schools in Nigeria (Doctoral Dissertation). Retrieved from ProQuest Dissertations and Theses Database. (AAT 3247173).
Pajares (2002). Overview of social cognitive theory and of self-efficacy. Retrieved May 20, 2010, from http://www.emory.edu/EDUCATION/mfp/eff.html.
Pajares, F., & Schunk, D.H. (2001). Self-beliefs and school success: Self-efficacy, self-concept, and school achievement. In R. Riding & S. Rayner (eds.), Perception (pp. 239-266). London: Ablex Publishing.
*Parker, K., Hannah, E., & Topping, K. (2006). Collective teacher efficacy, pupil attainment and socio-economic status in primary school. Improving Schools, 9 (2), 111-129.
*Parker, L. E. (1994). Working together: Perceived self- and collective-efficacy at the workplace. Journal of Applied Social Psychology, 24 (1), 43-59.
Parker, M.J., & Guarino, A.J (2001). A comparison of the efficacy levels of preservice, internship, and inservice teachers. Research Report (ED 461-647).
*Pearce, S. (2007). Mitigating the effects of poverty: A study of collective teacher efficacy, socioeconomic status, and student achievement in Colorado elementary schools (Doctoral Dissertation). Retrieved from ProQuest Dissertations and Theses Database. (AAT 3272636).
Pearson, R. (2011, March 3). Daley: We’re a ‘country of whiners.’ Chicago Tribune.
Retrieved from http://newsblogs.chicagotribune.com
*Pennycuff, L. (2010). The impact of the academic component of response to intervention on collective efficacy, parents' trust in schools, referrals for special education, and student achievement (Doctoral Dissertation). Retrieved from ProQuest Dissertations and Theses Database. (AAT 3392573).
Powers, W.T. (1973, 2005). Behavior: the control of perception. New Canaan, CT: Benchmark Publications.
Ravitch, D. (2010, November 10). Dictating to the schools. Virginia Journal of Education. Retrieved from http://www.veanea.org/vea-journal/1011/index.html
166
Rose, J.S., & Medway, F.J. (1981). Measurement of teachers’ beliefs in their control
over student outcomes. Journal of Educational Research, 74 (3), 185-190.
Ross, J.A. (1992). Teacher efficacy and the effects of coaching on student achievement. Canadian Journal of Education, 17 (1), 51-65.
Ross, J.A. (1998). Antecedents and consequences of teacher efficacy. In J. Brophy (Ed.), Advances in research on teaching (Vol. 7, pp. 49-74). Greenwich, CT: JAI Press
Ross, J. A. (2004). Effects of running records assessment on early literacy achievement. Journal of Educational Research, 97 (4), 186-194.
*Ross, J. A., & Gray, P. (2006a). School leadership and student achievement: The mediating effects of teacher beliefs. Canadian Journal of Education, 29 (3), 798-822.
Ross, J. A., & Gray, P. (2006b). Transformational leadership and teacher commitment to organizational values: The mediating effects of collective teacher efficacy. School Effectiveness and School Improvement, 17 (2), 179-199.
Ross, J. A., Hogaboam-Gray, A., & Gray, P. (2004). Prior student achievement, collaborative school processes, and collective teacher efficacy. Leadership and Policy in Schools, 3 (3), 163-188.
Rotter, J.B. (1954). Social learning and clinical psychology. Englewood Cliffs: Prentice Hall.
Rotter, J.B. (1966). Generalized expectancies for internal versus external control of reinforcement. Psychological Monographs: General & Applied, 80 (1), 1-28.
Schechter, C., & Tschannen-Moran, M. (2006). Teachers sense of collective efficacy: An international view. International Journal of Educational Management, 20 (6), 480-489.
Schmidt, F. (2010). Detecting and correcting the lies that data tell. Perspectives on Psychological Science, 5 (3), 233-242.
*Schumacher, D. (2009). Collective teacher efficacy and student achievement (Doctoral Dissertation). Retrieved from ProQuest Dissertations and Theses Database. (AAT 3355838).
167
Shahid, J., & Thompson, D. (2001, April). Teacher efficacy: A research synthesis. Paper presented at the Annual Meeting of the American Educational Research Association, Seattle, WA.
*Shepard, S. H. (2009). The relationship between the effective schools characteristics, collective teacher efficacy, and student achievement in high poverty, high minority populated elementary schools in Mississippi (Doctoral Dissertation). Retrieved from ProQuest Dissertations and Theses Database. (AAT 3358545).
Sheu, H., Lent, R., Brown, S., Miller, M., Hennessy, K., & Duffy, R. (2010). Testing the
choice model of social cognitive career theory across Holland themes: A meta-analytic path analysis. Journal of Vocational Behavior, 76 (2), 252-264.
*Sidhu, D. K. (2006). Applying the principles of Albert Bandura's social cognitive theory to examine if collective teacher efficacy contributes to higher student achievement through the processes established under the model of a learning organization (Doctoral Dissertation). Retrieved from ProQuest Dissertations and Theses Database. (AAT 3245532).
Sirin, S.R. (2005). Socioeconomic status and academic achievement: A meta-analytic review of research. Review of Educational Research, 75 (3), 417-453.
Skaalvik, E. M., & Skaalvik, S. (2007). Dimensions of teacher self-efficacy and relations with strain factors, perceived collective teacher efficacy, and teacher burnout. Journal of Educational Psychology, 99 (3), 611-625.
Smith, P. A., & Hoy, W. K. (2007). Academic optimism and student achievement in urban elementary schools. Journal of Educational Administration, 45 (5), 556-568.
*Solomon, C. (2007). The relationships among middle level leadership, teacher commitment, teacher collective efficacy, and student achievement (Doctoral Dissertation). Retrieved from ProQuest Dissertations and Theses Database. (AAT 3322742).
Stajkovic, A., & Luthans, F. (1998). Self-efficacy and work-related performance: A meta-analysis. Psychological Bulletin, 124 (2), 240-262.
*Tschannen-Moran, M., & Barr, M. (2004). Fostering student learning: The relationship of collective teacher efficacy and student achievement. Leadership and Policy in Schools, 3 (3), 189-209.
168
Tschannen-Moran, M., & Woolfolk Hoy, A. (2001). Teacher efficacy: Capturing an elusive construct. Teaching and Teacher Education, 17, 783-805.
Tschannen- Moran, M., & Woolfolk Hoy, A. (2006). The differential antecedents of self-efficacy beliefs of novice and experienced teachers. Teaching and Teacher Education, 23, 944-956.
Tschannen-Moran, M., Woolfolk Hoy, A., & Hoy, W.K. (1998). Teacher efficacy: Its meaning and measure. Review of Educational Research, 68 (2), 202-248.
Twenge, J.M. (2006). Generation Me: Why today’s young Americans are more confident, assertive, entitled—and more miserable than ever before. New York: Free Press.
Valentine, J.C., & Cooper, H. (2003). Effect size substantive interpretation guidelines: Issues in the interpretation of effect sizes. Washington, DC: What Works Clearinghouse.
*Wagner, C. (2008). Academic optimism of Virginia high school teachers: Its relationship to organizational citizenship behaviors and student achievement (Doctoral Dissertation). Retrieved from ProQuest Dissertations and Theses Database. (AAT 3302006).
Ware, H., & Kitsantas, A. (2007). Teacher and collective efficacy beliefs as predictors of professional commitment. Journal of Educational Research, 100 (5), 47-48.
*Washburn, T. E. (2006). Teacher's collective efficacy beliefs and student achievement in Virginia elementary schools (Doctoral Dissertation). Retrieved from ProQuest Dissertations and Theses Database. (AAT 3235105).
Waters, J.T., & Marzano, R.J. (2006). School district leadership that works: The effect of superintendent leadership on student achievement. A working paper. (Mid-Continent Research for Education and Learning Report). Retrieved March 10, 2011 from ERIC.
Witcher, L., Onwuegbuzie, A., Collins, K., Witcher, A., Minor, L., & James, T. (2002, November 1). Relationship between teacher efficacy and beliefs about education among preservice teachers. Paper presented at the Annual Meeting of the Mid-South Educational Research Association, Chattanooga, TN.
Woolfolk, A.E., & Hoy, W.K. (1990). Prospective teachers’ sense of efficacy and beliefs about control. Journal of Educational Psychology, 82 (1), 81-91.
169
Woolfolk, A., & Rosoff, B., & Hoy, W.K. (1990). Teachers' sense of efficacy and their beliefs about managing students. Teaching and Teacher Education, 6 (2), 137-48.
Woolfolk Hoy, A., Spero, R.B. (2005). Changes in teacher efficacy during the early years of teaching: A comparison of four measures. Teaching and Teacher Education, 21, 343-356.
Zambo, R., & Zambo, D. (2008). The impact of professional development in mathematics on teachers' individual and collective efficacy: The stigma of underperforming. Teacher Education Quarterly, 35 (1), 159-168.
170
VITA
Rachel Eells was born in Baton Rouge, Louisiana, and raised in Enid
Oklahoma; Tuckahoe, New York; and Austin Texas. She earned a Bachelor of Science
in Education from Concordia College, Seward, Nebraska in 1995, having majored in
elementary and special education with a minor in art. Her first teaching job was at
Christ Lutheran School in Little Rock, Arkansas. In 1998, she earned a Master of
Education in Teaching the Gifted and Talented from the University of Arkansas at
Little Rock. While in Little Rock, she taught special education, gifted education, art,
and fifth and sixth grades. In 2003, she took a job at St. Paul Lutheran School in
Mount Prospect, Illinois as a K-8 resource teacher, coordinating both special
education services and gifted education programming. She was accepted into the
Educational Psychology program at Loyola University Chicago in 2005, and
defended her dissertation in April of 2011.
Rachel began her career in higher education at Concordia University Chicago
in 2007, and currently is an assistant professor of psychology and chair of the
psychology department. She is looking forward to continuing what this dissertation
began: using meta-analysis as a tool for research in educational psychology, and
examination of efficacy as it relates to learning, teacher preparation, and school
effectiveness.