Embed Size (px)
Citation preview

Meta-Analysis of PSA Growth
Lurdes Y.T. Inoue, Ph.D.Ruth Etzioni, Ph.D.Elizabeth Slate, Ph.D.Christopher Morrel, Ph.D.

OUTLINE
Background
Description of Studies
Change-Point Models
Some Results
Future Plans

BACKGROUND
Prostate Cancer Prostate Cancer:
most commonly diagnosed cancer in men Risk factors:
Race, family history• Black men: higher incidence and poorer survival
Treatment options: Surgery or radiation for localized disease Hormone ablation for advanced or recurrent disease
Survival: Excellent for localized disease Poor if metastases are present (approx. 30% at 5
years)


PSA Screening Most significant and controversial development in
prostate cancer control over the last 20 years Initial studies:
PSA markedly elevated in men with prostate cancer PSA screening resulted in dramatic shift in stage of
disease PSA screening in US exploded in late 1980s and early
1990s Dissemination was not tracked Heterogeneity in how PSA is used
Conclusive evidence of efficacy is still lacking! In absence of clinical trial results, controversy about
role of PSA in PC mortality declines

SCIENCE TIMES, April 9 2002

0
50
100
150
200
250
300
350
400
1975 1979 1983 1987 1991 1995 1999
White Black
Prostate Cancer Trends
Inci
den
ce p
er
10
0,0
00
0
10
20
30
40
50
60
70
80
90
1975 1979 1983 1987 1991 1995 1999
year
PC
a D
eath
s p
er 1
00,0
00
White Black
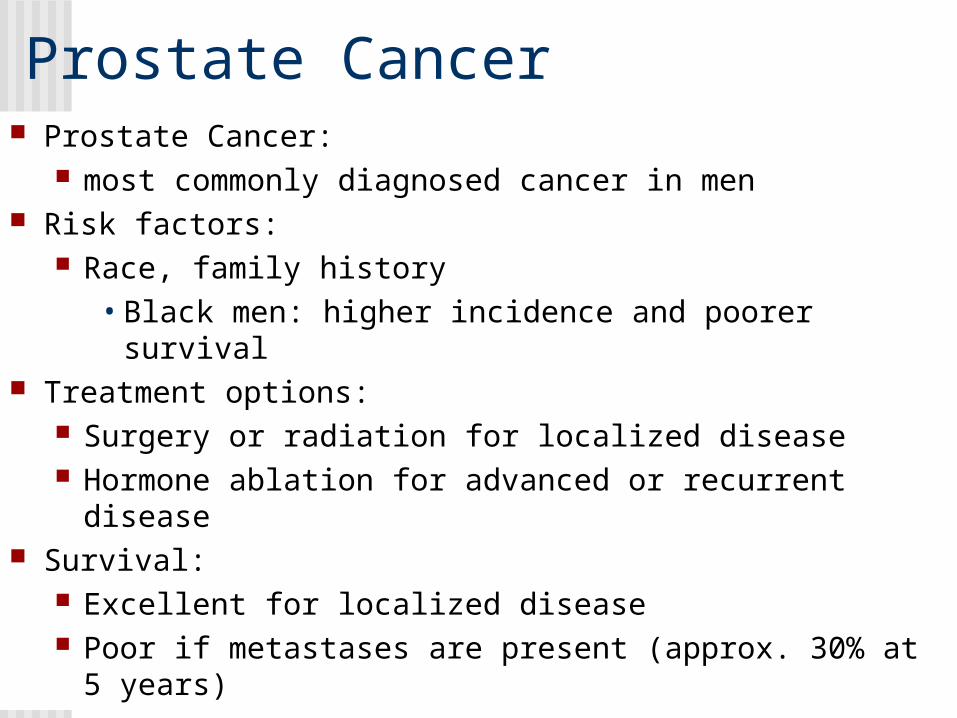
Cancer Intervention and Surveillance Network (CISNET) Consortium of NCI-sponsored investigators Main Goal:
understand the impact of cancer control interventions (e.g. screening, treatment and prevention) on population trends in incidence and mortality
Approach: Simulation-based models Requirement
• Estimates of PSA growth in cases and non-cases

Prior Studies of PSA Growth
Five prior studies CARET, BLSA, NPCT, VA, KAISER
Variability in the results e.g. 17% increase in Alice Whittemore’s study
versus 33% in the Baltimore study). Small samples

Summarize important growth rate parameters in a large dataset
Understand the impact of advanced cancers (stage/grade) on growth rates
Bayesian approach provide new ways of looking at these data…
Goals

Description of Studies
Baltimore Longitudinal Study of Aging (BLSA)
Continual longitudinal and multi-disciplinary study of
normal human aging
Beta-Carotene and Retinol Efficacy Trial (CARET)
Chemo-preventive efficacy and safety of beta-
carotene and retinol in a population at risk for lung
cancer
Nutritional Prevention of Cancer Trial (NPCT)
Determine whether a supplement of selenium
decreases the incidence of cancer

Data: Summary Statistics


Change-point Models
Broad literature on change-point models, some applied to PSA data: Pearson, et. al. (1994) Morrell et. al. (1995), Slate and Cronin (1997), Slate and Clark (1999)
ALL BASED ON SINGLE STUDIES.

Age
Log(PSA+1)
1 2
Local
Metastasis

Features:
Estimate a change-point in clinically diagnosed cases
Combining data from different studies
HIERARCHICAL MODELS (RANDOM-EFFECTS)

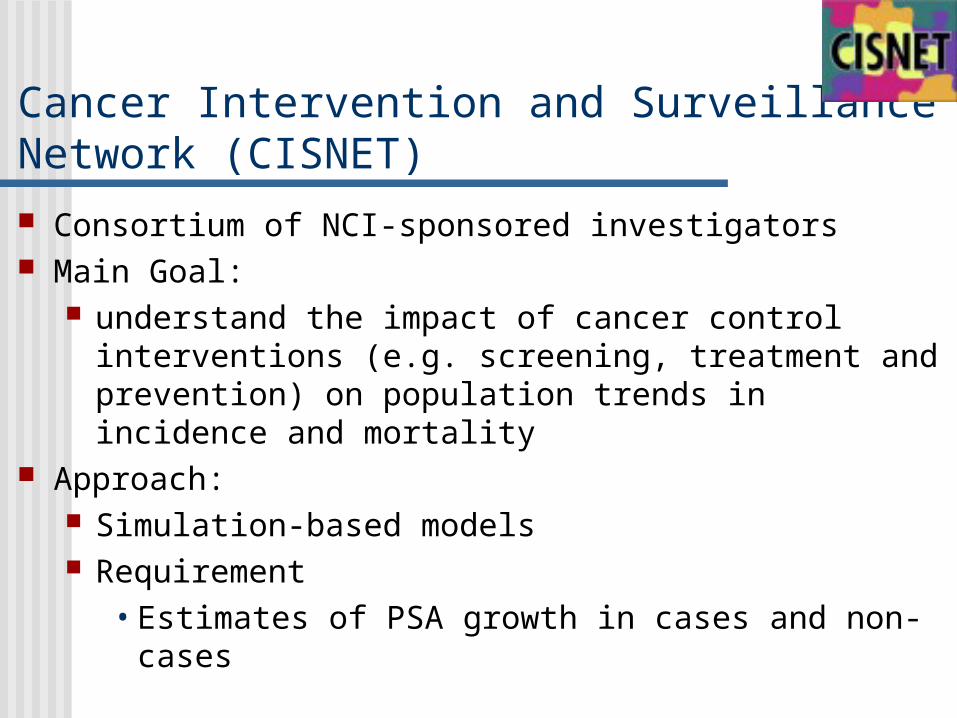
Meta-Analysis using One-Change Point Models
Restricted to prostate cancer patients Is there a growth rate change?
Stratified by Grade/Gleason’s Score Higher growth rate under poor prognosis?

One-Change Point Model
Priors:

Meta-Analysis using Two-Change Point Models
Restricted to prostate cancer patients Use stage information: worse prognosis inducing a second change point in patient’s FU window.

Two-Change Point Model
+ Interval censored observation for second change-point using stage of disease
-0.2 0.0 0.2 0.4
02
46
81
0
OVERALLCARETBALTINPCT
Slopes after the change point

ln(P
SA
+1
)
42 44 46 48 50
01
23
4
ln(P
SA
+1
)
64 65 66 67 68
01
23
4
ln(P
SA
+1
)
55 60 65 70
01
23
4
ln(P
SA
+1
)
55 60 65 70 75 80
01
23
4
ln(P
SA
+1
)
63 64 65 66 67 68
01
23
4
ln(P
SA
+1
)
70 71 72 73 74 75
01
23
4

ln(P
SA
+1
)
30 40 50 60 70 80 90
02
46 CARET
LOCAL
ln(P
SA
+1
)
30 40 50 60 70 80 90
02
46 CARET
METASTASIS
ln(P
SA
+1
)
30 40 50 60 70 80 90
02
46 BLSA
LOCAL
ln(P
SA
+1
)
30 40 50 60 70 80 90
02
46 BLSA
METASTASIS
ln(P
SA
+1
)
30 40 50 60 70 80 90
02
46 NPCT
LOCAL
ln(P
SA
+1
)
30 40 50 60 70 80 90
02
46 NPCT
METASTASIS

AGE
Pre
dic
tive
Ag
e a
t Ch
an
ge
Po
int
40 50 60 70 80 90
0.0
0.0
10
.02
0.0
30
.04
0.0
5
AGE
Pre
dic
tive
me
dia
n lo
g(P
SA
+1
) T
raje
cto
ry
40 50 60 70 80 90
02
46

CH
AN
GE
PO
INT
(Y
EA
RS
BE
FO
RE
DIA
GN
OS
IS)
01
02
03
04
0
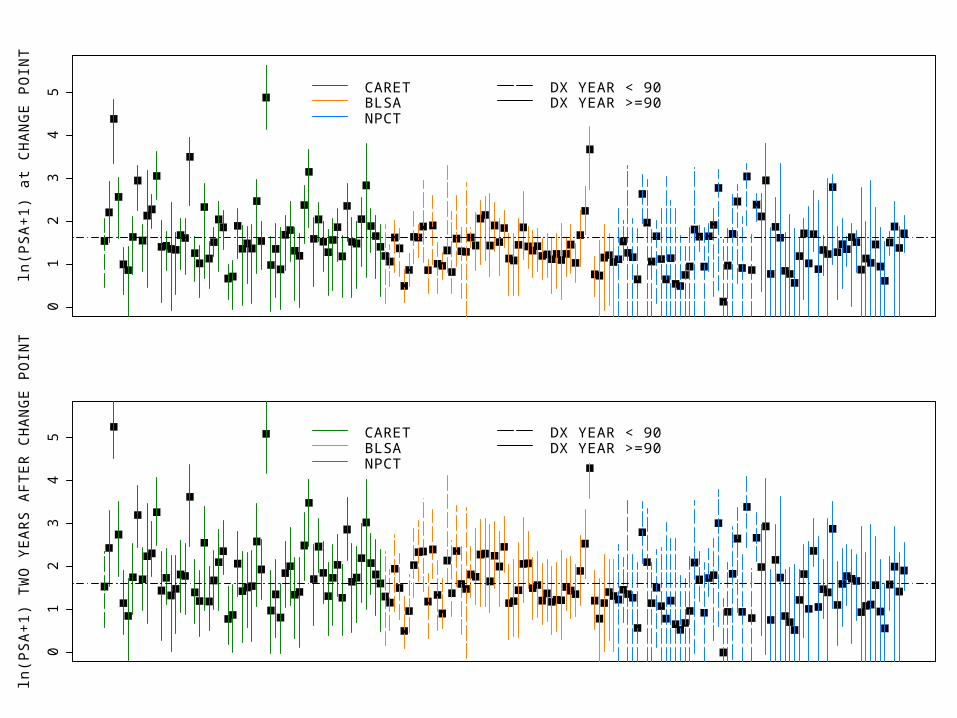
CARETBLSANPCT
DX YEAR < 90DX YEAR >=90
ln(P
SA
+1
) a
t CH
AN
GE
PO
INT
01
23
45 CARET
BLSANPCT
DX YEAR < 90DX YEAR >=90
ln(P
SA
+1
) T
WO
YE
AR
S A
FT
ER
CH
AN
GE
PO
INT
01
23
45 CARET
BLSANPCT
DX YEAR < 90DX YEAR >=90

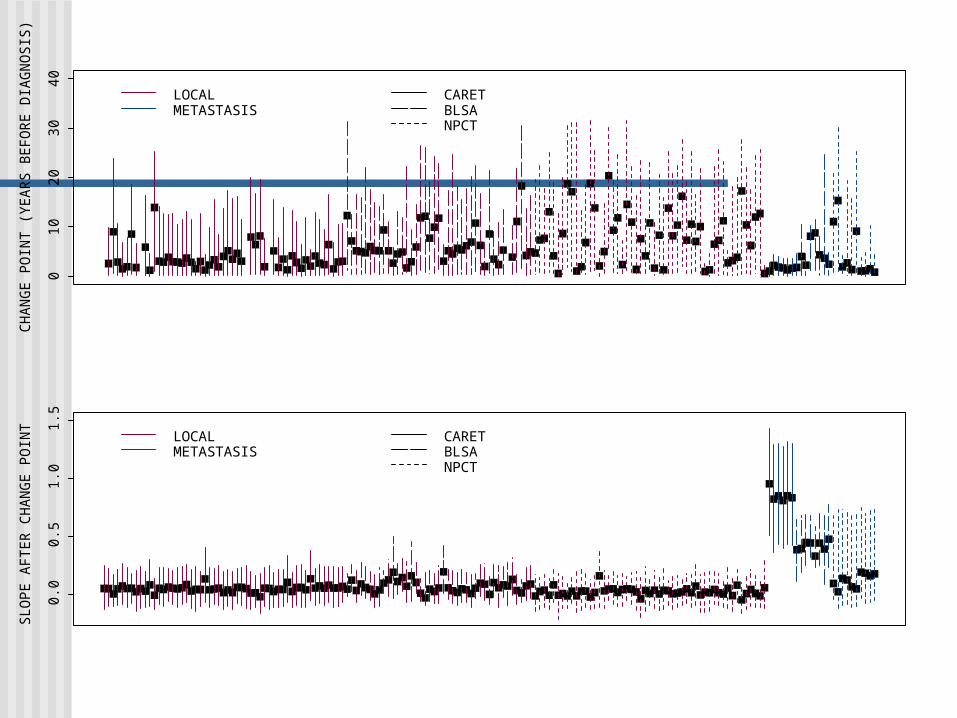
CH
AN
GE
PO
INT
(Y
EA
RS
BE
FO
RE
DIA
GN
OS
IS)
01
02
03
04
0
LOCALMETASTASIS
SL
OP
E A
FT
ER
CH
AN
GE
PO
INT
0.0
0.2
0.4
0.6
0.8
1.0
LOCALMETASTASIS

Other results:
Stratified Analysis: Slope parameter after change-point:
• Grade 0: CI(95%)= [-0.06,0.23]• Grade 1: CI(95%)= [-0.11,0.47]
Indication of faster PSA growth for grade 1 patients (more variability too).
Two-Change Point Analysis: No evidence for a two-change point: unlikely
to occur during subject’s lifetime. Maybe just different post-change point
slopes depending on tumor stage…

Using Stage Information

-0.2 -0.1 0.0 0.1 0.2 0.3
02
46
81
01
21
4
OVERALLCARETBALTINPCT
-1.0 -0.5 0.0 0.5 1.0 1.5
01
23
4
OVERALLCARETBALTINPCT
Post-Change Point Slope – baseline (LOCAL)
Effect of Advanced Stage on Post-Change Point Slope (METASTASIS)
CH
AN
GE
PO
INT
(Y
EA
RS
BE
FO
RE
DIA
GN
OS
IS)
010
2030
40
LOCALMETASTASIS
CARETBLSANPCT
SLO
PE
AF
TE
R C
HA
NG
E P
OIN
T
0.0
0.5
1.0
1.5
LOCALMETASTASIS
CARETBLSANPCT

30 40 50 60 70 80 90
02
46 CARET
LOCAL
30 40 50 60 70 80 90
02
46 CARET
METASTASIS
30 40 50 60 70 80 90
02
46 BLSA
LOCAL
30 40 50 60 70 80 90
02
46 BLSA
METASTASIS
30 40 50 60 70 80 90
02
46 NPCT
LOCAL
30 40 50 60 70 80 90
02
46 NPCT
METASTASIS

42 44 46 48 50
01
23
4
64 65 66 67 68
01
23
4
55 60 65 70
01
23
4
55 60 65 70 75 80
01
23
4
63 64 65 66 67 68
01
23
4
70 71 72 73 74 75
01
23
4

Conclusions
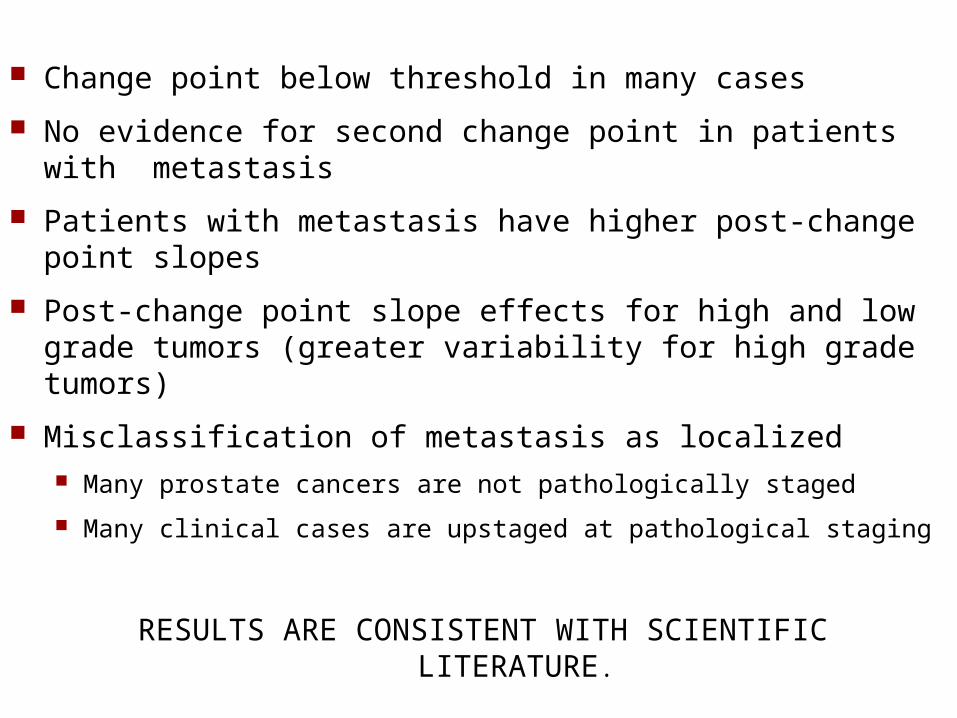
Change point below threshold in many cases
No evidence for second change point in patients with metastasis
Patients with metastasis have higher post-change point slopes
Post-change point slope effects for high and low grade tumors (greater variability for high grade tumors)
Misclassification of metastasis as localized Many prostate cancers are not pathologically staged
Many clinical cases are upstaged at pathological staging
RESULTS ARE CONSISTENT WITH SCIENTIFIC LITERATURE.

Future Plans:
Obtain a fourth longitudinal data set
Validation of the simulation model (CISNET)
Focus on natural history models Effects of intervention (prostate cancer
prevention)
Including controls Dealing with misclassification

Challenge:
Extremely high latent prevalence relative to clinical incidence Majority of men over 70 harbor a
prostate cancer! Lifetime probability of PC onset:
36% Lifetime probability of a PC
diagnosis pre-PSA: 9%9
27
36

20
Model Components
Inputs M odules Outputs
• all cause mortality• asymptomatic incidence
• stage transition ratesNatural History
• lifetime probability of clinicalpresentation
• distribution of stage at clinicalpresentation
ClinicalPresentation
• PSA growth curve (healthy)• PSA growth curve (cancer)
• length of stage A1PSA • annual PSA levels
• screening strategy• PSA growth curve
Screening• age at screen detection
• stage at screen detection
• age and stage specificcancer survival curves
Survival
• age at onset• age at stage transition
• age at other cause death
• age at clinical presentation• stage at clinical presentation
• age at death with screening• age at death without screening