Embed Size (px)
Citation preview
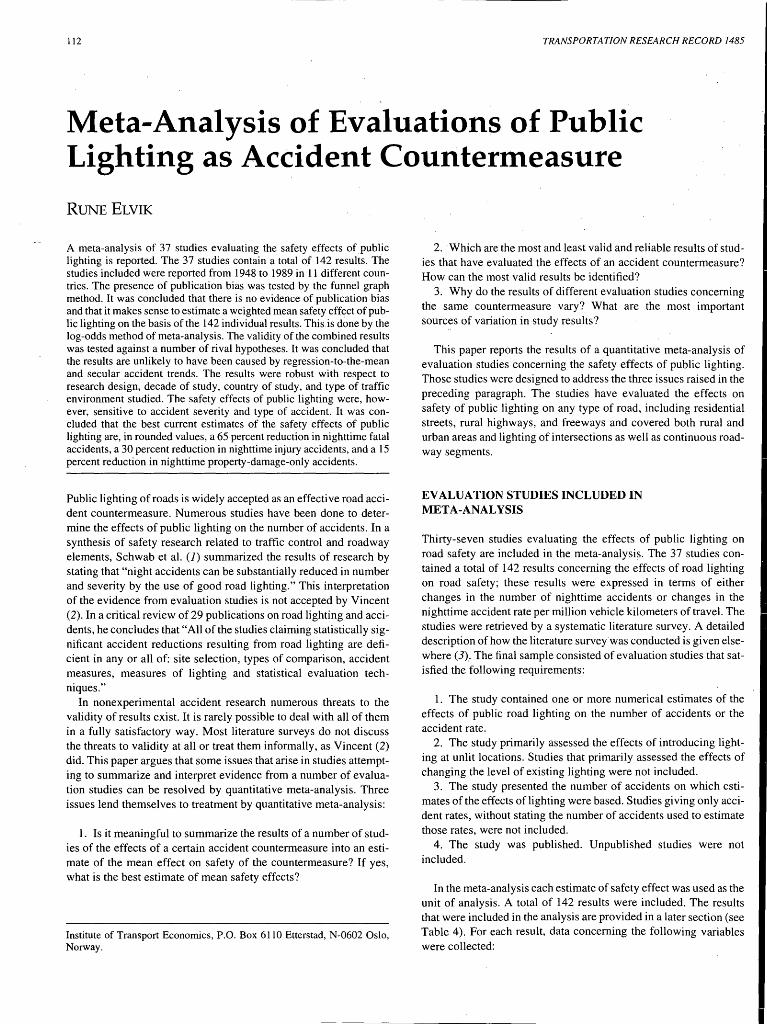
112 TRANSPORTATION RESEARCH RECORD 1485
Meta-Analysis of Evaluations of Public Lighting as Accident Countermeasure
RUNE ELVIK
A meta-analysis of 37 studies evaluating the safety effects of public lighting is reported. The 37 studies contain a total of 142 results. The studies included were reported from 1948 to 1989 in 11 different countries. The presence of publication bias was tested by the funnel graph method. It was concluded that there is no evidence of publication bias and that it makes sense to estimate a weighted mean safety effect of public lighting on the basis of the 142 individual results. This is done by the log-odds method of meta-analysis. The validity of the combined results was tested against a number of rival hypotheses. It was concluded that the results are unlikely to have been caused by regression-to-the-mean and secular accident trends. The results were robust with respect to research design, decade of study, country of study, and type of traffic environment studied. The safety effects of public lighting were, however, sensitive to accident severity and type of accident. It was concluded that the best current estimates of the safety effects of public lighting are, in rounded values, a 65 percent reduction in nighttime fatal accidents, a 30 percent reduction in nighttime injury accidents, and a 15 percent reduction in nighttime property-damage-only accidents.
Public lighting of roads is widely accepted as an effective road accident countermeasure. Numerous studies have been done to determine the effects of public lighting on the number of accidents. In a synthesis of safety research related to traffic control and roadway elements, Schwab et al. (1) summarized the results of research by stating that "night accidents can be substantially reduced in number and severity by the use of good road lighting." This interpretation of the evidence from evaluation studies is not accepted by Vincent (2). In a critical review of 29 publications on road lighting and accidents, he concludes that "All of the studies claiming statistically significant accident reductions resulting from road lighting are deficient in any or all of: site selection, types of comparison, accident measures, measures of lighting and statistical evaluation techniques."
In nonexperimental accident research numerous threats to the validity of results exist. It is rarely possible to deal with all of them in a fully satisfactory way. Most literature surveys do not discuss the threats to validity at all or treat them informally, as Vincent (2) did. This paper argues that some issues that arise in studies attempting to summarize and interpret evidence from a number of evaluation studies can be resolved by quantitative meta-analysis. Three issues lend themselves to treatment by quantitative meta-analysis:
1. Is it meaningful to summarize the results of a number of studies of the effects of a certain accident countermeasure into an estimate of the mean effect on safety of the countermeasure? If yes, what is the best estimate of mean safety effects?
Institute of Transport Economics, P.O. Box 6110 Etterstad, N-0602 Oslo, Norway.
2. Which are the most and least valid and reliable results of studies that have evaluated the effects of an accident countermeasure? How can the most valid results be identified?
3. Why do the results of different evaluation studies concerning the same countermeasure vary? What are the most important sources of variation in study results?
This paper reports the results of a quantitative meta-analysis of evaluation studies concerning the safety effects of public lighting. Those studies were designed to address the three issues raised in the preceding paragraph. The studies have evaluated the effects on safety of public lighting on any type of road, including residential streets, rural highways, and freeways and covered both rural and urban areas and lighting of intersections as well as continuous roadway segments.
EVALUATION STUDIES INCLUDED IN META-ANALYSIS
Thirty-seven studies evaluating the effects of public lighting on road safety are included in the meta-analysis. The 37 studies contained a total of 142 results concerning the effects of road lighting on road safety; these results were expressed in terms of either changes in the number of nighttime accidents or changes in the nighttime accident rate per million vehicle kilometers of travel. The studies were retrieved by a systematic literature survey. A detailed description of how the literature survey was conducted is given elsewhere (3).. The final sample consisted of evaluation studies that satisfied the following requirements:
1. The study contained one or more numerical estimates of the effects of public road lighting on the number of accidents or the accident rate.
2. The study primarily assessed the effects of introducing lighting at unlit locations. Studies that primarily assessed the effects of changing the level of existing lighting were not included.
3. The study presented the number of accidents on which estimates of the effects of lighting were based. Studies giving only accident rates, without stating the number of accidents used to estimate those rates, were not included.
4. The study was published. Unpublished studies were not included.
In the meta-analysis each estimate of safety effect was used as the unit of analysis. A total of 142 results were included. The results that were included in the analysis are provided in a later section (see Table 4). For each result, data concerning the following variables were collected:
Elvik 113
1. Author or authors of study, · 2. Year of publication,
CS effect = (no. of nighttime accidents after/no. of nighttime accidents before)
3. Country to which each result refers, 4. Study design (coded variable with seven categories),
-;- (no. of daytime accidents after/no. of daytime accidents before)
5. Type of traffic environment studied (coded variable with three categories),
If this ratio is less than 1.0 lighting reduces the number of nighttime accidents. If it is more than 1.0 lighting increases the number of nighttime accidents. In some before-and-after studies, as well as in all case-control studies, the odds ratio is expressed in terms of accident rates rather than the number of accidents. If the introduction of public lighting does not affect exposure, the odds ratio of accident rates will be identical to the _odds ratio of accident frequencies. The comparability of the two measures of safety effect is discussed in a subsequent section of the paper.
· 6. Type of accident studied (coded variable with five cate-gories),
7. Accident severity (coded variable with four categories), 8. Number of nighttime accidents before or without lighting, 9. Number of nighttime accidents after or with lighting,
10. Number of daytime accidents before or without lighting, 11. Number of daytime accidents after or with lighting, and 12. Estimate of the effect of lighting on road safety.
Table 1 describes in more detail how the variables included in the analysis were coded. TECHNIQUES OF META-ANALYSIS
In terms of study design a broad distinction can be made between various forms of before-and-after studies on the one hand and various forms of comparative studies on the other. Conforming to the language of epidemiology [see, e.g. Hennekens and Buring (4)], the comparative studies will be referred to as case-control studies, in which one or more lit locations constitute the cases, whereas one or more unlit locations constitute the controls. The two main groups of research design differ in terms of the criterion of safety (CS) effect generally adopted. In before-and-after studies the basic CS effect is the odds ratio, commonly defined as
Meta-analysis can be done by several techniques (5-9). The simplest kind of meta-analysis is the vote counting method, which consists of compiling a frequency distribution of results by safety effect. A vote count of the 142 results concerning the safety effects of road lighting included in the present study shows that 115 results (81 percent) indicate that safety has improved and 27 results ( 19 percent) indicate that safety has deteriorated. Since the majority ofresults indicate that safety has improved, it is concluded that road lighting is likely to improve safety in most cases.
TABLE 1 Variables Included in Meta-Analysis
Variable Categories of the variable Author Listed alphabetically Year of publication 1948 through 1989 Country of origin 11 different countries represented Study design (I) 22 =before-and-after study with nighttime accidents on unlight-
ed road sections as comparison group (2) 23 = before-and-after study with daytime accidents as compari-son group (3) 2223 = before-and-after study with daytime accidents as com-parison group and an additional comparison group of unlighted road sections (4) 2331 = before-and-after study with daytime accidents as com-parison group and data on traffic volume by time of day before and after lighting (5) 26 = case-control study where comparisons between cases and controls are stratified according to one or more confounding variables (6) 27 = case-control study where cases and control have been matched according to one or more confounding variables (7) 33 =simple case-control study; cases and controls are compared directly with no control for confounding variables
Traffic environment (I) Urb =urban; (2) Rur =rural; (3) Mwy =Motorway (freeway) Type of accident (I) All = all accidents; (2) Ped = pedestrian accidents; (3) Yeh =
accidents involving just vehicles; (4) June = accidents at junctions; (5) Sec= accidents between junctions
Accident severity (I) Du = Fatal accidents; (2) Psu = injury accidents, (3) Msu = property-damage-only accidents (4) All = accidents of unspecified severity; all accidents included
Number of accidents Recorded directly, in the following four categories: (I) NL = nighttime, lit road; (2) = NU = nighttime, unlit road; (3) DL = day-time, lit road; (4) DU= daytime, unlit road
Effect of lighting Defined in terms of the odds ratio =
0 = (NL/NU)/(DL/DU), which may be equivalently expressed in terms of accident rates (number of accidents per million vehicle kilometres of travel)
114
A simple vote count is, however, not very informative. A refinement of the vote counting method consists of grouping results according to their statistical significance. Applied to the 142 results concerning the safety effects of road lighting, this version of the vote counting method shows that 45 results indicated a statistically significant safety improvement at the 5 percent level of significance. Ninety-seven results did not show any statistically significant changes in safety at this level of significance (5). This result illustrates the point raised by Hauer (10) about the danger of relying on tests of statistical significance alone in summarizing the results of several evaluations of a safety measure. Evidence of safety effects typically comes in small doses that are not always statistically significant. When a large number of studies are put together, however, their combined evidence can be very strong indeed.
The basic idea in more sophisticated techniques of meta-analysis is to combine statistically the evidence from several studies by computing a weighted mean result. Weighting can be done by several techniques, depending on the statistical properties of the results that are combined. In the present study the log-odds method described by Fleiss (5) was used.
Once a method for combining the results of different studies has been chosen, it is possible to study the effects of several variables on the combined result of case studies. Does, for example, the combined safety effect of public lighting vary according to the research design used in different studies? In meta-analysis this question can be answered by defining a variable describing study design (Table 1 ), combining evidence from all studies that use the same design, and comparing the combined evidence from studies that use different designs. In this paper the effects of several variables on the results of evaluation studies have been analyzed in this manner.
IS THERE A GENERAL EFFECT OF PUBLIC LIGHTING ON ROAD SAFETY?
Vincent (2) argues that it does not make sense to estimate a mean safety effect of public lighting, because the locations studied have not been sampled at random from a ·known sampling frame. Besides, the safety effect of public lighting is likely to vary substantially from one case to another, depending, inter alia, on luminance levels, traffic environment, and predominant type of accident at the location. In meta-analysis three requirements must be fulfilled for a weighted mean estimate of safety effect to make sense: (a) there should not be publication bias, (b) the assumption that all results belong to a distribution having a well-defined mean value should be reasonably well supported, and (c) all studies should use comparable measures of safety effect.
Testing for Publication Bias
The term publication bias refers to the tendency not to publish results that are unwanted or believed not to be useful, for example, because they show an increase in accidents or because they are not statistically significant (6).
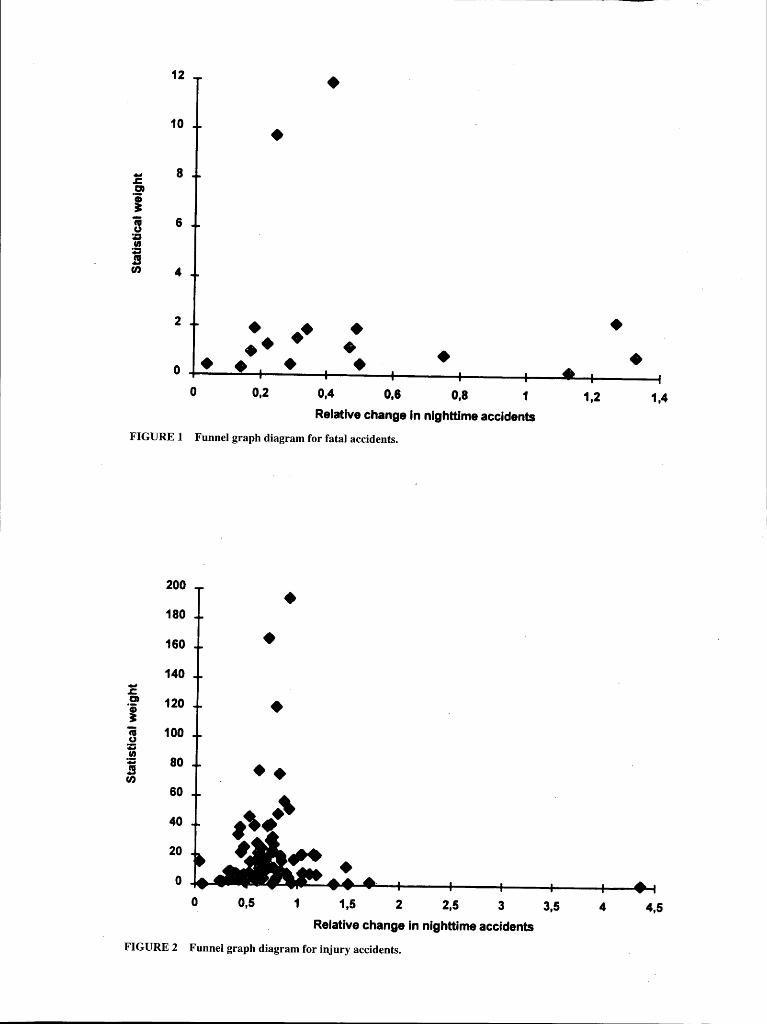
Light and Pillemer (6) have developed a graphical technique of testing for publication bias called the funnel graph method. It relies on visual inspection of a diagram in which each study result is plot-. ted in a coordinate system. The horizontal axis shows each result. The vertical axis shows the sample size on which each result is
TRANSPORTATION RESEARCH RECORD 1485
based. The idea is that if there is no publication bias the scatter plot of study results should resemble the form of a funnel turned upside down. The dispersion of points in the diagram should narrow as sample size increases, since large sample sizes provide more precise estimates of effects than small sample sizes. If the tails of the scatter plot are symmetrical and the density of points is the same in all areas of the diagram, this indicates that there is no publication bias.
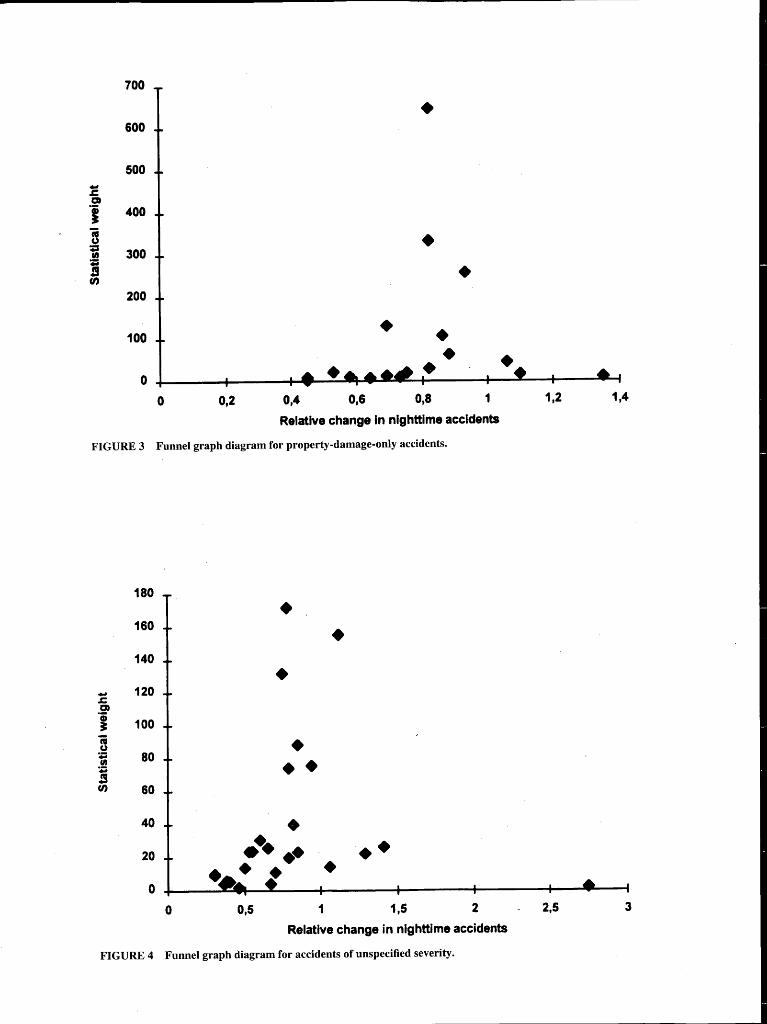
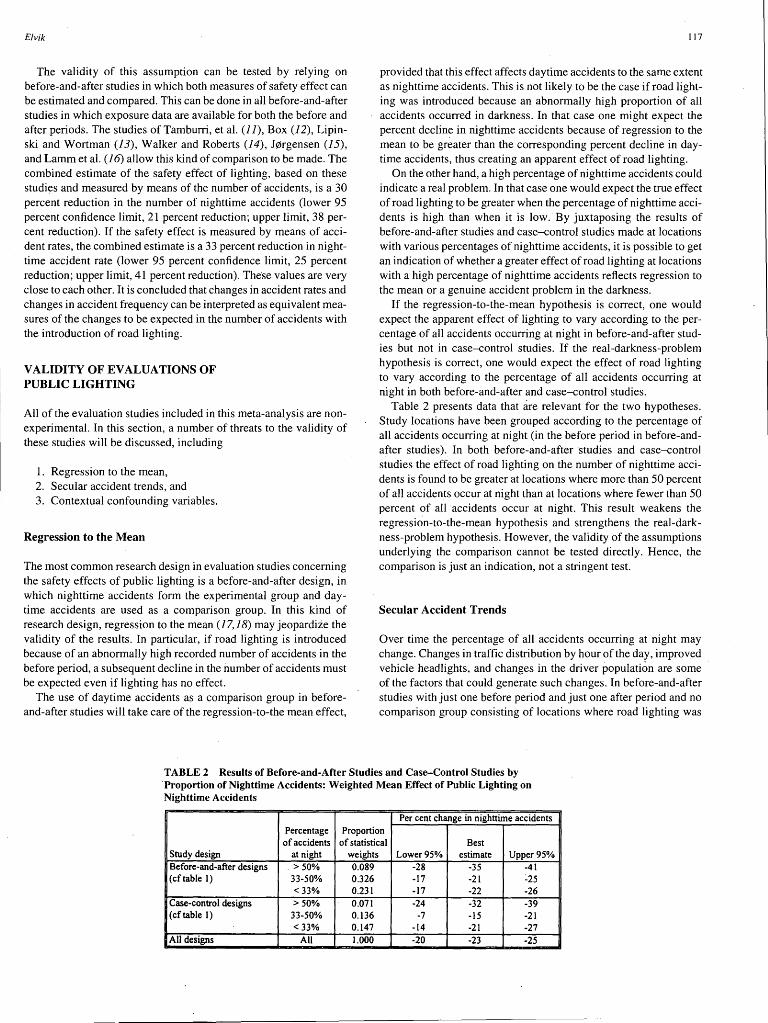
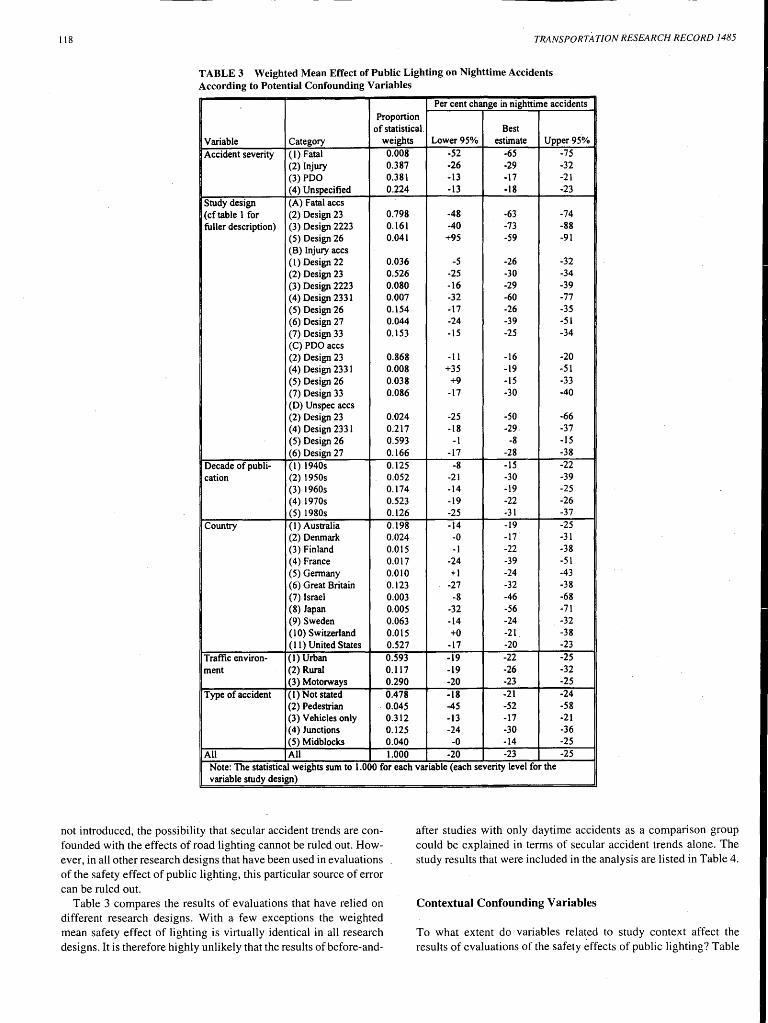
Figures .1 to 4 show funnel graph diagrams of study results for studies of the effects of public lighting on fatal accidents (Figure 1 ), injury accidents (Figure 2), property-damage-only accidents (Figure 3), and accidents of unspecified severity (Figure 4). The latter category presumably includes accidents at all levels of severity. Statistical weight is used as a measure of sample size. The statistical weight of a result is proportional to the inverse of the variance of that result. For example, for a result based on 45 (dark, before), 25 (dark, after), 90 (day, before) and 85 (day, after) accidents, the statistical weight is 1/(1/45 + 1/25 + 1/90 + 1/85). Accidents of different degrees of severity were treated separately, because both safety effects and sample sizes are likely to differ across severity levels.
Inspection of Figures 1 to 4 does not give any indication of a clear publication bias. There is, however, a considerable amount of spread in the results. This indicates that statistically aggregating the results in terms of a weighted mean estimate of safety effect may be problematic.
Is There a True Mean Safety Effect?
The shape of scatter plots in funnel graph diagrams indicates if it makes sense to estimate a weighted mean safety effect. If the funnel graph is bimodal (has two humps) or multi modal or if there is no clear pattern in the scatter plot, a weighted mean will not be very informative. If a funnel pattern is· clearly visible, estimating a weighted mean safety effect will be informative and will indicate the size of the effect that studies tend to converge to as sample size increases. In Figures 1 to 4 the funnel pattern is visible and a weighted mean value of the safety effects of lighting has been estimated.
In addition, Fleiss (5) describes a formal test of the homogeneity of the results. This test indicates that the results referring to fatal accidents and property-damage-only accidents are homogeneous, whereas there is a statistically significant heterogeneity in the results referring to injury accidents and accidents of unspecified severity. It was nevertheless decided to combine evidence from the various studies referring to injury accidents and accidents of unspecified severity to explore some of the sources of heterogeneity in the results.
Comparability of Measures of Effect
As pointed out earlier two measures of safety effect have been used in studies evaluating the safety effects of public lighting: changes in the odds ratio based on the number of accidents and changes in the odds ratio based on accident rates. In the funnel graph diagrams these two measures of safety effect have been mixed, relying on the assumption that neither the total amount of exposure nor its distribution between daytime and nighttime is affected by road lighting.
12 • 10 •
-z:; 8 m
I fti 6 u :g en ;; J! en 4
2 • •• • • •• • • • 0 • • • 0 0,2 0,4 0,6 0,8 1 1,2 1,4
Relative change In nighttime accidents
FIGURE 1 Funnel graph diagram for fatal accidents.
200
• 180
160 • 140 -z:; CD 120 ·; •
fti 100 u ;; en ;; 80 J! en ••
60
40
20
0
0 0,5 1 1,5 2 2,5 3 3,5 4 4,5
Relative change in nighttime accidents
FIGURE 2 Funnel graph diagram for injury accidents.
700
• 600
500 -~ CD
1 400
3 ;I 300 ,,, • ! fl) •
200
• 100
0
0 0,2 0,4 0,6 0,8 1
Relative change In nighttime accidents
FIGURE 3 Funnel graph diagram for property-damage-only accidents.
180
160
140
- 120 .s:;, CD
I 100 Ci u = 80 ,,, = J! fl) 60
40
20
0
0
•
•
• ••
•
• • •• •• •• • • • 0,5 1 1,5 2
•
Relative change in nighttime accidents
FIGURE 4 Funnel graph diagram for accidents of unspecified severity.
1,2 1,4
2,5 3
Elvik
The validity of this assumption can be tested by relying on before-and-after studies in which both measures of safety effect can be estimated and compared. This can be done in all before-and-after studies in which exposure data are available for both the before and after periods. The studies of Tamburri, et al. (11), Box (12), Lipinski and Wortman (13), Walker and Roberts (14), J0rgensen (15), and Lamm et al. (16) allow this kind of comparison to be made. The combined estimate of the safety effect of lighting, based on these studies and measured by means of the number of accidents, is a 30 percent reduction in the number of nighttime accidents (lower 95 percent confidence limit, 21 percent reduction; upper limit, 38 percent reduction). If the safety effect is measured by means of accident rates, the combined estimate is a 33 percent reduction in nighttime accident rate (lower 95 percent confidence limit, 25 percent reduction; upper limit, 41 percent reduction). These values are very close to each other. It is concluded that changes in accident rates and changes in accident frequency can be interpreted as equivalent measures of the changes to be expected in the number of accidents with the introduction of road lighting.
VALIDITY OF EV ALUA TIO NS OF PUBLIC LIGHTING
All of the evaluation studies included in this meta-analysis are nonexperimental. In this section, a number of threats to the validity of these studies will be discussed, including
1. Regression to the mean, 2. Secular accident trends, and 3. Contextual confounding variables.
Regression to the Mean
The most common research design in evaluation studies concerning the safety effects of public lighting is a before-and-after design, in which nighttime accidents form the experimental group and daytime accidents are used as a comparison group. In this kind of research design, regression to the mean (17, 18) may jeopardize the validity of the results. In particular, if road lighting is introduced because of an abnormally high recorded number of accidents in the before period, a subsequent decline in the number of accidents must be expected even if lighting has no effect.
The use of daytime accidents as a comparison group in beforeand-after studies will take care of the regression-to-the mean effect,
117
provided that this effect affects daytime accidents to the same extent as nighttime accidents. This is not likely to be the case if road lighting was introduced because an abnormally high proportion of all accidents occurred in darkness. In that case one might expect the percent decline in nighttime accidents because of regression to the mean to be greater than the corresponding percent decline in daytime accidents, thus creating an apparent effect of road lighting.
On the other hand, a high percentage of nighttime accidents could indicate a real problem. In that case one would expect the true effect of road lighting to be greater when the percentage of nighttime accidents is high than when it is low. By juxtaposing the results of before-and-after studies and case-control studies made at locations with various percentages of nighttime accidents, it is possible to get an indication of whether a greater effect of road lighting at locations with a high percentage of nighttime accidents reflects regression to the mean or a genuine accident problem in the darkness.
If the regression-to-the-mean hypothesis is correct, one would expect the apparent effect of lighting to vary according to the percentage of all accidents occurring at night in before-and-after studies but not in case-control studies. If the real-darkness-problem hypothesis is correct, one would expect the effect of road lighting to vary according to the percentage of all accidents occurring at night in both before-and-after and case-control studies.
Table 2 presents data that are relevant for the two hypotheses. Study locations have been grouped according to the percentage of all accidents occurring at night (in the before period in before-andafter studies). In both before-and-after studies and case-control studies the effect of road lighting on the number of nighttime accidents is found to be greater at locations where more than 50 percent of all accidents occur at night than at locations where fewer than 50 percent of all accidents occur at night. This result weakens the regression-to-the-mean hypothesis and strengthens the real-darkness-problem hypothesis. However, the validity of the assumptions underlying the comparison cannot be tested directly. Hence, the comparison is just an indication, not a stringent test.
Secular Accident Trends
Over time the percentage of all accidents occurring at night may change. Changes in traffic distribution by hour of the day, improved vehicle headlights, and changes in the driver population are some of the factors that could generate such changes. In before-and-after studies with just one before period and just one after period and no comparison group consisting of locations where road lighting was
TABLE 2 Results of Before-and-After Studies and Case-Control Studies by ·Proportion of Nighttime Accidents: Weighted Mean Effect of Public Lighting on Nighttime Accidents
Per cent change in nighttime accidents Percentage Proportion of accidents of statistical Best
Study design at night weights Lower95% estimate Upper 95% Before-and-after designs . >50% 0.089 -28 -35 -41 (cftable 1) 33-50% 0.326 -17 -21 ~25
<33% 0.231 -17 -22 -26 Case-control designs >50% 0.071 -24 -32 -39 (cftable I) 33-50% 0.136 -7 -15 -21
<33% 0.147 -14 -21 -27 All designs All 1.000 -20 -23 -25
118 TRANSPORTATION RESEARCH RECORD 1485
TABLE 3 Weighted Mean Effect of Public Lighting on Nighttime Accidents According to Potential Confounding Variables
Per cent change in nighttime accidents Proportion
of statistical. Best Variable Category weights Lower95% estimate Upper 95.%
Accident severity (1) Fatal 0.008 -52 -65 -75 (2) Injury 0.387 -26 -29 -32 (3) PDO 0.381 -13 -17 -21 (4) Unspecified 0.224 -13 -18 -23
Study design (A) Fatal aces (cf table l for (2) Design 23 0.798 -48 -63 -74 fuller description) (3) Design 2223 0.161 -40 -73 -88
(5) Design 26 0.041 +95 -59 -91 (B) Injury aces (l) Design 22 0.036 -5 -26 -32 (2) Design 23 0.526 -25 -30 -34 (3) Design 2223 0.080 -16 -29 -39 (4) Design 2331 0.007 -32 -60 -77 (5) Design 26 0.154 -17 -26 -35 (6) Design 27 0.044 -24 -39 -51 (7) Design 33 0.153 -15 -25 -34 (C) PDQ aces (2) Design 23 0.868 -11 -16 -20 (4) Design 2331 0.008 +35 -19 -51 (5) Design 26 O.Q38 +9 -15 -33 (7) Design 33 0.086 -17 -30 -40 (D) Unspec aces (2) Design 23 0.024 -25 -50 -66 (4) Design 2331 0.217 -18 -29 -37 (5) Design 26 0.593 -1 -8 -15 (6) Design 27 0.166 -17 -28 -38
Decade of pub Ii- (1) 1940s 0.125 -8 -15 -22 cation (2) 1950s 0.052 -21 -30 -39
(3) 1960s 0.174 -14 -19 -25 (4) 1970s 0.523 -19 -22 -26 (5) 1980s 0.126 -25 -31 -37
Country ( 1) Australia 0.198 -14 -19 -25 (2) Denmark 0.024 -0 -17 -31 (3) Finland O.Ql5 -1 -22 -38 (4) France 0.017 -24 -39 -51 (5) Germany 0.010 +l -24 -43 (6) Great Britain 0.123 -27 -32 -38 (7) Israel 0.003 -8 -46 -68 (8) Japan 0.005 -32 -56 -71 (9) Sweden 0.063 -14 -24 -32 ( 10) Switzerland O.Ql5 +O -21. -38 (11) United States 0.527 -17 -20 -23
Traffic environ- (1) Urban 0.593 -19 -22 -25 ment (2) Rural 0.117 -19 -26 -32
(3) Motorways 0.290 -20 -23 -25
Type of accident ( 1) Not stated 0.478 -18 -21 -24 (2) Pedestrian . 0.045 -45 -52 -58 (3) Vehicles only 0.312 -13 -17 -21 (4)Junctions 0.125 -24 -30 -36 (5) Midblocks 0.040 -0 -14 -25
All All 1.000 -20 -23 -25 Note: The statistical weights sum to 1.000 for each variable (each severity level for the variable study design)
not introduced, the possibility that secular accident trends are confounded with the effects of road lighting cannot be ruled out. However, in all other research designs that have been used in evaluations of the safety effect of public lighting, this particular source of error can be ruled out.
Table 3 compares the results of evaluations that have relied on different research designs. With a few exceptions the weighted mean safety effect of lighting is virtually identical in all research designs. It is therefore highly unlikely that the results of before-and-
after studies with only daytime accidents as a comparison group could be explained in terms of secular accident trends alone. The study results that were included in the analysis are listed in Table 4.
Contextual Confounding Variables
To what extent do variables related to study context affect the results of evaluations of the safety effects of public lighting? Table
Elvik 119
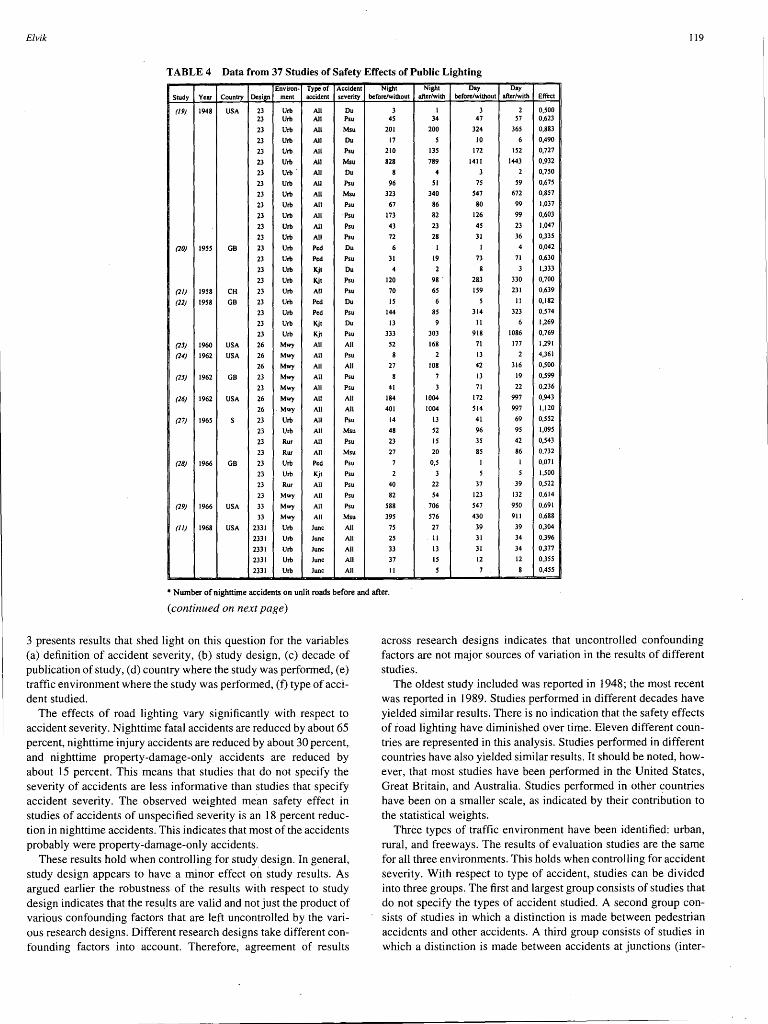
TABLE 4 Data from 37 Studies of Safety Effects of Public Lighting
Environ- Type of Accident Night Night Day Day Study Year Country Design ment accident severity before/without after/with before/without after/with Effect
(19) 1948 USA 23 Urb All Du 3 I 3 2 O,SOO 23 Urb All Psu 45 34 47 51 0,623
23 Urb All Msu 201 200 324 365 0,883
23 Urb All Du 17 s 10 6 0,490
23 Urb All Psu 210 135 172 152 0,727
23 Urb All Msu 828 789 1411 1443 0,932
23 Urb. All Du 8 4 3 2 0,750
23 Urb All Psu 96 SI 75 59 0,675
23 Urb All Msu 323 340 547 672 0,857
23 Urb All Psu 67 86 80 99 1,037
23 Urb All Psu 173 82 126 99 0,603
23 Urb All Psu 43 23 45 23 1,047
23 Urb All Psu 72 28 31 36 0,335
(10) 1955 GB 23 Urb Ped Du 6 I I 4 0,042
23 Urb Ped Psu JI 19 7J 71 0,630
23 Urb Kjt Du 4 2 8 3 1,333
23 Urb Kjt Psu 120 98. 283 JJO 0,700
(11) 1958 CH 23 Urb All Psu 70 65 159 231 0,639
(22) 1958 GB 23 Urb Ped Du IS 6 s II 0,182
23 Urb Ped Psu 144 85 314 323 0,574
23 Urb Kjt Du 13 9 11 6 1,269
23 Urb Kjt Psu 333 JOJ 918 1086 0,769
(13) 1960 USA 26 Mwy All All 52 168 71 177 1,291
(24) 1962 USA 26 Mwy All Psu 8 2 13 2 4,361
26 Mwy All All 27 108 42 316 O,SOO
(25) 1962 GB 23 Mwy All Psu 8 7 13 19 0,599
23 Mwy All Psu 41 J 71 22 0,236
(26) 1962 USA 26 Mwy All All 184 1004 172 997 0,943
26 .Mwy All All 401 1004 514 997 1,120
(27} 1965 s 23 Urb All Psu 14 13 41 69 0,552
23 Urb All Msu 48 52 96 95 1,095
23 Rur All Psu 23 15 35 42 0,543
23 Rur All Msu 27 20 85 86 0,732
(28) 1966 GB 23 Urb Ped Psu 7 0,5 I I 0,071
23 Urb Kjt Psu 2 J s s l,SOO
23 Rur All Psu 40 22 37 39 0,522
23 Mwy All Psu 82 54 123 132 0,614
(29) 1966 USA JJ Mwy All Psu 588 706 541 950 0,691
33 Mwy All Msu 395 576 430 911 0,688
(II) 1968 USA 2331 Urb June All 75 27 39 39 0,304
2331 Urb June All 25 11 31 34 0,396
2331 Urb June All 33 13 31 34 0,377
2331 Urb June All 37 IS 12 12 0,355
2331 Urb June All II s 7 8 0,455
•Number of nighttime accidents on unlit roads before and after.
(continued on next page)
3 presents results that shed light on this question for the variables (a) definition of accident severity, (b) study design, (c) decade of publication of study, ( d) country where the study was performed, ( e) traffic environment where the study was performed, (f) type of accident studied.
The effects of road lighting vary significantly with respect to accident severity. Nighttime fatal accidents are reduced by about 65 percent, nighttime injury accidents are reduced by about 30 percent, and nighttime property-damage-only accidents are reduced by about 15 percent. This means that studies that do not specify the severity of accidents are Jess informative than studies that specify accident severity. The observed weighted mean safety effect in studies of accidents of unspecified severity is an 18 percent reduction in nighttime accidents. This indicates that most of the accidents probably were property-damage-only accidents.
These results hold when controlling for study design. In general, study design appears to have a minor effect on study results. As argued earlier the robustness of the results with respect to study design indicates that the results are valid and not just the product of various confounding factors that are left uncontrolled by the various research designs. Different research designs take different confounding factors into account. Therefore, agreement of results
across research designs indicates that uncontrolled confounding factors are not major sources of variation in the results of different studies.
The oldest study included was reported in 1948; the most recent was reported in 1989. Studies performed in different decades have yielded similar results. There is no indication that the safety effects of road lighting have diminished over time. Eleven different countries are represented in this analysis. Studies performed in different countries have also yielded similar results. It should be noted, however, that most studies have been performed in the United States, Great Britain, and Australia. Studies performed in other countries have been on a smaller scale, as indicated by their contribution to the statistical weights.
Three types of traffic environment have been identified: urban, rural, and freeways. The results of evaluation studies are the same for all three environments. This holds when controlling for accident severity. With respect to type of accident, studies can be divided into three groups. The first and largest group consists of studies that do not specify the types of accident studied. A second group consists of studies in which a distinction is made between pedestrian accidents and other accidents. A third group consists of studies in which a distinction is made between accidents at junctions (inter-
120 TRANSPORTATION RESEARCH RECORD 1485
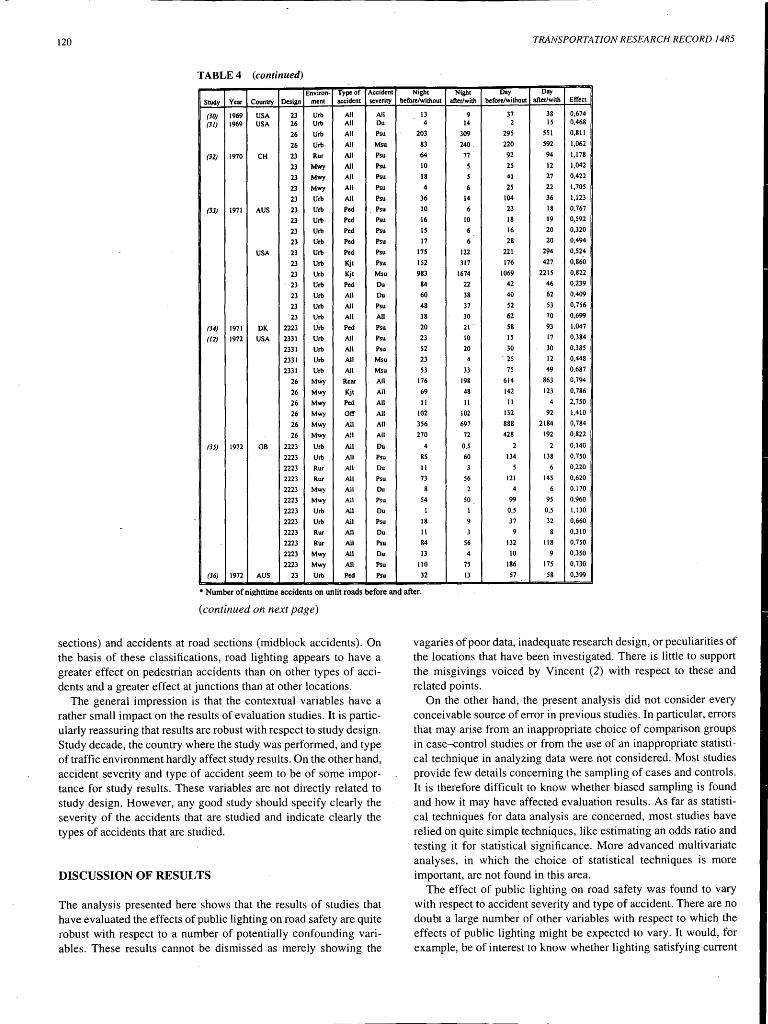
TABLE 4 (continued)
Environ- Type of Accident Night Night Day Day
Study Yeiir Counuy Design ment accident severity before/without after/with before/without after/with Effect
(JO) 1969 USA 23 Urb All All 13 9 37 38 0,674
(JI) 1969 USA 26 Urb All Du 4 14 2 IS 0,468
26 Urb All Psu 203 309 295 551 0,811
26 Urb All Msu 83 240. 220 592 1,062
(J2) 1970 CH 23 Rur All Psu 64 77 92 94 1,178
23 Mwy All Psu 10 s 25 12 1,042
23 Mwy All Psu 18 s 41 27 0,422
23 Mwy All Psu 4 6 25 22 1,705
23 Urb All Psu 36 14 104 36 1,123
(JJ) 1971 AUS 23 Urb Ped Psu 10 6 23 18 0,767
23 Urb Ped Psu 16 10 18 19 0,592
23 Urb Ped Psu IS 6 16 20 0,320
23 Urb Ped Psu 17 6 28 20 0,494
USA 23 Urb Ped Psu 11S 122 221 294 0,524
23 Urb Kjt Psu 1S2 317 176 427 0,860
23 Urb Kjt Msu 983 1674 1069 2215 0,822
. 23 Urb Ped Du 84 22 42 46 0,239
23 Urb All Du 60 38 40 62 0,409
23 Urb All Psu 48 37 52 53 0,756
23 Urb All All 38 30 62 70 0,699
(J4) 1971 DK 2223 Urb Ped Psu 20 21 . 58 93 1,047
(12) 1972 USA 2331 Urb All Psu 23 10 IS 17 0,384
2331 Urb All Psu 52 20 30 30 0,385
2331 Urb All Msu 23 4 - 25 12 0,448
2331 Urb All Msu SJ 33 75 49 0,687
26 Mwy Rear All 176 198 614 863 0,794
26 Mwy Kjt All 69 48 142 123 0,786
26 Mwy Ped All II II II 4 2,750
26 Mwy Off All 102 102 132 92 1,410
26 Mwy All All 356 697 888 2184 0,784
26 Mwy All All 270 72 428 192 0,822
(J5) 1972 GB 2223 Urb All Du 4 O,S 2 2 0,140
2223 Urb All Psu SS 60 134 138 0,750
2223 Rur All Du II 3 s 6 0,220
2223 Rur All Psu 73 56 121 145 0,620
2223 Mwy All Du 8 2 4 6 0,170
2223 Mwy All Psu 54 so 99 95 0,960
2223 Urb All Du I I 0,5 0,5 1,130
2223 Urb All Psu 18 9 37 32 0,660
2223 Rur All Du II 3 9 8 0,310
2223 Rur All Psu 84 56 132 118 0,750
2223 Mwy All Du 13 4 10 9 0,350
2223 Mwy All Psu 110 75 186 175 0,730
(J6) 1972 AUS 23 Urb Ped Psu 32 13 57 58 0,399
•Number ofnilthttime accidents on unlit roads before and after.
(continued on next page)
sections) and accidents at road sections (midblock accidents). On the basis of these classifications, road lighting appears to have a greater effect on pedestrian accidents than on other types of accidents and a greater effect at junctions than at other locations.
The general impression is that the contextual variables have a rather small impact on the results of evaluation studies. It is particularly reassuring that results are robust with respect to study design. Study decade, the country where the study was performed, and type of traffic environment hardly affect study results. On the other hand, accident severity and type of accident seem to be of some importance for study results. These variables are not directly related to study design. However, any good study should specify clearly the severity of the accidents that are studied and indicate clearly the types of accidents that are studied.
DISCUSSION OF RESULTS
The analysis presented here shows that the results of studies that have evaluated the effects of public lighting on road safety are quite robust with respect to a number of potentially confounding variables. These results cannot be dismissed as merely showing the
vagaries of poor data, inadequate research design, or peculiarities of the locations that have been investigated. There is little to support the misgivings voiced by Vincent (2) with respect to these and related points.
On the other hand, the present analysis did not consider every conceivable source of error in previous studies. In particular, errors that may arise from an inappropriate choice of comparison groups in case-control studies or from the use of an inappropriate statistical technique in analyzing data were not considered. Most studies provide few details concerning the sampling of cases and controls. It is therefore difficult to know whether biased sampling is found and how it may have affected evaluation results. As far as statistical techniques for data analysis are concerned, most studies have relied on quite simple techniques, like estimating an odds ratio and testing it for statistical significance. More advanced multivariate analyses, in which the choice of statistical techniques is more important, are not found in this area.
The effect of public lighting on road safety was found to vary with respect to accident severity and type of accident. There are no doubt a large number of other variables with respect to which the effects of public lighting might be expected to vary. It would, for example, be of interest to know whether lighting satisfying current
Elvik 121
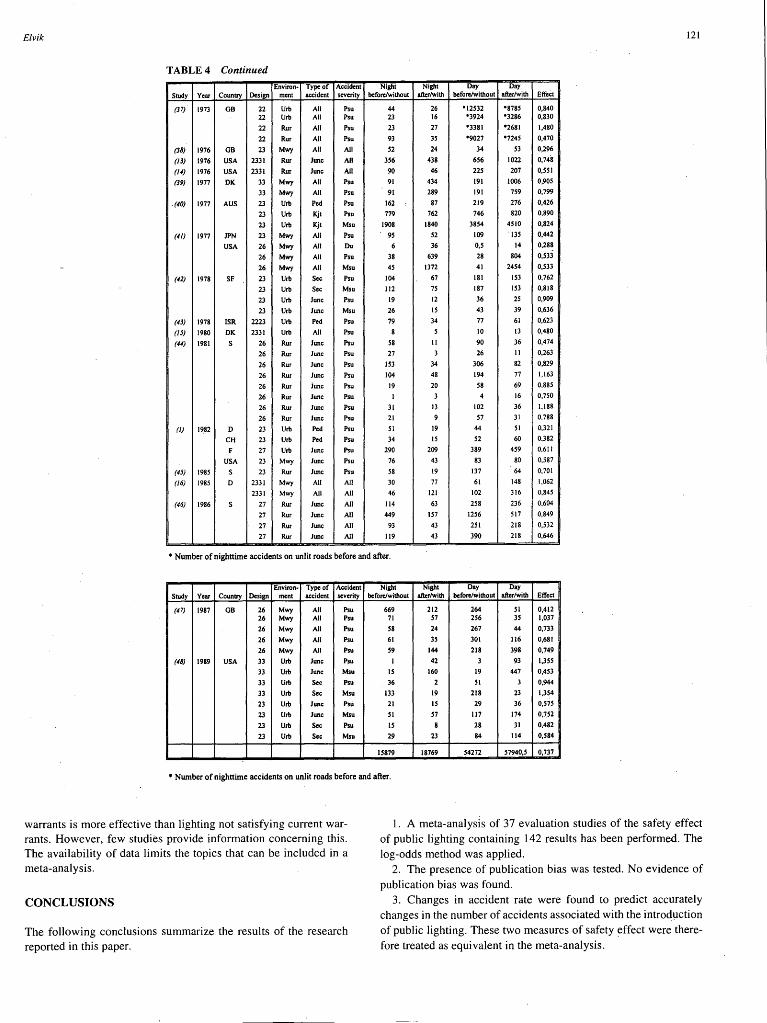
TABLE 4 Continued
Environ- Type of Accident Night Night Day Day Study Year Country Design ment accident severity before/without after/with before/without after/with Effect
(37} 197J GB 22 Urb All Psu 44 26 •12sJ2 0 878S 0,840 22 Urb All Psu 23 16 •3924 0 J286 0,8JO
22 Rur All Psu 23 27 0 3381 0 2681 1,480
22 Rur All Psu 9J JS 0 9027 •7245 0,470
(38) 1976 GB 23 Mwy All All S2 24 34 SJ 0,296
(13) 1976 USA 2331 Rur June All 3S6 438 6S6 1022 0,748
(14) 1976 USA 2331 Rur June All 90 46 22S 207 O,SSI
(39} 1977 DK 33 Mwy All Psu 91 434 191 1006 0,905
33 Mwy All Psu 91 289 191 7S9 0,799
(40) 1977 AUS 23 Urb Ped Psu 162 87 219 276 0,426
23 Urb Kjt Psu 119 762 746 820 0,890
23 Urb Kjt Msu 1908 1840 3854 4510 0,824
(41) 1977 JPN 23 Mwy All Psu 9S S2 109 13S 0,442
USA 26 Mwy All Du 6 36 o.s 14 0,288
26 Mwy All Psu 38 639 28 804 O,S33
26 Mwy All Msu 45 1372 41 2454 0,5J3
(42} 1978 SF 23 Urb Sec Psu 104 67 181 IS3 0,762
23 Urb Sec Msu 112 75 187 IS3 0,818
23 Urb June Psu 19 12 36 2S 0,909
23 Urb June Msu 26 IS 43 39 0,636
(43) 1978 ISR 2223 Urb Ped Psu 79 34 77 61 0,623
(15) 1980 DK 2331 Urb All Psu 8 s 10 13 0,480
(44) 1981 s 26 Rur June Psu S8 II 90 36 0,474
26 Rur June Psu 27 J 26 II 0,263
26 Rur June Psu 153 34 306 82 0,829
26 Rur June Psu 104 48 194 77 1,163
26 Rur iunc Psu 19 20 58 69 0,885
26 Rur June Psu I 3 4 16 0,750
26 Rur June Psu 31 13 102 36 1,188
26 Rur June Psu 21 9 57 31 0,788
(I) 1982 D 23 Urb Ped Psu 51 19 44 SI 0,321
CH 23 Urb Ped Psu 34 15 52 60 0,382
F 27 Urb June Psu 290 209 J89 4S9 Q,611
USA 23 Mwy June Psu 76 4J 8J 80 0,587
(45) 1985 s 2J Rur June Psu S8 19 IJ7 64 0,701
(16) 198S D 2331 Mwy All All JO 77 61 148 1,062
2331 Mwy All All 46 121 102 Jl6 0,84S
(46) 1986 s 27 Rur June All 114 6J 2S8 2J6 0,604
27 Rur June All 449 157 12S6 517 0,849
27 Rur June All 9J 4J 2SI 218 0,5J2
27 Rur June All 119 43 390 218 0,646
•Number of nighttime accidents on unlit roads before and after.
Environ- Type of Accident Night Night Day Day Study Year Country Design ment accident severity before/without after/with before/without after/with Effect
(47) 1987 GB 26 Mwy All Psu 669 212 264 SI 0,412 26 Mwy All Psu 71 S7 2S6 JS 1,037
26 Mwy All Psu S8 24 267 44 0,73J
26 Mwy All Psu 61 3S JOI 116 0,681
26 Mwy All Psu S9 144 218 398 0,749
(48) 1989 USA 33 Urb June Psu I 42 3 93 l,JSS
3J Urb June Msu IS 160 19 447 0,453
33 Urb Sec Psu J6 2 SI 3 0,944
3J Urb Sec Msu 133 19 218 2J l,3S4
23 Urb June Psu 21 IS 29 36 0,575
23 Urb June Msu SI S1 117 174 o;~S2
23 Urb Sec Psu IS 8 28 JI 0,482
23 Urb Sec Msu 29 2J 84 114 0,584
IS879 18769 S4272 S1940,S 0,737
•Number of nighttime accidents on unlit roads before and after.
warrants is more effective than lighting not satisfying current warrants. However, few studies provide information concerning this. The availability of data limits the topics that can be included in a meta-analysis.
CONCLUSIONS
The following conclusions summarize the results of the research reported in this paper.
1. A meta-analysis of 37 evaluation studies of the safety effect of public lighting containing 142 results has been performed. The log-odds method was applied.
2. The presence of publication bias was tested. No evidence of publication bias was found.
3. Changes in accident rate were found to predict accurately changes in the number of accidents associated with the introduction of public lighting. These two measures of safety effect were therefore treated as equivalent in the meta-analysis.
122
4. The validity of research results was tested with respect to (a) regression to the mean; (b) secular accident trends; and (c) contextual confounding variables, including definition of accident severity, study design, decade of publication, country where the study was performed type of traffic environment, and type of accident studied. It was concluded that regression to the mean and secular accident trends are unlikely to have affected the results of evaluation studies materially. As far as confounding variables are concerned, accident severity and type of accident studied were found to affect study results. The other confounding variables did not affect study results.
5. The best current estimate of the safety effects of road lighting in rounded values is a 65 percent reduction in nighttime fatal accidents, a 30 percent reduction in nighttime injury accidents, and a 15 percent reduction in nighttime property-damage-only accidents.
REFERENCES
1. Schwab, R. N., N. E. Walton, J.M. Mounce, and M. J. Rosenbaum. Roadway Lighting. Synthesis of Safety Research Related to Traffic Control and Roadway Elements, Vol. 2. ReportFHWA-TS-82-233. FHWA, U.S. Department of Transportation, 1982.
2. Vincent, T. Streetlighting and Accidents. Paper 17. In Traffic Accident Evaluation (D. C. Andreassend and P. G. Gipps, eds.), Papers presented at Essa-Monash Civil Engineering Workshop, Normanby House,· Monash University, February 15 to 17, 1983. Department of Civil Engineering, Monash University, Australia, 1983.
3. Elvik, R. Metaanalyse av Effektmalinger av Trafikksikkerhetstiltak. T01-Rapport 232. Transport~konomisk Institute, Oslo, Norway 1994.
4. Hennekens, C.H., and J.E. Buring. Epidemiology in Medicine. Little, Brown & Co, Boston, 1987.
5. Fleiss, J. L. Statistical Methods for Rates and Proportions, 2nd ed. John Wiley and Sons, New York, 1981.
6. Light, R. J., and D. B. Pillemer. Summing Up. The Science of Reviewing Research. Harvard University Press, Cambridge, Mass., 1984.
7. Hedges, L. V., and I. Olkin. Statistical Methods for Meta-Analysis. Academic Press, San Diego, Calif., 1985.
8. Hunter, J.E., and F. L. Schmidt. Methods of Meta-Analysis. Correcting Error and Bias in Research Findings. Sage Publications, Newbury Park, Calif., 1990.
9. Rosenthal, R. M. Meta-Analytic Procedures for Social Research. Applied Social Research Methods Series, Vol. 6. Sage Publications, Newbury Park, Calif., 1991.
10. Hauer, E. Should Stop Yield? Matters of Method in Safety Research. !TE-Journal, Sept. 1991, pp. 25-31.
11. Tamburri, T. N., C. J. Hammer, J.C. Glennon, and A. Lew. Evaluation of Minor Improvements. In Highway Research Record 257, HRB, National Research Council, Washington, D.C., 1968, pp. 34-79.
12. Box, P. C. Freeway Accidents and Illumination. In Highway Research Record 416, HRB, National Research Council, Washington, D.C., 1972, pp. I 0-20.
13. Lipinski, M. E., and R.H. Wortman. Effect of Illumination on Rural At-Grade Intersection Accidents. In Transportation Research Record 611, TRB, National Research Council, Washington, D.C., 1976, pp. 25-27.
14. Walker, F. W., and S. E. Roberts. Influence of Lighting on Accident Frequency at Highway Intersections. In Transportation Research Record 562, TRB, National Research Council, Washington, D.C., 1976, pp. 73-78.
15. forgensen, E. Eksempler pa Effektstudier fra SSV. Vejdirektoratet, S~kretariatet for Sikkerhedsfremmende Vejforanstaltninger (SSV), Nrestved, 1980.
16. Lamm, R., J. H. K!Ockner, and E. M. Choueiri. Freeway Lighting and Traffic Safety-A Long-Term Investigation. In Transportation Research Record 1027, TRB, National Research Council, Washington, D.C., 1985, pp. 57-63.
17. Hauer, E. Bias-by-Selection: Overestimation of the Effectiveness of Safety Countermeasures Caused by the Process of Selection for Treatment. Accident Analysis and Prevention, Vol. 12, l_ 980, pp. 113-117.
TRANSPORTATION RESEARCH RECORD 1485
18. Hauer, E. On the Estimation of the Expected Number of Accidents. AccidentAnalysis and Prevention, Vol. 18, 1986, pp. 1-12.
19. Seburn, T. C. Relighting A City. Proc., Institute of Traffic Engineers Nineteenth Annual Meeting, 1948, pp. 58-72.
20. Tanner, J. C., and A. W. Christie. Street Lighting and Accidents-A Study of Some New Installations in the London Area. Light and Lighting, Vol. 48, 1955, pp. 395-397.
21. Borel, P. Accident Prevention and Public Lighting. Bulletin des Schweitzerisches Elektrotechnisches Verbands, Vol. 49, No. 1, 1958, pp. 8-11.
22. Tanner, J.C. Reduction of Accidents by Improved Street Lighting. Light and Lighting, Vol. 51, 1958, pp. 353-355.
23. Taragin, A., and B. M. Rudy. Traffic Operations as Related to Highway Illumination and Delineation. Bulletin 255 HRB, National Research Council, Washington, D.C., 1960, pp. 1-22.
24. Billion, C. E., and N. C. Parsons. Median Accident Study-Long Island, New York. Bulletin 308, HRB, National Research Council, Washington, D.C., 1962, pp. 64-79.
25. Christie, A. W. Some Investigations Concerning the Lighting of Traffic Routes. Public Lighting, Vol. 27, 1962, pp. 189-204.
26. Ives, H. S. Does Highway Illumination Affect Accident Occurrence? Traffic Quarterly, Vol. 16, 1962, pp. 229-241.
27. Viig-och Gatubelysningens Inverkan pa Trafik-Siikerheten. Meddelande 60. Transportforskningskommissionen, Stockholm, Sweden, 1965.
28. Christie, A. W. Street Lighting and Road Safety. Traffic Engineering and Control, Vol. 7, 1966, pp. 229-231.
29. In~titute of Traffic Engineers and Illuminating Engineering Society. Joint Committee of Public Lighting. Public Lighting Needs. Special Report to U.S. Senate, 1966.
30. Cleveland, D. E. Illumination. Traffic Control and Roadway Elements-Their Relationship to Highway Safety, Revised. Automotive Safety Foundation, Washington, D.C. 1969, Chapt. 3.
31. Tennessee Valley Authority. A Study of the Benefits of Suburban Highway Lighting. Illuminating Engineering, April 1969, pp. 359-363.
32. Walthert, R., F. Mader, and P. Hehlen. Donnees Statistiques sur la Proportion des Accidents le lour et la Nuit, leurs Causes et Consequences. La Conduite de Nuit, Automobil Club de Suisse, 1970.
33. Fisher, A. J. A Review of Street Lighting in Relation to Road Safety. Report 18. Australian Department of Transport, Australian Government Publishing Service, Canberra, 1971.
34. forgensen, N. 0., and Z. Rabani. Fodgcengeres Sikkerhed i og ved Fodgcenger-Overgange. RfT-Rapport 7. Radet for Trafiksikkerhedsforskning, Copenhagen, Denmark, 1971.
35. Cornwell, P. R., and G. M. Mackay. Lighting and Road Traffic. Part 1. Public Lighting and Road Accidents. Traffic Engineering and Control, Vol. 13, 1972, pp. 142-144.
36. Pegrum, B. V. The Application of Certain Traffic Management Techniques and Their Effect on Road Safety. National Road Safety Symposium, Department of Transport, Canberra, Australia 1972.
37. Sabey, B. E., and H. D. Johnson. Road Lighting and Accidents: Before and After Studies on Trunk Road Sites. TRRL Report LR 586. Transport and Road Research Laboratory, Crowthorne, Berkshire, United Kingdom, 1973.
38. Austin, B. R. Public Lighting-The Deadly Reckoning. Traffic Engineering and Control, Vol. 17, 1976, pp. 262-263.
39. Andersen, K. B. Uheldsm¢nsteret pa Almindelige 4-Sporede Veje. RfTRapport 20. Radet for Trafiksikkerhedsforskning, Copenhagen, Denmark, 1977.
40. Fisher, A. J. Road Lighting as an Accident Countermeasure. Australian Road Research, Vol. 7, No. 4, 1977, pp. 3-15.
41. Ketvirtis, A. Road Illumination and Traffic Safety. Road and Motor Vehicle Traffic Safety Branch, Transport Canada, Ottawa, Ontario, Canada, 1977.
42. National Board of Public Roads and Waterways. Traffic Safety Effects of Road Lights. Vag-och Vattenbyggnadsstyrelsen, Helsinki, Finland, 1978.
43. Polus, A., and A. Katz. An Analysis of Nighttime Pedestrian Accidents at Specially Illuminated Crosswalks. Accident Analysis and Prevention, Vol. 10, 1978, pp. 223-228.
44. Brtide, U., and J. Larsson. Viigkorsningar pa Landsbygd inom Huvudviigniitet. Olycksanalys. VTI-Rapport 233. Statens Vag-och Trafikinstitut, Linkoping, Sweden, 1981.
45. Brtide, U., and J. Larsson. Korsningsatgiirder Vidtagna inom viigforvaltningarnas Trafiksiikerhetsarbete. Regressions-och atgiirdseffekter.

Elvik
VTI-Rapport 292. Statens Vag-och Trafikinstitut, Linkoping, Sweden, 1985.
46. Brtide, U., and J. Larsson. Trafiksiikerhetseffekter av Korsningsatgiirder. VTI-Rapport 310. Statens Vag-och Trafikinstitut, Linkoping, Sweden, 1986.
47. Cobb, J. Light on Motorway Accident Rates. The Journal of the Institution of Highways and Transportation, Oct. 1987, pp. 29-33.
123
48. Box. P. C. Major Road Accident Reduction by Illumination. In Transportation Research Record 1247, TRB, National Research Council, Washington, D.C., 1989, pp. 32-38.
Publication of this paper sponsored by Committee on Methodology for Evaluating Highway Improvements.