Embed Size (px)
Citation preview
Meta-Analysis

HW 8
Roulette
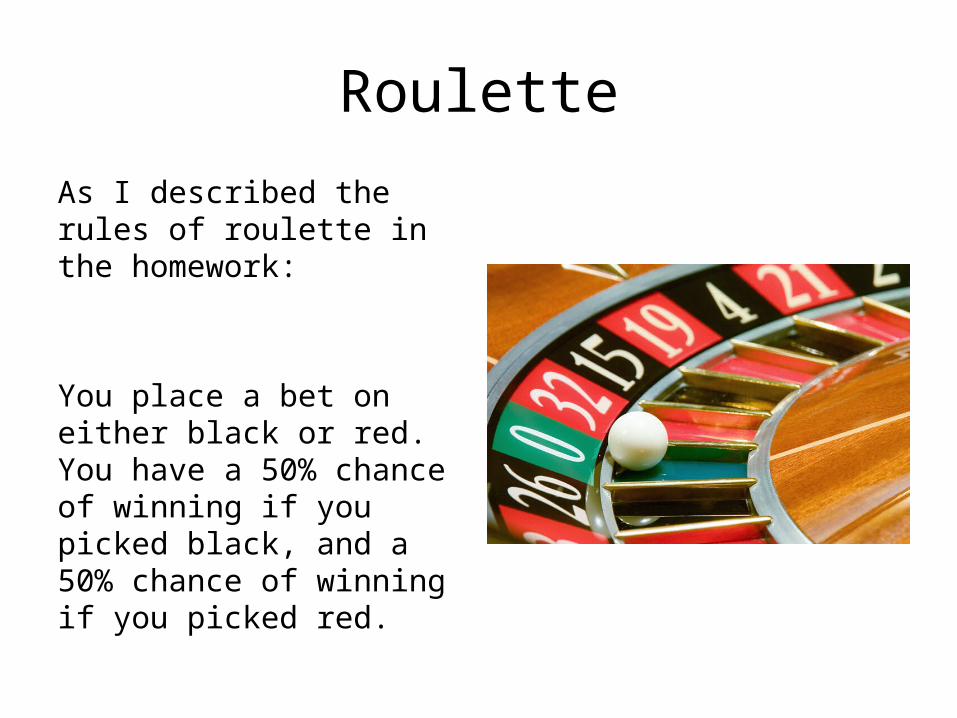
As I described the rules of roulette in the homework:
You place a bet on either black or red. You have a 50% chance of winning if you picked black, and a 50% chance of winning if you picked red.
Roulette
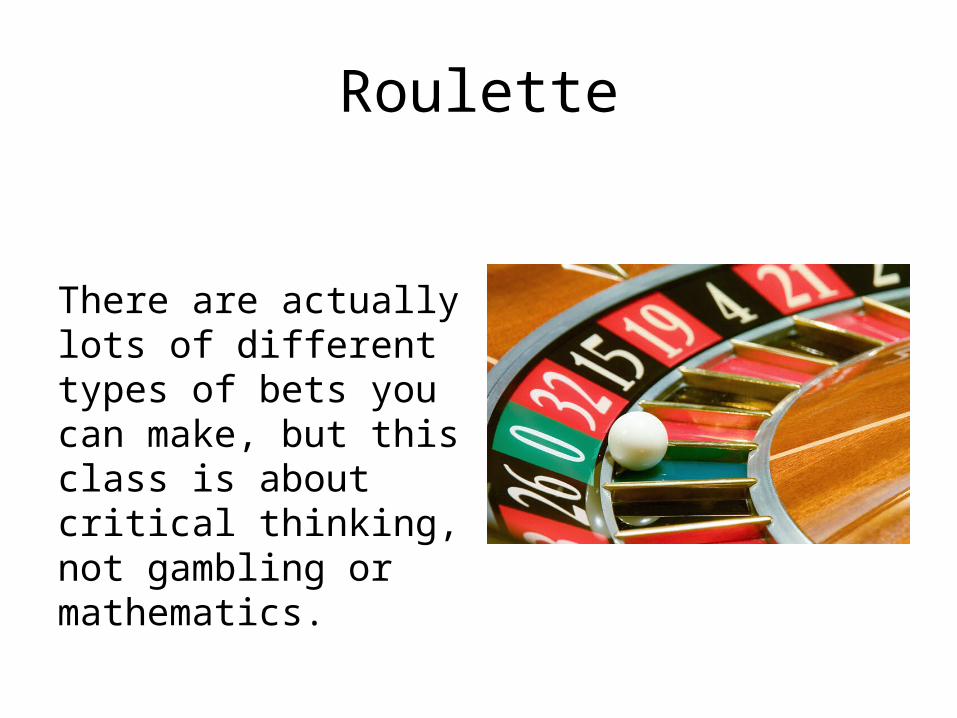
There are actually lots of different types of bets you can make, but this class is about critical thinking, not gambling or mathematics.
Punto Banco
In August of this year, Phil Ivey was playing Punto Banco and won the equivalent of about $87 million dollars.
Like roulette, Punto Banco is completely a game of chance: there is no skill involved, and your odds of winning are almost 50-50 (though of course the casino has an advantage).
“Evidence” = Winning
The casino refused to pay Ivey, presumably because it believes he cheated, although the casino has said that an investigation revealed no evidence of cheating.
It looks like the only “evidence” against him is that it is extremely unlikely that anyone could win that much money betting on coin flips.
Are You a Cheater?
For example (and here’s the homework problem), suppose you play roulette (my rules) ten times in a row, and win all ten times. What are the chances of that happening?
This is going to be (½)^10 = 1 in 1,024. So, pretty low. If you played once a day, 10 games a day, you would win all your games on average about once every 2.8 years. Are you a cheater?
How Many Winners?
But that’s just one person playing 10 games a day. There are lots of people who play every day.
Suppose 1,024,000 have played 10 games in a row at that casino, and nobody ever plays more or less games (this assumption just makes the math easier). How many people do we expect won all 10 games in a row?
How Many Legitimate Winners?
Clearly it’s going to be.
Chances of Winning x Number of Players= (1/1,024) x 1,024,000 = 1,000.
So we expect that there have been a thousand legitimate winners.
How Many Cheaters Won?
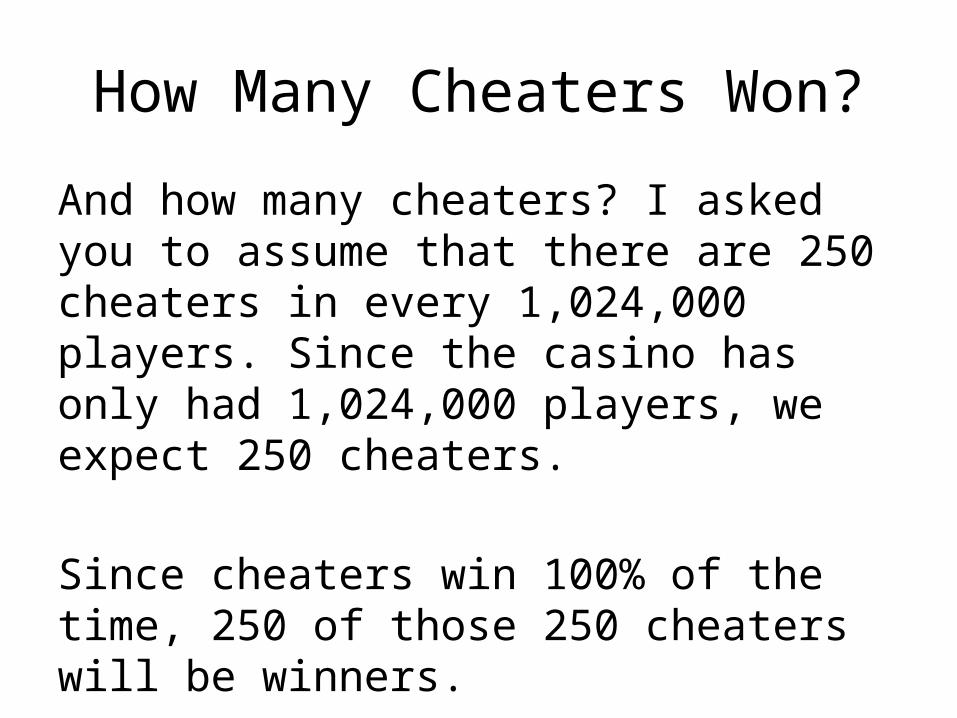
And how many cheaters? I asked you to assume that there are 250 cheaters in every 1,024,000 players. Since the casino has only had 1,024,000 players, we expect 250 cheaters.
Since cheaters win 100% of the time, 250 of those 250 cheaters will be winners.
Answer to the Homework
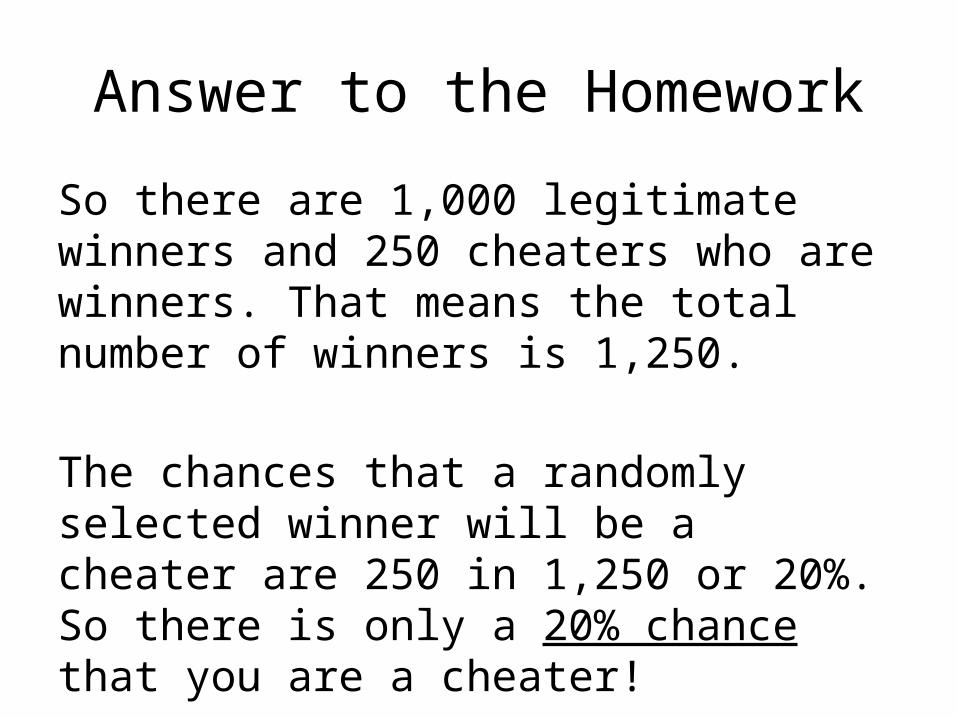
So there are 1,000 legitimate winners and 250 cheaters who are winners. That means the total number of winners is 1,250.
The chances that a randomly selected winner will be a cheater are 250 in 1,250 or 20%. So there is only a 20% chance that you are a cheater!
More Realistic Assumptions
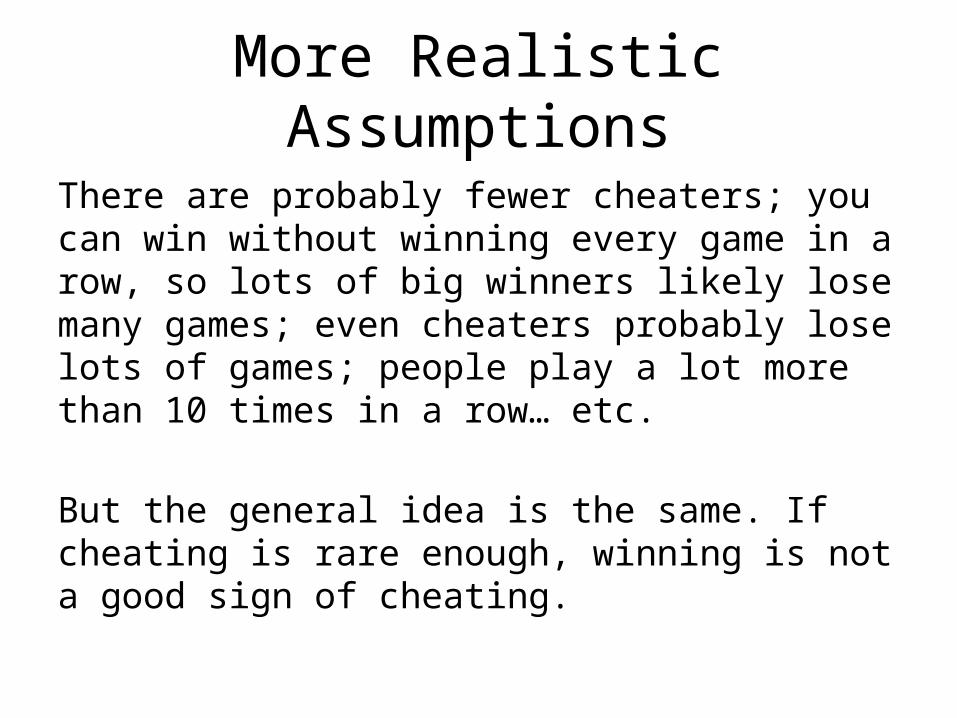
There are probably fewer cheaters; you can win without winning every game in a row, so lots of big winners likely lose many games; even cheaters probably lose lots of games; people play a lot more than 10 times in a row… etc.
But the general idea is the same. If cheating is rare enough, winning is not a good sign of cheating.
Error
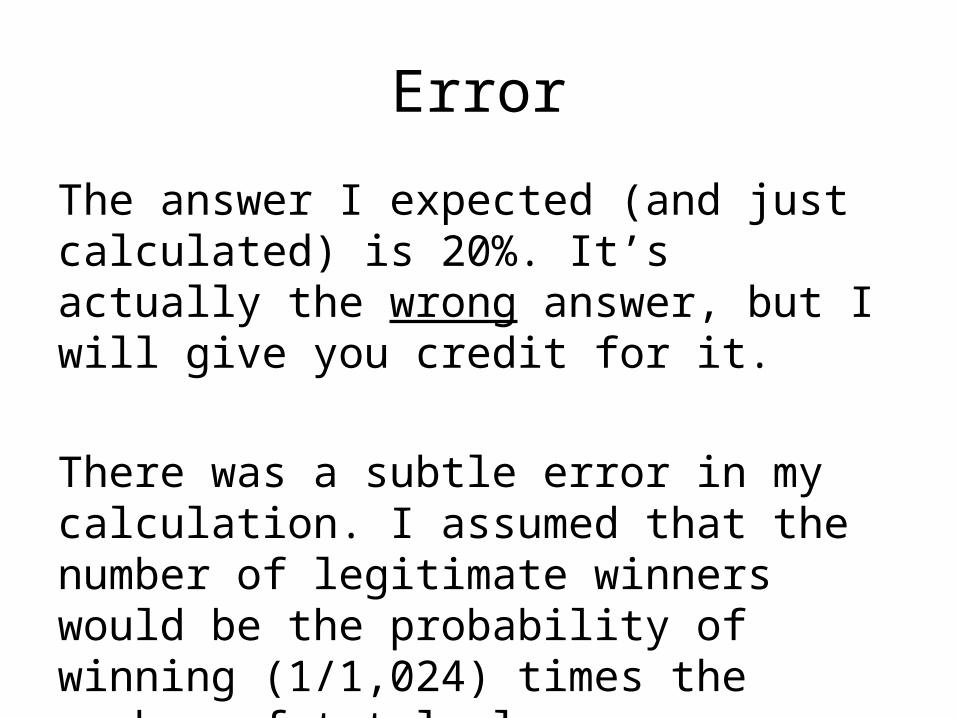
The answer I expected (and just calculated) is 20%. It’s actually the wrong answer, but I will give you credit for it.
There was a subtle error in my calculation. I assumed that the number of legitimate winners would be the probability of winning (1/1,024) times the number of total players.
Cheaters Can’t Win Fairly!
But notice that the cheaters are included in the total number of players, and a cheater will never be a legitimate winner.
So the real expected number of legitimate winners is (1/1,024) x (1,024,000 – 250) = 999.75, or ¼ of a person less than 1,000. This obviously doesn’t really matter.
The Point
People kill themselves when they test positive for HIV. Innocent farmers are kept in Guantanamo Bay for years and tortured because they’ve been turned in as terrorists. People like Lucia de Berk get branded serial killers and put in jail on the basis of circumstantial evidence or DNA tests. People who have fairly won tens of millions of dollars get their winnings denied to them. What do all these cases have in common?
The Point
In all of these cases, someone has neglected the base rate. They have failed to take into account that
When the probability of being an X (HIV positive, serial killer, terrorist, cheater) is low, then even tests with high true positive and low false positive rates are unreliable.
Problem #2
It’s a strange fact that when an area of Chicago has more street crime, it has more car crashes, and when it has less street crime, it has fewer car crashes.
What could explain this strange correlation? I wanted you to attempt three explanations.
Street Crime
I had to look up “street crime” because I didn’t know exactly what it meant. Wikipedia quotes London’s police definition:
“Robbery, often called 'mugging', and also includes thefts from victims in the street where property is snatched and the victim is not assaulted.”
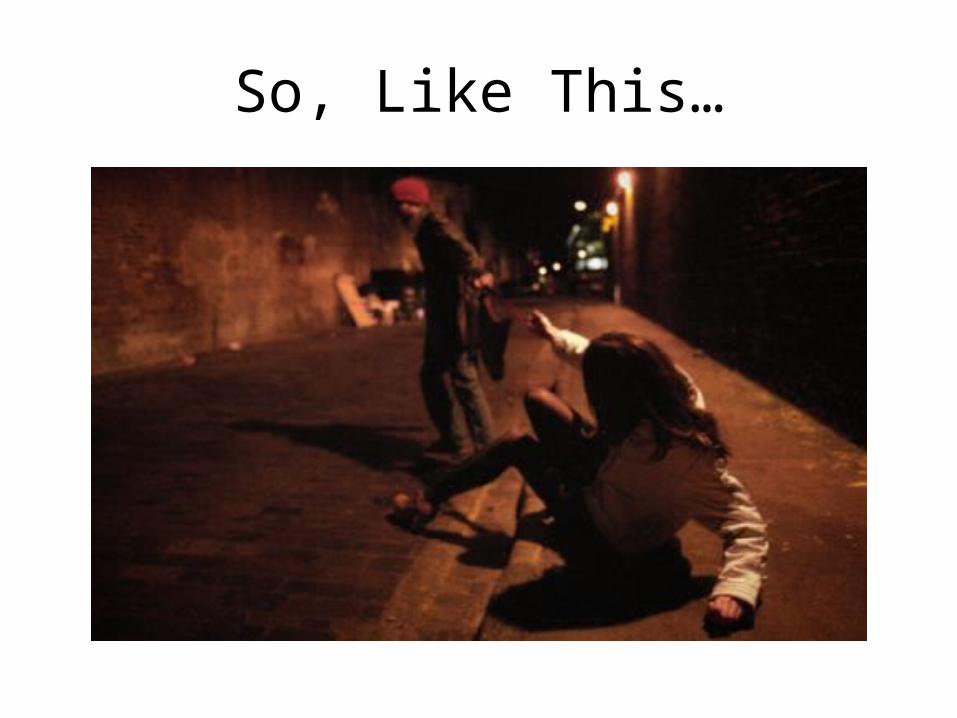
So, Like This…
Street Crime Causes Car Accidents
There are lots of ways street crime could be responsible for more car accidents. 1. If criminals are running away, they may be reckless crossing the street. 2. If they drive away in their cars, they may drive dangerously. 3. If they buy cars with stolen money, they may care less about their cars. 4. If there are lots of muggings, people may drive more often to avoid the crime that occurs on the streets.
Another Reason
One of the commenters on the blog post I linked to actually had another theory:
5. Street crime results in more people getting shot (if you rob someone with a gun and they don’t give you their money, you shoot them). This means more ambulances on the roads, which tend to drive fast and dangerously.
Car Accidents Cause Streetcrime
What about the other causal direction? Can car accidents cause crime? This is less plausible, but there are certainly possibilities.1. If you need money to fix your damaged car, maybe you turn to crime. 2. If someone you know is killed in a car crash, maybe you get angry at the world and become a criminal.
One Additional Possibility
I’ve at least heard of crimes that work like this. Someone runs into your car while you’re stopped at a red light or stop sign. You get out to talk with them and they rob you and drive away.
So maybe it’s not street crime causes car crashes or car crashes cause street crime, but car crashes = street crime!
Common Cause Explanations
There are also various common cause explanations, where some variable C causes both car crashes and street crime. This seems reasonable, and that’s the direction that the blog post I linked to considered.
What could C be?
1. “Deviant Tendency”
According to this explanation, some people have a “deviant tendency,” which is just a fancy way of saying that they like to break the rules, and they aren’t motivated by the same moral concerns as the rest of us.This deviant tendency, so the explanation goes, causes them to break the rules of the road, which brings about accidents, and to break the rules that prohibit robbery.
2. Poverty
Not having money, or medical care, or food, or whatever can obviously lead people to become criminals who rob other people.
But can poverty cause car crashes? The article suggests two ways in which this might happen: by causing people to be lack empathy, and by causing people to be fatalists.
Lack of Empathy
Empathy is an emotional connection that we have to other people and animals. It is when other people’s happiness makes us happy and other people’s sadness makes us sad.
Some evidence suggests that poverty can lead people to lack empathy, and be unconcerned with the suffering of others.
Train Deaths in Mumbai (Bombay)
For example, every year in Mumbai, there are six thousand deaths caused by trains. That’s 16 deaths every day in just one city. People die by getting pushed off the platform in front of moving trains, by getting pushed off moving trains, and by getting trampled to death by people crowding onto trains. How can people be more concerned with pushing onto the train than with the people they’re pushing to death?
Empathy
The suggested explanation is that for so long, the people in Mumbai have been so poor, that they have lost their empathetic connection to others. They don’t feel any sadness or loss when someone else is trampled or pushed off a train. Who cares about that guy? I got what I wanted! (I notice this attitude a lot in Hong Kong too, though obviously people here aren’t so callous as to not care about someone else’s life!)
A Bad Explanation?
Maybe that’s true, but the article suggests it might not explain the correlation between street crime and car accidents.
The reason is that rich people lack empathy too. If you have lots of money, you tend to think of other people as “undeserving peasants” and not care what happens to them.
Fatalism
Fatalism is the idea that whatever will happen will happen (“que sera sera”). The future is fixed, and there’s nothing that can change it.
If poverty causes fatalism, then the poor might think that it’s not worth driving safely or using their turn signals, or whatever, because those things can’t change what will happen.
Fatalism
This is a better explanation, because rich people tend not to be fatalists. They believe that their hard work and effort is what made them rich, not merely the unchanging hand of fate. The poor are more likely to view their situation as not due to their own laziness or incompetence, but rather due to outside forces beyond their control.
Multiple Factors
Finally, there’s no reason to believe that the correlation might not result from all of these factors. It might be that sometimes street crime causes car crashes, sometimes car crashes cause street crime, and sometimes poverty causes both car crashes and street crime. When you “add up” all these effects, the correlation between street crime and poverty becomes strong.
The Point
What is the point of this exercise?
People very often argue from a correlation claim to a causation claim. This is typically an inference to the best explanation. What best explains the correlation between chocolate eating and Nobel prizes? Maybe chocolate causes you to win Nobel prizes.
The Point
As a critical thinker, your job is to evaluate their argument and decide whether to believe the conclusion.
To do this, you have to look to see whether there are better explanations than the one being offered. “It’s more likely,” you might say, “that wealth is the common cause here.”
META-ANALYSES
Meta-Analysis
A meta-analysis is an analysis of analyses.
In clearer terms, it is a study that looks at lots of different experiments that have been conducted on the same problem, and tries to “put together” all of the findings.
Motivation & Example
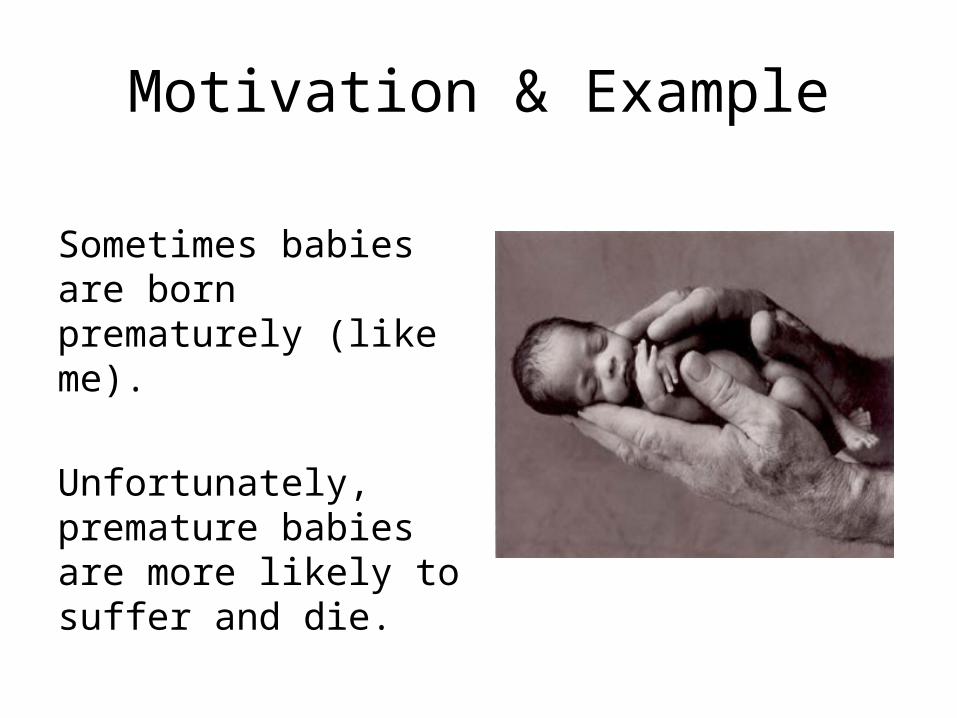
Sometimes babies are born prematurely (like me).
Unfortunately, premature babies are more likely to suffer and die.
Steroids
In New Zealand, doctors had the idea that giving steroids to premature babies might improve their chances of survival. They did seven separate studies over nine years. Two studies showed some benefit, but five of the studies were unable to reject the null hypothesis, that steroids did not help. As a result, doctors stopped using the treatment.

Blobbogram

Blobbogram
A blobbogram is a summary of a bunch of studies. Each study is represented by a line, so you can see the seven studies that were conducted on steroids in the previous slide. The line down the middle is the “no effect” line: if an study line crosses it, then that study can’t rule out the null hypothesis, that steroids are no better than placebo treatment.

Blobbogram
Lines to the left represent positive findings. Since two studies showed positive effects, we can see two lines that are completely to the left of the “no effect” line. The length of a study’s line represents its confidence: longer lines are more uncertain. Even though 5 studies touch the “no effect” line, there seems to be a trend here: the lines tend to be to the left, positive side.
Meta-Analysis
A meta-analysis is a way of “summing up” all the information contained in different studies of the same thing.
The blue diamond to the left of the “no effect” line represents the combined meaning of all the studies: steroids work to save the lives of premature babies.
Large Effect Size
In fact, the effect size is a reduction in the risk of death between 30% and 50%.Here’s what this means in human terms. In the US, 4 million children are born each year. 12% or about half a million of them are premature. There are about 5,000 neonatal deaths (in the first month of life) due to premature birth and complications associated with it.
Probabilities
So the likelihood that a premature baby (in the US) will die is around 5,000 in 500,000 or 1 in 100 or 1%.
This of course is right now, after we learned to use steroids. So that 1% figure is a 30% to 50% reduction of the earlier figure, which should be 1.4% to 2%.
The Human Cost
That’s up to twice as many deaths. Between 2,150 and 5,000 babies per year died– in the US alone– because they weren’t given life-saving treatment.This happened for eight years after we had all the information to know that the treatment worked. No one had put that information together in a meta-analysis.
Meta-Analysis
Now I hope it’s clear why these things are important. Ben Goldacre called the idea of meta-analyses an idea “that has saved the lives of more people than you will ever meet.” And it’s true!
But what exactly is a meta-analysis and how does it work?
Literature Review
The literature review is usually a search of databases containing abstracts of all the published literature or registered trials, like PubMed, Embase, or Web of Science. Researchers look for studies that have been conducted on certain topics like “breast cancer” and “wine”. This is the stage at which a meta-analysis can go really wrong for two reasons: cherry picking and the file drawer problem
Cherry Picking
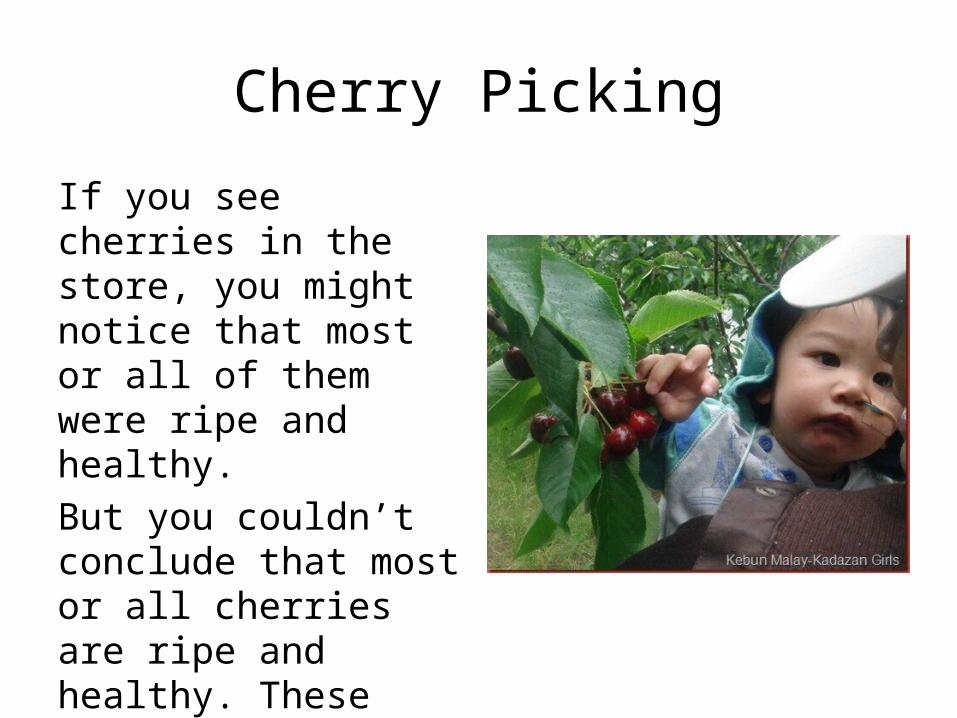
If you see cherries in the store, you might notice that most or all of them were ripe and healthy.But you couldn’t conclude that most or all cherries are ripe and healthy. These ones have been selectively picked for good condition.
Cherry Picking
Cherry picking is another name for “the fallacy of incomplete evidence,” and it’s related to confirmation bias and selection bias.
If I want to prove that a treatment works and I pick only those studies that are positive and ignore lots and lots of negative studies, then I’m “cherry picking” my studies.
“Systematic Review”
In the “bad old days” (before the 1980s) review articles were unsystematic, meaning that people writing the reviews included some studies that were relevant, but not all. This resulted in cherry picking: later it was shown that systematic meta-analyses often had the opposite conclusions of unsystematic reviews. A systematic review looks at all the relevant studies, not just some.
The File Drawer Problem
A second and more difficult problem for literature reviews is that the published literature is a biased sample of all the studies that have been done. As we saw last time, there is publication bias against negative results: people tend to publish positive findings, but to leave negative findings unpublished, sitting in the “file drawers” of their offices (metaphorically).
Detecting Publication Bias
One clever way to detect whether publication bias is operative is to make a funnel plot.
A funnel plot is a graph where the x-axis is the effect we’re looking for (number of premature deaths, for example) and the y-axis is how good the study is: how many people are in it, what the “variance” is, that sort of thing.
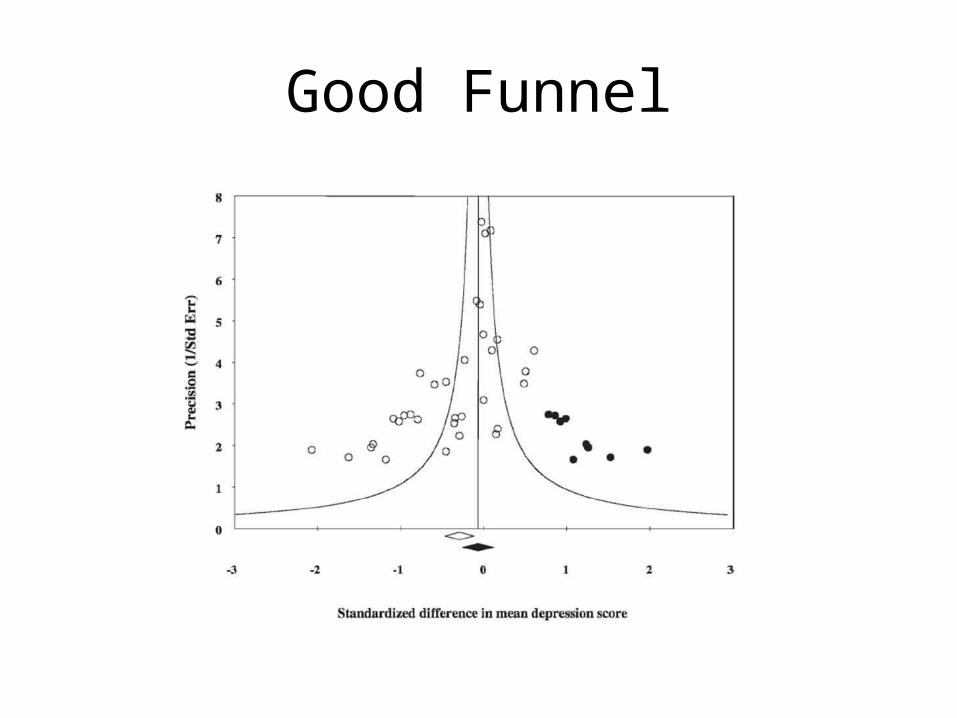
Good Funnel
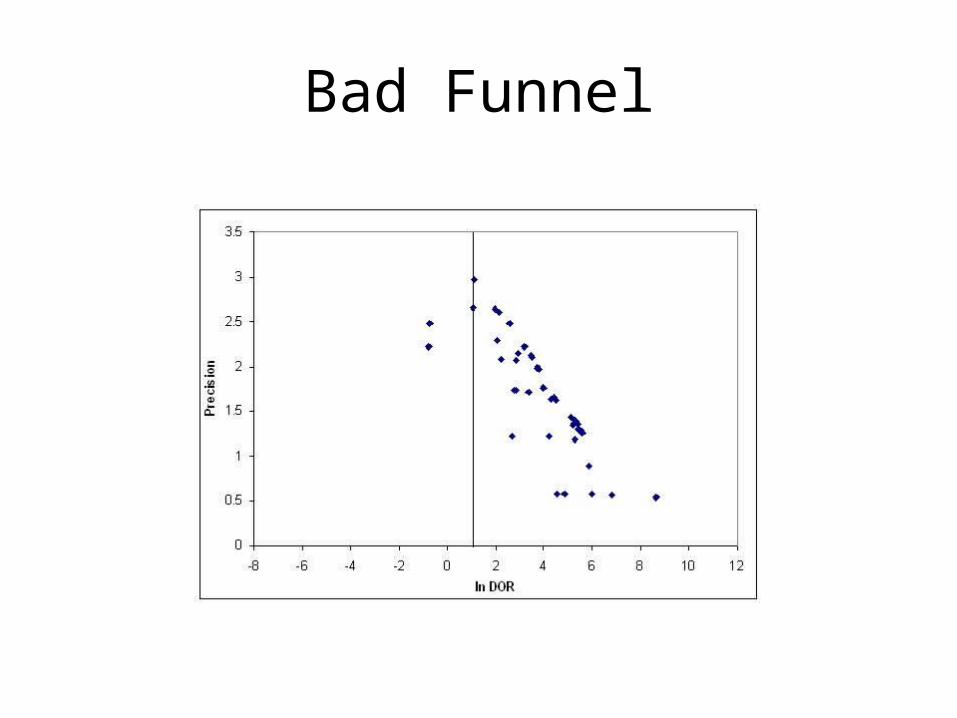
Bad Funnel
Inverted V
We always expect the best studies (at the top) to be closest to the actual effect, and the lower-quality studies to be further away from the actual effect– randomly to the left or right of it.
If there’s no publication bias, we get an “inverted V” shape: lower quality studies move further away from the actual effect in both directions.
Publication Bias
If there is publication bias, however, we get only half of an inverted V. The lower quality studies that had negative outcomes weren’t published, so there is no “left half” of the V, only a “right half.Not a lot can be done when there is serious publication bias. This is something we have to do before hand.
Trial Registration
One common idea is that we require every trial that is conducted to be registered before it is conducted. In the registration, it describes the methods, what the researchers are trying to find, and how they intend to measure those effects. If it isn’t registered, it can’t be published when it is completed, and if it’s registered but not published, we can always ask the researchers for their data afterward.
Quality
There is a balance that we want to maintain, however. While it’s good to include more studies in your meta-analysis, it’s bad to include low quality studies, especially since the effects of publication bias are stronger with low quality studies. In addition, low quality studies are subject to other biases as well (that’s why they’re “low quality”) so including them biases our results.
Selection Criteria
The way to maintain this balance is to state in advance the “selection criteria”– the features an experiment must have to be included in the analysis. For example, we might only want studies with control groups, where the control is a placebo and not “no treatment”, and the participants have randomly been assigned to the groups.
Cherry Picking?
Sometimes people with vested interests will argue that selection criteria amount to cherry picking. Studies of bad medicine often don’t have adequate randomization procedures or aren’t placebo controlled (or the placebo is not comparable to the “real” treatment– as when sugar pills are compared to acupuncture).
GMOs
For instance, one meta-analysis showed that GMOs (genetically modified organisms) had the same nutritional value as organic produce. People who are against GMOs argued that the analysis was cherry picked because it only included RCTs and not observational studies.That’s the point! Observational studies are full of biases that RCTs don’t have.
Measuring Quality
Even among the studies that get included, there will be differences in quality. We can measure the quality of the experiments, and report several figures:
What does the meta-analysis say if only the best studies are included? What does it say if all the studies that meet the criteria are included?
Jadad Scores
1. Do the researchers say that the study is randomized? Yes: 1 point, No: 0 points.If yes, was the method described and is it appropriate? Yes: 1 point, No: -1 point.2. Do they say it’s double-blind? Y: +1, N: 0.If yes, described and appropriate? Y: +1, N: -1.3. Did it describe the people who dropped out of the study? Y: +1, N: 0.
The Analysis
Finally, it’s time for the analysis. This involves complicated statistics that aren’t really important for us.
The basic idea is that you take all the results from all the studies and “weight” them according to some measure of the power of the study to detect effects (number of people, e.g.)
“Voting” on the Truth
The idea is that all of the experiments in the literature are going to “vote” on what the truth is. An experiment gets more “votes” if it’s more likely to “know” the truth, and less votes if it’s more likely to be “guessing”. We then use lots of complicated statistics to determine how close the “vote” is likely to get to the truth. If the “vote” is positive, and very likely to be true, then we conclude that there really is a positive effect.
Example Conclusion
This is taken from a meta-analysis of acupuncture literature for pain:“A small analgesic effect of acupuncture was found, which seems to lack clinical relevance and cannot be clearly distinguished from bias. Whether needling at acupuncture points, or at any site, reduces pain independently of the psychological impact of the treatment ritual is unclear.”
Cherry Picking
Sometimes there are lots of meta-analyses on the same topic. Different meta-analyses can make different choices: some might include unpublished data, they might have different selection criteria, and they might use different statistical methods. But we must remember not to cherry pick our meta-analyses! We can’t say “this one says acupuncture doesn’t work” when other ones say “it does” or vice versa.

SUMMARY
Meta-Analysis
Today we learned that lots of inconclusive information can be turned into conclusive knowledge by putting it together in a meta-analysis.
This can save lives– and it has saved lives, more people than you will ever meet in your life!
Methods
We looked at the methods of meta-analysis and saw some ways that they can go wrong. Sometimes this should lead us to reject the result (if the meta-analysis is not systematic, then it is biased) and sometimes it should lead us to be careful in interpreting the result (if there’s publication bias, the results of the meta-analysis are less certain).
Cherry Picking
Importantly, we talked A LOT about cherry picking. The whole goal of science is to remove bias. The reason why we randomize, why we control, why we double blind experiments– is to remove biases. If we then cherry pick our experiments in our meta-analysis or cherry pick which meta-analysis we believe, we have just undone all of our efforts and stuck the bias right back in!


![Roulette Physics1].pdf · Roulette Physics c J.-I. Eichberger rouletteball@gmx.de September 19, 2004 Abstract The motion of a roulette ball on the rim of a tilted roulette wheel is](https://img.pdfslide.us/doc/110x75/5e060897f027f27a382073d5/roulette-1pdf-roulette-physics-c-j-i-eichberger-rouletteballgmxde-september.jpg)