Embed Size (px)
Citation preview

Meta-analysis 1
Critical review of epi studies and presentation of study findings
Lydia B. Zablotska, MD, PhDAssociate ProfessorDepartment of Epidemiology and Biostatistics
With thanks to Dr. M. Pai, McGill University
Meta-analysis 2
Learning objectives
Public health implications of epi research findings Synthesis of findings across studies (pooled and
meta-analyses) Exploration of heterogeneity of published studies Presentation of results of meta-analyses Generalizability of findings
– Reporting bias
Meta-analysis 3
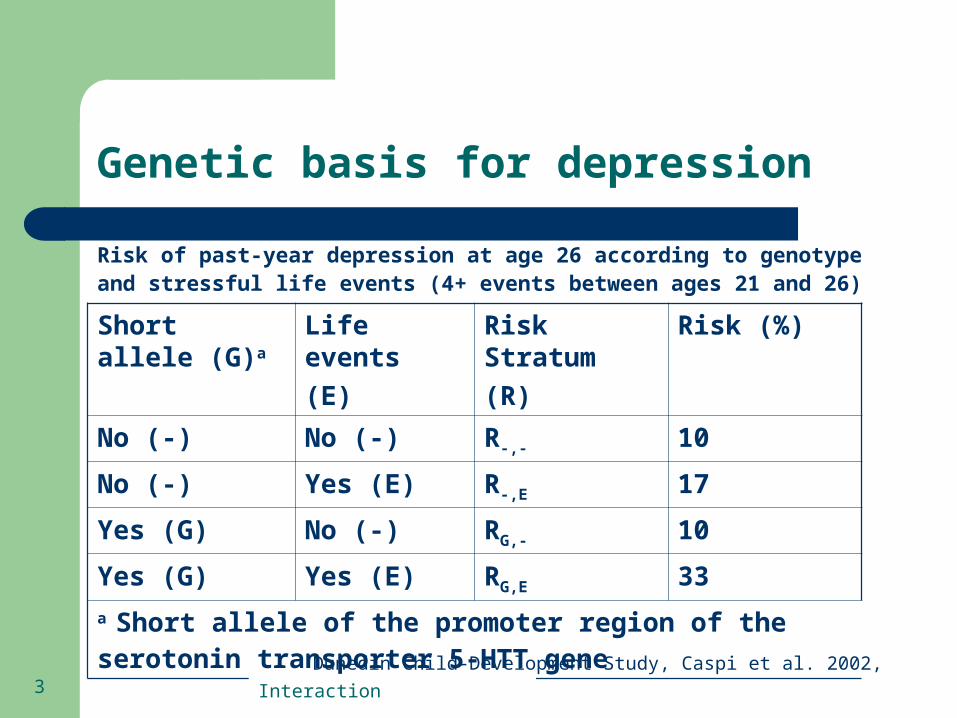
Genetic basis for depression
Risk of past-year depression at age 26 according to genotype and stressful life events (4+ events between ages 21 and 26)
Short allele (G)a
Life events
(E)
Risk Stratum
(R)
Risk (%)
No (-) No (-) R-,- 10
No (-) Yes (E) R-,E 17
Yes (G) No (-) RG,- 10
Yes (G) Yes (E) RG,E 33
a Short allele of the promoter region of the serotonin
transporter 5-HTT geneDunedin Child-Development Study, Caspi et al. 2002, 2003
Interaction
Meta-analysis 4
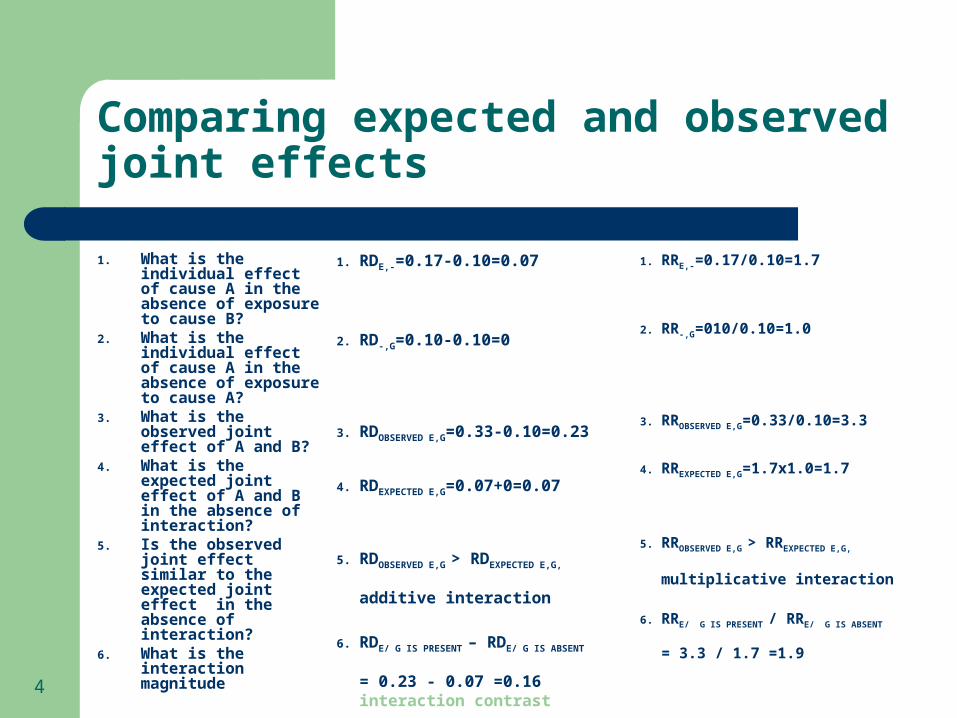
Comparing expected and observed joint effects
1. What is the individual effect of cause A in the absence of exposure to cause B?
2. What is the individual effect of cause A in the absence of exposure to cause A?
3. What is the observed joint effect of A and B?
4. What is the expected joint effect of A and B in the absence of interaction?
5. Is the observed joint effect similar to the expected joint effect in the absence of interaction?
6. What is the interaction magnitude
1. RDE,-=0.17-0.10=0.07
2. RD-,G=0.10-0.10=0
3. RDOBSERVED E,G=0.33-0.10=0.23
4. RDEXPECTED E,G=0.07+0=0.07
5. RDOBSERVED E,G > RDEXPECTED E,G,
additive interaction
6. RDE/ G IS PRESENT – RDE/ G IS ABSENT
= 0.23 - 0.07 =0.16interaction contrast
1. RRE,-=0.17/0.10=1.7
2. RR-,G=010/0.10=1.0
3. RROBSERVED E,G=0.33/0.10=3.3
4. RREXPECTED E,G=1.7x1.0=1.7
5. RROBSERVED E,G > RREXPECTED E,G,
multiplicative interaction
6. RRE/ G IS PRESENT / RRE/ G IS ABSENT
= 3.3 / 1.7 =1.9

Meta-analysis 5
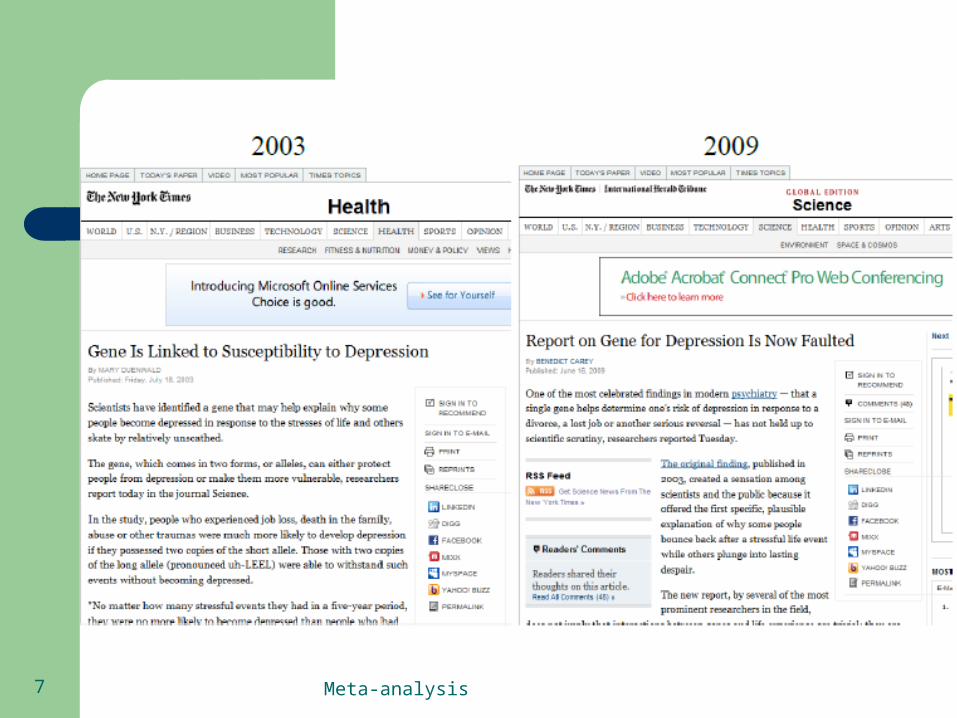
“…It is critical that health practitioners and scientists in other disciplines recognize the importance of replication of such findings before they can serve as valid indicators of disease risk or have utility for translation into clinical and public health practice.”
Meta-analysis 6
Meta-analysis 7
Meta-analysis 8
“The epicenter of translational science”
“The new challenge for epidemiology is the integration of knowledge and effective interventions into various societal settings working with allied disciplines not necessarily in the biomedical domain to ensure that these interventions have their intended effects on individual and public health.”
Hiatt RA. Am. J. Epidemiol. 2010;172:528-529

Meta-analysis
Epidemiology and the phases of translational research
Khoury M J et al. Am. J. Epidemiol. 2010;172:517-524
T0, scientific discovery research;
T1, translational research from discovery to candidate application;
T2, translational research from candidate application to evidence-based recommendation or policy;
T3, translational research from recommendation to practice and control programs;
T4, translational research from practice to population health impact.

Meta-analysis 10
KNOWLEDGE SYNTHESIS: AN ENGINE FOR TRANSLATIONAL EPIDEMIOLOGY
Knowledge synthesis is a systematic approach to reviewing the evidence on what we know and what we do not know, and how we know it.
Knowledge synthesis methods, such as meta-analysis, are becoming standard in developing evidence-based recommendations for practice (T2 research).
The Cochrane Collaboration Other independent groups, such as the US Preventive
Services Task Force
The Emergence of Translational Epidemiology: From Scientific Discovery to Population Health Impact. Khoury M J et al. Am. J. Epidemiol. 2010;172:517-524

Meta-analysis 11
Examples of knowledge synthesis
In human genomics (stage T1) - Human Genome Epidemiology Network (HuGENet, 1998) synthesizes information on gene-disease associations through human genome epidemiology (HuGE) reviews and meta-analyses
Publications reporting a discovery from genome-wide association studies are encouraged to include a meta-analysis of replication data sets
Candidate applications for clinical and public health practice (stage T2) - Evaluation of Genomic Applications in Practice and Prevention (EGAPP by CDC). An independent EGAPP Working Group selects topics, oversees systematic reviews of evidence, and makes evidence-based recommendations.
Khoury M J et al. Am. J. Epidemiol. 2010;172:517-524
Meta-analysis 12
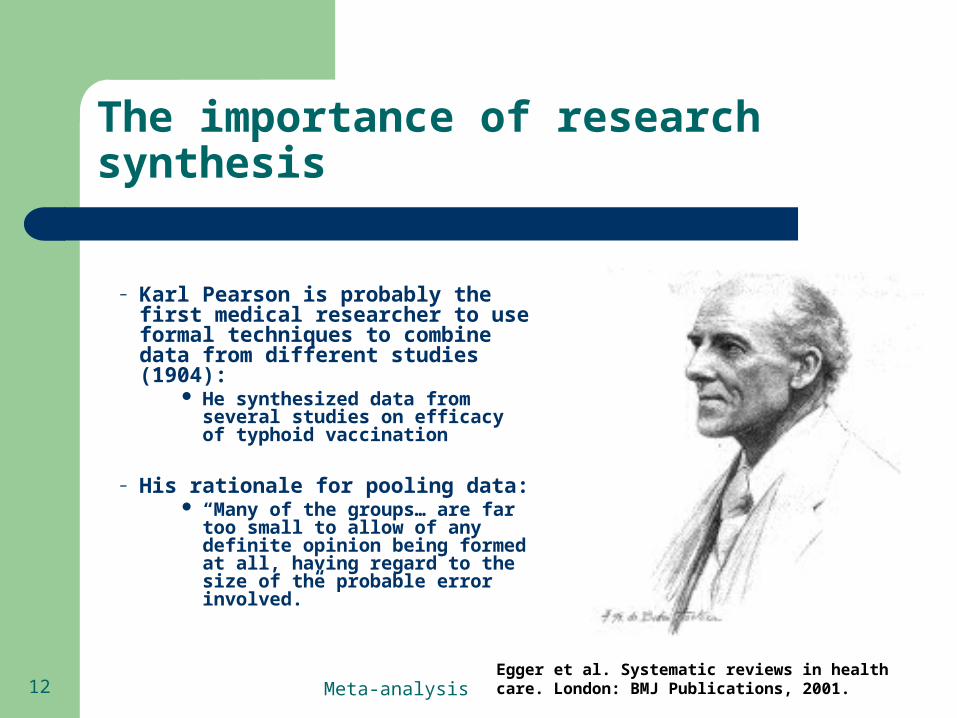
The importance of research synthesis
– Karl Pearson is probably the first medical researcher to use formal techniques to combine data from different studies (1904):
He synthesized data from several studies on efficacy of typhoid vaccination
– His rationale for pooling data: “Many of the groups… are far
too small to allow of any definite opinion being formed at all, having regard to the size of the probable error involved.”
Egger et al. Systematic reviews in health care. London: BMJ Publications, 2001.

Meta-analysis 13
The importance of research synthesis
The Cochrane Collaboration is named in honor of Archibald Cochrane, a British researcher.
– "It is surely a great criticism of our profession that we have not organized a critical summary, by specialty or subspecialty, adapted periodically, of all relevant randomized controlled trials.”

Meta-analysis 14
The Cochrane collaboration
Cochrane’s challenge led to the establishment during the 1980s of an international collaboration to develop the Oxford Database of Perinatal Trials.
His encouragement, and the endorsement of his views by others, led to the opening of the first Cochrane centre (in Oxford, UK) in 1992 and the founding of The Cochrane Collaboration in 1993.
An international not-for-profit and independent organization produces and disseminates systematic reviews of health-care interventions and promotes the search for evidence in the form of clinical trials and other studies of interventions.
Meta-analysis 15
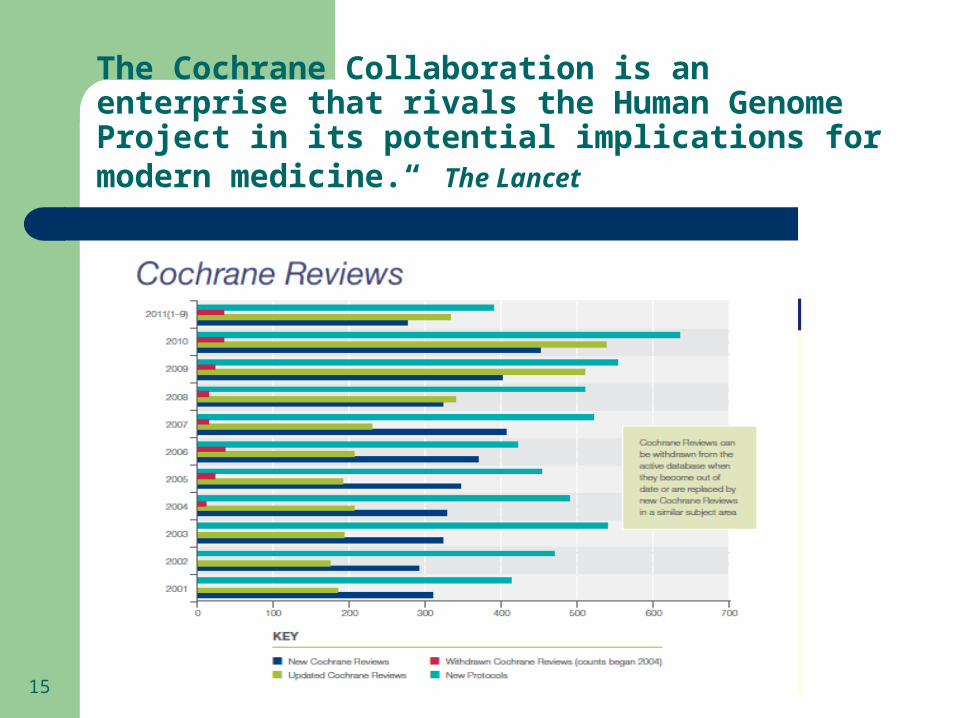
The Cochrane Collaboration is an enterprise that rivals the Human Genome Project in its potential implications for modern medicine.“ The Lancet

Meta-analysis 16
2010
6.186
345
271
233
99
749
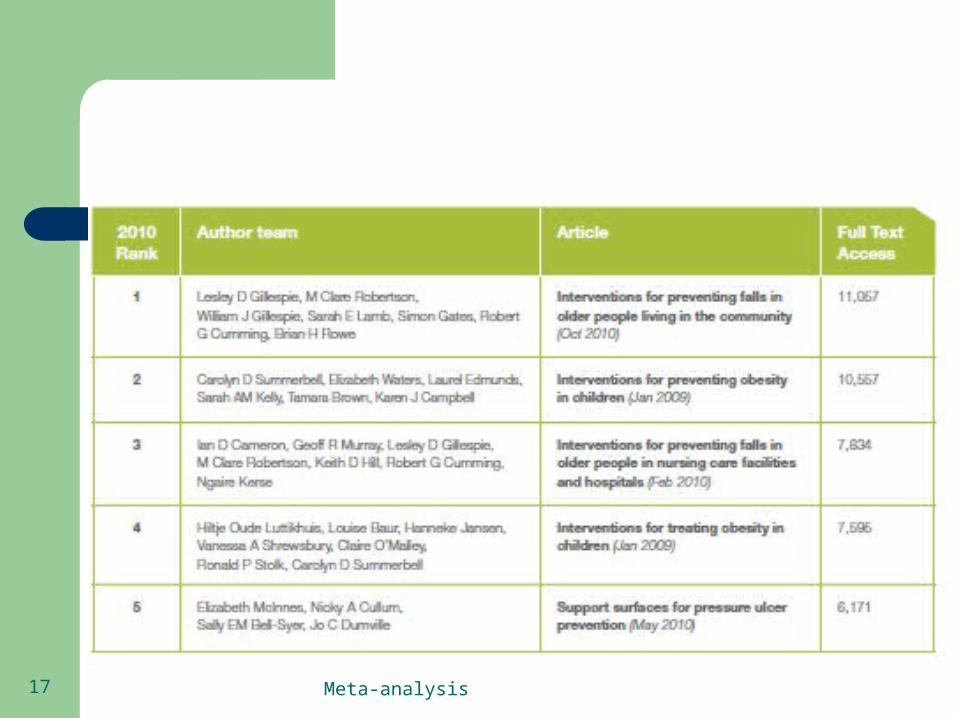
Meta-analysis 17

Meta-analysis 18

Meta-analysis 19
Meta-analyses and systematic reviews indexed in PubMed, 1990-2011
338 440 540 554 696 819 8841,202
1,3081,5552,0332,250
2,5612,955
3,526
4,457
5,257
6,295
7,157
8,491
9,751
11,994
0
2,000
4,000
6,000
8,000
10,000
12,000
1990199119921993199419951996199719981999200020012002200320042005200620072008200920102011
Search terms: meta-analysis[MeSH] OR meta-analysis[tw] OR systematic review[tw]

Meta-analysis 20
Meta-analyses and systematic reviews indexed in PubMed, by language
3161,819
9,313
22 214 438
0
1,000
2,000
3,000
4,000
5,000
6,000
7,000
8,000
9,000
10,000
1990 2000 2010
Search terms: meta-analysis[MeSH] OR meta-analysis[tw] OR systematic review[tw]
Foregin languages
English language
Meta-analysis 21
Are these the same or different?
Traditional, narrative review Systematic review Overview Meta-analysis Pooled analysis
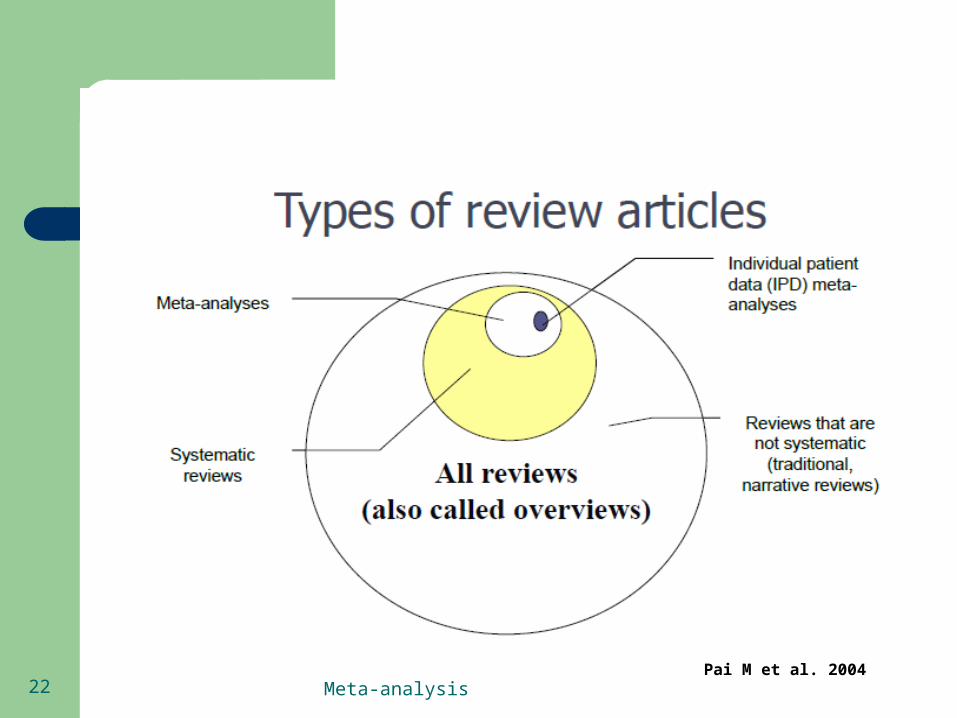
Meta-analysis 22Pai M et al. 2004
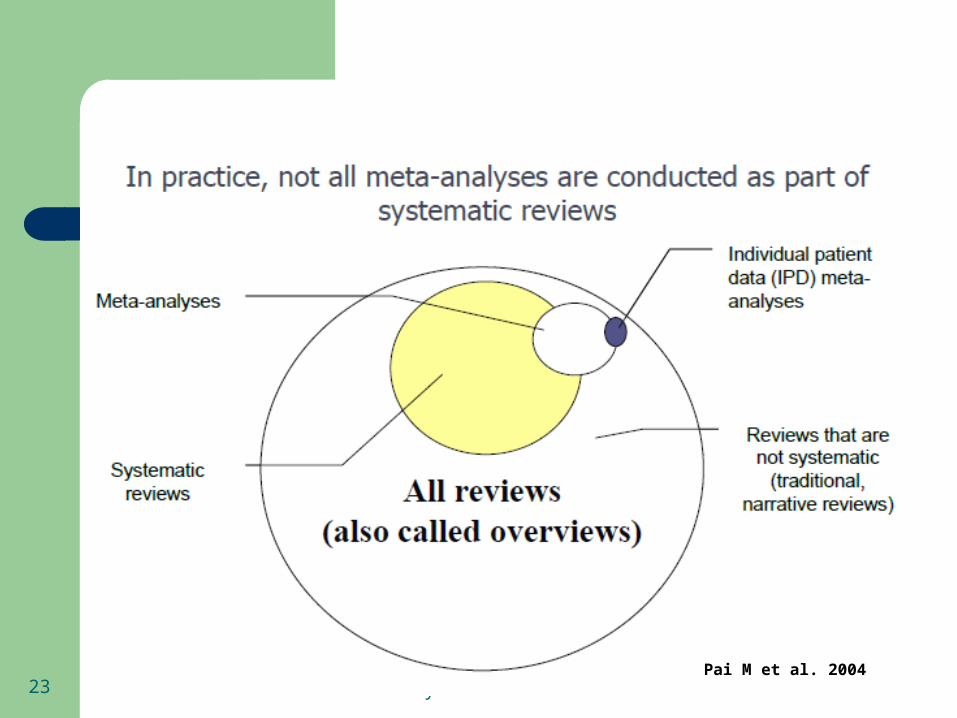
Meta-analysis 23Pai M et al. 2004
Meta-analysis 24
Definitions
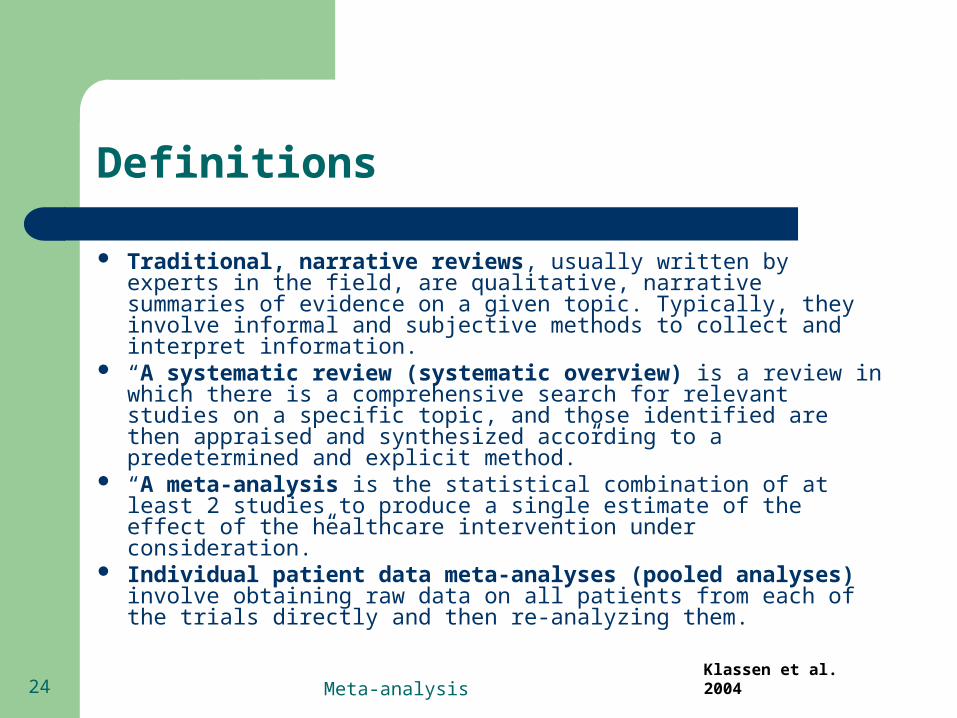
Traditional, narrative reviews, usually written by experts in the field, are qualitative, narrative summaries of evidence on a given topic. Typically, they involve informal and subjective methods to collect and interpret information.
“A systematic review (systematic overview) is a review in which there is a comprehensive search for relevant studies on a specific topic, and those identified are then appraised and synthesized according to a predetermined and explicit method.”
“A meta-analysis is the statistical combination of at least 2 studies to produce a single estimate of the effect of the healthcare intervention under consideration.”
Individual patient data meta-analyses (pooled analyses) involve obtaining raw data on all patients from each of the trials directly and then re-analyzing them.
Klassen et al. 2004

Meta-analysis 25
Definitions
Traditional, narrative reviews, usually written by experts in the field, are qualitative, narrative summaries of evidence on a given topic. Typically, they involve informal and subjective methods to collect and interpret information.
“A systematic review (systematic overview) is a review in which there is a comprehensive search for relevant studies on a specific topic, and those identified are then appraised and synthesized according to a predetermined and explicit method.”
“A meta-analysis is the statistical combination of at least 2 studies to produce a single estimate of the effect of the healthcare intervention under consideration.”
Individual patient data meta-analyses (pooled analyses) involve obtaining raw data on all patients from each of the trials directly and then re-analyzing them.
Type I – qualitative summary (narrative review article)
Type II – quantitative summary of published studies (usually called ‘meta-analysis’)
Type III – re-analysis of individual data, meta-analysis (usually called ‘pooled analysis’ in epidemiology)
Type IV – prospectively planned pooled analysis, where pooling is already plan of the protocol (data collection, definitions of variables, questions and hypotheses are standardized across studies)
Blettner et al. 1999Klassen et al. 2004
Meta-analysis 26
What is a systematic review?
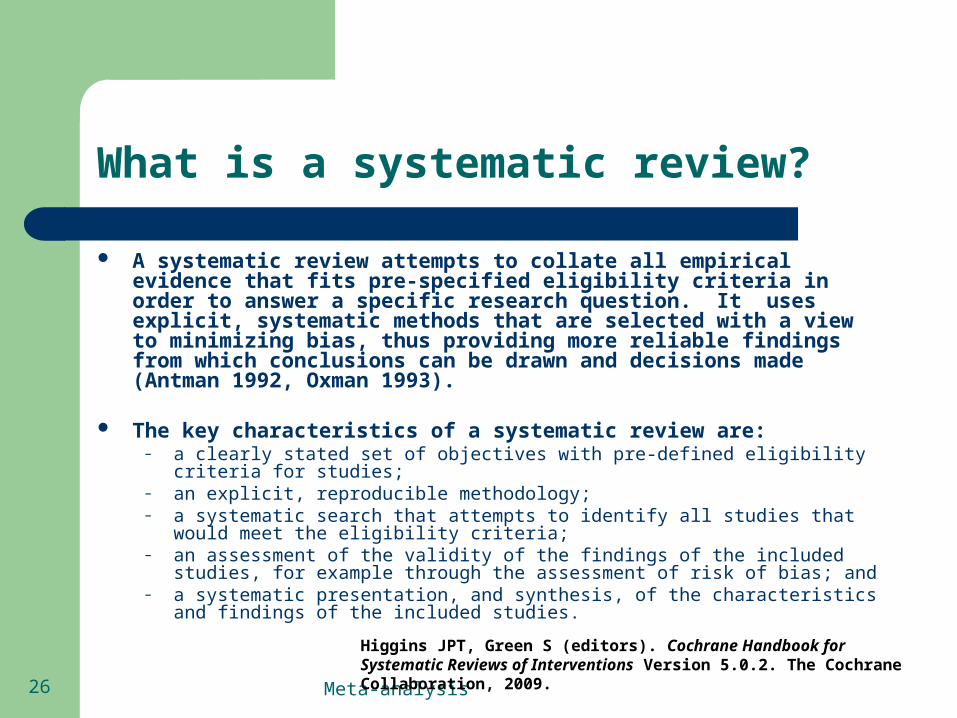
A systematic review attempts to collate all empirical evidence that fits pre-specified eligibility criteria in order to answer a specific research question. It uses explicit, systematic methods that are selected with a view to minimizing bias, thus providing more reliable findings from which conclusions can be drawn and decisions made (Antman 1992, Oxman 1993).
The key characteristics of a systematic review are:– a clearly stated set of objectives with pre-defined eligibility criteria for studies;– an explicit, reproducible methodology;– a systematic search that attempts to identify all studies that would meet the eligibility
criteria;– an assessment of the validity of the findings of the included studies, for example
through the assessment of risk of bias; and– a systematic presentation, and synthesis, of the characteristics and findings of the
included studies.
Higgins JPT, Green S (editors). Cochrane Handbook for Systematic Reviews of Interventions Version 5.0.2. The Cochrane Collaboration, 2009.
Meta-analysis 27
All systematic reviews are not systematic!
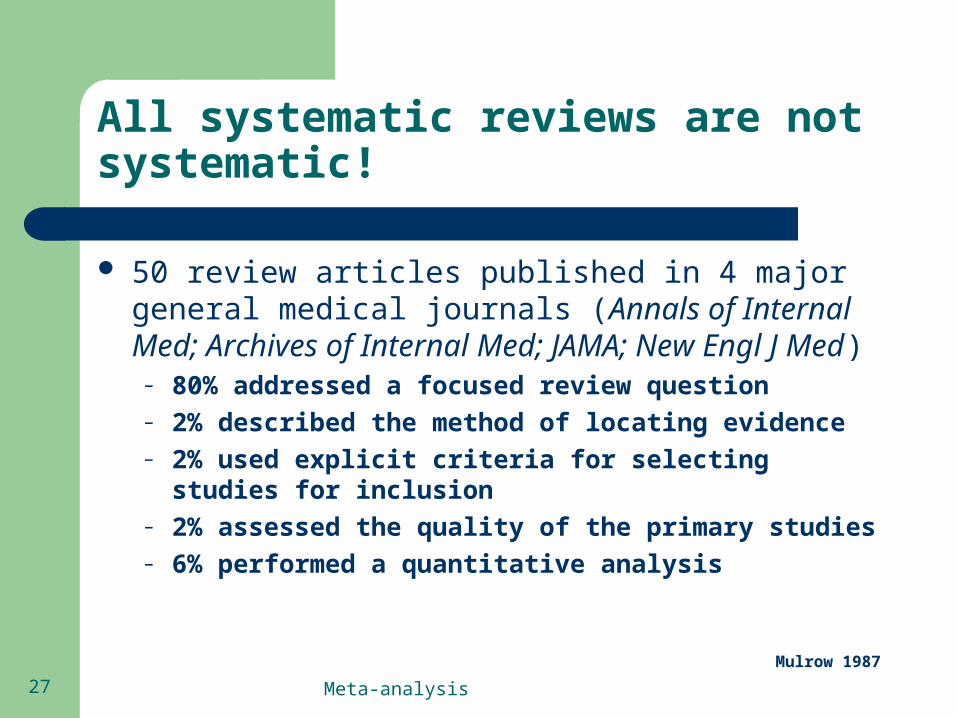
50 review articles published in 4 major general medical journals (Annals of Internal Med; Archives of Internal Med; JAMA; New Engl J Med)
– 80% addressed a focused review question– 2% described the method of locating evidence– 2% used explicit criteria for selecting studies for
inclusion– 2% assessed the quality of the primary studies– 6% performed a quantitative analysis
Mulrow 1987

Meta-analysis 28
All systematic reviews are not systematic!
50 review articles published in 4 major general medical journals (Annals of Internal Med; Archives of Internal Med; JAMA; New Engl J Med)
– 80% addressed a focused review question– 2% described the method of locating evidence– 2% used explicit criteria for selecting studies for inclusion– 2% assessed the quality of the primary studies– 6% performed a quantitative analysis
158 reviews published in 6 major general medical journals (Annals of Internal Med; JAMA; New Engl J Med; BMJ; Am J Med; J of Int Med)
– 34% addressed a focused review question– 28% described the method of locating evidence– 14% used explicit criteria for selecting studies for inclusion– 9% assessed the quality of the primary studies– 21% performed a quantitative analysis
Mulrow 1987
McAlister et al. 1999

Meta-analysis 29
All systematic reviews are not systematic!
What makes reviews systematic? Careful description of retrieval methodologies Assessment of consistency of findings across studies
(plots) Assessment for publication and other reporting biases
(assessment of heterogeneity)

Meta-analysis 30
Narrative vs. Systematic Reviews
Pai M et al. 2004

Meta-analysis 31
Meta-analysis
Meta-analysis is the use of statistical methods to summarize the results of independent studies (Glass 1976)
Originally intended for experimental studies only Meta-analyses of observational studies present
particular challenges because of inherent biases and differences in study designs (Stroup et al. 2008)

Meta-analysis 32
All systematic reviews are not meta-analyses
– Many systematic reviews contain meta-analyses. – “…it is always appropriate and desirable to
systematically review a body of data, but it may sometimes be inappropriate, or even misleading, to statistically pool results from separate studies. Indeed, it is our impression that reviewers often find it hard to resist the temptation of combining studies even when such meta-analysis is questionable or clearly inappropriate.”
Egger et al. 2001
Meta-analysis 33
Pooled analysis
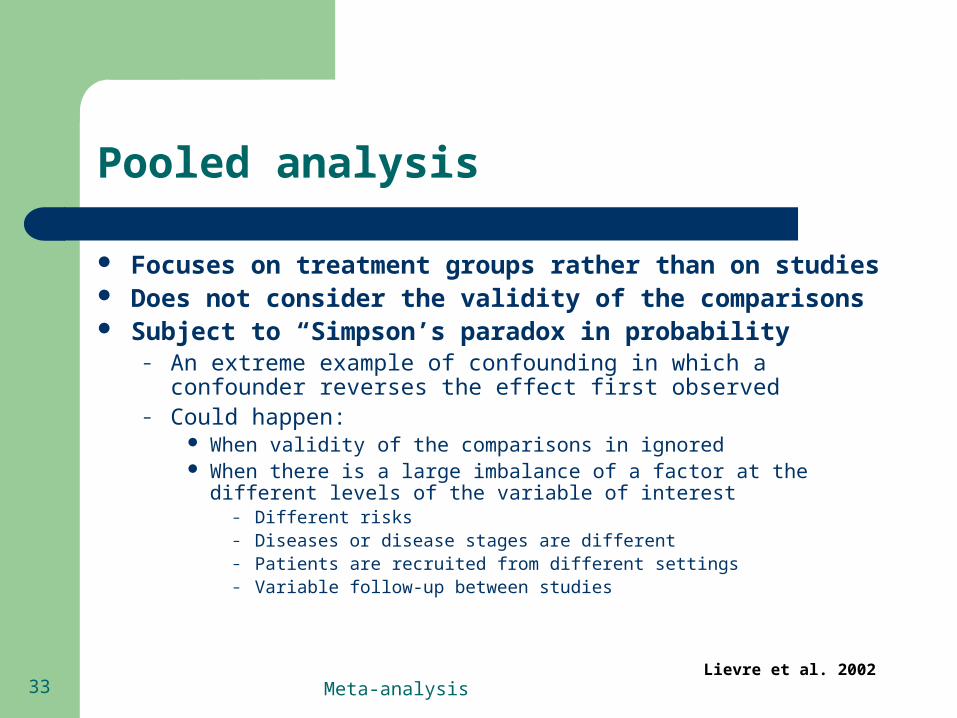
Focuses on treatment groups rather than on studies Does not consider the validity of the comparisons Subject to “Simpson’s paradox in probability
– An extreme example of confounding in which a confounder reverses the effect first observed
– Could happen: When validity of the comparisons in ignored When there is a large imbalance of a factor at the different levels of the
variable of interest– Different risks– Diseases or disease stages are different– Patients are recruited from different settings– Variable follow-up between studies
Lievre et al. 2002

Meta-analysis 34Lievre et al. 2002
A new drug is compared to a placebo in 4 relatively small trials in patients at high risk for a certain adverse even and to an active reference drug in 2 larger trials of patients at low risk for the event
45/3,460 19/1,460 5/2,000
45/3,460 / 5/2,000 = 0.0130 / 0.0025 = 5.20
meta-analysis was performed using the logarithmic mean of the relative risk weighted by the inverse of its variance
Meta-analysis 35
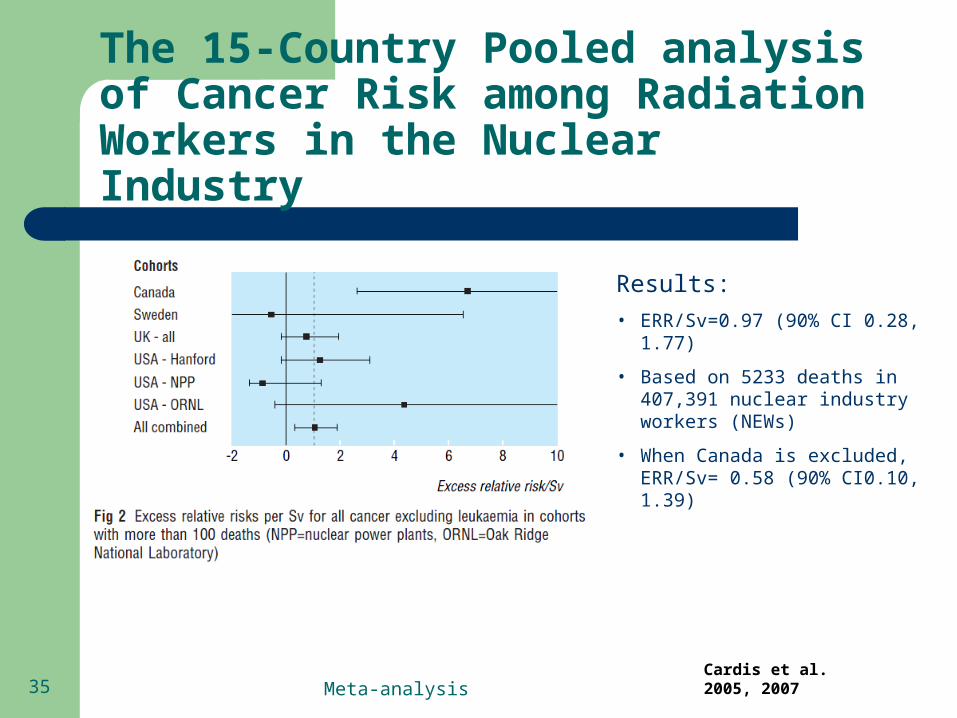
The 15-Country Pooled analysis of Cancer Risk among Radiation Workers in the Nuclear Industry
Cardis et al. 2005, 2007
Results:
• ERR/Sv=0.97 (90% CI 0.28, 1.77)
• Based on 5233 deaths in 407,391 nuclear industry workers (NEWs)
• When Canada is excluded, ERR/Sv= 0.58 (90% CI0.10, 1.39)
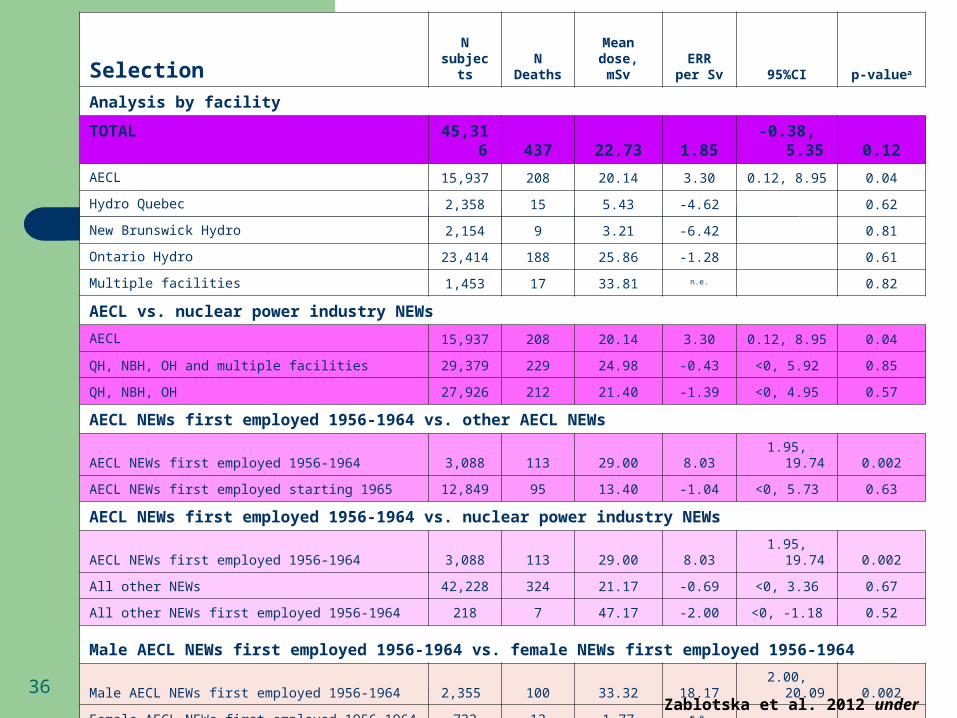
Meta-analysis 36
SelectionN
subjects N DeathsMean dose,
mSvERR per
Sv 95%CI p-valuea
Analysis by facility
TOTAL 45,316 437 22.73 1.85 -0.38, 5.35 0.12
AECL 15,937 208 20.14 3.30 0.12, 8.95 0.04
Hydro Quebec 2,358 15 5.43 -4.62 0.62
New Brunswick Hydro 2,154 9 3.21 -6.42 0.81
Ontario Hydro 23,414 188 25.86 -1.28 0.61
Multiple facilities 1,453 17 33.81 n.e. 0.82
AECL vs. nuclear power industry NEWs
AECL 15,937 208 20.14 3.30 0.12, 8.95 0.04
QH, NBH, OH and multiple facilities 29,379 229 24.98 -0.43 <0, 5.92 0.85
QH, NBH, OH 27,926 212 21.40 -1.39 <0, 4.95 0.57
AECL NEWs first employed 1956-1964 vs. other AECL NEWs
AECL NEWs first employed 1956-1964 3,088 113 29.00 8.03 1.95, 19.74 0.002
AECL NEWs first employed starting 1965 12,849 95 13.40 -1.04 <0, 5.73 0.63
AECL NEWs first employed 1956-1964 vs. nuclear power industry NEWs
AECL NEWs first employed 1956-1964 3,088 113 29.00 8.03 1.95, 19.74 0.002
All other NEWs 42,228 324 21.17 -0.69 <0, 3.36 0.67
All other NEWs first employed 1956-1964 218 7 47.17 -2.00 <0, -1.18 0.52
Male AECL NEWs first employed 1956-1964 vs. female NEWs first employed 1956-1964
Male AECL NEWs first employed 1956-1964 2,355 100 33.32 18.17 2.00, 20.09 0.002
Female AECL NEWs first employed 1956-1964 733 13 1.77 n.e.
Zablotska et al. 2012 under review

Meta-analysis 37
Potential pitfalls of systematic reviews and meta-analyses
When a meta-analysis is done outside of a systematic review
When poor quality studies are included or when quality issues are ignored
When small and inconclusive studies are included When inadequate attention is given to heterogeneity When reporting biases are a problem

Meta-analysis 38
Potential pitfalls of systematic reviews and meta-analyses
When a meta-analysis is done outside of a systematic review
When poor quality studies are included or when quality issues are ignored
When small and inconclusive studies are included When inadequate attention is given to heterogeneity When reporting biases are a problem

Meta-analysis 39
Assessment of heterogeneity of findings
Heterogeneity could be due to differences in:– Patient populations studied– Interventions used– Co-interventions– Outcomes measured– Study design features (eg. length of follow-up)– Study quality– Random error

Meta-analysis 40
Meta-analyses:How to look for heterogeneity
Are the results
of the studies fairly
similar (consistent)?
Yes No
What is the common,
summary effect?
How precise is
the common,
summary effect?
What factors can
explain dissimilarities
(heterogeneity)?
How should the results
be presented?
Meta-analysis 41
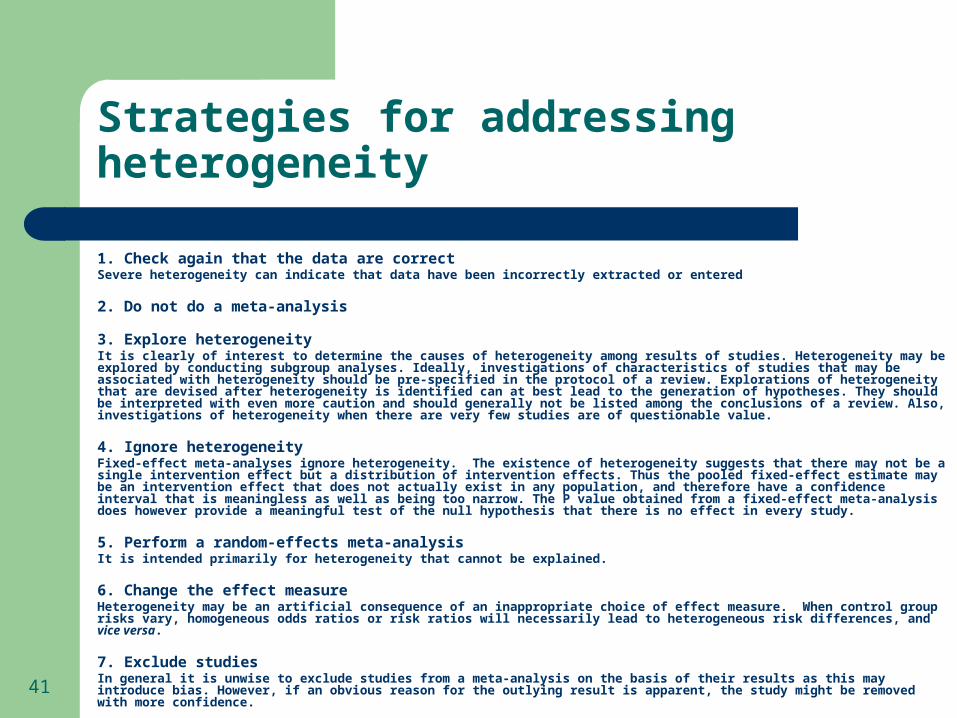
Strategies for addressing heterogeneity
1. Check again that the data are correctSevere heterogeneity can indicate that data have been incorrectly extracted or entered
2. Do not do a meta-analysis
3. Explore heterogeneityIt is clearly of interest to determine the causes of heterogeneity among results of studies. Heterogeneity may be explored by conducting subgroup analyses. Ideally, investigations of characteristics of studies that may be associated with heterogeneity should be pre-specified in the protocol of a review. Explorations of heterogeneity that are devised after heterogeneity is identified can at best lead to the generation of hypotheses. They should be interpreted with even more caution and should generally not be listed among the conclusions of a review. Also, investigations of heterogeneity when there are very few studies are of questionable value.
4. Ignore heterogeneityFixed-effect meta-analyses ignore heterogeneity. The existence of heterogeneity suggests that there may not be a single intervention effect but a distribution of intervention effects. Thus the pooled fixed-effect estimate may be an intervention effect that does not actually exist in any population, and therefore have a confidence interval that is meaningless as well as being too narrow. The P value obtained from a fixed-effect meta-analysis does however provide a meaningful test of the null hypothesis that there is no effect in every study.
5. Perform a random-effects meta-analysisIt is intended primarily for heterogeneity that cannot be explained.
6. Change the effect measureHeterogeneity may be an artificial consequence of an inappropriate choice of effect measure. When control group risks vary, homogeneous odds ratios or risk ratios will necessarily lead to heterogeneous risk differences, and vice versa.
7. Exclude studiesIn general it is unwise to exclude studies from a meta-analysis on the basis of their results as this may introduce bias. However, if an obvious reason for the outlying result is apparent, the study might be removed with more confidence.

Meta-analysis 42
Step 3: Exploring heterogeneity
Forest plots:– Do confidence intervals of studies overlap with each other
and the summary effect?– Present the point estimate and CI of each studies– Also present the overall, summary estimate– Allow visual appraisal of heterogeneity
Other graphs:– Cumulative meta-analysis– Sensitivity analysis– Funnel plot and trim-and-fill plot for publication bias– Galbraith, L’Abbe plots, etc.
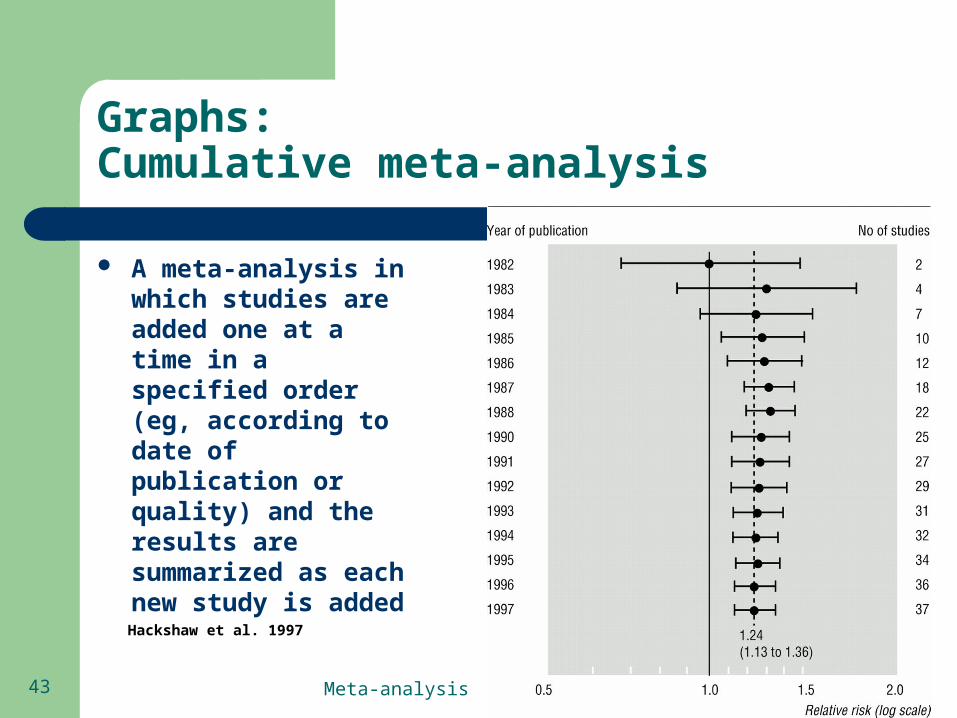
Meta-analysis 43
Graphs:Cumulative meta-analysis
A meta-analysis in which studies are added one at a time in a specified order (eg, according to date of publication or quality) and the results are summarized as each new study is added
Hackshaw et al. 1997

Meta-analysis 44 Fergusson et al. 2005

Meta-analysis 45
Graphs:Sensitivity analysis
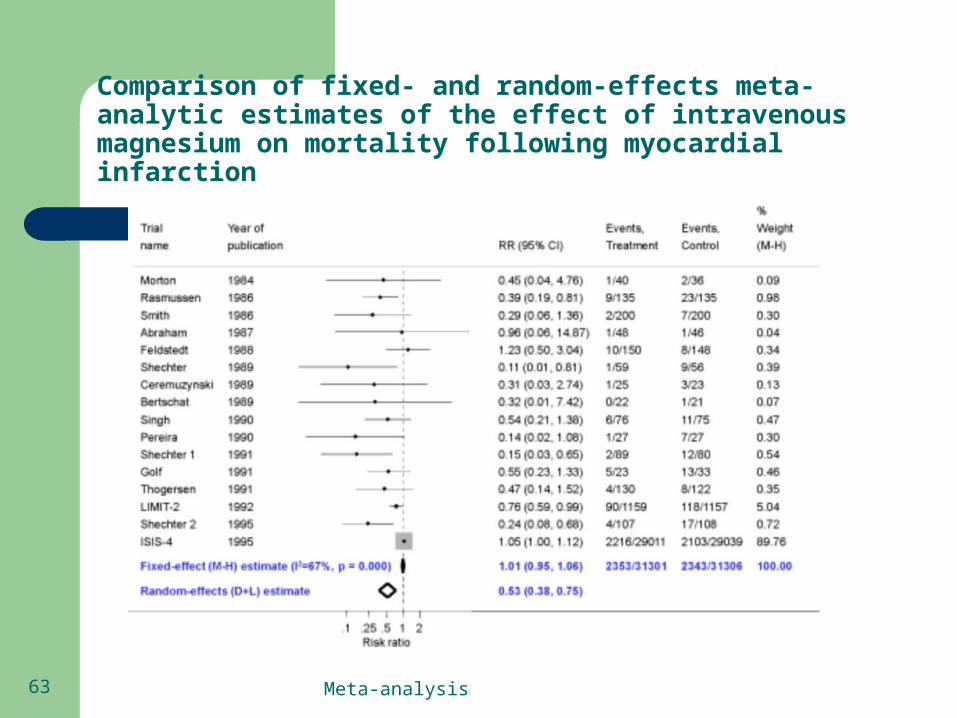
A meta-analysis in which studies are omitted one at a time in a specified order (eg, according to number of subjects or quality) and the results are summarized as each new study is omitted. IV magnesium for acute myocardial infarction
ISIS-4 trial (International Study of Infarct Survival and Magnesium in Coronaries) had >50,000 patients! It showed no survival benefit from the addition of magnesium

Meta-analysis 46
Graphs:Hypothetical funnel plots (search for asymmetry)
Panel A: symmetrical plot in the absence of bias.
Panel B: asymmetrical plot in the presence of reporting bias.
Panel C: asymmetrical plot in the presence of bias because some smaller studies (open circles) are of lower methodological quality and therefore produce exaggerated intervention effect estimates.
Meta-analysis 47
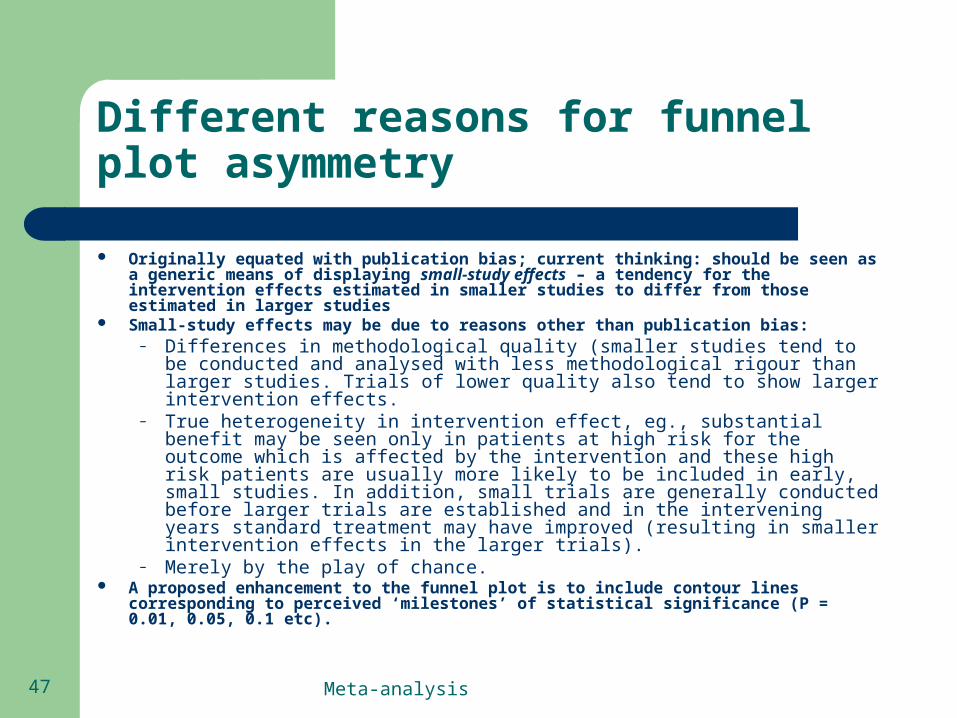
Different reasons for funnel plot asymmetry
Originally equated with publication bias; current thinking: should be seen as a generic means of displaying small-study effects – a tendency for the intervention effects estimated in smaller studies to differ from those estimated in larger studies
Small-study effects may be due to reasons other than publication bias:– Differences in methodological quality (smaller studies tend to be conducted
and analysed with less methodological rigour than larger studies. Trials of lower quality also tend to show larger intervention effects.
– True heterogeneity in intervention effect, eg., substantial benefit may be seen only in patients at high risk for the outcome which is affected by the intervention and these high risk patients are usually more likely to be included in early, small studies. In addition, small trials are generally conducted before larger trials are established and in the intervening years standard treatment may have improved (resulting in smaller intervention effects in the larger trials).
– Merely by the play of chance. A proposed enhancement to the funnel plot is to include contour lines
corresponding to perceived ‘milestones’ of statistical significance (P = 0.01, 0.05, 0.1 etc).

Meta-analysis 48
Possible sources of asymmetry in funnel plots
Egger et al. 1997
Meta-analysis 49
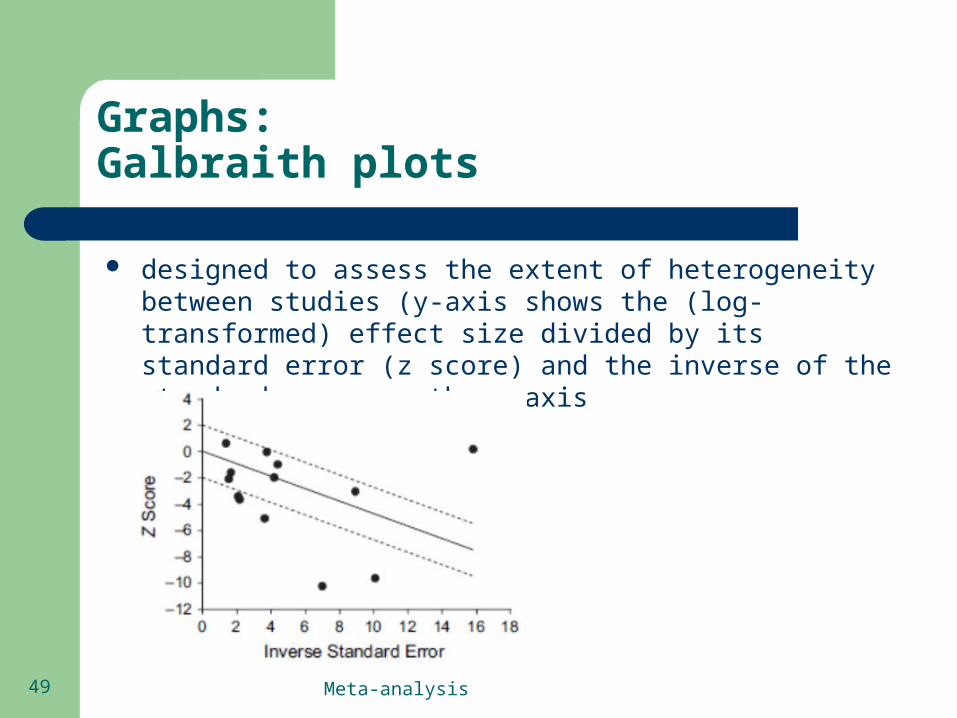
Graphs:Galbraith plots
designed to assess the extent of heterogeneity between studies (y-axis shows the (log-transformed) effect size divided by its standard error (z score) and the inverse of the standard error on the x-axis

Meta-analysis 50
Graphs:L’Abbe plots
– are the studies spread around a central diagonal line indicating identical risks in intervention and control groups?

Meta-analysis 51
Meta-analyses:How to look for heterogeneity
Statistical tests:– Chi-square test for heterogeneity (Cochran Q test)
Tests whether the individual effects are farther away from the common effect, beyond what is expected by chance
Has poor power P-value < 0.10 indicates significant heterogeneity
– I-squared (I2, Higgins et al 2002) % of total variability in effect measure that is attributable to
heterogeneity (i.e. not to chance) ranges between 0 and 100 Values of I-squared equal to 25%, 50%, and 75% representing low,
moderate, and high heterogeneity, respectively.
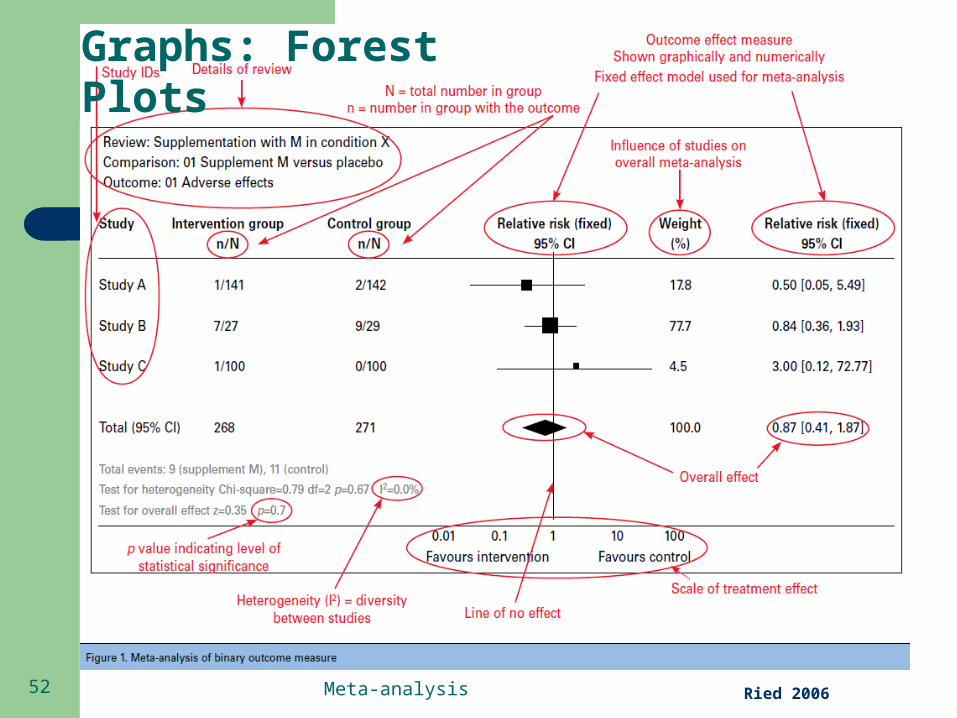
Meta-analysis 52 Ried 2006
Graphs: Forest Plots
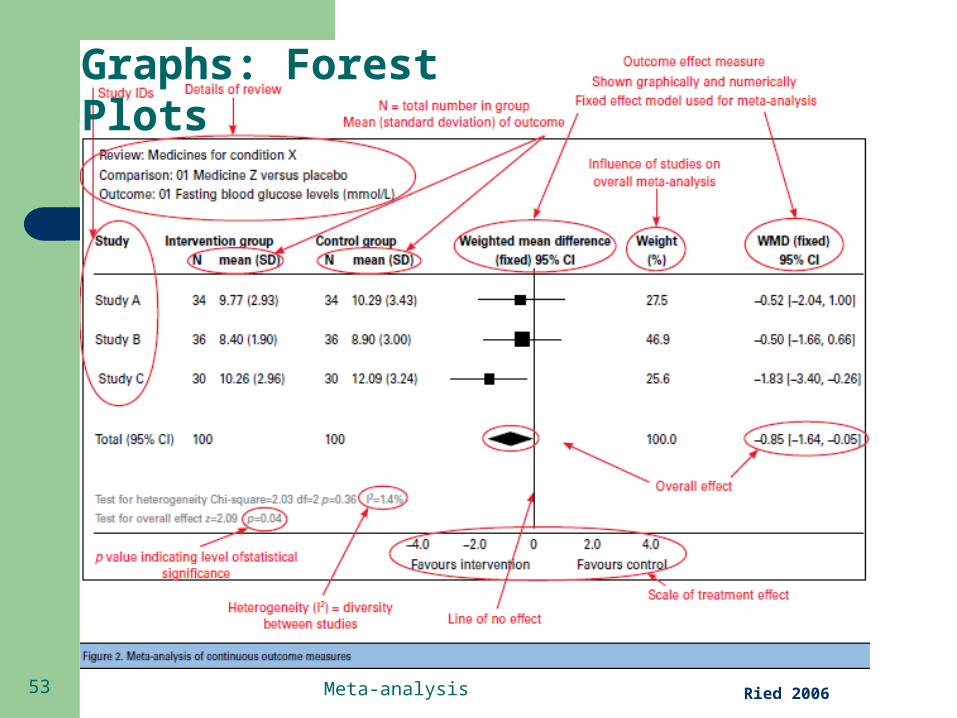
Meta-analysis 53 Ried 2006
Graphs: Forest Plots

Meta-analysis 54
Statistical models for combining data
All methods compute weighted averages Weighting factor is often the study size Models for dichotomous outcomes:
– Fixed effects model Inverse-variance, Peto method, M-H method
– This choice of weight minimizes the imprecision (uncertainty) of the pooled effect estimate
– Random effects model DerSimonian & Laird method
– The amount of variation, and hence the adjustment, can be estimated from the intervention effects and standard errors of the studies included in the meta-analysis
Models for continuous outcomes:– inverse-variance fixed-effect method– inverse-variance random-effects method
– The methods will give exactly the same answers when there is no heterogeneity. – Where there is heterogeneity, confidence intervals for the average intervention effect will be wider if the random-
effects method is used rather than a fixed-effect method, and corresponding P values will be less significant.– an underlying assumption is that the outcomes have a normal distribution in each intervention arm in each study– summary statistics used for meta-analysis of continuous data are the mean difference (MD) and the standardized
mean difference (SMD)
Higgins JPT, Green S (editors). Cochrane Handbook for Systematic Reviews of Interventions Version 5.0.2 [updated September 2009].
Meta-analysis 55
Fixed effects model
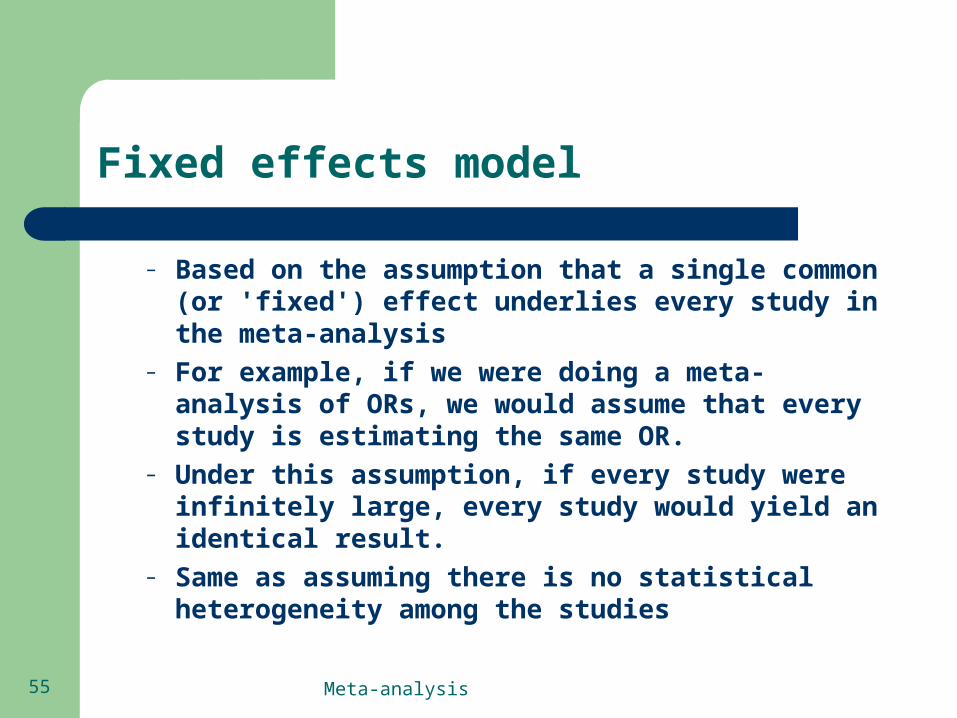
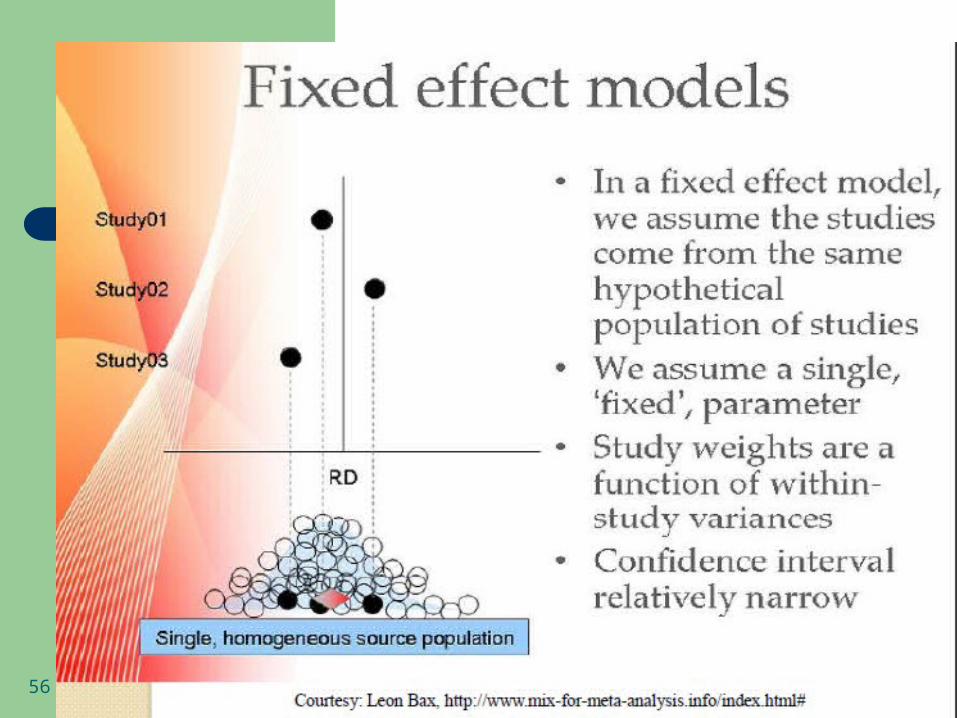
– Based on the assumption that a single common (or 'fixed') effect underlies every study in the meta-analysis
– For example, if we were doing a meta-analysis of ORs, we would assume that every study is estimating the same OR.
– Under this assumption, if every study were infinitely large, every study would yield an identical result.
– Same as assuming there is no statistical heterogeneity among the studies
Meta-analysis 56

Meta-analysis 57
Random effects model
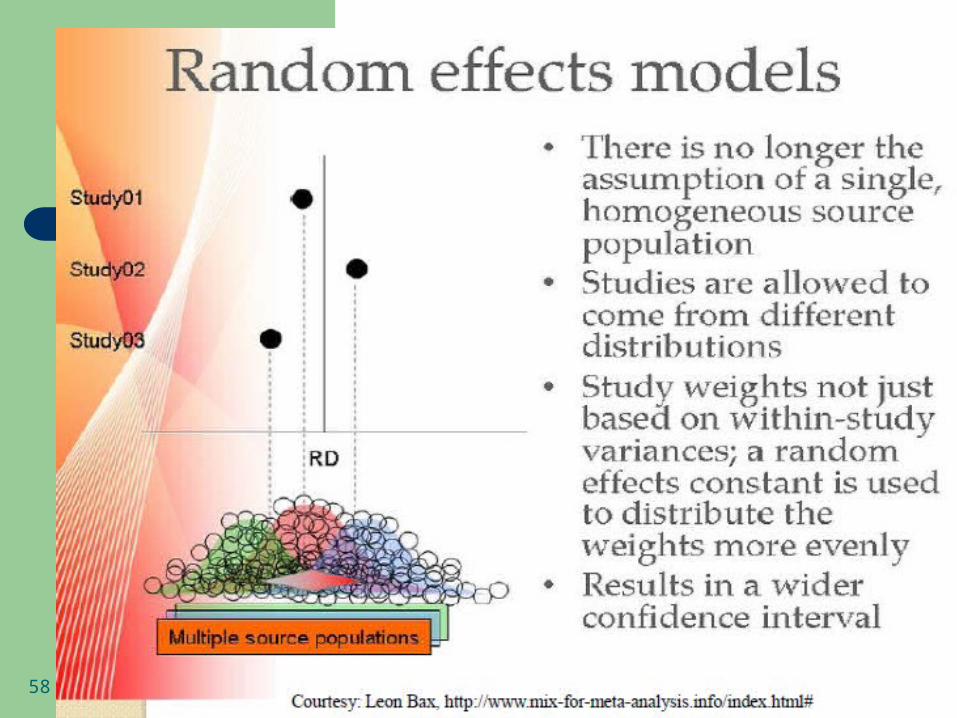
Makes the assumption that individual studies are estimating different true effects
– we assume they have a distribution with some central value and some degree of variability
– the idea of a random effects MA is to learn about this distribution of effects across different studies
– Allows for random error plus inter-study variability– Results in wider confidence intervals (conservative)– Studies tend to be weighted more equally (relatively
more weight is given to smaller studies)– Can be unpredictable (i.e. not stable)
Meta-analysis 58
Meta-analysis 59

Meta-analysis 60
Fixed vs. random effects models
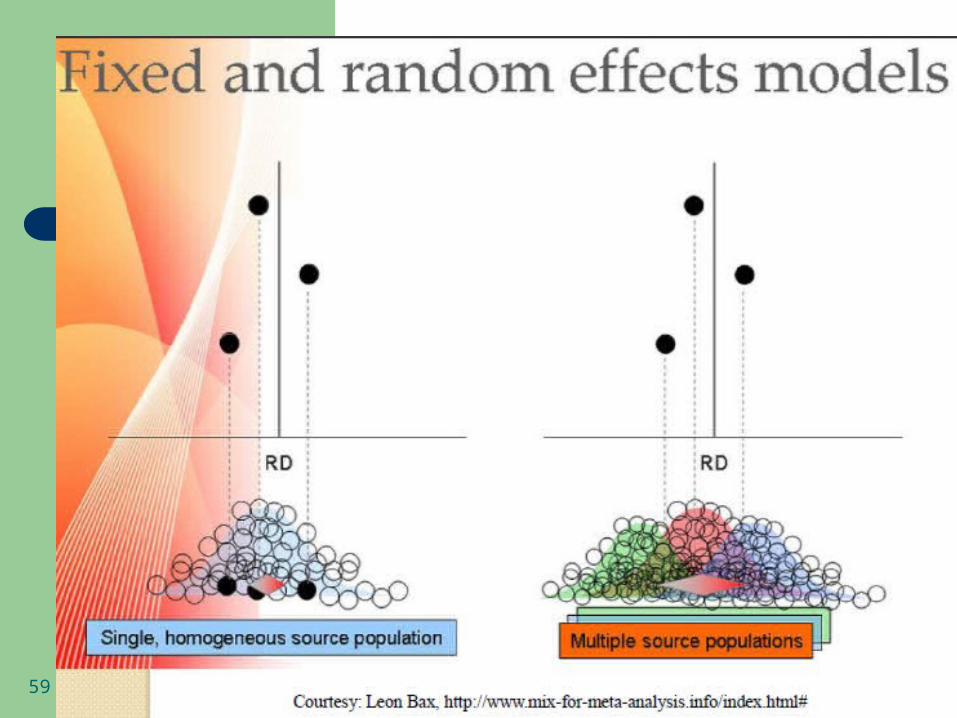
1. A fixed effects model concentrates solely on the selected studies included in the meta-analysis, whereas a random effects model takes into account that there might be other studies unpublished, overlooked in the systematic literature search, or to be undertaken in the future which weren’t included in the meta-analysis at hand.
2. When the research question in the meta-analysis is whether treatment has produced an effect in the set of homogeneous studies analyzed, then the fixed effects model is the appropriate one.
3. If binary outcome variables are used, fixed and random effects models give different results.
4. In case of continuous variables, the results of meta-analyses using fixed or random models are often identical.
5. Random effects model adds between-study variability to the variance, resulting in larger variance and wider CIs.
6. In the presence of heterogeneity, a random effects meta-analysis weights the studies relatively more equally than a fixed effect analysis.
Meta-analysis 61
Fixed vs. random effects models
Meta-analysis 62
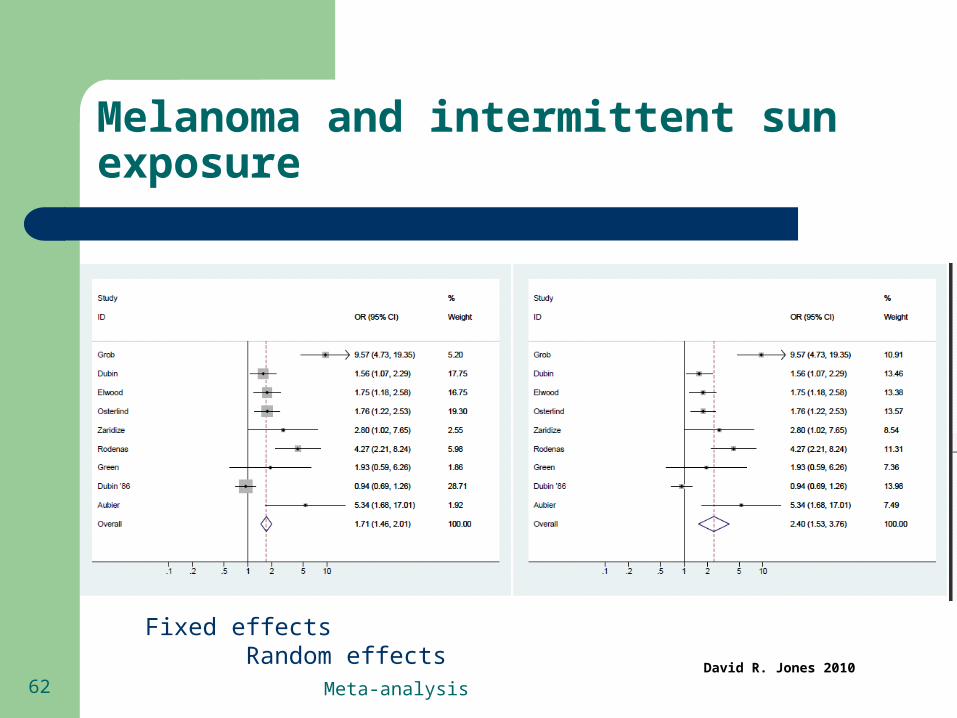
Melanoma and intermittent sun exposure
Fixed effects Random effects
David R. Jones 2010
Meta-analysis 63
Comparison of fixed- and random-effects meta-analytic estimates of the effect of intravenous magnesium on mortality following myocardial infarction

Meta-analysis 64

Meta-analysis 65
Potential pitfalls of systematic reviews and meta-analyses
When a meta-analysis is done outside of a systematic review
When poor quality studies are included or when quality issues are ignored
When small and inconclusive studies are included When inadequate attention is given to heterogeneity When reporting biases are a problem

Meta-analysis 66
Generalizability of findings
Type of bias Description
Selection biasInformation bias:
Systematic differences between baseline characteristics of the groups that are compared.
Performance bias Systematic differences between groups in the care that is provided, or in exposure to factors other than the interventions of interest.
Attrition bias Systematic differences between groups in withdrawals from a study.
Detection bias Systematic differences between groups in how outcomes are determined.
Reporting bias Systematic differences between reported and unreported findings.
Meta-analysis 67
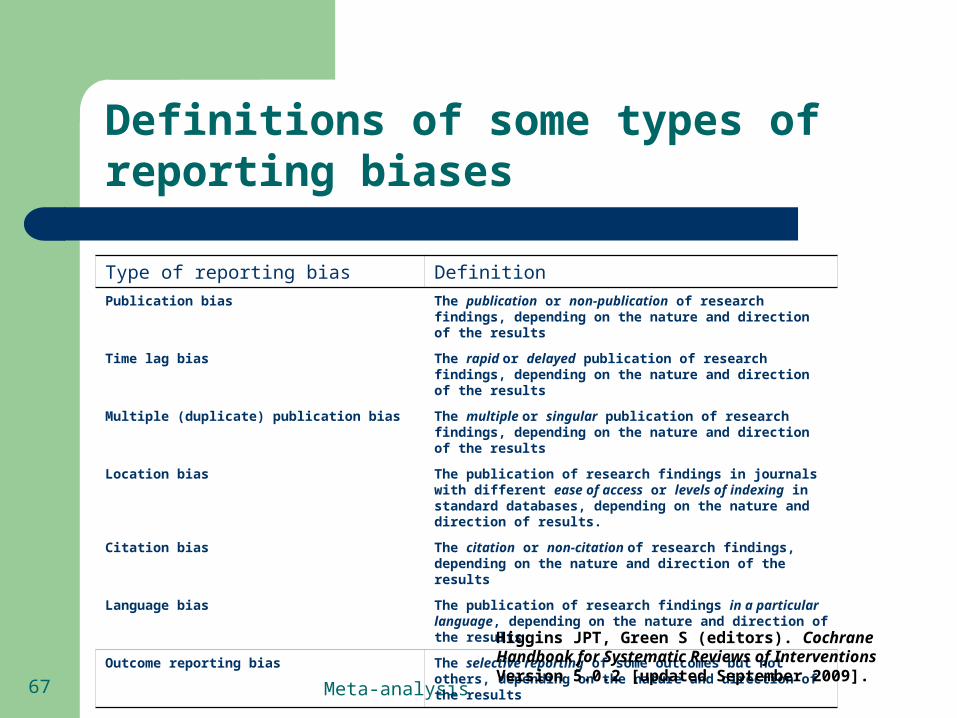
Definitions of some types of reporting biases
Type of reporting bias Definition
Publication bias The publication or non-publication of research findings, depending on the nature and direction of the results
Time lag bias The rapid or delayed publication of research findings, depending on the nature and direction of the results
Multiple (duplicate) publication bias The multiple or singular publication of research findings, depending on the nature and direction of the results
Location bias The publication of research findings in journals with different ease of access or levels of indexing in standard databases, depending on the nature and direction of results.
Citation bias The citation or non-citation of research findings, depending on the nature and direction of the results
Language bias The publication of research findings in a particular language, depending on the nature and direction of the results
Outcome reporting bias The selective reporting of some outcomes but not others, depending on the nature and direction of the results
Higgins JPT, Green S (editors). Cochrane Handbook for Systematic Reviews of Interventions Version 5.0.2 [updated September 2009].
Meta-analysis 68
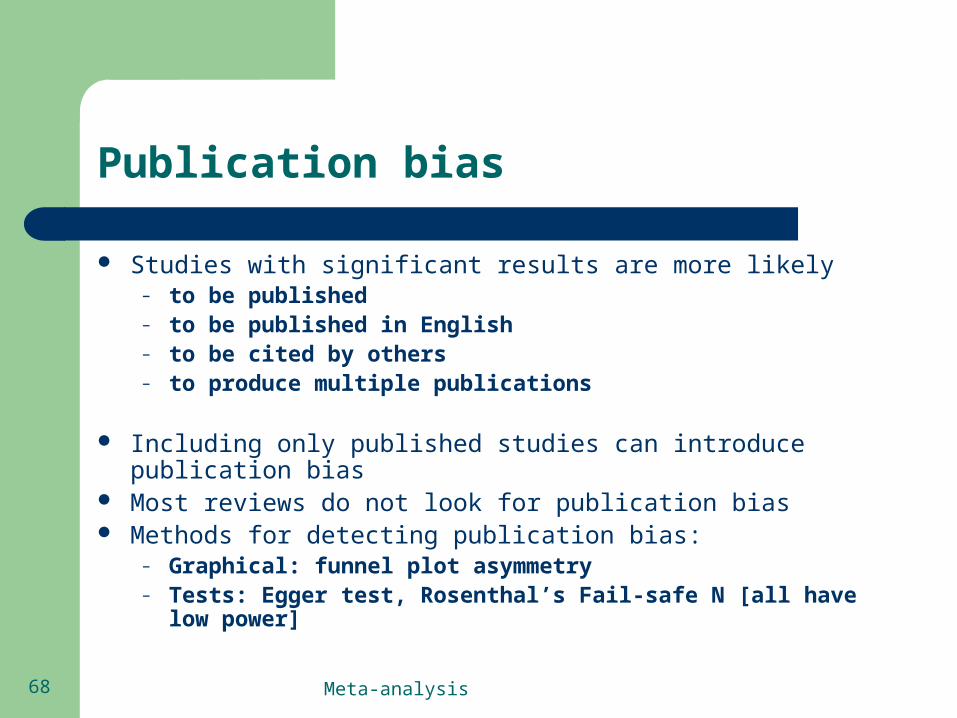
Publication bias
Studies with significant results are more likely – to be published– to be published in English– to be cited by others– to produce multiple publications
Including only published studies can introduce publication bias Most reviews do not look for publication bias Methods for detecting publication bias:
– Graphical: funnel plot asymmetry– Tests: Egger test, Rosenthal’s Fail-safe N [all have low power]
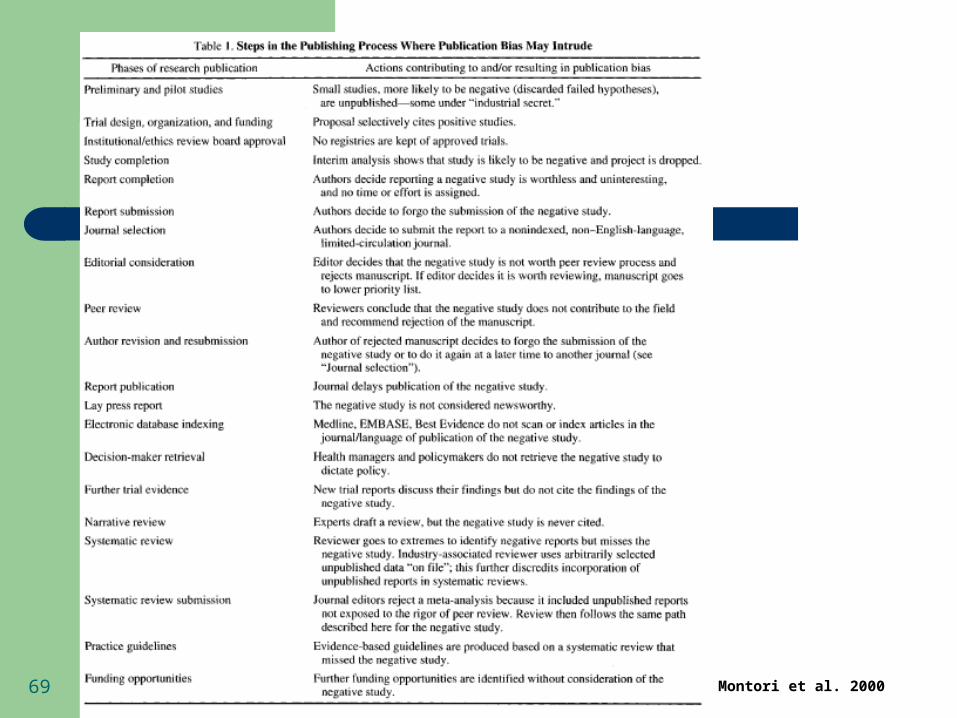
Meta-analysis 69 Montori et al. 2000
Meta-analysis 70
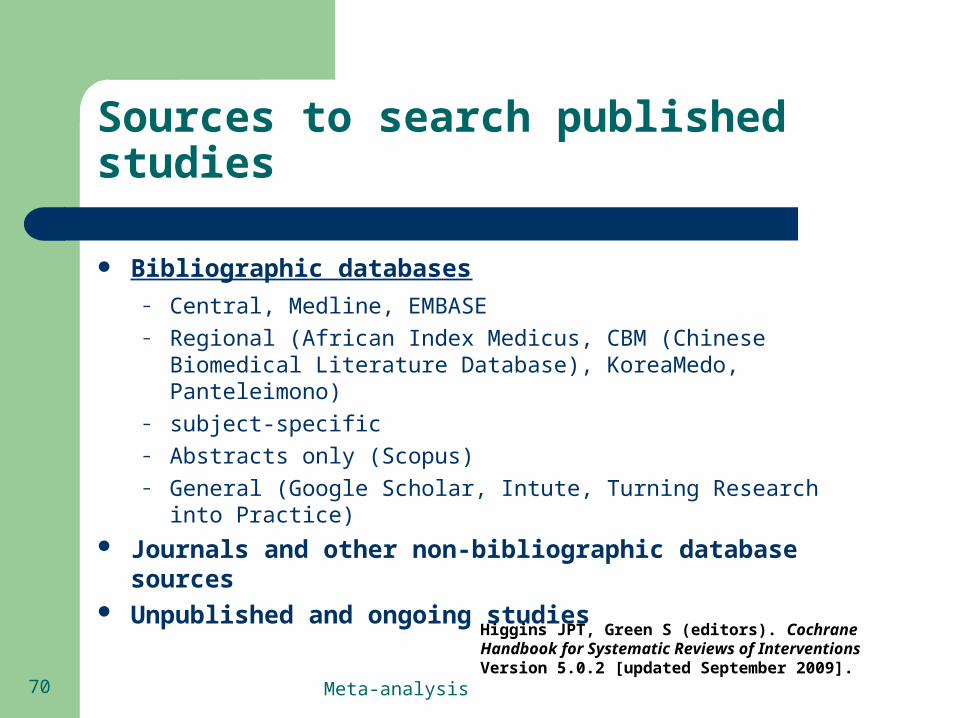
Sources to search published studies
Bibliographic databases– Central, Medline, EMBASE– Regional (African Index Medicus, CBM (Chinese Biomedical
Literature Database), KoreaMedo, Panteleimono)– subject-specific– Abstracts only (Scopus)– General (Google Scholar, Intute, Turning Research into Practice)
Journals and other non-bibliographic database sources Unpublished and ongoing studies
Higgins JPT, Green S (editors). Cochrane Handbook for Systematic Reviews of Interventions Version 5.0.2 [updated September 2009].
Meta-analysis 71
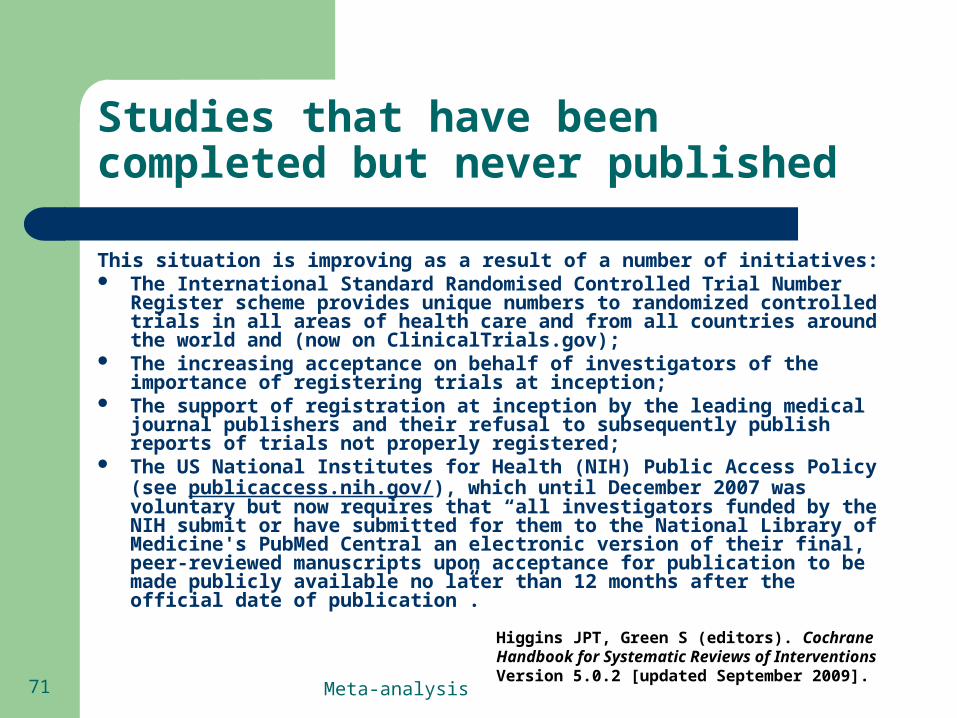
Studies that have been completed but never published
This situation is improving as a result of a number of initiatives: The International Standard Randomised Controlled Trial Number Register
scheme provides unique numbers to randomized controlled trials in all areas of health care and from all countries around the world and (now on ClinicalTrials.gov);
The increasing acceptance on behalf of investigators of the importance of registering trials at inception;
The support of registration at inception by the leading medical journal publishers and their refusal to subsequently publish reports of trials not properly registered;
The US National Institutes for Health (NIH) Public Access Policy (see publicaccess.nih.gov/), which until December 2007 was voluntary but now requires that “all investigators funded by the NIH submit or have submitted for them to the National Library of Medicine's PubMed Central an electronic version of their final, peer-reviewed manuscripts upon acceptance for publication to be made publicly available no later than 12 months after the official date of publication”.
Higgins JPT, Green S (editors). Cochrane Handbook for Systematic Reviews of Interventions Version 5.0.2 [updated September 2009].
Meta-analysis 72
Recommendations for reporting the results of meta-analyses
– Graphical summaries of study estimates and a combined estimate
– Tables listing descriptive information for each study
– Results of sensitivity testing
– Results of sub-group analyses
–Discussion of statistical uncertainty of findings

Meta-analysis 73
Summary
Meta-analyses cannot be done outside of a systematic review
Before conducting a meta-analysis, the quality of studies should be investigated; small and inconclusive studies should be included with caution
Great attention should be given to heterogeneity of published studies
Reporting biases should be carefully evaluated